Aiming for Fewer Hospital U-turns – Issue Brief – 8688
For Medicare patients, hospitalizations can be stressful; even more so when they result in subsequent readmissions to the hospital. While many readmissions cannot and should not be prevented, researchers have found wide variation in hospitals’ readmission rates, suggesting that patients admitted to certain hospitals are more likely to experience readmissions compared to other hospitals.1 A number of studies show that hospitals can engage in several activities to lower their rate of readmissions, such as clarifying patient discharge instructions, coordinating with post-acute care providers and patients’ primary care physicians, and reducing medical complications during patients’ initial hospital stays.2
Medicare—through Congressional direction and Administration initiatives—has started implementing incentives to reduce hospital readmissions. One example, and the focus of this Issue Brief, is the Hospital Readmission Reduction Program (HRRP) which penalizes hospitals with relatively higher rates of Medicare readmissions.3 Applying to most inpatient hospitals, the Department of Health and Human Services states that the HRRP will play a role in its new goals to tie an increasing share of traditional Medicare payments to quality or value in the coming years.4
This Issue Brief describes the HRRP, analyzes the impact of this program on Medicare patients and hospitals, and discusses several issues that have been raised regarding its implementation. While other studies have focused primarily on penalties imposed on specific hospitals, this Issue Brief provides additional analysis on the extent to which Medicare beneficiaries stay in hospitals with relatively high penalties and national trends in beneficiary readmission rates.5
Main Findings
- Both the share of hospitals receiving penalties for 30-day readmissions and total fines are higher in 2015, compared to previous years—due mostly to more medical conditions being measured, rather than increases in the penalty cap. The average financial penalty (Medicare payment reduction) for individual hospitals is less than 1 percent, as it has been in prior years.
- For 2015, 83 percent of Medicare patient admissions are projected to be in hospitals receiving either no readmission penalty or penalties of less than 1 percent.
- Across all three years of the HRRP, some types of hospitals are more likely than others to incur penalties, including major teaching hospitals and hospitals with relatively higher shares of low-income beneficiaries—two often overlapping characteristics.
- Beneficiary readmission rates started to fall in 2012, suggesting that hospital administrators and clinicians may have initiated strategies soon after the enactment of the HRRP and prior to the application of the fines—realizing that the penalties would be based on performance in preceding years. Other factors may also have played a role these declines.
- Researchers, hospitals, and policymakers are actively considering refinements to the HRRP and looking for ways to engage other providers and patients to reduce preventable patient readmissions to the hospital.
Defining a hospital readmission
Generally speaking, a hospital readmission occurs when a patient is admitted to a hospital within a specified time period after being discharged from an earlier (initial) hospitalization. For Medicare, this time period is defined as 30 days, and includes hospital readmissions to any hospital, not just the hospital at which the patient was originally hospitalized.
Medicare uses an “all-cause” definition of readmission, meaning that hospital stays within 30 days of a discharge from an initial hospitalization are considered readmissions, regardless of the reason for the readmission. This all-cause definition is used in calculating both the national average readmission rate and each hospital’s specific readmission rate. Starting in 2014, CMS began making an exception for planned hospitalizations (such as a scheduled coronary angioplasty) within the 30-day window; these are no longer counted as readmissions.
The current focus in the HRRP is on readmissions occurring after initial hospitalizations for selected conditions—namely, heart attack, heart failure, pneumonia, chronic obstructive pulmonary disease (COPD), and elective hip or knee replacement. CMS also collects hospitals’ overall readmission rates (regardless of initial diagnoses), but these overall rates are not currently used in the HRRP to calculate readmissions penalties.
The first three years of the HRRP
The HRRP was established by a provision in the Affordable Care Act (ACA) requiring Medicare to reduce payments to hospitals that have relatively high readmission rates for patients in traditional Medicare. It started in 2013 as a permanent component of Medicare’s inpatient hospital payment system (i.e., not a temporary demonstration project), and applies to most acute care hospitals. Hospitals exempt from the HRRP include psychiatric, rehabilitation, long term care, children’s, cancer, critical access hospitals, and all hospitals in Maryland.6
Under the HRRP, hospitals with readmission rates that exceed the national average are penalized by a reduction in payments across all of their Medicare admissions—not just those which resulted in readmissions. Before comparing a hospital’s readmission rate to the national average, CMS adjusts for certain demographic characteristics of both the patients being readmitted and each hospital’s patient population (such as age and illness severity). After these adjustments, CMS calculates a rate of “excess” readmissions, which links directly to the hospital’s readmission penalty—the greater each hospital’s rate of excess readmissions, the higher its penalty.7 Each year, CMS releases each hospital’s penalty for the upcoming year in the Federal Register and posts this information on its Medicare website.
CMS first started imposing readmission penalties in fiscal year 2013, during which the maximum penalty was 1 percent of the hospital’s base inpatient claims, increasing to 2 percent for 2014, and will remain at 3 percent starting for fiscal year 2015 and beyond (Table 1). When calculating each hospital’s readmission rate, CMS uses three full years of previous data to determine hospital performance. For penalties that will be imposed in fiscal year 2015, therefore, CMS based its calculations on hospital readmissions that occurred from July 2010 through June 2013.
| Table 1. The Hospital Readmission Reduction Program (HRRP): 3-year phase in | |||
| Year penalty applied
(Penalties: percentage reductions in payments for all Medicare admissions in the year) |
FY 2013 | FY 2014 | FY 2015 |
| Performance (measurement) period | June 2008-July 2011 | June 2009-July 2012 | June 2010-July 2013 |
| Diagnoses of initial hospitalization | Heart attack Heart failure Pneumonia |
Heart attack Heart failure Pneumonia |
Heart attack Heart failure Pneumonia COPD Hip or knee replacement |
| Maximum rate of penalty | 1% | 2% | 3% |
| Average hospital payment adjustment (among penalized and non-penalized hospitals) |
-0.27% | -0.25% | -0.49% |
| Average hospital penalty (among penalized hospitals only) |
-0.42% | -0.38% | -0.63% |
| Percent of hospitals penalized | 64% | 66% | 78% |
| Percent of hospitals at maximum penalty | 8% | 0.6% | 1.2% |
| CMS estimate of total penalties | $290 million | $227 million | $428 million |
| NOTES: Penalties are applied to each hospital in the fiscal year shown, based on its performance during a preceding 3-year measurement period, also shown. Analysis excludes hospitals not subject to HRRP, such as Maryland hospitals and other hospitals not paid under the Medicare Hospital Inpatient Prospective Payment System, such as psychiatric hospitals. COPD: Chronic obstructive pulmonary disease. FY: fiscal year. SOURCE: Kaiser Family Foundation analysis of CMS Final Rules and Impact files for the Hospital Inpatient Prospective Payment System. |
|||
For penalties levied in 2013 and 2014, CMS focused on readmissions occurring after initial hospitalizations for three selected conditions: heart attack, heart failure, and pneumonia. For penalties levied in 2015, CMS included additional diagnoses: chronic obstructive pulmonary disease (COPD), and elective hip or knee replacement. In future years, CMS has indicated that it plans to continue with all these diagnoses and, for 2017, will also assess performance following initial diagnosis of coronary artery bypass graft (CABG) surgery to the list.
More hospitals are penalized in 2015, compared to previous years, but average penalties remain below 1 percent
In the third year of the HRRP (FY 2015), the proportion of hospitals receiving a penalty increased to 78 percent—up from 64 percent and 66 percent in 2013 and 2014 respectively. This increase is not surprising given that for 2015 penalties, CMS included additional diagnoses when assessing each hospital’s performance. Average penalties (among hospitals receiving a penalty) will also increase compared to previous years; however, they will remain below 1 percent, despite the maximum cap on the penalty increasing to 3 percent as part of the planned phase-in of the HRRP.
CMS estimated total hospital penalties under the HRRP to sum to $428 million in 2015, an increase over prior years ($290 million in 2013 and $227 million in 2014).8 This increase is due mostly to more hospitals receiving a penalty, given the expanded number of initial diagnoses included in calculating readmission rates, but a small part of the increase may also due to the increase in the maximum penalty.
Most Medicare patients will stay in hospitals with either no penalty or penalties less than 1 percent
From a patient perspective, our analysis finds that for 2015, most beneficiaries will stay in hospitals with low to no penalties. Specifically, we estimate that 83 percent of beneficiary stays in 2015 will be in hospitals that scored well enough during their previous measurement period to receive either no penalty or penalties of less than 1 percent (Figure 1).9 Conversely, 17 percent of beneficiary stays will be in hospitals that will receive penalties of 1 percent or higher. Less than a percent (0.5%) of Medicare admissions will occur in hospitals that received the maximum penalty of 3 percent.
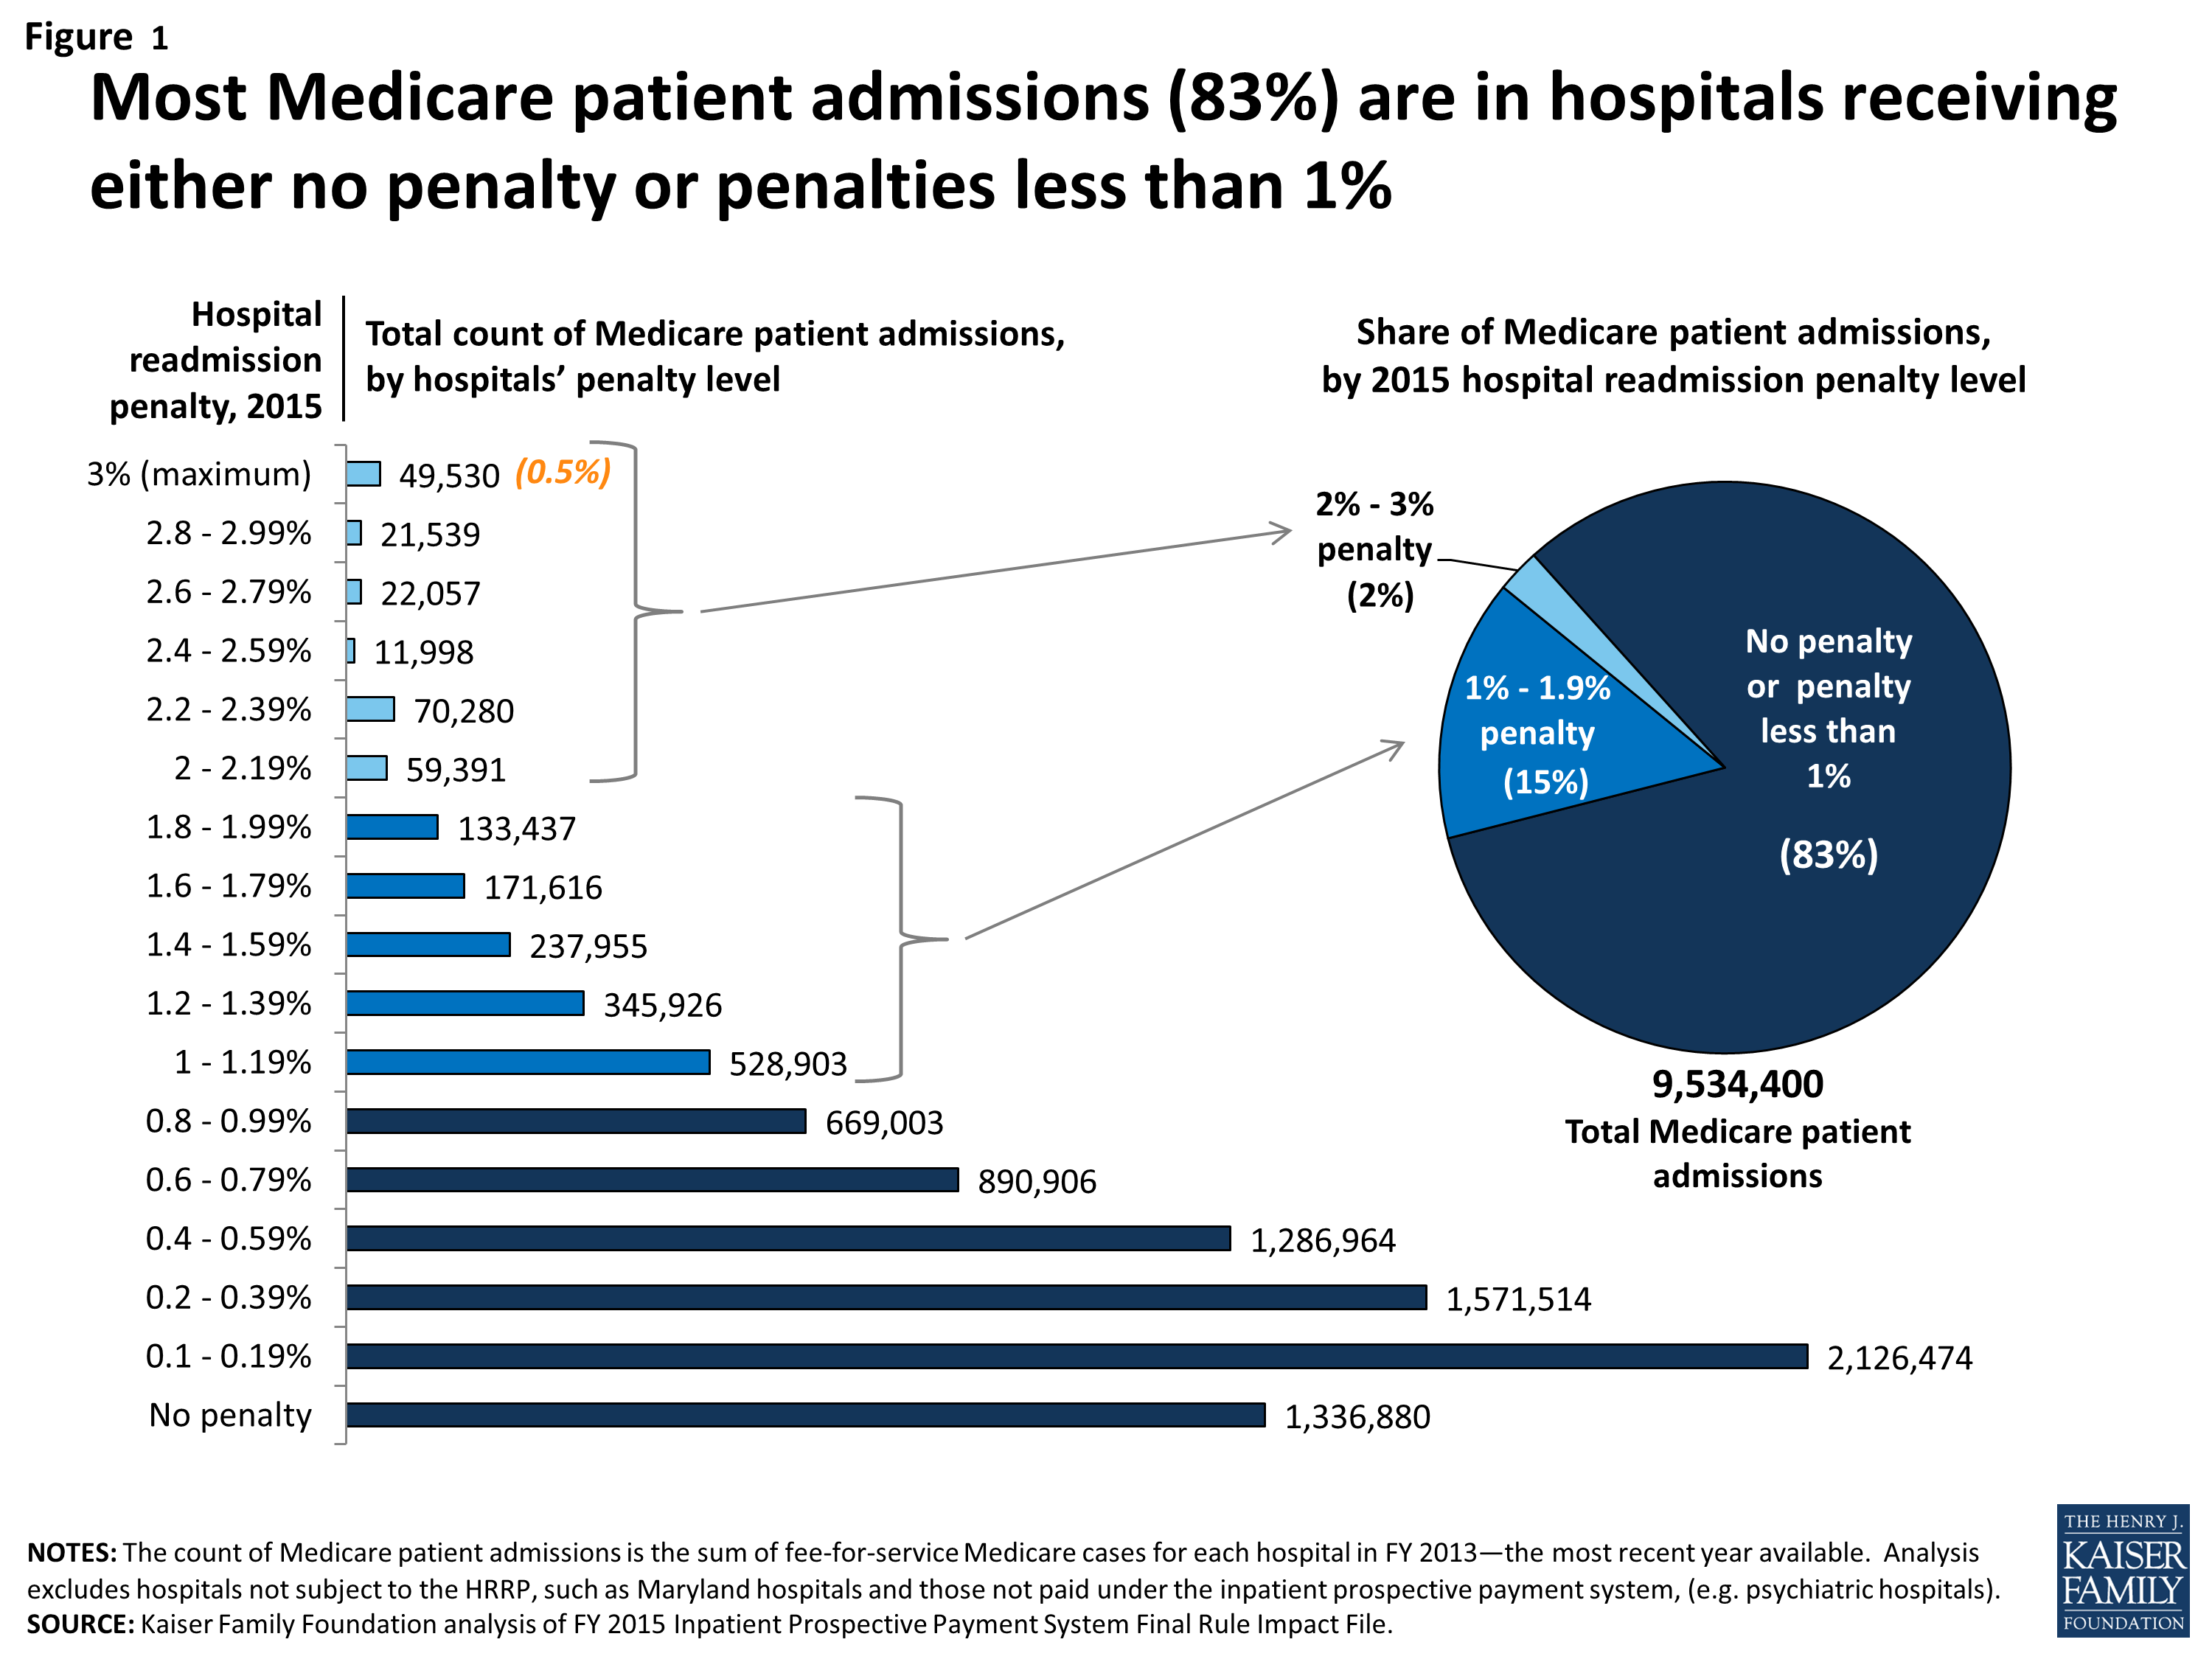
Figure 1: Most Medicare patient admissions (83%) are in hospitals receiving either no penalty or penalties less than 1%
Analysis of the variation in penalties by type of hospital suggests that Medicare beneficiaries who go to certain types of hospitals—namely major teaching hospitals and hospitals with relatively greater shares of low-income beneficiaries—are more likely to stay in penalized hospitals (Table 2). To some degree there is overlap among these two types of hospitals as major teaching hospitals often serve as safety-net hospitals with higher proportions of low-income patients. Further study by initial diagnoses could provide more insights, particularly for 2015 penalties which show some narrowing of performance among hospitals with greater proportions of low-income beneficiaries, compared to previous years.10 For example, among the top three quartiles, the percentage of hospitals receiving a penalty ranges by only 3 percentage points in 2015 (81% – 84%), but by 16 percentage points in 2013 (61% – 77%).
| Table 2. Variation in penalties by hospital type generally persist across first three years of HRRP | |||||||||||||
| Hospital group type | % of hospitals in group | % of Medicare patient admissions in group |
Average hospital payment adjustment | % of hospitals with any penalty |
% of hospitals at year’s max penalty |
||||||||
| 2013 | 2014 | 2015 | 2013 | 2014 | 2015 | 2013 (-1%) |
2014 (-2%) |
2015 (-3%) |
|||||
| All | 100% | 100% | 0.27% | 0.25% | 0.49% | 64% | 66% | 78% | 8.0% | 0.6% | 1.2% | ||
|
Rural/urban
|
|||||||||||||
|
Urban
|
74% | 89% | 0.26% | 0.23% | 0.46% | 65% | 66% | 78% | 7.1% | 0.1% | 0.8% | ||
| Rural | 26% | 11% | 0.30% | 0.31% | 0.57% | 62% | 65% | 79% | 11.5% | 1.9% | 2.2% | ||
| Teaching status | |||||||||||||
| Major Teaching | 9% | 17% | 0.43% | 0.34% | 0.51% | 86% | 87% | 92% | 16.5% | 0.4% | 0.3% | ||
| Other teaching | 22% | 35% | 0.26% | 0.22% | 0.44% | 68% | 66% | 79% | 5.8% | 0.1% | 0.3% | ||
| Nonteaching | 70% | 47% | 0.26% | 0.25% | 0.50% | 61% | 63% | 76% | 8.2% | 0.8% | 1.5% | ||
|
Size
|
|||||||||||||
|
<100 beds
|
39% | 10% | 0.22% | 0.23% | 0.45% | 50% | 53% | 66% | 7.8% | 1.4% | 2.3% | ||
| 100-299 beds | 42% | 42% | 0.30% | 0.28% | 0.55% | 74% | 75% | 87% | 8.2% | 0.2% | 0.6% | ||
| 300+ beds | 19% | 48% | 0.31% | 0.25% | 0.43% | 71% | 73% | 85% | 9.5% | 0.0% | 0.2% | ||
| Proportion of low-income Medicare patients | |||||||||||||
| Quartile 1 (Lowest) | 25% | 19% | 0.18% | 0.15% | 0.43% | 49% | 51% | 67% | 4.3% | 0.4% | 1.7% | ||
| Quartile 2 | 25% | 27% | 0.24% | 0.22% | 0.46% | 61% | 62% | 81% | 5.4% | 0.0% | 0.2% | ||
| Quartile 3 | 25% | 29% | 0.31% | 0.28% | 0.53% | 73% | 73% | 84% | 8.0% | 0.4% | 1.0% | ||
| Quartile 4 (Highest) | 25% | 25% | 0.37% | 0.36% | 0.54% | 77% | 78% | 84% | 14.7% | 1.3% | 1.8% | ||
|
NOTES: The low-income Medicare patient proportion is derived from hospital ratios of Supplemental Security Income (SSI) patient days, with the 4th quartile having the highest ratio of low-income patient days. The percent of hospitals in each group is for FY2015. The percent of Medicare fee-for-service patient admissions is from FY2013, the most recent year for which admission distribution is available. Analysis excludes hospitals not subject to HRRP because they are not paid under the Medicare Hospital Inpatient Prospective Payment System (IPPS) (e.g., Maryland hospitals, psychiatric hospitals).
SOURCE: Kaiser Family Foundation analysis of CMS Final Rules and Impact Files for the Hospital IPPS; CMS’s SSI calculations from 2013 claims run out.
|
|||||||||||||
National Medicare readmission rates started falling prior to HRRP penalties
CMS has been posting individual hospital readmission rates on its Hospital Compare website, in addition to other measures of quality and patient satisfaction, since 2009. Designed for use by Medicare consumers as well as researchers, this website also provides comparisons of each hospital’s Medicare readmission performance to the national average by indicating whether the hospital is “better/worse/no different” than the U.S. National rate.11 In addition to readmissions following hospitalizations for selected diagnoses, the Hospital Compare website started reporting each hospital’s overall Medicare readmission rates.
Analysis of this database shows that 2012 marks the first measurable declines in readmissions (Figure 2). Specifically, when the last six months of 2008 were replaced by the first six months of 2012, national readmission rates fell across all three diagnosis categories. Furthermore, these rates continued to decline in the subsequent measurement period. For each of the three diagnosis categories, therefore, hospital readmissions fell about 1-2 percentage points by mid-2013. These drops started after Congress enacted the HRRP, suggesting that hospitals may have initiated strategies to lower their readmission rates during the HRRP measurement periods preceding the start of the program’s penalties. Additionally, other clinician activities outside the hospitals may have contributed to the decline in readmissions. CMS has estimated reductions in overall hospital readmissions (not specific to any initial diagnoses) totaling 150,000 fewer Medicare patient readmissions during the period between January 2012 and December 2013.12
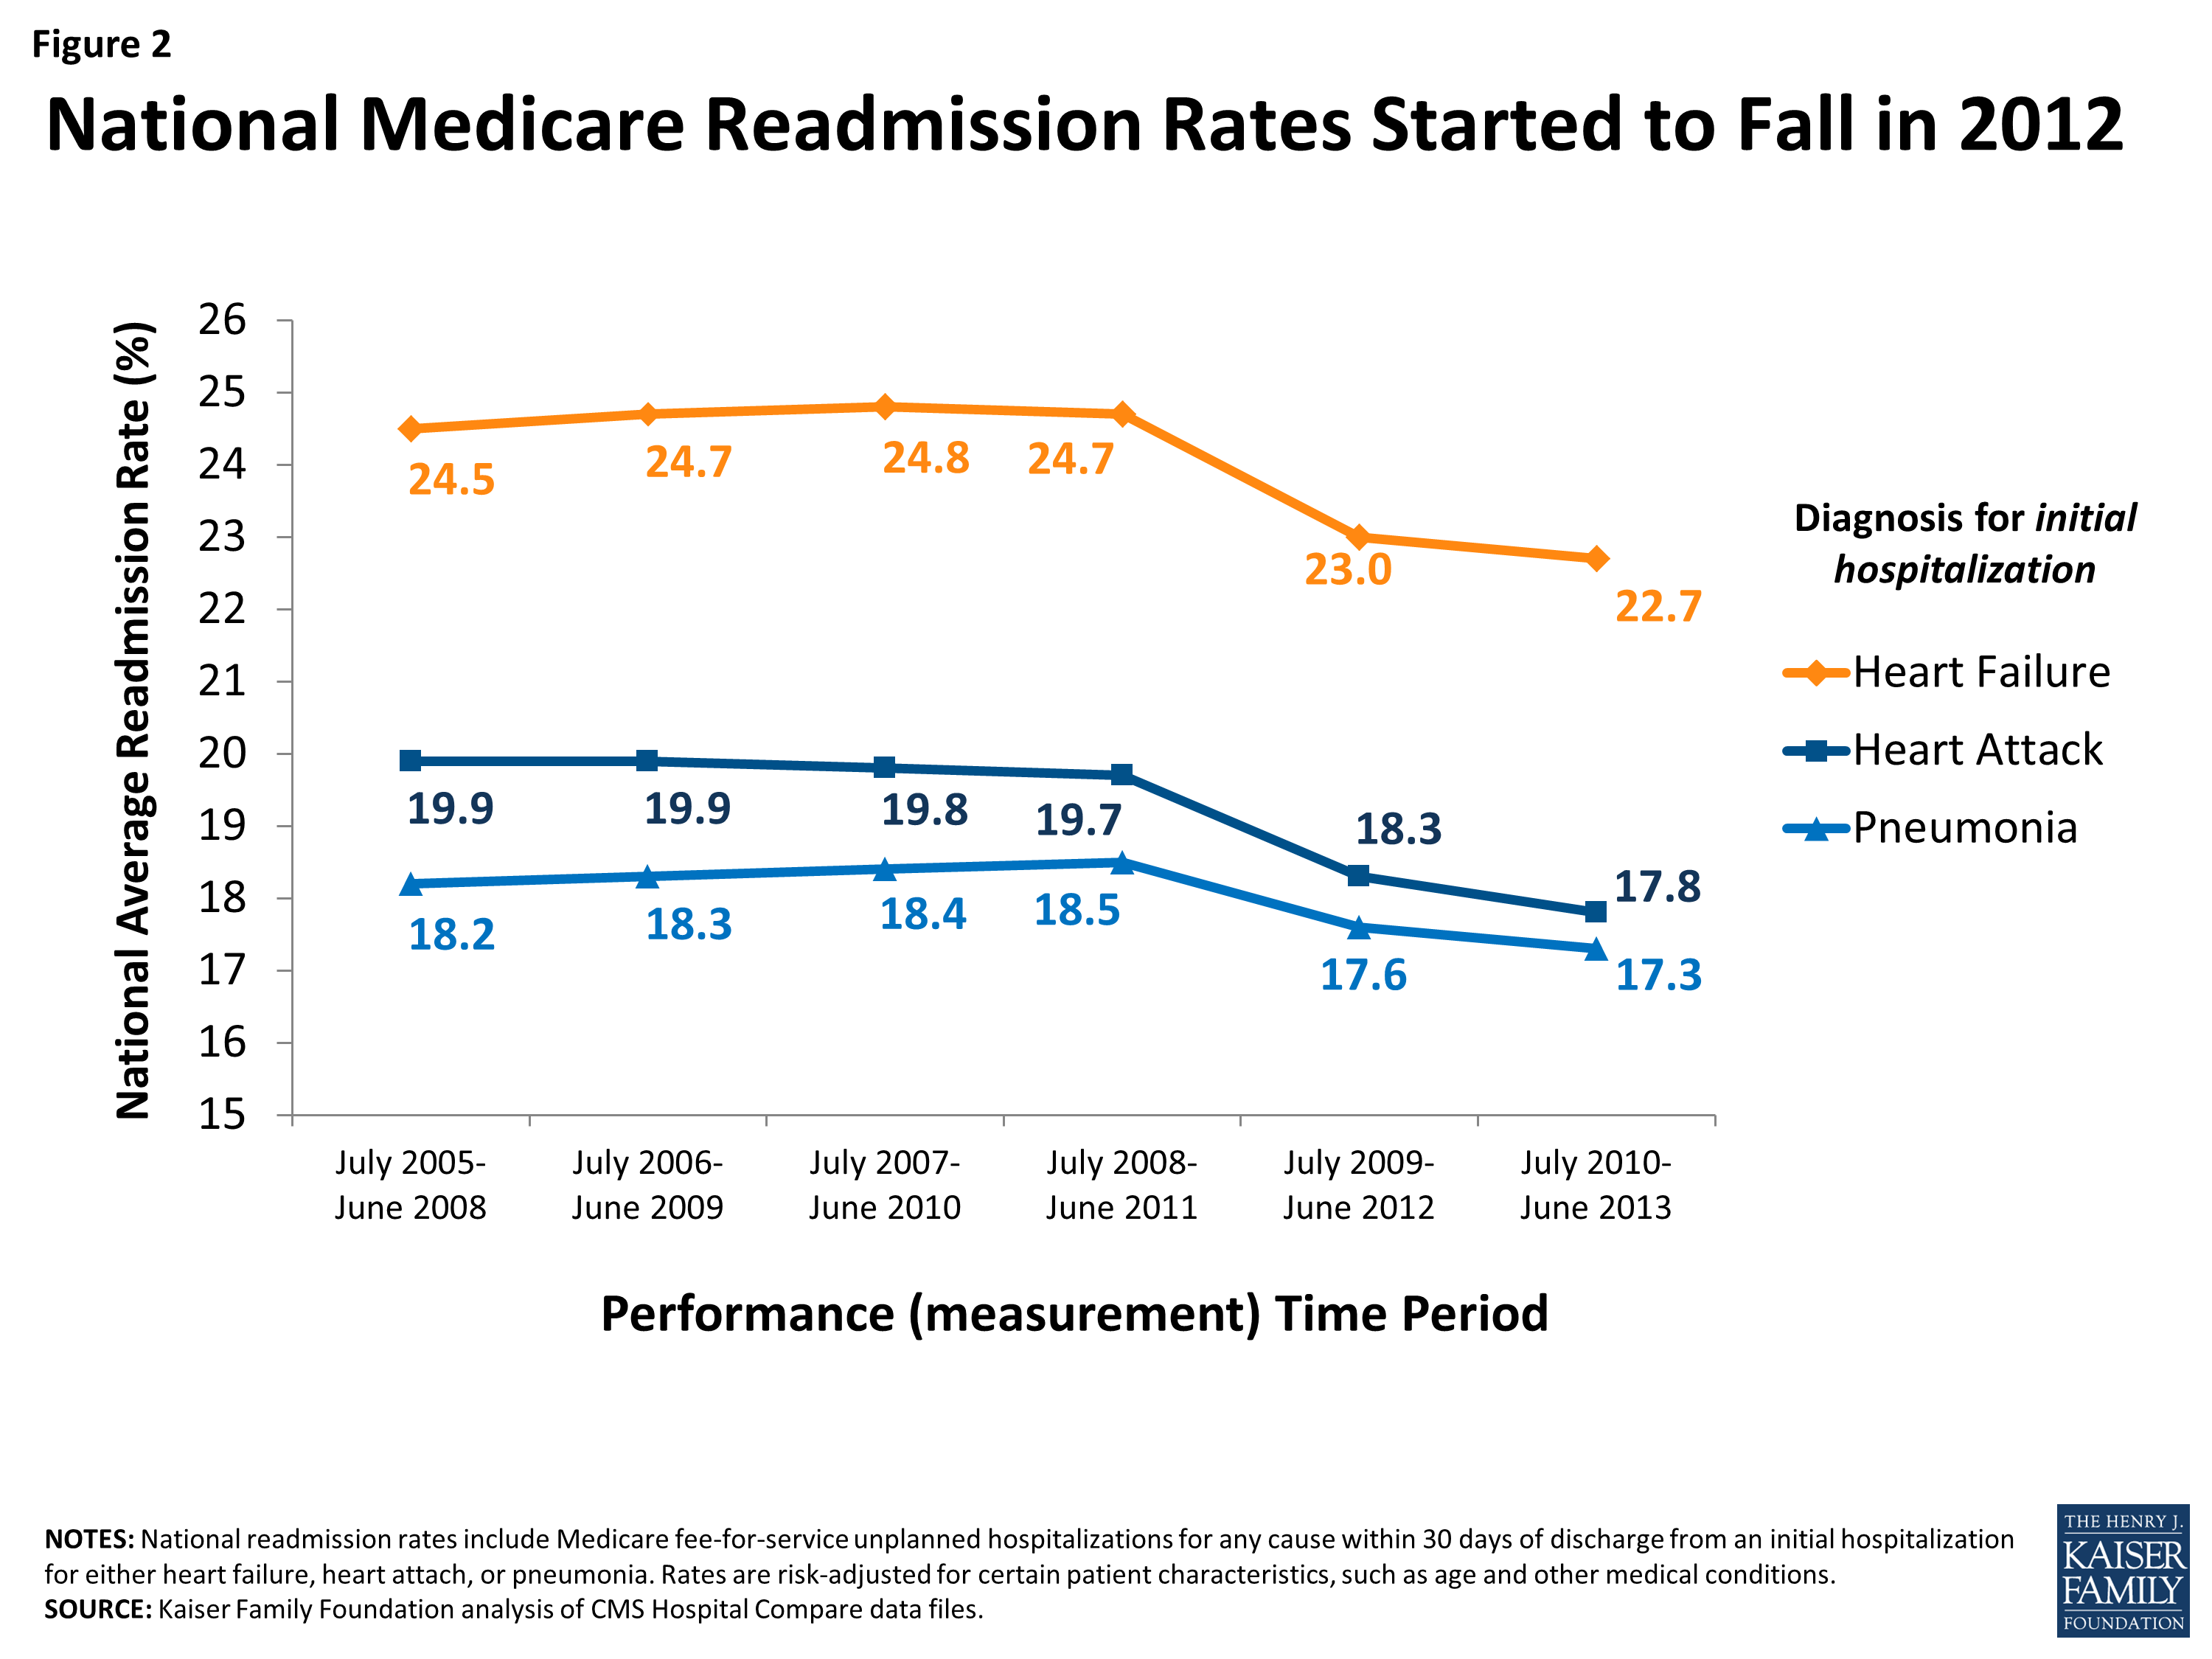
Figure 2: National Medicare Readmission Rates Started to Fall in 2012
Ongoing policy issues
Concerns raised by researchers and hospital representatives have prompted policymakers to consider refinements to the implementation of the HRRP and look for ways to engage other health care providers and patients.13 Some of the refinements under discussion include changes in the way hospital measures are risk-adjusted, setting hospital performance targets, and engaging other providers.
- Risk-adjustment. While Medicare’s readmission measures adjust for some patient characteristics associated with higher rates of hospital readmissions, they do not adjust for others, such as socioeconomic or community-level factors. CMS’s original measures were endorsed by the National Quality Forum (NQF), as required by statute. Research by the Medicare Payment Advisory Commission (MedPAC), an independent federal agency that advises the Congress on Medicare issues, has shown that hospitals’ readmission penalties are positively correlated with their share of low-income Medicare patients, suggesting that factors other than hospital quality may play a role in readmission rates. In a recent report, MedPAC outlined ways to modify the calculation for determining financial penalties in the HRRP by comparing hospitals in peer groups that have similar shares of low-income beneficiaries. Additionally, an advisory panel to the NQF recommended that for certain purposes (such as provider accountability) some NQF-endorsed measures should include adjustments for socioeconomic status. CMS has expressed concern that softening penalties for hospitals with lower-income patients would hold those hospitals to a lower standard, and unintentionally weaken incentives for those hospitals to improve health outcomes for disadvantaged patients.14
- Moving goalposts. Hospital performance in the HRRP is, essentially, graded on a curve because the calculations for determining penalties are based on comparisons to the national average. For each measure, if the national rate of Medicare readmissions declines—the main goal of the HRRP—then it is possible for hospitals to improve their readmission rates, but still be penalized. On the one hand, some suggest that if Medicare established fixed target rates, hospitals might have an easier time understanding the HRRP and embracing interventions to achieve those targets.15 On the other hand, others could argue that fixed targets might mitigate the level of hospital improvement because it establishes a minimum performance, rather than encouraging hospitals to keep up with the average, especially when the average improves. Regardless, adjustments to the benchmark for calculating HRRP penalties would require a change in law.
- Other providers play a role. Hospital executives and policymakers have noted that incentives to reduce readmissions should not rest on hospitals alone because other providers and the patients themselves may play important roles in this effort. Further, hospitals may have little to no control over the care that patients receive after they are discharged from an inpatient stay. While researchers readily acknowledge that many readmissions are not preventable, studies show that hospitals can engage in collaborative activities to lower their number of readmissions, such as clarifying patient discharge instructions, coordinating with post-acute care providers, and reducing medical complications during the patients’ initial hospital stays.16
Discussion
Our analysis finds that most Medicare patient admissions (83%) for 2015 will be in hospitals receiving either no readmission penalty or penalties of less than 1 percent. Given the stress and problems that patients experience when readmitted to the hospital, it may be reassuring that beneficiaries’ stays are typically in hospitals with relatively lower readmission rates. While hospitals at the upper end of the penalty range account for a considerably smaller proportion of beneficiary inpatient stays, to the extent that higher readmission rates signal concerns about care quality and discharge planning, patients going to higher-penalty hospitals may be at greater risk for related problems. Further study about other possible differences between relatively high- and low-penalty hospitals may be helpful, such as in their discharge planning activities or their overall patient complexity, particularly in teaching hospitals and hospitals with higher proportions of low-income Medicare patients. Additionally, further research could examine the role of other clinicians in these hospitals’ communities, including ambulatory and post-acute care providers and other organizations.
Our research also shows that previously flat readmission rates for traditional Medicare started to decline in 2012 for patients who had been hospitalized for heart failure, heart attack, or pneumonia. This timing suggests that hospitals may have started to implement strategies to lower their readmissions in response to the enactment of the HRRP, with the understanding that the financial penalties (starting in 2013) would be based on performance in prior years. Further, because the declines are seen for multiple conditions, multipronged and system-based efforts to reduce readmissions are likely, rather than just improvements in certain clinical treatment for specific diseases.17 Also, concurrently, other providers in the community may have started to focus on ways to lower readmissions among their patients, thus contributing to the national decline in rates.
The overall effect of the HRRP on Medicare beneficiaries is rather indirect. To the extent that the financial penalties encourage hospitals to implement activities designed to improve care quality and lower their rate of preventable readmissions, the penalty program could be beneficial to Medicare patients and the Medicare program. Alternatively, some have noted that reducing financial resources to lower-performing hospitals could have a negative impact on their delivery of patient care. Regarding beneficiaries’ out-of-pocket expenses, a hospital’s penalty status has no direct effect on beneficiaries’ cost sharing during inpatient stays. For readmissions in particular, the inpatient hospital deductible is waived ($1,260 in 2015), but beneficiaries do face other out-of-pocket liabilities—mostly in the form of coinsurance for separately billed physician services received during their stay—as they would in all inpatient stays.18
In the coming years
With the enactment of the HRRP in the ACA, the aim to reduce preventable hospital readmissions has gained traction among providers and policymakers. In fact, the HRRP is featured as part of the Administration’s newly announced goal to tie an increasing share of traditional Medicare payments to quality or value in the coming years. Moreover, key programs, such as Accountable Care Organizations (ACOs), bundled-payment initiatives, and the Independence at Home demonstration, include provider incentives to lower hospital admission and readmission rates, either directly or indirectly. The Community-based Care Transitions Program, also enacted by the ACA, is designed to assess ways that community-based organizations (such as local aging services agencies) might partner with hospitals to improve patients’ transitions to other settings, such as skilled nursing facilities or the patients’ home.19 Additionally, CMS has recently started allowing physicians to bill Medicare for “transitional care management” after a beneficiary’s discharge from a hospital or other health care facility.
Evaluations of these ongoing Medicare programs and demonstrations will be helpful in determining which interventions are more successful than others in reducing the rate of preventable hospital readmissions. The continuing decline in preventable readmission rates would help slow the growth in Medicare spending and may also signal improved care for patients during and after their hospitalizations.
Endnotes
Jencks, S. F. et al., “Hospitalizations among Patients in the Medicare Fee-for-Service Program,” New England Journal of Medicine Vol. 360, No. 14: 1418-1428, 2009.; Epstein, Arnold M. et al., “The Relationship between Hospital Admission Rates and Rehospitalizations,” New England Journal of Medicine Vol. 365, No. 24: 2287-2295, 2011.
Ahmad, Faraz S. et al., “Identifying Hospital Organizational Strategies to Reduce Readmissions,” American Journal of Medical Quality Vol. 28, No. 4: 278-285, 2013.; and Silow-Carroll, Sharon et al., “Reducing Hospital Readmissions: Lessons from Top-Performing Hospitals,” Commonwealth Fund Synthesis Report, New York: Commonwealth Fund, 2011.; and Jack, B. W. et al., “A Reengineered Hospital Discharge Program to Decrease Hospitalization: A Randomized Trial,” Annals of Internal Medicine Vol. 50, No. 3: 178-187, 2009.; and Kanaan Susan B., “Homeward Bound: Nine Patient-Centered Programs Cut Readmissions,” Oakland, CA: California HealthCare Foundation, 2009.
Other examples include several of the new payment delivery system reforms launched by the CMS Innovation Center, including Pioneer Accountable Care Organizations (ACOs), bundled-payment initiatives, and the Independence at Home demonstration, all of which include provider incentives to lower hospital admission and readmission rates, either directly or indirectly. Additionally, the Community-based Care Transitions Program, also enacted by the ACA, is designed to assess ways that community-based organizations (such as local aging services agencies) might partner with hospitals to improve patients’ transitions to other settings, such as skilled nursing facilities or the patients’ home.
U.S. Department of Health and Human Services, “Better, Smarter, Healthier: In historic announcement, HHS sets clear goals and timeline for shifting Medicare reimbursements from volume to value.” Press release, January 26, 2015. http://www.hhs.gov/news/press/2015pres/01/20150126a.html
Rau, Jordan, “Medicare Fines 2,610 Hospitals in Third Round of Readmissions” Kaiser Health News, October 02, 2014; Joynt, K. and A. Jha, “A Path Forward on Medicare readmissions” New England Journal of Medicine Vol. 368, No. 13, 2013. Medicare Payment Advisory Commission, “Chapter 4: Refining the Hospital Readmissions Reduction Program,” Report to the Congress: Medicare and the Health Care Delivery System, June 2013.
Maryland hospitals have a longstanding Medicare waiver that exempt them from the IPPS and allows Maryland to set all-payer rates for its hospital services.
Hospitals’ excess readmission ratios are also weighted by Medicare’s cost for admissions with the given initial diagnosis.
These estimates of total penalties reflect CMS’s published corrections. CMS’s earlier estimates were a little lower—$280 million for 2013 and $424 million for 2015.
We estimate future hospitalizations (for FY 2015) based on the distribution of Medicare Fee-for-Service beneficiaries in 2013, the latest year available. If patient awareness of hospital performance influences hospital selection, then the proportion of patients going to hospitals with higher penalties may be even lower.
Medicare Payment Advisory Commission, “Chapter 4: Refining the Hospital Readmissions Reduction Program,” Report to the Congress: Medicare and the Health Care Delivery System, June 2013. Joynt, K. and A. Jha, “A Path Forward on Medicare readmissions” New England Journal of Medicine Vol. 368, No. 13, 2013.
For some hospitals, the number of cases is too small (fewer than 25) to reliably tell how well the hospital is performing, so no comparison to the national rate is shown.
U.S. Department of Health & Human Services, “New HHS Data Shows Major Strides Made in Patient Safety, Leading to Improved Care and Savings,” May 7, 2014.
“Hospital Readmissions Program Accuracy and Accountability Act of 2014,” S.2501, 113th Cong. (2013-2014); and “Establishing Beneficiary Equity in the Hospital Readmission Program Act,” H.R.4188, 113th Cong. (2013-2014).”
Federal Register Vol. 79, No. 163: 49659-50536, 2014.
This issue and other complexities with the penalty formula are discussed in Medicare Payment Advisory Commission, “Chapter 4: Refining the Hospital Readmissions Reduction Program,” Report to the Congress: Medicare and the Health Care Delivery System, June 2013; Lynn, Joanne and Steve Jencks, “A Dangerous Malfunction in the Measure of Readmission Reduction,” MediCaring.org, August 26, 2014.
Ahmad, Faraz S. et al., “Identifying Hospital Organizational Strategies to Reduce Readmissions,” American Journal of Medical Quality Vol. 28, No. 4: 278-285, 2013.; and Silow-Carroll, Sharon et al., “Reducing Hospital Readmissions: Lessons from Top-Performing Hospitals,” Commonwealth Fund Synthesis Report, New York: Commonwealth Fund, 2011.; and Jack, B. W. et al., “A Reengineered Hospital Discharge Program to Decrease Hospitalization: A Randomized Trial,” Annals of Internal Medicine Vol. 50, No. 3: 178-187, 2009.; and Kanaan Susan B., “Homeward Bound: Nine Patient-Centered Programs Cut Readmissions,” Oakland, CA: California HealthCare Foundation, 2009.
While hospital readmission rates among Medicare patients has declined, some other types of hospital rates have increased, including outpatient emergency room visits and observation stays. Medicare claims analysis by Gerhardt et al (2014) suggests that reductions in readmissions in 2012 were largely independent from these other types of hospital uses. (Gerhardt, G., A. Yemane, K. Apostle, A. Oelschlaeger, E. Rollins, and N. Brennan. 2014. "Evaluating Whether Changes in Utilization of Hospital Outpatient Services Contributed to Lower Medicare Readmission Rate." Medicare & Medicaid Research Review 4(1), E1-E13.)
Rollins, and N. Brennan. 2014. "Evaluating Whether Changes in Utilization of Hospital Outpatient Services Contributed to Lower
Medicare Readmission Rate." Medicare & Medicaid Research Review 4(1), E1-E13.
In general, beneficiaries are not responsible for an inpatient deductible if admitted to a hospital within 60 days of a prior hospitalization.
Based on a subset of participating organizations from the start of the Community-based Care Transitions program, preliminary results find that only a small number of organizations were able to achieve significant reductions in readmissions. Further analysis is expected that could highlight both successful and unsuccessful strategies and techniques. (Econometrica, Inc, “Evaluation of the Community-based Care Transitions Program,” submitted to CMS (May 2014).