The Red/Blue Divide in COVID-19 Vaccination Rates
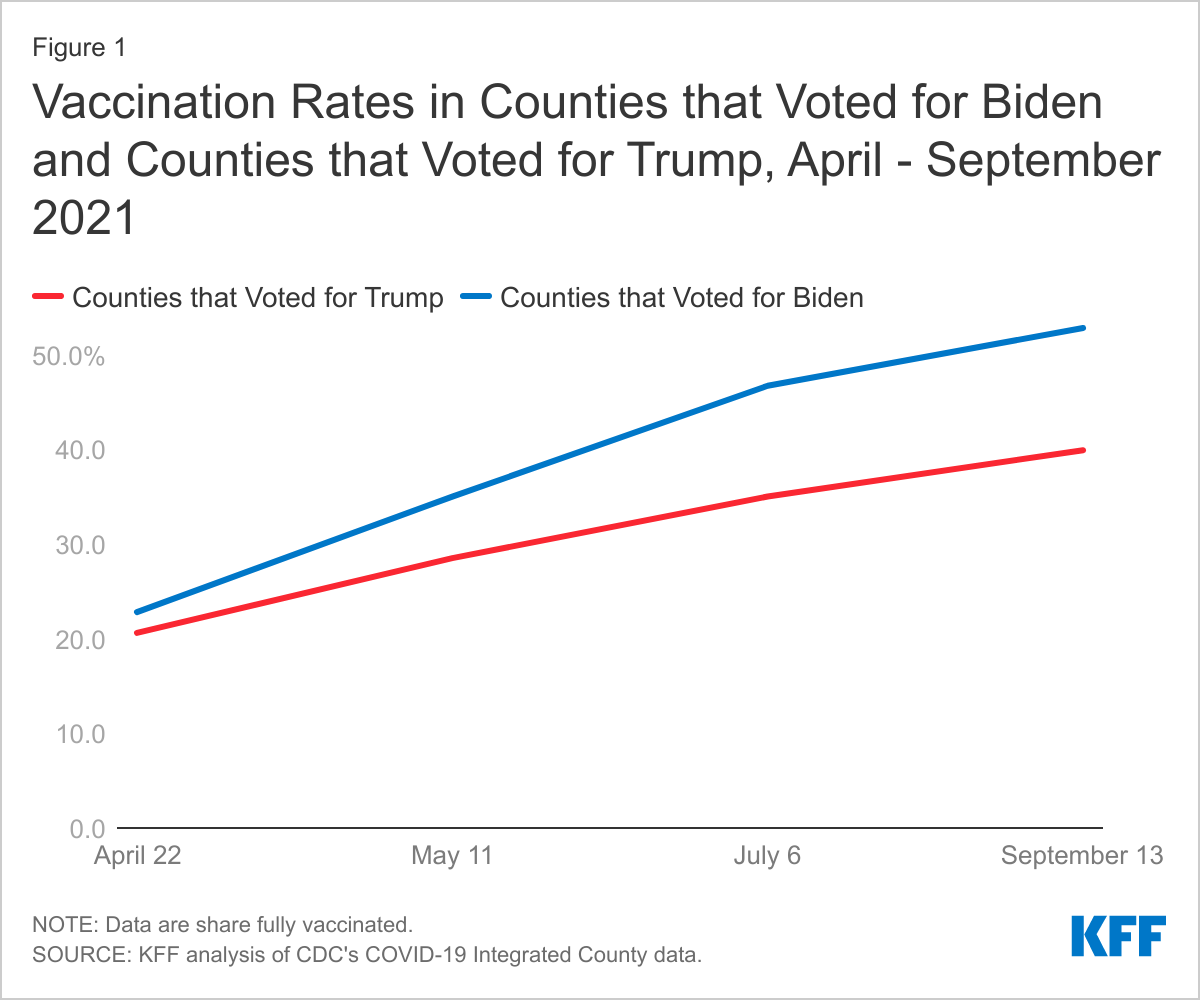
There continue to be differences in COVID-19 vaccination rates along partisan lines, a gap that has grown over time. We’ve documented this in our COVID-19 Vaccine Monitor surveys of the public, and we’ve been tracking county-level data to assess vaccination rates in counties that voted for Trump in the 2020 Presidential election compared to those that voted for Biden.
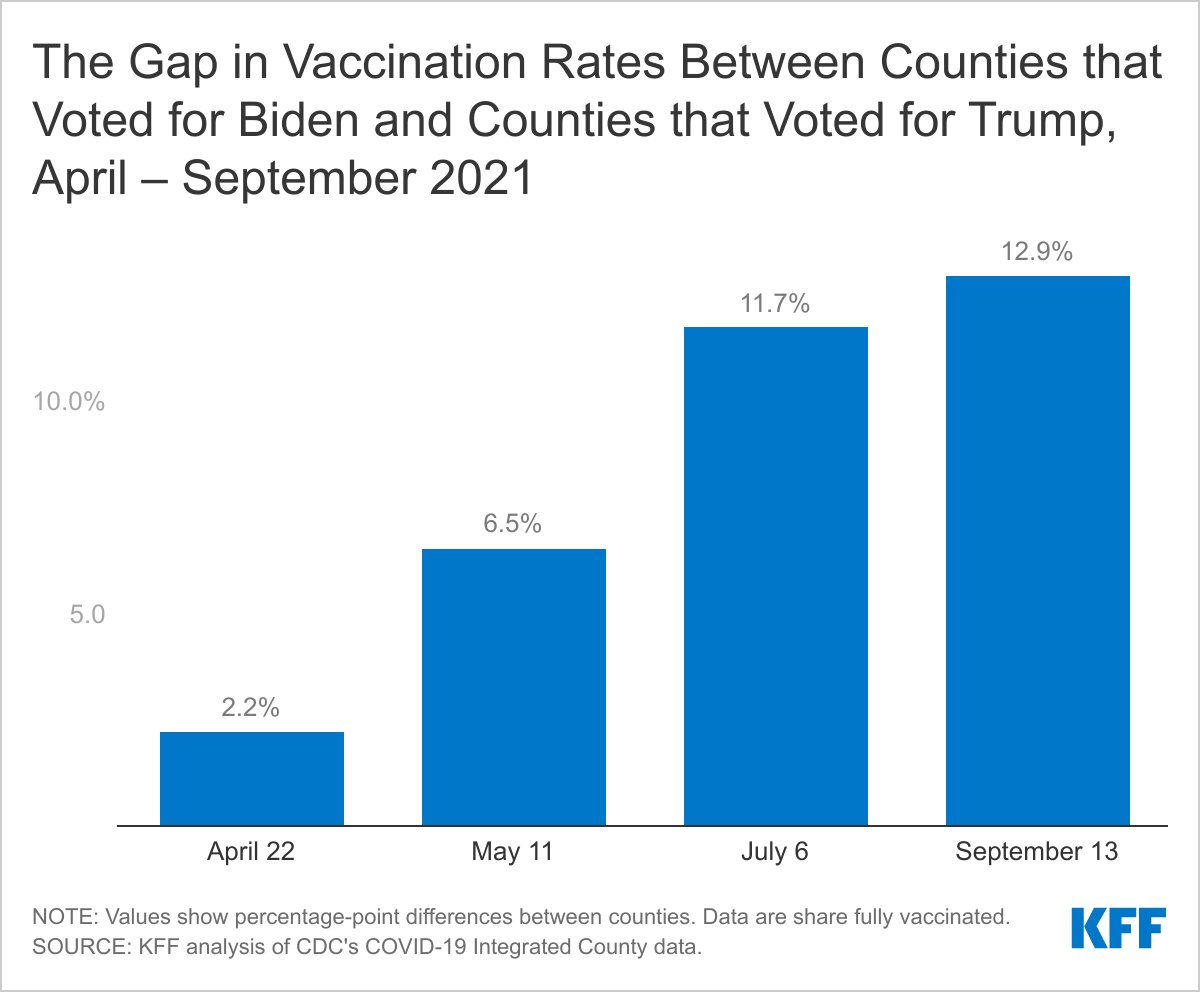
As of September 13, 2021, 52.8% of people in counties that voted for Biden were fully vaccinated compared to 39.9% of Trump counties, a 12.9 percentage point difference (Figure 1). While the rate of vaccination coverage has slowed in both county groups, the gap has widened over time (Figure 2).
Whether President Biden’s recent actions to address the ongoing impact of COVID-19 in the U.S., including a federal employee vaccine mandate and a requirement that all employers with more than 100 employees institute a vaccine mandate or regular testing, will be enough to increase vaccination rates and narrow this gap remains to be seen.
This data snapshot is based on an analysis of data on the share of the population fully vaccinated by county from the Centers for Disease Control and Prevention’s (CDC) COVID-19 Integrated County View and data on the 2020 Presidential election results by county from here (for more detailed methods, see: https://www.kff.org/coronavirus-covid-19/issue-brief/vaccination-is-local-covid-19-vaccination-rates-vary-by-county-and-key-characteristics/).