The Role of Adult Children of Immigrants in the U.S. Health Care Workforce

Published: Mar 13, 2024

Introduction

Immigrants and their children form a growing share of the U.S. population and make important contributions to the country’s culture, economy, and workforce. One of the major reasons why immigrants come to the U.S. is for improved educational and employment opportunities for their children. Many children of immigrants realize their parents’ dreams by attaining high levels of education and jobs that allow for an improved quality of life. Adult children of immigrants also play an important role in supporting the U.S. workforce and economy, particularly in certain sectors, including health care. This brief examines key characteristics of nonelderly adult children of immigrants and their role in the workforce, including the health care workforce, based on KFF analysis of 2023 Current Population Survey data (see Methods for details). All differences described in the text are statistically significant at p<0.05. Key takeaways include the following:

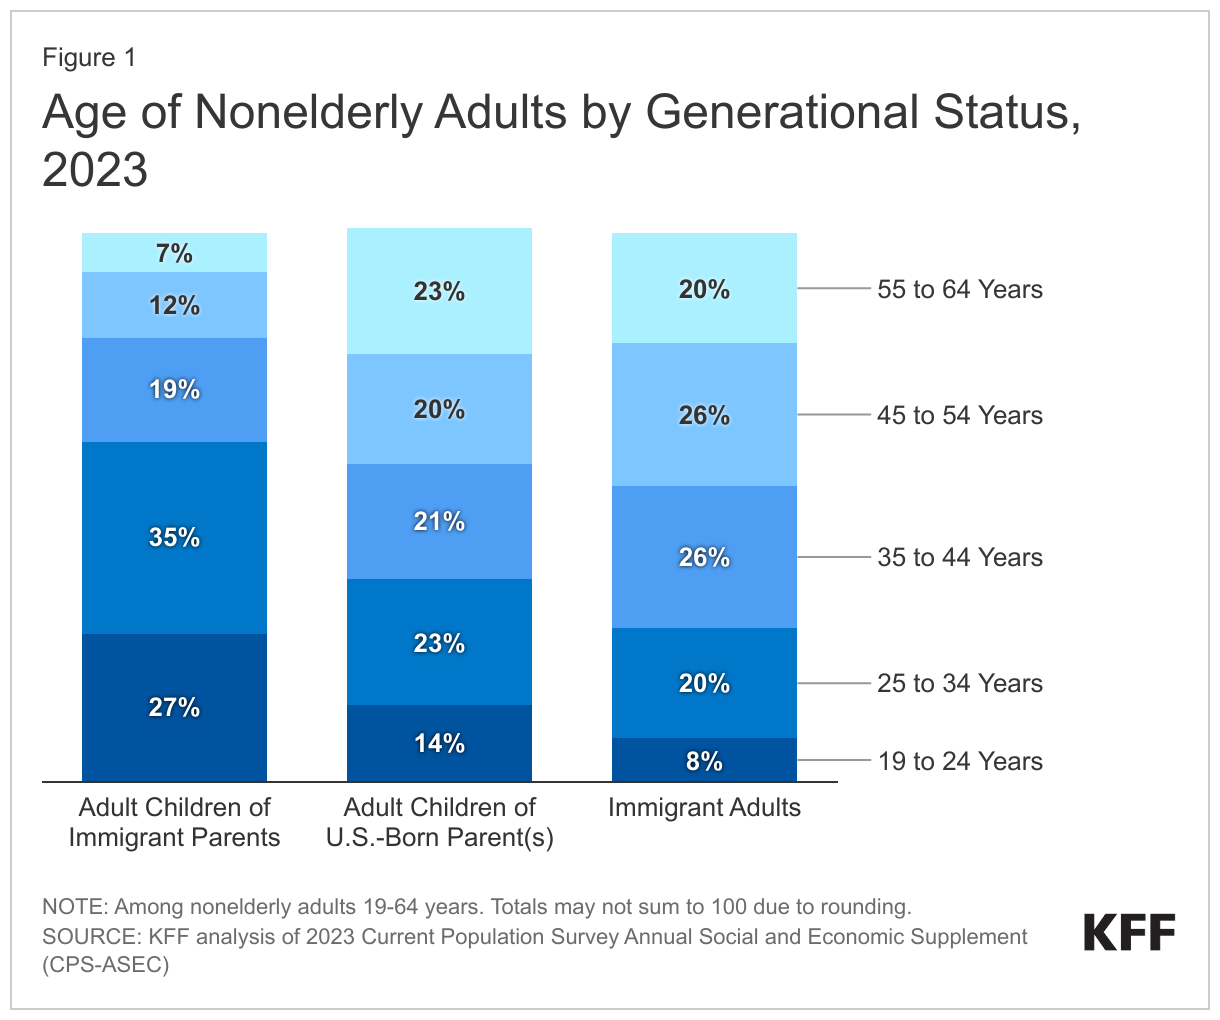
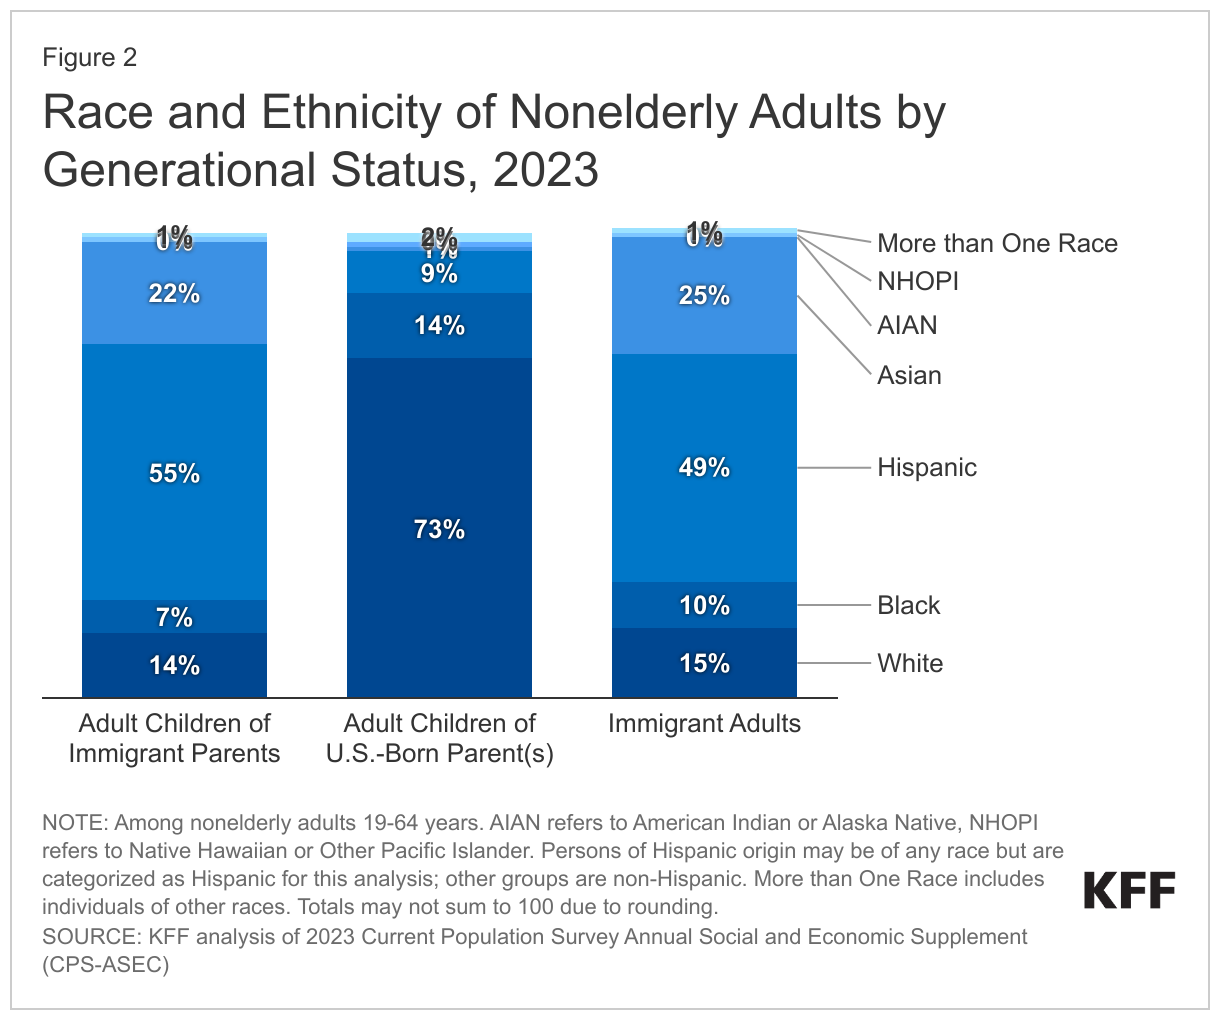
  • Nonelderly adult children of immigrants are more likely than those with U.S.-born parents to be under age 35 and to be Hispanic or Asian. Six in ten (62%) nonelderly adult children of immigrants are under age 35 and three-quarters are Hispanic (55%) or Asian (22%). In comparison, about four in ten (37%) of nonelderly adults with at least one U.S.-born parent are under 35 years and one in ten is Hispanic (9%) or Asian (1%). About three in ten (28%) nonelderly adults who are immigrants themselves are under 35 years and three-quarters are Hispanic (49%) or Asian (25%).
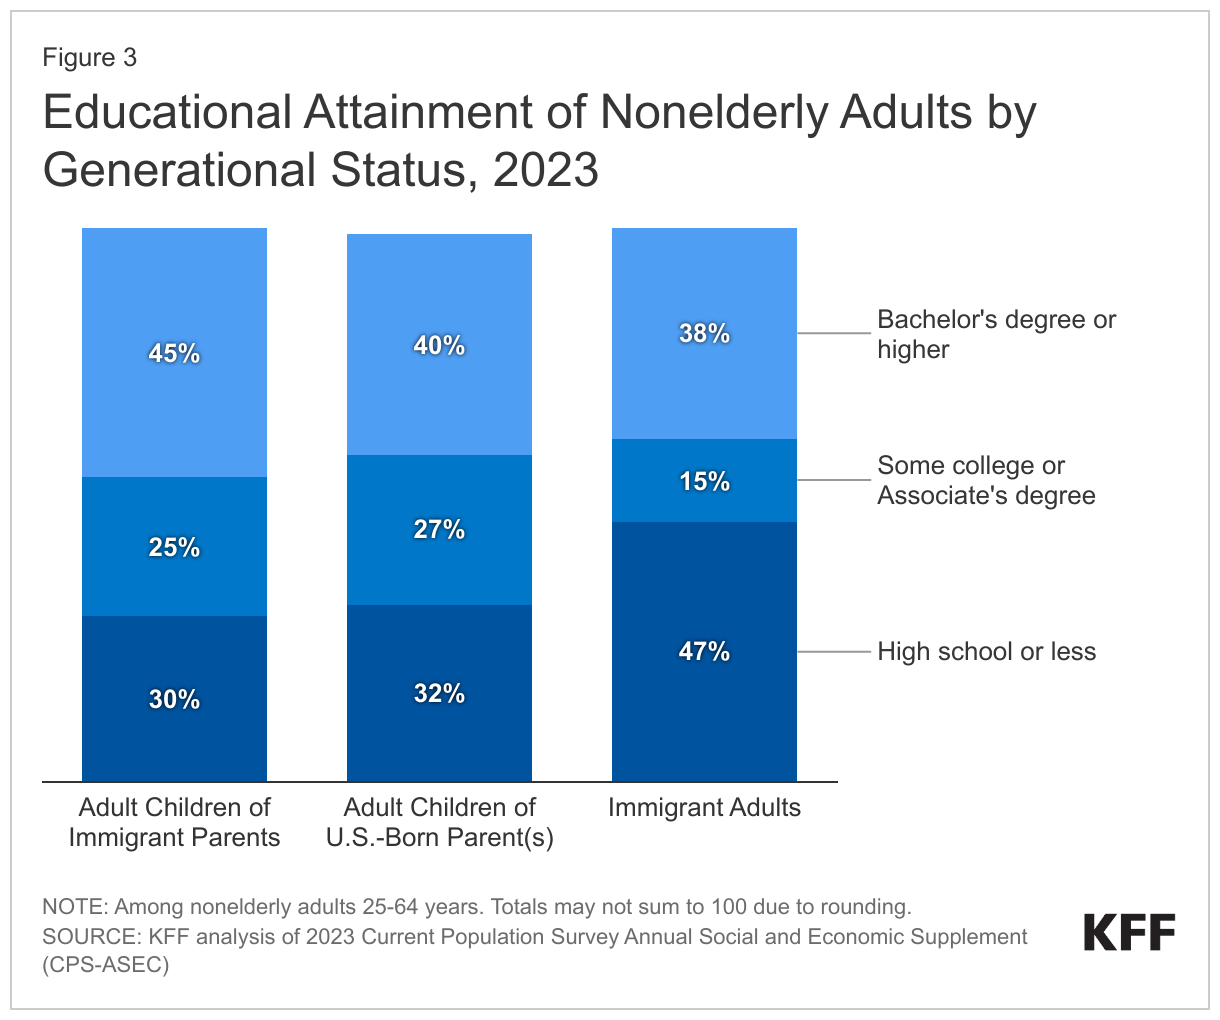
  • Nonelderly adult children of immigrants have somewhat higher educational attainment compared to their peers with U.S.-born parents and immigrant adults. Among those ages 25 to 64 (who are less likely to be students), over four in ten (45%) adult children of immigrants have a bachelor’s degree or higher compared with 40% of those with at least one U.S.-born parent and 38% of immigrant adults.
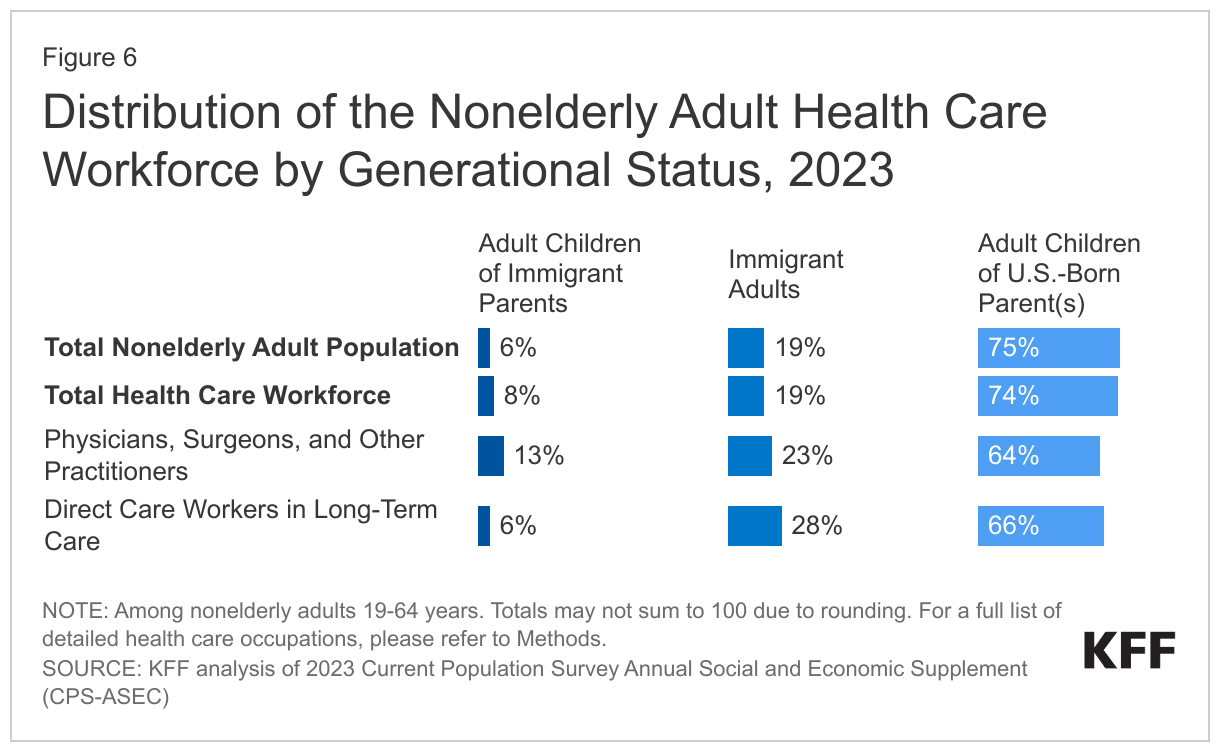
  • About three-quarters (76%) of nonelderly adult children of immigrants and nonelderly adult immigrants (75%) are working and they make outsized contributions to the health care workforce. In particular, adult children of immigrants make up twice the share of physicians, surgeons, and other health care practitioners compared with their share of the population (13% vs. 6%). Immigrant adults also make up a larger share of physicians, surgeons, and other health care practitioners than they do of the population (23% vs. 19%) and play a particularly large role as direct care workers in long-term care settings, accounting for almost three in ten (28%) of these workers. In contrast, nonelderly adults with at least one U.S.-born parent make up a smaller share of physicians, surgeons, and other health care practitioners as well direct care workers in long-term care relative to their share of the population.
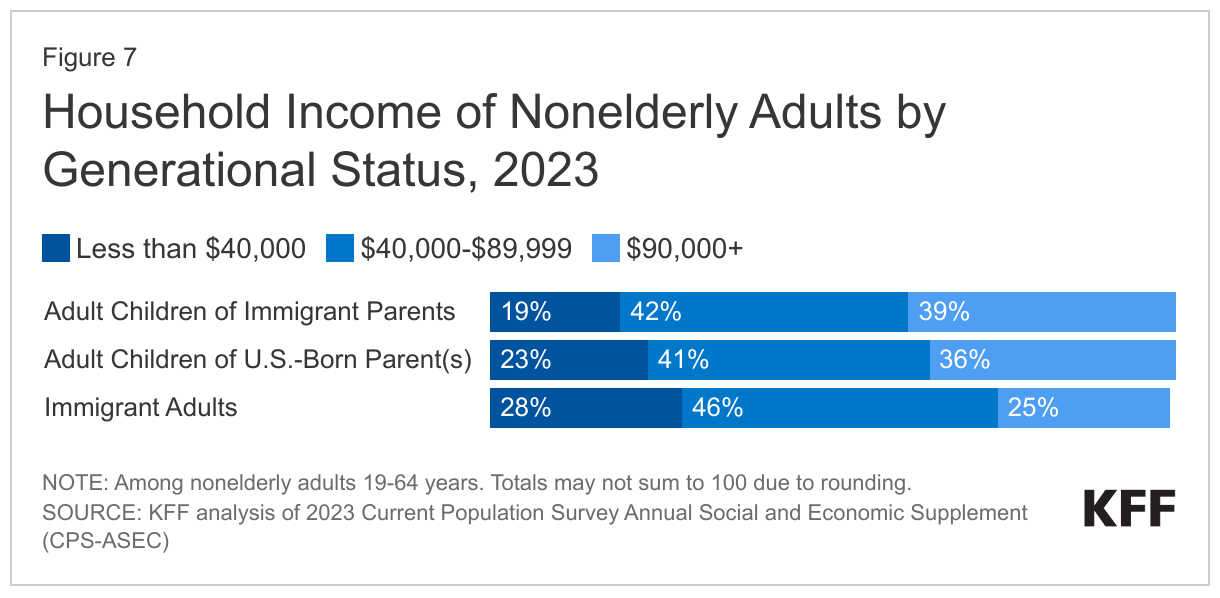
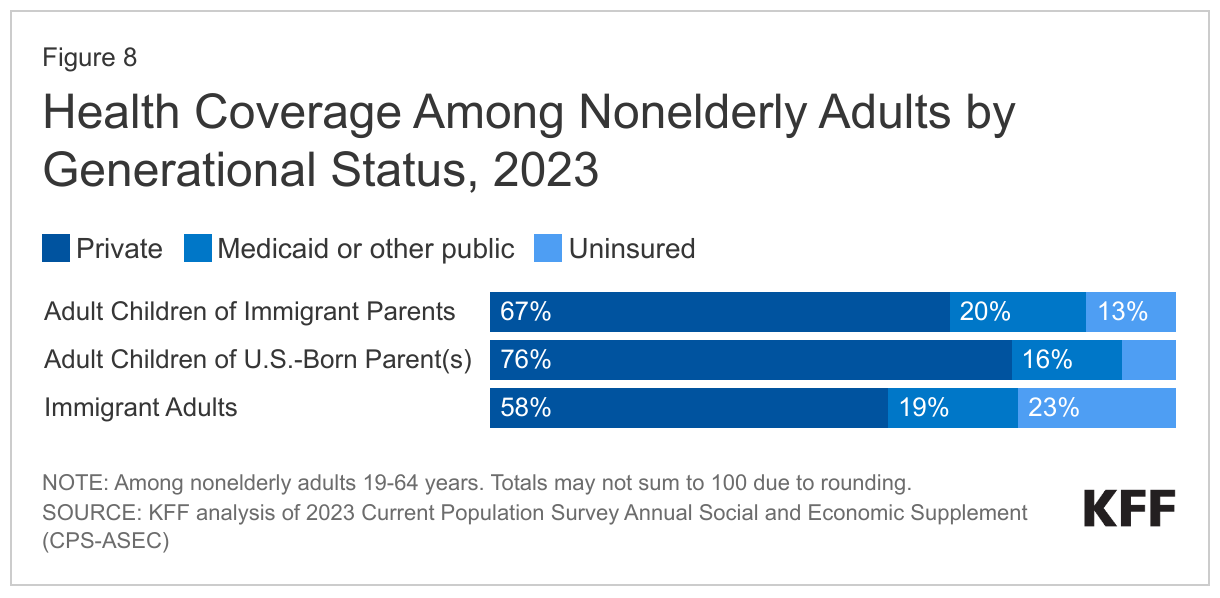
  • Four in ten (39%) nonelderly adult children of immigrants live in households with an annual income of $90,000 or more and most (67%) have private health coverage. Similarly, about one in three (36%) of nonelderly adults with at least one U.S.-born parent and a quarter (25%) of nonelderly adult immigrants have annual household incomes of $90,000 or more. However, adult children of immigrants are less likely than adult children of U.S.-born parents to have private health coverage (67% vs. 76%) and more likely to be uninsured (13% vs. 8%), although they are more likely than immigrant adults to have coverage. Their higher uninsured rates relative to their peers with at least one U.S.-born parent may reflect that they are more likely to be employed in construction, food services, or transportation occupations, which may be less likely to offer employer-sponsored coverage.

These data suggest that proposals to limit workforce participation of immigrants or to end birthright citizenship for the children of some immigrants may adversely impact the U.S. workforce and economy. A reduction in the population of first- and second-generation immigrants may increase workforce shortages. The current health care workforce shortage in particular, which is projected to continue across professions, including allied health, long-term support services, behavioral health, and specialty physicians, may be exacerbated by such limitations given the disproportionate roles of both adult children of immigrants as well as immigrant adults in various health care occupations and industries. Worsening shortages could have negative effects on the nation’s health and well-being as well as the economy.

Background

In addition to the 45.5 million immigrants residing in the U.S. as of 2023, there are over 25.6 million U.S.-born individuals residing in the country who have immigrant parents (both parents born outside the U.S.), half of whom are nonelderly adults ages 19 to 64.1  Immigrants and their adult children make up a growing share of the population and play an important role in the nation’s communities, workforce, and economy. Other research has shown that adult children of immigrants have higher levels of educational attainment and work in higher-earning professions than their parents. Analysis further shows that children of immigrants contribute more in taxes on average than their parents or the rest of the U.S.-born population, and their fiscal contributions exceed their costs associated with health care, education, and other social services. Moreover, as older generations exit the workforce, immigrants and their U.S.-born children have been the primary drivers of workforce growth, accounting for 83% of the growth in the U.S. labor force between 2010 and 2018.

At the same time, immigration remains a hot-button political issue in the U.S. and there is pervasive anti-immigrant rhetoric. A few states, like Florida, recently passed laws that seek to limit immigrants’ ability to participate in the workforce, and, at the national level, presidential candidates have made recent proposals to end or limit birthright citizenship, a right guaranteed under the 14th amendment of the U.S. Constitution for children born in the U.S. regardless of their parents’ immigration status. Such proposals, which are intended to deter immigration, would not only impact immigrants’ and their children’s access to health care but could have broader ramifications for the nation’s workforce and economy, potentially exacerbating existing worker shortages, including in health care.

This brief analyzes data from the 2023 Current Population Survey Annual Social and Economic Supplement (CPS-ASEC) to present demographic, employment, and socioeconomic characteristics of nonelderly adults 19 to 64 years born in the U.S. to immigrant parents (“adult children of immigrant parents”) (defined as having both parents born outside the U.S) and how they compare to “adult children of U.S.-born parents” (defined as having at least one parent born in the U.S.) and immigrant adults (see Methods for more details).

Demographic Characteristics

Adult children of immigrants are more likely to be younger (under 35 years) and more likely to be Hispanic or Asian than adult children of U.S.-born parents. Six in ten (62%) adult children of immigrants are between 19 and 34 years compared to 37% with at least one U.S.-born parent and 28% of immigrant adults (Figure 1). In addition, almost three-quarters of adult children of immigrants (77%) and immigrant adults (74%) are Hispanic or Asian compared to one in ten (10%) with at least one U.S.-born parent (Figure 2).

Age of Nonelderly Adults by Generational Status, 2023


Race and Ethnicity of Nonelderly Adults by Generational Status, 2023

Adult children of immigrants have somewhat higher educational attainment levels compared to their peers with U.S.-born parents and immigrant adults. Among those between the ages of 25 and 64 years (who are more likely to have completed school), over four in ten (45%) of adult children of immigrants have a bachelor’s degree or higher compared with 40% of those with at least one U.S.-born parent and 38% of immigrant adults (Figure 3).

Educational Attainment of Nonelderly Adults by Generational Status, 2023

Employment Characteristics

Three in four (76%), or nearly 8.7 million adult children of immigrants are employed, accounting for 6% of the nonelderly adult workforce, which is similar to their share of the nonelderly adult population (6%). Immigrants make up about one in five of the nonelderly adult workforce and population, while the remaining three-quarters of the nonelderly workforce and population are comprised of adults with at least one U.S.-born parent.

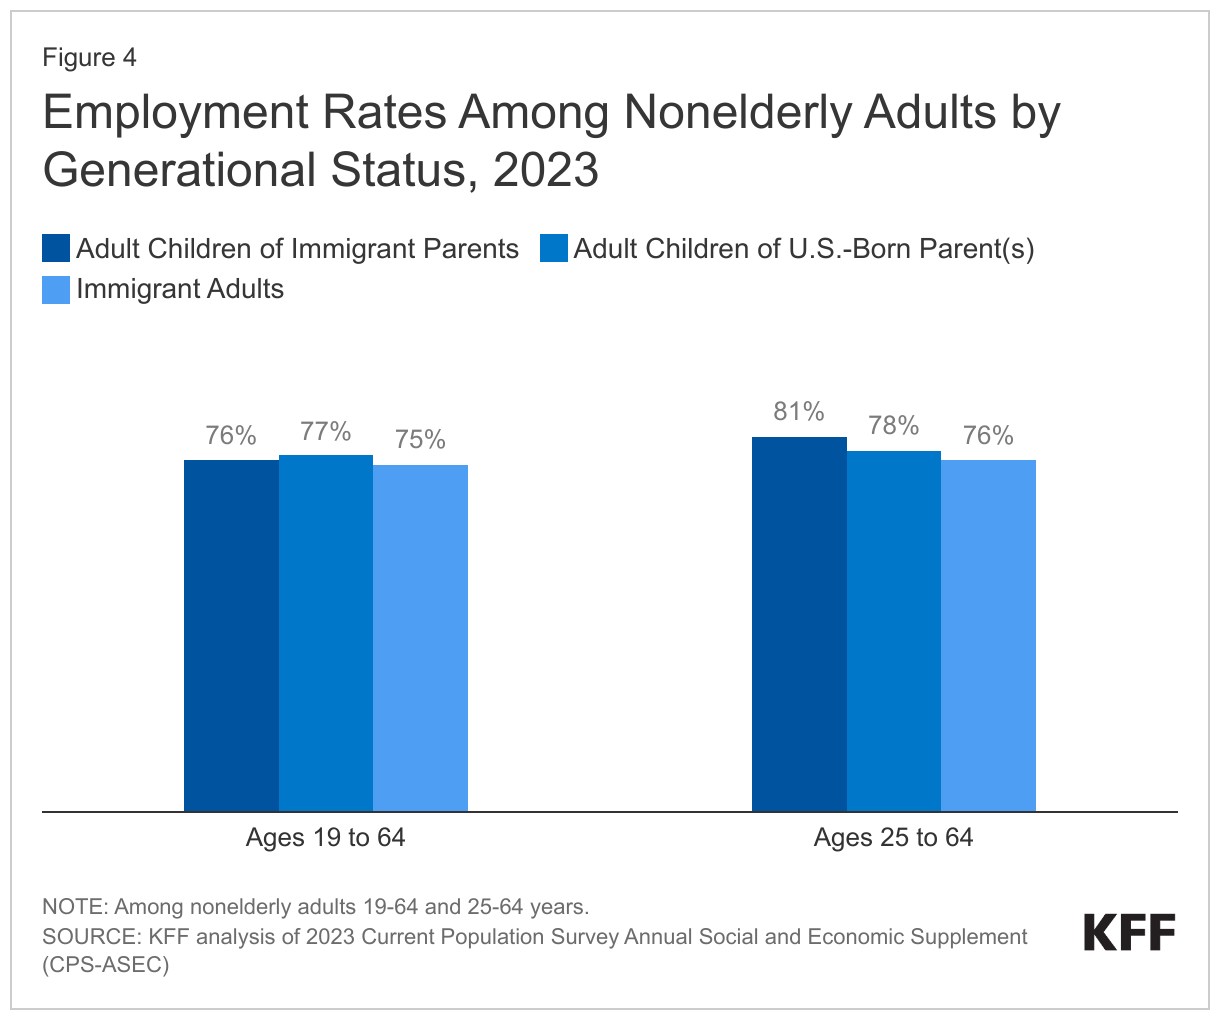
Employment rates for adult children of immigrants are similar to their counterparts with at least one U.S.-born parent and immigrant adults with roughly three in four employed, although among those ages 25 to 64, they are higher for adult children of immigrants. Among nonelderly adults between ages 25 to 64 (who are less likely to be students), about eight in ten (81%) adult children of immigrants are employed compared with 78% of their peers with at least one U.S.-born parent and 76% of immigrant adults in this age group.

Employment Rates Among Nonelderly Adults by Generational Status, 2023

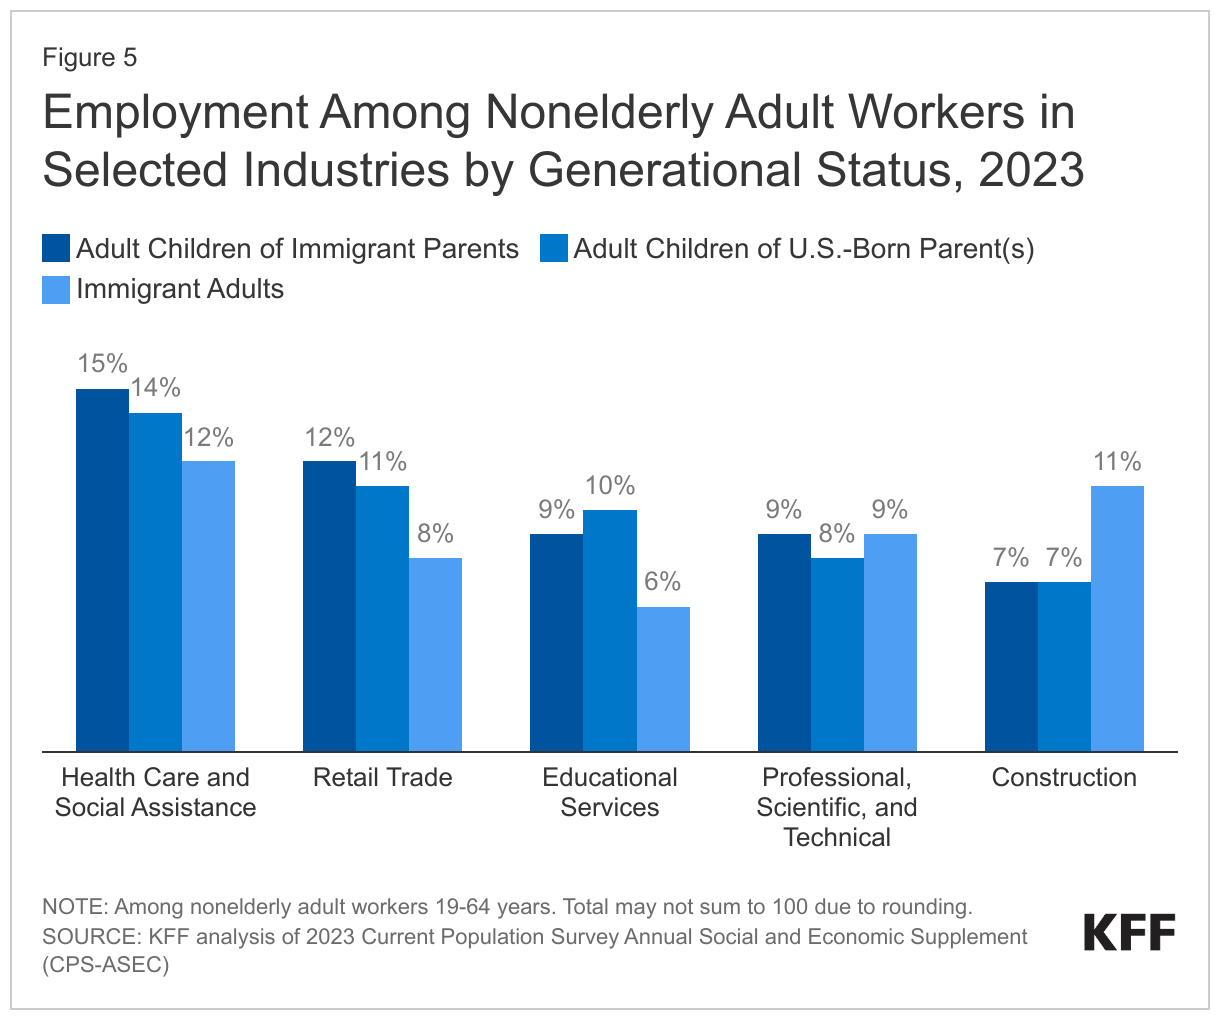
The top five industries in which adult children of immigrants are employed include health care and social assistance; retail trade; educational services; professional, scientific, and technical;  and construction industries (Figure 5). Industry patterns for adult children of immigrants and their counterparts with U.S.-born parents are largely similar, with significant shares working in health care and social assistance (15% and 14%), retail trade (12% and 11%), professional, scientific, and technical industries (9% and 8%), educational services (9% and 10%), and in construction (7% for both). While significant shares of immigrant adults also are employed in health care and social assistance (12%) and professional, scientific, and technical industries (9%), their rates are lower, and over one in ten work in construction (11%). Significant shares of immigrant adults also are employed in food service (8%) and transportation (7%) industries.

Employment Among Nonelderly Adult Workers in Selected Industries by Generational Status, 2023

Role in the Health Care Workforce

Adult children of immigrants and immigrant adults account for larger shares of physicians, surgeons, and other practitioners relative to their share of the nonelderly population. Specifically, adult children of immigrants make-up 13% of physicians, surgeons, and other practitioners, over twice their share of the nonelderly population (6%), and immigrant adults account for about a quarter (23%) of people in these occupations compared with 19% of the nonelderly population (Figure 6). (See Methods for details on health care occupation groupings.) Immigrant adults also play a particularly large role in the long-term care (LTC) workforce, making up almost three in ten (28%) of direct care workers in LTC settings, including registered nurses, licensed practical nurses, certified nursing assistants, home health aides, and personal care aides working in nursing homes, residential care facilities, or home health services. Reflecting this role, research has found that increased immigration is associated with improved staffing levels at U.S. nursing homes and consequently leads to improved outcomes for patients. On the other hand, adult children of at least one U.S.-born parent make up a smaller share of physicians, surgeons, and other practitioners as well as direct care workers in LTC than they do of the population (64% and 66% vs. 75%).

Distribution of the Nonelderly Adult Health Care Workforce by Generational Status, 2023

Income and Health Coverage

Adult children of immigrants attain greater upward mobility than their parents and have somewhat higher household incomes than immigrant adults as well as adult children of U.S.-born parents. Reflecting their higher rates of educational attainment and employment patterns, four in ten (39%) nonelderly adult children of immigrants live in households with an annual income of $90,000 or more compared with about one in three (36%) nonelderly adult children of U.S.-born parents and a quarter (25%) of nonelderly adult immigrants (Figure 7).

Household Income of Nonelderly Adults by Generational Status, 2023

Most adult children of immigrants and immigrant adults have private health coverage, but they are more likely than adult children of U.S.-born parents to be uninsured (Figure 8). Despite high rates of employment and higher incomes, adult children of immigrants are less likely than adult children of U.S.-born parents to have private health coverage (67% vs. 76%) and are more likely to have Medicaid or other public coverage (20% vs. 16%) or to be uninsured (13% vs. 8%). However, they are more likely than immigrant adults to have private coverage (67% vs. 58%) and less likely to be uninsured (13% vs. 23%). While many adult children of immigrants work in health care and other professional occupations, they are more likely than those with at least one U.S. born parent to be in construction, food services, or transportation occupations, which may be less likely to offer employer-sponsored coverage. The higher uninsured rates among immigrant adults also reflect eligibility restrictions for federally funded coverage options, including Medicaid. Given their higher uninsured rates, immigrants and adult children of immigrants likely face increased barriers to accessing care and are at increased financial risk for health care costs.

Health Coverage Among Nonelderly Adults by Generational Status, 2023


Methods

The data in this brief are based on KFF analysis of the 2023 Current Population Survey Annual Social and Economic Supplement (CPS-ASEC) and are limited to nonelderly adults 19 to 64 years. Adult children of immigrant parents are defined as nonelderly adults born in the U.S. or its territories who have both parents born outside the U.S. or its territories; adult children of U.S.-born parent(s) are defined as nonelderly adults born in the U.S. or its territories who have at least one parent also born in the U.S. or its territories; and immigrant adults are defined as individuals born outside the U.S. or its territories.

The total health care workforce is defined as occupation codes 3000 through 3655. Physicians, surgeons, and other practitioners are defined as occupation codes 3000-3120 (chiropractors, dentists, dietitians, nutritionists, optometrists, pharmacists, physicians, surgeons, physician assistants, and podiatrists). Direct care workers in long-term care are defined as occupation codes 3255 (registered nurses), 3500 (licensed practical and licensed vocational nurses), 3603 (nursing assistants), 3601 (home health aides), or 3602 (personal care aides) working in industry codes 8170 (home health care services), 8270 (nursing care facilities), or 8290 (residential care facilities).

  1. KFF analysis of 2023 Current Population Survey Annual Social and Economic Supplement (CPS-ASEC). ↩︎

Domestic HIV Funding in the White House FY 2025 Budget Request

Author: Lindsey Dawson
Published: Mar 12, 2024

President Biden released his FY 2025 budget request on March 11, 2024. The President’s fourth and final budget request of his first term builds on past efforts to address the domestic HIV response, including by proposing slight funding increases for the “Ending the HIV Epidemic” (EHE) initiative and the Housing Opportunities for People with AIDS (HOPWA) Program. In addition, this is the third year the budget proposes a new mandatory HIV prevention program aimed at expanding the use of pre-exposure prophylaxis (PrEP), a medication that prevents HIV for those at higher risk.

The request also includes discretionary funding levels for key programs aimed at addressing the domestic HIV epidemic, including at the Centers for Disease Control and Prevention (CDC), the Health Resources and Services Administration’s (HRSA) Ryan White HIV/AIDS and Health Center Programs, the National Institutes of Health (NIH), the Dept. of Housing, Urban Development’s HOPWA Program, the Minority AIDS Initiative, and the Indian Health Service (IHS). It also marks the fifth year of budget requests for the EHE. (Not included here are funding levels through mandatory accounts, including Medicaid, Medicare, Social Security Insurance (SSI), and Social Security Disability Insurance (SSDI), which make up the majority of HIV spending by the federal government.)

As the FY 2024 budget has not yet been approved by Congress, comparisons are made to the FY 2023 level, when possible. An overall request total for discretionary HIV funding is not yet available as we await the domestic HIV funding level from NIH. The funding request for the EHE initiative totals $593.25 million, $20 million (3.5%) over the FY 2023 enacted level.

Key budget highlights are as follows.

CDC – HIV prevention

  • The FY 2025 funding request for domestic HIV prevention at the CDC, which accounts for almost all federal funding for domestic HIV prevention, totals $1.0 billion which is the same level as the FY 2023 enacted amount.

HRSA – Ryan White and Health Center HIV Funding

  • The Ryan White HIV/AIDS Program, the nation’s safety net for HIV care and treatment, receives $2.6 billion in the FY 2025 request, a $10 million (0.4%) increase over the FY 2023 enacted level. The small increase is attributed to EHE activities; the EHE receives $175 million in the request, an increase of $10 million (6.1%) over the FY 2023 enacted level.
  • The FY 2025 budget request also includes $157.25 million in HIV funding for the Health Center Program at HRSA, all of which is for the EHE initiative, and is the same amount as the FY 2023 enacted level.

NIH – Domestic HIV Research

  • The National Institutes of Health (NIH) carries out almost all federally funded HIV research activities. The domestic share of HIV funding is not yet known. The FY 2023 enacted level for domestic HIV research at NIH was $2.7 billion. (This line will be updated with FY 2025 request level, when possible.)
  • Included in the overall HIV funding at NIH is funding for the EHE. The agency received $26 million in EHE funding in the request which is the same as the FY 2023 enacted level.

Indian Health Service (IHS)

  • The FY 2024 budget request includes $15 million for EHE activities at the Indian Health Service (IHS). This is a $10 million, or 200% increase, over the FY 2023 enacted level of $5 million.

Housing Opportunities for People with AIDS (HOPWA)

  • HOPWA is a program of the Department of Housing and Urban Development which provides housing assistance and supportive services to low-income people with HIV facing housing insecurity. The FY 2023 budget request includes $505 million, a $6 million (1%) increase over the FY 2023 enacted level.

PrEP Access through Medicaid and CHIP

  • The budget creates a proposal which would require state Medicaid and CHIP programs to cover PrEP and associated laboratory services without cost-sharing for beneficiaries. It also “places guardrails on utilization management practices like prior authorization and step therapy.”

Mandatory PrEP Program

  • For the third year in a row, the Budget proposes to repropose $9.8 billion over 10 years for a new mandatory Pre-Exposure Prophylaxis (PrEP) Delivery Program to End the HIV Epidemic in the United States (“PrEP Delivery Program”). The program would aim to “provide PrEP and associated services at no cost to uninsured and underinsured individuals and expand the number of providers serving underserved communities.”

The tables below compare federal funding levels for domestic HIV, where specified, in the FY 2025 request to the FY 2023 enacted levels. (As noted, FY24 funding levels are yet available for comparison.) Funding for the “Ending the HIV” Initiative is included in the overall table (Table 1) and in a dedicated table (Table 2). Funding for the new PrEP program is not included below as the following tables include discretionary funding only.

Key Discretionary Accounts in the Domestic HIV Budget Request, FY 2025 Budget Request and FY 2023 Enacted (in Millions)


Ending the HIV Epidemic (EHE) Funding in the Domestic HIV Budget Request, FY 2025 Budget Request and FY 2023 Enacted (in Millions)


Key Documents:

Global Health Funding in the FY 2025 President’s Budget Request

Published: Mar 12, 2024

President Biden released his FY 2025 Budget Request on March 11, 2024. Since FY 2024 appropriations have not been finalized yet, comparisons here are made to the FY 2023 enacted level. The budget request includes discretionary funding for U.S. global health programs at the State Department, the U.S. Agency for International Development (USAID), the Centers for Disease Control and Prevention (CDC), and the National Institutes of Health (NIH).[i] Highlights include:

  • Total funding would decline: Funding provided to the State Department and USAID through the Global Health Programs (GHP) account, which represents the bulk of global health assistance, totals $9.8 billion in FY 2025, a decrease of $733 million below the FY 2023 enacted level.
  • The entire decline is due to a decreased contribution to the Global Fund (but, there are specific technical reasons for the decrease): Funding for the Global Fund to Fight AIDS, Tuberculosis and Malaria (Global Fund) totals $1.2 billion, a decrease of more than $800 million compared to FY 2023 ($2 billion). This decrease is due to a funding match requirement that limits the amount the U.S. can contribute, which is a cap of 33% of total contributions from other donors; the FY 2025 Global Fund amount is expected to support the third tranche of U.S. funding as part of its three-year pledge of $4.8 billion toward the Global Fund’s seventh replenishment.
  • Two areas would increase slightly:
    • Maternal and child health (MCH) programs would receive a slight increase, partly due to an increased contribution to Gavi, the Vaccine Alliance, as part of the first year of a four-year pledge towards Gavi’s next replenishment cycle.
    • Family planning and reproductive health (FP/RH)[ii], is the only other area that would receive a slight increase – for both bilateral funding and the U.S. contribution to the United Nations Population Fund (UNFPA).
  • All other areas would remain flat: Funding for bilateral HIV, TB, malaria, nutrition, vulnerable children, neglected tropical diseases, global health security, and the Health Reserve Fund are the same as the FY 2023 amount.
  • Also of note:
    • The FY 2025 request also includes funding for the Global Financing Facility (GFF), provided under MCH funding; the Pandemic Fund, provided under global health security funding; and the Global Health Worker Initiative, provided as its own separate line item.
    • Global health funding at CDC remains flat.

See the table below for additional detail. See other budget summaries and the KFF budget tracker for details on historical annual appropriations for global health programs.

KFF Analysis of Global Health Funding in the President's FY 2025 Request

Resources:


[i] Total funding for global health is not currently available as some funding provided through USAID, NIH, and DoD is not yet available.

[ii] Funding through the Economic Support Fund (ESF) account for FP/RH was specified by the White House Office of Management and Budget (OMB) during a conference call on the international affairs budget, per PAI.


A Closer Look at Medicaid Expansion Efforts in Mississippi

Published: Mar 12, 2024

Following implementation of Medicaid expansion under the Affordable Care Act (ACA) in North Carolina and South Dakota in 2023, there has been a recent surge in expansion activity early in 2024 among several of the ten states that have not yet adopted Medicaid expansion. While activity in Alabama, Georgia, and Kansas may have stalled, there continues to be growing potential for action in Mississippi. While expansion activity is ongoing in several states, President Biden continues to urge Congress to close the coverage gap in the remaining non-expansion states, though that is unlikely in a divided Congress. This policy watch takes a look at recent activity, what expansion could mean in Mississippi, and what to watch as things continue to play out.

What is the status of Medicaid expansion in Mississippi?

Medicaid expansion legislation (HB 1725) was recently passed in the Mississippi House by a 99-20 vote (a veto-proof majority) that directs the Division of Medicaid to seek a waiver to implement the expansion. The waiver would require individuals to be working in a job without health insurance, enrolled as a full-time student, or enrolled full-time in a workforce training program. Coverage would be delivered through managed care plans, which would provide workforce training and skills building and financial literacy materials. Individuals who have insurance through employer or private health insurance and who voluntarily disenroll from that coverage would not be eligible for Medicaid expansion coverage for 12 months. A $10 copay would be required for nonemergency use of the emergency room.

The legislation requires the Medicaid agency to submit a State Plan Amendment (SPA) to implement the expansion if the waiver is not approved by Sept. 30, 2024 or if approved and subsequently terminated. The SPA would be “substantially the same” as the waiver plan in terms of coverage group, delivery system, benefits package, and funding but would exclude the work requirement.

The bill includes financing and other provisions. The legislation stipulates that the expansion is contingent upon continuation of the current federal matching rate (FMAP) of 90%. Through waiver or SPA, the legislation calls for an assessment on hospitals and managed care plans to fund portion of the state share. The legislation would implement expansion starting January 1, 2025 and would require reauthorization to extend expansion beyond January 31, 2029.

What are the implications of Medicaid in Mississippi?

Medicaid eligibility for adults in Mississippi is very limited. In Mississippi, current eligibility limits for parents is 28% of the federal poverty level (FPL) or $7,230 annually for a family of three. There is no pathway for coverage for childless adults, so most childless adults with incomes below the poverty level have no options for affordable, comprehensive health coverage, since ACA premium subsidies are available only for people with income levels at or above poverty.

KFF estimates that 123,000 uninsured adults could be eligible for Medicaid if the state adopts the Medicaid expansion. This number includes 74,000 adults with incomes below poverty who fall into the coverage gap and an additional 49,000 uninsured adults with incomes between 100% and 138% FPL. Adults who fall into the coverage gap have incomes above current Medicaid eligibility limits, but below poverty, making them ineligible for subsidies in the ACA Marketplaces. Most uninsured adults with incomes between 100% and 138% FPL are currently eligible for Marketplace coverage but not enrolled. Most of the adults who are currently eligible for coverage in the Marketplace qualify for plans with zero premiums; however, even with no premiums, Medicaid could provide more comprehensive benefits and lower cost-sharing compared to Marketplace coverage.

What are key developments to watch?

Mississippi Medicaid expansion legislation is now under consideration in the Senate. The outcome of the legislation remains uncertain, and Senate leaders plan to introduce their own proposal so it is likely that there will be further negotiations between the two chambers. CMS under the Biden Administration is not expected to approve work requirement waivers. Unlike the House bill, the Senate proposal could include language and dates that would wait for a future presidential administration to take office and approve a waiver before expansion would be implemented. Even if a bill is passed by both legislative chambers, Governor Reeves has remained opposed to expansion.

A temporary financial incentive for states that newly adopt Medicaid expansion has made expansion more attractive for states. Under the American Rescue Plan Act states that newly adopt expansion are eligible for an additional 5 percentage point increase in the state’s traditional FMAP for two years, resulting in a temporary net fiscal benefit for these states. This fiscal incentive was key in moving expansion forward in North Carolina. KFF had estimated that Mississippi could realize a net fiscal benefit of $690 million over two years if expansion had been implemented in 2022; however, the fiscal incentive is available for two years whenever a state adopts expansion.

Provider organizations in the state, including the Mississippi State Medical Association and Mississippi Hospital Association, have been supporters of expansion. A KFF review of studies on the economic impact of Medicaid expansion on providers identified positive economic impacts for providers (particularly rural hospitals), in line with prior research.

FAQs on Prescription Drug Importation

Published: Mar 11, 2024

The high cost of prescription drugs continues to be a top health care priority for the public. Policymakers from both parties at the federal and state level have been pursuing a range of options to lower drug prices for Americans, one of which would allow for the safe importation of prescription drugs from Canada. This idea is based on data showing that people in the U.S. often pay more for medications than people in other countries.

On January 5, 2024, Florida became the first state to gain authorization from the Food and Drug Administration (FDA) to import certain prescription drugs from Canada. Florida’s plan is based on an approach developed under the Trump Administration and executed under the Biden Administration, following an executive order issued by President Biden in July 2021 directing the FDA to work with states to import prescription drugs from Canada. The idea of importing prescription drugs has bipartisan support among the general public (Figure 1), although there are long-standing concerns with this approach in terms of ensuring drug safety, and the idea is opposed by the Pharmaceutical Research and Manufacturers of America (PhRMA) and the Canadian government.

Majority of the Public Favors Allowing Americans to Buy Prescription Drugs Imported from Canada

Many studies have shown that people in the United States often pay more for their prescription drugs than in other developed countries, including Canada. One analysis of a broad range of drugs found that Canadian prices are 44% of those in the United States, and according to a KFF analysis, per capita spending on prescribed medicines was 42% higher in the United States than Canada. Canada’s drug prices are generally lower than those in the United States because the Canadian government has various mechanisms to lower the cost of prescription drugs.

The Inflation Reduction Act included many provisions that affected Medicare drug prices and out-of-pocket costs, but did not address drug prices for others, which has contributed to ongoing interest in adopting strategies, such as importation, to lower drug costs for other Americans.

These FAQs address questions related to prescription drug importation, including the current status of importation proposals, details of Florida’s importation program recently authorized by the FDA, and concerns and challenges with this approach.

1. How does the U.S. currently regulate the importation of prescription drugs from other countries?

Currently, the only type of legally imported FDA-approved drugs are those that are: 1) manufactured in foreign FDA-inspected facilities, intended for use by U.S. consumers, and imported into the U.S. by the drug manufacturer, and 2) those that are U.S.-approved and manufactured in the U.S., sent abroad, then imported back into the U.S. under rare circumstances such as for emergency medical purposes or in the case of product recalls.

Drug importation as part of efforts to lower drug prices in the U.S. takes a different form. In 2000, Congress enacted the Medicine Equity and Drug Safety (MEDS) Act, which added Section 804 to the FD&C Act, to allow pharmacists and wholesalers to import prescription drugs directly from certain industrialized countries, including Canada. The MEDS Act allows such importation only if the HHS Secretary certifies that the program: “poses no additional risk to the public’s health and safety,” and “results in a significant reduction in the cost of covered products to the American consumer.” The Medicare Modernization Act of 2003 (MMA) amended Section 804 by specifying that wholesalers and pharmacists can only import prescription drugs from Canada, not other industrialized countries. The MMA also requires the HHS Secretary to issue regulations that would grant waivers to individuals to import drugs for personal use under certain circumstances.

In September 2020, the Trump Administration issued a final rule that created a new pathway, called the Section 804 Importation Program (SIP) pathway, for states and other entities to import drugs from Canada. To comply with the statutory requirements related to health and safety and cost savings, then-HHS Secretary Alex Azar certified that importation of prescription drugs poses no risk to public health and safety and would result in significant cost savings to the American consumers.

2. How did Florida gain approval to import drugs from Canada and what requirements must be met before the plan can be implemented?

In January 2024, the FDA under President Biden granted its approval to Florida’s state plan to import certain prescription drugs from Canada for a period of two years, stating that it met the requirements that importation would provide savings to consumers without sacrificing health and safety. When submitting its SIP application for approval, Florida was required to specify: the drugs it seeks to import; the foreign seller in Canada that would purchase the drug directly from its manufacturer; the importer in the U.S. that would buy the drug directly from the foreign seller in Canada; the re-labeler or re-packager of the drug itself that would ensure the drug meets all labeling requirements in the U.S.; the qualifying lab that would conduct testing of the drug for authenticity and degradation; and steps that would be taken by the SIP to ensure the supply chain is secure.

Even with FDA approval, Florida will need to meet additional requirements before the plan can be implemented. For example, before Florida is permitted to import any drugs from Canada, it will need to submit a pre-import request to the FDA for each drug it seeks to import, and it can only import that drug if the FDA approves that request. The state of Florida will also be required to conduct quality testing of the drugs and ensure that drug labels meet FDA standards.

3. Which drugs can be imported by Florida and other states under the SIP importation pathway?

Under the SIP pathway, only drugs that are currently marketed in the U.S. are eligible for importation. In addition, in order for a drug to eligible, it must also be approved by the Health Canada’s Health Products and Food Branch (HPFB) and have appropriate labeling to be marketed in Canada.

As under current law, certain types of drugs are excluded from the definition of a prescription drug eligible for importation including: controlled substances, biological products (including insulin), infused drugs, intravenously injected drugs, and inhaled drugs during surgery. Furthermore, drugs that are subject to risk evaluation and mitigation strategies (REMS), which are high-risk products with serious safety concerns, such as opioids, are not eligible for importation.

Florida seeks to initially import 14 drugs that treat HIV/AIDS, mental illness, prostate cancer, and urea cycle disorder. In Florida, imported drugs will only be available for people receiving services through certain state agencies and government programs, including people covered under Medicaid, people served through county health departments, and others residing in certain state facilities. The program does not extend to people with other types of insurance, such as employer insurance, or the uninsured.

4. What are the estimated savings associated with Florida’s drug importation plan?

According to Florida’s January 5, 2024 press release, the state’s plan will save the state up to $183 million in the first year of implementation, and based on Florida’s October 20, 2023 estimate of cost savings, these savings will accrue to the state’s Medicaid program. Whether any Floridians will pay lower out-of-pocket costs on imported drugs, or how much they are likely to save, is unclear.

Neither the September 2020 final rule that created the SIP pathway nor the FDA’s full final regulatory impact analysis provided an estimate of the expected savings. The final regulatory analysis noted that responses by other stakeholders, such as Canadian regulatory agencies and drug manufacturers, could impact the potential benefits of this program.

5. What are other states doing to implement drug importation proposals?

Many states are considering legislation that would facilitate drug importation from Canada. Several states, including Colorado, Vermont, Maine, New Mexico, New Hampshire, North Dakota, and Texas have enacted laws to establish importation programs and are actively pursuing the importation of prescription drugs from Canada.

  • Colorado: In February 2024, Colorado submitted a revised version of its SIP to the FDA. In its proposal, Colorado notes that it has been having difficulty negotiating with drug manufacturers in Canada to allow exportation of their drugs to the U.S. and has been looking for more guidance from the FDA on how to address this issue. Colorado seeks to import 24 drugs to treat blood clots, cystic fibrosis, respiratory illnesses, cancer, type 2 diabetes, HIV/AIDS, psoriatic and rheumatoid arthritis. Of the drugs Colorado lists in its application, 4 overlap with those that are on Florida’s importation drug list.Colorado estimates the program will save $50.9 million in the first 3 years of implementation if all 24 eligible drugs are imported. Unlike the Florida analysis of savings, Colorado’s analysis assumes cost savings for individuals with commercial insurance, including employer-sponsored and individually purchased insurance. According to Colorado, Medicaid is not a targeted population because it “receives steep rebates for covered drugs, lower than what any importation program could provide,” and therefore, its estimates of savings do not include individuals covered by Medicaid, nor does it include Medicare or the uninsured. Colorado expects the nearly all of the savings (93.5%) will be passed onto consumers in the form of lower premiums though consumers will also see some savings in the form lower out-of-pocket expenses.
  • New Mexico: New Mexico submitted its SIP application in December 2020 for FDA approval and is still awaiting a response from the FDA.
  • New Hampshire: New Hampshire submitted a SIP proposal in August 2021, which was rejected by the FDA in November 2022 because the state had not identified a Foreign Seller nor provided other requested information. New Hampshire has not yet submitted a revised application.
  • Vermont: Vermont submitted a concept paper in November 2019, but it has not submitted a new importation proposal following the SIP pathway being finalized in September 2020.
  • Maine: Maine submitted an importation proposal in May 2020 for FDA approval, also prior to the SIP pathway being finalized, and has not submitted a new proposal.
  • North Dakota: North Dakota passed a bill in April 2021 that requires a study on the potential impacts of prescription drug importation.
  • Texas: In June 2023, Texas enacted legislation to establish an importation program and published a wholesale prescription drug importation report in December 2023 with research and recommendations to support implementation of the program. 

6. How does Canada view these importation programs?

When the SIP importation pathway was first proposed, the Government of Canada stated that it would be unable to meet the needs of the U.S. market without impacting access to medications for Canadians. The Canadian government also expressed concern that this policy would create drug shortages in Canada, and issued an order in November 2020 prohibiting the distribution of drugs that could cause or exacerbate a shortage. Therefore, it is possible that the Canadian government may impose barriers for importation to the U.S. Canadian law limits the sale of drugs outside of Canada that could create or worsen supply issues for Canadians. In response to the recent FDA action, Health Canada released a statement saying, “the Government of Canada is taking all necessary action to safeguard the drug supply and ensure Canadians have access to the prescription drugs they need” and added, “bulk importation will not provide an effective solution to the problem of high drug prices in the U.S.”

7. Under what circumstances can individuals legally import drugs from other countries, like Canada?

In most circumstances, it is illegal for individuals to import FDA-approved drugs from other countries for personal use. However, based on changes enacted by the MMA, personal importation of prescription drugs that have not been approved by the FDA for use in the U.S. is permitted on a case-by-case basis. Under this statutory authority, FDA has put out guidance that lays out certain circumstances where importation of non-FDA approved drugs for personal use might be allowed. For example, personal importation is generally allowed if the treatment is for a serious condition, there is no effective treatment available in the U.S., and there is no commercialization of the drug for U.S. residents. Typically, only a three-month supply is allowed, and individuals must confirm in writing that the drug is for personal use and provide information about the physician responsible for their treatment.

There appears to be little enforcement by the FDA of the ban against importing FDA-approved drugs for personal use. Even if the personal importation of a drug is technically illegal, current law directs the FDA to exercise discretion in permitting personal importation of drugs when the product is “clearly for personal use, and does not appear to present an unreasonable risk to the user,” which is reinforced in FDA guidelines.

Access to Adult Dental Care Gets Renewed Focus in ACA Marketplace Proposal

Published: Mar 8, 2024

Updated February 20, 2025, to correct the average deductible amount for standalone dental plans offered on the Marketplace in 2023.The 2023 KFF Consumer Survey of Consumer Experiences with Health Insurance finds cost barriers to adult dental care across coverage types. Conducted in February and March of 2023, the survey includes a nationally representative sample of 3,605 U.S. adults who have health insurance. This Policy Watch discusses a new proposal in the Health and Human Services (HHS) Benefit and Payment Parameters for 2025 that aims to expand access to adult dental care in Affordable Care Act (ACA) Marketplace plans.

Background

While dental coverage for children under the age of 18 is an essential health benefit (EHB) under the ACA statute, adult dental care is currently prohibited by agency regulation from being considered an EHB in individual and small group plans. As a result, it is excluded from the ACA’s major cost-sharing protections that apply to EHBs such as the ban on annual and lifetime dollar limits and maximum annual limits on out-of-pocket cost sharing for consumers and is not covered by premium subsidies. There are still coverage options for adults seeking dental care through the Marketplace, offered through stand-alone dental plans (SADPs) or embedded plans (medical plans that include dental coverage). Dental care is usually subject to a deductible, though the National Association of Dental Plans reports that many dental plans waive the deductible for preventive dental care such as cleanings or cover preventive care 100%. Dental coverage that is included in an embedded plan is generally subject to the medical deductible for the plan, which, on average, was $3,057 in 2024. This translates to greater consumer cost sharing before coverage of dental services begins. In contrast, the average deductible for standalone dental plans offered on the Marketplace in 2023 was $52 according to KFF analysis of the Health Insurance Exchange Plan Attributes Public Use Files, which includes all qualified and non-qualified stand-alone dental plans sold on- and off- the exchange.

The KFF Consumer Survey of Consumer Experiences with Health Insurance finds that consumers who reported having insurance coverage at the time of the survey tend to avoid seeking dental care if the out-of-pocket costs are high. Across coverage types, at least one in four adults with health insurance report cost barriers to accessing dental care in the past year, including about four in ten of those with Medicaid (39%) and Marketplace coverage (37%) and a quarter of those with ESI (25%) and Medicare (26%) (Figure 1).

37% of Marketplace Enrollees Reported Delaying or Forgoing Dental Care Due To Cost Barriers

Delaying needed dental care could lead to more serious health problems down the road. Poor dental health is associated with chronic diseases such as diabetes, heart disease, and oral cancer, and could also lead to additional burdens on the healthcare system as patients seek care elsewhere.

The HHS Benefit and Payment Parameters Notice for 2025 proposes to remove the prohibition on the classification of routine adult dental health coverage as an EHB. Under this proposed rule, states would have the option of classifying adult dental care as an EHB. If a state chose to classify adult dental health as an EHB, the state (or the federal government as a fallback) would be required to enforce the same ACA protections for adult dental coverage that apply to other EHBs. They would also have the option of applying additional protections for adult dental coverage offered as an EHB that goes beyond the federal requirements for EHBs.

What Are the Key Issues to Watch?

Embedded deductibles might not provide consumers with financial protection for dental care. One issue raised in comment letters for the 2025 Payment Notice is that consumers who receive dental care through embedded dental coverage may have to meet the medical deductible before coverage of dental services can begin. If a state chooses to offer adult dental care as an EHB, medical plans would be required to cover it, and the medical deductible could apply. Deductibles under medical plans can be thousands of dollars, which may deter consumers from seeking dental care, especially people with lower incomes.

Classifying adult dental care as an EHB could come at an increased cost to the federal government and health issuers. CMS stated in the proposed rule that it does not anticipate any immediate costs as a result of giving states the option to include adult dental care as an EHB. However, it is possible that application of advanced premium tax credits towards dental care could raise costs for the federal government. Additionally, cost sharing provisions that apply to EHBs, such as the ban on annual and lifetime coverage limits and the maximum annual out of pocket limit, could increase costs for health plan issuers since they could no longer apply these restrictions on dental care.

The new provision could affect employer-sponsored plans. Small employer plans, like those in the individual market, are required to cover EHBs. While large employer plans do not have to meet EHB rules, federal regulations require that these plans choose a state benchmark in order to comply with the ACA’s prohibition on annual and lifetime dollar limits. CMS pointed out in the proposed Payment Notice that if a self-insured or fully-insured large employer plan selects a state benchmark plan that includes adult dental care as an EHB, they would be required to abide by the cost-sharing requirements that apply to other EHBs. Employer plans that offered dental plans separately as “excepted benefits” (which are not subject to ACA requirements for comprehensive medical insurance), however, would presumably not be required to abide by these requirements.

Consumers could be subject to cost-sharing for preventive dental services. The ACA requires most private health plans to cover, without cost sharing, preventive health services rated as an A or B in the United States Preventive Service Task Force recommendations; however, no adult dental services have received this A or B rating. Consumers could be subject to cost sharing for routine preventive dental services or be required to meet the deductible before coverage of preventive services began, although as stated above, many private health plans already cover preventive health services such as cleanings before the deductible.

Looking Forward

The ACA’s EHB requirements seek to ensure consumers in the individual and small group markets have comprehensive coverage that meets vital health needs. The law requires the Secretary of HHS to define EHB that covers at least 10 general categories of benefits and has a scope equal to those “under a typical employer plan.” According to the 2023 KFF Employer Health Benefits Survey, 90% of small firms and 94% of large firms offer dental insurance programs to their employees. If the proposed 2025 Payment Rule is finalized as proposed, this will allow states to choose to include adult dental care as a required benefit in state-regulated health plans. This could enhance efforts to increase access to dental care, especially for lower income adults who are particularly susceptible to having unmet dental health needs. In addition, KFF research shows that dental costs are a contributor to medical debt. CMS and states may evaluate the most appropriate ways to structure an adult dental benefit that provides financial protections to avoid debt for common basic care, balanced by potential increases in federal costs.

This work was supported in part by a grant from the Robert Wood Johnson Foundation. The views and analysis contained here do not necessarily reflect the views of the Foundation. KFF maintains full editorial control over all of its policy analysis, polling, and journalism activities.

Poll Finding

KFF Health Tracking Poll March 2024: Abortion in the 2024 Election and Beyond

Published: Mar 7, 2024

Findings

Key Takeaways

  • Voters who say abortion is the most important issue to their vote are disproportionately younger, Democratic-leaning, and want abortion to be legal in all cases. In the two years post Dobbs, there seems to be a new generation of abortion voters largely made up of those who want abortion to be legal in all cases. Voters who say abortion is the “most important issue” in their 2024 vote (12% of all voters) are disproportionately made up of Black voters, Democratic voters, women voters, and the youngest voting bloc – voters ages 18 to 29.
  • Many voters, especially Democrats, see the 2024 election as a high-stakes election for determining the future of access to abortion and contraception. Half of voters say they think the elections for president, Congress, and state legislatures will have a “major impact” on access to abortion, rising to two-thirds of Democratic voters and seven in ten voters who say abortion is their most important voting issue. About four in ten voters overall say the same about the perceived impact of the elections on access to contraception, though there are stark partisan divides on this outlook. At least half of Democratic voters say they think the elections will have a “major impact” on access to contraception, whereas three in ten or fewer Republican voters say the same.
  • Less than half of adults say the right to use contraception is a “secure right.” Following the Dobbs decision, uncertainty around people’s ability to access contraception emerged, while the recent Alabama Supreme Court ruling on IVF further ignited public debate on the impact of abortion bans on access to other health services. Less than half of adults (45%) say they consider the right to contraception a “secure right likely to remain in place,” about one in five (21%) adults consider the right to use contraception a threatened right likely to be overturned, and an additional third (34%) are “not sure” if the right is threatened or secure. Views on this topic diverge widely by partisanship, with Democrats nearly four times more likely to say they view the right to use contraception as threatened than are Republicans (38% vs. 10%).
  • There is broad support, even among partisans, for protecting access to abortions for patients who are experiencing pregnancy-related emergencies and protecting patients’ right to travel to access abortions, but partisans disagree on other policy proposals such as whether there should be a federal right to abortion or a nationwide 16-week abortion ban. Two-thirds of the public, including majorities of Democrats (86%) and independents (67%), support a law guaranteeing a federal right to abortion. Yet, this is opposed by nearly six in ten Republicans (57%). In addition, while among the public overall about six in ten (58%) oppose a 16-week abortion ban, a majority of Republicans (63%) adults support this proposal, while most Democrats (75%) and independents (59%) oppose it.
  • The group most impacted by reproductive health policy in this country – women ages 18 to 49 – see the upcoming election as a pivotal moment and largely support laws protecting access to abortions. One in six (16%) women of reproductive age (18-49) say abortion is the most important issue in their 2024 vote and about half say the 2024 elections will have a “major impact” on abortion access in the country and their own state. Women of reproductive age overwhelmingly say decisions about abortions should be made by a woman, in consultation with her doctor (86%), two-thirds (65%) want the federal government to pass laws to protect abortion nationwide, and at least two thirds support laws protecting access to abortions for patients experiencing pregnancy-related emergencies (88%), protecting a patient’s right to travel to get an abortion (79%), and guaranteeing a federal right to abortion (76%).
  • Reflecting strong Trump support, Republicans trust former President Trump on abortion policy, regardless of their own views on the issue. While 85% of Republican voters who want abortion to be illegal in all or most cases say they trust former President Trump more than President Biden on the issue of abortion, half of Republican voters who want abortion to be legal in all or most cases also say they trust Trump more than Biden on this issue, suggesting that former President Trump is able to connect with many Republican voters regardless of their own views on abortion, including many of those who are more supportive of abortion access. This may be largely because few (4%) of Republicans who want abortion to be legal see abortion as the most important issue to their vote.
  • Democrats and Republicans hold very different views on how they see the issue of abortion. The large partisan disagreement on proposals aimed at legislating abortion access may be driven by how differently Democrats and Republicans view the issue. Democrats overwhelmingly view the issue of abortion as an issue of individual rights and freedom (96%) as well as a health care issue (82%). Republicans, on the other hand, are more likely to view it as a moral issue (81%) and more than half (55%) of Republicans also say it is a religious issue.
  • About two-thirds of the public have not heard anything about an upcoming Supreme Court case that may impact if and how patients can access mifepristone (medication abortion). In addition, many adults are at least somewhat confused by the abortion laws in their state and uncertain about the legality and use of mifepristone. 

How Voters See Abortion as a Voting Issue

With former President Trump and President Biden now the presumptive presidential nominees for both parties, the focus of voters has shifted from the presidential primaries to the 2024 general election and how the candidates’ positions on key voting issues could impact voters’ decisions. Last month’s KFF Health Tracking Poll showed that partisans supported their own candidates when it came to two key health care issues: affordability and the ACA. This month’s poll explores voters’ preferences on another key voting issue: abortion.

Abortion Voters Are More Likely to be Women Voters, Black Voters, Younger Voters, and Democratic Voters

With many issues competing for voters’ attention during this election cycle, one in eight voters (12%) say abortion is the “most important issue” to their vote in the 2024 election while half of voters (52%) say it is a “very important issue but not the most important.” About one in three voters say either abortion is “somewhat important” (22%) or “not an important issue” (14%) to their 2024 vote.

The share saying abortion is the “most important issue” includes 16% of all women voters and rises to more than one in four Black women voters (28%), and about one in five in other key voting groups of women including Democratic women (22%), women who currently live in states where abortion is banned1  (19%), women voters who say they plan to vote for President Biden (19%), and women of reproductive age (ages 18 to 49) (17%). At least two-thirds of each of these groups say they think abortion should be legal in all or most cases.

Prior to the Supreme Court decision overturning Roe v. Wade, pro-life proponents and Republicans were the voters most likely to identify as “single issue abortion voters.” In fact, twenty years ago pro-life adults were nearly three times as likely as pro-choice adults to describe themselves as single-issue voters on abortion. And in 2020, prior to the 2022 Dobbs decision, a larger share of pro-life voters than pro-choice voters said abortion was important to their vote.

Yet, post Dobbs, there seems to be a new generation of abortion voters. These voters are largely made up of those who want abortion to be “legal in all cases.” They also are disproportionately made up of Black voters, Democratic voters, women voters, and the youngest voting bloc – voters ages 18 to 29. In contrast, about one in three voters who say abortion is the most important issue to their vote think abortion should be “illegal in all or most cases.”

Single Issue Abortion Voters Lean Left and Want Abortion to Be Legal

Reflecting their Democratic leaning, about half of abortion voters say if the 2024 presidential election was held today, they would vote for Democrat Joe Biden (48%) while one in four (26%) say they would vote for Republican Donald Trump. A quarter of these voters say they would either vote for some other candidate (16%) or they wouldn’t vote (9%). This group also went for President Biden over President Trump in the 2020 election by a nearly two to one margin (50% v. 27%). About one in five in this group say they didn’t vote in the 2020 presidential election.

Slightly less than half of abortion voters (45%) say they are “more motivated” to vote in this presidential election compared to previous ones while about a quarter (23%) say they are “less motivated” to vote. Similarly, overall, 44% of voters say they are more motivated to vote in this year’s presidential election.

While abortion may not be a top voting issue for independent voters or Republican voters, the issue may move small numbers within these groups to vote for President Biden – which could matter in tight races. While just five percent of independent voters identify abortion as their most important issue and say if the election was held today, they would vote for Biden, overall one-third of independent voters want abortion to be legal and plan on supporting Biden. Among Republicans, less than 1% identify abortion as their most important issue and plan on crossing the political aisle to vote for Biden, but overall 3% of Republicans want abortion to be legal and say that if the election was held today, they would vote for President Biden.

Partisan Voters Trust Their Own Party More on Abortion Policy, But Significant Shares Say They Trust Neither Party nor Either Presidential Candidate

While voters overall are split largely by their partisan identification in who they are planning on supporting in the upcoming presidential election, President Biden has an advantage over former President Trump on who voters trust more to move abortion policy in the right direction. Four in ten voters (38%) say they trust Biden, compared to three in ten (29%) who say they trust Trump. A notable share of voters say either that they don’t trust either candidate to move abortion policy in the right direction (21% of voters) or that they are unsure (11%).

Partisans largely say they trust their own party’s candidate on abortion. Eight in ten (79%) Democratic voters say they trust President Biden, and seven in ten (70%) Republicans say they trust former President Trump. Independent voters give President Biden the advantage on the issue of abortion with a third saying they trust him on this issue (35%) compared to 19% who say they trust former President Trump. However, one in three independent voters (31%) say they don’t trust either candidate on this issue as do more than one in ten Democratic voters (12%) and one in six Republican voters (17%).

The same trends emerge when examining which political party voters trust more on abortion policy. The Democratic Party overall garners more trust among voters on abortion policy than the Republican Party (41% vs. 27%) – but still don’t have a majority of voters’ trust. And while each party garners majority support from their own partisan voters and the Democratic Party has a more than two to one advantage among independent voters (38% v. 15%), a significant share of independent voters (39%) say they trust neither party. One in four (24%) Republican voters say they trust neither party on the issue of abortion, which is more than twice the share of Democratic voters who say the same (10%).

President Biden and Democratic Party Have Advantage on Abortion Policy, Yet Notably Some Say They Don't Trust Either Candidate or Party on This Issue

Women voters overall say they trust both the Democratic Party and President Joe Biden more on abortion policy in this country, but trust varies depending on partisanship and age. In fact, neither candidate nor party garners majority of support from women of reproductive age.

Most Republican women voters trust former President Trump and the Republican Party to move abortion policy in the right direction, but one in five say they don’t trust either candidate or they don’t trust either party. On the other side of the political aisle, at least three-fourths of Democratic women voters say they trust President Biden and the Democratic Party more on abortion policy and about one in seven say they don’t trust either candidate or political party.

Independent women voters are more than twice as likely to say they trust Biden (35%) than Trump (16%) to move abortion policy in the right direction. Similarly, a larger share of independent women voters give the Democratic Party an advantage over the Republican Party (33% v. 10%), but neither candidate nor party gets a majority of independent voters saying they trust them more on this issue. In addition, about a third of independent women voters say they trust neither candidate (32%) and four in ten say they trust neither party (42%) on this issue. This suggests at least some independent women voters may be looking for different leadership from the political parties and the party’s candidates for president on this key issue.

Women Voters Trust Democratic Party and Biden More on Abortion Policy, Especially Democratic Women; Yet Many Independent Women Don’t Trust Either Candidate or Party

About four in ten Republican voters (43%) say they think abortion should be legal in all or most cases. Among this group of voters, half (52%) say they trust the Republican Party more on the issue of abortion, 8% say they trust the Democratic Party, and one in three (33%) say they don’t trust either political party on this issue.

Similarly, half of these Republican voters (those who want abortion to be legal) say they trust former President Trump more to move abortion policy in the right direction, while 9% say they trust President Biden, and more than a quarter (28%) say they don’t trust either candidate. Among Republicans who say abortion should be illegal in all or most cases, both former President Trump and the Republican Party garner majorities of trust on this issue (85% and 80%, respectively). Republicans who say abortion should be illegal are more likely to be single-issue abortion voters (14%, 8% of total Republican voters) than those who say abortion should be legal (4%, 2% of total Republican voters).

Republican voters, regardless of their views on whether abortion should be legal or illegal, are divided in former President Trump’s role in the overturning of Roe v. Wade – though leaning in slightly different directions. While former President Trump has taken credit for the 2022 Dobbs decision in past speeches because he had appointed three conservative judges which led to the ruling, a majority of Republican voters who want abortion to be legal (56%) say Trump had “just a little” or “no responsibility” in the overturning of Roe v. Wade. On the other hand, more than half of Republican voters who want abortion to be illegal (54%) say he has at least some responsibility.

Overall, two-thirds of voters (65%) say former President Trump had at least some responsibility for the overturning of Roe v. Wade, but this is largely driven by the views of Democrats (83%) and independents (64%).

While Democrats Hold Former President Trump Responsible for Overturning Roe, Many Republicans Say He Had a Limited Role
Half Of Voters Say The Elections This Fall Will Have A “Major Impact” On Access To Abortion

Large shares of the public say they think the elections this fall will impact access to abortion both in this country and in their own states. At least half of voters overall say this year’s elections for president (51%), Congress (53%), as well as which party controls their state legislature (55%) will have a “major impact” on access to abortion in the U.S. and their state, respectively. At least seven in ten single-issue abortion voters say each of these elections will have a “major impact” on abortion access in the U.S. or their state.

Other than single-issue abortion voters, Democratic voters are the most likely to say the elections will matter, with at least two-thirds saying they think the elections will have a “major impact” on abortion access in the U.S. and their state. About four in ten Republican voters say the same when considering the presidential (41%) and Congressional (41%) elections, rising to about half (52%) who say which political party controls the legislature in their state will have a “major impact” on access to abortion in their state. The views of women voters by partisanship largely mirror the patterns on these questions among partisans overall.

At Least Half of Voters Say the Elections For President, Congress, and Which Party Controls Their State Legislature Will Have A Major Impact on Abortion Access

One In Five Adults Consider the Right to Use Contraception Threatened, And Most Democratic Voters Say the Upcoming Election Will Have a Major Impact on Access to Contraception

Following the Dobbs decision and Justice Clarence Thomas’ concurrence opinion which questioned the basis for a prior Supreme Court case granting the right to contraception, many predicted that contraception access also could be affected. The recent Alabama Supreme Court ruling that frozen embryos can be considered children further ignited public debate on the impact of abortion bans on access to other health services.

Just under half (45%) of adults say they consider the right to use contraception “a secure right likely to remain in place,” while one in five (21%) say they consider the right to use contraception “a threatened right likely to be overturned.” A third (34%) are “not sure” if the right to use contraception is threatened or secured.

Partisans are split, with Democrats more likely to see the right to contraception as threatened, while Republicans see it more as a secure right. About four in ten Democrats (38%) – including four in ten (41%) Democratic women – consider the right to contraception threatened, whereas about six in ten Republicans (57%) – including six in ten Republican women (61%) – say they consider contraception access secure. At least three in ten across partisans say they are not sure about the future of the right to contraception. Similar shares of women of reproductive age (18 to 49) and women ages 50 and older consider the right to use contraception secure, with about four in ten saying so.

One in Five Adults Consider the Right to Use Contraception to Be Under Threat; Larger Shares of Democrats—Including Democratic Women—Say the Same

When asked specifically about how the elections this fall may impact access to contraception in the U.S., about four in ten voters overall say the elections for president (37%), Congress (39%), and which party controls the legislature in their state (43%) will have a “major impact.” About half or more of single-issue abortion voters say the presidential election (53%), Congressional election (59%) or which party controls the legislature in their state (54%) will have a “major impact” on access to contraception. And majorities of Democratic voters say they think the three elections will have a “major impact” on access to contraception, whereas three in ten or fewer Republican voters say the same.

Most Democrats Think Elections This Fall Will Have a Major Impact on Access to Contraception

Majorities Say Abortion Decisions Should Be Made by Women and Their Health Care Providers

The public overwhelmingly thinks decisions about abortions should be made by women in consultation with their health care providers (80%), while 19% say lawmakers should make decisions about when abortions should be available and under what conditions. The share who say the decision-making should fall to women remains unchanged since the Dobbs decision and includes large majorities of Democrats (94%) and independents (81%), and most Republicans (62%).

Nearly nine in ten (86%) women between the ages of 18 and 49 say decisions about abortion should be made by women and their health care providers, as do almost all Democratic women (94%), eight in ten independent women (83%), and seven in ten Republican women (70%).

Majorities Across Parties Say Women and Doctors Should Make Decisions About Abortions Rather Than Lawmakers; Women of Reproductive Age Agree

While most of the public doesn’t think lawmakers should decide when abortions should be available, many states are passing laws regulating abortion access and there has been public debate about whether the federal government should take action on this issue. Overall, a majority of the public (55%) say they would rather see the federal government pass laws to protect abortion access nationwide, while a quarter (25%) say they want to see the federal government take no action, and a fifth (19%) want the federal government to pass laws prohibiting abortions.

Three in four Democrats (77%) say they would rather see the federal government pass laws to protect abortion access, as do six in ten (58%) independents. Republicans, on the other hand, are divided between wanting the federal government to pass laws prohibiting abortions nationwide (36%) and wanting the federal government to not act on this issue (37%). About a quarter (26%) of Republicans want the government to pass laws to protect abortion nationwide.

Women of reproductive age want the federal government to pass laws to protect abortion nationwide (65%), as do large majorities of Democratic women (79%) and independent women (64%). Republican women are more divided with similar shares wanting the government to pass laws prohibiting abortion (35%), take no action (34%), and pass laws to protect abortion (30%).

Most Would Rather Federal Government Pass Laws to Protect Abortion Access; Republicans Are Split Between Wanting to Prohibit Access and No Federal Action

In states where abortion is either banned or limited, half of adults (52%) say they would rather see the federal government pass laws to protect abortion nationwide including three-fourths (74%) of Democratic and Democratic-leaning women living in those states. Republican and Republican-leaning women living in states where abortion is banned or limited are divided with similar shares who say they want the federal government to pass laws prohibiting abortion nationwide (40%) as say they want laws protecting abortion nationwide (35%).

Majorities of Adults—Including Those in States Where Abortion is Legal and Those Who Believe Abortion Should Be Legal—Want the Federal Government to Protect Abortion Nationwide

Overall, a majority of the public supports protecting access to abortions for patients who are experiencing pregnancy-related emergencies, such as miscarriages (86%), protecting a patient’s right to travel in order to get an abortion (79%), and protecting doctors who perform abortions from receiving fines or facing prison time (67%). Two-thirds of the public also support a law guaranteeing a federal right to abortion. Less than half (42%) of the public support a law establishing a 16-week ban on abortion.

In addition, most of the public opposes many of the policies anti-abortion groups are advocating for aimed at restricting or banning medication abortion such as making it a crime for health care provider to mail medication abortion to patients living in states where abortions are banned (62%) or banning the use of medication abortion nationwide (66%). Most of the public (61%) also opposes policies that prohibit clinics that receive federal funds from providing abortions or referring patients to abortion providers.

The group that stands to be impacted most by these proposals, women of reproductive age (18-49), also support protecting access to abortion including opposing laws restricting access to medication abortion. Three-fourths (76%) of women between the ages of 18 and 49 support laws guaranteeing a federal right to abortion while four in ten (38%) support a 16-week abortion ban.

Majorities of Adults, Including Women Ages 18-49, Support Laws Protecting Patients' Rights to Access Abortions in Emergencies, Travel for Abortion Care

There is consensus support across partisans for some reproductive health proposals such as protecting access to abortions for patients who are experiencing miscarriages, protecting a patient’s right to travel in order to get an abortion, and protecting doctors who perform abortions from receiving fines or facing prison time. But support for other proposals, including both a federal right to abortion and a 16-week abortion ban, vary widely depending on partisanship.

While majorities of Democrats (86%) and independents (67%) adults support a law guaranteeing a federal right to abortion, this is opposed by nearly six in ten Republicans (57%). In addition, while a majority of Republicans (63%) support a federal 16-week abortion ban, a policy that former President Trump has quietly supported in recent weeks, a majority of Democrats (75%) and independents (59%) oppose this proposal.

Most, Across Partisans, Support Some Abortion Protections Including Protecting Abortion Access for Pregnancy-Related Emergencies; Republicans Are More Likely to Support a 16-Week Abortion Ban

The large partisan disagreement on proposals aimed at legislating abortion access may be driven by how differently Democrats and Republicans view the issue. Democrats overwhelmingly view the issue of abortion as an issue of individual rights and freedom (96%) as well as a health care issue (82%). Republicans, on the other hand, are more likely to view it as a moral issue (81%) and more than half (55%) of Republicans also say it is a religious issue.

Democrats and Independents Overwhelmingly Think Abortion Is an Issue of Individual Rights and Freedoms; Eight in Ten Republicans Say It's a Moral Issue

Knowledge, Use, and Legality of Mifepristone

Since the overturning of Roe, medication abortion has been the focus of policy debates at the state and federal level, yet there is extensive uncertainty on whether medication abortion is legal or illegal, given that its legality depends on state laws.

Overall, more than one in three (36%) adults say they understand the abortion laws in their state less than “somewhat well,” including one-third (32%) of women of reproductive age (ages 18 to 49). And while a slim majority (54%) of the public has heard of mifepristone, the medication abortion pill, the legality and use of the medication continues to be misunderstood across the public.

About four in ten women (43%) are “unsure” whether medication abortion is legal in the state they live in, including 38% of women ages 18-49. Nationally, at least four in ten U.S. adults say they are not sure whether the medication is legal where they live regardless of whether they live in a state where abortion is limited (54% say they are unsure), banned (44%), or available (41%). In addition, about one in eight adults (13%), including a similar share (11%) of women, living in states where abortion is currently banned, incorrectly believe medication abortion is legal in their state.

Women without a college degree are more likely to say they are “unsure” about the legality of medication abortion in their state, with half (50%) of women without a college degree saying they are unsure, compared to about one in three (32%) of women with a college degree.

Adults Are Confused About The Legality of Medication Abortion, Especially in States Where Abortion is Limited or Banned

In addition to confusion around state abortion laws and whether mifepristone is legal or not, there is also a general lack of understanding of what the pill is used for. About one in five (19%) adults correctly say that mifepristone can be used to treat a miscarriage, while about one in ten (8%) incorrectly say it cannot be used for this purpose and about three in four (73%) are “unsure” whether mifepristone can also be used to treat a miscarriage or not. Across gender, age, and education, at least six in ten adults say they are “unsure” about whether mifepristone can also be used to treat a miscarriage. However, women with a college degree (34%) and women of reproductive age (29%) are the groups most likely to be aware that mifepristone can also be used to treat a miscarriage.

Three Quarters of the Public Is Unaware Mifepristone Can Also Be Used to Treat a Miscarriage

Most of the public is unaware that few abortions occur after 20 weeks of pregnancy

There is also widespread misunderstanding about when most abortions occur. Public debate continues to circulate around so-called “late-term” abortions, which typically refer to abortions obtained at or after 21 weeks. The latest KFF Health Tracking Poll finds that two-thirds (67%) of adults are unaware that less than 5% of abortions occur more than 20 weeks into a pregnancy, while one-third of adults (32%) correctly say that five percent or fewer abortions occur before this point. Indeed, abortions at or after 21 weeks are uncommon and represent 1% of all abortions in the U.S. And, despite claims of abortions occurring “moments before birth” or “after birth,” scenarios like these do not occur nor are they legal in the United States.

Similar majorities of adults across age and gender are unaware of this statistic. However, women who are college graduates are more likely to correctly say less than five percent of abortions occur after 20 weeks than are women with lower levels of education (45% vs. 26%).

Majorities of Adults, Across Age and Gender, Are Unaware Fewer Than 5% of Abortions Occur More Than 20 Weeks into a Pregnancy

Two-thirds of the public has not heard about the upcoming Supreme Court case challenging mifepristone use

Currently, FDA policy allows mifepristone pills to be prescribed via telehealth, mailed to patients, and dispensed at in-person pharmacies. However, this policy update is currently being legally challenged by anti-abortion groups. On March 26, 2024 the Supreme Court is set to hear oral arguments challenging the safety and the conditions in which the Mifepristone can be dispensed which may impact if and how patients can access the drug, including in states where abortion is currently available. About two-thirds (64%) of adults have not heard anything in the news regarding this court case, while 18% have heard “just a little,” 15% have heard “some” and few (4%) have heard “a lot.” About six in ten (59%) women under the age of 50 living in states where abortion is currently available, a group that could also be affected if the court rules to restore limits on dispensing mifepristone, are unaware of the case.

Most of The Public is Unaware of Upcoming Supreme Court Case About The Safety and Dispensing of Mifepristone, Including Women of Reproductive Age in States Where Abortion is Currently Available

Methodology

This KFF Health Tracking Poll was designed and analyzed by public opinion researchers at KFF. The survey was conducted February 20-28,2024, online and by telephone among a nationally representative sample of 1,316 U.S. adults in English (1,226) and in Spanish (90). The sample includes 1,036 adults (n=51 in Spanish) reached through the SSRS Opinion Panel either online (n=1,011) or over the phone (n=25). The SSRS Opinion Panel is a nationally representative probability-based panel where panel members are recruited randomly in one of two ways: (a) Through invitations mailed to respondents randomly sampled from an Address-Based Sample (ABS) provided by Marketing Systems Groups (MSG) through the U.S. Postal Service’s Computerized Delivery Sequence (CDS); (b) from a dual-frame random digit dial (RDD) sample provided by MSG. For the online panel component, invitations were sent to panel members by email followed by up to three reminder emails.

Another 280 (n=39 in Spanish) interviews were conducted from a random digit dial telephone sample of prepaid cell phone numbers obtained through MSG. Phone numbers used for the prepaid cell phone component were randomly generated from a cell phone sampling frame with disproportionate stratification aimed at reaching Hispanic and non-Hispanic Black respondents. Stratification was based on incidence of the race/ethnicity groups within each frame.

Respondents in the phone samples received a $15 incentive via a check received by mail, and web respondents received a $5 electronic gift card incentive (some harder-to-reach groups received a $10 electronic gift card). In order to ensure data quality, cases were removed if they failed two or more quality checks: (1) attention check questions in the online version of the questionnaire, (2) had over 30% item non-response, or (3) had a length less than one quarter of the mean length by mode. Based on this criterion, no cases were removed.

The combined cell phone and panel samples were weighted to match the sample’s demographics to the national U.S. adult population using data from the Census Bureau’s 2023 Current Population Survey (CPS), September 2021 Volunteering and Civic Life Supplement data from the CPS, and the 2023 KFF Benchmarking survey with ABS and prepaid cell phone samples. The demographic variables included in weighting for the general population sample are sex, age, education, race/ethnicity, region, civic engagement, frequency of internet use, political party identification by race/ethnicity, and education. The sample of registered voters was weighted separately to match the U.S. registered voter population using parameters above plus recalled vote in the 2020 presidential election by county quintiles grouped by Trump vote share. Both weights account for differences in the probability of selection for each sample type (prepaid cell phone and panel). This includes adjustment for the sample design and geographic stratification of the cell phone sample, within household probability of selection, and the design of the panel-recruitment procedure.

The margin of sampling error including the design effect for the full sample is plus or minus 3 percentage points and for registered voters is plus or minus 4 percentage points. Numbers of respondents and margins of sampling error for key subgroups are shown in the table below. For results based on other subgroups, the margin of sampling error may be higher. Sample sizes and margins of sampling error for other subgroups are available by request. Sampling error is only one of many potential sources of error and there may be other unmeasured error in this or any other public opinion poll. KFF public opinion and survey research is a charter member of the Transparency Initiative of the American Association for Public Opinion Research.

GroupN (unweighted)M.O.S.E.
Total1,316± 3 percentage points
Total Registered Voters1,072± 4 percentage points
Republican Registered Voters368± 6 percentage points
Democratic Registered Voters353± 7 percentage points
Independent Registered Voters256± 8 percentage points
 
Women voters ages 18-49277± 8 percentage points

Endnotes

  1. Click here to see a map of states where abortion is banned, limited, or available. ↩︎
News Release

1 in 8 Voters Say Abortion Is Most Important to Their Vote: They Lean Democratic, Support Biden, and Want Abortion to Be Legal

Most of the Public Opposes a 16-Week Ban on Abortion, Though Most Republicans Favor It; Majorities Across Party Lines Support Abortion for Pregnancy-Related Emergencies

Published: Mar 7, 2024

About 1 in 8 voters (12%) now say that abortion is the most important issue for their vote in the 2024 elections, highlighting how the issue could motivate groups of voters who largely say abortion should be legal in all or most cases, a new KFF Health Tracking Poll finds.

The issue resonates with certain key groups of women voters. More than 1 in 4 Black women voters (28%), and about a fifth of Democratic women (22%), women who live in states where abortion is banned (19%), women voters who plan to vote for President Biden (19%), and women of reproductive age (18-49) (17%) identify as abortion voters.

Overall, the majority of abortion voters say abortion should be legal in all or most cases. This is a significant shift from elections prior to the Supreme Court’s decision to overturn Roe v. Wade, when abortion voters were largely those who identified as pro-life.

About half (48%) of this election’s abortion voters say that they would vote for President Biden if the election were held today, nearly double the share (26%) who say that they would vote for former President Trump. This group says they voted for Biden over Trump by a similar margin in 2020, though about 1 in 5 say they did not vote in that election.

At the same time, 43% of Republicans overall say abortion should be legal in all or most cases, but few Republicans who want abortion to be legal seem ready to buck their party over the abortion issue. In tight races, however, even small shifts could become important. Republicans who say abortion should be illegal are more likely to be abortion voters (14%, or 8% of all Republican voters) than those who say abortion should be legal (4%, or 2% of all Republican voters).

Partisans largely trust their own party and their own party’s presumptive nominee more on the issue of abortion. Larger shares of independent voters trust the Democratic Party (38%) and President Biden (35%) than the Republican Party (15%) and former President Trump (19%), though a significant share of independent voters say they don’t trust either party (39%) or candidate (31%) on this issue. 

About half of voters overall say this year’s presidential election (51%), Congressional election (53%), and which party controls their state legislature (55%) will have a “major impact” on access to abortion. The shares who say it will have a major impact rises to at least two-thirds among abortion voters and Democratic voters.

Majorities, Including Most Women of Reproductive Age, Favor Policies to Protect Abortion Access and Oppose Policies that Could Restrict It

The poll also gauges the public’s support for specific abortion policies, including a national 16-week abortion ban that media reports suggest Trump is considering for his platform.

Most of the public (58%), including most women under age 50 (61%), oppose a national 16-week abortion ban, though most Republicans (63%) would favor it.

On other policy changes, the poll finds the public overall – and most Democrats – largely supportive of policies protecting access to abortion. Examples include:

  • Adults (86%) overwhelmingly say they support protecting access to abortion for patients experiencing pregnancy-related emergencies, such as miscarriages. This includes large majorities of Democrats, independents, and Republicans.
  • Two thirds (66%) support guaranteeing a federal right to an abortion, including three quarters (76%) of women under age 50. Large majorities of Democrats (86%) and independents (67%), and a sizeable minority of Republicans (43%), support such a guarantee.
  • Most of the public opposes several policies advocated by abortion opponents, such as making it a crime for health care providers to mail abortion pills to patients in states where abortion is prohibited (62% oppose) and policies that prohibit clinics that receive federal funds from providing abortions or referring patients to abortion providers (61% oppose). Narrow majorities of Republicans support each of those policies.

The public’s views on specific policies likely reflect their broader views of abortion. When asked how they think about abortion, most of the public says it is an issue of individual rights and freedoms (81%), a health care issue (68%), and a moral issue (62%). This includes at least half of Democrats, independents, and Republicans. Fewer see it as a religious issue (41%), though most Republicans (55%) do.

Other poll findings include:

  • Former President Trump has taken credit for the Supreme Court’s decision to overturn Roe v. Wade, as the three justices he appointed to the court joined that decision. About two thirds of voters (65%) say he had at least some responsibility for the decision, including half of Republican voters.
  • On March 26, the Supreme Court will hear arguments in a case that could affect access to mifepristone, a drug used for medication abortion that can currently be prescribed via telehealth and mailed to patients. About two thirds (64%) of the public has not heard anything about the case.
  • In the wake of the Supreme Court’s decision to end the constitutional right to abortion, just under half (45%) of adults say they consider the right to use contraception as “secure,” while one in five (21%) say it is “a threatened right likely to be overturned,” and a third (34%) say they are not sure whether the right is threatened or secure. Among partisans, Democrats are most likely to see the right to contraception as threatened (38%).

Designed and analyzed by public opinion researchers at KFF, the survey was conducted from February 20-28, 2024, online and by telephone among a nationally representative sample of 1,316 U.S. adults, including 1,072 registered voters. Interviews were conducted in English and in Spanish. The margin of sampling error is plus or minus 3 percentage points for the full sample and 4 percentage points for the sample of registered voters. For results based on other subgroups, the margin of sampling error may be higher.

Charges for Emails with Doctors and other Healthcare Providers

Authors: Justin Lo, Krutika Amin, and Cynthia Cox
Published: Mar 6, 2024

Patient-provider email messaging accelerated early in the COVID-19 pandemic as more patients sought medical care remotely, and the addition of billing codes for digital health services and subsequent changes in insurers’ payment policies have enabled providers to bill insurers and patients for messaging. This analysis examines the typical cost of patient-provider email messaging in 2020 and 2021 using private health insurance claims data.

The typical cost for an email messaging claim was $39 in 2021, including both the portion paid by insurance and that paid by patients. Although the health plan covered the full cost for most of these claims (82%), those patients with at least some out-of-pocket costs typically paid $25.

The analysis is available through the KFF-Peterson Health System Tracker, an online information hub that monitors and assesses the performance of the U.S. health system.

News Release

3 Charts: The Cost and Coverage of Opill—the First FDA-approved Over-the-Counter Daily Oral Contraceptive Pill in the United States 

Published: Mar 5, 2024

The first FDA-approved over-the-counter daily oral contraceptive pill in the United States— Perrigo’s Opill— is now available for pre-order at major online retailers and will soon be available in stores.

Although the new over-the-counter pill could broaden access to contraceptive options in the United States, KFF research suggests consumers are likely to face some hurdles if they seek to have their plan cover the costs. For example, while federal policy requires most private health insurance plans and Medicaid expansion programs to cover—without patient copays—the full range of FDA-approved contraceptive methods with a prescription, there is no federal requirement that plans cover nonprescription contraception.

As Opill officially launches and federal regulators consider public input on how best to ensure coverage and access to over-the-counter preventive services like it, these three charts provide insights into the coverage and affordability issues raised by the over-the-counter availability of these pills.

1) Many women who say they are likely to use an over-the-counter oral contraceptive pill say they would not be willing to pay Opill’s suggested retail price.

The suggested retail price of Opill is $19.99 for one month’s supply or $49.99 for three months’ supply. Four in ten (39%) of those who say they are likely to use over-the-counter pills say they would be willing and able to pay $1-$10 per month and 11% would not be willing to pay anything ($0) for the pills. A third (34%) would pay $11-$20.

2) More than one third of oral contraceptive users have missed taking their birth control because they were unable to get their next supply on time.

Traditionally, patients need to get a prescription for oral contraceptives from a clinician and then pick up their supply at a pharmacy. Dispensing qualities vary by insurer, but the vast majority of oral contraceptive pills users receive fewer than 6 packs of pills at a time. The added convenience and time saved by obtaining oral contraception directly in stores or having them delivered from online retailers could reduce the share of women who miss taking their contraception on time because of difficulties in keeping a continuous supply on hand.

3) Seven states require state-regulated private health insurance plans to cover at least some methods of over-the-counter contraception without a prescription free of cost-sharing, and seven states use state funds to offer the same coverage for Medicaid enrollees.

Several states have taken action to address affordability barriers to over-the-counter contraception by requiring plans to cover certain products such as emergency contraception and condoms without a prescription. However, the reach of these measures is limited because the majority of those with private health insurance are enrolled in plans that are only subject to federal laws, not to state laws. In most of these states, the language of these private health insurance policies is broad enough to include an over-the-counter daily oral contraceptive such as Opill without a change in policy.

KFF has many resources about Opill’s potential impact and the coverage landscape in which the pill will be available. Take a deeper dive into the following: