Women’s Experiences with Preventive and Health Care Services: Findings from the 2024 KFF Women’s Health Survey

Published: Mar 12, 2025

Introduction

Women’s use of health care services is shaped by a range of factors, including their health needs, health coverage, access and availability of health providers in their communities, and the social determinants of health. This data note presents findings from the KFF Women’s Health Survey on women’s health status, access to health care services, and use of preventive health services. The data are analyzed across different subgroups of women including by age, race/ethnicity, insurance status, poverty level, disability status, and sexual orientation (LGBT+). The KFF Women’s Health Survey is a nationally representative survey of 5,055 women ages 18 to 64, conducted May 15 – June 18, 2024. See the methodology for details.

Key Findings:

Health Status and Ongoing Health Conditions:

  • While most women (81%) ages 18 to 64 report being in excellent, very good, or good health, one in five (20%) report being in fair or poor health, with substantial differences by sociodemographic characteristics.
  • Half of women report having an ongoing health condition that needs to be monitored regularly or for which they need regular care or medication. Nearly one in five (17%) women say they have an ongoing health condition that keeps them from participating in daily life activities such as school, work or housework.

Site of Care and Access to Services:

  • Eight in ten (81%) women report having a regular doctor or health care provider they see when they are sick or need care, but notably, less than half of those who are uninsured have a usual source of care an important access point for health care.
  • While the majority of women (59%) rely on a private doctor’s office or HMO when they are sick or in need of health advice, clinics are a key source of care for about four in ten who have lower incomes, Medicaid coverage, are under the age of 25, or are Hispanic.
  • Reproductive health care is not universally obtained by all women. Six in ten women between the age of 18 and 64 report having had a gynecological visit in the past two years, but one in 10 (8%) never had a visit, including almost one in five (19%) uninsured women.
  • Less than half (47%) of women ages 50 to 64 report that a health care provider has spoken to them about what to expect in menopause.

Use of Preventive Health Services:

  • The majority of women (72%) ages 40 to 64 report that they have had a mammogram in the past two years—among uninsured women, the rates are far lower, with less than four in ten (38%) reporting having had a mammogram in the past two years.
  • Most women (62%) ages 21-64 report that they had a Pap smear or Pap test in the past two years for cervical cancer screening, with higher screening rates among Black and Hispanic women as well as those with higher incomes and private insurance.
  • Almost half (47%) of women ages 45 to 64 report having had a recent colon cancer screening test in the past two years, including higher shares of Black and Hispanic women and women with private or Medicaid coverage.
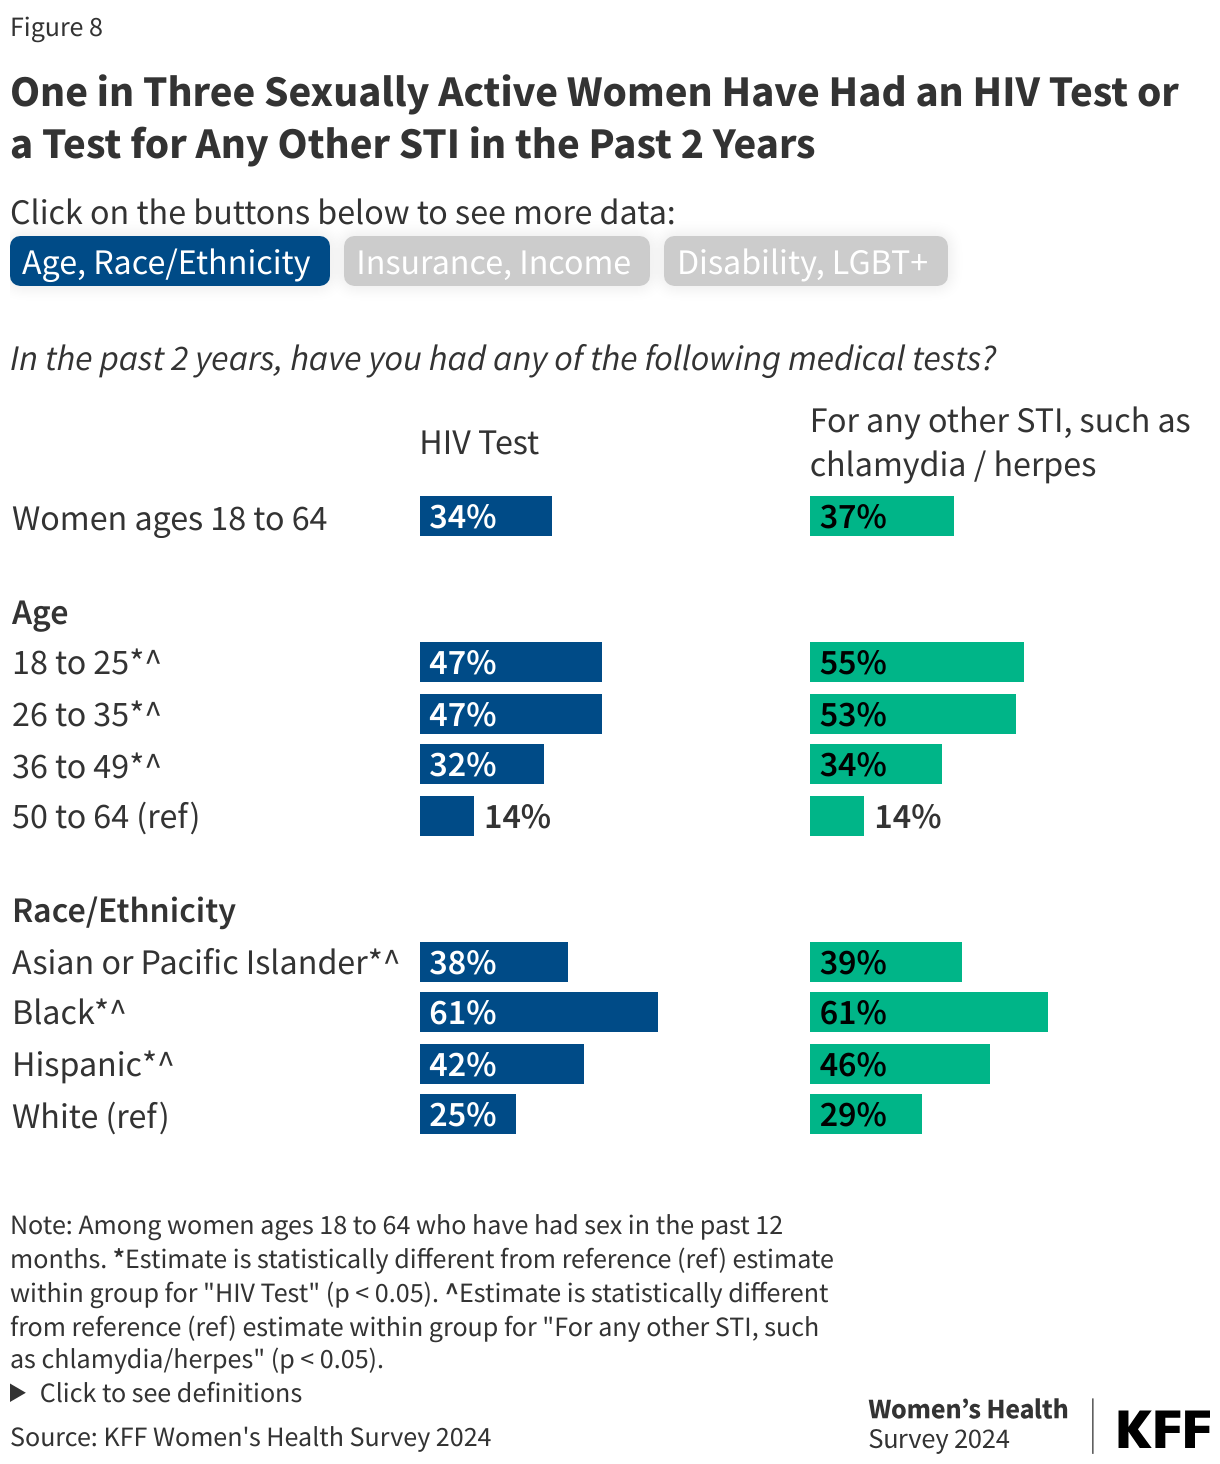
  • Among women ages 18 to 64 who report having sex in the past 12 months, one in three report having had an HIV test (34%) or a test for other STIs such as chlamydia or gonorrhea (37%) in the past two years.

Health Status and Ongoing Health Conditions

The majority of women ages 18 to 64 report being in good or excellent health, but one in five report fair or poor health. Substantial shares of LGBT+ women, women who identify as disabled, those with lower incomes, those with Medicaid coverage, and those without insurance describe their health as fair or poor. Eight in ten women ages 18 to 64 (81%) rate their health as excellent, very good, or good; however, one in five (20%) describe their health as fair or poor (Figure 1). Nearly half (47%) of women who identify as disabled, and over one in four LGBT+ women, women with low incomes, as well as those with Medicaid coverage and without insurance describe their health as fair or poor. Nearly a quarter of mid-life aged (50-64) women, those living in rural areas, and Black and Hispanic women describe their health as fair or poor, which was significantly higher than younger women, those living in urban areas, and White women.
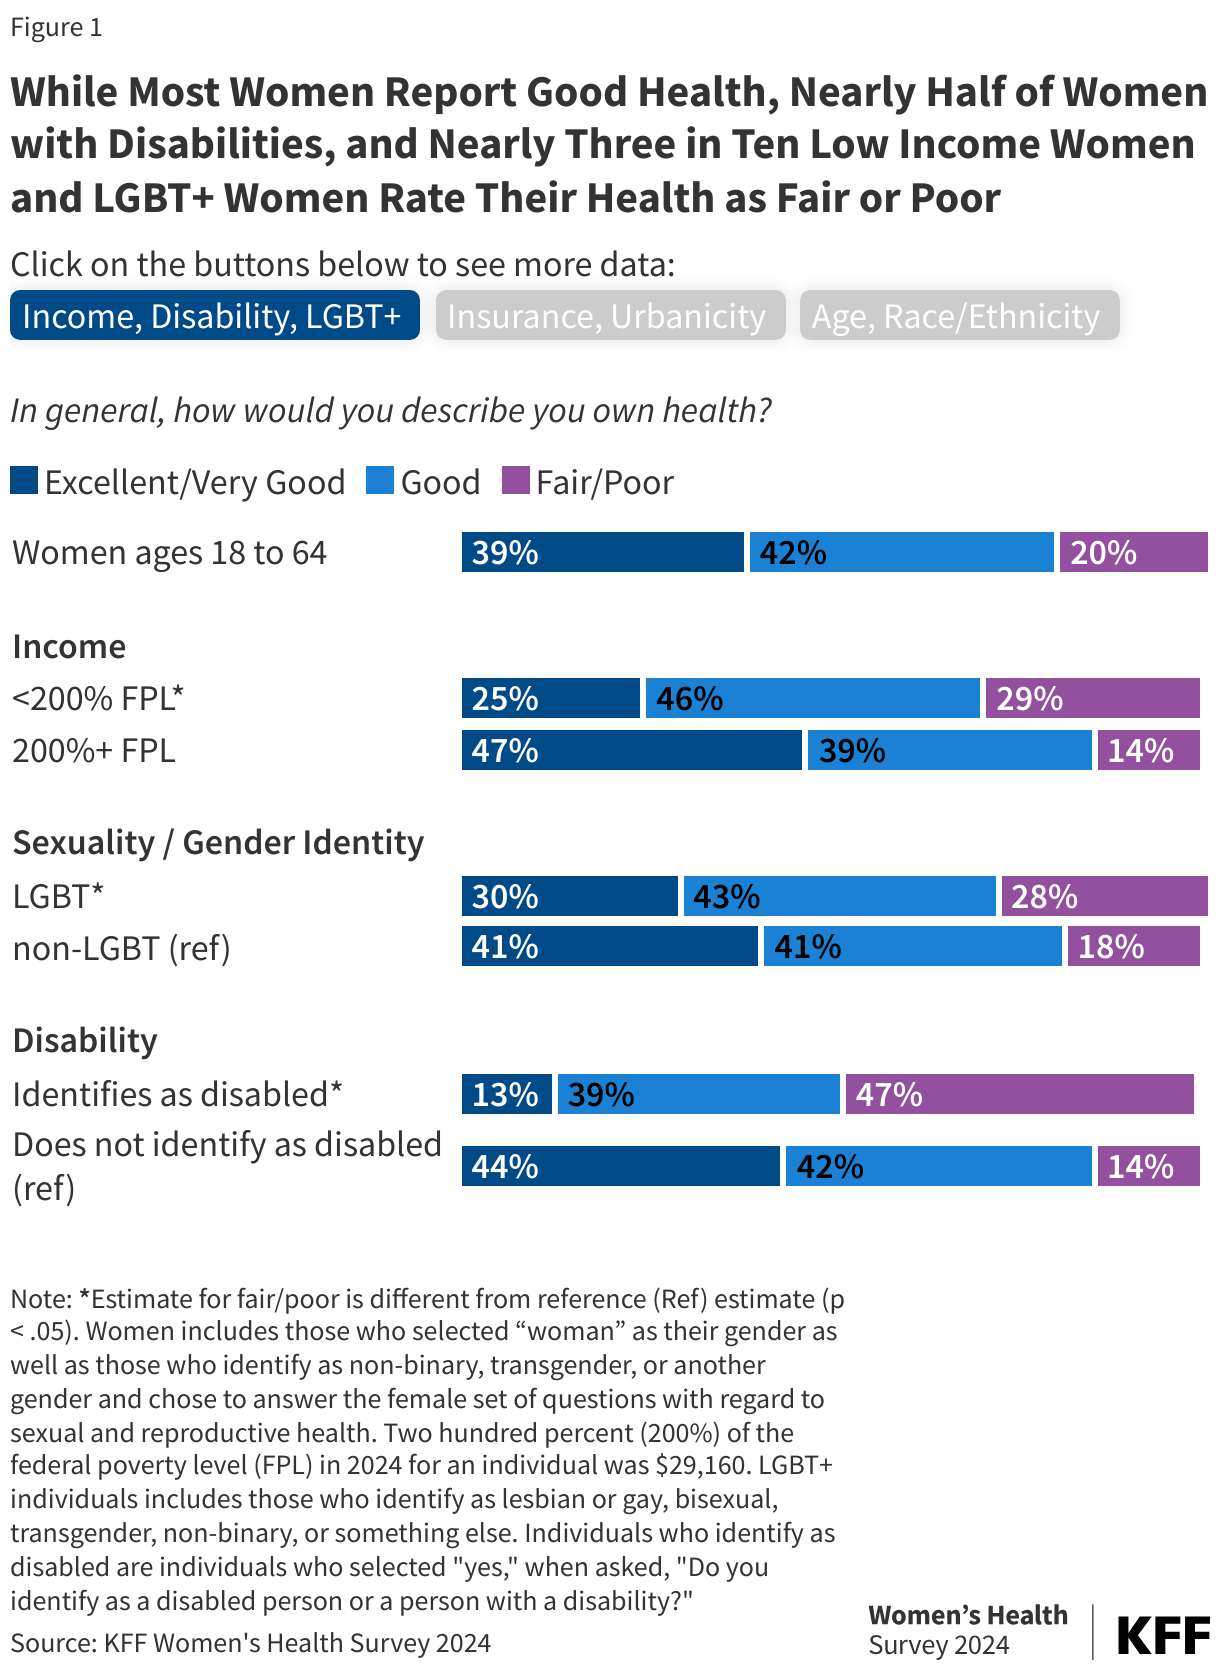
While Most Women Report Good Health, Nearly Half of Women with Disabilities, and Nearly Three in Ten Low Income Women and LGBT+ Women Rate Their Health as Fair or Poor

Half of women ages 18 to 64 report that they have an ongoing health condition that needs to be monitored regularly or for which they need regular care or medication (Figure 2). Larger shares of women age 50 to 64 and women with Medicaid coverage report an ongoing health condition compared to women ages 18 to 49 and women with private health care coverage. Rates are also higher among women who are White and Black, compared to those who are Hispanic or Asian or Pacific Islander. Among women who identify as disabled, 86% report having an ongoing health condition that requires regular monitoring, care, or medication.

While half of women report having an ongoing health condition, nearly one in five (17%) say that they have an ongoing health condition that keeps them from participating fully in school, work, housework, or other activities. One in four women with lower incomes (26%), women with Medicaid coverage (26%), women 50 to 64 (23%), and women living in rural areas (24%) report having an ongoing health condition that keeps them from participating fully in daily life. Among women who identify as disabled, two-thirds (65%) report they have an ongoing health condition that keeps them from participating in daily life.
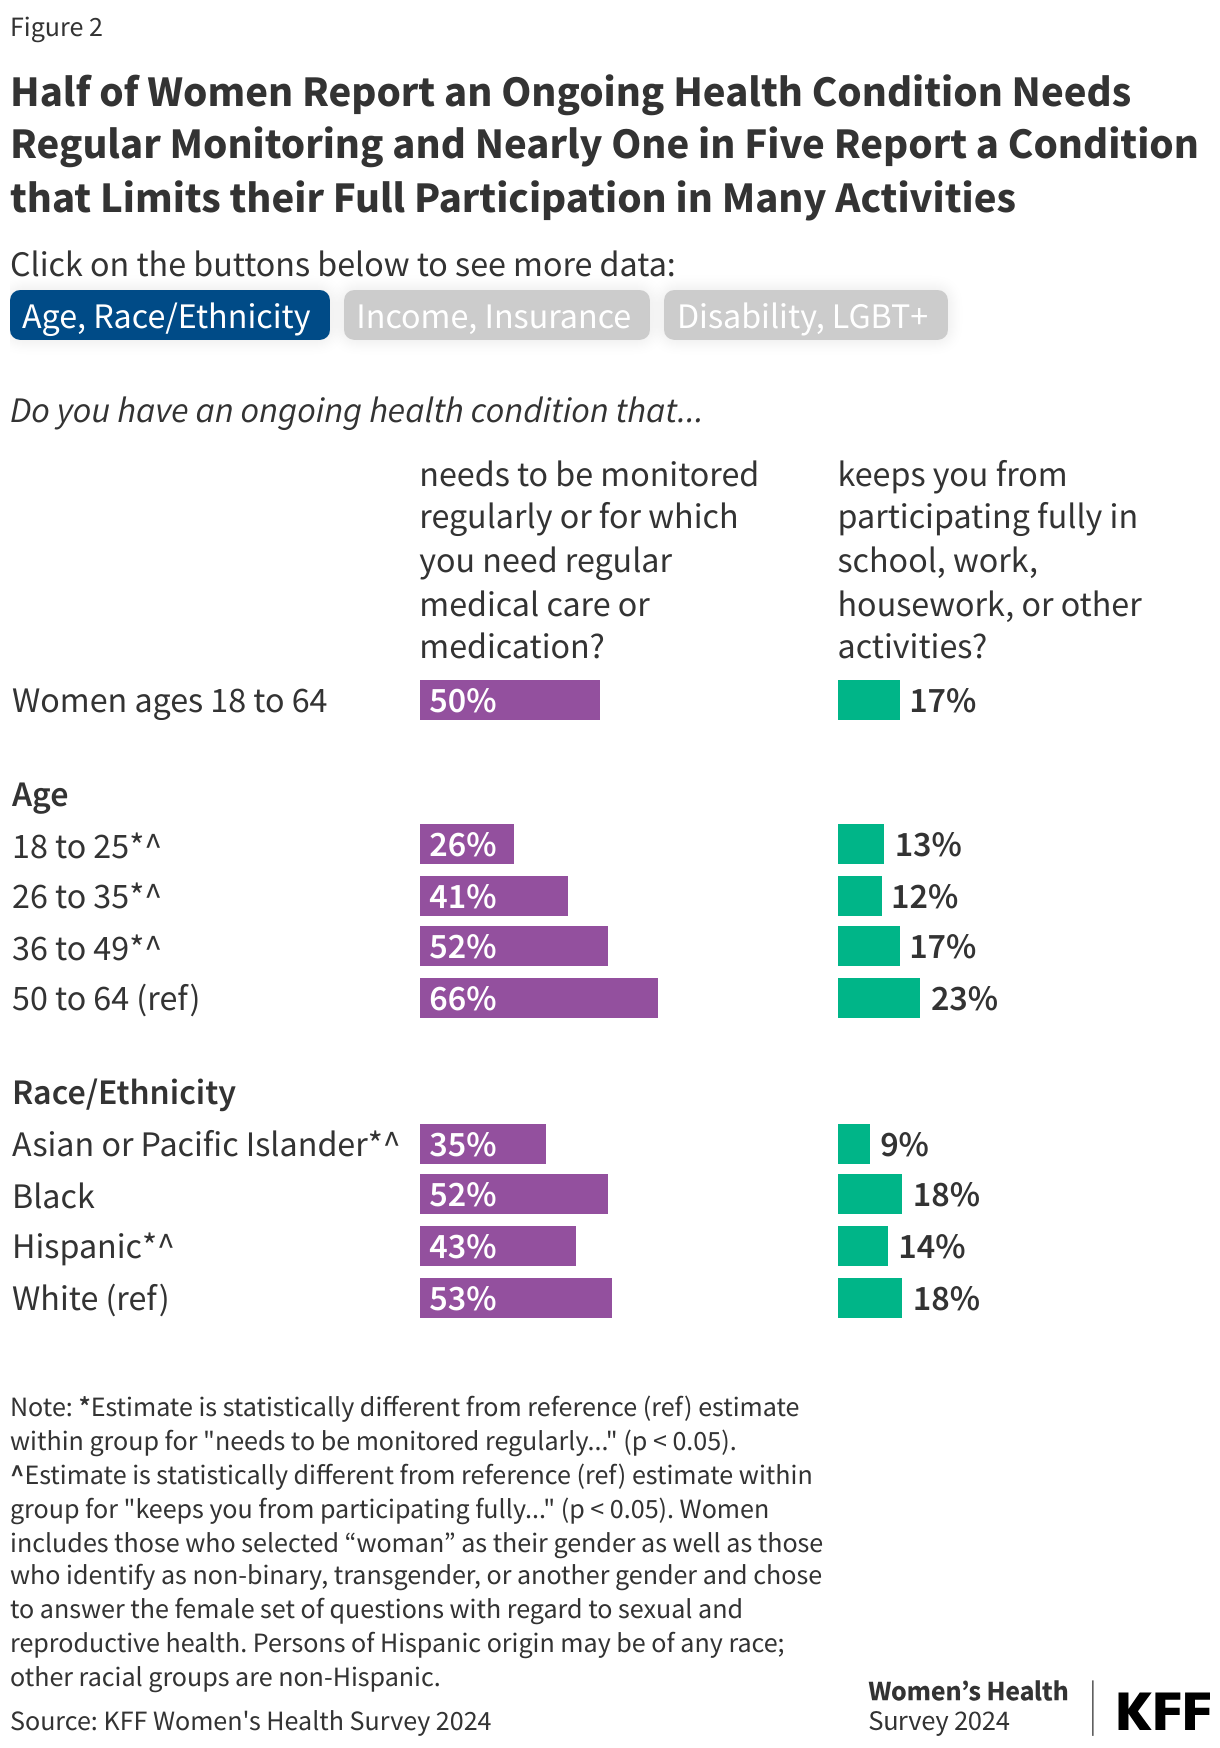
Half of Women Report an Ongoing Health Condition Needs Regular Monitoring and Nearly One in Five Report a Condition that Limits their Full Participation in Many Activities

(Back to top)

Site of Care and Access to Services

Most women report having a regular doctor or health care provider they see when they are sick or need care, but less than half of those who were uninsured had a usual source of care. Eight in ten (81%) women ages 18 to 64 say they have a regular doctor or health care provider they usually see when they are sick or need routine care (Figure 3). Larger shares of women ages 50 to 64, Black women, and women who identify as disabled report having a regular doctor or health provider. However, among women who are uninsured, only four in ten (39%) say they have a regular health care provider compared to 85% of women with private insurance or Medicaid.
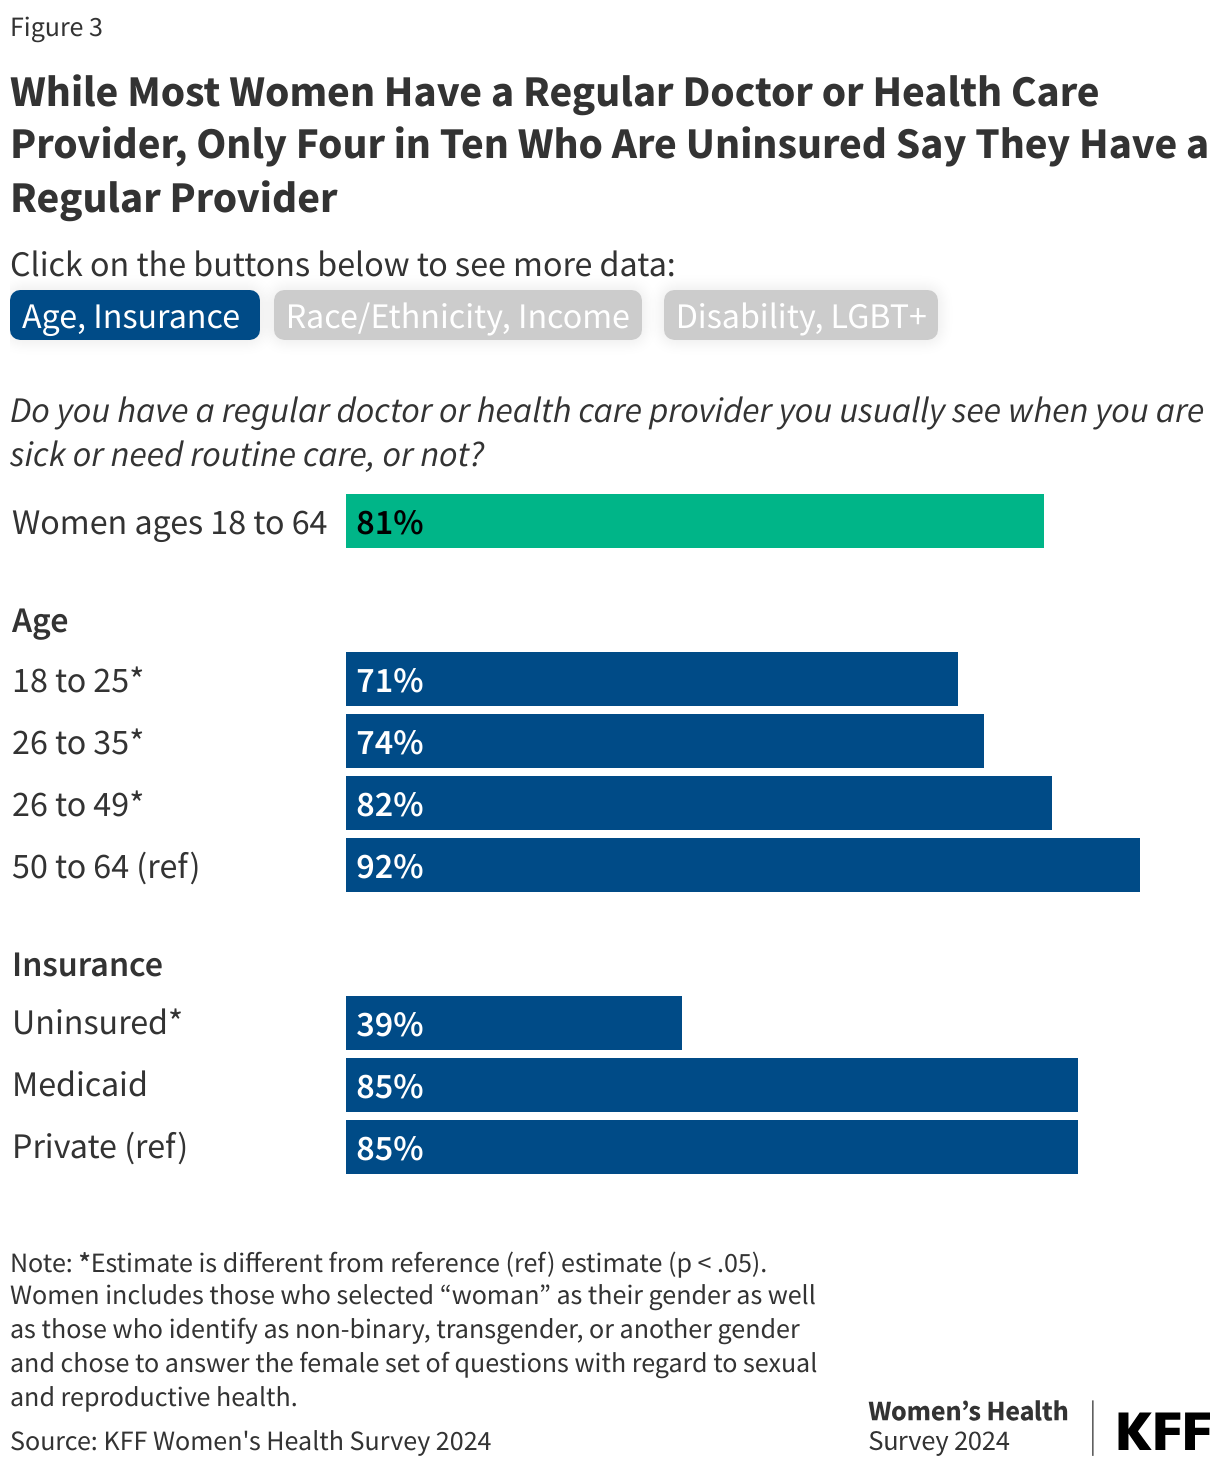
While Most Women Have a Regular Doctor or Health Care Provider, Only Four in Ten Who Are Uninsured Say They Have a Regular Provider

When they get sick or need advice about their health, the majority (59%) of women go to a private doctor’s office or HMO (Table 1). Three in ten (28%) women go to a clinic, 5% go to an emergency room, and 4% go to some other place for their health care. Overall, four percent of women 18 to 64 report that they do not have a place to go when they are sick or need advice about their health.

While the majority of women go to a private doctor’s office or HMO when they are sick or in need of health advice, women with lower incomes, Medicaid coverage, are under the age of 25, or are Hispanic are more likely to report going to clinics for their usual care (Table 1). Lower shares of Hispanic women, those with lower incomes or Medicaid coverage, those living in rural areas, and LGBT+ women report that their usual place of care is a private doctor’s office or HMO. In contrast, among women who are uninsured, only one in five (19%) say they go to a private doctor’s office for care—four in ten (40%) say they go to a clinic, many of which provide free or reduced cost care thanks to federal and state support, and one in five (18%) report that they do not have a place to go to when they are sick or need advice. Women under the age of 25 are also more likely to rely on clinics for their care and about one-third of women living in rural areas usually get care at a clinic. While only 5% of women report an emergency room as their usual place of care, larger shares of Black (11%) and Hispanic women (6%), women with lower incomes (10%), those with Medicaid coverage (8%) and those who are uninsured (14%) say their usual place of care is an ER.
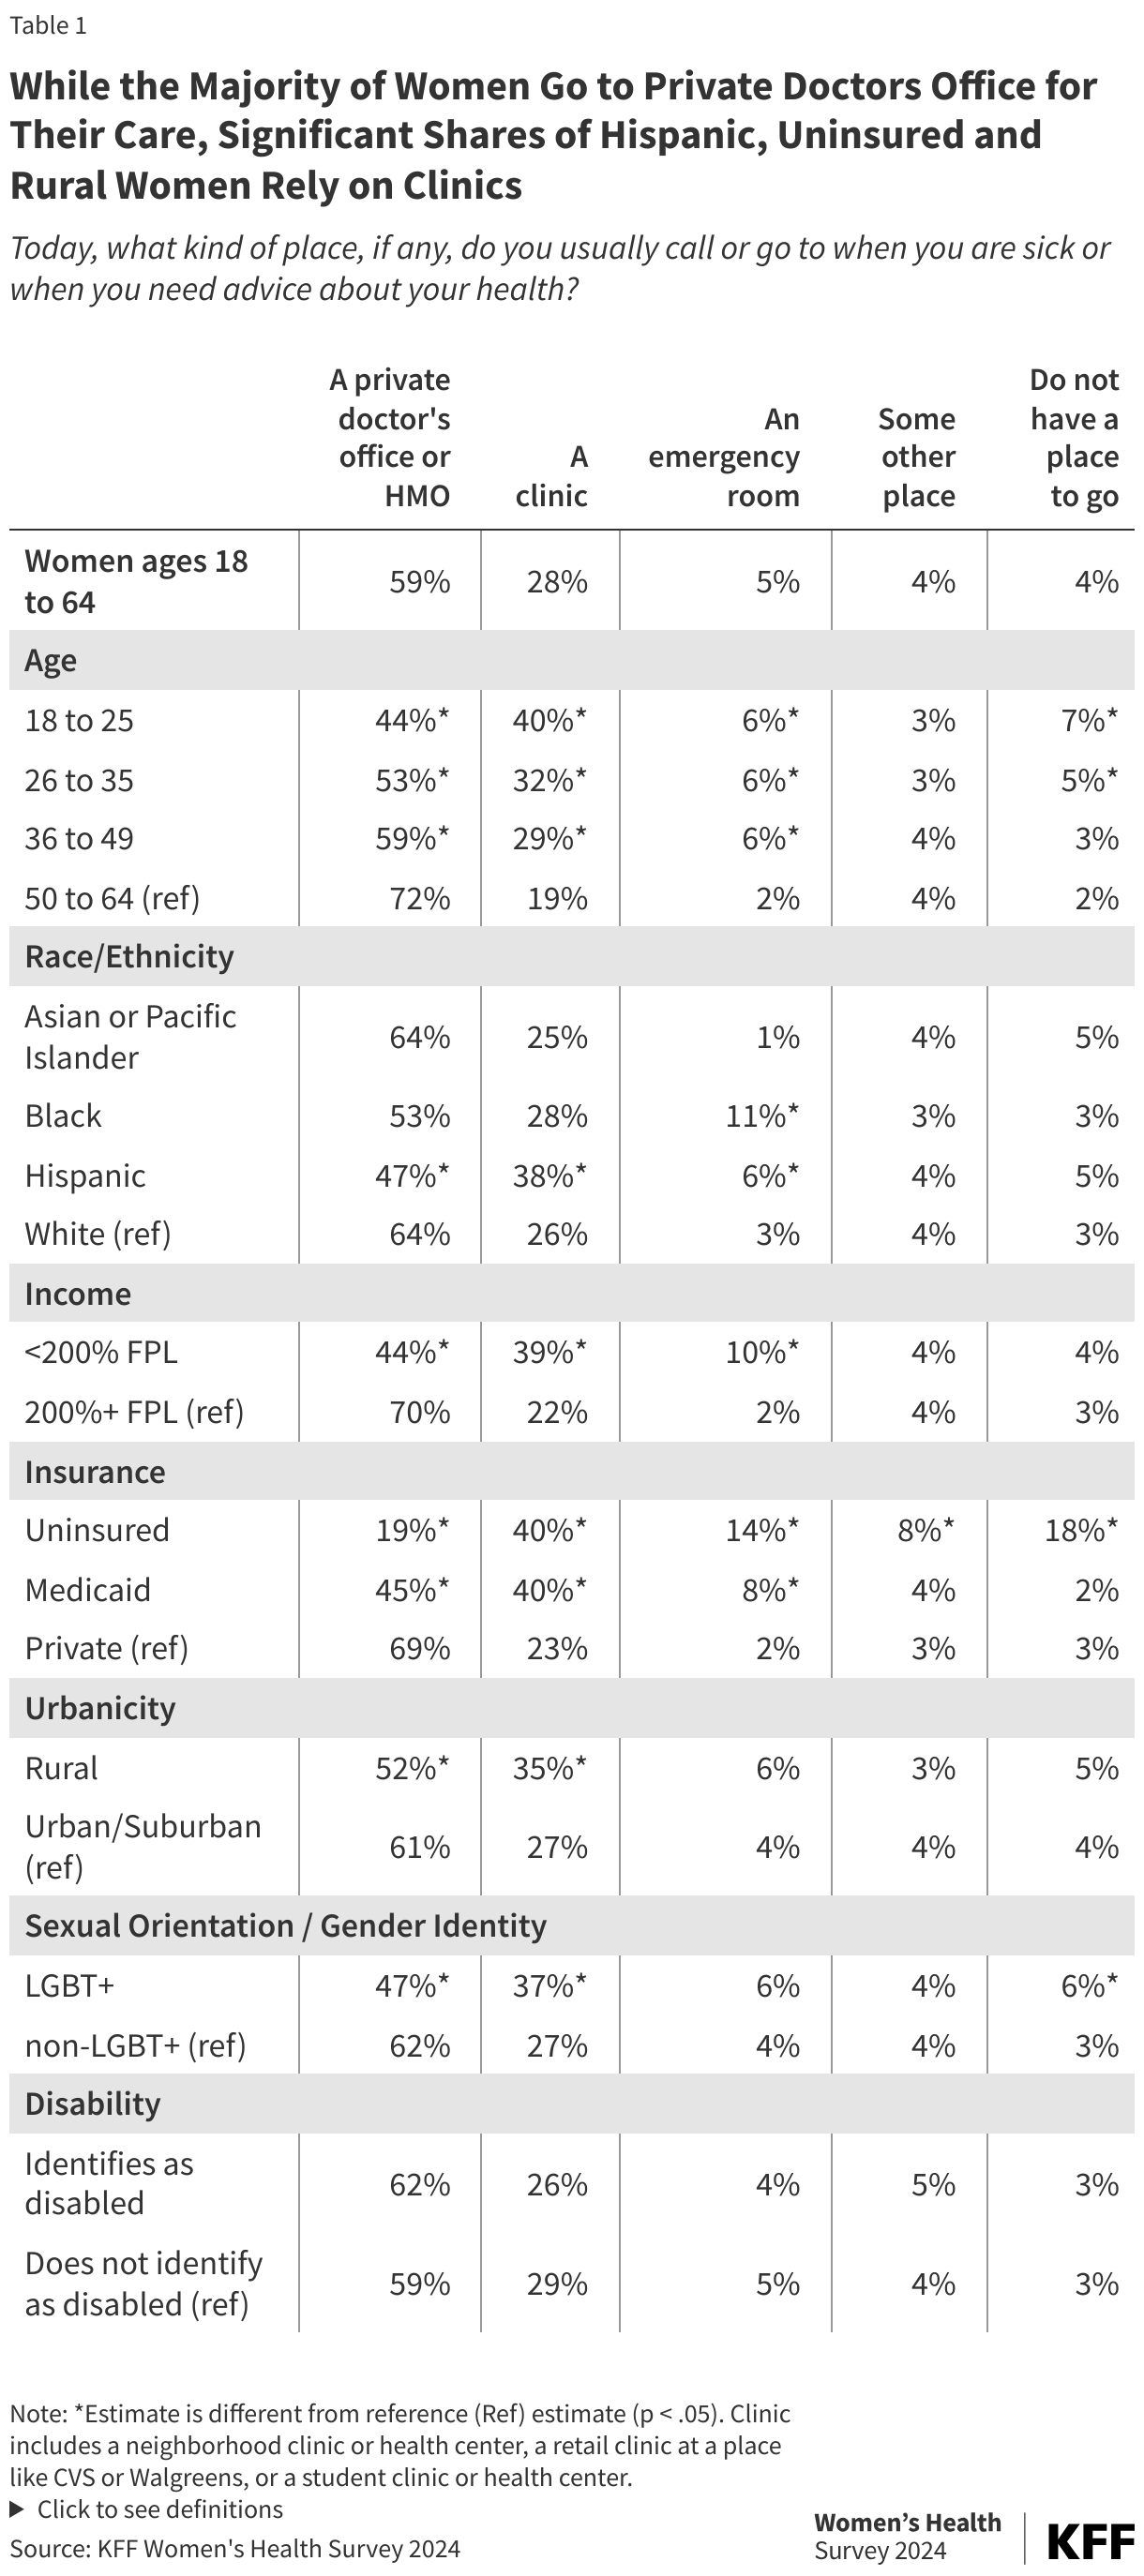
While the Majority of Women Go to Private Doctors Office for Their Care, Significant Shares of Hispanic, Uninsured and Rural Women Rely on Clinics

Almost all women report they have seen a doctor or health provider in the past two years, either in person, over the phone, or virtually. The majority of women report that they have seen a doctor for an in-person visit (93%), while half (48%) report they talked to a provider over the phone or had a virtual visit (considered a telehealth visit) (Figure 4). The share of women who have seen a doctor or health care provider in the past two years either in person or through telehealth does not differ statistically across key demographic groups such as race and ethnicity, income, and age.
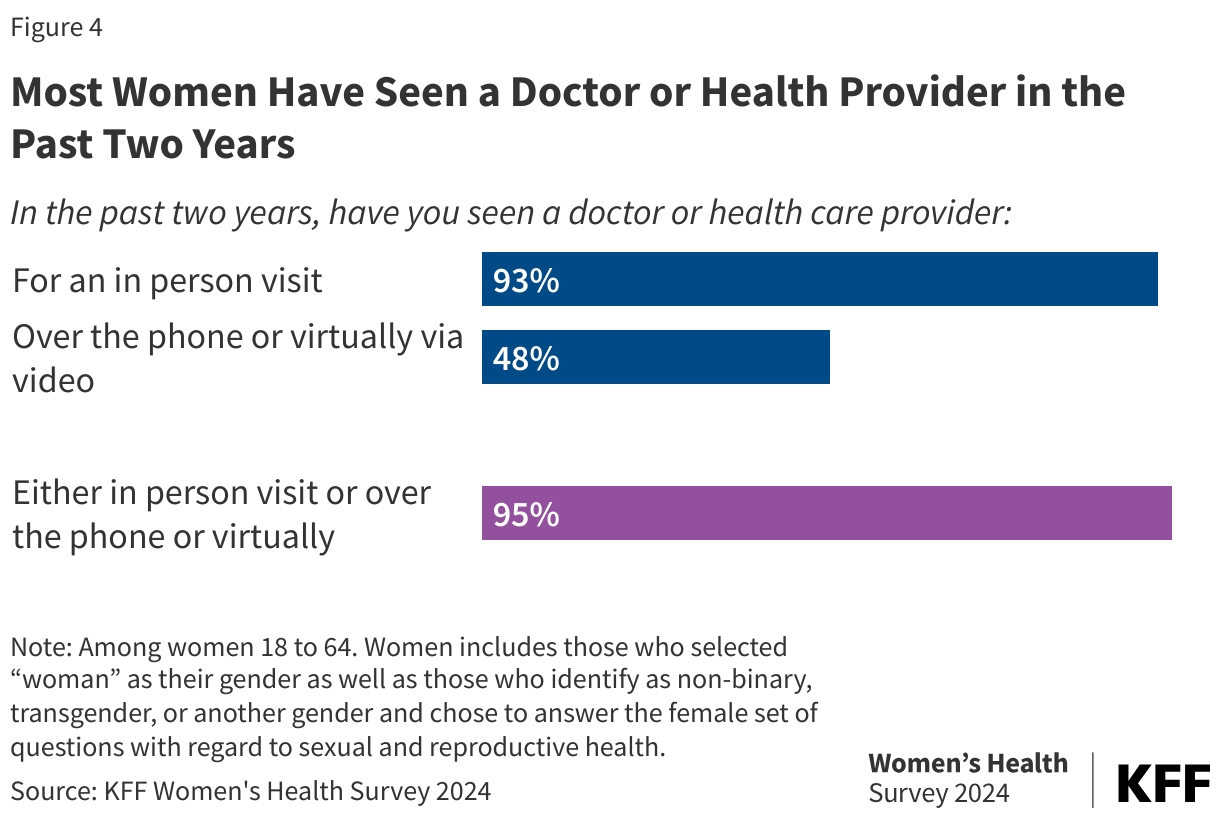
Most Women Have Seen a Doctor or Health Provider in the Past Two Years

Nationally, six in ten (61%) report that they take prescription medications, including birth control pills, on a regular basis (Figure 5). Larger shares of women ages 50 to 64, women with private coverage, and women with higher incomes take prescription medications compared to reproductive age women, women with lower incomes, and women who are uninsured. Use of prescription medications is predicated on access to clinical care which is poorer among many of these groups. White women are more likely to report that they take prescription medications than Asian or Pacific Islander, Black, and Hispanic women. Nine in 10 (88%) women who identify as disabled report that they take prescription medications compared to 57% who do not identify as disabled.
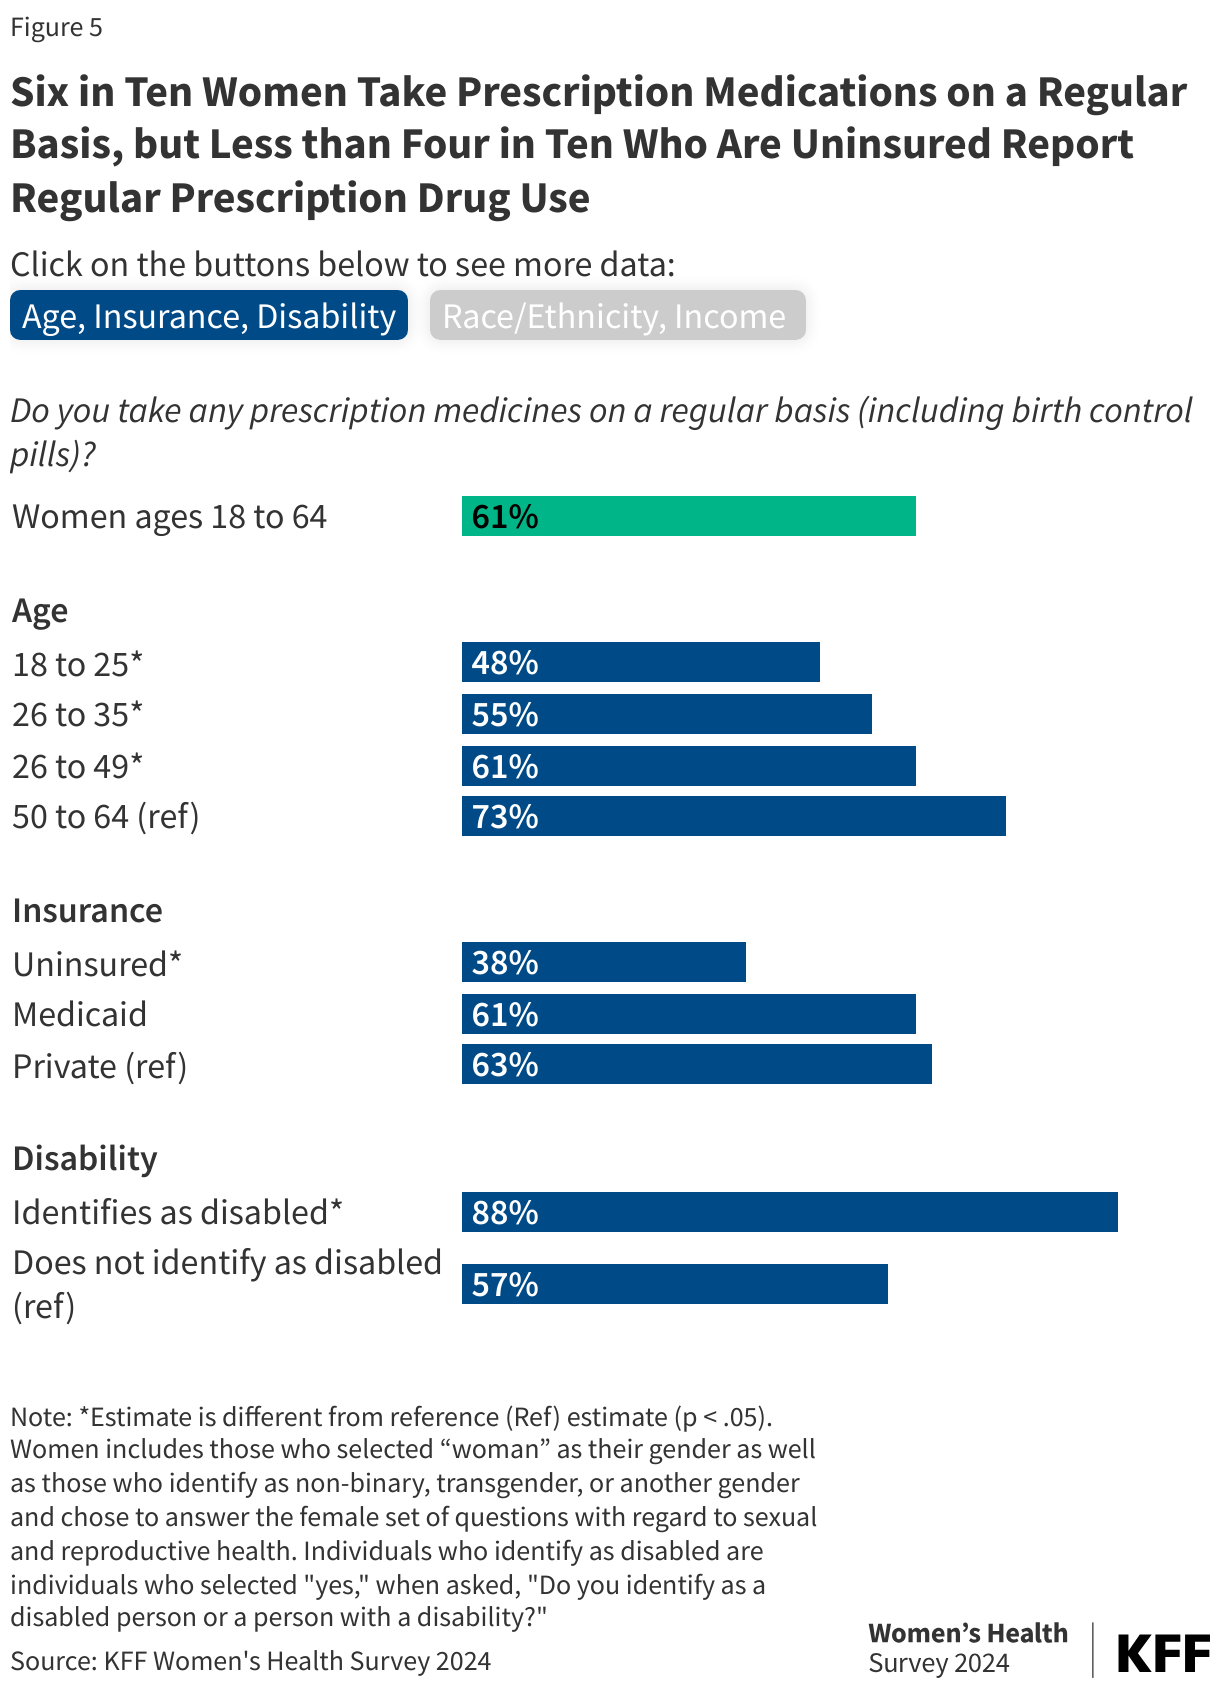
Six in Ten Women Take Prescription Medications on a Regular Basis, but Less than Four in Ten Who Are Uninsured Report Regular Prescription Drug Use

Six in ten (62%) women report having had a gynecological visit in the past two years (Figure 6). Gynecological visits can include pelvic exams, examinations of the female reproductive organs, cervical cancer screenings, discussion and prescriptions of contraceptives, pregnancy planning, and discussions of menopause, among other topics. Twelve percent of women have had a visit in the past two to three years and 18% had a visit more than three years ago. Nearly one in 10 women (8%) have never had a gynecological visit.

Across most subgroups, except for uninsured women, over half of women have had a gynecological visit in the past two years. Among uninsured women, only one in three (35%) have had a gynecological visit in the past two years, and one in five (19%) report that they have never had a gynecological visit. A third of women under the age of 25 report that they have never had a gynecological visit compared to one percent of women ages 50 to 64. One in seven Asian or Pacific Islander women (13%) and LGBT+ women (14%) also report that they have never had a gynecological visit.
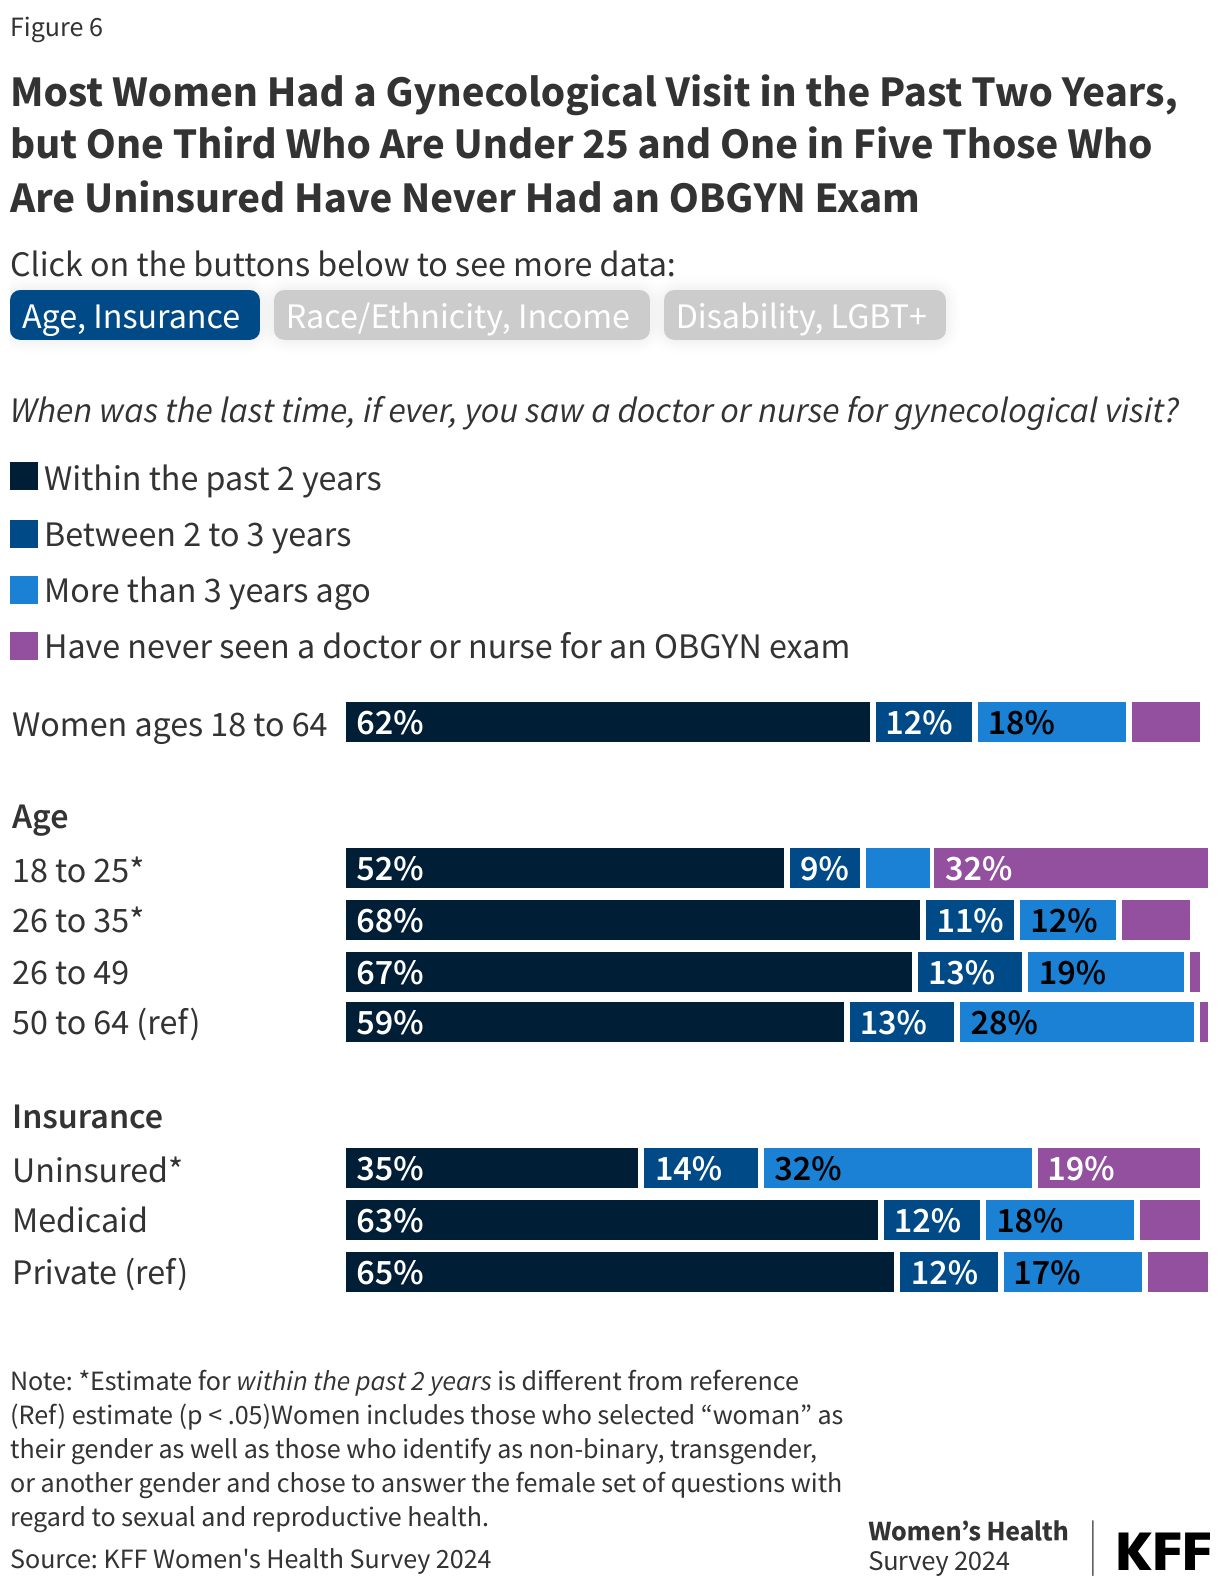
Most Women Had a Gynecological Visit in the Past Two Years, but One Third Who Are Under 25 and One in Five Those Who Are Uninsured Have Never Had an OBGYN Exam

Less than half (47%) of women ages 50 to 64 report that a health care provider has spoken to them about what to expect in menopause (Figure 7). A gynecological visit can be an opportune time for providers to discuss menstrual and other changes across the lifespan, but in recent years, there has been an increased recognition that clinicians do not speak often enough about menopause with female patients.
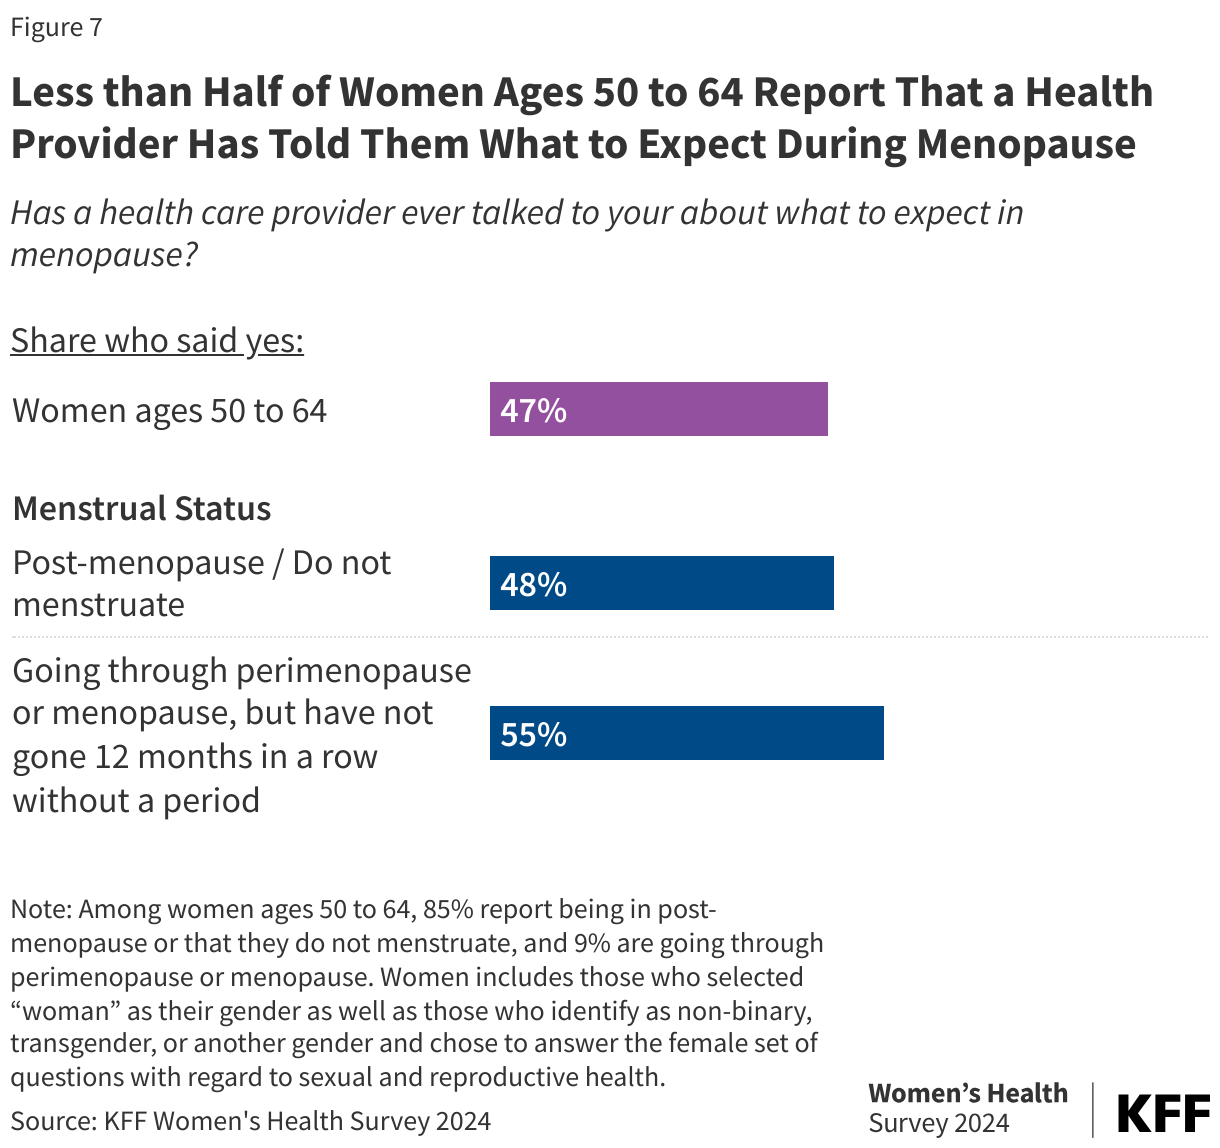
Less than Half of Women Ages 50 to 64 Report That a Health Provider Has Told Them What to Expect During Menopause

(Back to top)

Use of Preventive Health Services

The Affordable Care Act (ACA) requires most private health insurance plans and ACA Medicaid expansion programs to cover many recommended preventive services for adults without any patient cost-sharing. Some preventive services are specific to women, including annual checkups, prenatal tests, breast and cervical cancer screenings, prescription contraceptive services and supplies, as well as many services recommended for adults regardless of sex or gender identity. Use of preventive services can lead to early identification of conditions when they are more responsive to medical interventions. Despite the policy’s wide reach and popularity with the public, there have been several legal challenges over elements of the preventive services requirement since it initially took effect, including in a pending case, Braidwood Management Inc. v. Becerra.

The majority of women ages 40 to 64 report that they have had a mammogram in the past two years, with higher rates among Black women. Both the United States Preventive Health Services (USPSTF) and the Health Resources and Services Administration (HRSA) recommend that women ages 40 to 74 with average risk for breast cancer get a screening mammogram at least every two years. Seven in ten (72%) women ages 40 to 64 report having had a mammogram in the past two years (Table 2). Larger shares of Black women (81%) compared to White women (71%) report having had a mammogram in the past two years. Prior research has similarly found that higher shares of Black women report having had a screening mammogram compared to White women. Significantly larger shares of women with private coverage (77%) report having had a mammogram compared to those with Medicaid coverage (66%) or who are uninsured (38%). The National Breast and Cervical Cancer Early Detection Program offers free mammograms to those who are uninsured, but many people may not know of it or how to obtain free or low-cost services.
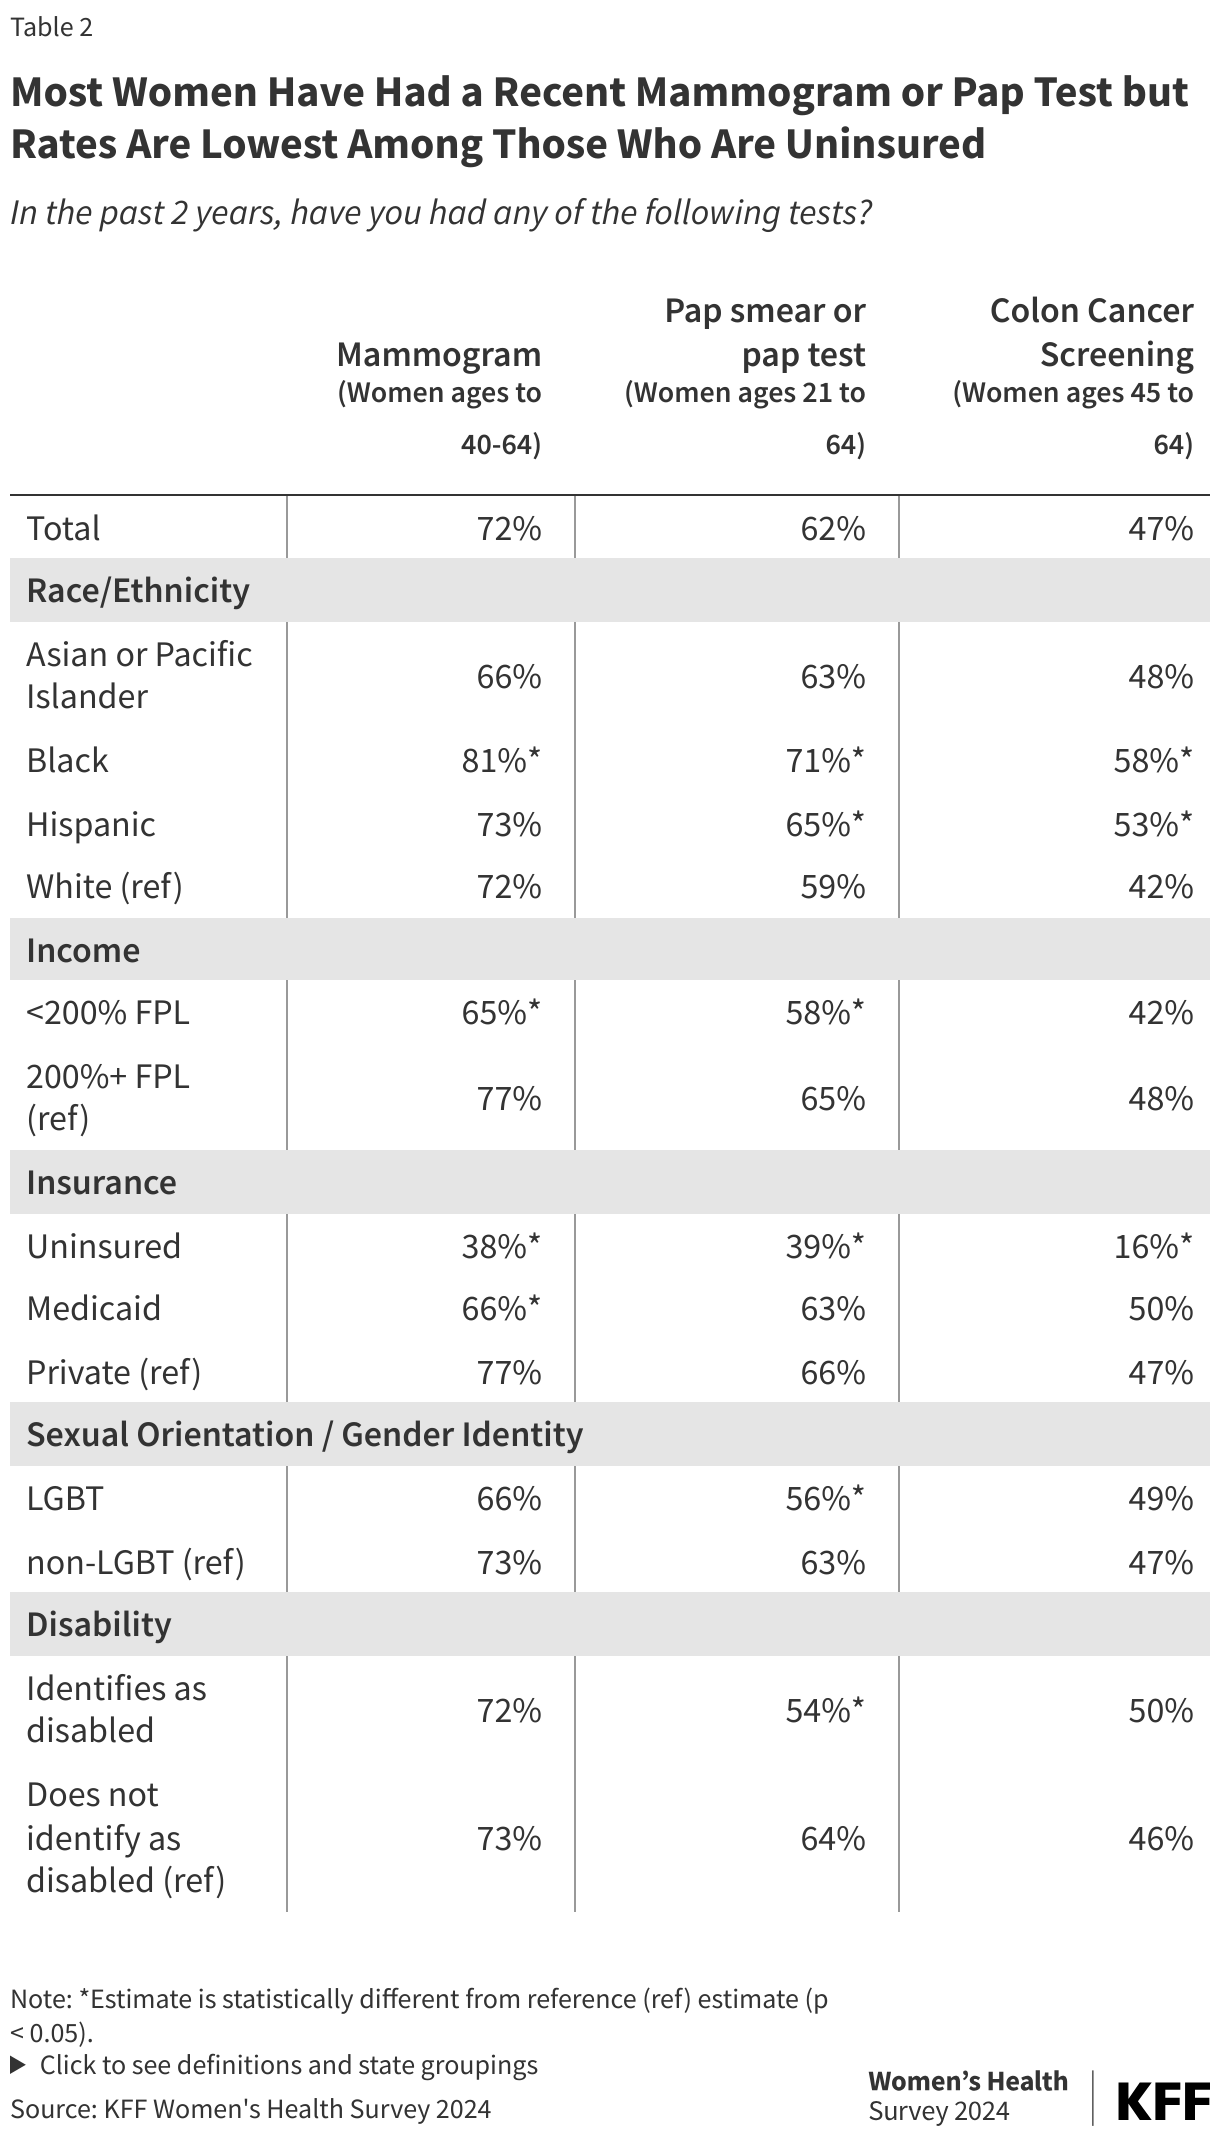
Most Women Have Had a Recent Mammogram or Pap Test but Rates Are Lowest Among Those Who Are Uninsured

Most women ages 21-64 report that they have had a Pap smear or Pap test in the past two years for cervical cancer screening, with higher rates among Black and Hispanic women and those with higher incomes and private insurance. USPSTF and HRSA both recommend cervical cancer screenings for women ages 21 to 65, either via a pap smear or a high-risk HPV test or a combination of both every 3 to 5 years, depending on the person’s age. Six in ten women (62%) ages 21 to 64 report having had a pap smear or test in the past two years. Higher shares of Black women (71%) and Hispanic women (65%) report having had a cervical cancer screening compared to White women (59%). Women with private insurance are more likely to have had a cervical cancer screening in the past two years than women who are uninsured. Lower shares of LGBT+ women (56%) and women who identify as disabled (54%) report having had a pap smear or pap test in the past two years compared to non-LGBT+ women (63%) and women who do not identify as disabled (64%).

Fewer women ages 45 to 64 have had a recent colon cancer screening/colonoscopy in the past two years, with lower rates among the uninsured. The USPSTF recommends colon cancer screening (which can include colonoscopies, fetal occult testing, Stool DNA-FIT, or sigmoidoscopy) for all adults ages 45 to 75 every one to ten years, depending on the screening test. In 2021 the USPSTF lowered the age recommendation for starting colon cancer screenings from 50 to 45 in part due to the increasing incidence of colon cancer in younger adults. Almost half (47%) of women ages 45 to 64 report having had a recent colon cancer screening test in the past two years. A higher share of Black (58%) and Hispanic (53%) women report having had a colon cancer screening test in the past two years compared to White women (42%). Significantly higher shares of women with private coverage (47%) and women with Medicaid coverage (50%) report having had a colon cancer screening test in the past two years compared to only 16% of women who are uninsured. Because the question in this survey limits the time period to the last two years, it is likely that a larger share of women in this age group have had a colon cancer screening within the recommended timeframe for their screening test.

Despite clinical recommendations and the fact that they are covered without cost-sharing by most private plans and ACA Medicaid expansion pathways, smaller shares of women report having an HIV test or a test for other sexually transmitted infections (STIs) in the past two years (Figure 9). The USPSTF and HRSA recommend HIV testing for adolescents and adults at least once in their lifetimes, with additional screenings for those at increased risk for HIV infections. Pregnant people should also get tested for HIV during their pregnancies. The USPSTF also recommends chlamydia, gonorrhea, and syphilis screenings for sexually active women and those at increased risk of infection. Among women ages 18 to 64 who report having sex in the past 12 months, one in three report having had an HIV test (34%) or a test for other STIs such as chlamydia or gonorrhea (37%) in the past two years. Recent STI and HIV testing rates are higher among women under the age of 50, those who identify as LGBT+, Asian or Pacific Islander, Black and Hispanic women, women with lower incomes, those who identify as disabled, and women with Medicaid.
One in Three Sexually Active Women Have Had an HIV Test or a Test for Any Other STI in the Past 2 Years

(Back to top)

A Closer Look at Negative Interactions Experienced by Women in Health Settings: Findings from the 2024 KFF Women’s Health Survey

Published: Mar 12, 2025

Women’s health outcomes are shaped not only by access to care, health insurance, and affordability, but also by the social and economic factors that drive health, discrimination, and experiences within the health care system. When people feel discriminated against or are treated disrespectfully in healthcare settings, they are more likely to avoid medical care, which can lead to worse health outcomes, especially among more at-risk populations.

This data note presents findings from the 2024 KFF Women’s Health Survey on women’s experiences with disrespectful and unfair treatment as well as negative interactions with providers during health care visits in the past two years. The 2024 KFF Women’s Health Survey was fielded from May 15 to June 18, 2024, and was developed and analyzed by KFF staff. It is a nationally representative survey of 5,055 women and 1,191 men ages 18 to 64. See the methodology for detailed definitions, sampling design, and margins of sampling error.

Disrespectful or Unfair Treatment

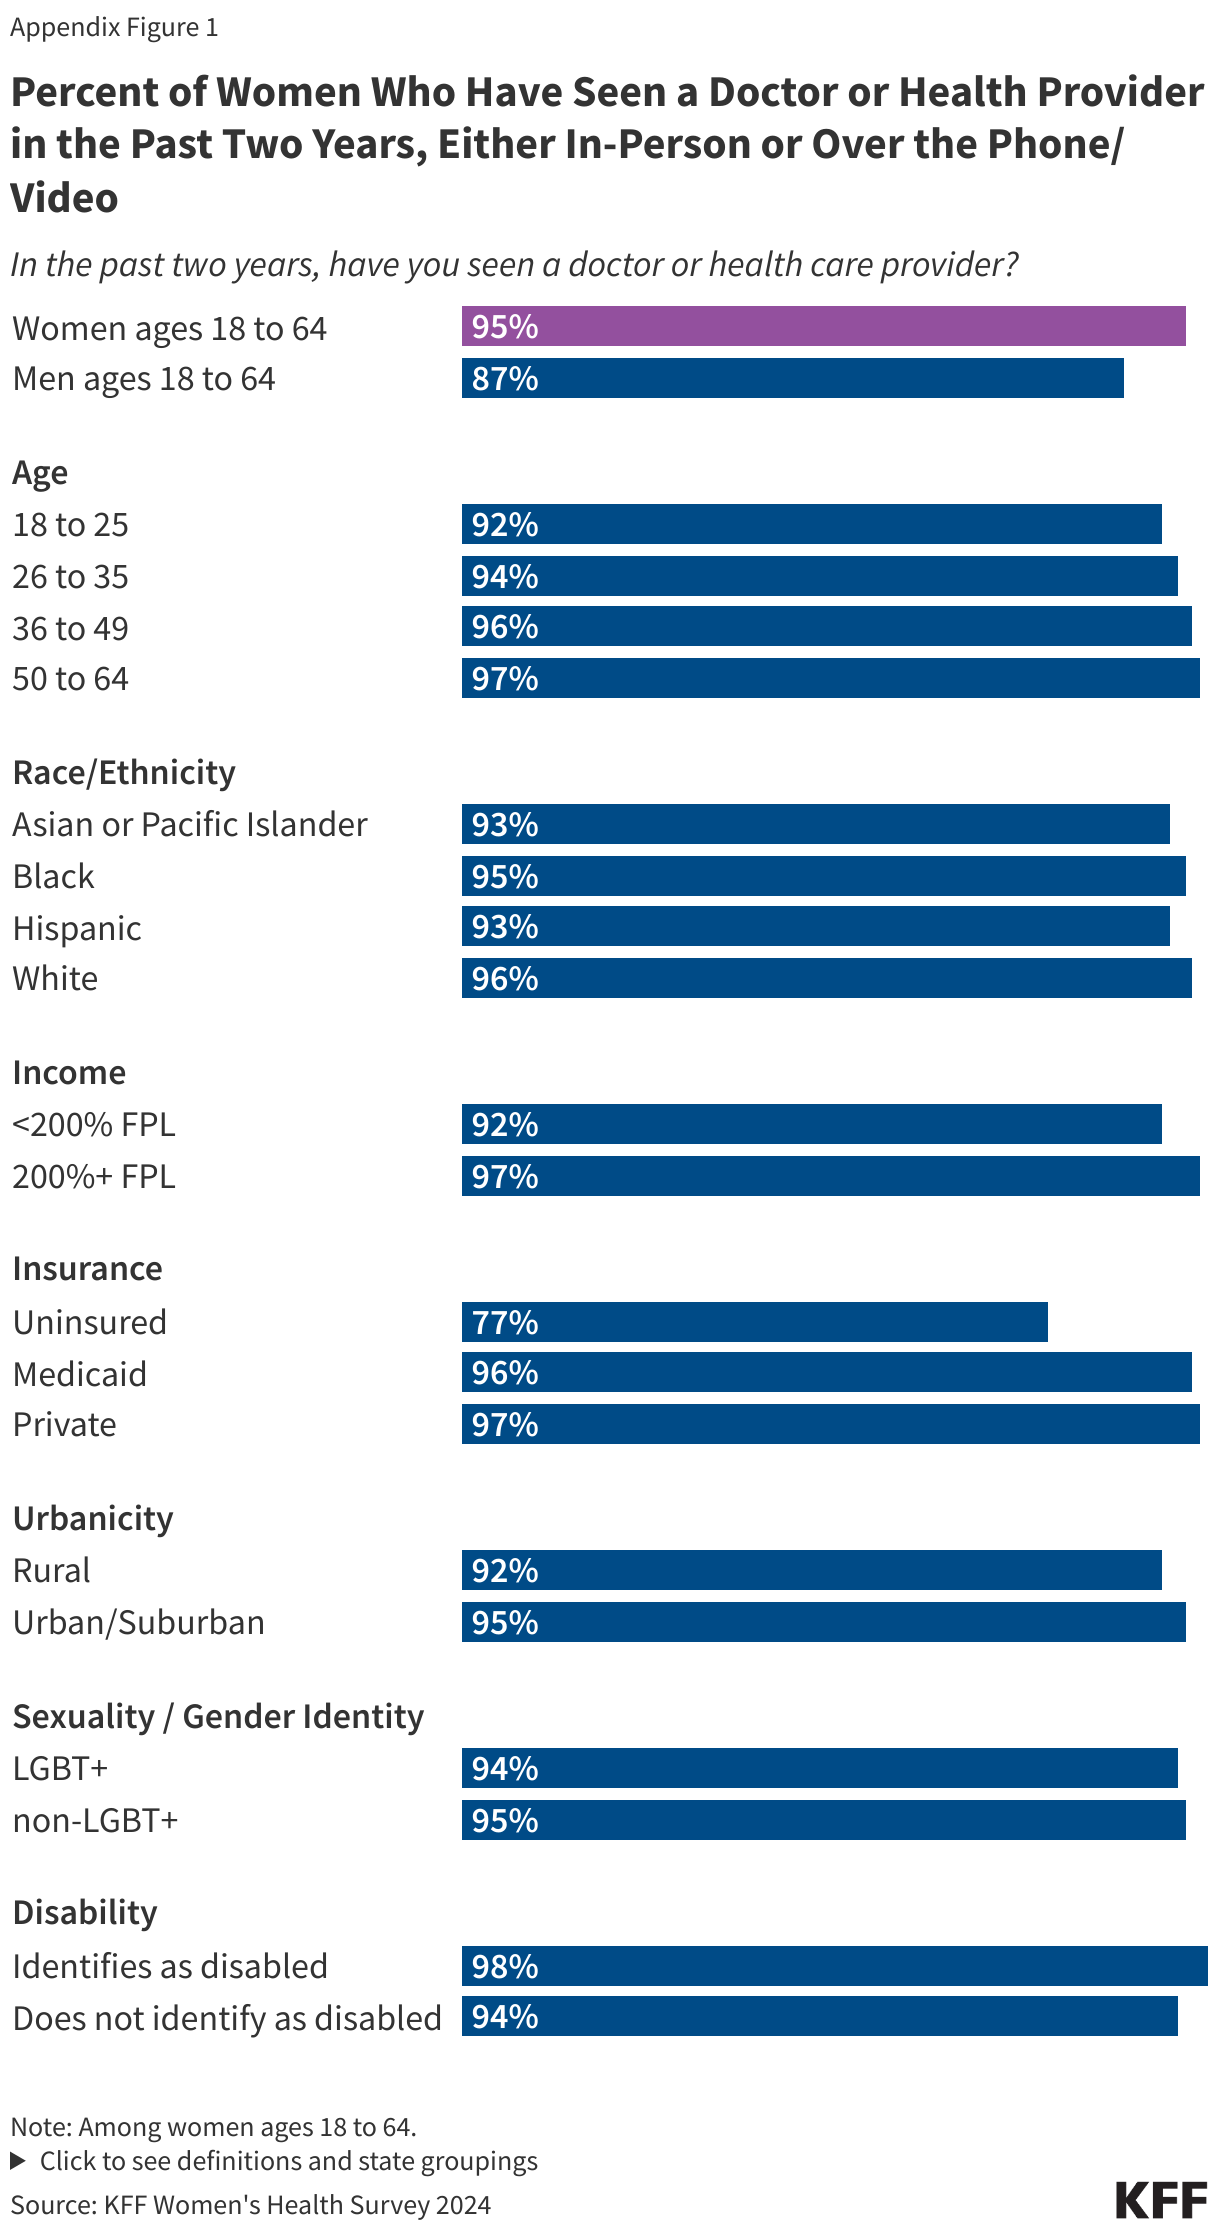
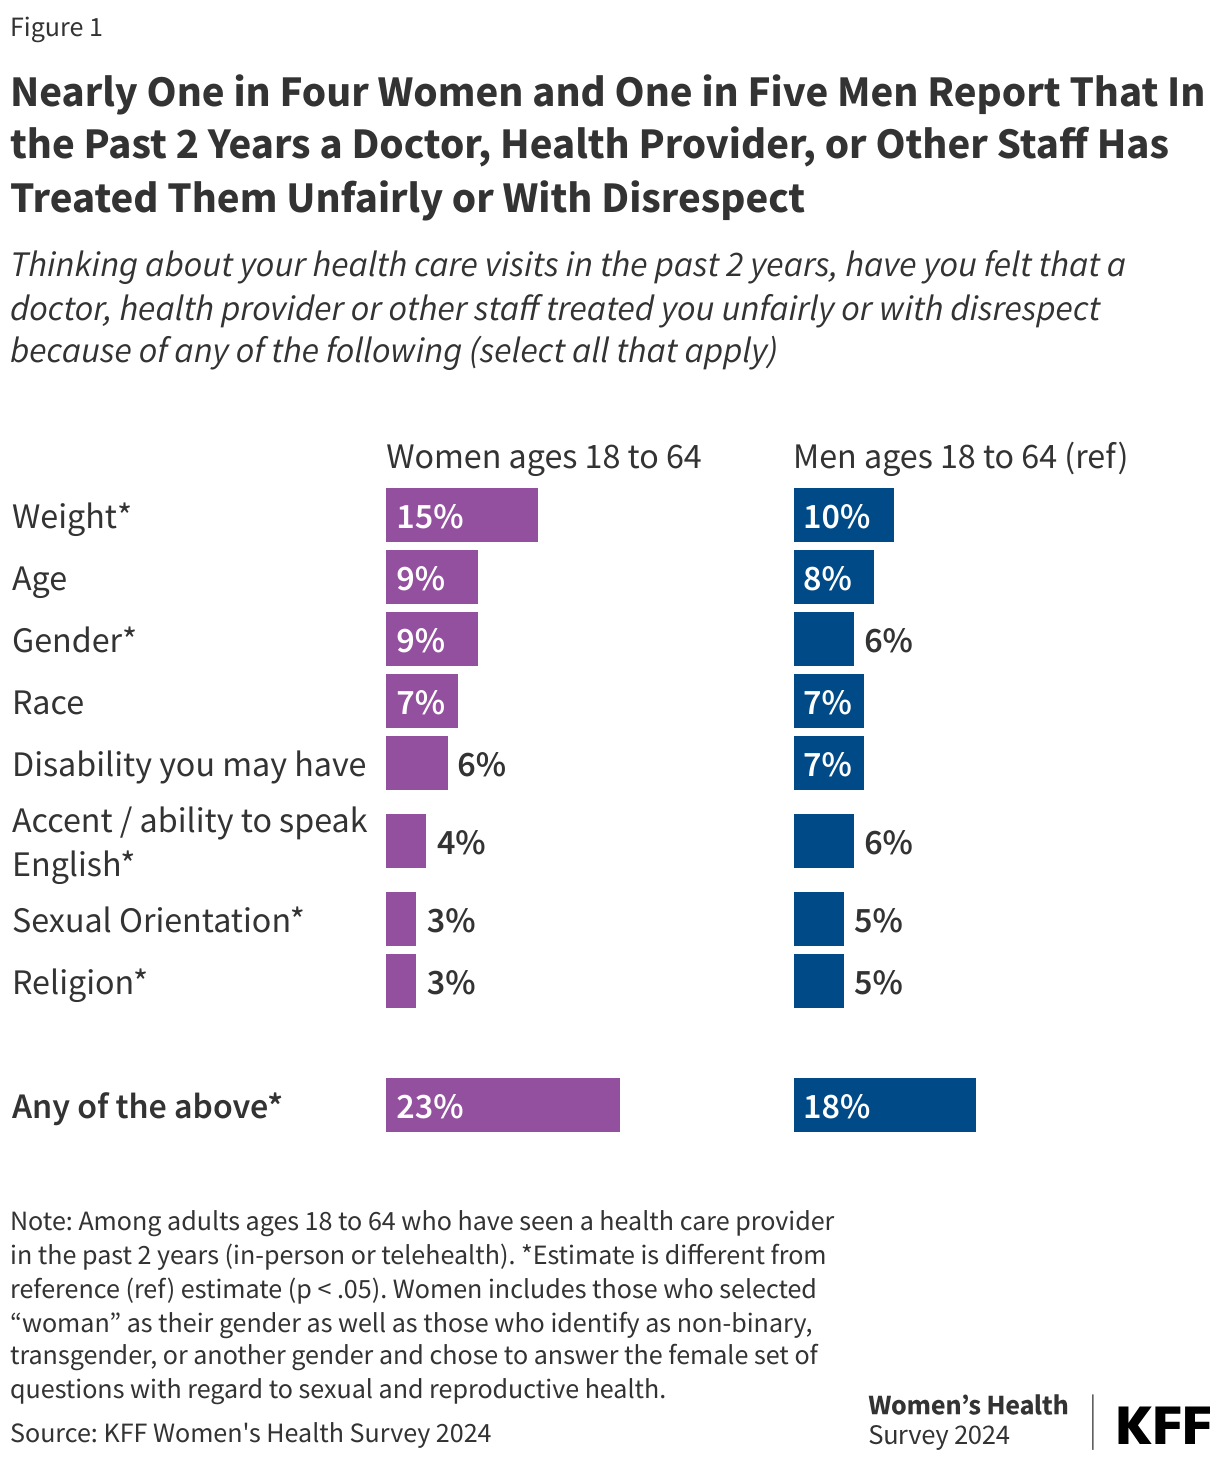
The majority of women (95%) and men (87%) ages 18 to 64 report having seen a health care provider, either in-person or via telehealth over the past two years (Appendix Figure 1). However, among those who have seen a provider, nearly one in four women ages 18 to 64 (23%) report that a doctor, health provider, or other staff has treated them unfairly or with disrespect in the past two years, a rate that is somewhat higher than the share reported by men (18%) (Figure 1). For both men and women, weight is the most common reason identified as to why they were treated unfairly or with disrespect. Overall, one in seven (15%) women say that they were treated unfairly or with disrespect because of their weight, and one in 10 (9%) identified their age and/or gender as the reason why they were treated poorly. Seven percent of women report they were treated unfairly or with disrespect because of their race.

Nearly One in Four Women and One in Five Men Report That In the Past 2 Years a Doctor, Health Provider, or Other Staff Has Treated Them Unfairly or With Disrespect

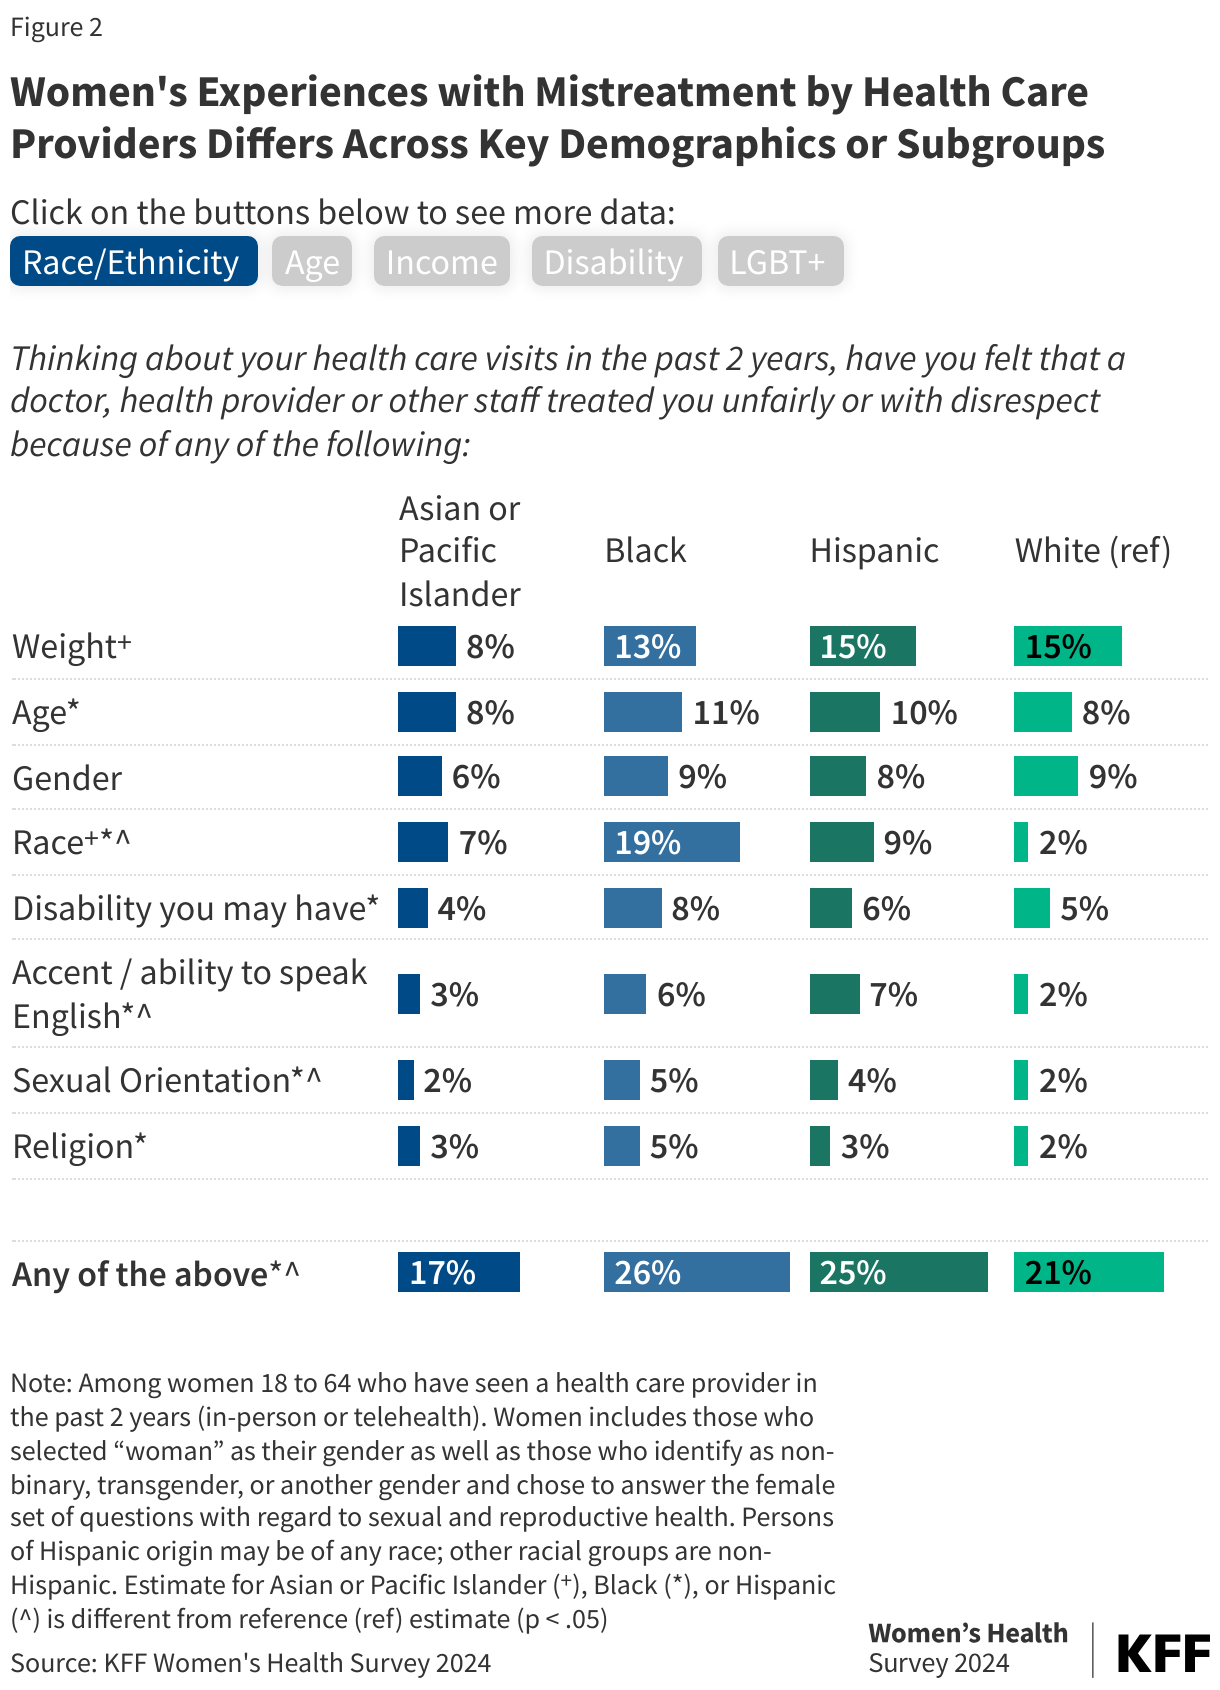
Overall, somewhat larger shares of Black (26%) and Hispanic (25%) women report that they have been treated unfairly or with disrespect by a doctor, health provider, or other staff in the past 2 years compared to White women (21%) (Figure 2). One in five Black women (19%) report that they have been treated unfairly or with disrespect because of their race. One in 10 (9%) Hispanic women and 7% of Asian or Pacific Islander women also identify their race as the reason why they were treated poorly by a health provider while only 2% of White women identify their race as the reason. Larger shares of Black and Hispanic women report that their accent or ability to speak English was the reason they were treated unfairly or with disrespect compared to White women.

Women's Experiences with Mistreatment by Health Care Providers Differs Across Key Demographics or Subgroups (Split Bars)

Women of reproductive age (18 to 49), women with lower incomes, LGBT+ women, and women who identify as disabled are more likely to report that they have been treated unfairly or with disrespect compared to women 50 to 64, women with higher incomes, non-LGBT+ women and women who do not identify as disabled. Among women who identify as disabled one in five women (19%) say they were treated poorly due to a disability they have.

Across the majority of subgroups, weight is the most common reason identified by women about why they were treated unfairly or with disrespect. Weight stigma and discrimination can reduce the quality of care patients receive and patient satisfaction. It can also lead to an increase in stress for a patient and affect their short- and long-term health outcomes. Similar shares of White (15%), Hispanic (15%), and Black (13%) women identify their weight as the reason why they were treated poorly by a health provider in the past two years, while only 8% of Asian or Pacific Islander women say the same. Twice as many LGBT+ women (26%) women and women who identify as disabled (24%) compared to non-LGBT+ women (13%) and women who do not identify as disabled (13%) say that weight was the reason they were treated unfairly or with disrespect by a health care provider.

Negative Health Care Experiences

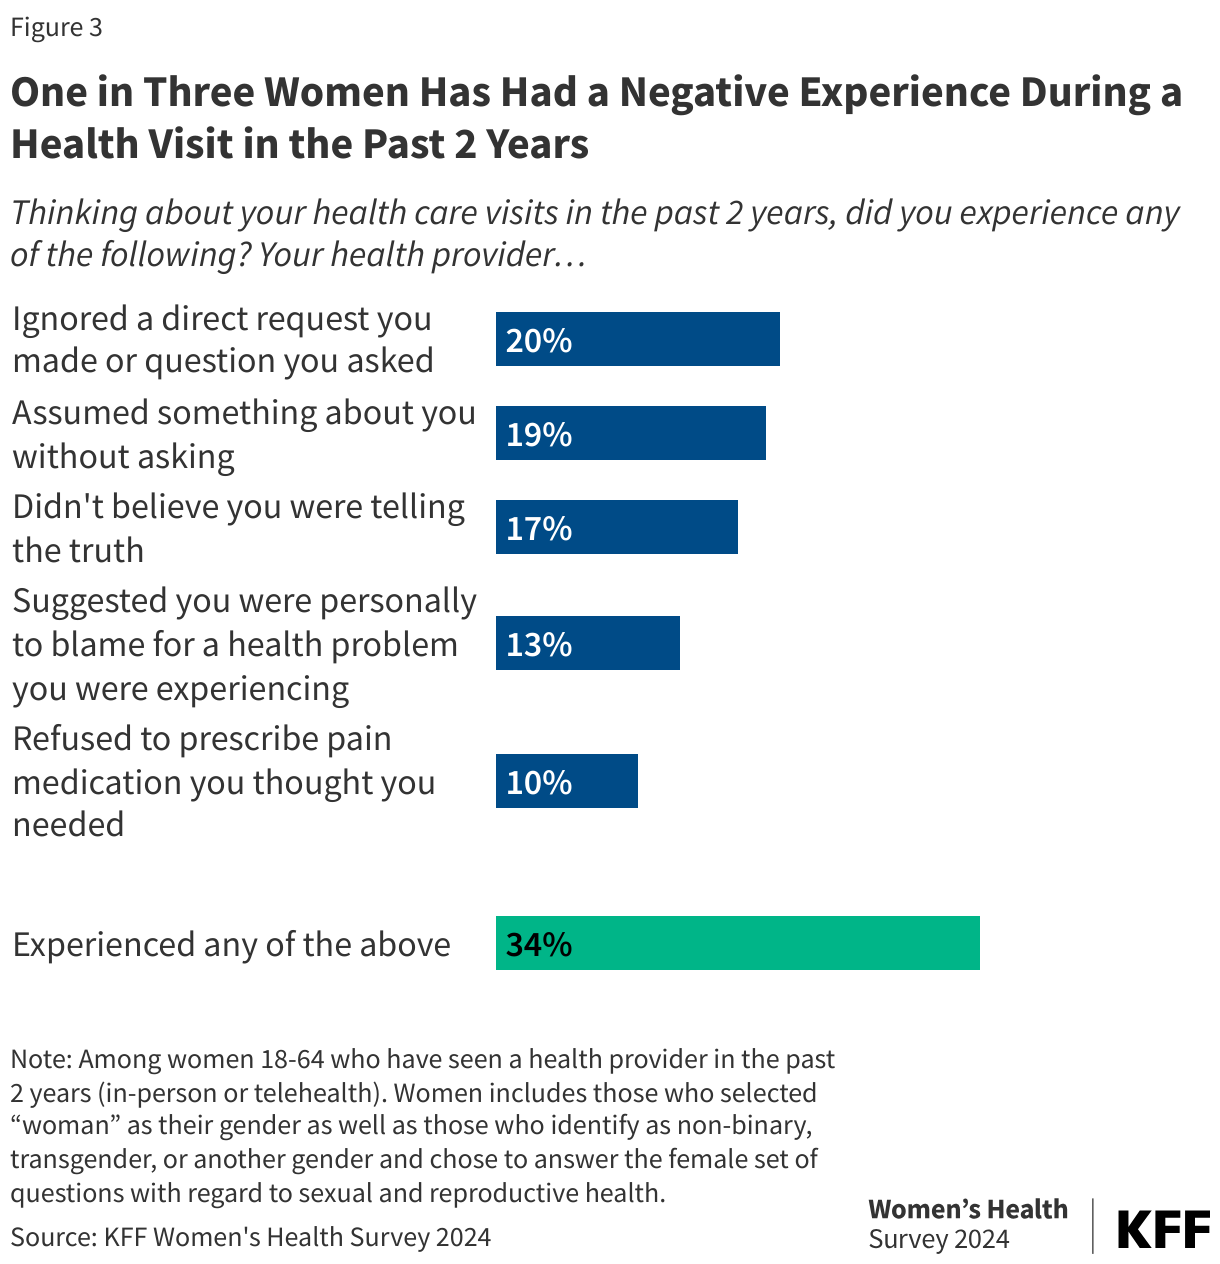
One in three women (34%) who have seen a provider in the past two years report having at least one of several negative experiences (Figure 3). One in five women (20%) said a health provider has ignored a direct request they made or question they asked, and another one in five (19%) report that a provider has assumed something about them without asking. Nearly one in five women say that a provider didn’t believe they were telling the truth, and one in seven (13%) say their provider suggested they were personally to blame for a health problem they were experiencing. One in 10 women say their provider has refused to prescribe them pain medication they thought they needed.

One in Three Women Has Had a Negative Experience During a Health Visit in the Past 2 Years (Bar Chart)

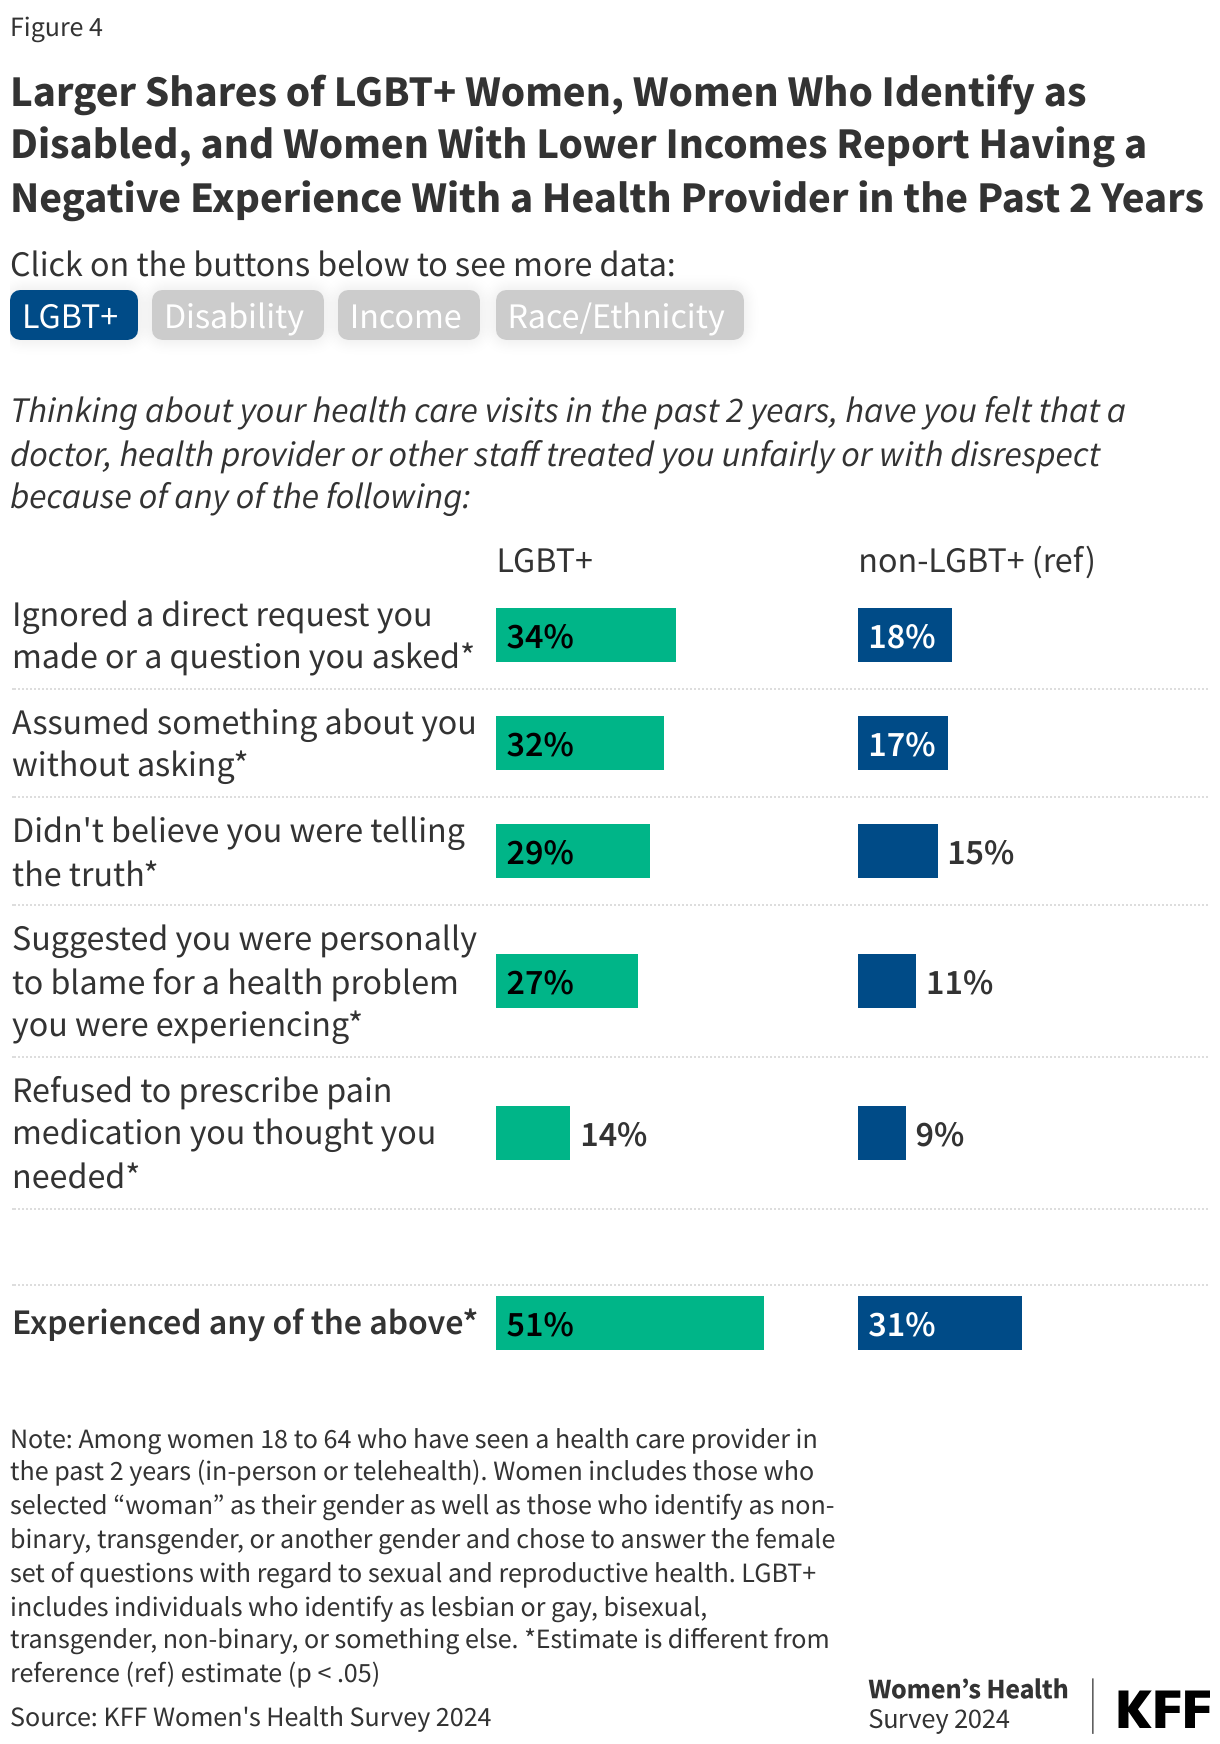
Significantly larger shares of LGBT+ women and women who identify as disabled have had a negative experience with a health care provider in the past two years (Figure 4). About half of LGBT+ women (51%) and women with disabilities (47%) report having had a negative experience with a health provider in the past two years. Across all five of the negative experiences asked about on the survey, larger shares of LGBT+ women and women who identify as disabled say they have experienced each compared to non-LGBT+ women and women who do not identify as disabled. Prior KFF research has found that LGBT+ adults are more likely than non-LGBT+ adults to report adverse consequences because of negative interactions with health providers and are more likely to take steps to mitigate or prepare for unfair treatment when receiving care.

Similarly, larger shares of women with lower incomes report having had a negative experience with a health provider in the past two years compared to women with higher incomes.

Larger Shares of LGBT+ Women, Women Who Identify as Disabled, and Women With Lower Incomes Report Having a Negative Experience With a Health Provider in the Past 2 Years (Split Bars)

Percent of Women Who Have Seen a Doctor or Health Provider in the Past Two Years, Either In-Person or Over the Phone/ Video (Bar Chart)

Congressional District Interactive Map: Medicaid Enrollment by Eligibility Group

Published: Mar 11, 2025

There are several options under consideration in Congress to significantly reduce Medicaid spending to help pay for tax cuts, with the recently passed House budget resolution targeting cuts to Medicaid of up to $880 billion or more over a decade. Medicaid is the primary program providing comprehensive health and long-term care to 83 million people living in the U.S (particularly those with low-incomes) and accounts for nearly $1 out of every $5 spent on health care. Medicaid is administered by states within broad federal rules and jointly funded by states and the federal government, meaning restrictions in federal Medicaid spending could leave states with tough choices on how to offset reductions through cuts to Medicaid, cuts to other programs, or tax increases.

In the months ahead, members of Congress will be considering and voting on various proposals to cut the Medicaid program. President Trump and Speaker Johnson have promised to leave Medicaid intact, cutting only fraud, waste, and abuse. However, if Medicaid is cut by $880 billion over 10 years, that would reduce federal spending by 13% relative to KFF’s projections of Medicaid spending under current law (which estimate spending growth using the Congressional Budget Office’s Medicaid projections). Cuts of that magnitude would force states to raise new revenues or reduce Medicaid spending by eliminating coverage for some people, covering fewer services, or cutting payment rates for providers.

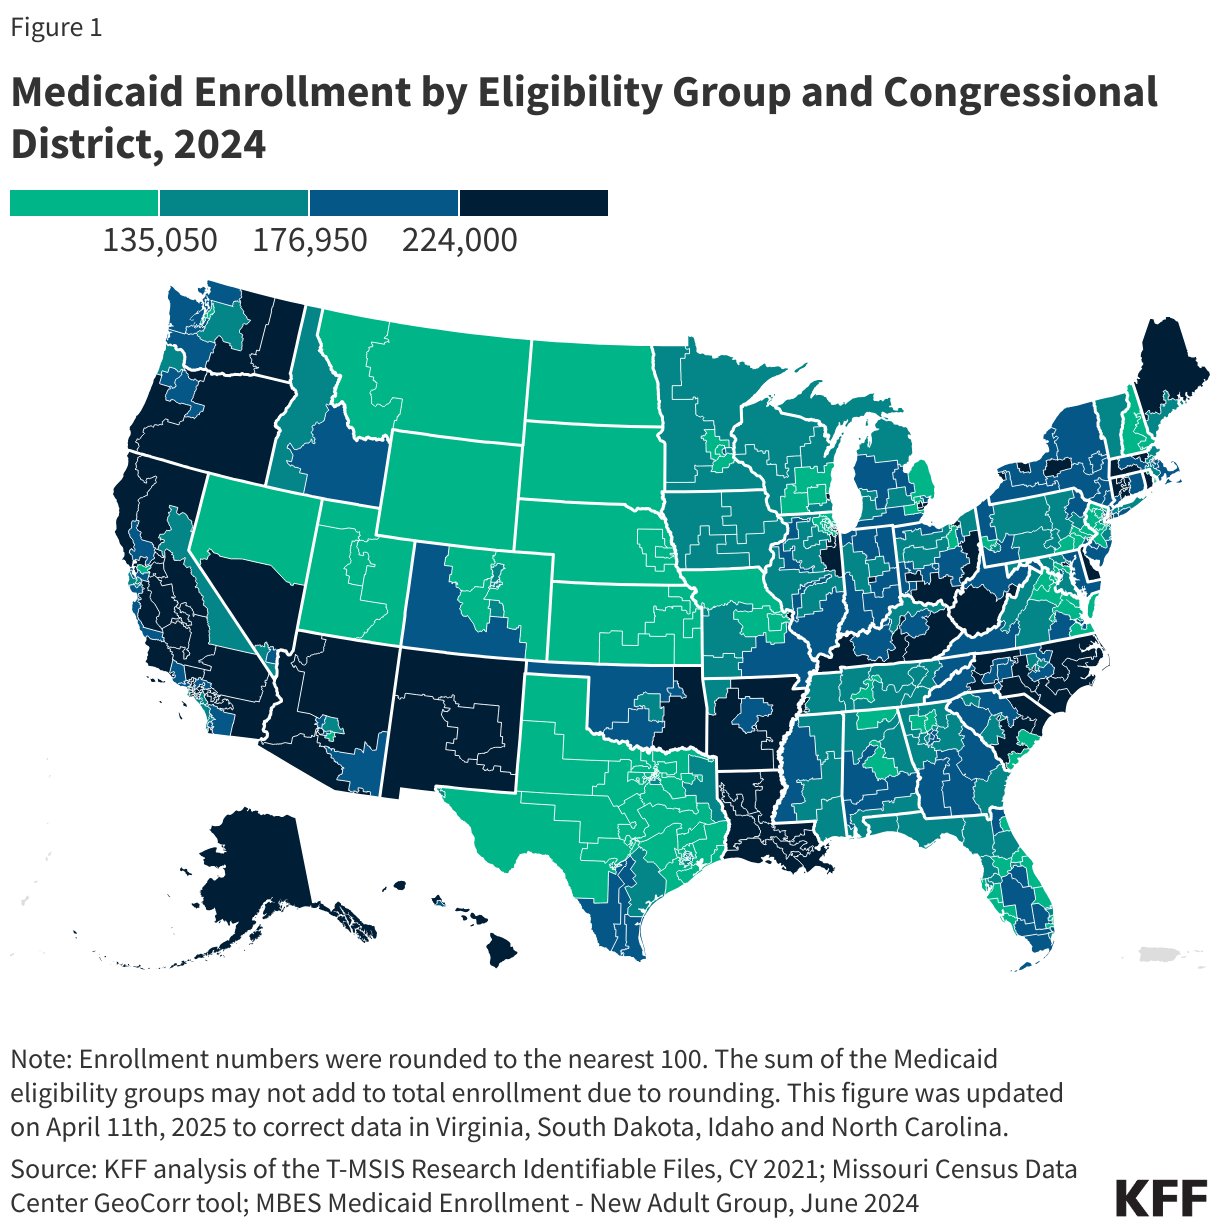
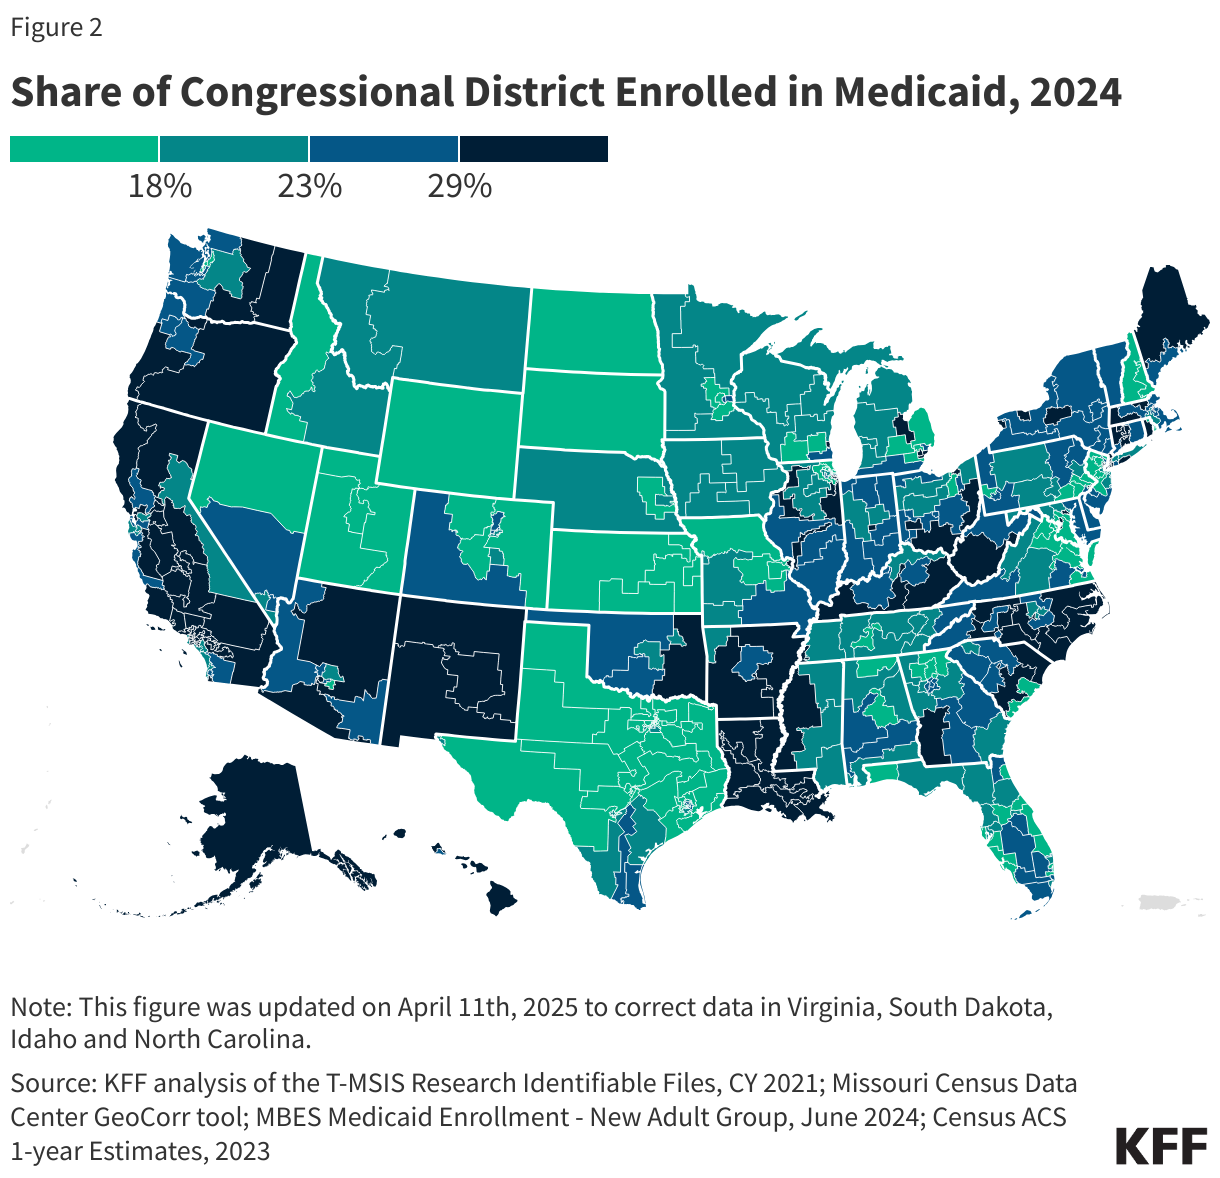
The interactive maps below illustrate how many people are enrolled in Medicaid and what percentage of the population is enrolled in Medicaid for each congressional district. Enrollment numbers include enrollment in each of the major Medicaid eligibility groups, highlighting whose coverage may be at risk in upcoming deliberations. Key takeaways include:

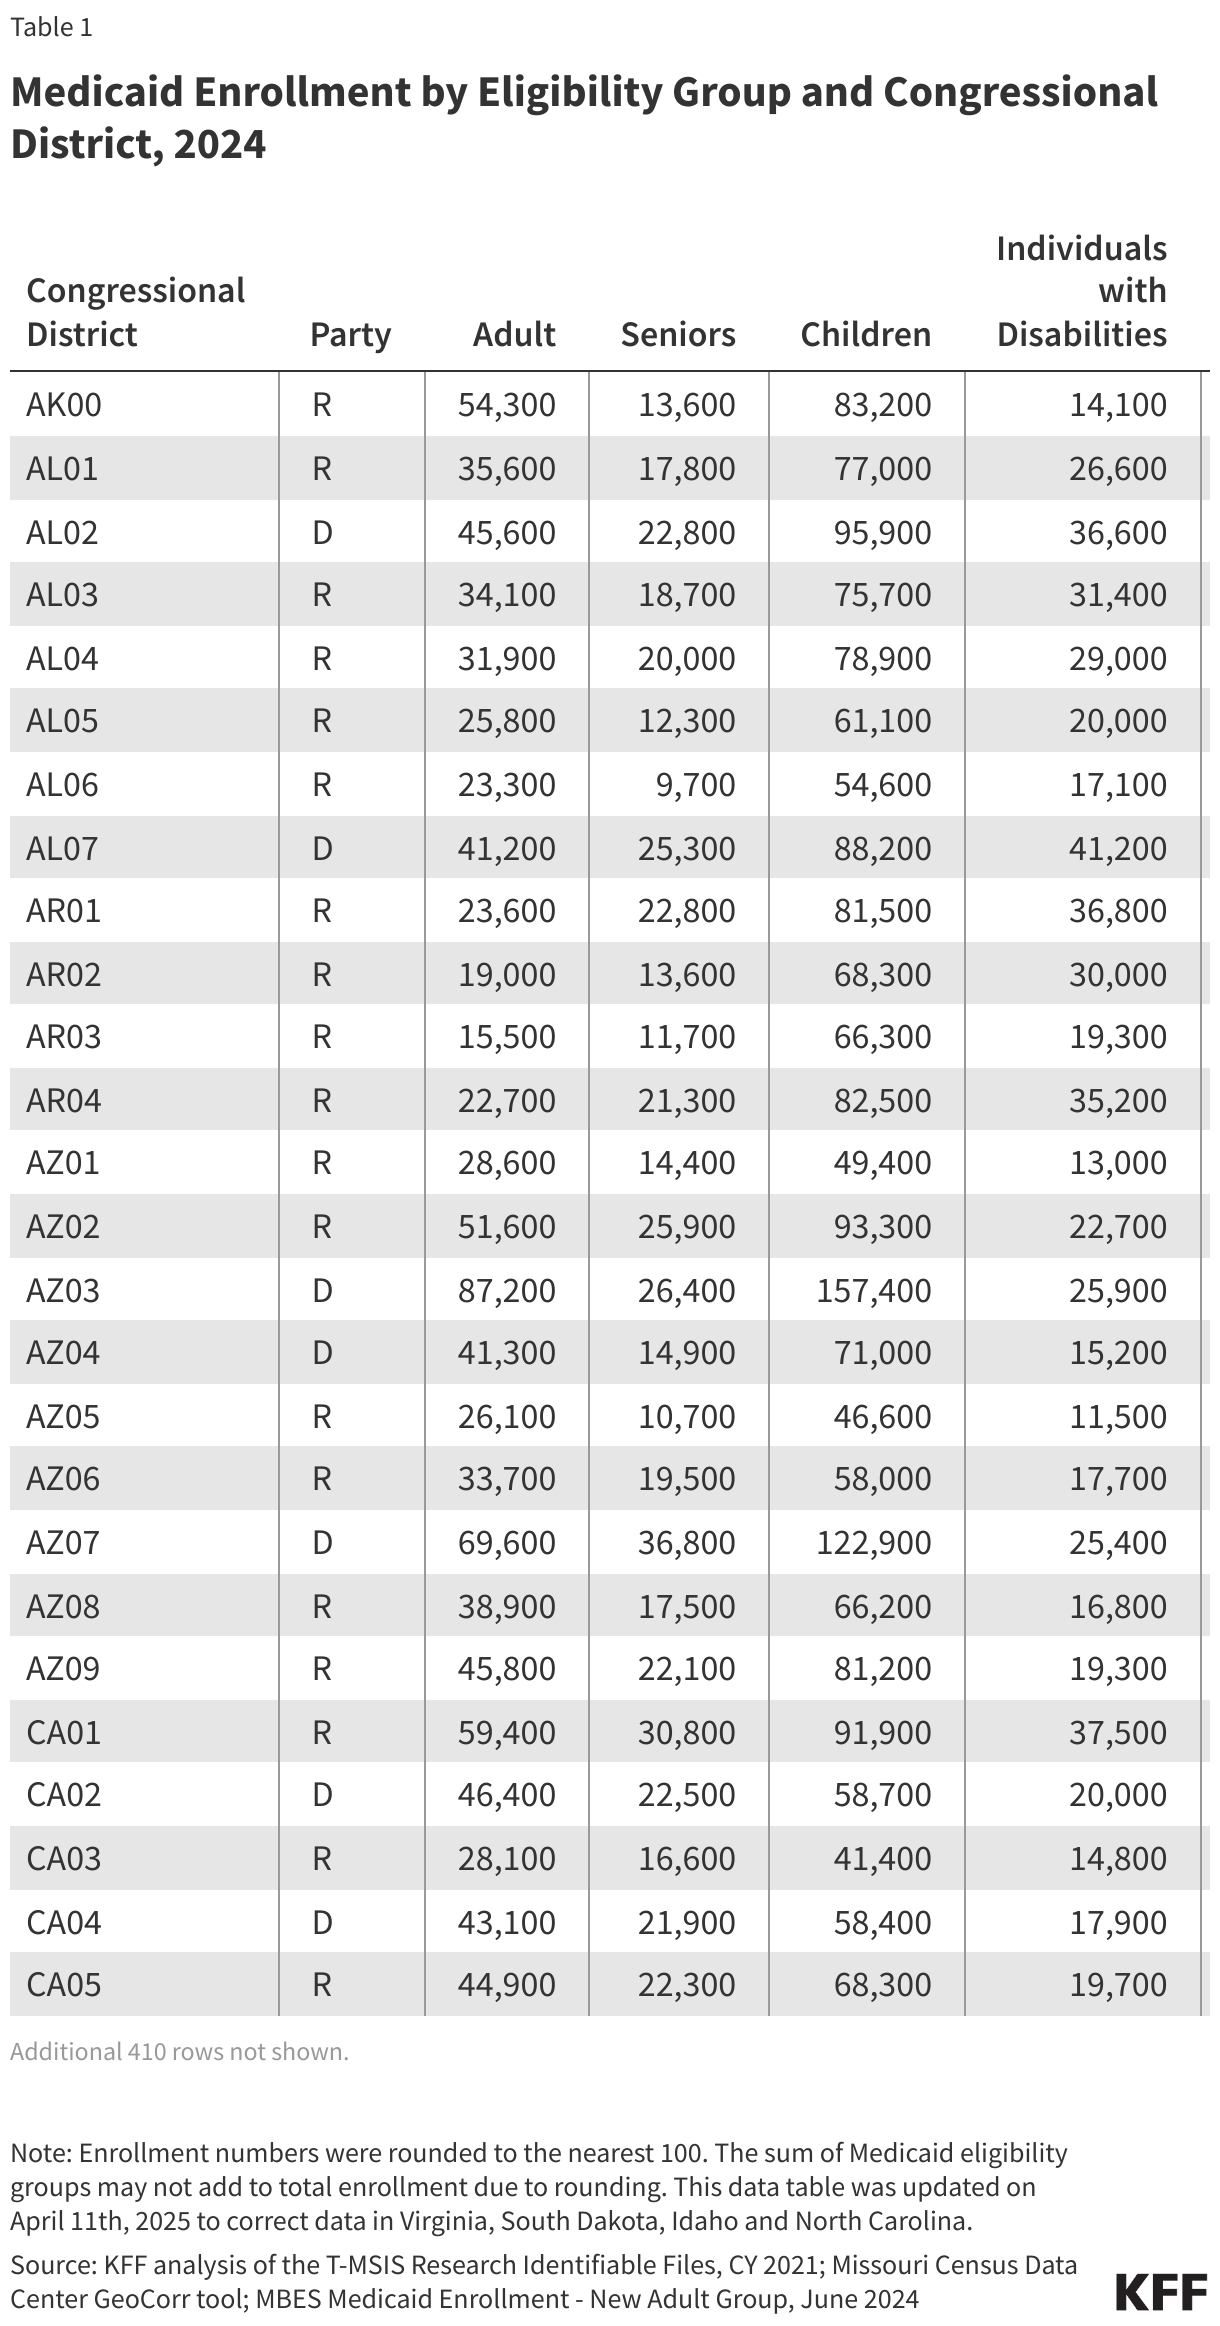
  • There are 53,000 or more Medicaid enrollees living in each congressional district, with enrollment as high as 510,000 in some districts. In each congressional district, there are at least: 3,500 Medicaid enrollees ages 65 and older, 2,000 enrollees eligible because of a disability, 7,400 child enrollees, and 5,300 other adult enrollees.
  • In half of all Republican congressional districts, 21% or more of the population is enrolled in Medicaid; and in half of all Democratic districts, 26% or more of the population is enrolled in Medicaid.
  • Republican districts have a higher share of Medicaid enrollees who are children and who are eligible because of a disability compared with Democratic districts that have a higher share of expansion enrollees and adults ages 65 and older.
  • The top 10 Republican districts with the highest number of Medicaid enrollees are: CA22 (495,200); KY05 (397,800); CA23 (355,400); CA01 (316,800); LA05 (312,600); NY11 (304,100); LA03 (303,000); WV01 (300,100); LA04 ( 288,400); and WA04 (278,000).
  • The top 10 Democratic districts with the highest number of Medicaid enrollees are: NY15 (510,100); CA43 (473,500); CA37 (470,600); CA21 (462,900); CA34 (453,800); NY13 (426,200); NY14 (423,800); CA13 (417,800); AZ03 (410,900) and CA25 (397,400).
Medicaid Enrollment by Eligibility Group and Congressional District, 2024

Share of Congressional District Enrolled in Medicaid, 2024

Medicaid Enrollment by Eligibility Group and Congressional District, 2024

Methods

Data: To calculate Medicaid enrollment by eligibility group and congressional district, this analysis uses the 2021 T-MSIS Research Identifiable Demographic-Eligibility and Claims Files, the Missouri Census Data Center’s Geocorr 2022 data, the Medicaid new adult group enrollment data collected through MBES for June 2024 (downloaded in February 2025), and the Census American Community Survey 1-Year Estimates, 2023.

Assigning Medicaid Enrollees to Congressional Districts: This analysis used the Missouri Census Data Center’s Geocorr 2022 tool to create a zip code-to-congressional district crosswalk and a county-to-congressional district crosswalk. Using those crosswalks, we assigned Medicaid enrollees to 119th congressional districts in the T-MSIS data.

In some cases, a county or a zip code can be split among multiple congressional districts. In those cases, enrollees were randomly assigned to a congressional district based on an allocation factor from the Geocorr 2022 tool that is calculated using the 2020 decennial census.

For each state, we calculated the percentage of people living in a zip code that aligned with a single congressional district and the percentage of people living in a county that aligned with a single congressional district. In most states, the zip code alignment was better, and we used the zip code crosswalk. In 9 states (AL, IA, KY, MS, MT, NC, NE, RI, and WV), the county alignment was better, so we used the county code crosswalk.

We applied the T-MSIS distributions of enrollees in eligibility groups and congressional districts to the MBES administrative enrollment data. Those data report enrollment for adults eligible through the Affordable Care Act (ACA) and for all other Medicaid enrollees on a quarterly basis.

Expansion States with Missing/Incomplete Expansion Data: Idaho and Virginia have data quality issues in the reporting of their ACA adult population in 2021 T-MSIS data, and North Carolina and South Dakota had not yet expanded Medicaid as of 2021. In those four states, we used the distribution of non-disabled adult enrollment to apportion ACA enrollment across congressional districts.

Poll Finding

KFF Health Tracking Poll February 2025: The Public’s Views on Potential Changes to Medicaid

Published: Mar 7, 2025

Key Takeaways

  • Medicaid WatchAs Congress considers changes to the Medicaid program as part of budget conversations, the latest KFF Health Tracking Poll finds that fewer than one in five adults (17%) want to see Medicaid funding decreased, and most think funding should either increase (42%) or be kept about the same (40%). Majorities of Democrats, Republicans, independents, Trump voters, and adults living in rural areas say Medicaid funding should either increase or be kept about the same, though about one-third of Republicans want spending to decrease. The public’s staunch opposition to Medicaid cuts likely reflects the fact that most people have a connection to the program. About half (53%) of adults, including a similar share of those living in rural areas, say they or a family member has received help from Medicaid at some point. This includes about four in ten Republicans (44%) and those who voted for President Trump in 2024 (45%). Regardless of whether they have a connection to the program, nearly all (97%) adults say Medicaid is at least somewhat important for people in their local community, including three-quarters who say it is “very important.” Large majorities across partisans, those who voted for President Trump in 2024, and adults living in rural areas say the program is “very important” for their local community. Most of the public also says Medicaid is important to them and their families, including four in ten Republicans and those who voted for President Trump in the 2024 election. Recent KFF focus groups of Medicaid enrollees further emphasize the program’s importance to people and their families.
  • Cuts to federal Medicaid funding could have significant impacts on rural hospitals and providers, where many residents already face limited access to care. One third (34%) of rural residents say there are not enough hospitals in their community to serve local residents, while about half say there are not enough primary care providers (49%) and about seven in ten say there are not enough mental health providers (67%) or specialists (71%) in their community.
  • While Republicans in Congress have yet to put forth a bill specifying the changes they would make to Medicaid, some of the options that have been discussed include implementing work requirements and scaling back the Affordable Care Act (ACA)’s expansion of Medicaid. Overall, about six in ten (62%) adults support work requirements, which would require nearly all adults to be working or looking for work in order to have health insurance through Medicaid, while a majority (59%) oppose eliminating the 90% federal match rate for adults covered under the ACA Medicaid expansion. However, public opinion on both proposals is malleable when people hear arguments or are given more information.
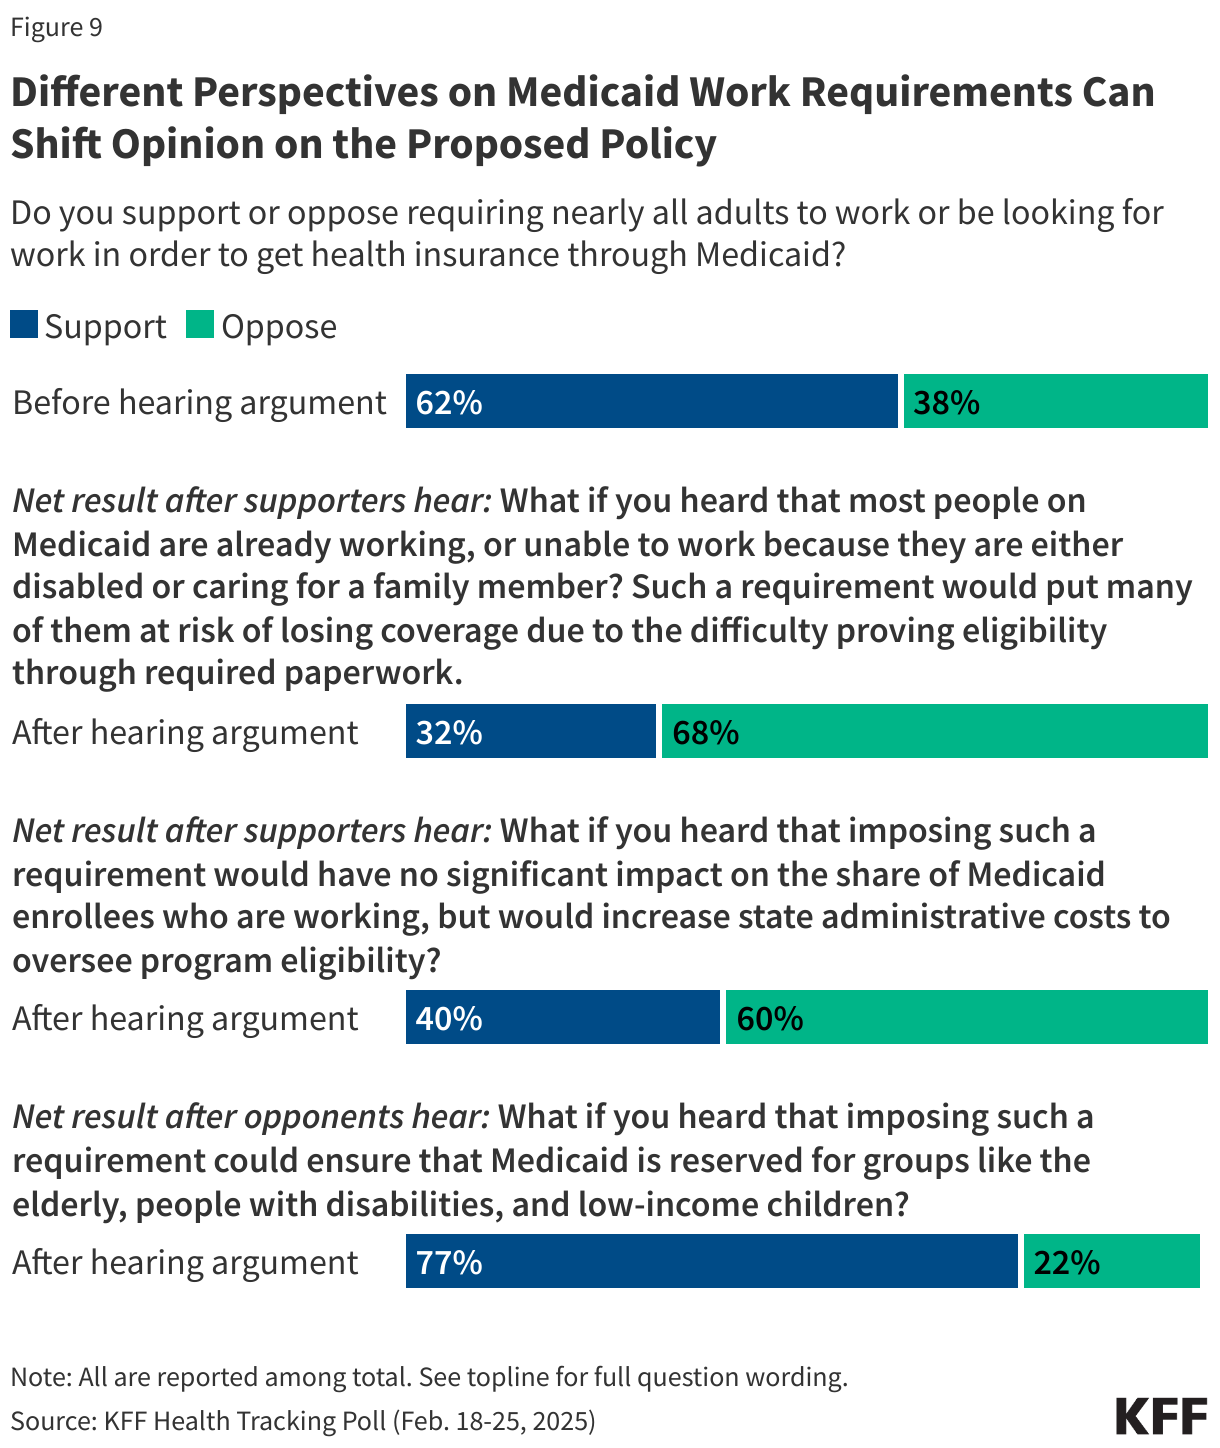
  • For example, a majority (62%) of the public incorrectly believe that most working-age adults on Medicaid are unemployed, and some people change their views on imposing work requirements when they hear about the potential implications. Overall support for work requirements drops from 62% to 32% when those who initially support the proposal hear that most people on Medicaid are already working and many would risk losing coverage because of the burden of proving eligibility through paperwork. Overall support also drops to 40% after supporters hear that there would be an increase in state administrative costs to oversee the work requirement. On the other hand, when opponents of work requirements hear the argument made by supporters that imposing such requirements could allow Medicaid to be reserved for groups like the elderly, people with disabilities, and low-income children, support for work requirements increases from 62% to 77%.
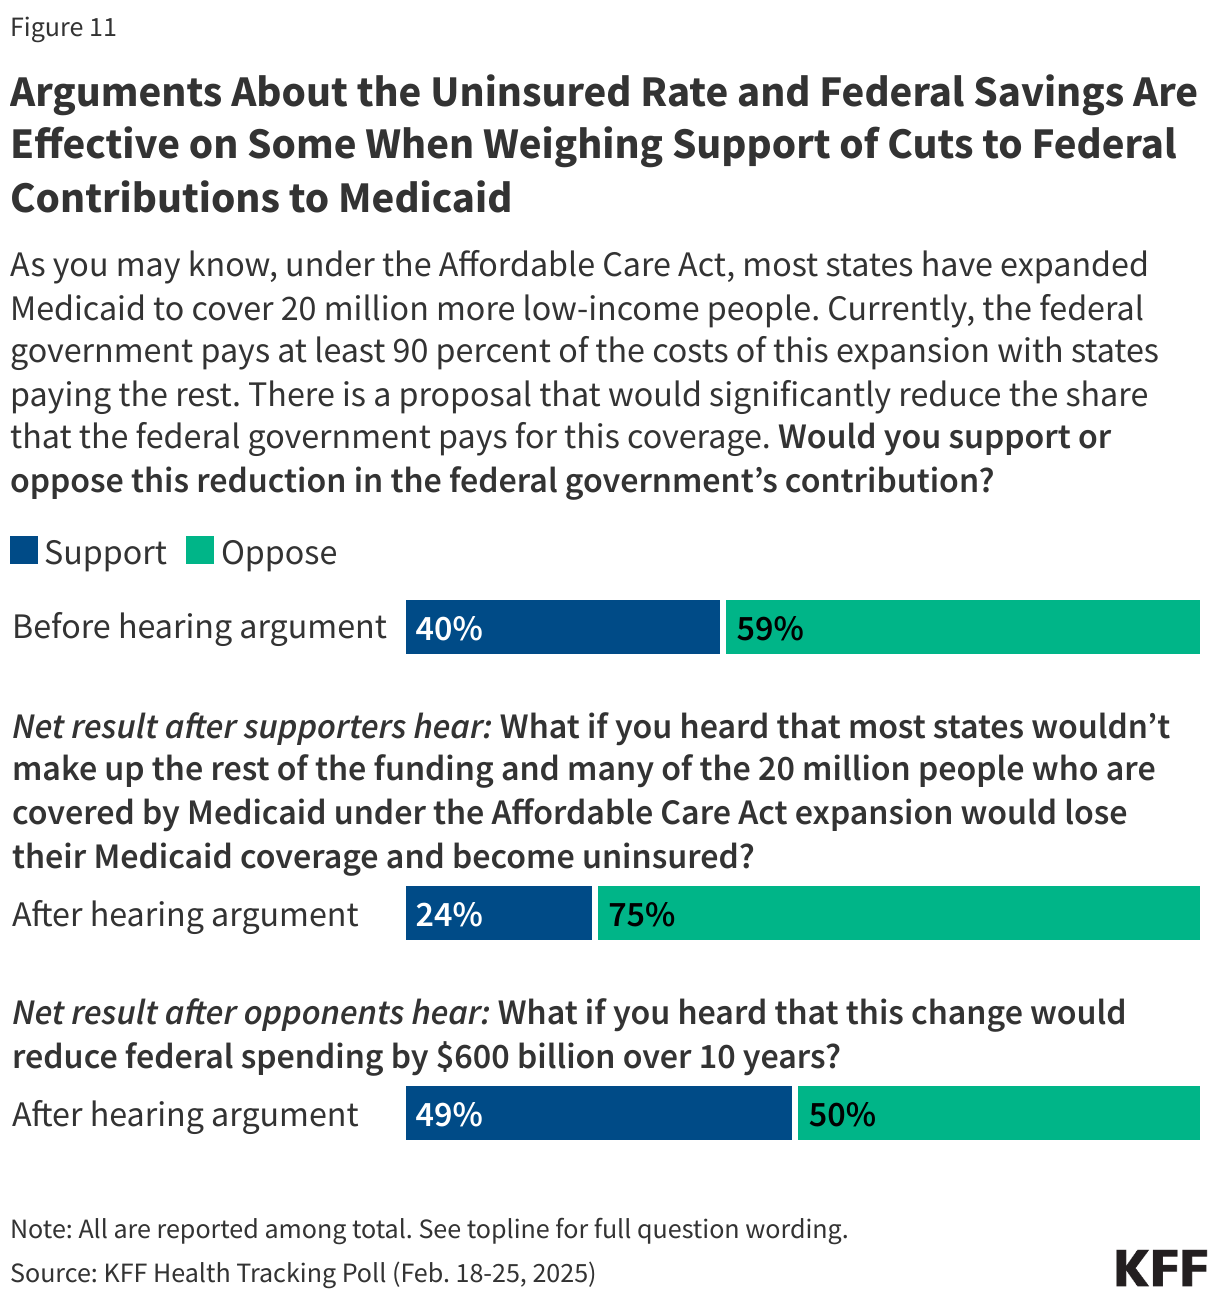
  • Views on eliminating the 90% federal match rate for the ACA Medicaid expansion are also somewhat malleable when more information is presented. When supporters of the proposal hear that most states wouldn’t be able to make up the funding and that 20 million people would likely become uninsured as a result, overall support drops from 40% to 24%. On the other hand, when opponents of the proposal hear that it would reduce federal spending by $600 billion over ten years, support increases somewhat from 40% to 49%, with 50% overall continuing to oppose the proposal.
  • As Republicans and President Trump continue to claim that Medicaid won’t change beyond addressing “waste, fraud, and abuse” and falsely assert that undocumented immigrants are on the program, public confusion about who is covered by Medicaid and what services it covers persists. Slightly less than half (47%) of adults are either unsure or incorrectly believe undocumented immigrants are eligible for health insurance programs paid for the federal government, although they are not.1  Additionally, most of the public does not know that Medicaid pays for nursing home care and other extended long-term care services for low-income, elderly, and disabled people.

Medicaid in Rural America

Medicaid provides health care coverage to one in five people in the United States and Medicaid covers a higher share of children and adults in small towns and rural areas compared to metro areas. Among Medicaid enrollees, 17% live in rural areas. Rural communities generally have higher poverty rates and worse health outcomes compared to urban residents. Additionally, rural residents face a number of barriers to accessing health care including longer travel distances to hospitalsprovider shortagesless access to employer-sponsored health coverage, and higher uninsured rates. Medicaid helps to address some of these barriers to access and provides health care coverage to millions of rural adults, children, pregnant women, and individuals with disabilities who do not have access to affordable private coverage. Medicaid covered 1.5 million births in 2023—representing 41% of all U.S. births—and financed nearly half (47%) of births in rural areas. In states that expanded Medicaid coverage under the ACA, research shows decreased uncompensated care costs (UCC) overall and for specific types of hospitals, including those in rural areas. Any cuts to Medicaid being considered by Congress could have implications for residents in rural areas.

In order to provide a representative look at how rural residents view recent proposed changes to the program, the KFF Health Tracking Poll included interviews with 337 rural adults which includes an oversample of 170 rural residents who currently have Medicaid coverage. For more information about the sample of rural residents please see the rural topline.

Views on Medicaid Spending and Importance

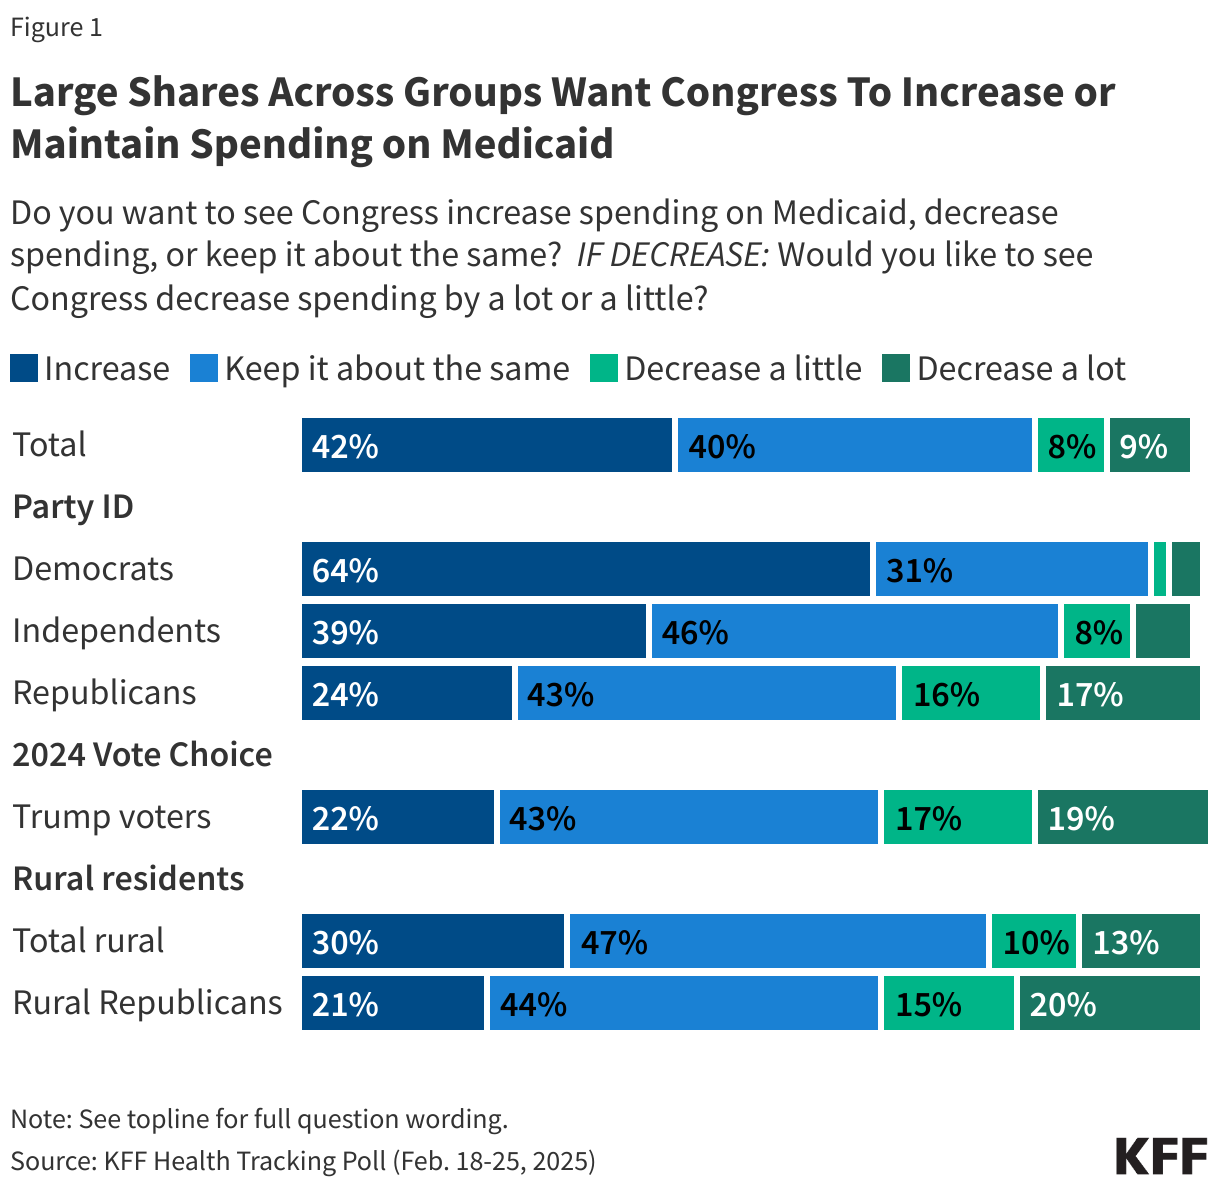
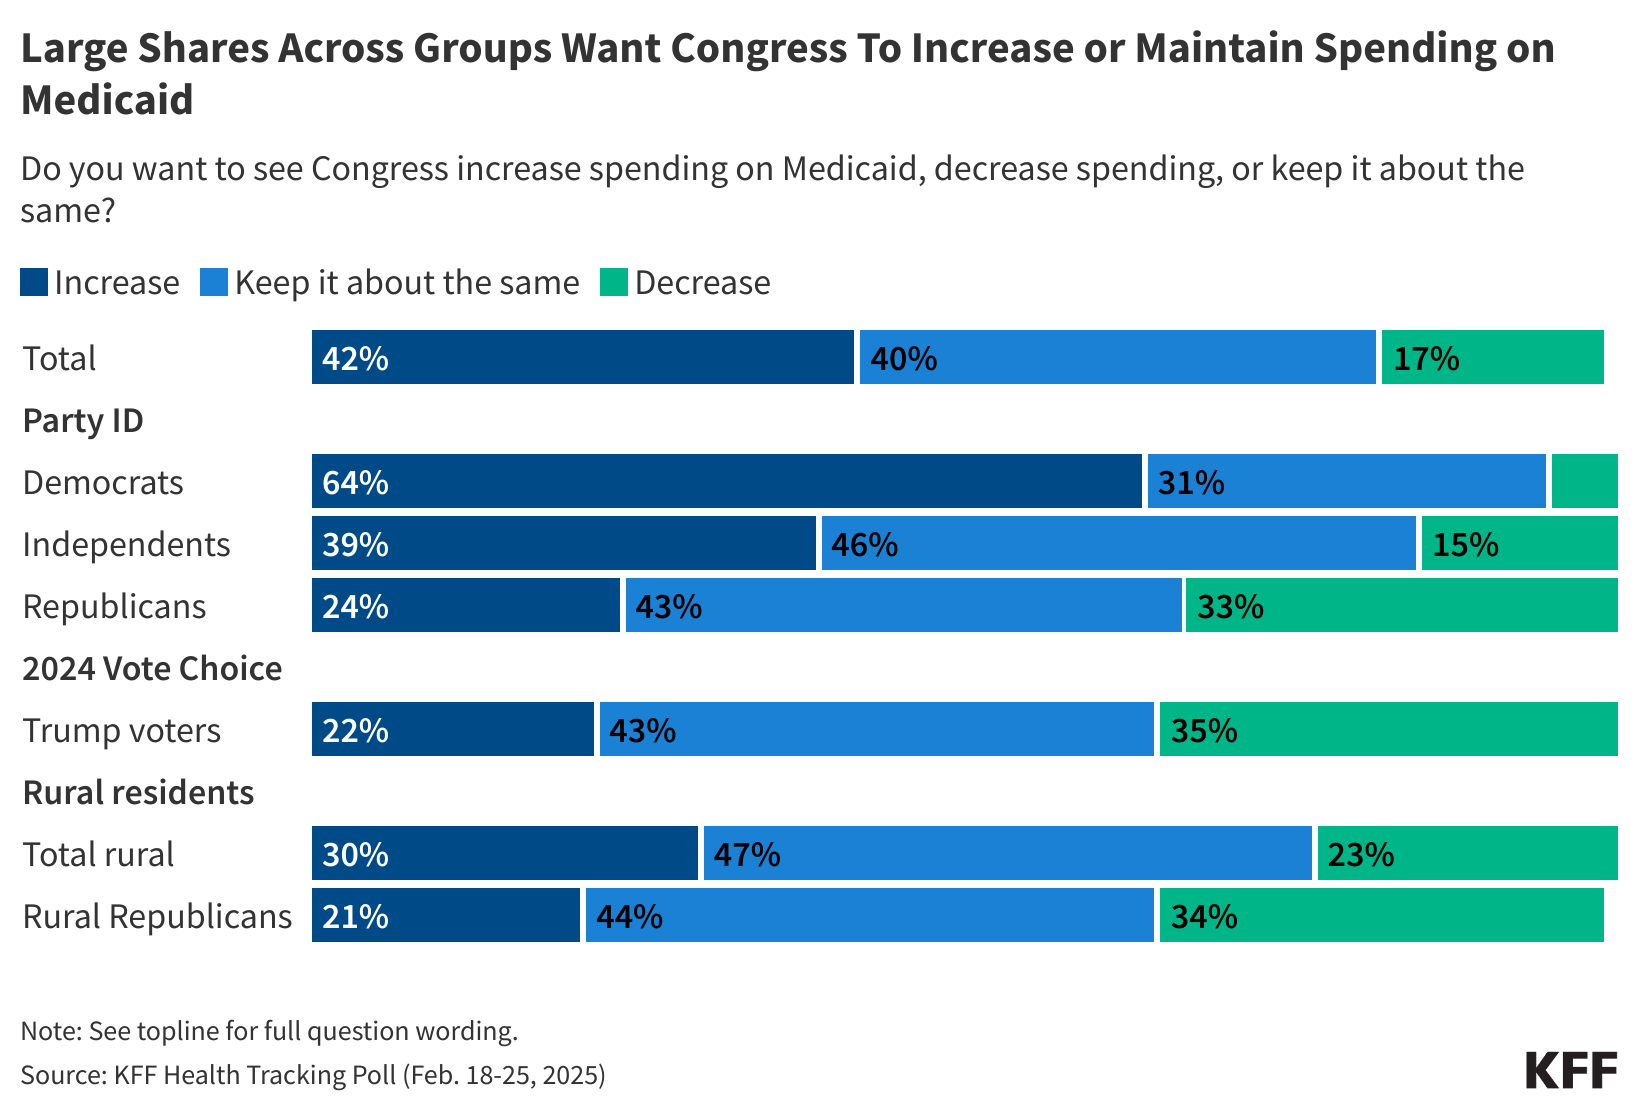
As the debate over potential changes to Medicaid continues in Congress, the latest KFF Health Tracking Poll finds that fewer than one in five (17%) say they want to see Medicaid funding decreased. In fact, most people say funding for Medicaid should either increase (42%) or stay about the same (40%). A majority of Democrats (64%) want Congress to increase spending on Medicaid, as do about four in ten independents (39%). Support for decreasing Medicaid spending is somewhat higher among key groups of President Trump’s supporters, but still about two-thirds (65%) of Trump 2024 voters, and two-thirds (67%) of Republicans want spending to increase or be kept about the same. About three in four total rural residents (77%) say funding should increase or stay the same, as do two-thirds (66%) of rural Republicans.

Large Shares Across Groups Want Congress To Increase or Maintain Spending on Medicaid

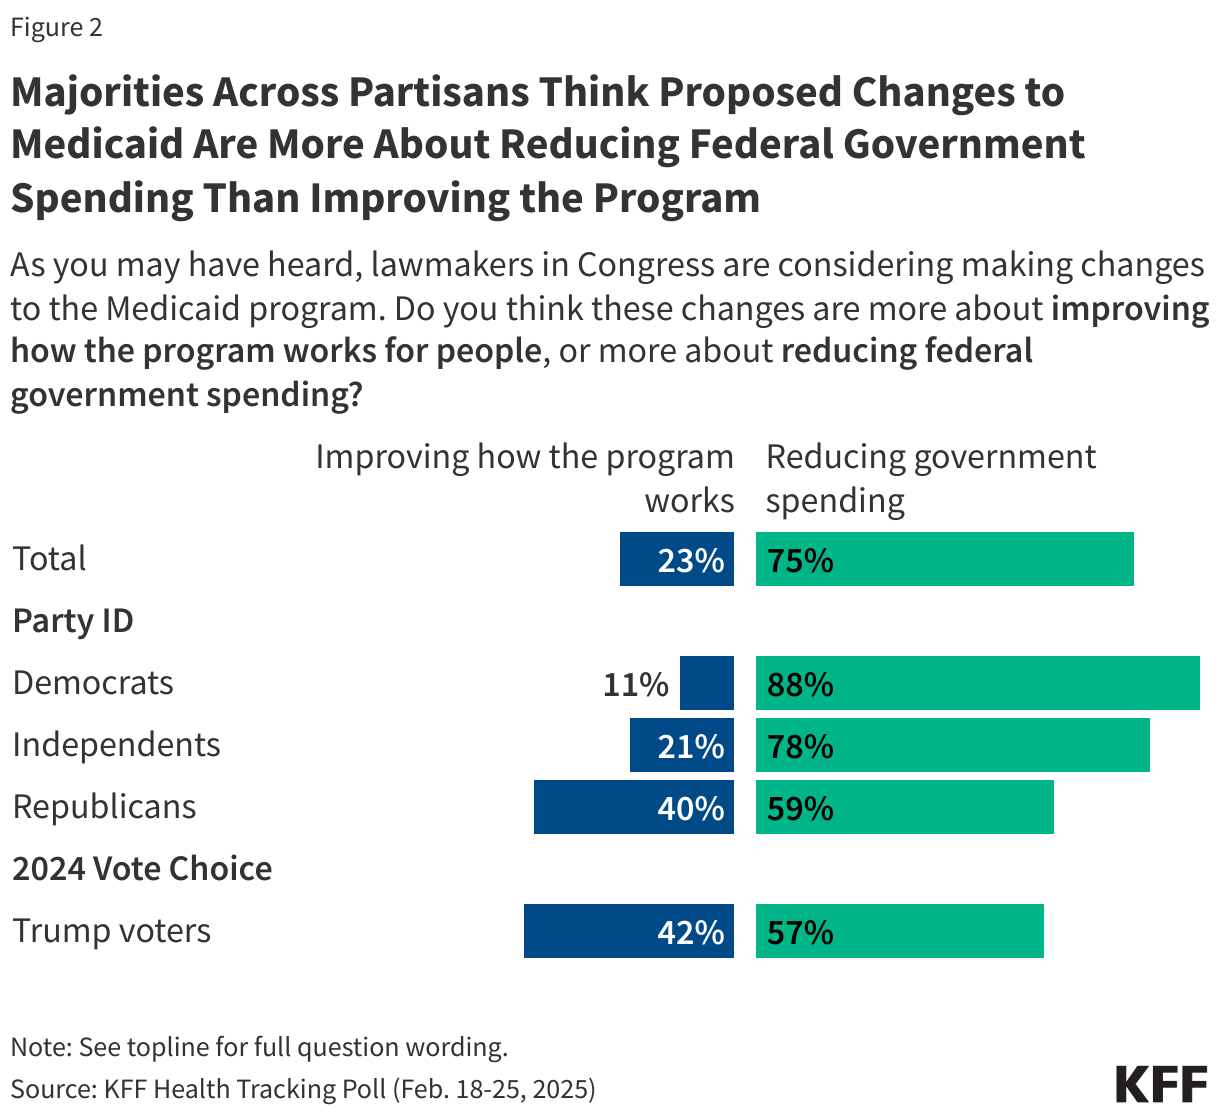
While many Republicans legislators, President Trump, and Elon Musk have said changes to Medicaid will help root out “waste, fraud, and abuse” and make the program “more effective and better,” about three times as many people think the changes under consideration are more about “reducing federal government spending” than “about improving how the program works for people” (75% vs. 23%). Notably, this view is held by a majority of those who say they voted for President Trump in the 2024 election (57%) as well as majorities across partisans, though Democrats and independents are much more likely to say the changes are about reducing federal spending (88% and 78%, respectively) than Republicans (59%).

Majorities Across Partisans Think Proposed Changes to Medicaid Are More About Reducing Federal Government Spending Than Improving the Program

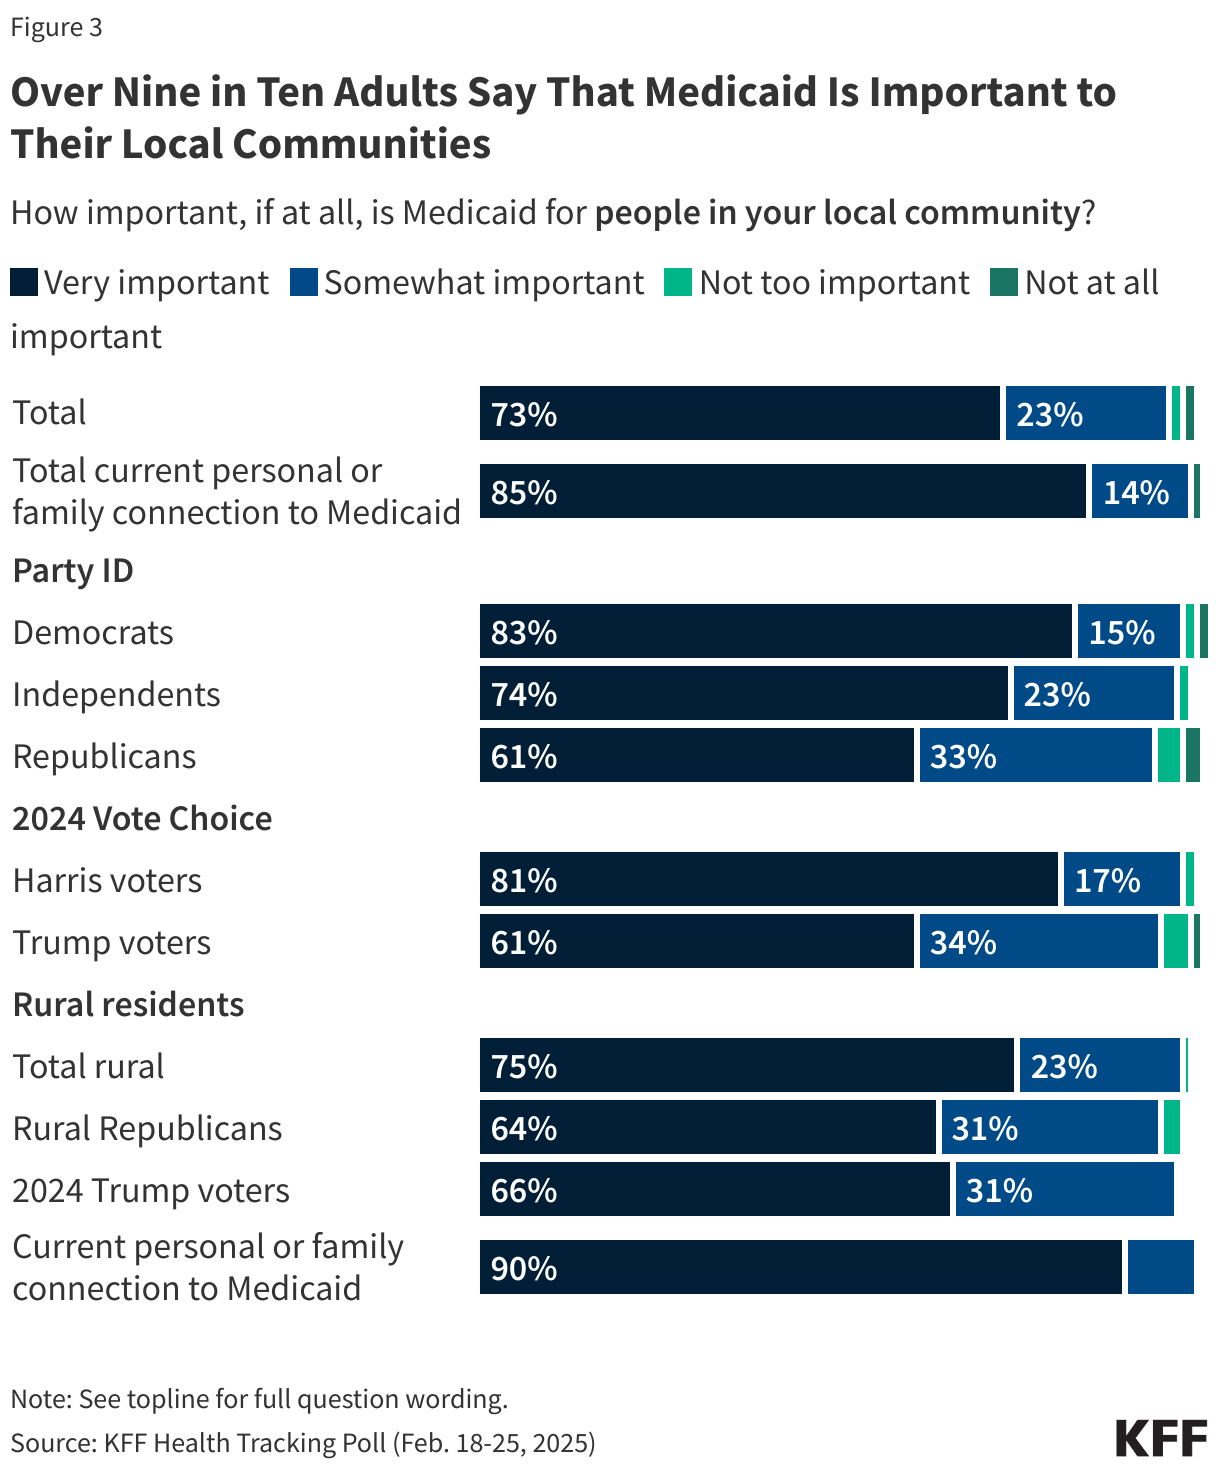
Opposition to a reduction in federal spending on Medicaid may reflect the fact that most people view Medicaid as important for their families and communities and most have a personal connection to the program. Nearly all (97%) adults say Medicaid is at least somewhat important for people in their local community, including about three in four (73%) who say it is “very important.” This includes majorities across partisans, Trump voters, as well as those with and without a personal connection to the program. Among those living in rural areas, three in four (75%) say Medicaid is “very important” for people in their local community– including about two in three Republicans (64%) and those who voted for President Trump in 2024 (66%).

Shows the share of adults who have a connection to the Medicaid program

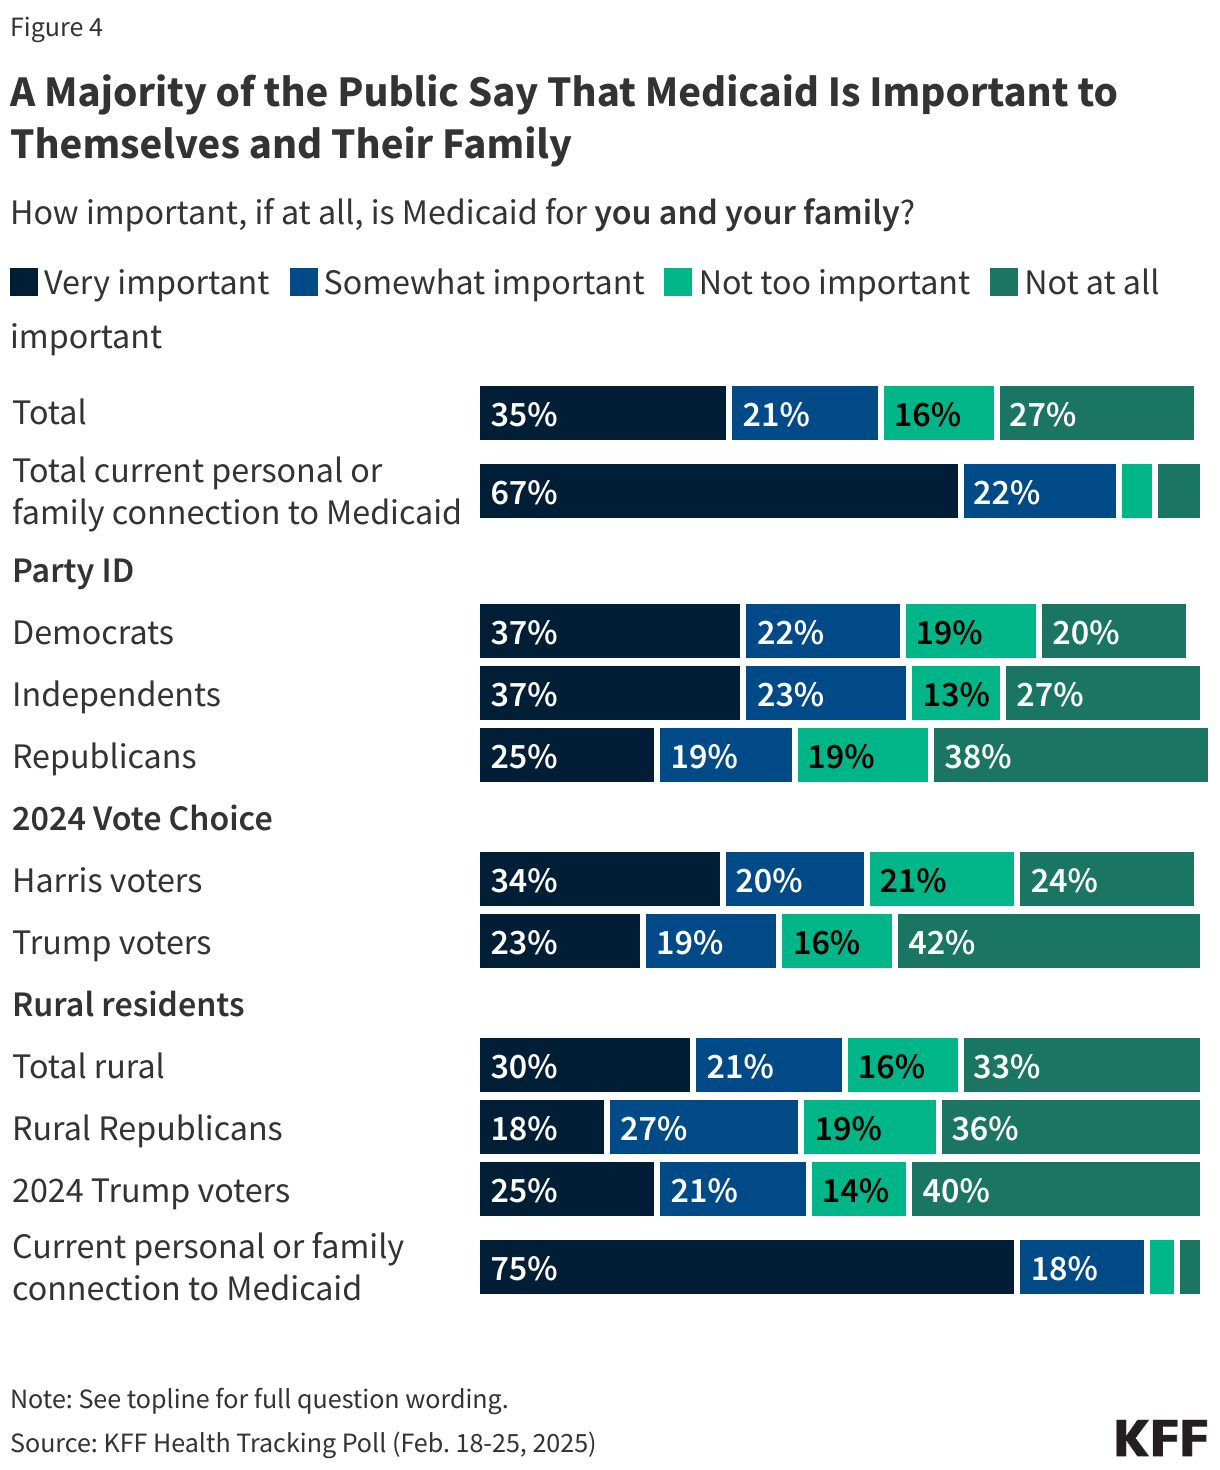
A majority (56%) of adults also say Medicaid is important for them and their family, including about a third (35%) who say it is “very important.” Among those who are currently enrolled in Medicaid or have a family member who is, about nine in ten (89%) say it is “very important” or “somewhat important” or them and their families. Overall, about four in ten (42%) adults who voted for President Trump in the 2024 election say Medicaid is important for them and their family, as do a similar share (44%) of Republicans. Among Trump voters and Republicans living in rural areas, similar shares say the same.

Shows the share of adults who have a connection to the Medicaid program

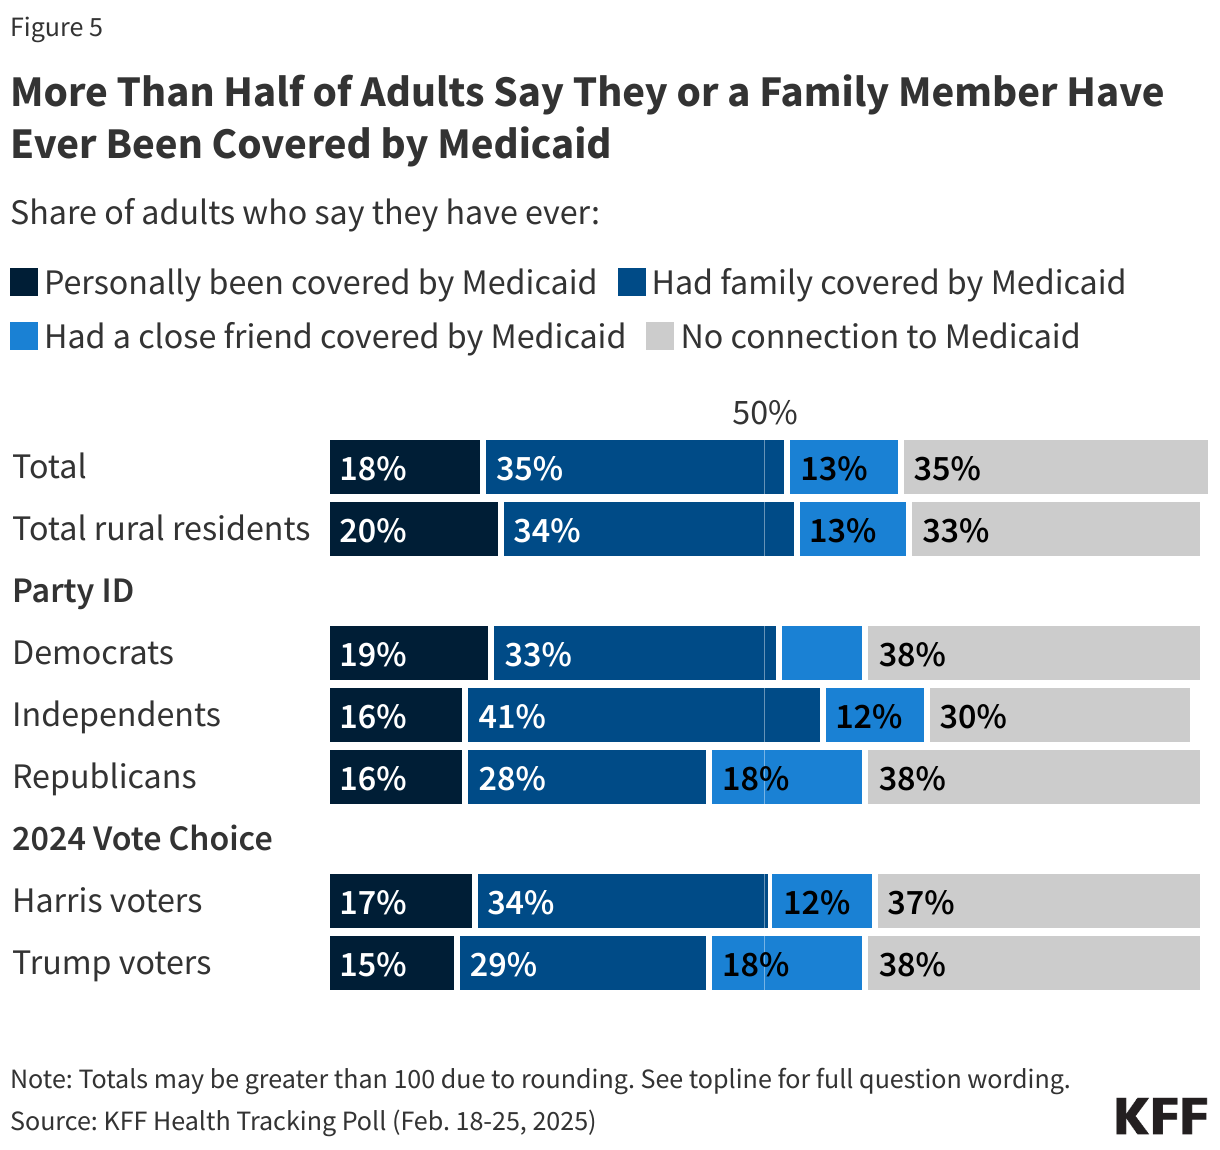
Most adults report some level of connection to the Medicaid program. More than half (53%) of adults say they (18%) or a family member (35%) have received help from Medicaid at some point. An additional 13% say a close friend has been covered by the program. Substantial shares of Democrats (52%), independents (57%), and Republicans (44%) say they or a family member has ever been covered by Medicaid, as do substantial shares of those who voted for President Trump (45%) and former Vice President Harris (51%), and those who live in rural areas (54%).

Shows the share of adults who have a connection to the Medicaid program

KFF analysis finds that a reduction in federal spending on the Medicaid program will likely have widespread implications, such as losses in coverage and problems for state budgets. Cuts to Medicaid could also lead to hospitals closing, fewer providers taking Medicaid insurance due to reductions in their payment rates, and other implications for how people access care in their communities, particularly for those living in rural areas. These implications come at a time when substantial shares of adults overall, as well as those with a current connection to Medicaid and those living in rural areas say there are not enough hospitals and providers to serve their communities.

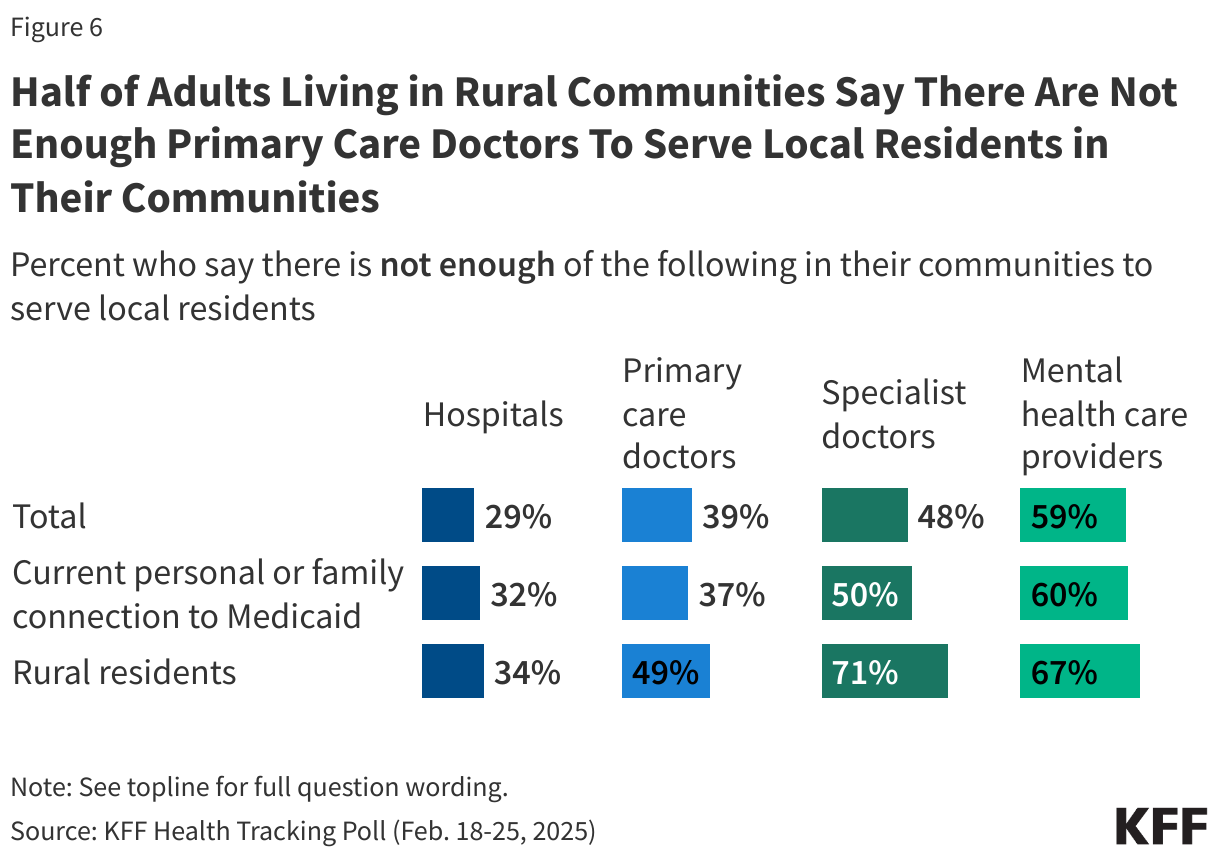
Three in ten (29%) adults overall, including 34% of those living in rural areas, say there are not enough hospitals to serve local residents in their communities. Even larger shares say there are not enough mental health providers (59%), specialist doctors (48%) and primary care doctors (39%) to serve their community’s needs. In rural areas, about half say there are not enough primary care providers (49%) and about seven in ten say there are not enough mental health providers (67%) or specialists (71%) in their community.

Shows the share of adults who have a connection to the Medicaid program

Work Requirements

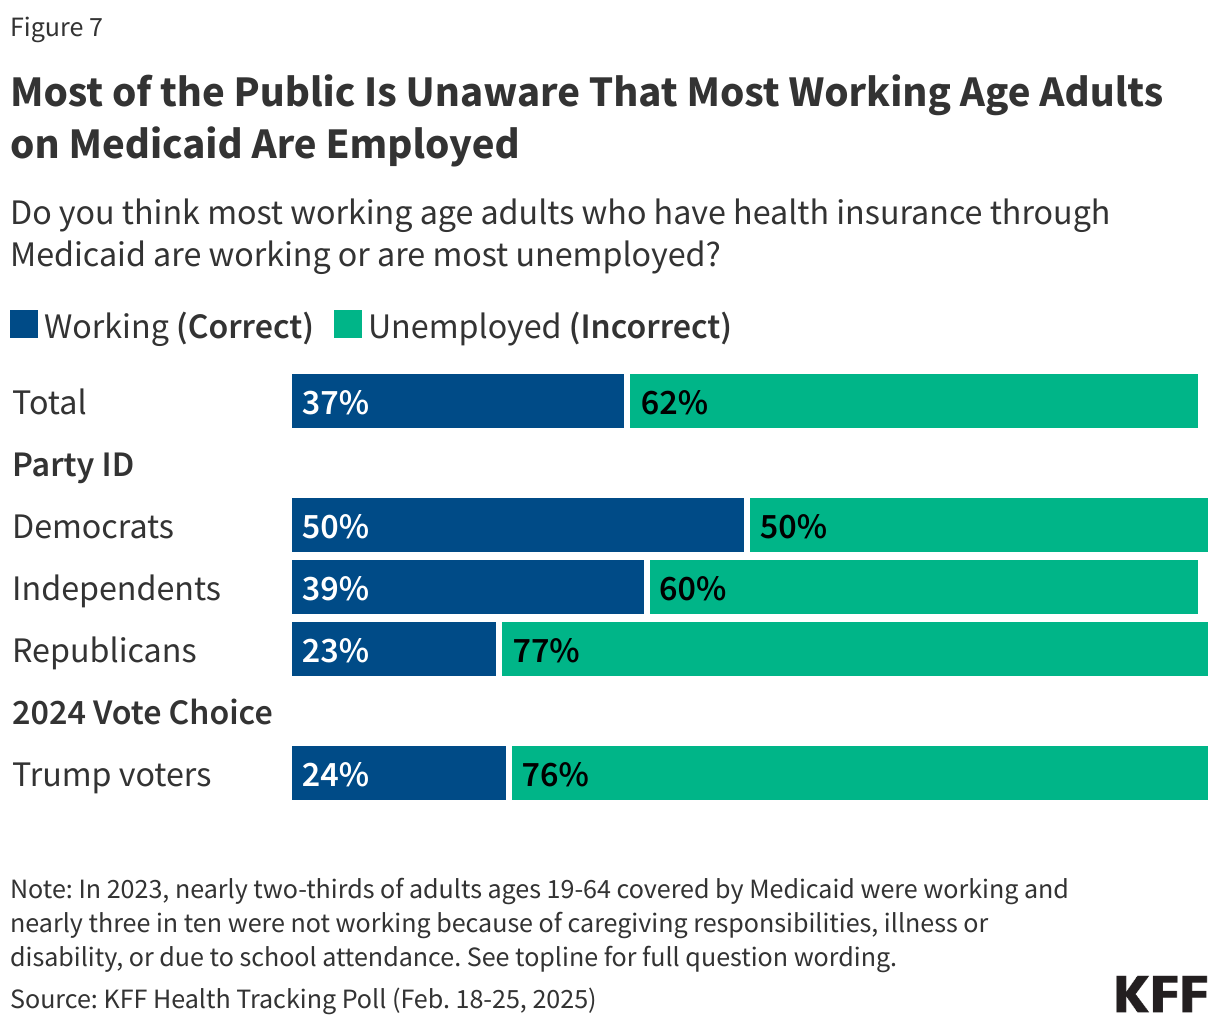
Beyond a general reduction in federal spending on Medicaid, Republicans in Congress have discussed other changes to the program, including work requirements, which would require nearly all adults to be either working or looking for work in order to have health insurance through Medicaid. Although analysis has shown that most working-age adults on Medicaid are already working, about six in ten (62%) adults think most people in the program are unemployed. Fewer, about four in ten (37%), are aware most people in the program are working. Large shares across partisans are unaware that most working-age adults on Medicaid are already working including half of Democrats (50%), six in ten independents (60%), and three-quarters of Republicans (77%) and Trump voters (76%).
Most of the Public Is Unaware That Most Working Age Adults on Medicaid Are Employed

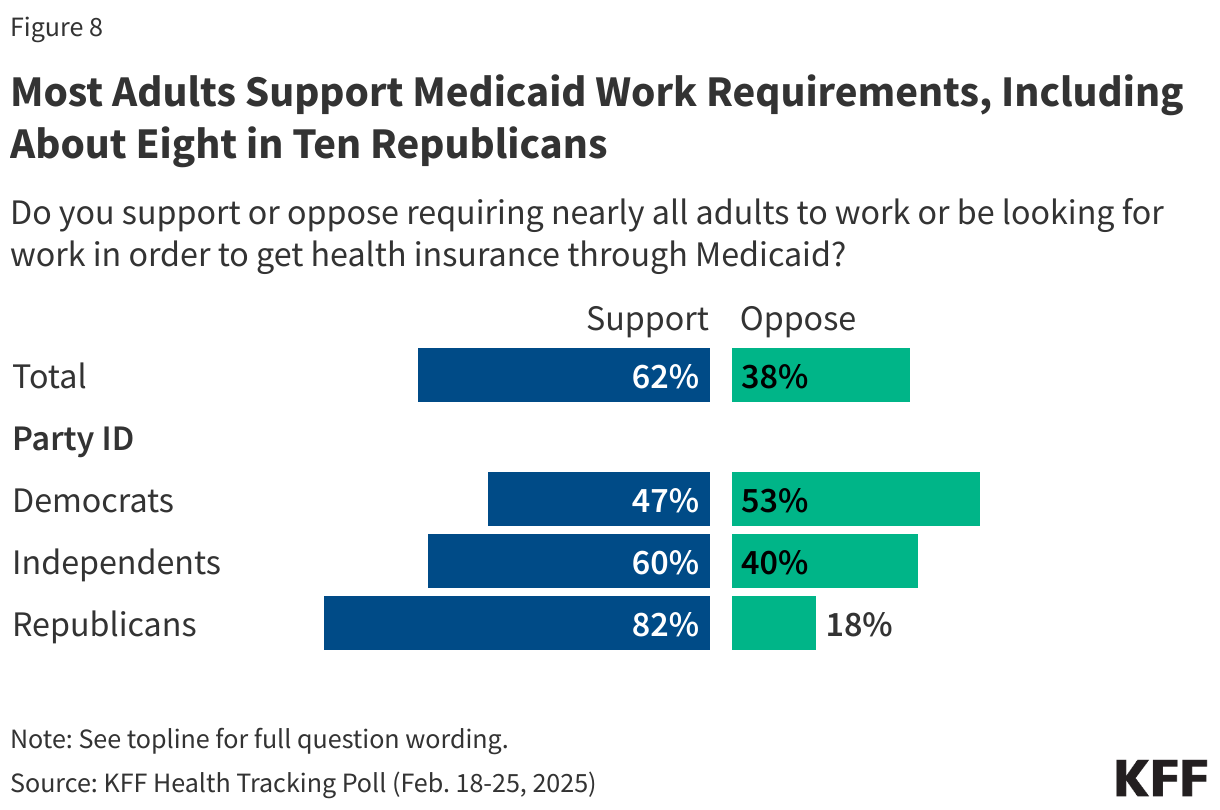
The latest KFF Health Tracking Poll finds substantial initial support for Medicaid work requirements but also finds that attitudes towards imposing work requirements are malleable when people are presented with more information. Overall, about six in ten (62%) adults say they support Medicaid work requirements, while about four in ten (38%) oppose. Majorities of Republicans (82%) and independents (60%) support such a requirement, while Democrats are more split (47% support, 53% oppose).

Most Adults Support Medicaid Work Requirements, Including About Eight in Ten Republicans

As Republicans in Congress consider instituting work requirements for Medicaid, polls can help illustrate how public opinion may change as the public debate unfolds and they begin to hear arguments both in favor and against such requirements. For example, when those who support work requirements hear that most people on Medicaid are already working and that many would be at risk of losing coverage because of paperwork challenges, about half change their view and now say they oppose Medicaid work requirements, dropping overall support for work requirements roughly in half, from 62% to 32%.

Hearing that work requirements would not have a significant impact on employment but would increase state administrative costs also changes views, but to a lesser extent. After supporters hear this argument, support drops to 40%, while 60% overall are now opposed.

On the other side, when those who initially oppose work requirements hear the argument made by supporters that this policy could allow Medicaid to be reserved for groups like seniors, people with disabilities, and low-income children, most say they still oppose the policy, but some change their opinion, increasing total support for work requirements from 62% to 77%.

Different Perspectives on Medicaid Work Requirements Can Shift Opinion on the Proposed Policy

Elimination of Federal Match Rate Under ACA Expansion

In addition to the implementation of work requirements, another prominent proposal to reduce federal spending on Medicaid is to eliminate the enhanced 90% federal match rate for adults covered under the Affordable Care Act (ACA) Medicaid expansion. KFF analysis estimates that the elimination of the enhanced federal match rate would likely lead to losses in coverage for 20 million Medicaid enrollees or would result in a substantial increase in state Medicaid spending to make up for a reduction of more than $600 billion in federal government spending.

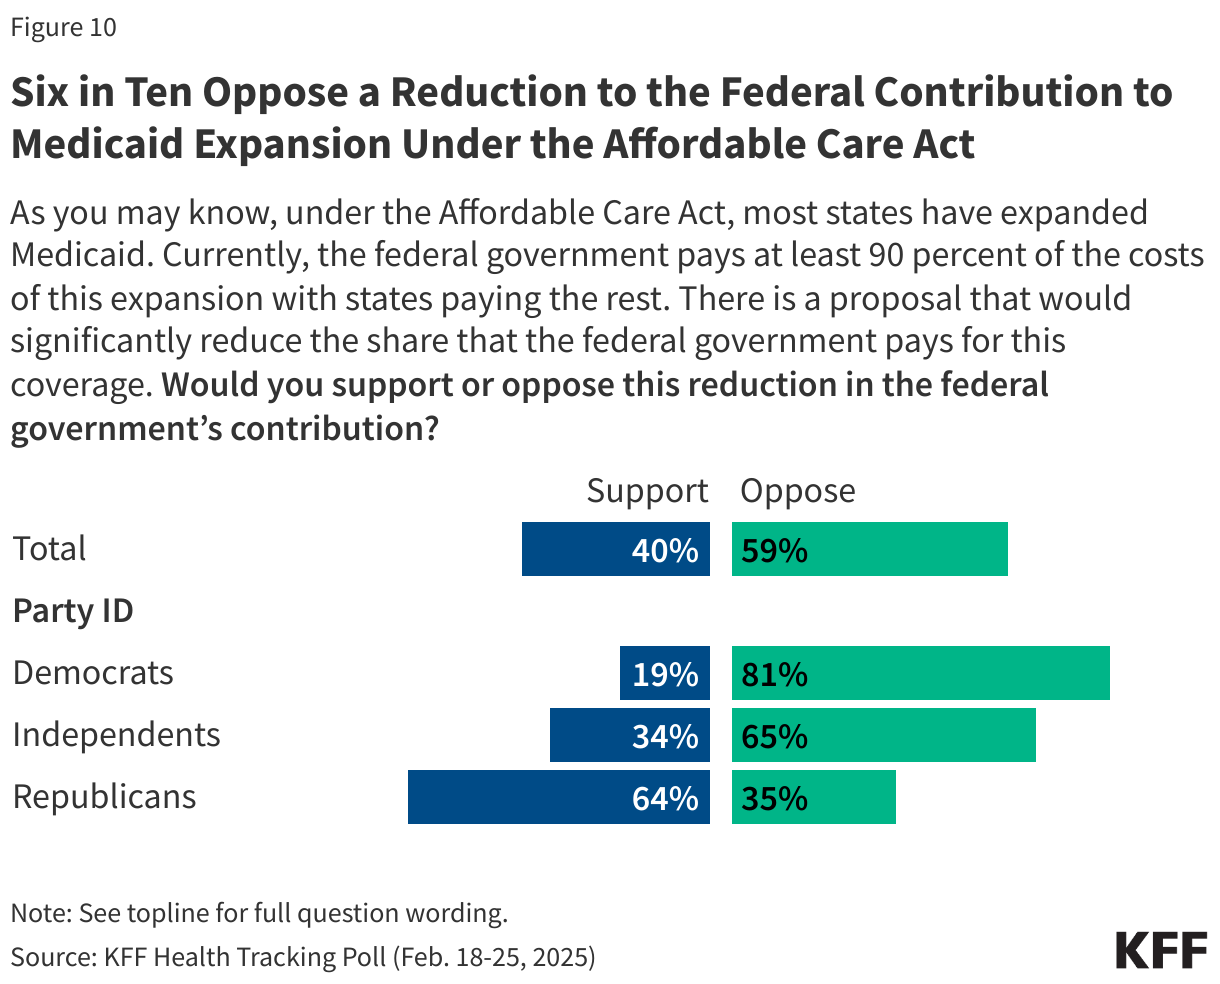
About six in ten (59%) adults say they oppose reducing the share that the federal government pays for Medicaid expansion coverage, while four in ten (40%) support this. Majorities of Democrats (81%) and independents (65%) oppose this proposal, whereas a majority of Republicans (64%) support it. These views may be, in part, a reflection of partisan views on the ACA itself. KFF Health Tracking Polls have consistently found that most Republicans have an unfavorable view of the ACA, while most independents and Democrats view it favorably.

Six in Ten Oppose a Reduction to the Federal Contribution to Medicaid Expansion Under the Affordable Care Act

Hearing arguments for and against eliminating the enhanced federal match rate under ACA expansion causes some people to change their views. When those who support the reduction in the federal government’s contribution hear that most states wouldn’t make up the rest of the funding and that 20 million people would lose coverage, about four in ten change their view, dropping overall support for the change from 40% to 24%. When opponents of the proposal hear that it would reduce federal spending by $600 billion over ten years, about one in six change their view, increasing overall support to about half (49%) of the public, while 50% remain opposed to the change.

Arguments About the Uninsured Rate and Federal Savings Are Effective on Some When Weighing Support of Cuts to Federal Contributions to Medicaid

Medicaid Knowledge

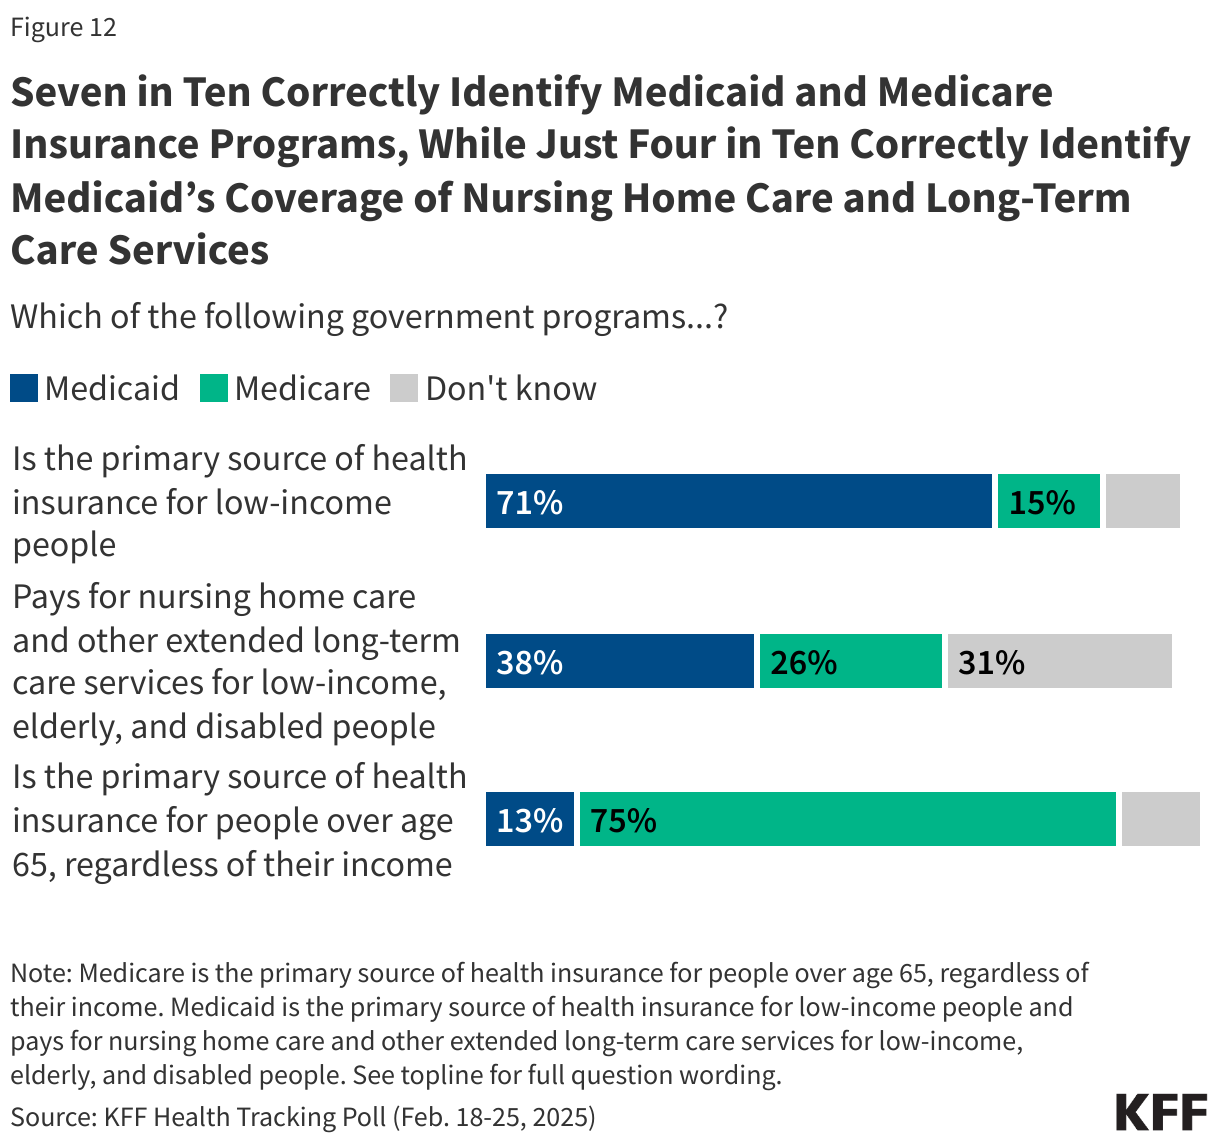
Despite Medicaid’s reach, there is still some confusion about what the Medicaid program covers and who is on it. Most (71%) adults know that Medicaid is the primary source of health insurance for low-income people, including similar shares of Democrats and Republicans. However, about one in six (15%) confuse Medicare (the government program for adults 65 and older, and some younger adults with long-term disabilities) for Medicaid. And a majority (62%) of the public are either not sure or incorrectly believe Medicare or some other program pays for nursing home care and other extended long-term care services for low-income, elderly, and disabled people, when in fact, Medicaid covers these services and is the primary payer for over six in ten residents in nursing facilities.
Shows the share of adults who have a connection to the Medicaid program

In addition, some misinformation about who is covered by Medicaid persists. While the belief that undocumented immigrants are receiving free health care from the federal government circulated prior to the new administration coming into office, it has gained new prominence amid Republican talking points about rooting out fraud and abuse in government programs, including Medicaid. In recent KFF focus groups among Medicaid recipients, some participants who voted for Trump suggested that proposals to reduce Medicaid were part of the crackdown on illegal immigration and aimed at removing undocumented immigrants from the program.
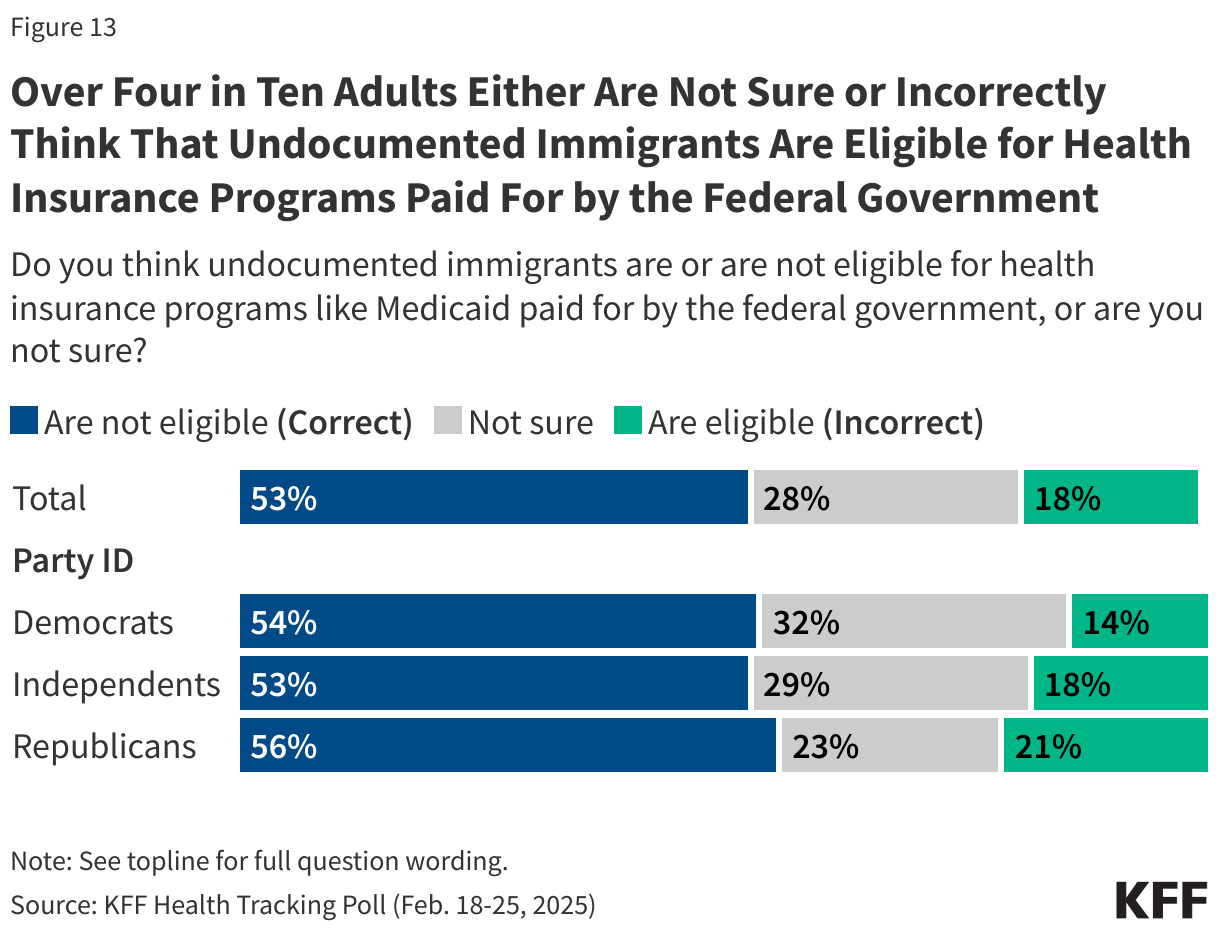
The latest KFF Health Tracking Poll finds that slightly less than half of adults are either unsure (28%) or incorrectly believe (18%) that undocumented immigrants are eligible for health insurance programs paid for the federal government, although they are not. Republicans are more likely than Democrats to incorrectly believe undocumented immigrants are eligible for federal health insurance programs (21% vs. 14%), though similar shares across partisans correctly answer that they are not eligible.

Over Four in Ten Adults Either Are Not Sure or Incorrectly Think That Undocumented Immigrants Are Eligible for Health Insurance Programs Paid For by the Federal Government

This KFF Health Tracking Poll was designed and analyzed by public opinion researchers at KFF. The survey was conducted February 18-25, 2025, online and by telephone among a nationally representative sample of 1,322 U.S. adults in English (1,254) and in Spanish (68). The sample includes 1,014 adults (n=53 in Spanish) reached through the SSRS Opinion Panel either online (n=992) or over the phone (n=22). The SSRS Opinion Panel is a nationally representative probability-based panel where panel members are recruited randomly in one of two ways: (a) Through invitations mailed to respondents randomly sampled from an Address-Based Sample (ABS) provided by Marketing Systems Groups (MSG) through the U.S. Postal Service’s Computerized Delivery Sequence (CDS); (b) from a dual-frame random digit dial (RDD) sample provided by MSG. For the online panel component, invitations were sent to panel members by email followed by up to three reminder emails.

Another 308 (n=15 in Spanish) adults were reached through random digit dial telephone sample of prepaid cell phone numbers obtained through MSG. Phone numbers used for the prepaid cell phone component were randomly generated from a cell phone sampling frame with disproportionate stratification aimed at reaching Hispanic and non-Hispanic Black respondents. Stratification was based on incidence of the race/ethnicity groups within each frame. Among this prepaid cell phone component, 140 were interviewed by phone and 168 were invited to the web survey via short message service (SMS).

Respondents in the prepaid cell phone sample who were interviewed by phone received a $15 incentive via a check received by mail. Respondents in the prepaid cell phone sample reached via SMS received a $10 electronic gift card incentive. SSRS Opinion Panel respondents received a $5 electronic gift card incentive (some harder-to-reach groups received a $10 electronic gift card). In order to ensure data quality, cases were removed if they failed two or more quality checks: (1) attention check questions in the online version of the questionnaire, (2) had over 30% item non-response, or (3) had a length less than one quarter of the mean length by mode. Based on this criterion, no cases were removed.

The combined cell phone and panel samples were weighted to match the sample’s demographics to the national U.S. adult population using data from the Census Bureau’s 2024 Current Population Survey (CPS), September 2023 Volunteering and Civic Life Supplement data from the CPS, and the 2024 KFF Benchmarking Survey with ABS and prepaid cell phone samples. The demographic variables included in weighting for the general population sample are sex, age, education, race/ethnicity, region, civic engagement, frequency of internet use, political party identification by race/ethnicity, and education. The weights account for differences in the probability of selection for each sample type (prepaid cell phone and panel). This includes adjustment for the sample design and geographic stratification of the cell phone sample, within household probability of selection, and the design of the panel-recruitment procedure.

The margin of sampling error including the design effect for the full sample is plus or minus 3 percentage points. Numbers of respondents and margins of sampling error for key subgroups are shown in the table below. For results based on other subgroups, the margin of sampling error may be higher. Sample sizes and margins of sampling error for other subgroups are available on request. Sampling error is only one of many potential sources of error and there may be other unmeasured error in this or any other public opinion poll. KFF public opinion and survey research is a charter member of the Transparency Initiative of the American Association for Public Opinion Research.

For information on the rural sample methodology see the Rural Sample Topline.

GroupN (unweighted)M.O.S.E.
Total1,322± 3 percentage points
.
Party ID
Democrats432± 6 percentage points
Independents424± 6 percentage points
Republicans377± 6 percentage points
.
Rural residents337± 9 percentage points
  1. Undocumented immigrants are not eligible to enroll in federally funded coverage including Medicaid, CHIP, or Medicare, or to purchase coverage through the ACA Marketplaces. However, some states have established fully state-funded programs to provide coverage to immigrants regardless of immigration status, although they vary in eligibility and scope of benefits provided. In addition, Emergency Medicaid spending reimburses hospitals for emergency care they are obligated to provide to individuals who meet other Medicaid eligibility requirements (such as income) but who do not have an eligible immigration status, including undocumented immigrants and lawfully present immigrants who remain ineligible for Medicaid or CHIP. Read more about immigrants’ use of health care here.   ↩︎
News Release

Poll: With More Than Half the Public Saying They or a Family Member Have Been Covered by Medicaid, Large Majorities Don’t Want Cuts, Including Most Trump Voters and Rural Residents

Most Support Adding Work Requirements to Medicaid, but Views Shift with Arguments Made for and Against

Published: Mar 7, 2025

As Congress considers changes to the Medicaid program as part of the budget debate, relatively few (17%) in the public say they want to see a reduction in Medicaid spending, with larger shares saying they want spending to stay about the same (40%) or increase (42%), a new KFF Health Tracking Poll finds.

Support for Medicaid spending cuts is relatively low even among traditionally conservative groups, including Republicans (33% favor cuts), people who voted for Donald Trump (35% favor cuts), and people living in rural communities (23% favor cuts). Across each of these groups, larger shares say they want Congress to maintain or increase Medicaid spending.

More than half of the public say either  they themselves have ever been covered by Medicaid (18%) or that a family member has ever been covered (35%). An additional 13% say that they have a close friend who has ever been covered by the program.

Substantial shares of Democrats (52%), independents (57%), and Republicans (44%) say they or a family member has ever been covered by Medicaid, as do substantial shares of those who voted for President Trump (44%) and former Vice President Harris (51%), and those who live in rural areas (54%).

Perhaps relatedly, nearly three-quarters (73%) of the public say that Medicaid is “very important” to their local community. This includes a similar share of rural residents (75%), as well as majorities of Republicans (61%), Trump voters (61%), and rural Trump voters (66%).

Those who are currently enrolled in Medicaid or have a family member who is are even more likely to say the program is “very important” to their communities (85% overall, including 90% of those living in rural areas).

“I am about ready to say Medicaid is up there with Social Security and Medicare on the public’s do-not-cut list,” KFF President and CEO Drew Altman said. “That’s a real change since the beginning of the program, and one that Republicans in Washington are coming to grips with.”

While President Trump and some Republican lawmakers have described potential changes to Medicaid as efforts to make the program better, three-quarters (75%) of the public say potential changes to Medicaid are more about “reducing federal government spending,” three times the share (23%) who say they are more about “improving how the program works for people.”

Majorities across political parties, including most Trump voters (57%), say the changes are more about reducing federal spending than improving how the program works for people.

Views on Work Requirements and Medicaid Expansion Funding Can Shift with Arguments

While budget plans under consideration in Congress target substantial cuts to Medicaid, no specific changes have been formally proposed yet. The poll gauges the public’s views on two potential options that have been under consideration: work requirements and decreasing federal funding for the Affordable Care Act’s Medicaid expansion. The poll finds the public’s views are somewhat fluid and can change when presented with arguments that are made for or against them as would happen during a public debate.

For example, about six in 10 (62%) adults initially say they favor requiring nearly all adults to work or be looking for work in order to have health insurance through Medicaid. Support falls to just 32% when people are told that most Medicaid enrollees are already working and that many would be at risk of losing coverage because of paperwork challenges.
In contrast, support for work requirements grows to 77% when people hear the argument made by supporters that work requirements could ensure Medicaid is reserved for the elderly, people with disabilities, and low-income children.

Similarly, when asked about reducing the federal government’s share of the costs of covering low-income childless adults through the ACA’s Medicaid expansion, most (59%) initially say they would oppose it, while 40% say they would support it.

When told that such a change would reduce federal spending by $600 billion over 10 years, views shift slightly so that equal shares support (49%) and oppose (50%) such a policy. In contrast, opposition to the change grows to 75% when people are told states wouldn’t be able to make up the rest of the difference and that 20 million people could lose their Medicaid coverage and become uninsured.

Arguments made by proponents and opponents of policies may or may not be entirely accurate. KFF has long tested them to understand how public opinion may respond to actual debate.

Other findings include:

  • Just over a third (37%) of the public are aware that most working-age adults with Medicaid coverage are working, while a majority (62%) incorrectly says they are unemployed. Republicans (77%) and Trump voters (76%) are more likely than others to be unaware that most working-age people with Medicaid are currently working.
  • About half (53%) of the public correctly says that undocumented immigrants are not eligible for federally funded health insurance such as Medicaid, while the rest are either unsure (28%) or incorrectly say that undocumented immigrants are eligible for coverage (18%). Republicans are more likely than Democrats to incorrectly believe undocumented immigrants are eligible for federal health insurance programs (21% vs. 14%).
  • Many are also confused about Medicaid’s role in paying for nursing home care and other extended long-term care services for low-income, elderly and disabled people. About four in 10 (38%) correctly identify Medicaid as the program that does this, while most either incorrectly believe Medicare pays for such care (26%) or are not sure which program does (31%).
  • About half (49%) of rural residents say there are not enough primary care doctors in their community to serve local residents. Even larger shares say there are not enough specialists (71%) or mental health providers (67%). A third (34%) say there are not enough hospitals.

Designed and analyzed by public opinion researchers at KFF, the survey was conducted Feb. 18-25, 2025, online and by telephone in English and in Spanish among a nationally representative sample of 1,322 U.S. adults, including an oversample of rural adults (n=337). The margin of sampling error is plus or minus 3 percentage points for the full sample. For results based on other subgroups, the margin of sampling error may be higher.

The Trump Administration’s Foreign Aid Freeze and Global Health: The Biggest Gaps Left on the Donor Landscape

Published: Mar 6, 2025

With the Trump administration instituting a foreign aid freeze, including a stop-work order, cancelling the vast majority of foreign aid grants and contracts, and moving to dismantle USAID, U.S. global health programs have been effectively shuttered. Even the limited waivers that have been granted for some services have not resulted in any significant funds flowing or services offered, according to multiple lawsuits and other reports.

This situation presents considerable risks to the health of millions of people in low- and middle-income countries, given the role the U.S. has played in this area. Indeed, the U.S. government has been the largest donor to global health for decades, carving out health one of its main sectors of international development, across multiple administrations and Congresses, through the provision of significant financial assistance, technical expertise, and personnel. However, this has also meant that the U.S. has disproportionately shouldered the burden for health programs, making health especially vulnerable to U.S. policy fluctuations and changes, and especially to the recent, abrupt halt in funding.

A recent analysis from the Center for Global Development identified countries most vulnerable to these cuts. This analysis examines the relative role of the U.S., compared to other donors (governments as well as multilateral institutions), in global health. We used disbursement data from the Organisation of Economic Development (OECD) Creditor Reporting System (CRS), averaged over a three-year period (2021-2023), to smooth out spending fluctuations (all totals and percent share present the per year average over the period). We focused on bilateral donor spending (e.g., the funding a donor gives directly to or on behalf of specific countries) vs. multilateral spending (e.g., the funding a donor gives to a multilateral institution that is then pooled with other donor contributions and provided to countries) because such funding is attributed to the multilateral institution as the donor in the CRS database. In addition, at this time, no U.S. government funding to the main multilateral funders of global health services has been halted. We looked at overall health spending as well as spending for HIV, tuberculosis (TB), and malaria. We removed COVID-19 funding given that it was emergency in nature and not enduring. Due to lack of available data, this analysis does not include domestic funding from recipient countries that are also used for health and in some case may be significant, although in general, GDP growth in low and middle income countries continues to lag due to the effects of COVID-19 and many face significant debt burdens that limit their ability to increase resources for health.

As this analysis shows, given that the U.S. has been the largest donor to global health, the gap left, should cuts and disruption continue, would be quite significant. This is especially true in the case of HIV for which the U.S. provides almost two-thirds of bilateral assistance. In addition, there are several countries that could be disproportionately affected by U.S. cuts, given that they are both very low-income and rely heavily on the U.S. for health assistance. Whether other donors, or countries themselves, would be able to make up such losses is unknown but seems unlikely given broader global economic trends.

Findings

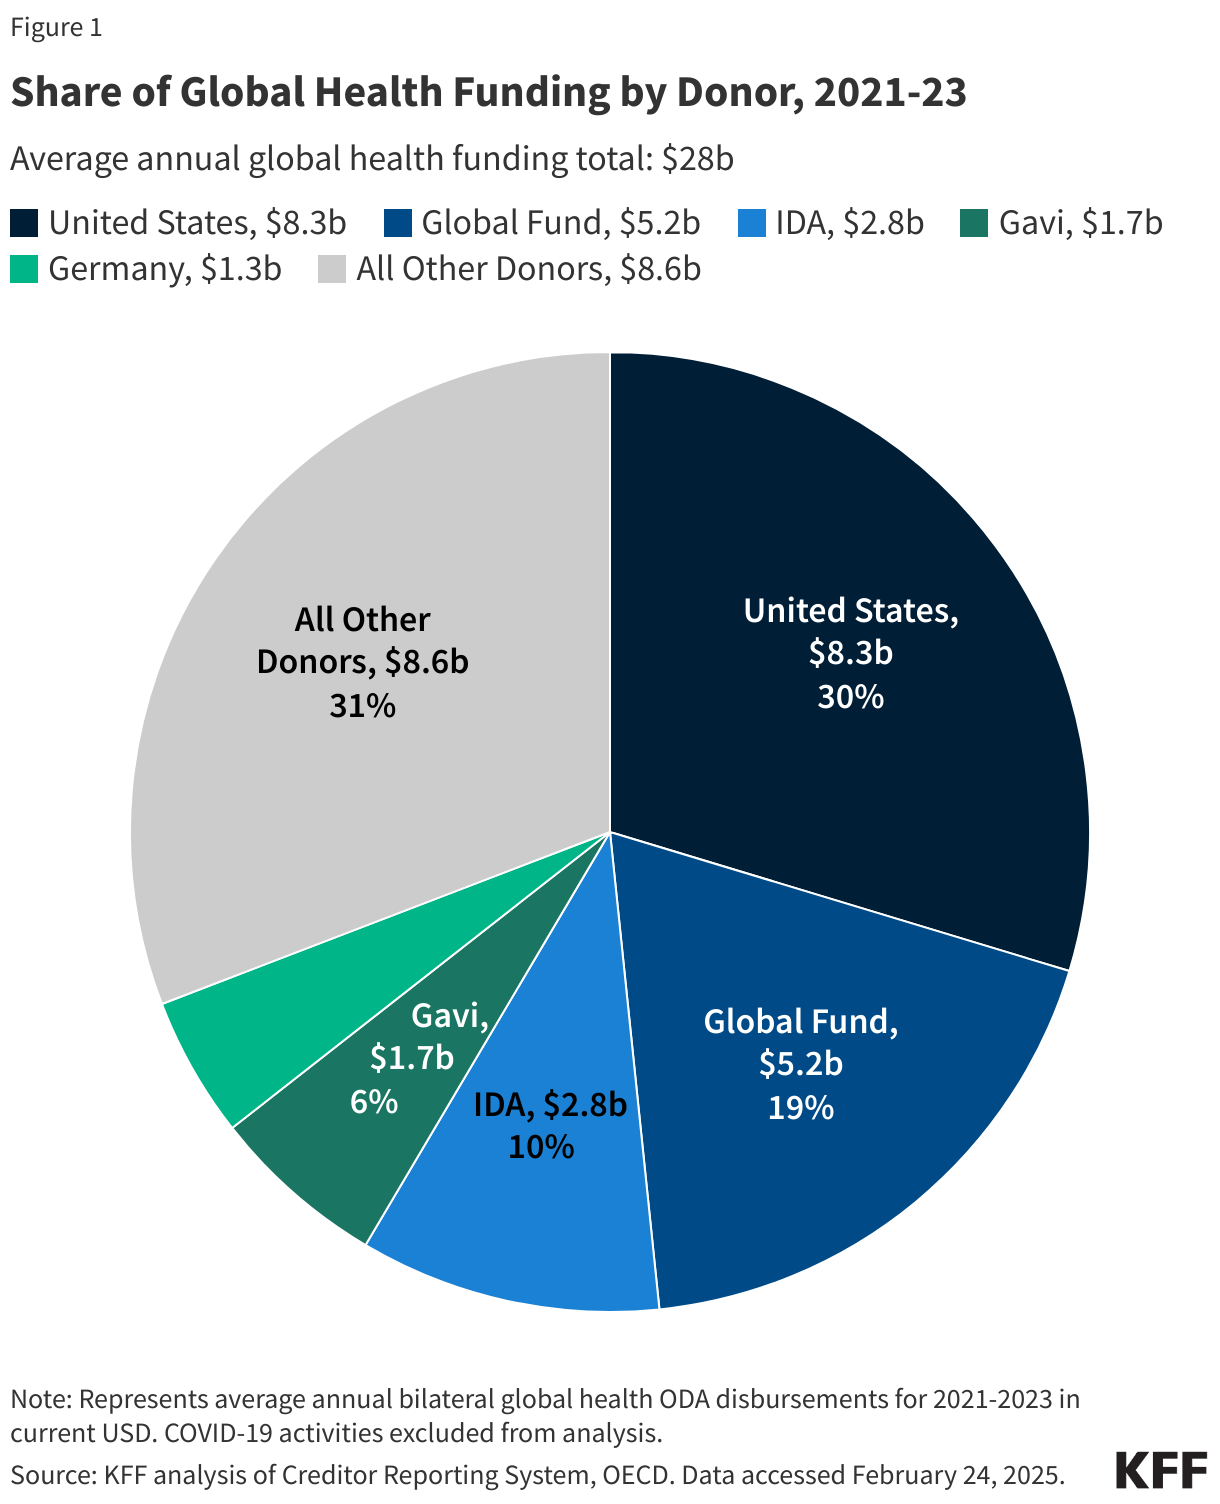
The U.S. government was the single largest donor to health in low- and middle-income countries over the 2021-2023 period. The U.S. provided 30% of all health assistance, or $8.3 billion per year in bilateral support. The next largest donor was the Global Fund to Fight AIDS, Tuberculosis and Malaria (Global Fund), providing 19% or $5.2 billion each year over the period. The third largest donor was the World Bank’s International Development Association (IDA) (10% or $2.8 billion per year), followed by Gavi, the Global Alliance for Vaccines and Immunization (Gavi) at 6% ($1.7 billion per year) Germany (5% or $1.3 billion per year). All other donors each represented less than 5%. See Figure 1. It is important to note that government donors also fund multilateral entities focused on health and other areas, so these data underestimate the relative contributions of governments to health. The U.S., for example, is the Global Fund’s largest donor, providing approximately a third of its funding while the UK is Gavi’s largest donor providing about a quarter of its funding. Still, at this point, the Trump administration has not issued stop-work orders for the main multilateral entities that support health.

Share of Global Health Funding by Donor, 2021-23

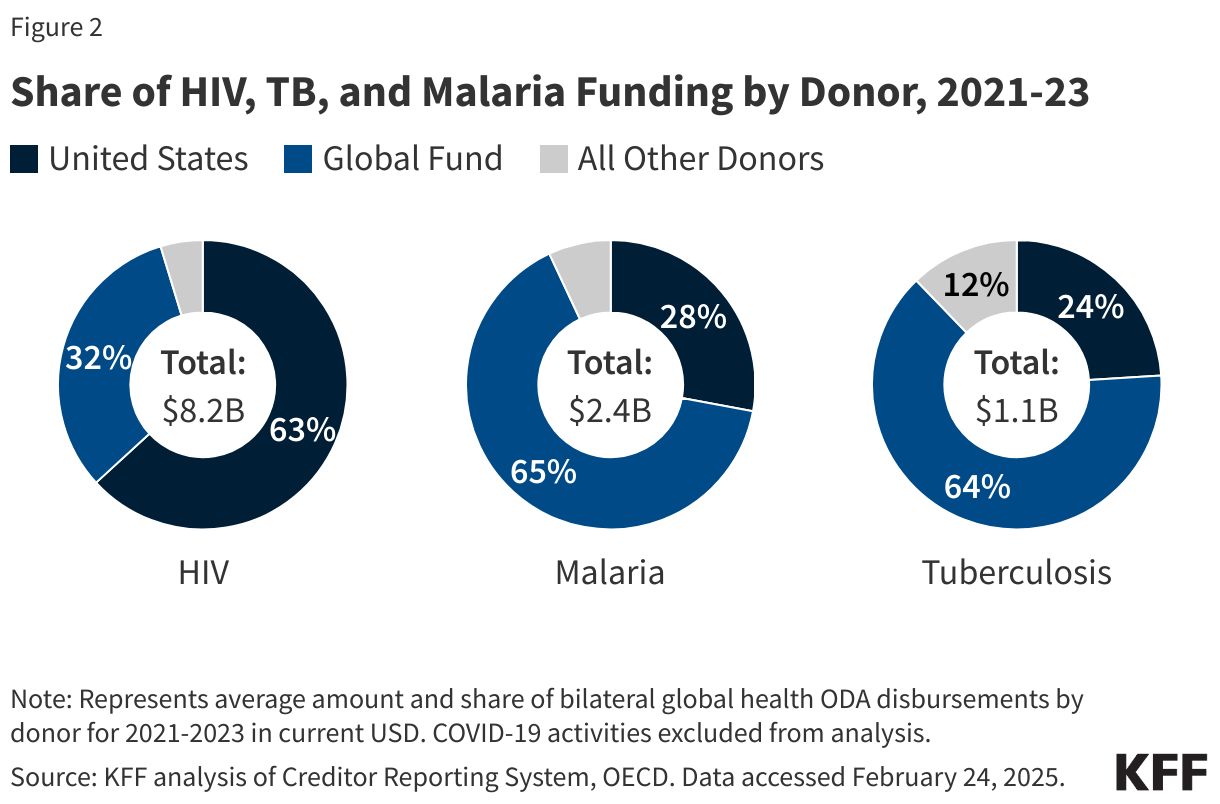
For HIV, the U.S. provided almost two-thirds of all donor support (63% or $5.2 billion per year) over the 2021-2023, making this area of health especially vulnerable to U.S. cuts. The next largest donor was the Global Fund (32% or $2.6 billion). The EU and UNAIDS provided 1%; while all other donors each provided less than 1%. Because the U.S. is the largest donor to the Global Fund, any reductions in its support would have an even greater and disproportionate impact on the HIV response. See Figure 2.

Share of HIV, TB, and Malaria Funding by Donor, 2021-23

For malaria, the Global Fund was the single largest donor (65% or $1.6 billion) over the period. The U.S. was second largest at 28% or $673 million. The EU and IDA each provided 2% and all other donors were at 1% or less. As with HIV, reductions to Global Fund support by the U.S. would affect the global malaria response. See Figure 2.

Similarly, the Global Fund was the largest donor to TB efforts, providing 64% or $707 million per year over the period. The U.S. was the next largest, at 24% or $266 million, followed by the EU (4%) and Australia (2%). All other donors provided 1% or less. See Figure 2.

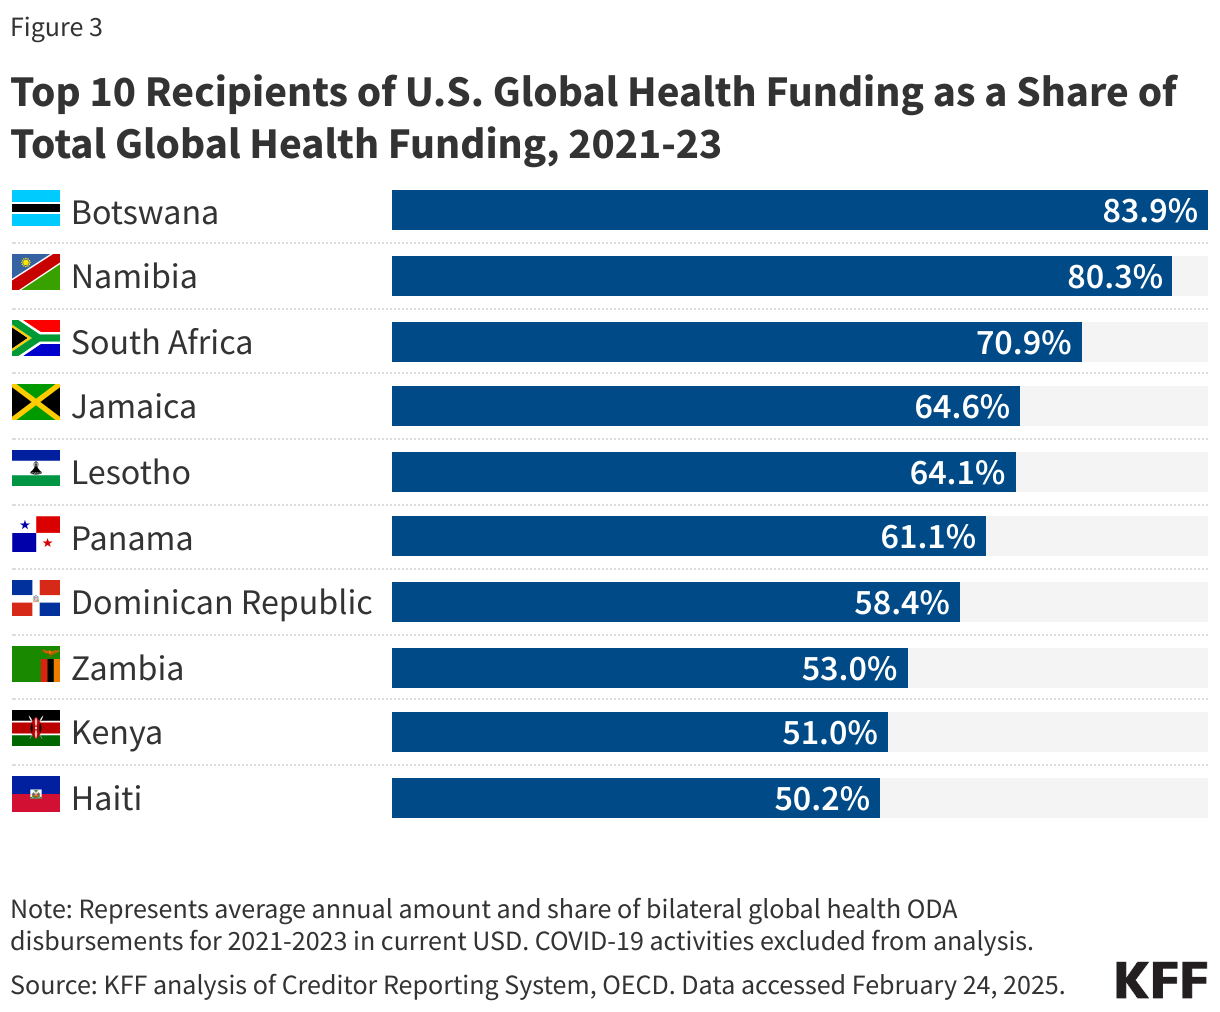
Some countries would be disproportionately affected by U.S. cuts in health aid, compared to others. Whereas the U.S. provided 30% of direct health assistance per year during the 2021-2023 period, it provided 50% or more of health assistance in 11 countries, including several low or lower-middle-income countries (Eswatini, Haiti, Kenya, Lesotho, and Zambia), one of which is currently conflict-affected (Haiti). Others are upper-middle-income (Botswana, Dominican Republic, Namibia, Jamaica, and South Africa) or high-income (Panama) and could likely more easily absorb U.S. cuts. See Figure 3.

Top 10 Recipients of U.S. Global Health Funding as a Share of Total Global Health Funding, 2021-23

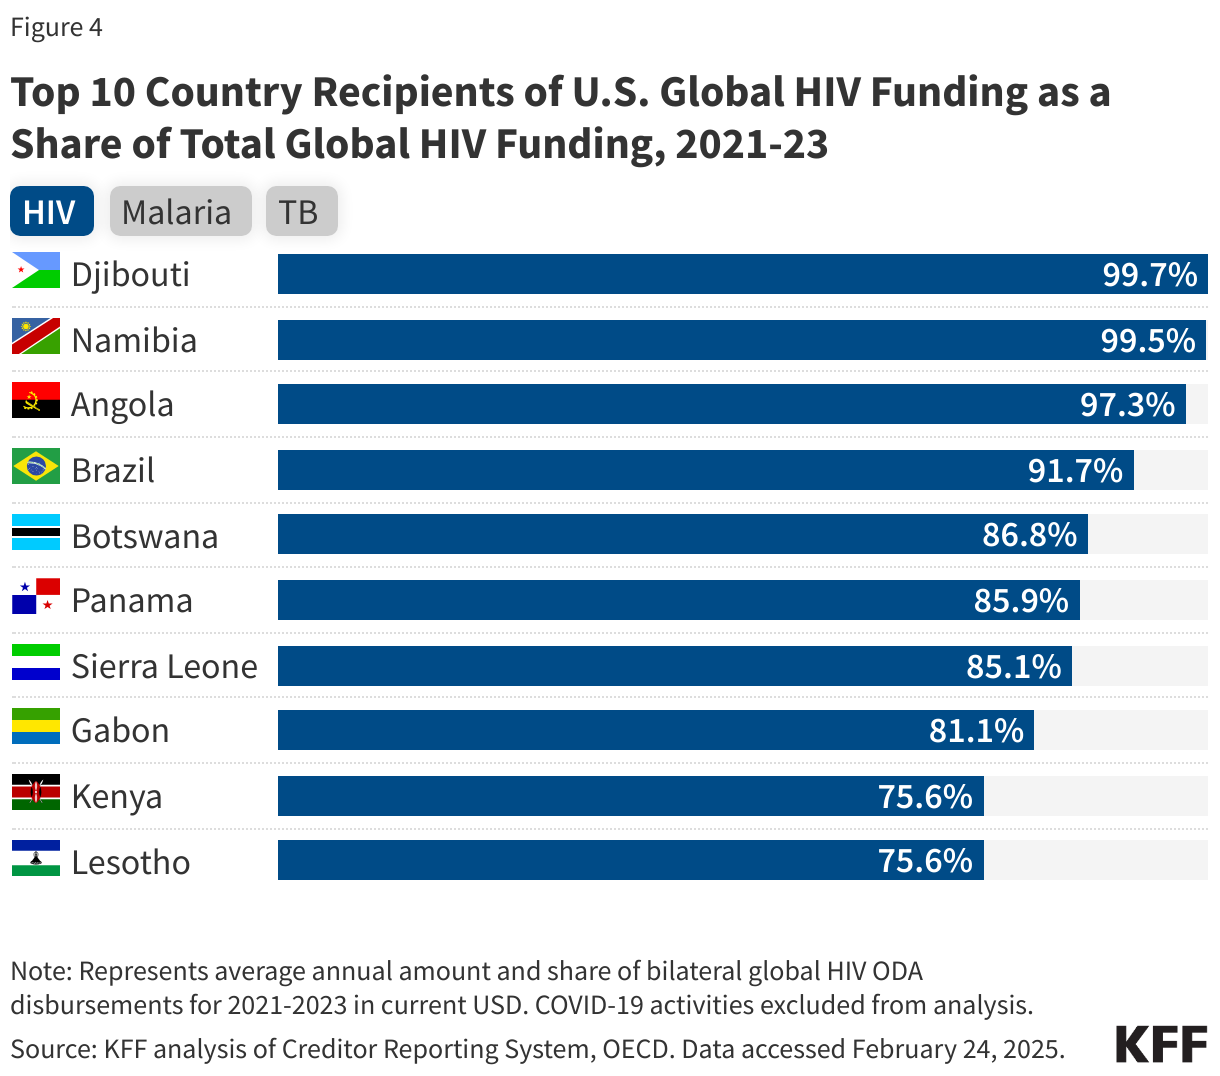
Country reliance on U.S. support is even more concentrated for HIV. Eight countries receive 80% or more of their donor support for HIV from the U.S., compared to 63% across all recipients. For malaria, seven countries receive 50% or more of their funding from the U.S., and for TB the U.S. accounts for more than 50% of funding in nine countries. See Figure 4.

Top 10 Country Recipients of U.S. Global HIV Funding as a Share of Total Global HIV Funding, 2021-23

5 Key Facts About Medicaid and Hospitals

Published: Mar 5, 2025

There are several options under consideration in Congress to significantly reduce Medicaid spending to help pay for tax cuts, with the recently passed House budget resolution targeting cuts to Medicaid of up to $880 billion or more over a decade. Large reductions in Medicaid spending are likely to have direct implications for the 83 million people covered by Medicaid, state budgets, and health care providers, including hospitals. Medicaid accounted for about one fifth (19%) of all spending on hospital care in 2023. Changes in hospital finances could affect patient care and may have broader economic implications, given that, for example, hospitals employ 6.7 million people and are the sixth largest employer in the country when comparing industry subsectors.

A number of policies to achieve large Medicaid savings have been discussed. These include imposing a per capita cap on federal Medicaid spending, reducing the federal government’s share of costs for the ACA Medicaid expansion group, imposing Medicaid work requirements, limiting states’ use of provider taxes to finance the state share of Medicaid spending, and placing restrictions on supplemental payments to providers and/or state-directed payments (which are payments managed care plans make to providers, including hospitals). Such policies could force states to make tough choices about raising state revenues to replace the lost federal dollars or making cuts to Medicaid by reducing the number of people covered; covering fewer benefits; or reducing payment rates for hospitals, physicians, nursing homes, and other health care providers.

Absorbing reductions in Medicaid spending could be challenging for hospitals, particularly for those that are financially vulnerable, such as hospitals that care for a relatively large share of Medicaid patients. Reducing reimbursement rates or cutting supplemental payments to hospitals would have a direct impact on hospital finances. Rolling back coverage would increase the number of uninsured patients, which could result in higher uncompensated care costs (and have implications for the health of Medicaid enrollees who lose coverage or have access to fewer benefits). Hospitals may respond to those financial pressures by operating more efficiently or by making various cuts—such as offering fewer services, laying off staff, or investing less in quality improvements—and lower payment rates could reduce the willingness of hospitals to see Medicaid patients. Cuts to Medicaid spending could also potentially accelerate the pace of hospital closures, including in rural areas. Given differences in state responses to potential federal Medicaid cuts, the impact would likely vary across states and hospitals.

1. Medicaid covered about one fifth of all hospital spending in 2023.

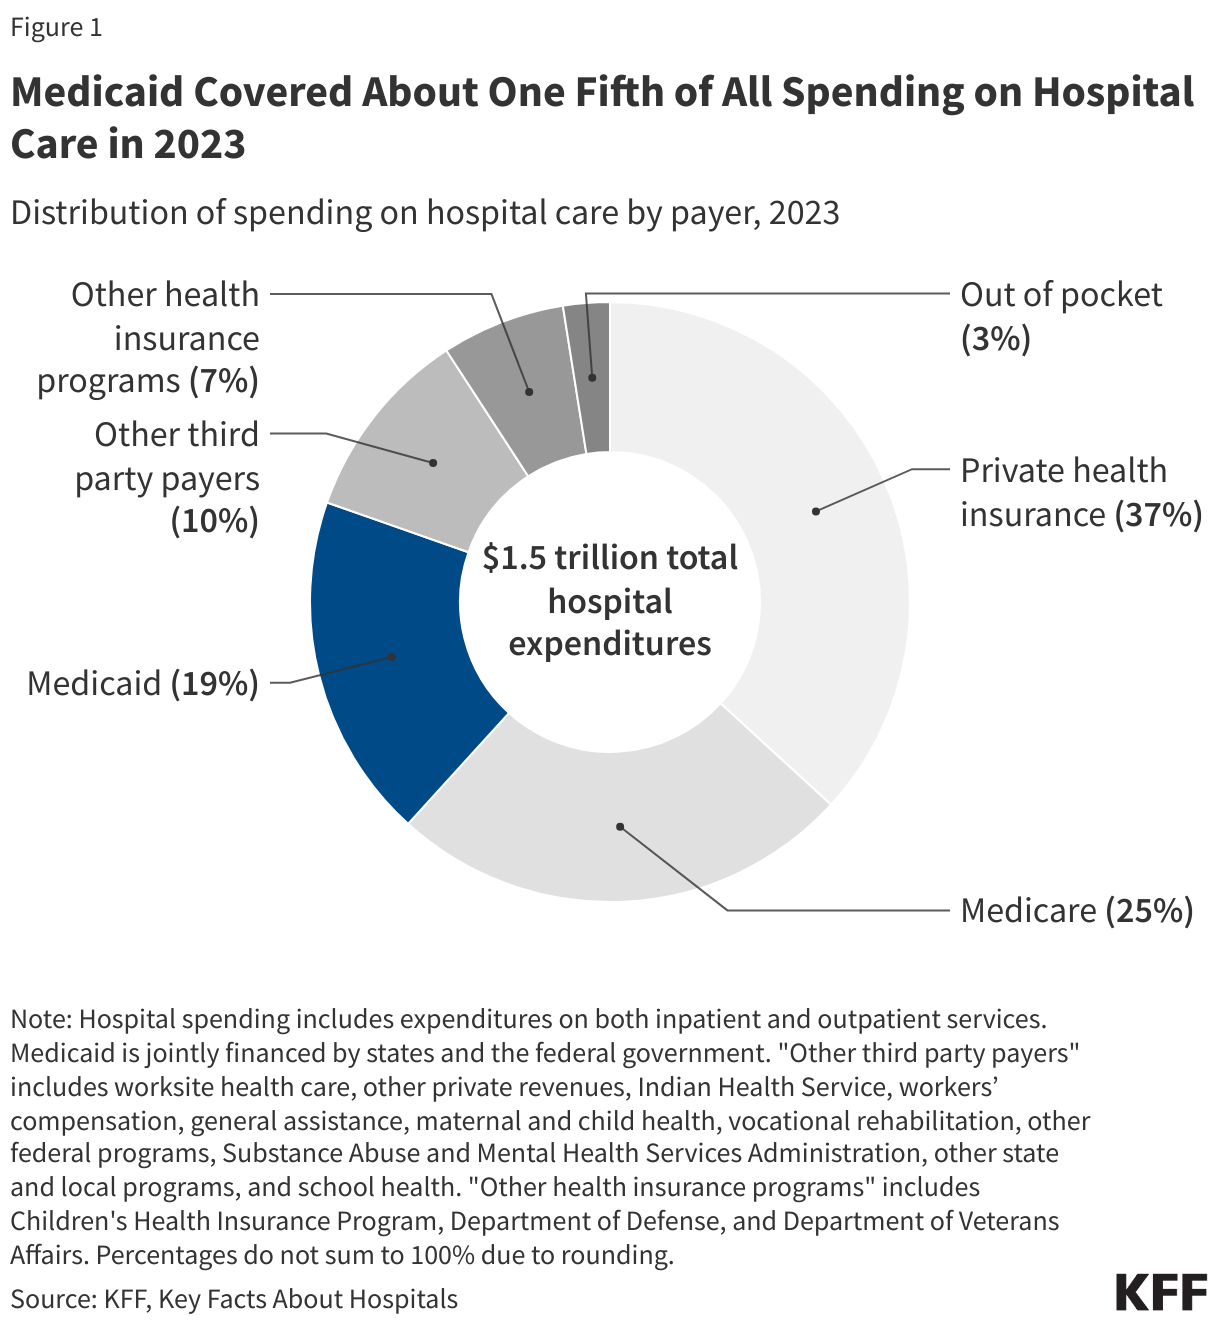
Medicaid accounted for 19% of all spending on hospital care in 2023, or $283 billion out of the $1.5 trillion spent on hospital care (Figure 1). The other major payers for hospital care are Medicare (25%) and private health insurance (37%). Medicaid also covered about one fifth of hospital discharges in 2023.

Medicaid Covered About One Fifth of All Spending on Hospital Care in 2023

2. Hospital care accounted for about one third of total Medicaid spending in 2023.

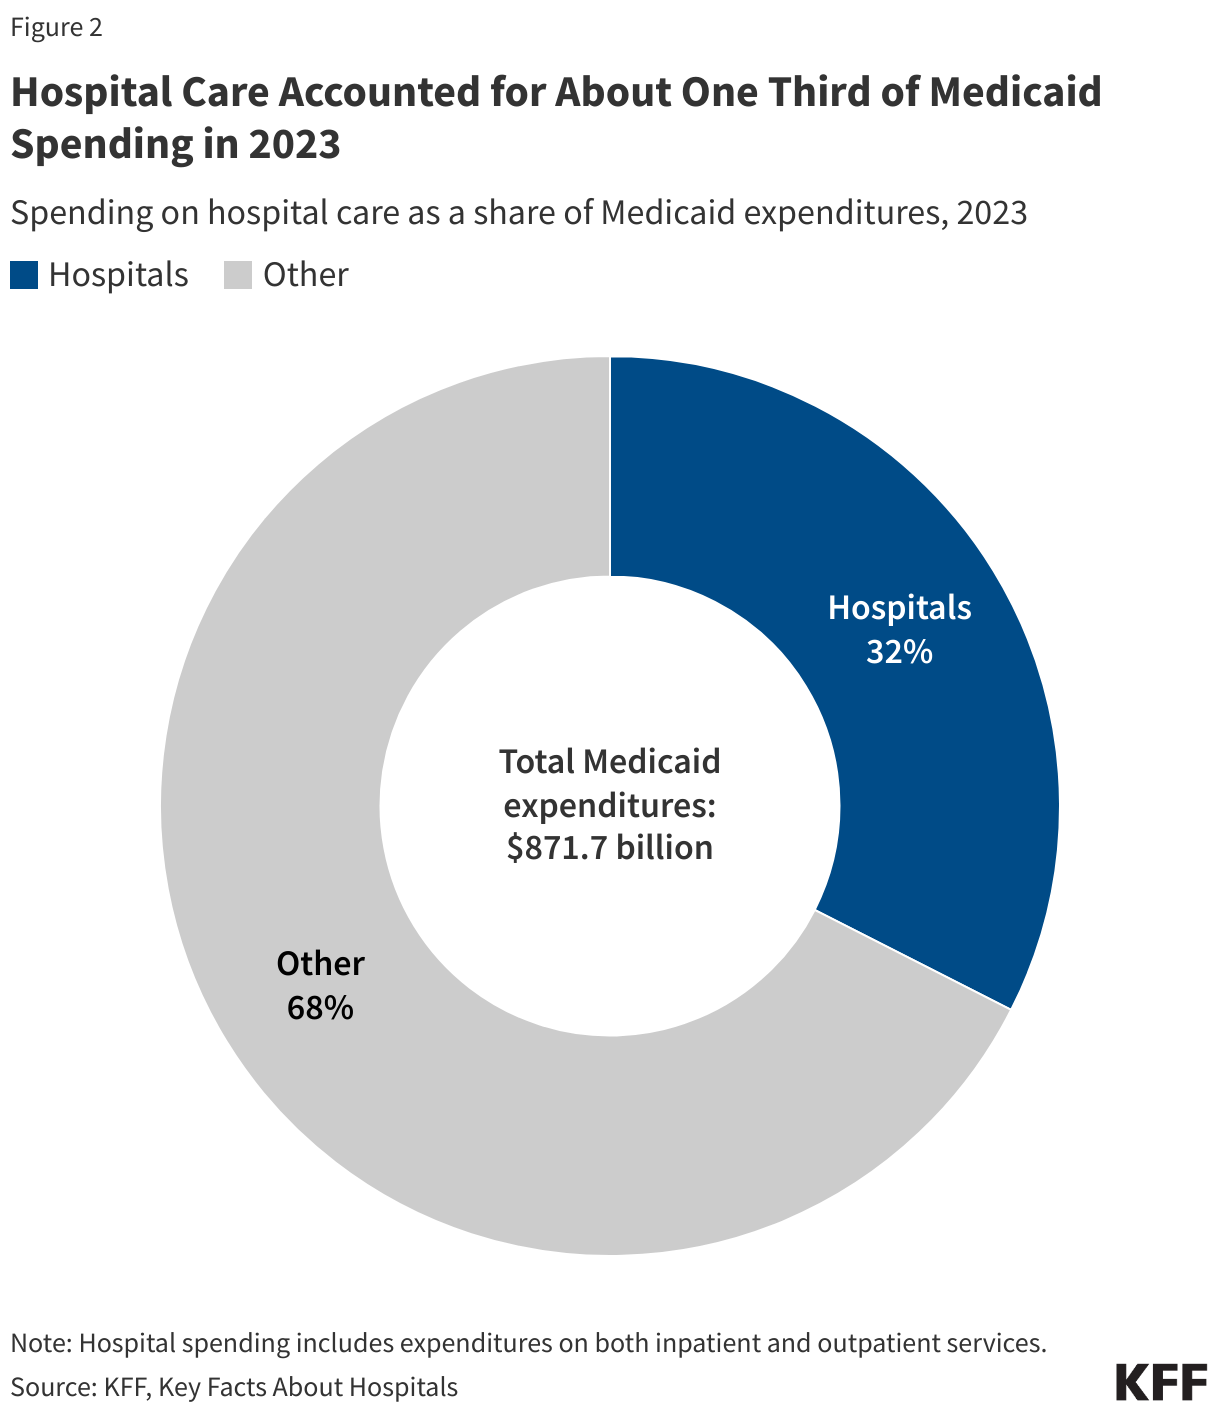
Hospital care accounted for about one third (32%) of Medicaid spending in 2023, or $283 billion out of $872 billion in total Medicaid expenditures. For purposes of comparison, hospital care represented a larger share of Medicaid spending (32%) than physician and clinical services (14%) or retail prescription drugs (6%). Because hospital care accounts for a large share of Medicaid expenditures, it is likely that any substantial reduction in Medicaid spending would impact hospitals, and some proposed policy changes directly target supplemental or state directed payments to hospitals.

Hospital Care Accounted for About One Third of Medicaid Spending in 2023

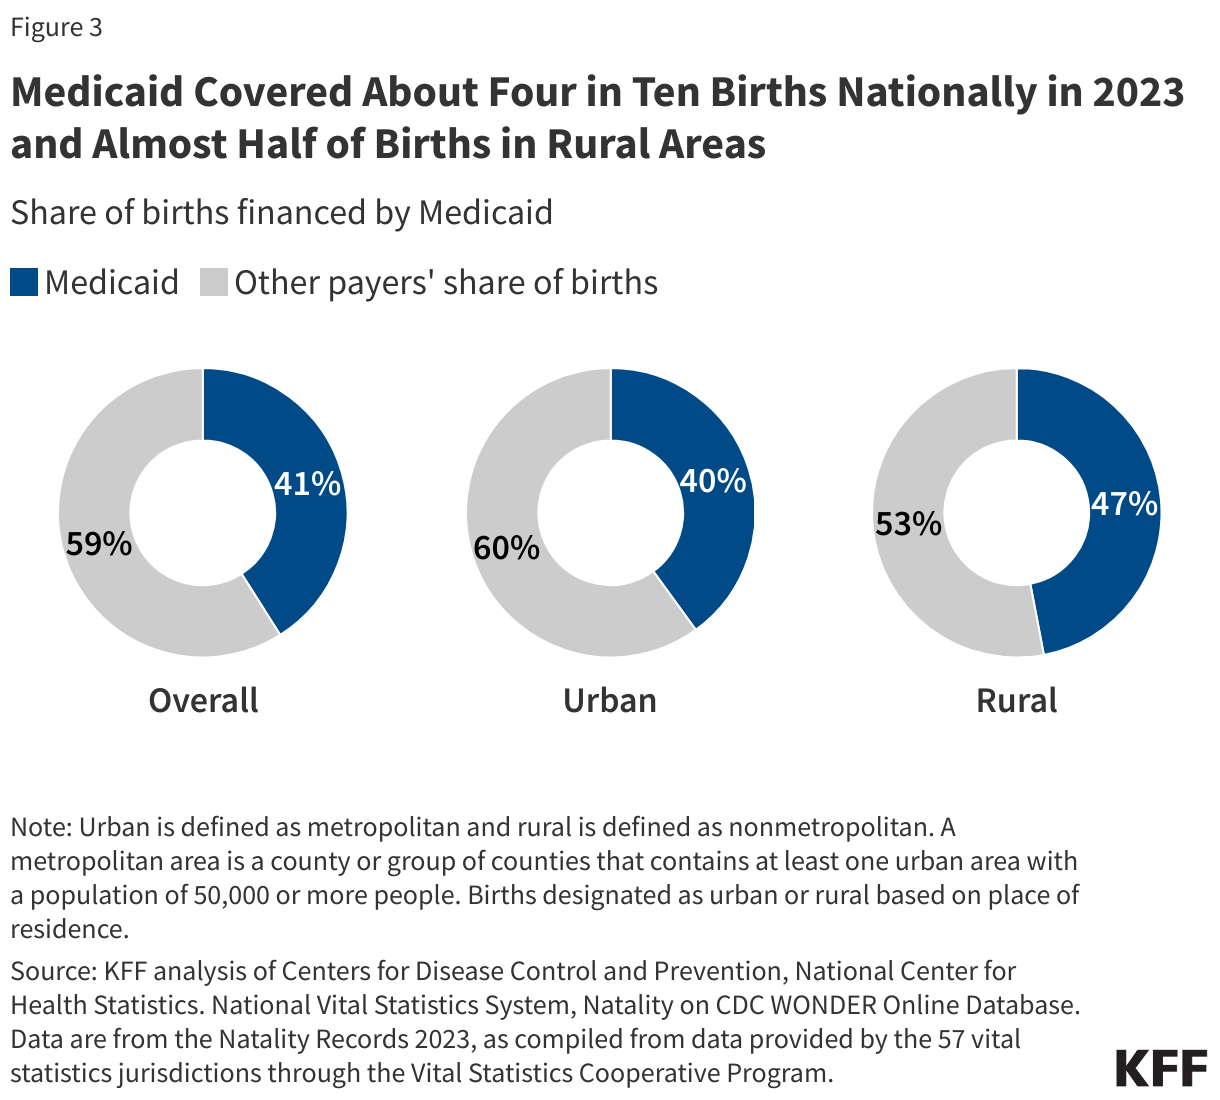
3. Medicaid covered about four in ten births nationally in 2023 and almost half of births in rural areas.

Medicaid covered 1.5 million births in 2023—representing 41% of all U.S. births—and financed nearly half (47%) of births in rural areas (Figure 3). Births are the most common reason for a hospital inpatient stay. Medicaid covered more than two in ten births in nearly every state, at least four in ten births in 25 states and DC, and more than half of births in four states: Louisiana, Mississippi, New Mexico, and Oklahoma. The share was the largest in Louisiana, where Medicaid covered nearly two in three (64% of) births. (See prior KFF work for more about women and Medicaid).

State Medicaid programs are required to cover pregnancy-related services without cost sharing for people with incomes up to 138% of the federal poverty level (FPL), including in states that have not adopted the ACA Medicaid expansion. For births covered by Medicaid, states must also provide pregnancy-related coverage for at least 60 days postpartum and cover infants for twelve months. Nearly all states have taken up the option to extend postpartum coverage through one year postpartum.

Medicaid Covered About Four in Ten Births Nationally in 2023 and Almost Half of Births in Rural Areas

4. The ACA Medicaid expansion has helped improve hospital finances and is associated with lower charity care costs.

Expanding Medicaid under the ACA has had financial benefits for hospitals, according to several studies. These benefits include:

  • Improvements in payer mix (fewer uninsured patients, more Medicaid patients, or both),
  • Reductions in uncompensated care,
  • Increases in hospital revenues and operating margins, and
  • Fewer hospital closures.

The financial impact of Medicaid expansion for at least certain measures may be most evident among rural hospitals, small hospitals, and hospitals that see a higher proportion of low-income patients, based on some of the research.

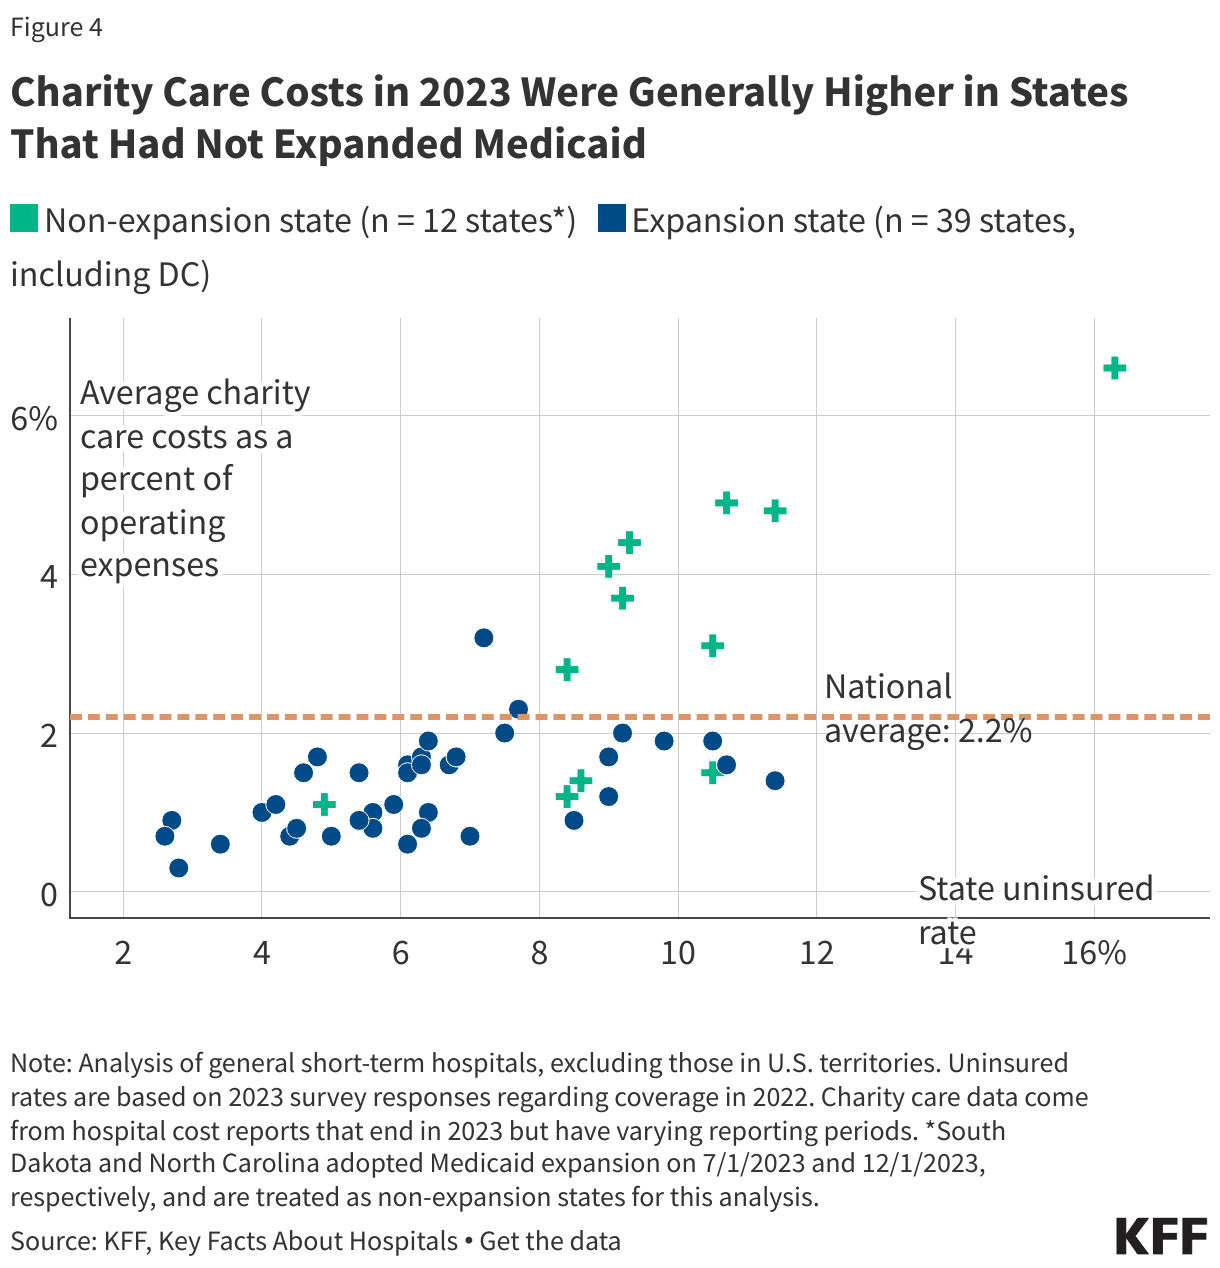
Hospital charity care costs (one component of uncompensated care) were generally higher in 2023 in states that had not expanded Medicaid (Figure 4). Hospital charity care programs, also known as “financial assistance programs,” provide free or discounted services to eligible patients who are unable to afford their care and are one component of uncompensated care. Among the ten states with the highest charity care costs as a percentage of operating expenses in 2023, eight had not expanded Medicaid as of November of that year (one did so in December).

Texas, a non-expansion state, had both the highest uninsured rate (16%) and the highest average charity care costs as a percent of operating expenses (6.6%) in the country. Conversely, all thirteen states where average charity care costs as a percentage of operating expenses were less than 1.0% had expanded Medicaid. Wisconsin, which had the lowest uninsured rate and average charity care as a percentage of operating costs in 2023 among non-expansion states, has expanded Medicaid eligibility up to 100% of the federal poverty level under a Medicaid waiver and therefore does not have a coverage gap.
Although Medicaid expansion has helped improve hospitals’ finances, operating margins were lower than average in 2023 among hospitals with relatively high Medicaid shares, according to KFF analysis. This is true overall and in both rural and urban areas.

Charity Care Costs in 2023 Were Generally Higher in States That Had Not Expanded Medicaid

5. Medicaid financing for hospitals is complex.

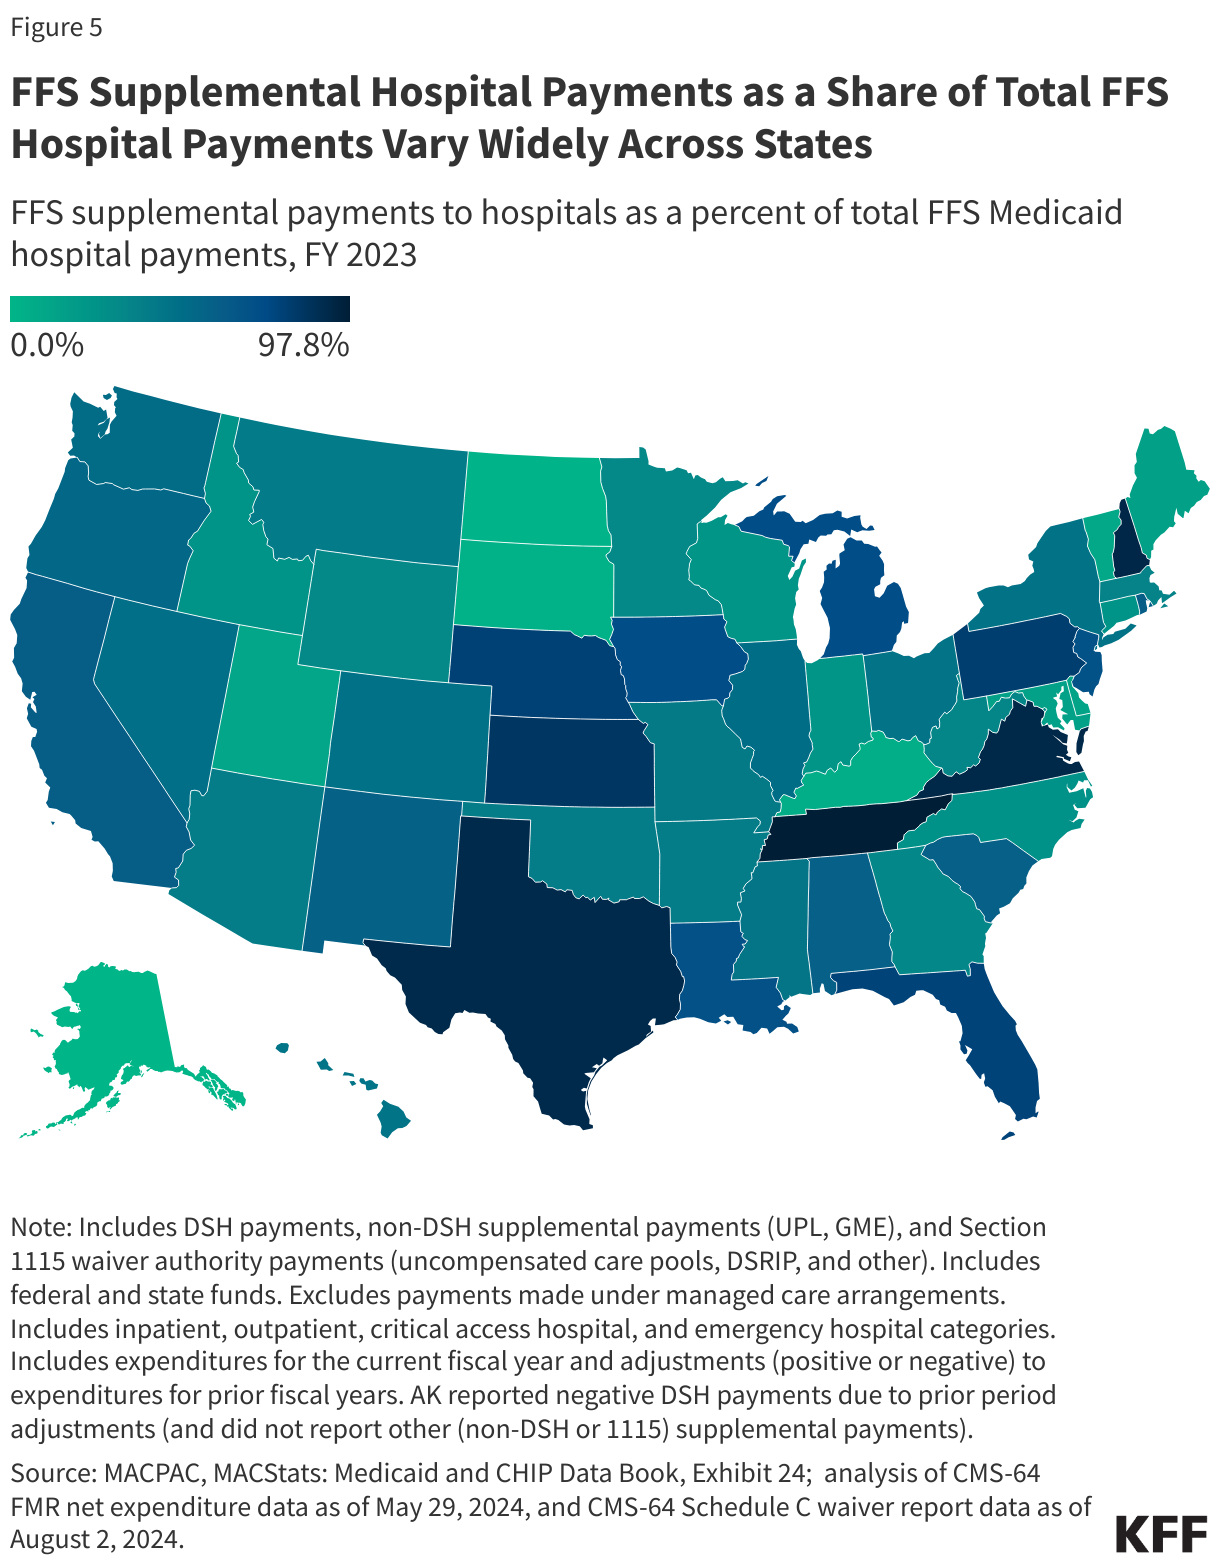
States deliver and pay for services in Medicaid through fee-for-service (FFS) or managed care (Box 1). Hospital FFS rates consist of base rates and supplemental payments. Base rates vary considerably across states and, on average, are below hospitals’ costs of providing services to Medicaid enrollees. States may rely on supplemental payments – such as payments to hospitals that serve a disproportionate share of low-income patients – to help cover hospitals’ costs. FFS supplemental hospital payments as a share of total FFS hospital payments vary widely across states. In eight states, FFS hospital supplemental payments make up more than 75% of total FFS hospital payments (Figure 5). States with capitated managed care arrangements are generally prohibited from contractually directing how managed care plans pay providers. Subject to CMS approval, however, states may implement certain “state directed payments” (SDPs). Many states that contract with managed care plans use SDPs to make uniform hospital rate increases that are like FFS supplemental payments (Box 1).

FFS Supplemental Hospital Payments as a Share of Total FFS Hospital Payments Vary Widely Across States

According to MACPAC, in FY 2022, 61% of Medicaid payments to hospitals were made through managed care delivery systems and 39% were made on a FFS basis. About half of FFS payments to hospitals were made through supplemental payments, while one third of managed care payments to hospitals were made through state directed payments. States are permitted to finance the non-federal share of Medicaid spending through multiple sources, including state general funds, health-care related taxes, and local government funds (Box 1). Most FFS hospital supplemental payments and state directed uniform rate increases are financed by provider taxes and funds from local governments. Efforts to restrict provider taxes or intergovernmental transfers could have bigger implications for states that rely more heavily on these financing mechanisms as well as states with larger shares of hospital funding for supplemental payments.

In an effort to increase access for Medicaid enrollees, Medicaid managed care rules finalized in 2024 permit states to pay hospitals and nursing facilities at the average commercial payment rate (ACR) when using directed payments, which is substantially higher than the Medicare payment ceiling used for Medicaid FFS supplemental payments. CBO Medicaid spending projections for 2025-2034 included a 4% (or $267 billion) increase from the February 2024 baseline to the June 2024 baseline, with half of the increase attributed to expected growth in directed payments in Medicaid managed care (driven in part by the rule change allowing states to pay at the ACR). Federal policy options under consideration include proposals to repeal the 2024 managed care rules (including the provision that formalized/codified states’ ability to pay certain providers up to the ACR) and proposals to limit the use of provider taxes.

Box 1: Medicaid Financing for Hospitals

Fee-for-service (FFS) Medicaid. States have substantial flexibility to establish provider reimbursement methodologies and amounts under FFS Medicaid. The two broad categories of FFS payment are (1) base rates and (2) supplemental payments, which are typically made in a lump sum for a fixed period of time. States use supplemental payments, including upper payment limit (UPL), disproportionate share hospital (DSH), or uncompensated care pool payments, to cover hospital costs that exceed the amounts covered by their FFS base rates. DSH payments can also be used to pay for unpaid costs of care for the uninsured. Because many types of supplemental payments are interchangeable, an increase in one type can lead to a decrease in another. Increases or decreases in base FFS payments may also result in supplemental payment changes. Reimbursement methodologies and levels may also vary by hospital type (e.g., community, critical access, and academic medical center hospitals).
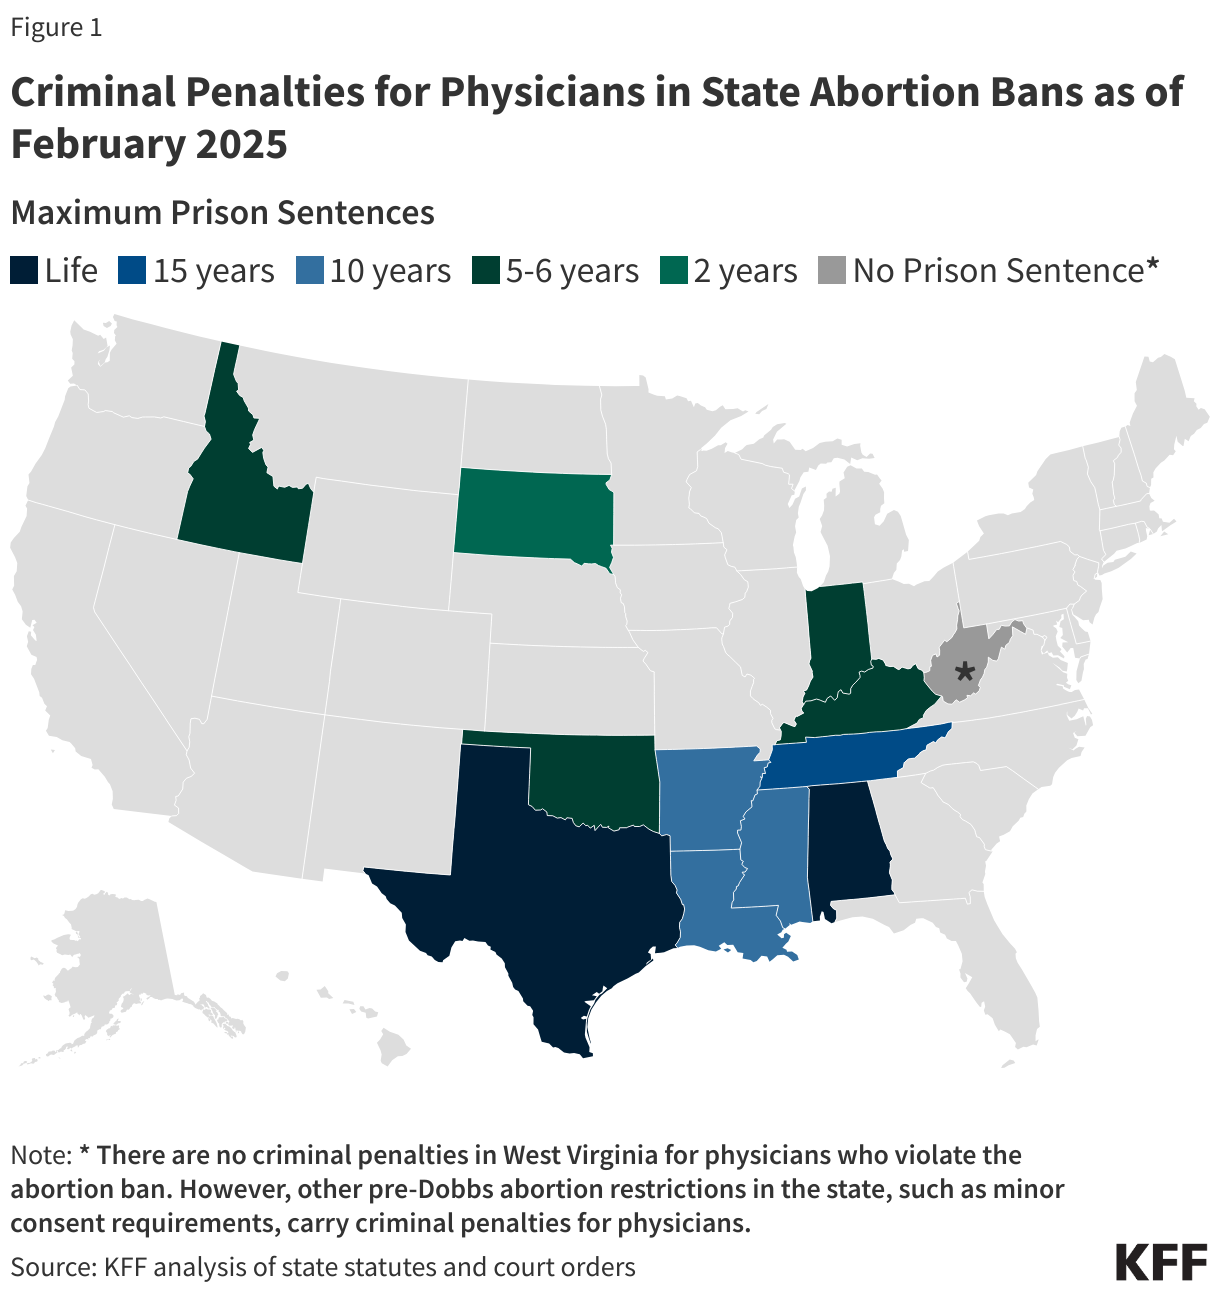
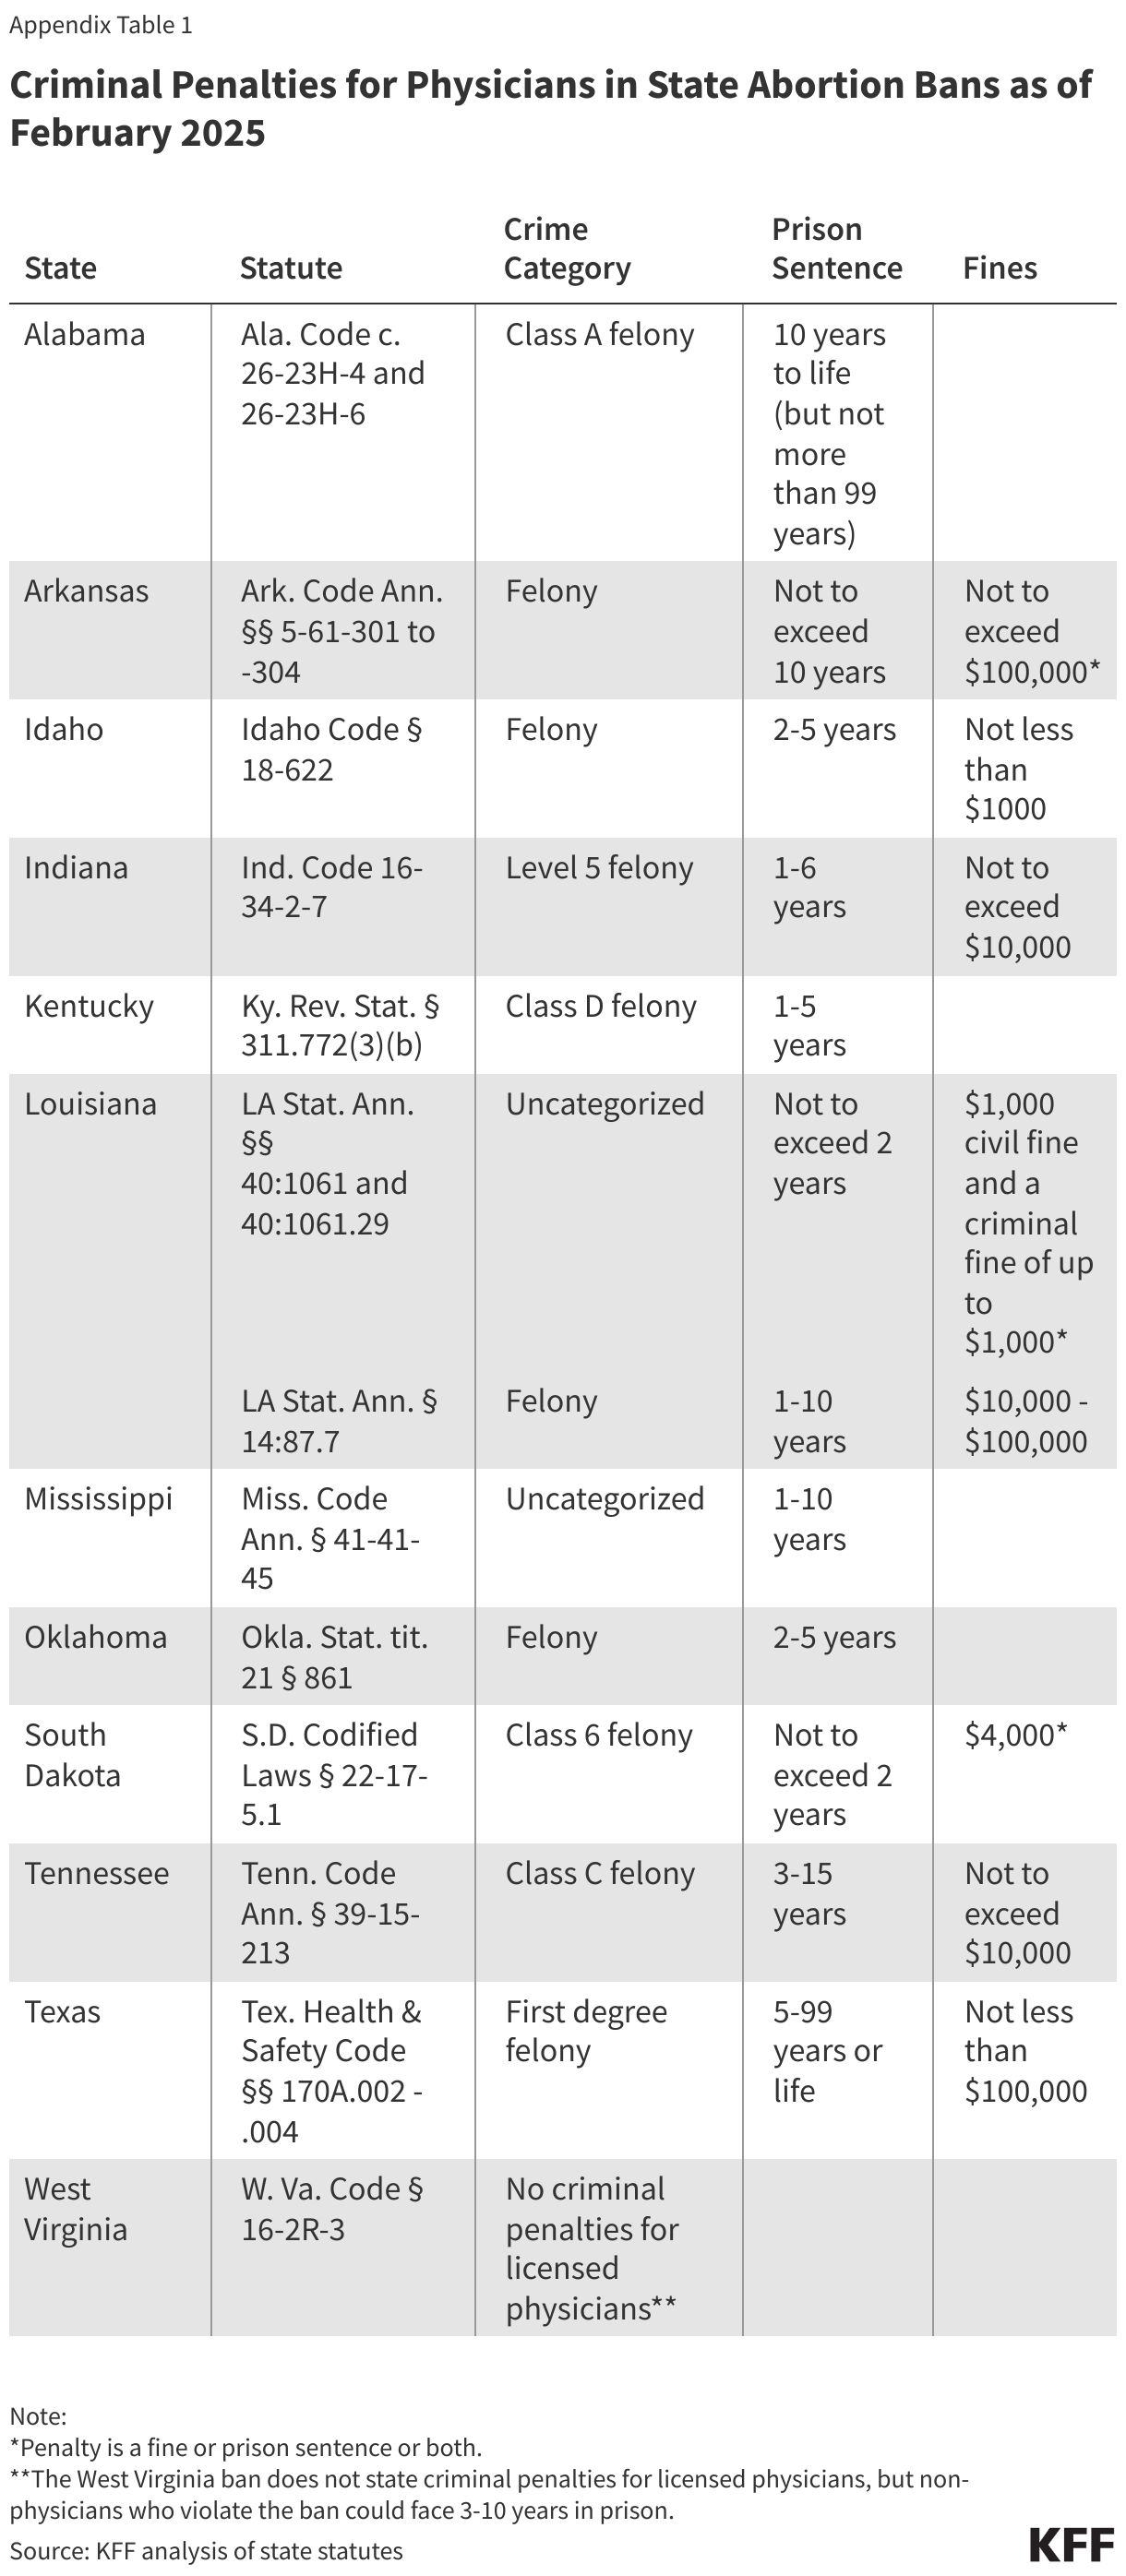
Medicaid managed care organizations (MCOs). Seventy-five percent of Medicaid beneficiaries were enrolled in Medicaid MCOs in 2022. States pay Medicaid managed care organizations a set per member per month (“capitation”) payment for the Medicaid services specified in their contracts. States are generally prohibited from contractually directing how a managed care plan pays its providers. Subject to CMS approval, states may implement “state directed payments” (SDPs) that require managed care plans to adopt minimum or maximum provider payment fee schedules, provide uniform dollar or percentage increases to network providers (above base payment rates), or implement value-based provider payment arrangements. Most states had an SDP for hospital services in place as of July 1, 2024 (37 of 41 responding states that contract with MCOs, excluding SDPs requiring a FFS payment floor) with most states reporting that hospital SDP payments as a percentage of total Medicaid hospital reimbursement were projected to increase in FY 2025. A few states reported plans to significantly increase hospital SDPs in FY 2025, including increases up to average commercial rates (which is the federal limit on SDPs).

Provider Taxes. States have flexibility in determining how to finance the non-federal share of state Medicaid payments. In addition to state general funds appropriated directly to the Medicaid program, most states also rely on funding from health care providers and local governments generated through provider taxes, user fees, intergovernmental transfers (IGTs), and certified public expenditures (CPEs). Over time, states have increased their reliance on provider taxes, with the growth in provider taxes frequently following economic downturns. Federal regulations require provider taxes to be broad-based (imposed on all non-governmental entities, items, and services within a class) and uniform (consistent in amount and scope across the entities, items, or services to which it applies) and that states must not hold taxpayers harmless (i.e., they must not directly or indirectly guarantee that the provider paying the tax will be repaid for all or a portion of the tax). However, there is a “safe harbor” exception that allows a state to use hold-harmless arrangements when the taxes it collects do not exceed 6 percent of a provider's net revenues from treating patients. A provider tax will meet the hold harmless “safe harbor threshold” if it generates revenue that does not exceed 6% of net patient revenue.

This work was supported in part by Arnold Ventures. KFF maintains full editorial control over all of its policy analysis, polling, and journalism activities.

Criminal Penalties for Physicians in State Abortion Bans

Authors: Mabel Felix, Laurie Sobel, and Alina Salganicoff
Published: Mar 4, 2025

Introduction

There have been several high-profile cases regarding exceptions to save the health or the life of pregnant patients in state abortion bans. Major cases that have reached the US Supreme Court (Moyle v. Idaho) and Texas Supreme Court (Zurawski v. Texas) have highlighted the significant challenges for physicians providing pregnancy-related care in states with abortion bans. According to a 2023 KFF survey, 61% of OBGYNs practicing in states where abortion is banned report being concerned about their legal risk when making decisions about patient care and the necessity of abortion care for their patients. Some of the concern about legal risks stems from the “reasonable medical judgment” legal standard used in most states for when an abortion qualifies for an exception. This legal standard does not defer to the treating physician’s judgment but rather allows a court to review circumstances after the abortion has been completed and rely on the testimony of other medical experts to determine whether the treating physician met the standard. Some anti-abortion advocates, legislators, and state attorneys general maintain, however, that it is physicians, not the abortion bans, that are responsible for denial and delays of care, and have implied that providers should face medical malpractice lawsuits for not properly following the exceptions. This brief examines the legal considerations for physicians providing abortion care, including criminal and professional penalties, as well as the potential for medical malpractice lawsuits for delayed care to patients due to bans and prosecution for violation of abortion bans across state lines.

What Criminal Penalties Do Physicians Face for Providing Abortions?

Eleven of the 12 states with abortion bans impose criminal penalties on clinicians who violate their respective bans. These penalties range in severity from a few months in prison to the possibility of a life sentence. All but two of these 11 states — Arkansas and South Dakota — impose minimum sentences for violation of their abortion bans. In Alabama, for example, violation of the total ban constitutes a Class A felony and carries a minimum prison sentence of ten years and a maximum sentence of 99 years. Class A felony is the most serious offense in Alabama, which places abortion in the same criminal category as murder and first-degree domestic violence. Other states place the violation of their abortion bans in the same category as crimes such as aggravated assault (Tennessee), involuntary manslaughter (Indiana), and stalking in violation of a protective order (Kentucky). West Virginia’s law does not include jail time for licensed physicians who violate the abortion ban, but it does include a 3–10-year sentence for other people who violate the law. However, other pre-Dobbs abortion restrictions in the state, such as minor consent requirements, carry criminal penalties for physicians.

Criminal Penalties for Physicians in State Abortion Bans as of February 2025

In addition, penalties include fines, and in many states, violation of the abortion ban or conviction of a felony are grounds for medical license revocation. If a physician’s license is revoked, even after they have served their sentence, they may not return to practicing medicine. License revocation penalties jeopardize physicians’ livelihoods. In many states, license revocation in a different state is grounds for denying a new medical license or revoking an existing license. This means that if a physician loses their license as a result of providing an abortion in a state where abortion is banned, they may not be able to practice medicine in other parts of the country.

Many states where abortion rights are supported have passed laws to protect clinicians from losing their license, amending their licensing provisions such that if a physician’s license has been revoked in a different state solely due to the provision of abortion care that would have been lawful in the state, the physician may not be denied a license. However, in these circumstances, there is no certainty that a physician would be able to receive a license in another state. And even if physicians had the certainty, continuing to practice medicine would require moving to another state.

No clinician has yet been convicted and jailed for performing an abortion since the Dobbs ruling, but a physician in New York, where abortion is protected, has been charged with a felony crime for mailing medication abortion pills that were given to a minor in Louisiana (discussed below). However, there have been cases indicating that the threat of criminal prosecution has led physicians to delay health- or life-preserving care and prevented them from practicing medicine based on accepted standards of care. A UCSF study identified multiple cases of patients with pregnancy complications being denied abortion care that met clinical standards in states where abortion is banned. Cases included second trimester obstetric complications such as preterm labor, preterm pre-labor rupture of membranes (PPROM), hemorrhage, cervical dilation, and hypertension, as well as ectopic pregnancy, Abortion care was also denied in case of patients with underlying medical conditions that made continuing a pregnancy dangerous, who were experiencing miscarriages, or were carrying a pregnancy with a severe fetal anomaly.

Medical Malpractice

While physicians are faced with criminal and professional penalties if they provide abortion care for health reasons that are later second-guessed in court, if they do not provide this care or delay it, they could potentially be sued for medical malpractice for failing to provide timely and necessary care.

Post-Dobbs, there are no documented cases of medical malpractice lawsuits being filed by pregnant patients who were denied care or did not receive it in a timely manner. However, there have been growing calls from anti-abortion advocates to hold treating physicians liable for delays or denials of miscarriage management care or other care to pregnant people.

In response to calls for exceptions to abortion bans to be widened in scope or be further clarified, anti-abortion lawmakers and attorneys general have argued that it is not policies, but rather the physicians who are at fault in situations where care has been delayed or denied. For instance, in the case Zurawski v. Texas, where women facing dangerous pregnancy complications who had been denied emergency abortion care and two OB-GYNs asked Texas courts to clarify the scope of the medical emergency exceptions in the state’s abortion bans, attorneys for the state of Texas argued that it was not the state’s abortion bans that prevented plaintiffs from receiving timely care. Instead, he argued that physicians committed malpractice and are at fault and suggested that people should sue their physicians, not the state, when they are unable to receive timely abortion care in life-threatening medical emergencies.

Prosecution of Providers Across State Lines

In 2023, some states started passing “shield” laws. These laws aim to protect physicians from prosecution brought by states where abortion is banned as long as the physician is located within the state with the shield law and the care they provided is legal in that same state, regardless of patient location. From July 2023 through June 2024, the Society of Family Planning estimates that 1 in 10 abortions in the U.S. have been medication abortions for which the pills were mailed by providers practicing in states with shield laws.

In December 2024, in the first action testing a shield law, the Texas Attorney General filed a lawsuit against a New York doctor for mailing medication abortion pills into the state. The lawsuit alleges the physician violated Texas law by practicing medicine in the state of Texas without a Texas license and for violating the state’s abortion ban and prohibitions on telehealth for abortion care. On February 13, 2025, after the physician did not respond to the lawsuit or appear at court proceedings, a trial court issued a default judgment for the state, enjoining the physician from prescribing medication abortions to Texas residents and ordering her to pay $100,000 in civil fines. Additionally, in January 2025, a Louisiana grand jury indicted the same New York physician for violating Louisiana’s abortion ban and restrictions. The mother of the minor who received the medication abortion was also indicted. Shield laws in the state of New York seek to protect providers from this kind of litigation, so these cases will likely serve as a test case for shield laws and their ability to protect clinicians providing abortion care via telehealth to patients located in states that ban or restrict abortion. In the Louisiana case, however, the minor’s mother does not have a similar protection from the ban.

Challenges to Exceptions to Abortion Bans

In response to the abortion bans, physicians practicing in Idaho, South Carolina, Tennessee, and Texas have filed lawsuits challenging the vagueness, narrowness, and lack of deference to physician judgment of the medical exceptions in state abortion bans. Among other claims, these challenges contend the vagueness of the exceptions unduly places physicians’ livelihoods and liberty at stake. Additionally, a complaint filed by South Carolina providers argues the state ban’s exceptions violate their First Amendment rights to practice their faith, which includes beliefs that they should use their medical training to honor patients’ requests to end pregnancies that threaten to profoundly harm them or when a fetus is diagnosed with a fatal anomaly, beyond what the exceptions allow.

The Texas Supreme Court has issued rulings in both the challenges in the state – Zurawski v. Texas and Cox v. Texas – ruling in favor of the state and leaving the narrow exceptions untouched. A Tennessee court partly granted a preliminary injunction blocking the state from taking disciplinary action against physicians who provide abortion care to safeguard the health of the pregnant person (unlike Texas, Tennessee has a health exception to their abortion ban). However, because the court lacked authority over criminal laws, it did not block criminal enforcement of the law against physicians. Whether or not these lawsuits will ultimately expand the scope of the exceptions or the deference granted to physician judgment will depend on the rulings of each state’s respective supreme court.

Criminal Penalties for Physicians in State Abortion Bans as of February 2025
News Release

Poll: Two Thirds Believe Dissolving USAID Will Lead to More Illness and Death Globally, While Nearly Half Say It Would Significantly Reduce the Budget Deficit and Fund Domestic Programs

Most of the Public Thinks Foreign Aid Accounts for a Much Larger Share of Federal Spending than It Does, and That Misperception Contributes to People’s Support for Budget Cuts

Published: Mar 4, 2025

As the Trump administration works to dissolve the U.S. Agency for International Development (USAID), a new KFF poll finds that two-thirds (67%) of the public believe these actions will increase illness and death in low-income countries, and a similar majority (62%) believe it will result in more humanitarian crises around the world.At the same time, nearly half of the public believe the dissolution of USAID will significantly reduce the U.S. budget deficit (47%) and allow funds to be redirected to domestic programs (47%).  Views on the impact of downsizing USAID divide sharply along partisan lines, with most Democrats and independents expecting more illness and death in low-income countries (91% and 69%, respectively), and most Republicans expecting positive impacts on domestic programs (72%) and the budget deficit (67%).The poll also finds that most of the public grossly overestimates how much the federal government spends on foreign aid. When informed that it is actually about 1% of the federal budget, far fewer people say the U.S. spends “too much” on foreign aid. 
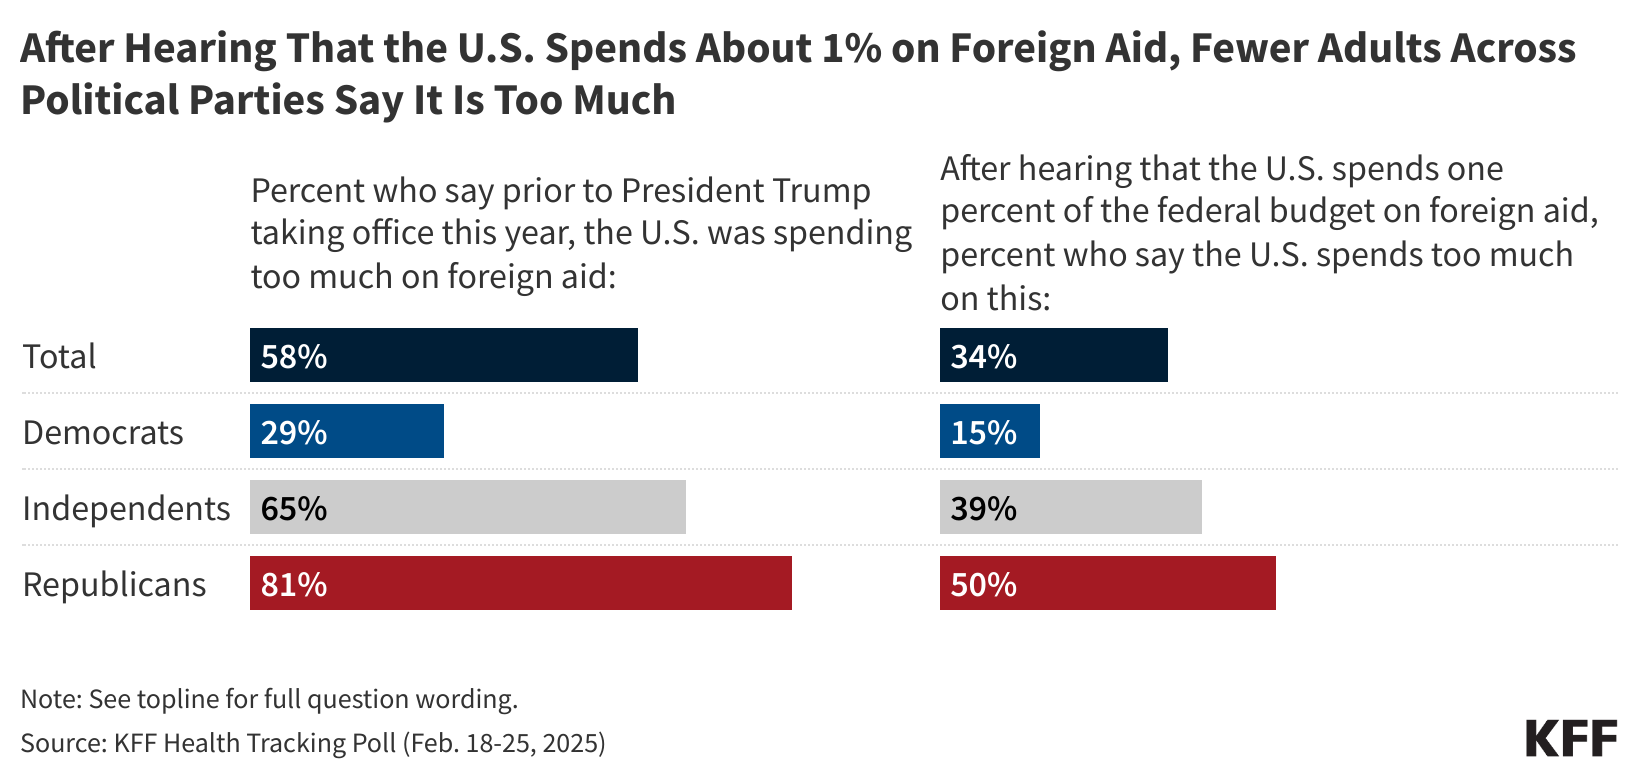
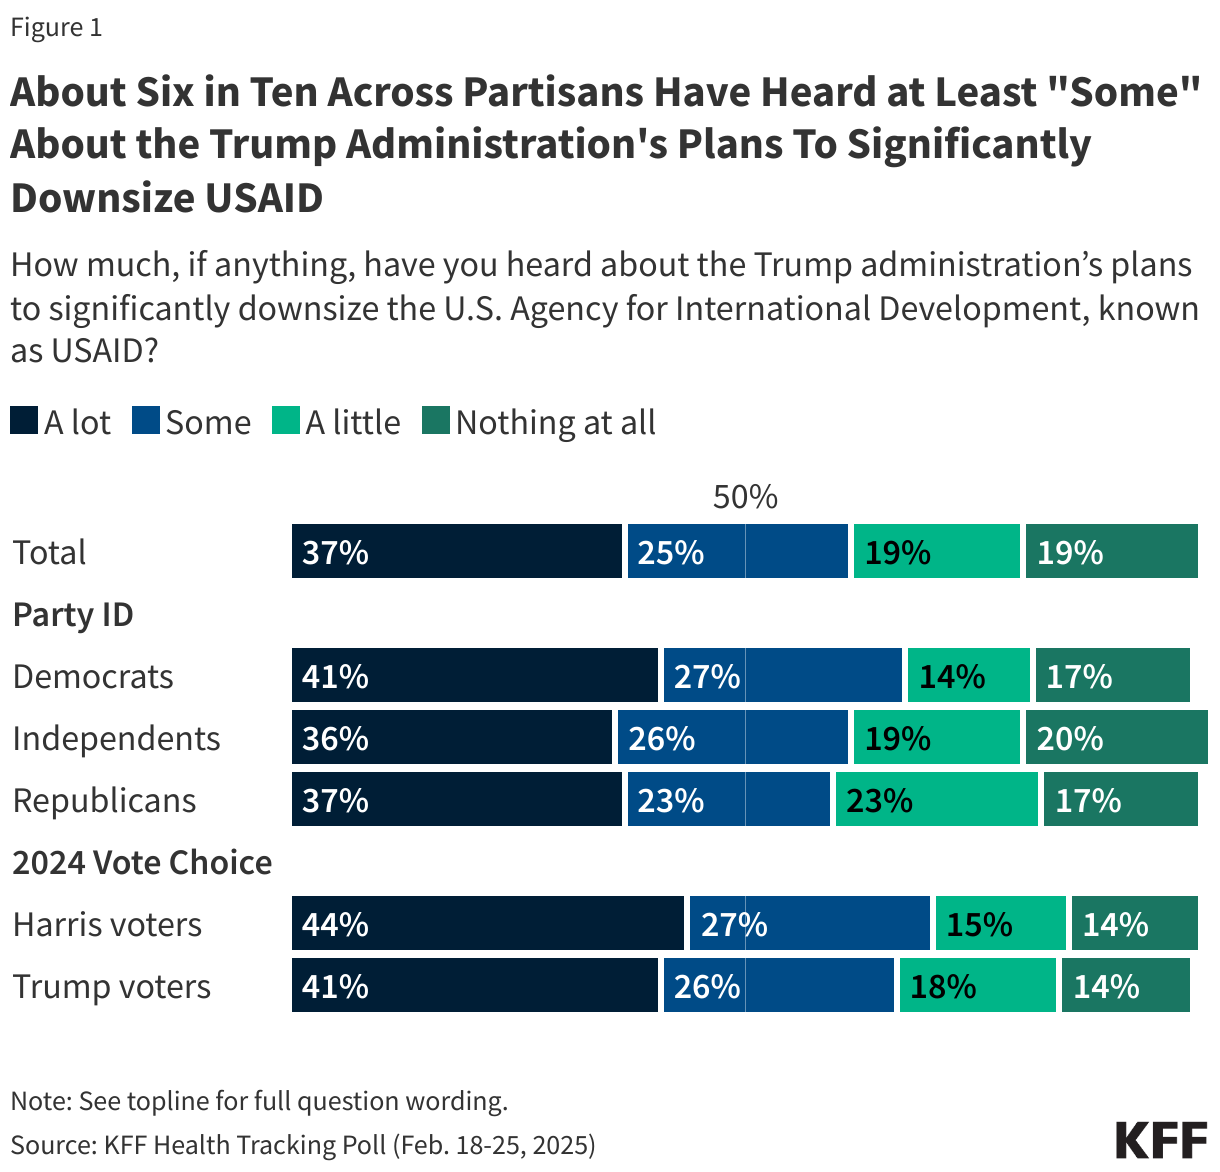
About one in ten (11%) adults correctly estimate that 1% or less of the federal budget goes to foreign aid, with others guessing higher amounts, including more than half (54%) who guess more than 10%. On average, U.S. adults guess that foreign aid accounts for 26% of the federal budget.When initially asked about the level of U.S. foreign aid prior to President Trump taking office, most say the country was spending “too much” (58%). After being informed that foreign aid accounts for about 1% of the federal budget, the share of the public who says that the U.S. spends too much on foreign aid drops more than 20 percentage points to one-third (34%). This shift is similar across partisans. After hearing that only about 1% percent of the federal budget is spent on foreign aid, the share saying the U.S. spends too much drops to 50% among Republicans, 39% among independents, and 15% among Democrats. 

The Public is More Supportive of Global Health Spending than Foreign Aid Overall

The poll also finds that half (50%) of the public believe the U.S. should play “the leading role” or “a major role” in efforts to improve health for people in developing countries. About a third (36%) say the U.S. should play a minor role in global health, while fewer (14%) say it should not play any role.Republicans’ views on the role that the U.S. should play in global health have shifted since President Trump’s first term. In the most recent poll, one-third (32%) of Republicans say the U.S. should play at least a major role in improving the health of people in developing countries, down from about half in KFF polls in 2016 and 2018. At the same time, the share of Republicans who say the U.S. should take “no role” in global health has risen from 9% in 2016 to one in four (24%) now. 

When asked about U.S. spending on global health, the public is more supportive than they are of spending on foreign aid generally. Nearly six in ten say that prior to President Trump taking office, the U.S. was spending either too little (19%) or about the right amount (37%) to improve health for people in developing countries, while about four in ten (43%) say the U.S. was spending “too much.”Seven in ten adults say spending money on improving health in developing countries helps protect the health of Americans by preventing the spread of infectious diseases, including about nine in ten Democrats (86%) and two-thirds of independents (67%). Republicans are split, with half saying this spending helps Americans in this way (49%) and half saying it does not have much of an impact (51%). 

Designed and analyzed by public opinion researchers at KFF. The survey was conducted Feb. 18-25, 2025, online and by telephone among a nationally representative sample of 1,322 U.S. adults in English and in Spanish. The margin of sampling error is plus or minus 3 percentage points for the full sample. For results based on other subgroups, the margin of sampling error may be higher.

Poll Finding

KFF Health Tracking Poll February 2025: The Public’s Views on Global Health and USAID

Published: Mar 4, 2025

Key Takeaways

  • As the Trump administration takes steps to dissolve the U.S. Agency for International Development (USAID) and freeze most foreign aid, including global health funding, the latest KFF Health Tracking Poll finds that a majority of the public expect this will lead to increased humanitarian and health crises globally while somewhat fewer expect the move to alleviate domestic fiscal issues. At least six in ten adults say that getting rid of USAID is likely to lead to more illness and death in low-income countries (67%) or more humanitarian crises around the world (62%). On the other hand, smaller shares – but still close to half – say getting rid of USAID will likely allow funds to be redirected to domestic programs (47%) or significantly reduce the U.S. budget deficit (47%). Partisans are strongly divided on the impacts of cutting USAID, with Democrats more likely to anticipate negative health and humanitarian consequences globally and Republicans more likely to expect positive fiscal outcomes at home.
  • The Trump administration plans to eliminate nearly all of USAID’s foreign aid awards, and though most adults say the U.S. was spending too much on foreign aid before Trump took office, the vast majority of the public do not want aid to be eliminated entirely. Just over one in ten (13%) say that, prior to Trump taking office in January, the U.S. was spending too much on foreign aid, and it should be eliminated entirely. Even among Republicans, the group most likely to say the U.S. was spending too much in this area before President Trump took office this year, scaling back on global health spending is more popular than ending all spending by a two-to-one ratio.
  • Overall, there is broad support for the U.S. playing a role in improving the health for people in developing countries, though the share of Republicans saying the U.S. should play a major role in this area has declined since 2016. Half of the public says the U.S. should take a leading or major role in improving health for people in developing countries, while about one-third (36%) say the U.S. should take a “minor role.” Just over half the public says that before Trump took office this year, the U.S. was spending too little (19%) or about the right amount (37%) on these efforts. Partisans divide on the role the U.S. should play and how much the country should spend, with most Republicans saying the U.S. should play a minor or no role and that it spends too much on health in developing countries, while majorities of Democrats want the U.S. to play a leading or major role and say the U.S. spends too little or the right amount. Few across partisans say the U.S. should not play a role at all in improving the health of people in developing countries.
  • In addition, the public continues to recognize a benefit of spending money on global health, including preventing rising infectious diseases from spreading to the U.S. A large majority of adults say that spending money on improving health in developing countries helps protect the health of Americans by preventing the spread of infectious diseases, including about nine in ten Democrats (86%) and two-thirds of independents (67%). Republicans are split, with half saying this spending helps Americans in this way (49%), down from 68% in 2016.
  • The public’s views on foreign aid may be shaped by misconceptions about its cost. Most U.S. adults overestimate the share of the federal budget that goes towards foreign aid, and attitudes towards spending shift once people know more information. Nearly nine in ten (86%) adults overestimate the share of the federal budget spent on foreign aid, saying on average that the U.S. spends about a quarter (26%) of its budget on foreign aid. And, after hearing that foreign aid accounts for about one percent of the federal budget, the share of the public who say that the U.S. spends too much on foreign aid drops more than twenty percentage points from six in ten (58%) to one-third (34%). This pattern is consistent across partisans.
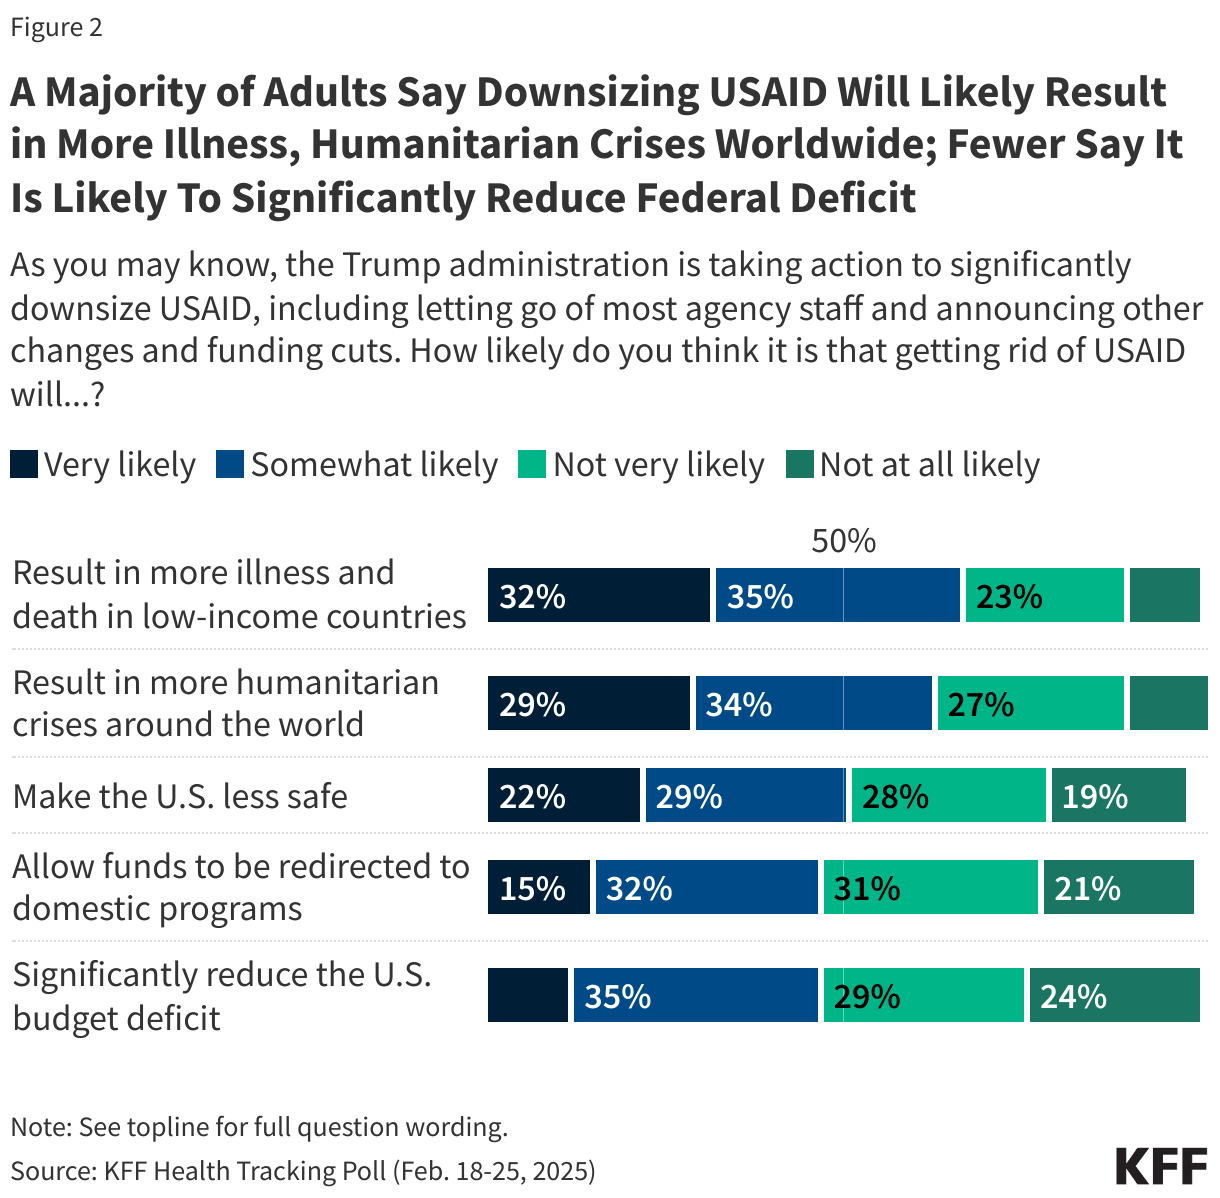
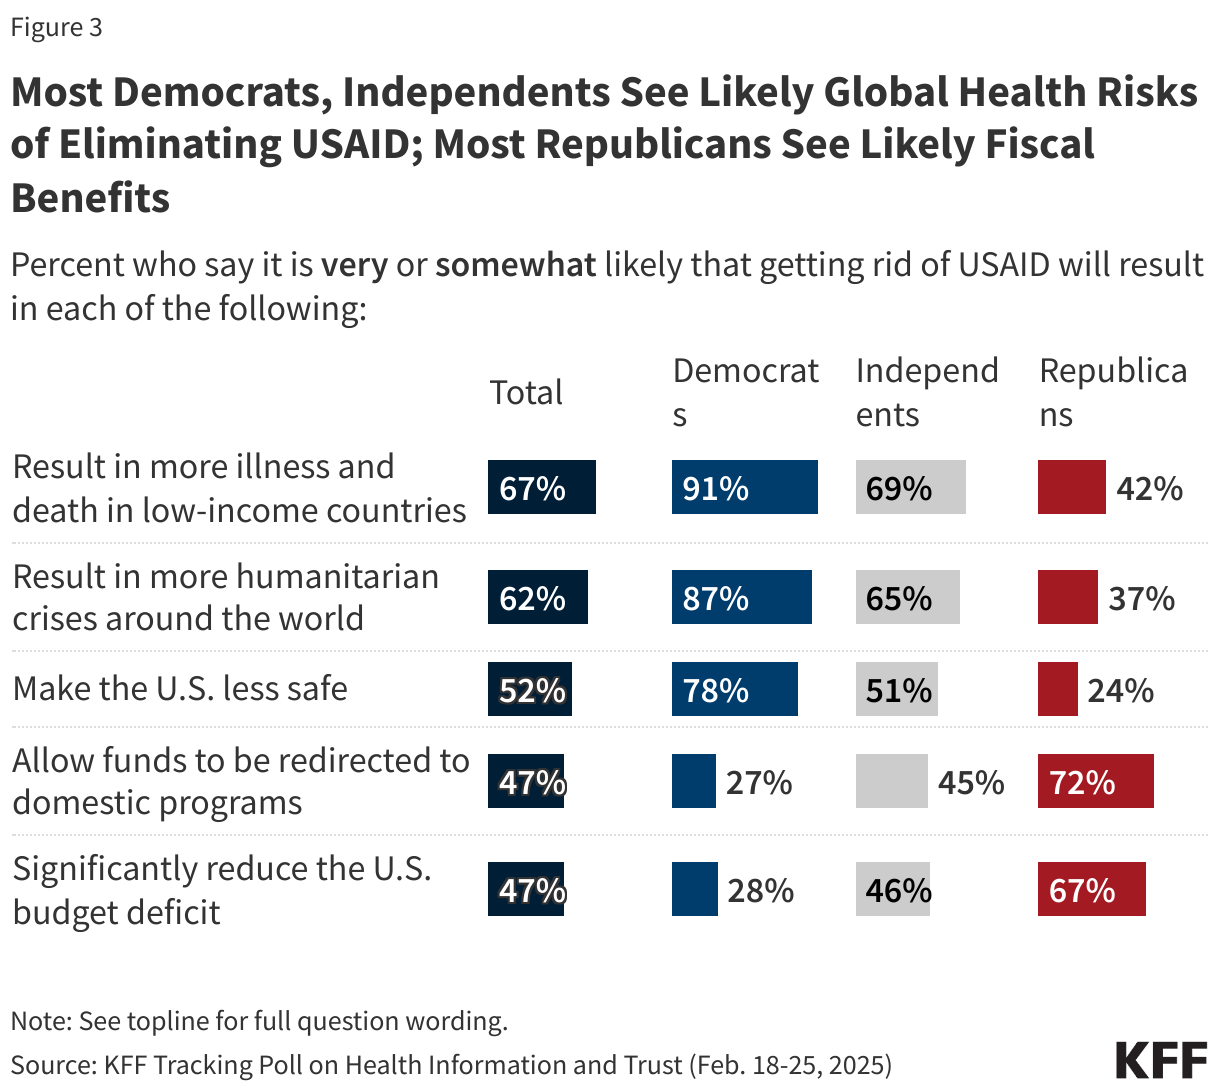
Most U.S. Adults Say Downsizing USAID Will Lead to Health and Humanitarian Crises; About Half Say It Will Alleviate the Federal Deficit

Since the start of his second term, President Trump and his administration have taken steps to dissolve the U.S. Agency for International Development, or USAID, and freeze most foreign aid, including global health funding. So far, the administration has removed the USAID website, let go of most of the agency’s staff, and hundreds of the agency’s awards and contracts have been canceled. There have been several legal challenges to the Trump administration’s actions, and as of this poll finding, cases are continuing to make their way through the courts. These executive actions have far-reaching implications for the U.S.’s involvement in global health.

News of the Trump administration’s action on USAID seems to be reaching people across the political spectrum as majorities across partisans, including about seven in ten Harris voters (71%) and Trump voters (68%), say they have heard “a lot” or “some” about the administration’s plans.

Stacked bar chart showing how much people have heard about the Trump administration's plans to downside USAID. Results shown by total, party identification, and 2024 presidential vote choice.

Most of the public thinks the downsizing of USAID will lead to increased risks to global health, while about half say these cuts will improve national budget issues. Two-thirds of the public overall say that getting rid of USAID will likely lead to more illness and death in low-income countries (67%), including about one-third (32%) who say this is “very likely” and about one-third (35%) who say this is “somewhat likely.” A similar majority says dismantling USAID will likely result in more humanitarian crises around the world (62%), with three in ten saying this is very likely (29%) and one-third (34%) saying it is “somewhat likely.” Much smaller shares – about one in ten (11%) – say either of these outcomes is “not at all likely.”

The public is split on whether they expect the dismantling of USAID to pose a safety issue at home. About half of adults say that eliminating USAID will make the U.S. less safe (52%), including about one in five (22%) who say this is “very likely” and three in ten (29%) who say it is “somewhat likely.” Half of the public says eliminating USAID is “not very likely” (28%) or “not at all likely” (19%) to make the U.S. less safe.

The public is also split on their assessment of the likelihood of some positive consequences of reducing USAID. About half of adults say it is at least somewhat likely that getting rid of USAID will allow funds to be redirected to domestic programs (47%) or significantly reduce the U.S. budget deficit (47%). Smaller shares say either of these outcomes is “very likely” (15% and 12%, respectively). Because foreign aid spending, much of which is provided through USAID, makes up such a small percentage of the overall federal budget, its reduction will not significantly reduce the deficit.

Stacked bar chart showing how likely people believe the Trump administration's plans to downsize USAID will impact the U.S. and global health.

The public is split along party lines in their views on the consequences of dismantling USAID. Large majorities of Democrats say it would lead to health and humanitarian crises and make the U.S. less safe, while at least two-thirds of Republicans say cutting USAID is likely to result in positive effects on domestic fiscal issues. About nine in ten Democrats say ending the agency would likely lead to more illness and death in low-income countries (91%), while about four in ten (42%) Republicans agree. Similarly, about nine in ten Democrats say it will likely lead to more humanitarian crises worldwide (87%). About four in ten (37%) Republicans say the same. Two-thirds of independents say these negative global health consequences are likely.

Larger shares of Democrats also see safety risks, with nearly eight in ten Democrats saying getting rid of USAID will make the U.S. less safe (78%). Half of independents (51%) and one in four Republicans (24%) agree.

Republicans are more aligned with the Trump administration’s rationale for cutting USAID. Two-thirds (67%) say it is likely that this move will significantly reduce the U.S. federal budget deficit, compared to about three in ten (28%) Democrats and about half (46%) of independents. Similarly, seven in ten (72%) Republicans say it is likely ending USAID will allow for funds to be redirected to domestic programs, while smaller shares of independents (45%) and Democrats (27%) agree.

Split bar chart showing shares of adults, by party identification, who say it is likely that getting rid of USAID will impact the U.S. and global health.

Most of the Public Say the U.S. Spends Too Much on Foreign Aid, But Views Change After Hearing Actual Amount Spent

The Trump administration’s move to cut foreign aid and dismantle USAID is part of the administration’s plan to cut federal spending overall. However, about one percent of the federal budget goes to foreign aid. The public largely overestimates the share of the budget that goes to foreign aid, with about one in ten (11%) adults correctly estimating the share to be about one percent or less. This pattern is consistent with previous KFF polls.

About nine in ten (86%) incorrectly say foreign aid accounts for at least two percent of the federal budget, including more than half (54%) who believe it makes up more than 10 percent. On average, the public says spending on foreign aid makes up roughly one quarter (26%) of the federal budget. Across partisans, the public overestimates the share of the federal budget allocated for foreign aid. However, Republicans are most likely to overestimate foreign aid spending. On average, Republicans say foreign aid accounts for about 31% of the federal budget, while Democrats and independents estimate it to be around one quarter (23% and 24% respectively).

Bar chart showing the perceived amount of money the U.S. spends on foreign aid and highlighting the actual amount spent.

Amid news of the major cuts to foreign aid by the Trump administration, the poll also asked what the public thought about federal spending abroad prior to President Trump taking office. About six in ten U.S. adults say that prior to President Trump taking office this year, the U.S. was spending “too much” on foreign aid (58%), while about one in ten (11%) say the U.S. spent “too little”, and about three in ten (29%) say the U.S. was spending “about the right amount.”

However, after hearing the factual statement that only about one percent of the federal budget is spent on foreign aid, the share who say the U.S. is spending “too much” decreased more than twenty percentage points, down to about one-third (34%) of the public who now say the federal government is spending “too much” on foreign aid. In the same vein, the share of the public who now say the U.S. spends “too little” increased by 17 percentage points to about three in ten (28%).

Stacked bar chart showing peoples opinion on the amount of U.S. foreign aid spending before and after hearing the real amount spent.

This shift is similar across partisans. After learning that approximately one percent of the federal budget is spent on foreign aid, the share saying the U.S. spends “too much” declines by 31 percentage points among Republicans, 26 percentage points among independents, and 14 percentage points among Democrats.

Split bar chart showing the share of people, by party identification, who believe the U.S. is spending too much on foreign aid before and after hearing the actual amount spent.

Despite court orders to release frozen aid funding, the Trump administration continues to withhold nearly all foreign aid and has just eliminated more than 90% of USAID’s contracts and grants for foreign assistance. Ending all foreign aid spending is not a popular position among the U.S. public, with just about one in ten adults (13%) saying the U.S. should do so. Instead, while many say the U.S. is spending too much, most want to see the U.S. scale back rather than end all spending. In fact, the public prefers scaling back spending over ending all spending by a more than three-to-one ratio (43% compared to 13%).

Across partisans, “scaling back spending” on foreign aid is more favorable than “ending all spending.” Half (53%) of Republicans say the U.S. was spending too much on foreign aid and that it should be scaled back, compared to fewer (28%) who say it should be ended completely. Half of independents prefer scaling back spending, while just one in ten (11%) say all spending on foreign aid should end. While Democrats are much more likely to say that the U.S. spends the right amount on foreign aid, among the 29% who say that the U.S. was spending too much, very few (2%) say this funding should cease.

Stacked bar chart showing how much people think the U.S. was spending on foreign aid and whether they should change the amount spent. Results shown by total and party identification.

The Public’s Views on the Role of the U.S. in Global Health

President Trump’s “America First” Agenda emphasizes domestic interests, removing the U.S. from the global arena, including when it comes to global health. In addition to the dismantling of USAID, one of Trump’s first executive orders was to withdraw the U.S. from the World Health Organization (WHO) and to reevaluate and realign U.S. foreign aid, which has led to freezing all foreign aid funding and most programs, limiting the U.S.’s influence and spending on preventing infectious diseases globally. Among the public, there is broad support for the U.S. playing a role in improving health for people in developing countries. Half of the public says that the U.S. should take “the leading role” or “a major role, but not the leading role” in improving health for people in developing countries. About one-third (36%) say the U.S. should take a minor role, while fewer (14%) say the U.S. should not play a role in this area. While Democrats are more likely to want the U.S. to take a leading or major role (69%) in improving the health for people in developing countries, about half of Republicans and key segments of President Trump’s base, including those aligned with the Make America Great Again (MAGA) movement, favor the U.S. taking a “minor role” in global health. Few across political affiliation say the U.S. should have “no role at all.”

Stacked bar chart showing the role people believe the U.S. should take in improving health for people in developing countries. Results shown by total, party identification, 2024 presidential vote choice, and MAGA support.

Republicans’ views on the U.S.’s role in global health have shifted since President Trump’s first term. KFF polls from 2016 and 2018 show that about half of Republicans at the time supported the U.S. taking at least a major role in improving global health. In the most recent poll, the share of Republicans who support this role for the U.S. has fallen to about one-third (32%). Additionally, the share of Republicans who say the U.S. should take “no role” in improving the health of people in developing countries has risen from 9% in 2016 to about one in four (24%) currently. At the same time, KFF polling does not find a similar shift among Democrats or independents. About seven in ten Democrats and half of independents have consistently said the U.S. should play a “major” or “leading role” in improving global health.

Split bar chart showing the percent of partisans over time, who say the U.S. should have a major or leading role in improving health for people in developing countries.

The U.S. global health funding budget is just $12 billion, or less than 0.1% of the overall federal budget. While the process for funding global health is complex, USAID implements most U.S. global health bilateral assistance. When asked about U.S. spending on global health, the public is more supportive than of foreign aid generally. About six in ten say, prior to President Trump taking office, the U.S. was spending too little (19%) or about the right amount (37%) on efforts to improve health for people in developing countries, while about four in ten (43%) say the U.S. was spending “too much.”

Stacked bar chart showing how much people believe the U.S. was spending, prior to President Trump's administration, on improving global health.

Eliminating all spending on efforts to improve the health of people in foreign countries is unpopular among the public. Few adults (11%) saying the Trump administration should end all spending, while about three in ten (31%) say this funding should be scaled back but not eliminated. Even among Republicans, the group most likely to say the U.S. was spending too much in this area before President Trump took office this year, two in ten (22%) say the Trump administration should eliminate all funding for global health.

Few Adults Across Partisans Say the U.S. Should End All Spending on Global Health

Two-thirds of adults (67%) say that spending money on improving health in developing countries helps protect the health of Americans by preventing the spread of infectious diseases, including about nine in ten Democrats (86%) and two-thirds of independents (67%). Republicans are split, with half saying this spending helps Americans in this way (49%) and half saying it does not have much of an impact (51%). Previous KFF polling shows that most U.S. adults say the most important reason the U.S. should spend money on global health is because “it is the right thing to do,” but that many people also believe such spending helps protect Americans from infectious diseases.

Attitudes on the benefits of global health spending among Republicans have shifted. A KFF poll from April 2016 showed large majorities of adults across partisans saying that spending money on improving health in developing countries helps protect the health of Americans by preventing the spread of diseases, including nearly seven in ten Republicans (68%). While the share of Democrats recognizing this benefit has increased slightly since 2016, the share of Republicans saying the same has decreased by 17 percentage points.

Split bar chart showing the share of people who think spending money on health in developing countries helps or does not have much impact. Results by total and party identification.

This KFF Health Tracking Poll was designed and analyzed by public opinion researchers at KFF. The survey was conducted February 18-25, 2025, online and by telephone among a nationally representative sample of 1,322 U.S. adults in English (1,254) and in Spanish (68). The sample includes 1,014 adults (n=53 in Spanish) reached through the SSRS Opinion Panel either online (n=992) or over the phone (n=22). The SSRS Opinion Panel is a nationally representative probability-based panel where panel members are recruited randomly in one of two ways: (a) Through invitations mailed to respondents randomly sampled from an Address-Based Sample (ABS) provided by Marketing Systems Groups (MSG) through the U.S. Postal Service’s Computerized Delivery Sequence (CDS); (b) from a dual-frame random digit dial (RDD) sample provided by MSG. For the online panel component, invitations were sent to panel members by email followed by up to three reminder emails.

Another 308 (n=15 in Spanish) adults were reached through random digit dial telephone sample of prepaid cell phone numbers obtained through MSG. Phone numbers used for the prepaid cell phone component were randomly generated from a cell phone sampling frame with disproportionate stratification aimed at reaching Hispanic and non-Hispanic Black respondents. Stratification was based on incidence of the race/ethnicity groups within each frame. Among this prepaid cell phone component, 140 were interviewed by phone and 168 were invited to the web survey via short message service (SMS).

Respondents in the prepaid cell phone sample who were interviewed by phone received a $15 incentive via a check received by mail. Respondents in the prepaid cell phone sample reached via SMS received a $10 electronic gift card incentive. SSRS Opinion Panel respondents received a $5 electronic gift card incentive (some harder-to-reach groups received a $10 electronic gift card). In order to ensure data quality, cases were removed if they failed two or more quality checks: (1) attention check questions in the online version of the questionnaire, (2) had over 30% item non-response, or (3) had a length less than one quarter of the mean length by mode. Based on this criterion, no cases were removed.

The combined cell phone and panel samples were weighted to match the sample’s demographics to the national U.S. adult population using data from the Census Bureau’s 2024 Current Population Survey (CPS), September 2023 Volunteering and Civic Life Supplement data from the CPS, and the 2024 KFF Benchmarking Survey with ABS and prepaid cell phone samples. The demographic variables included in weighting for the general population sample are sex, age, education, race/ethnicity, region, civic engagement, frequency of internet use, political party identification by race/ethnicity, and education. The weights account for differences in the probability of selection for each sample type (prepaid cell phone and panel). This includes adjustment for the sample design and geographic stratification of the cell phone sample, within household probability of selection, and the design of the panel-recruitment procedure.

The margin of sampling error including the design effect for the full sample is plus or minus 3 percentage points. Numbers of respondents and margins of sampling error for key subgroups are shown in the table below. For results based on other subgroups, the margin of sampling error may be higher. Sample sizes and margins of sampling error for other subgroups are available on request. Sampling error is only one of many potential sources of error and there may be other unmeasured error in this or any other public opinion poll. KFF public opinion and survey research is a charter member of the Transparency Initiative of the American Association for Public Opinion Research.

GroupN (unweighted)M.O.S.E.
Total1,322± 3 percentage points
.
Party ID
Democrats432± 6 percentage points
Independents424± 6 percentage points
Republicans377± 6 percentage points