The U.S. & The Global Fund to Fight AIDS, Tuberculosis and Malaria

Published: Dec 3, 2024

This fact sheet does not reflect recent changes that have been implemented by the Trump administration, including a foreign aid review and restructuring. For more information, see KFF’s Overview of President Trump’s Executive Actions on Global Health.

Key Facts

  • The Global Fund to Fight AIDS, Tuberculosis and Malaria (Global Fund), founded in 2002, is an independent, multilateral financing entity designed to raise significant resources and accelerate efforts to end the HIV, tuberculosis (TB), and malaria epidemics.
  • The U.S. government (U.S.), which provided the Global Fund with its founding contribution, is its largest single donor; between FY 2001 and FY 2024 regular Congressional appropriations to the Global Fund totaled approximately $26 billion. In FY 2021, an additional $3.5 billion was provided by Congress as emergency funding to respond to the COVID-19 pandemic.
  • The U.S. also plays a key role in the organization’s governance and oversight, having its own Board seat and sitting on two of the Board’s committees.
  • As of October 2024, the Global Fund had approved more than $78 billion in funding to almost 130 countries for its core HIV, TB, and malaria programs; the Global Fund estimates these investments have helped to save 65 million lives. In addition to its core programmatic activities, the Global Fund played a major role in COVID-19 response efforts, awarding over $5 billion to respond to COVID-19 as of July 2024, and continues to support countries as they shift from emergency pandemic response to longer-term health systems strengthening and pandemic preparedness efforts.
  • The Global Fund’s eighth replenishment cycle, where it will mobilize resources from donors for its next funding cycle, will take place in 2025.

What is the Global Fund?

Overview

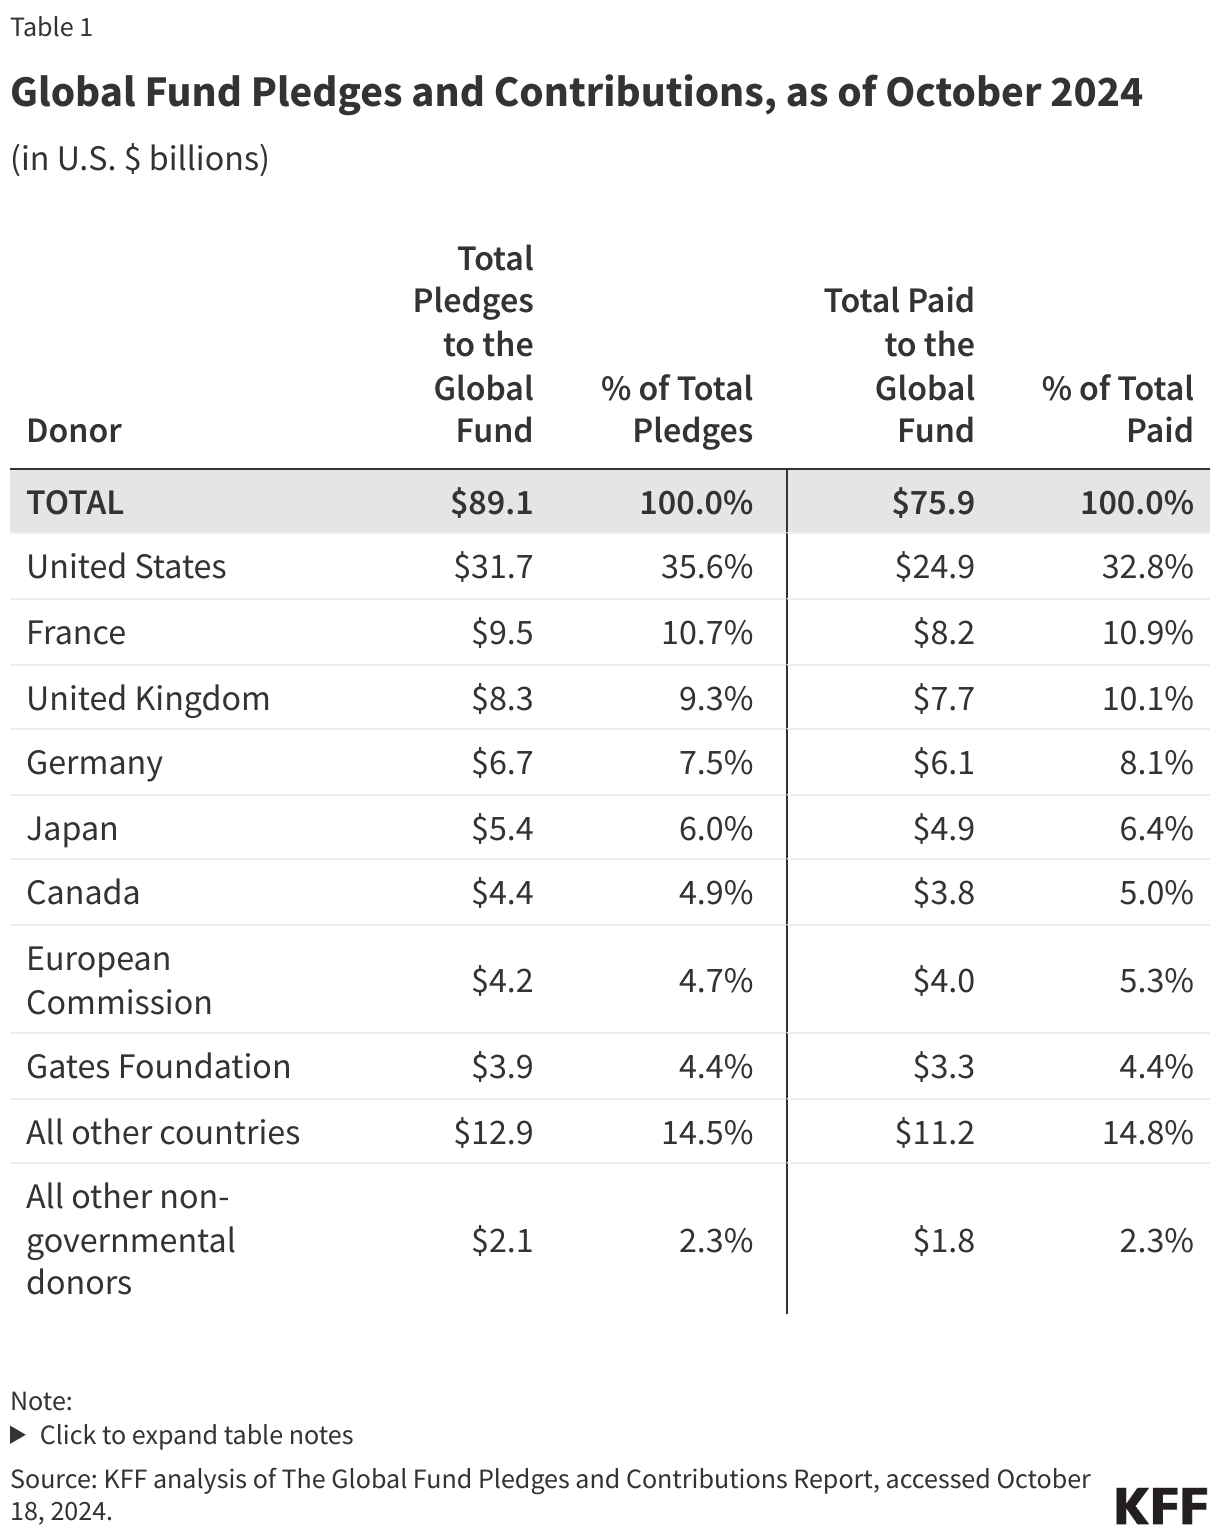
The Global Fund is an independent, multilateral financing entity designed to raise significant new resources to combat HIV, tuberculosis (TB), and malaria in low- and middle- income countries. First proposed in 2001, the Global Fund began operations in January 2002 and receives funding from both public and private donors to finance programs developed and implemented by recipient countries. The Global Fund uses a “country-defined” and “results-based financing” model that focuses on country ownership and is supported by investments from both donors and implementing countries (by contrast, bilateral support is provided from donors directly to recipient country governments, non-governmental organizations, and other entities and often reflects donor-defined priorities). To date, approximately $89 billion1  has been pledged by all donors (governments, the private sector, and private foundations) to the Global Fund, including $15.7 billion at the latest replenishment conference for the 2023-2025 funding cycle. Using these resources, the Global Fund has approved more than $78 billion in grants to almost 130 countries2  for its core HIV, TB, and malaria programs, and awarded over $5 billion in funding to respond to the COVID-19 pandemic’s impact on efforts related to these three epidemics.3  The Global Fund’s eighth replenishment cycle, where it will mobilize resources from donors for its next funding cycle, will take place in 2025.

The U.S. has played an integral role in the Global Fund since its inception. Under the George W. Bush administration, the U.S. provided the Global Fund with its founding contribution and was involved in the initial negotiations on the multilateral organization’s design. Under the Obama administration, the U.S. pledged $12.3 billion to the Global Fund over three replenishment periods.4  The Trump administration had proposed funding cuts to the Global Fund and a reduced pledge amount, although Congress rejected these proposals.5  The Biden administration signaled increased support for the Global Fund, particularly given its direct role in responding to the COVID-19 pandemic (see the Global Fund & COVID-19 section below), and pledged $6 billion over a three-year period6  at the latest replenishment conference in September 2022. The U.S. also provided an additional $3.5 billion in FY 2021 emergency funding to the Global Fund to address the impact of COVID-19 on HIV, TB, and malaria programs.

In addition to being the Global Fund’s single largest donor (see Table 1), the U.S. has a permanent seat on the Board of the Global Fund, giving it a key role in governance and oversight.7  The Global Fund has been called the “multilateral component” of the U.S. President’s Emergency Plan for AIDS Relief (PEPFAR), the U.S. government’s global effort to combat HIV (see the KFF fact sheet on PEPFAR), serving as a significant part of the U.S. government’s global health response, expanding its reach to more countries, and leveraging additional donor resources.

Still, long-ongoing discussions include the appropriate balance of U.S. funding between the Global Fund and U.S. bilateral programs, how to ensure the Global Fund’s sustainability and ability to provide the needed level of support (particularly given continued high demand for its support from countries, even amid a shortfall in available resources), and more broadly, the role of multilateralism in U.S. global health policy.8  Further, the appropriate shape of its role in strengthening health and community systems and, more broadly, pandemic preparedness and response, (its latest strategy includes a new pandemic preparedness and response objective) is also the subject of discussion.9 

Global Fund Pledges and Contributions, as of October 2024

Funding Model & Organizational Structure10 

The Global Fund was established as an independent foundation under Swiss law and operates as a multilateral financing entity. Funding is pooled from multiple sources, including from donor governments, the private sector, and private foundations. Countries submit proposals to the Global Fund, and if approved, funding is provided using a performance-based system where a grant is regularly monitored and evaluated to determine if it should be extended or discontinued based on the effectiveness of the program. Eligibility for funding is based on a country’s income classification and disease burden.11  Also, in order to incentivize recipient countries to increase their domestic investments and increase country ownership (ultimately preparing countries for graduation from Global Fund support), the Global Fund includes a policy that at least 15% of funding is conditional upon increases in co-financing (see KFF brief on co-financing for more).12 

The Global Fund’s organizational structure includes a broad set of stakeholders, and the U.S. government is involved in many of its core structures:

  • Board. The Board guides policy and strategic decisions and approves all funding. There are 20 voting members (10 implementers and 10 donors) and 8 non-voting members as follows:
    • Implementers:
      • Developing countries: seven members, one from each of the six WHO regions and an additional member from Africa.
      • Civil Society: three members, one from a developing country non-governmental organization (NGO), one from a developed country NGO, and one representative from an NGO who is a person living with HIV/AIDS or from a community living with TB or malaria.
    • Donors:
      • Government: eight members, including the U.S., which has a permanent Board seat. The U.S. also sits on the Audit & Finance and Ethics & Governance Committees.
      • Private Sector: one member.
      • Private Foundation: one member.
    • Non-voting: eight members, including the Global Fund Executive Director, the Board Chair and Vice-Chair, one representative from Global Fund partner organizations, one representative each from WHO, UNAIDS, and the World Bank, and one representative from certain public donors that are not part of a voting donor constituency.
  • Secretariat. Based in Geneva, the Secretariat manages day-to-day operations. Because the Global Fund finances but does not implement programs, it does not maintain any in-country staff.
  • Office of the Inspector General. An independent body of the Global Fund that reports directly to the Board through its Audit and Finance Committee, the Office of the Inspector General provides the Board with audits and investigations of the Fund’s activities, in an effort to promote good practices, reduce funding risks, and report on potential abuse.
  • Technical Review Panel (TRP). An independent body of global health and development experts (which has included U.S. government experts) appointed by the Board to evaluate the merits of all proposals and make funding recommendations to the Board.
  • Independent Evaluation & Learning. An independent body consisting of an Evaluation & Learning Office and Independent Evaluation Panel (IEP) that provides advisory services and oversight on the Fund’s evaluation efforts, including progress toward achieving the goals laid out in its strategy.13 
  • Country Coordinating Mechanisms (CCMs). The country-level entity comprised of public and private sector representatives, such as governments, businesses, and NGOs, that submits proposals to the Global Fund and oversees funded grants within a country. U.S. representatives sit on CCMs in almost all PEPFAR focus countries and often help with proposal development. The U.S. has also entered into a memorandum of understanding (MOU) in several countries to bring together PEPFAR with Ministries of Health and the Global Fund to clarify collaboration and partnership activities, particularly in the area of antiretroviral drug procurement.
  • Principal Recipients (PR). The legal entity chosen by the CCM to receive Global Fund disbursements, implement programs or contract with sub-recipients, and provide regular reports and progress updates to the Secretariat.
  • Local Funding Agents (LFA). Since it does not have an in-country presence, the Global Fund contracts with a local entity (usually an accounting firm) to monitor program implementation, ensure financial accountability, and provide funding recommendations to the Secretariat.

Results

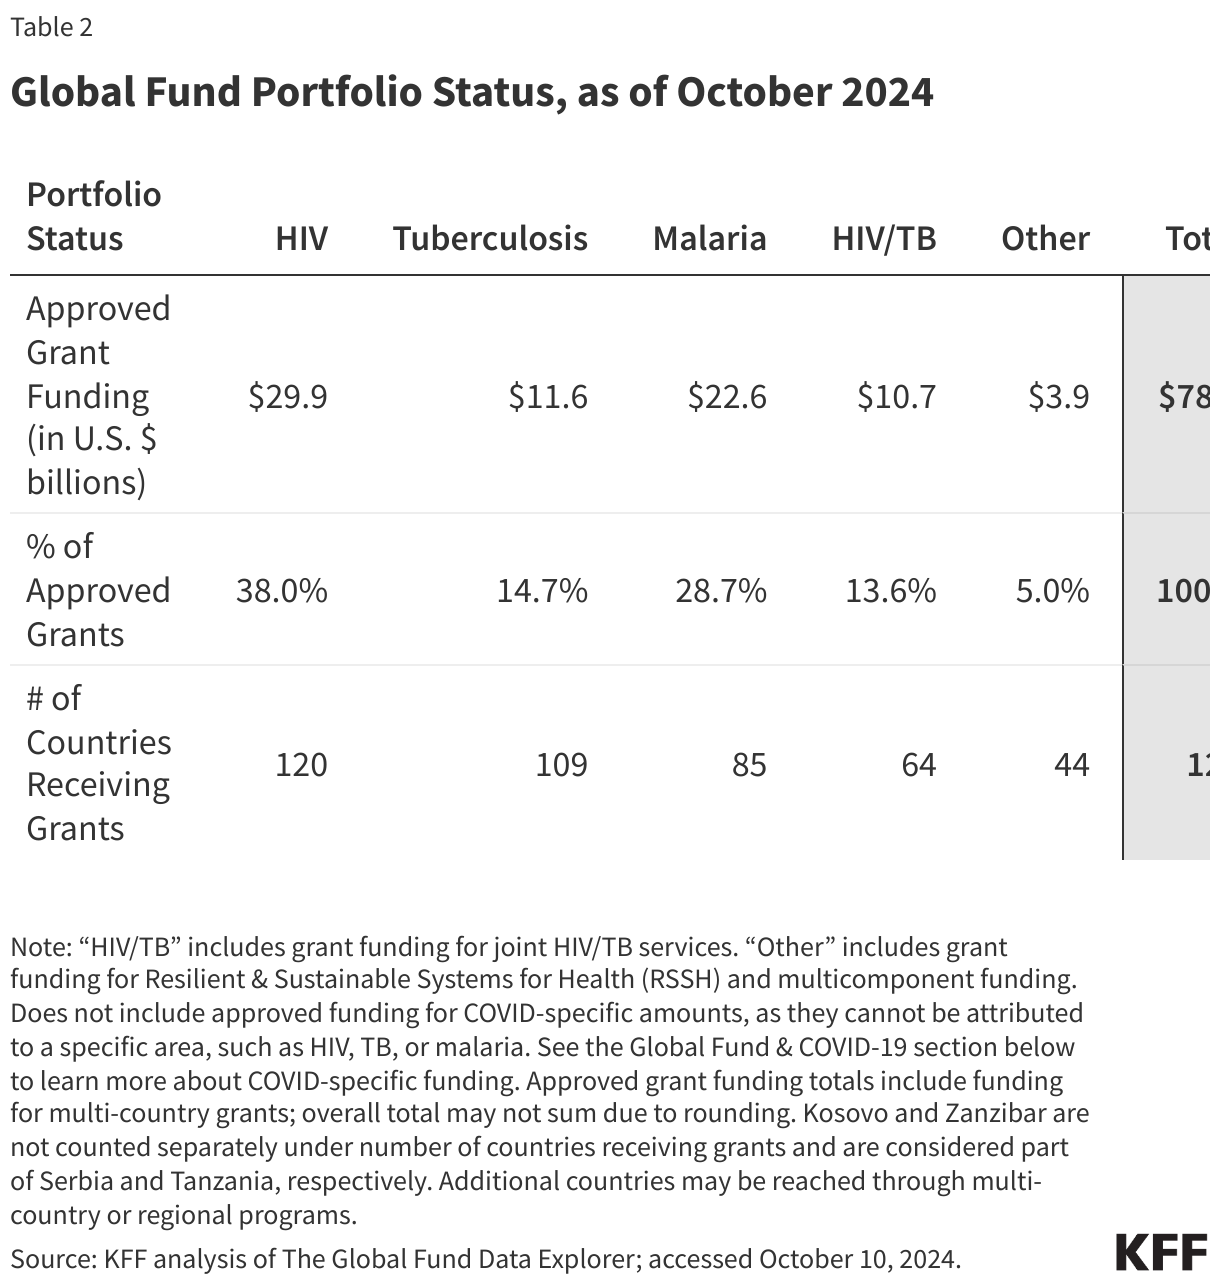
The Global Fund, which was the second largest donor to global health programs in 2022 (the U.S. was the largest),14  estimates that, since 2002, its grants have helped save the lives of 65 million people who would have otherwise died due to complications from AIDS, TB, or malaria and reduced the combined death rate from these three diseases by 61%. As of October 2024, the Global Fund had approved more than $78 billion in funding for its core HIV, TB, and malaria activities and, as of July 2024, awarded over $5 billion in funding to respond to COVID-19 (see the Global Fund & COVID-19 section below).15  Funding supports a wide range of prevention, treatment, and care activities and health systems development and strengthening. Most approved funding has supported HIV programs, followed by malaria and TB (see Table 2). This funding has reached almost 130 countries,16  including not only countries that also have received U.S. bilateral support for HIV, TB, and/or malaria but also many others that have not.17  The African region has received the largest share of approved funding (68%), followed by South-East Asia (11%).18 

Global Fund Portfolio Status, as of October 2024

U.S. Engagement with the Global Fund

In addition to U.S. engagement in governance and oversight of the Global Fund, U.S. financial support has been significant and is a key component of U.S. involvement (see figure).19  The U.S. first contributed to the Global Fund in FY 2001, and then upon the creation of PEPFAR in 2003, Congress incorporated all U.S. support for the Global Fund under the PEPFAR umbrella. At that time, Congress authorized up to $1 billion for the Global Fund for FY 2004 and “such sums as may be necessary” for FY 2005-FY 2008. In the 2008 reauthorization of PEPFAR, Congress authorized up to $2 billion in FY 2009 and “such sums as may be necessary” for FY 2010-FY 2013.” In 2013, 2018, and 2024, Congress again reauthorized PEPFAR, and while those reauthorizations included provisions related to U.S. support for the Global Fund (see below), they did not include specific funding authorization amounts. Since the 2024 reauthorization was a short-term extension (through March 2025), discussions about the next reauthorization of PEPFAR, including expiring provisions related to the Global Fund, are ongoing. See the KFF policy watch on PEPFAR reauthorization key issues as well as the KFF brief on PEPFAR legislation over time.

U.S. Funding for The Global Fund, FY 2016 - FY 2025

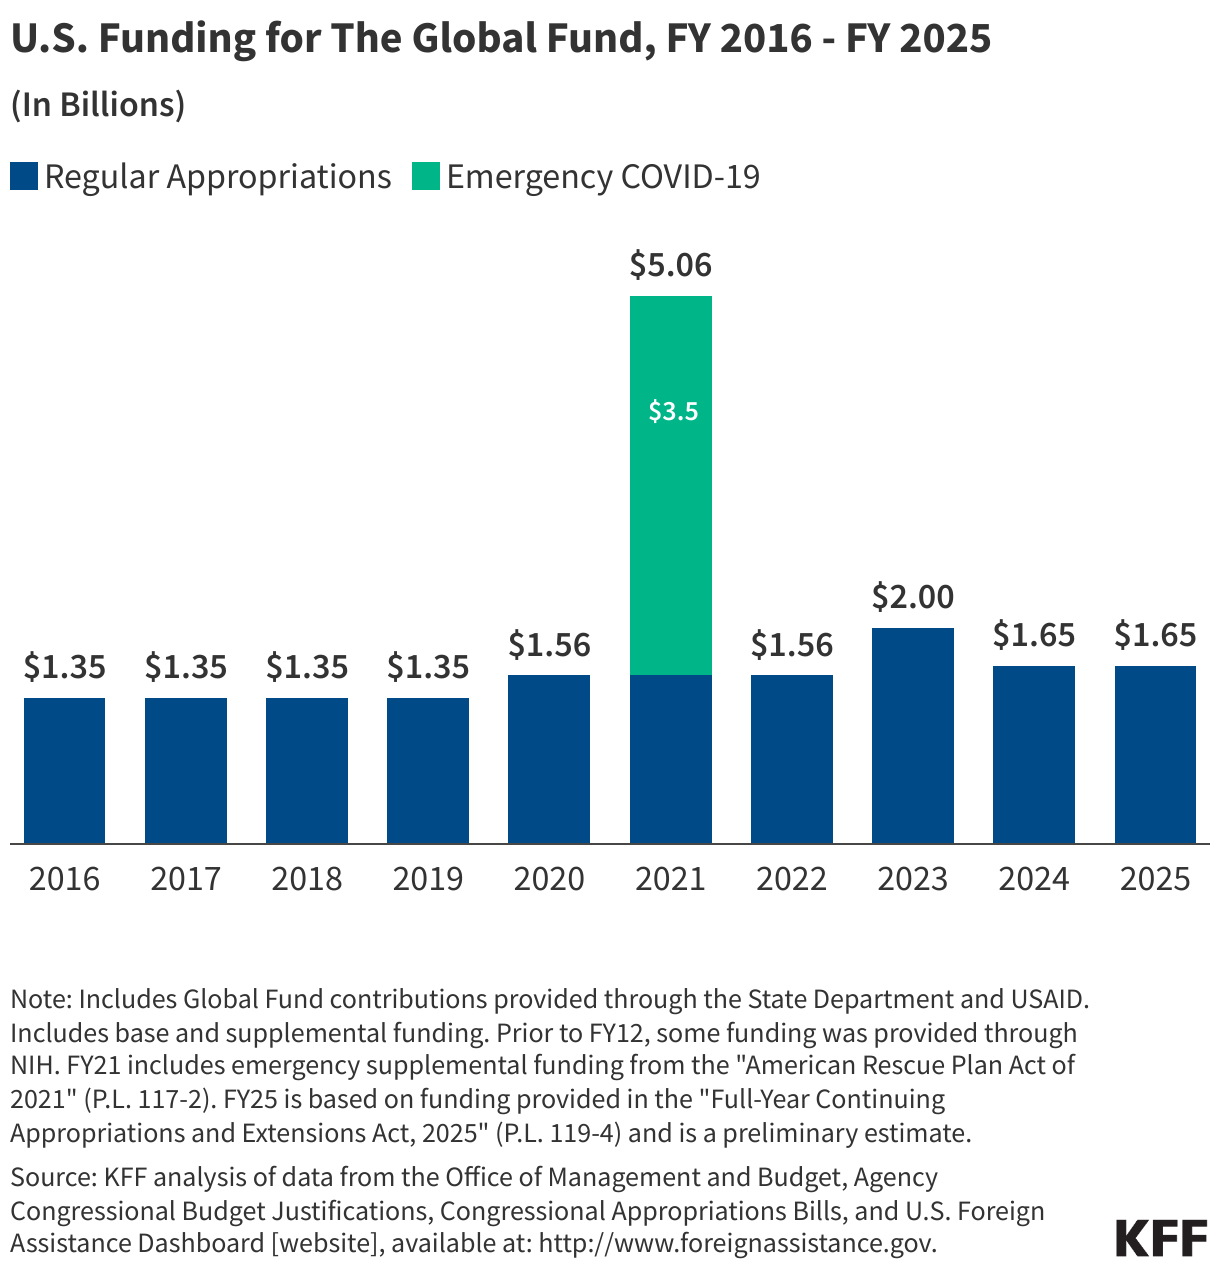
Congress specifies support for the Global Fund each year as part of PEPFAR appropriations, and funding is typically provided through the Department of State, although funding has also been provided through USAID and NIH in past years. Between FY 2001 and FY 2024, regular Congressional appropriations to the Global Fund totaled approximately $26 billion.20  In FY 2021, an additional $3.5 billion was provided as emergency funding to respond to the COVID-19 pandemic.21  Congress has historically matched or provided more to the Global Fund each year than the President has requested. (See the KFF budget tracker and the KFF fact sheet on the U.S. Global Health Budget: Global Fund for details on historical appropriations for the Global Fund.)

While Congress has provided strong funding support for the Global Fund, it has also regularly passed provisions that placed restrictions on U.S. contributions:22 

  • Requiring that total U.S. contributions do not exceed 33% of total contributions from all donors, a provision that was part of the original PEPFAR authorization and maintained in the reauthorizations. Designed to leverage U.S. contributions to increase support from other donors and to limit the U.S. from becoming the predominant donor to the Global Fund, it was invoked only once, in FY 2004 when appropriated funds were held back until the following fiscal year when the 33% cap would not be exceeded.
  • Setting aside 5% of U.S. contributions to cover the cost of technical assistance to Global Fund grantees, a provision first included in foreign operations appropriations bill language in 2005 and in subsequent years.
  • Authorizing the Secretary of State to withhold a percentage of the U.S. contribution until the Global Fund could demonstrate improved oversight and accountability in grant disbursement.
  • Requiring, as part of the FY 2012 through FY 2024 appropriations bills, that the administration consult with Congress prior to making multi-year funding pledges.

The Global Fund & Emergency Responses

COVID-19

Since the beginning of the COVID-19 pandemic, the Global Fund acted to support countries in their efforts to address COVID-19’s impact on HIV, TB, and malaria programs. The Global Fund established a “COVID-19 Response Mechanism” (C19RM) in April 2020, and also allowed for grant flexibilities that gave countries the ability to use a certain percentage of their current grants for COVID-19 response activities. As of July 2024, the Global Fund had awarded over $5 billion in funding to more than 100 countries to support countries’ responses to COVID-19.23  Support from the Global Fund to countries was used to:

  1. support national COVID-19 response efforts, including purchasing tests, treatments, and medical supplies;
  2. mitigate COVID-19’s impact on Global Fund-supported programs; and
  3. improve health and community-led response systems.

As countries shifted from emergency pandemic response to longer-term efforts, the Global Fund allowed countries to reprogram their C19RM funds for health systems strengthening and pandemic preparedness activities. Today, the Global Fund reports that its partner countries have made a full recovery from the impacts of the COVID-19 pandemic and that service delivery metrics have surpassed pre-COVID-19 levels.

Mpox

Since Mpox was first declared a public health emergency of international concern in 2022, the Global Fund has worked to strengthen partner countries’ response to Mpox outbreaks by allowing grant flexibilities and repurposing of funds from HIV grants and C19RM funding. Specifically, countries may request support from Global Fund grants for activities such as disease surveillance, laboratory system strengthening, strengthening the workforce, as well as community engagement.

  1. Includes pledges through 2025. Includes COVID-specific emergency contributions. ↩︎
  2. Does not include countries that may have received funding through multi-country or regional programs. Additional countries may be reached through multi-country or regional programs. ↩︎
  3. Core activities represent HIV, TB, HIV/TB, malaria, multi-purpose, and Resilient & Sustainable Systems for Health (RSSH) funding only; the more than $78 million in approved funding does not include a breakdown of COVID-specific amounts as they cannot be attributed to a specific area, such as HIV, TB, or malaria. KFF analysis of The Global Fund Data Service: https://data-service.theglobalfund.org/downloads; accessed October 2024. The Global Fund, Dataset: Funding Approved for COVID-19 Response; July 2024. ↩︎
  4. The U.S. pledged $4 billion in both the FY11-FY13 and FY14-16 replenishment cycles and $4.3 billion in the FY17-FY19 replenishment cycle. U.S. State Department, Obama Administration’s Pledge to Global Fund to Fight HIV/AIDS, Malaria and Tuberculosis, October 5, 2010. The Global Fund, Fourth Voluntary Global Fund Replenishment Pledges, December 2013. White House, Office of the Press Secretary. Statement by National Security Advisor Susan E. Rice on the United States’ Global Fund Pledge; August 31, 2016. ↩︎
  5. Fulfillment of a pledge is dependent on annual Congressional appropriations. The Trump administration proposed reducing U.S. contributions to the Global Fund in each of its annual budget requests to Congress. In addition, the Trump administration proposed a pledge of $3.3 billion, matching $1 for every $3 contributed by other donors for the next replenishment period, a decline of more than $1.0 billion compared to the U.S. pledge during the prior replenishment period under the Obama administration (up to $4.3 billion, matching $1 for every $2 provided by other donors). See U.S. Department of State, FY2021 Congressional Budget Justification – Department of State, Foreign Operations, and Related Programs, February 2020. ↩︎
  6. The pledge period for the Global Fund’s seventh replenishment is 2023-2025. ↩︎
  7. Global Fund: http://www.theglobalfund.org/; as of September 2024. KFF analysis. White House, President Announces Proposal for Global Fund to Fight HIV/AIDS, Malaria and Tuberculosis; May 11, 2001. ↩︎
  8. Global Fund, The Global Fund Strategy 2023-2028, November 2021. The Global Fund, Thematic Report: Pandemic Preparedness and Response, May 2022. ↩︎
  9. Global Fund, Results Report 2024, September 2024. ↩︎
  10. Center for Global Development, Overview of the Global Fund to Fight AIDS, Tuberculosis and Malaria. ↩︎
  11. All low- and lower-middle-income countries are eligible for Global Fund grants regardless of disease burden; disease burden criteria only apply to upper-middle-income countries to determine their eligibility. ↩︎
  12. The Global Fund funding model includes a co-financing requirement for countries to show progressive government spending on health and progressive up-take of recurrent costs associated with key programs, as well as a co-financing incentive that at least 15% of a country’s allocation is withheld until the country has committed to additional investments over and above previous levels of spending. Global Fund, Website: Funding Model: Throughout the Cycle: Co-financing, available at: https://www.theglobalfund.org/en/funding-model/throughout-the-cycle/co-financing/. ↩︎
  13. The Independent Evaluation & Learning function replaces the Technical Evaluation Reference Group (TERG). Global Fund, Website: Independent Evaluation & Learning, available at: https://www.theglobalfund.org/en/iel/; accessed September 2024. ↩︎
  14. KFF analysis of OECD DAC CRS database, June 2024. ↩︎
  15. KFF analysis of the Global Fund Data Explorer: https://data.theglobalfund.org/home; accessed September 2024. The Global Fund, Dataset: Funding Approved for the COVID-19 Response; July 2024. ↩︎
  16. Does not include countries that may have received funding through multi-country or regional programs. Additional countries may be reached through multi-country or regional programs. ↩︎
  17. KFF analysis of the Global Fund Data Explorer: https://data.theglobalfund.org/home; accessed October 2024. ↩︎
  18.  KFF analysis of the Global Fund Data Explorer: https://data.theglobalfund.org/home; accessed October 2024. Regions based on WHO regional classifications. ↩︎
  19. KFF analysis of data from the Office of Management and Budget, Agency Congressional Budget Justifications, Congressional Appropriations Bills, and U.S. Foreign Assistance Dashboard [website], available at: www.foreignassistance.gov. ↩︎
  20. This amount ($26 billion) represents the total amount of funding specified by Congress through FY 2024. However, the $32 billion pledged by the U.S. (seen in Table 1) includes the latest replenishment which runs through 2025, so the amounts will not match. ↩︎
  21. KFF analysis. The American Rescue Plan Act of 2021 included $3.75 billion “to support programs for the prevention, treatment, and control of HIV/AIDS in order to prevent, prepare for, and respond to coronavirus, including to mitigate the impact on such programs from coronavirus and support recovery from the impacts of the coronavirus,” of which not less than $3.5 billion was for the Global Fund. U.S. Congress, Public Law No: 117-2; March 11, 2021. KFF, Global Funding Across U.S. COVID-19 Supplemental Funding Bills, March 2021. ↩︎
  22. KFF analysis. U.S. Congress, Public Law No: 110-293; July 30, 2008. U.S. Senate Committee on Foreign Relations (Minority Staff Report), Fraud and Abuse of Global Fund Investments at Risk without Greater Transparency; April 5, 2011. U.S. Congress, Public Law No: 112-74; December 23, 2011. KFF, PEPFAR Reauthorization: Side-by-Side of Legislation Over Time, August 18, 2022. ↩︎
  23. Global Fund, Dataset: Funding Approved for COVID-19 Response; July 2024. ↩︎

Health Care Experiences of Native Hawaiian or Pacific Islander Adults

Published: Dec 3, 2024

Issue Brief

Introduction

There are about 1.5 million people in the U.S. who identify as Native Hawaiian or Pacific Islander (NHPI) alone or in combination with another race or ethnicity, but their experiences are often missing from analyses or conflated with Asian American adults. NHPI adults face persistent disparities in health and health care, which, in part, reflect specific challenges such as geographic isolation, limited access to linguistically accessible and culturally competent care, and social and economic inequities.

To help address gaps in data and information on NHPI people’s experiences, KFF conducted seven virtual focus groups between June-August 2024 to learn about NHPI peoples’ experiences with racism, discrimination, and health. The groups were conducted by NHPI moderators and informed by representatives from several organizations serving NHPI people (see Methodology for more details). This work complements KFF’s 2023 Survey on Racism, Discrimination, and Health which was part of a major effort to document the extent and implications of people’s experiences with racism and discrimination, particularly with respect to interactions with the health care system. A companion issue brief provides key data on NHPI peoples’ health and health care use.

The themes that emerged in the focus groups were often a reflection of disparities identified in analysis of existing federal and state data, and in many cases were consistent with findings about the health care experiences of other groups of color from the Survey on Racism, Discrimination, and Health. Highlights include:

  • While many focus group participants were satisfied overall with their ability to access care when needed, others mentioned barriers including, geographic isolation and limited system capacity, and lack of language access for family members with limited English proficiency. Participants in Hawaiʻi spoke about the lack of resources on the islands and shared stories of being flown to Oʻahu or the continental U.S. to receive specialized or emergency treatment such as chemotherapy or surgery. Some participants described having to translate for family members during health care visits because an interpreter was not available or being provided with interpreters who did not speak their dialect or were unable to fully and accurately interpret information.
  • All the participants in the groups shared that they have sought care from Western medical providers, but some also said they sometimes use family or traditional practices either in place of, or in addition to seeking care from Western medical providers. Participants identified a variety of reasons for seeking traditional care including cultural connections and family traditions, mistrust of Western health care practices and providers, and/or a belief that the practices offer a more holistic approach to well-being.
  • Participants described how longstanding relationships, connections to the community, and respect for their preferences and traditions contributed to positive experiences with providers, while interactions with providers who lacked these qualities were often viewed negatively. Some participants described negative experiences such as providers assuming things about them, blaming them for a problem, dismissing or ignoring their concerns or cultural traditions. Participants attributed these negative experiences to various factors including their NHPI identity, skin color, appearance, and their health insurance status. Some participants spoke about the consequences of these negative experiences, such as reluctance to seek future care or having their health get worse.
  • Participants identified suicide, substance use, and overdose deaths as concerns in their communities, and spoke about how stigma, cultural expectations of strength, and a lack of resources are barriers to seeking mental health care. Some participants also highlighted the difficulty of finding a mental health care provider who understands their cultural background and experiences. Across the groups, participants discussed making efforts to increase communication, reduce stigma, and improve mental health for the next generation.
  • Participants suggested a number of ways to improve the health care system for themselves and their families. Some suggestions included enhancing educational resources for patients, training providers to offer culturally competent care, and increased integration of traditional and cultural practices with Western medicine.

Access to and Use of Health Care

Overall, available data show that NHPI adults under age 65 are somewhat more likely than their White counterparts to be uninsured (9% vs. 7%), and uninsured rates range widely within the population from less than one in ten of Chamorro (8%), Samoan (9%), and Native Hawaiian (9%) adults to nearly one in four (24%) Marshallese people. Data also show that NHPI adults face increased barriers to accessing health care, including not having a usual doctor or provider or going without care due to cost, with about one in four (24%) NHPI adults saying they went without a routine checkup in the past 12 months, and one in five (18%) saying they have not seen a provider due to concerns about costs. Some NHPI people also face language barriers, with about one in ten (8%) of NHPI adults reporting that they speak English less than very well, rising to about one in five Tongan (17%) and Fijian (21%) adults and one in three (32%) Marshallese adults. Focus group participants described both positive and negative health care experiences that are consistent with these data.

Insurance Coverage

Most participants had health insurance, but some identified periods of being uninsured and some described difficulties understanding or using their insurance. Participants in the groups were selected to reflect a mix of those with private insurance, Medicaid, and Medicare, as well as some who were uninsured. Reasons participants cited for being uninsured included aging out of their parents’ coverage, facing difficulties with renewing or maintaining their Medicaid eligibility, or difficulty affording the cost of insurance. Among participants who were insured, some said they found it difficult to understand what their health insurance covered, and some expressed concerns about the costs of care even when covered by health insurance. Other participants described experiences in which they or a family member struggled to understand how the U.S. health insurance system works, including lacking familiarity with the concept of paying for health care services. These experiences were mostly described by participants who were themselves or had family members from Micronesia, the Marshall Islands, or Palau, likely reflecting the fact that health care services for people living on these islands are low-cost or free given that they have largely public health care systems that receive funding from the U.S. through the COFA (Compacts of Free Association).

For the first, I think last year, six months I didn’t have insurance, but because I turned 26, so I got off my dad’s health insurance. – Samoan woman, Age 27, Oʻahu

Well, we had Med-QUEST [Medicaid] and then Med-QUEST canceled us because they said our income was too high. My husband is on home dialysis … Every month we had to pay [$930] just to keep him alive. Then Med-QUEST went back into effect because I had the emergency proclamation for the wildfire, and then we got all those bills caught up. – Native Hawaiian woman, Age 54, Hawaiʻi

My grandparents [from Micronesia] don’t understand what insurance is. … Us family members can help out in the home with trying to further break down what are these terms? What is an application? What is insurance? What does it mean to renew your application or to reapply for something? – Micronesian man, Age 29, Oʻahu

Use of Health Care

Participants described using an array of providers including private providers, community clinics, urgent care centers, the emergency room and traditional medicine practitioners to obtain health care. Some participants talked about first trying a home remedy or doing an internet search to assess the importance of seeking care before seeing a provider. While all the participants in the groups shared that they have sought care from Western medical providers, some participants also said they sometimes use family or traditional practices either in place of, or in addition to seeking care from Western medical providers. Participants identified a variety of reasons for seeking traditional care including cultural connections and family traditions, mistrust of Western health care practices and providers, and/or a belief that the practices offer a more holistic approach to well-being. Some participants expressed a desire for Western medicine to integrate more traditional practices within its range of services.

I would say the same just from things that we grew up with, like my grandmother or my aunties, for small stuff. But serious stuff, obviously if one of my kids broke an arm or something like that, then definitely [I would take them to the doctor], but for just common colds and stuff like that, there’s lots of just natural herbs of teas and stuff that I have always used in our family that are better than anything over the counter. – Samoan woman, Age 41, Oregon

If it’s something like a cut or cough or something just basic, I’ll go to the doctor. But if it’s something that I don’t know, Western medicine cannot fully explain, then I’ll try to seek out some of those things… So I would say it’s probably 80% go doctor and then 20% lāʻau lapaʻau (translation: traditional Hawaiian healing practice/medicine). I’m very glad to have that option because you cannot trust the Western medical system completely. There’s always these holistic things about us that can’t be explained by pure science. – Native Hawaiian man, Age 52, Hawaiʻi

For me, I would, most of the time, ask family members that are in the medical field. And then, sometimes, I would also ask my mom, like the older generation people, on home remedies to help with that, because I would rather do that than actually go to a hospital and get a bill, and especially when you don’t have medical [insurance]. – Samoan woman, Age 41, Utah

… in between (PCP and specialist visits) my grandpa would seek out people from our own community who can do traditional practices. If he was experiencing pain, then he would seek out somebody who could do traditional massage. – Micronesian man, Age 29, Oʻahu

Access to Providers

While many focus group participants were satisfied overall with their ability to access care when needed, some discussed difficulties navigating the health care system and getting access to providers. Participants who were satisfied with their access to care noted things like the ease of getting an appointment, quickly communicating with a provider on MyChart or through telehealth and encountering few problems with their coverage. However, many participants identified challenges with accessing health care for themselves and/or family members, such as understanding how to navigate seeing different types of providers and specialists, including getting referrals as needed. Participants shared that these challenges were especially pronounced among elders in their communities. For example, some participants discussed how elders in their communities didn’t understand that they had to see someone other than their primary care provider (PCP) to receive certain kinds of treatment, or that they had to get a referral from their PCP to see a specialist who could treat them.

We have a family doctor, and we’re always connected on MyChart. And she’s very honest too. Once you shoot a question, and then she’s going to ask what the symptoms are, and then you tell the symptoms, and then she’ll be like, “ER, now.” Or she’s going to be like, “Okay, no, let’s do this, do this,” and then try to deal with it at home before we even connect with that big bill. – Samoan man, Age 41, Alaska

Well, I feel the good thing with [private health system] is it’s so accessible. It’s very easy to navigate. On the other hand, I feel sometimes it’s a revolving door … I’ve had two different PCPs in the last, I don’t know, four years. I never met them because when I’m sick, and I call for an appointment, their next appointment is three weeks from that day. You know what I mean? No, I’m sick now. I’m not sick in three weeks. – Native Hawaiian woman, Age 47, Maui

… if you need something special, you got to call your primary care person, then they got to refer you to the specialist, and then you got to call them to make an appointment. – Native Hawaiian woman, Age 54, Maui

Geographic Isolation and Limited System Capacity

Another challenge to obtaining health care that participants identified was lack of health care system capacity and resources, particularly for those living in Hawaiʻi. Some participants across groups identified concerns about health care system capacity, noting long wait times to get appointments; long wait times at urgent care centers and/or emergency rooms; and difficulty finding available health care providers, including primary care providers. Some also felt that their interactions with providers were often rushed and impersonal due to capacity limitations. Participants in Hawaiʻi also identified challenges related to limited health care resources, including specialty or advanced care, especially on islands other than Oʻahu. Reflecting this and the relative geographic isolation of the islands, some participants described situations in which they or a family member had to be flown to Oʻahu or to the continental U.S. to receive specialized treatment or care that was not available on their island, such as chemotherapy treatment or surgery. Some participants in Hawaiʻi also described long travel times to reach providers, particularly those living in more remote areas of the islands.

For me, I go to urgent care. Only reason is because I’ve been trying to get a primary doctor up in Washington, but I can’t find one. They either aren’t accepting new patients or they don’t take my insurance. – Native Hawaiian woman, Age 57, Washington

And also it was a really big struggle to even get an appointment with your PCP; it was months. By the time I got my insurance and I got my first appointment, was five and a half months later. So this is just to establish care. So it was really bad.– Native Hawaiian woman, Age 54, Hawaiʻi

I recently broke my ankle in January and had to have surgery, and I had to fly to Oʻahu. With a broken leg, fly on the plane, get surgery, fly home same day. He didn’t put me up in the hospital. … And even with my daughter getting her chemo, we’d have to fly her to Kapiʻolani. – Native Hawaiian woman, Age 47, Hawaiʻi

In our hospital on Kauaʻi that they don’t have the staffing. They don’t have the equipment. They don’t have the stuff that we need, so we have to get medevacked out of here. And it is a blessing. … So if we got to take that 45- minute helicopter ride in order to survive, to live, so that we can see our mom tomorrow, we are going to 100% jump on that little helicopter. – Native Hawaiian woman, Age 37, Kauaʻi

Yeah, I definitely have had experiences where I’ve gone and it’s just such a long wait, I end up in the car, and then I’m like, “Let’s just go. There’s no point of us just waiting.” It’s like maybe I’ll just get better soon. I can just treat this at home with some rest. – Samoan woman, Age 27, Oʻahu

Language Access Challenges

Some participants, especially those with older relatives from Micronesia or the Marshall Islands, noted issues with access to and quality of interpreters while seeking health care for family members. Some participants described instances of having to translate for their older family members during their health care visits because an interpreter was not available or provided.1  Some also said they experienced dealing with interpreters who did not speak their dialect or mixed English terms into conversations. One participant highlighted that his grandfather’s Chuukese dialect lacked words for concepts like “insurance” and “application,” illustrating the challenges of language access.

I would have to go with my grandpa is because he didn’t speak any English. So I had to be the interpreter between him and his PCP… Even though I could do it and it was an honor for me to do that for my grandfather, it was extremely difficult for me because I wasn’t born and raised in the island… it was a huge relief when there was somebody there from our background who speaks our dialect and can interpret articulately… We have some Chuukese interpreters who are not fully interpreting everything in our language. They’re mixing in English terms. And for people or the generation of my grandparents, sometimes that’s still confusing even if you’re speaking Chuukese with them … How do you explain an application to them because there’s no word for application in our language. – Micronesian man, Age 29, Oʻahu

… one of my relatives … was going through this health checkup and she doesn’t really know a lot of things. So when she was telling the story of how this incident happened to her, my mom kind of got mad and was like … “Where was your interpreter?” And then she told us that her interpreter didn’t show up. – Micronesian woman, Age 18, Oʻahu

Postponing or Delaying Care

Many participants described instances of themselves or a family member waiting to seek care until a health condition became severe. Participants noted that putting off or avoiding care was particularly common among elders in their communities. In some cases, these delays reflected concerns about cost or difficulty navigating the system, but participants also said it sometimes reflected past negative experiences or mistrust of the health care system. Some reflected on historical mistreatment and abuses of their communities and discussed stark divides between priorities and approaches of Western medicine vs. traditional healing practices. Many participants also talked about a sense of pride and the tendency within their communities to downplay health issues and how this can further contribute to delays in seeking care.

So our people tend not to seek healthcare… If you don’t know about it, then it’s not a problem. … I think maybe it could be a multitude of reasons, not trusting the system. It’s a product of colonization, not wanting to go and seek out Western methods. And then our access to native healing is so limited. It’s not like there’s a clinic down the road that you can go for native healing. – Native Hawaiian woman, Age 47, Maui

We pay insurance, but we don’t want to go to the hospital until we really feel that we have to see a doctor. – Micronesian man, Age 48, Oʻahu

I think me and my family’s relationship with healthcare, especially my dad, would never go to the doctor. He would put it off for as long as possible, whether it’s not believing in them or too expensive or this or that. And so that’s kind of how I grew up trying to avoid the doctor. – Tongan man, Age 29, California

If it’s something more serious, I’ll go to the hospital, but it’s very rare. But with my whole family, the hospital’s usually last resort, insurance or no insurance. It’s just a last resort. Only go when you really need to. – Chamorro woman, Age 26, Washington

I just feel like the older Samoans, they believe that God’s going to cure them if they ask… I strongly believe in prayer, but prayers don’t have X-rays and CAT scans to see what’s really going on inside. God, he hears us, but the doctors are the ones that are going to tell us, “Oh, your liver is on 3%.” – Samoan/Tongan woman, Age 33, Oʻahu

My husband, he works a very strenuous job and he’s always in pain, mostly sore muscles and whatnot, because he does repetitive movement every day. And so he would do stuff at home, for example, stretching, yoga exercises and just basically having our kids step on his back when he’s in pain, just to avoid going to the doctor because he says he can hack it and whatnot. But honestly, how can we afford it if we have to literally meet the deductible before actually our benefits are applied? – Chamorro woman, Age 37, Washington

Experiences in Health Care Settings

Previous KFF research (the 2023 KFF Survey on Racism, Discrimination, and Health) finds that while most adults across racial and ethnic groups report having positive and respectful interactions with their health care providers most of the time, most groups of color report having these experiences less often than White adults. The research further finds that these groups report higher levels of unfair treatment when seeking health care than their White counterparts, and that this leads many to say they prepare for possible insults or feel they must be very careful about their appearance to be treated fairly during health care visits. These negative experiences often lead to reports of worse health, being less likely to seek care, and/or switching providers. The research also highlights the importance of having providers with a shared background, as those who have more visits with providers of the same racial or ethnic background report more positive and respectful interactions.

NHPI focus group participants described having both positive and negative experiences in health care settings, which in many cases were similar to the findings of the survey for adults with other racial and ethnic backgrounds. Positive experiences participants described included having a trusted provider, feeling like they could talk to a provider without judgement, feeling heard and respected, and receiving culturally competent care. Negative experiences were often the opposite: feeling like providers rushed and did not take the time to build trust, not feeling heard or feeling judged, and receiving care that was not culturally competent.

The Role of Trusted Providers

Participants described how longstanding relationships and connections to the community contributed to trusted relationships with providers, while interactions with providers who lacked these qualities garnered lower levels of trust. Several participants who felt their provider interactions were generally positive described having long-term relationships with their or their children’s provider, including seeing the same provider from childhood to adulthood or their children having the same pediatrician they did as a child. Participants expressed that maintaining the same provider over the years made them feel understood on a personal level, beyond just their symptoms and medical history. Participants noted that they felt it easier to build trust when their provider shared their racial and ethnic background and/or had spent time in their community, or when a provider took the time to get to know them and understand their family situation. Some participants expressed challenges communicating with and trusting providers who were not familiar with their local culture or those that did not take time to get to know them and their family beyond their medical symptoms. For example, among participants living in Hawaiʻi, some said they received better care from providers who had lived in Hawaiʻi for some time, rather than newer providers, such as travel nurses, who participants felt were unfamiliar with the local culture. On the continent, participants noted that having a provider from Hawaiʻi or another Pacific Island made them feel more at ease, but that they also felt they could trust providers who took time to listen to them and understand their needs.

So my kids’ doctor is my pediatrician or my family’s pediatrician when we were younger. So she knows the history of what we went through as kids, so she already knows what my kids are potentially looking for. – Samoan woman, Age 24, Oʻahu

Same doctor, same dentist, and they’ve been going ever since they were born. It just goes smooth every time. – Marshallese man, Age 36, Oʻahu

I think with the traveling nurses and the doctors, this is not their home, so they’re just doing their job. They don’t care about your thoughts. They don’t care about your … I think we should do this or can we do that or can you look into this? It’s like I feel they just want to tell you and leave. –

Native Hawaiian woman, Age 54, Hawaiʻi

We had a family doctor, and it was different times though. I get it. But they knew our whole family, and it was just more on a personal level, and we talk story and stuff like that. But nowadays, it’s like clinics, community clinics, or even [health system], it’s like… Or even my daughter’s dentist, it’s just people in and out and they don’t really have a chance to really get to know them. – Native Hawaiian woman, Age 47, Hawaiʻi

My mom, she’s full Samoan, right? And so she just had an episode of COVID, and we went to the ER, and the people that were not from here treated her really bad and ordered her around. And she has Alzheimer’s, so she can’t understand, and it was the folks that come and clean up beds, and then they do the smaller stuff that really made her feel welcome, like, “Auntie, lay down. Oh, just put your arm …” They really showed aloha to my mom. – Native Hawaiian man, Age 52, Hawaiʻi

Feeling Heard and Respected

Participants discussed how trusting their provider allowed them to feel like they could talk freely and share their concerns without judgement. Participants described a range of positive experiences with providers, including feeling like their provider understood them and their family background, that their provider listened to their concerns, that their provider involved them in decision-making about their care, and that their provider respected their family needs and preferences. For example, some participants spoke about how their providers listened to and respected their birth plans when they were in the hospital to give birth. Other positive experiences participants spoke about included having doctors order the labs or tests they thought they needed and not feeling like they were rushed in their interactions with their provider.

… just being heard by her [primary care provider] made me leave there feeling good, feeling hopeful that somebody cares. – Native Hawaiian woman, Age 39, Washington

I just went to the doctors today, my son had a checkup today. They talk story, they’re pretty friendly. They talk about where we live and what kind of stuff we do. And I guess for me, the doctor we have, he tries to relate and he tries to be approachable with us. And for us, it works out. We’re comfortable with our doctor right now. – Native Hawaiian man, Age 31, Oʻahu

… my kids’ pediatrician, she’s a Haole girl (translation: foreigner, not from Hawaiʻi), and she is amazing. She knows my story every time I come back. She knows I adopted my kids from Child Welfare … so she’ll ask those kind of questions when I’m there or when I bring them. She’s like, “Oh, how’s the adoption process going?” And I’m like, “Oh, we’re almost there.” You know what I mean? – Native Hawaiian woman, Age 47, Maui

In contrast to these positive interactions, many participants also described negative experiences in which they felt judged or ignored by a provider. These experiences included feeling judged or blamed for their health issues, not receiving medications they believed they needed, or feeling dismissed and rushed during visits. Others shared experiences of not getting the labs or tests they think they needed and not having information explained to them in an understandable way.

So when I had my third child, I had gestational diabetes. But why is it like that now? That’s the question I asked my doctor, “Why, when the rest of my two was perfectly fine?” She didn’t have an answer, but that’s what made me stop going to the doctors just recently was because everything I’ve told her, she kind of rebelled against it and was like, “No.” – Samoan woman, Age 24, Oʻahu

I feel like because I’m a bigger person, I get overlooked so much because I’m on the bigger side of the spectrum and nobody in where I go to the hospital is a person of color. So I feel like that’s a big thing too. And we kind of just get pushed to the side in the medical field. That’s how I feel in some of the instances where I just have to be really firm on what I want but not do it in a way where I don’t seem that I’m being aggressive too. – Samoan woman, Age 36, California

For me, it was just being dismissive, automatically assuming that I speak Spanish. If I had a dollar every time somebody spoke Spanish to me. – Samoan woman, Age 41, Oregon

Culturally Competent Care

Across the groups, participants said that they valued providers who showed cultural understanding and respect, regardless of the ethnic or cultural background of the provider. Examples of culturally competent care participants discussed included avoiding assumptions based on racial or ethnic background, considering factors beyond just diet and exercise when addressing health concerns, and recognizing the importance of extended family. Some participants also discussed how they appreciated health care providers who respected and didn’t judge participants for turning to family or traditional practices before seeking care when dealing with a health issue.

The positive experience I had with that was just the culturally competent staff members … while my grandma was in the ER, because us Micronesians, we are people of community. So, it’s not just the kids and grandkids who show up, but it’s our extended relatives who show up and they want to know what’s going on and know if she’s okay. And the staff members, I think some of them kind of had a hard time, because they’re like, “Why is there so many people here?” Some of the [other] staff members, they were like, “Oh yeah, come in. Come and check in on her,” and they were wanting to make sure the family was updated on everything that’s going on. And one of the doctors that was in the ER, … he came to our family and said, “I understand that you guys have a big family, but if we could have one point of contact to make sure we can just be in contact with that one person in the family,” which was me because I’m the English-speaking person in my family. … It is comforting to have people who understand your culture and they’re flexible with meeting us halfway to make sure our questions are answered and our needs are being met from my grandma. – Micronesian man, Age 29, Oʻahu

I did find a primary care physician and she’s a Filipina. So right away when I met her, she made me feel really comfortable. And she asked us where we’re from and she found out that we’re from Guam. She related to us, made us feel connected pretty much… She understood what foods we eat and everything. So versus a nurse practitioner that I’ve also seen at that same clinic and he was American. So right away, he was just like, “Well, your blood pressure is really high. We got to put you on medicine, dah, dah, dah, really quick.” That’s it. – Chamorro woman, Age 37, Washington

But it did make a difference just having people that look like you, can relate to you… More just reciprocation. So if I have something to talk about, it’s just a little bit more relevant with somebody who shares that same cultural experiences, whether it be food, what’s good to eat around here … So it just facilitates for me a more trusting, more comfortable environment. – Chamorro/Guamanian man, Age 35, Oklahoma

Many participants also described negative health care experiences due to lack of culturally competent care. As an example, participants discussed how health care providers often blamed their health issues, such as diabetes, on their weight or body type. Many participants spoke about how health care providers focused only on their weight and how losing weight would be a panacea for their health problems—often leaving participants wanting to hear more about other ways to treat chronic conditions, such as taking medication. Other examples included feeling like they were judged by a provider for using traditional practices such as using home remedies.

So the only doctor I have is an OB, and so I’m PCOS, because I’m trying to have kids, and they basically were telling me, “Oh, you just got to lose weight.” And I was like, “Oh, okay.” So I lost like 15 pounds, and I went back and I was like, “Okay, so where are we at now?” And they were like, “You need to lose more weight.” And I was like, “Okay.” – Samoan woman, Age 27, Oʻahu

I mean, I don’t want to sound racist or anything, but the White ones who don’t really understand local, you know, how we do. When we take the kids and they’re like, “Oh, the Vicks is not good for babies,” but it’s like, I’m 34 years old and I’m fine. I’ve used this my whole life. How is it going to only hurt the baby now? – Samoan/Tongan woman, 33, Oʻahu

Reasons for and Consequences of Negative Experiences

Participants attributed negative experiences to various factors, including their skin color, appearance, NHPI identity, how they spoke, and health insurance status. Some participants said they felt they were treated differently or were unable to get tests or labs they thought they needed because they have Medicaid (QUEST in Hawaiʻi) as their insurance. Some participants shared how they felt they had to be careful with their interactions in health care settings due to a fear of being perceived as aggressive or problematic. Several participants told stories about how these negative encounters with providers resulted in poorer health outcomes, reluctance to seek care, switching providers, and/or heightened emotional distress.

And so I definitely feel they treat you a little bit different when you have QUEST [Medicaid] insurance rather than somebody who pays for insurance, and so I definitely see that happening here… It’s like, “Oh, because you get it from the state, and you’re not working. You’re not paying for it,” so they just treat you differently. – Native Hawaiian woman, Age 35, Oʻahu

And this doctor was White, and I know as soon as he walked in the room, of course, he instantly judged me because I look crazy. And my husband didn’t really say a word, and I felt like he totally ignored what I said, and it was too difficult for him to take two seconds out of his time to tell the nurse, “Please swab this, and let’s culture it.” So, my husband lost his toe because of the ignorance of the doctor. So, to me, I feel it’s really bad. We were judged instantly. – Native Hawaiian woman, Age 54, Hawaiʻi

We get pushed to the side a lot. And to me personally, I felt like, is it because I have Medi-Cal [Medicaid]? Is that why I’m just being pushed to the side? It made me feel some type of way. – Samoan woman, Age 36, California

Yeah, I overheard a nurse actually complaining one time about patients having QUEST and how she pays her taxes and how we paying for their medical. I didn’t say, I thought in my own head, I was like, “Oh wow, if she only knew my kid on QUEST,” she didn’t know that… Obviously, after she said that, I didn’t want to tell her. – Native Hawaiian woman, Age 47, Hawaiʻi

They just assume when you have darker skin like, “Oh, you’re just going to be trouble. You’re just going to like this, that, or the others.” Yeah, I felt it in that and other pieces as well. – Native Hawaiian man, Age 52, Hawaiʻi

Mental Health

Overall, data show that about one quarter of NHPI adults (23%) report experiencing any mental illness in the past year, similar to their White counterparts (27%). However, research suggests that a lack of culturally sensitive screening tools that detect mental illness, coupled with structural barriers could contribute to underdiagnosis of mental illness among people of color. Moreover, NHPI people are less likely to receive mental health treatment compared with White people, with 16% of NHPI people reporting receiving treatment in the past year compared to over one in four White people (26%). Previous KFF research found that cost concerns and scheduling difficulties are major barriers to accessing mental health services across racial and ethnic groups. Consistent with these data, focus group participants identified mental health needs among their communities and discussed some of the barriers to accessing care, including stigma, limited resources, and cost.

Participants identified mental health needs and concerns in their communities, including suicide, substance use, and overdose deaths, and described longstanding stigma associated with discussing mental health needs in their communities, describing the topic as “taboo” or “swept under the rug.” Several participants, both in Hawaiʻi and on the continent, shared personal stories of themselves or family members facing mental health issues and the struggles they faced in finding quality care close to where they lived. Participants also emphasized that cultural expectations of strength, especially among men in NHPI communities, create a barrier to recognizing and seeking help for mental health concerns. Some participants noted that mental health issues are often misunderstood by elders, who sometimes tie mental illness to religious beliefs.

I think the topic of mental health awareness is neglected, and I think there’s an area for opportunity there. My biological father, he came here, he came to Hawaiʻi from Pohnpei, but unfortunately he became a victim to suicide because the mental health wasn’t there… I think the topic of mental health awareness is neglected, and I think there’s an area for opportunity there… I think that we need to come up with a way to educate our community about all these mental health sicknesses because that’s not talked about. And if it is talked about in our communities… They don’t really understand the whole idea of it. And prior to Western contact, a lot of our islands were very into spirituality. So that’s another thing that it plays a component in this mental health awareness. – Micronesian man, Age 29, Oʻahu

It’s hard, and I want to say that I found a kanaka (translation: Hawaiian) psychiatrist … and he’s so amazing, Native Hawaiian, he understands the stuff that we go through, and he helped save my life. So, I think there’s a lot of good things, behavioral health, if you can find it… Putting resources into that for our Native Hawaiian and Pacific Islander providers and mental health. It helps saves lives. – Native Hawaiian man, Age 52, Hawaiʻi

… we had this small epidemic that happened on Maui, and it was like every month you had these young boys killing themselves… And it terrified me having, one, a boy. To this day, it terrifies me to see them and some of them I know, and to just be like, “What was so bad? Or did you not have somebody to talk to?” … And I think it goes back to colonization, it goes back to all of that generational trauma that our men are feeling that in this Western world. … – Native Hawaiian woman, Age 47, Maui

Participants noted that, beyond stigma, a lack of resources for mental health support has left many—both themselves, their family members, and friends—without access to mental health care. Participants identified cost concerns and scheduling difficulties as barriers to accessing mental health services and highlighted the difficulty of finding a provider who understands their cultural background and experiences. In the Hawaiʻi groups, participants expressed uncertainty about where to seek help for mental health issues, other than calling a crisis helpline like 988. Some participants said that they felt people in their communities would be hesitant to use crisis hotlines due to stigma or a preference for in-person connections when discussing sensitive topics. In the Hawaiʻi groups, participants pointed out that there is a limited number of mental health care providers on the islands and highlighted logistical difficulties of seeing someone in person due to transportation challenges, particularly in rural areas.

I don’t know, coming from a native perspective, I don’t know if Natives can call a crisis hotline. … We need a human to share that space, I don’t know, to share their spirit, to share their breath. That’s what heals us. – Native Hawaiian woman, Age 47, Maui

One, treat us like we’re your favorite family members and open more mental health clinics because mental health gets swept under the carpet so much, but we don’t have anywhere to focus on it either. – Samoan woman, Age 36, California

… I’ve been trying to tell my PCP, “Well, I’ve been trying to get a hold of the Behavioral Health to see a new counselor and nobody ever calls me back.” So, I think that’s pretty bad. I just came out of a domestic violence situation and sometimes I need somebody to talk to. So, I think that’s pretty rough. – Native Hawaiian woman, Age 54, Nevada

Across the groups, participants discussed the efforts they are taking to increase awareness and understanding of mental health issues within their communities. In the groups, many participants shared the difficulty of conveying mental health issues to their elders and in other languages, noting for example that there are not exact translations available for some terms or conditions in their languages. One participant shared a story of the importance of trusted community leaders in bridging the communication gap between elders and younger community members with a different understanding and approach to mental health. Participants across groups discussed the ways in which they were educating older generations and working to break the cycle of stigma among the next generation by encouraging their children to be more open and communicate their mental health needs.

Yeah, mental health, I feel like it’s not talked about a lot in the Polynesian culture, because old-fashioned, how our parents are, we were told to keep our mouths shut or whatever because it brings shame to the family or whatever the case is. So now, mental health, it’s a very common thing now, because now everybody, all the Polynesians that had childhood trauma, it’s affecting them as an adult now, and now they’re able to speak up. But the majority of them are afraid to speak up, because they’re afraid to upset their old-fashioned parents and don’t want to bring shame to the family or whatever the case might be. – Samoan woman, Age 41, Utah

I think our people are having a hard time accepting the fact that all these things are real. We’re the kind of people that, we tend to think that, “Oh, nope, it’s just faalii (translation: annoyance in Samoan).” When the child is acting up and then we automatically say they’re throwing a temper tantrum or without even knowing that they’re going through something and there’s imbalance with something. It’s either with their thought process or… So, I think acceptance should be the first thing with our people. We need to know that this is real, the feelings and the mental health are real… It’s the same thing with mental health. We don’t think it’s real. We just sugar coat stuff and shove it under the carpet, but once we have acceptance that it’s real, now we can have conversation – Samoan man, Age 41, Alaska

I think especially for men and especially for boys, it is really, really hard to talk about not being okay… I mean, their generation, a lot of them are struggling and they don’t know how to talk about it. So I feel like if we make it less taboo, maybe that’s not so much a cultural thing. But for me, I think that it’s normal to talk about depression and anxiety. I think that we have to start normalizing it because they experience stuff that – Samoan woman, Age 41, Oregon

I have a cousin who recently got diagnosed with schizophrenia and I think he was in critical condition… and there’s no term for schizophrenia in Chuukese… If you tell somebody in our Chuukese community that you’re hearing voices in your head, they’re going to tie that into, there’s a demonic force following you around or you need to go to the church more because there’s demons in your house or something like that… I contacted one of our community leaders … and I asked her, how do I explain schizophrenia in Chuukese because I need to call our aunties and tell them what’s going on with my cousin… So she explained to me how to, there’s no word for it, but she explained how I can interpret the symptoms… then I immediately called up our aunties to explain that to them and they had no clue what was going on. So that’s a lucky thing. That’s a success story for us because we were able to get him help and he is able to get medications now and I think he’s stable. – Micronesian man, Age 29, Oʻahu

Well, in my family, we just talk. I teach my kids, “There’s nothing you can’t tell me.” Always try to approach it with being open. So, it is hard because we have a big ʻohana (translation: family), so my mom, my brother, me, my kids, we all live in the same household… I had a hard time talking to my mom, and she had a hard time talking to her mom, and so I didn’t want that for my kids. I tried to break that cycle where I was open. I told them, “You want to ask me anything?” I always ask them, “How are you feeling?” I always tried not to put a stigma on how you’re feeling. – Native Hawaiian woman, Age 47, Maui

Social Support Networks and Connection to Culture

Participants described varying levels of feelings of connection to their culture and levels of social support, which, in part, reflected where they live. Participants in the Hawaiʻi groups largely said they felt connected to their communities and emphasized connections to the land, food, ocean, and family members living nearby. However, in the continent groups, many participants said they felt disconnected from their culture, especially those who did not live in areas where other Pacific Islanders live. Some participants spoke about how there were fewer opportunities to be connected to their culture living away from the islands, but some also identified ways they maintained connections, including through churches, extended family, sports, and community groups and organizations. In the groups both in Hawaiʻi and on the continent, some participants discussed enrolling in classes on topics like Hawaiian language or hula to learn more about their culture and maintain cultural knowledge and traditions. Across the groups, many participants discussed concerns about passing on their culture and heritage to their children, especially when they felt geographically disconnected from their community. Some participants living in areas without a large Pacific Islander community discussed the importance connecting with other racial and ethnic groups (such as with Black adults or American Indian adults) in creating a sense of belonging.

And I do attend church every Sunday, and church is a big part of our life, especially the Samoan church, but that’s how I stay connected. – Native Hawaiian woman, Age 38, California

After we left Hawaiʻi, it just wasn’t as significantly a part of our life as I wish it had been, and then when my parents split, it was even less then. I was really separated from all of my Samoan family. So I miss that. I miss a lot of that. Some of my happiest memories from my childhood are when I was surrounded by my family, just more familiar with the language and more familiar with the practices. But we all have such a cultural disconnect. A lot of us feel like a lot of hesitation because we don’t speak the language, we don’t understand the practices or what does that entail, what would we have to do? – Samoan woman, Age 41, Oregon

So I’m over here taking online classes for ʻōlelo (translation: Hawaiian language) just so I can raise my son and expose him to it, because my father’s already passed, and so with him being a kumu hula (translation: Hawaiian dance instructor), I grew up very involved in the culture, and I feel like I can only provide so much, because I’m not a kumu hula… That’s where a lot of the history came from that I was taught, and I want my son to be involved, but, like I said, the access is very limited for those of, I would say, Pacific Islander Polynesian descent. – Native Hawaiian woman, Age 43, Washington

Recommendations to Improve Care

Participants offered several suggestions to improve health care experiences in their communities. In Hawaiʻi, many participants emphasized the importance of recruiting and training doctors from the islands, highlighting the value of having providers who are part of the local community. In the groups on the continent, participants discussed the importance of cultural competency training for health care providers and efforts to increase the racial diversity of providers. Participants also expressed support for integrating traditional practices with Western medicine to facilitate a more holistic approach to care. Participants suggested that more education on how to navigate the health care and health insurance systems within their communities could help improve access to care. Participants also said they would like to see health care services become more centralized to help alleviate the logistical burden of seeking specialized care.  They also emphasized that increased availability and quality of interpreter services for people with limited English proficiency is important for increasing access to care as well as improve health care experiences.

My magic wand would be recommending that cultural intelligence communications class be mandatory for medical personnel’s education. – Native Hawaiian woman, Age 43, Washington

If the doctor wasn’t from here or the providers aren’t from here to take a culture class on getting used to the culture here so they can be better practitioners. I’ve had experiences where the bedside manner of providers are fantastic. And it ranges, it doesn’t matter the race. And then it ranges all the way to completely awful. – Samoan man, Age 37, Hawaiʻi

More Micronesian staff, more Micronesian nurses and doctors so that they can help be the liaison for all of this complex information that’s being communicated to the patients and their families. – Micronesian man, Age 29, Oʻahu

Well, one thing I would address is more opportunity for doctor’s appointments. Because there’s so many patients and not enough space. I was supposed to see a specialist for my hearing and she said, “Well, we’re already booked out to May of 2025.” – Native Hawaiian woman, Age 54, Nevada

Methodology

For this project, seven focus groups were conducted between June-August 2024 virtually among a total of 45 adults who self-identified as having a Native Hawaiian or Pacific Islander (NHPI) background. Three groups (Native Hawaiian, Samoan, Marshallese/Micronesian adults) were conducted among participants living in Hawaiʻi. Participants lived on the islands of Hawaiʻi, Maui, Oʻahu, and Kauaʻi (outreach to adults living on all islands was conducted). In the continental U.S., four groups were conducted among adults who identified as NHPI living in (1) California, (2) Pacific Northwest (AK, WA, NV, UT), (3) Washington or Oregon, and (4) other states in the continental U.S. Groups were mixed gender, lasted between 90 minutes and two hours, and were conducted in English with 5-8 participants each.

For each group, participants were chosen based on the following criteria: Must be at least 18 years of age and self-identify as having an NHPI background. Groups included multiracial (“in combination”) and single-race (“alone”) adults of Native Hawaiian or Pacific Islander ethnicity who indicated that their ethnicity was “extremely” or “very” important to how they think about themselves. All participants said they had seen a health care provider within the past three years. In addition, groups were chosen to represent a mix of household composition, including at least some participants who are parents; a mix of health statuses, including those living with a chronic condition; a mix of household income levels, with a preference for recruiting lower income participants; and a mix of health insurance types.

PerryUndem recruited the focus groups and Ward Research hosted the focus groups, using NHPI moderators who live in Hawaiʻi. The screener questionnaire and discussion guides were developed by researchers at KFF in consultation with the firms who recruited and hosted the groups as well as community representatives from Association of Asian Pacific Community Health Organizations, the National Association of Pasifika Organizations, and Papa Ola Lokahi. Groups were audio and video recorded with participants’ permission. Each participant was given an incentive between $100-$175 after participating.

Participant Characteristics
NHPI Identity Number
Native Hawaiian17
Samoan17
Tongan3
Micronesian6
Marshallese2
Chamorro3
Fijian1
Note: Values exceed number of total participants because some participants identified with multiple NHPI backgrounds.
Gender 
Men17
Woman26
Other2
Age
18-299
30-4925
50-6410
65+1
Insurance Type
Private22
Medicaid19
Uninsured3
Medicare1
States 
Hawaiʻi21
California6
Washington6
Oregon2
Nevada2
Utah2
Alaska1
Ohio1
Oklahoma1
Illinois1
Arizona1
New Mexico1


Endnotes

  1. All groups were all conducted in English, so while we heard about some of these problems related to family members, the challenges are likely even more pronounced among those who themselves lack English proficiency. ↩︎

Key Data on Health and Health Care for Native Hawaiian or Pacific Islander People

Published: Dec 3, 2024

Introduction

Native Hawaiian or Pacific Islander (NHPI) people experience substantial and enduring disparities in health and health care. These, in part, reflect specific challenges in accessing health care such as geographic isolation, economic challenges, and limited availability of culturally appropriate care. Furthermore, NHPI communities are often excluded from data and analysis due to their smaller population sizes. This limits the visibility and understanding of their health outcomes and experiences accessing health care, impeding efforts to address their health care needs and eliminate disparities.

Given the importance of increasing the understanding of experiences among these groups as part of advancing equity, this brief provides an overview of NHPI experiences across key measures of health, health access, and social and economic factors that influence health. It is based on KFF analysis of data from multiple datasets including the 2018-2022 American Community Survey, the 2022 Behavioral Risk Factor Surveillance System, and the Centers for Disease Control and Prevention (CDC) WONDER online database. This report also incorporates analysis from Key Data on Health and Health Care by Race and Ethnicity, which examines how people of color fare compared to White people across 64 measures of health, health care, and social determinants of health. Racial and ethnic groupings for each measure vary depending on the data source. Data reported by ethnic identity are limited to people who identify as NHPI alone. Data reported for the continental U.S. refers to the 48 contiguous states, District of Columbia (DC), and Alaska. Data for many health outcome measures are not available by ethnic subgroup. Data are limited to NHPI people residing within the 50 states and DC1 .

Key takeaways include:

NHPI people represent people from diverse backgrounds. The majority of NHPI people identify with more than one race and ethnicity. NHPI people have ethnic origins tracing back to several islands in the Pacific Ocean that have varying relationships with the U.S. Among NHPI people residing in the 50 states and DC, most live in Hawaii and California.

NHPI people fare worse than White people across the majority of examined measures of health, health care, and social determinants of health. Reflective of lower rates of private coverage, NHPI (9%) people under age 65 are somewhat more likely to be uninsured than White people (7%). Roughly a quarter of NHPI adults (24%) under age 65 report not having a personal provider compared to 17% of White adults. Additionally, similar shares of NHPI adults (20%) report fair or poor health status as White adults (16%). NHPI people have higher birth risks and worse birth outcomes compared to White people. This may in part reflect limited access to prenatal care, as NHPI women (22%) are over four times more likely to receive late or no prenatal care than White women (5%). NHPI people also have higher rates of pregnancy-related mortality (62.8 per 100,000) and infant mortality (8.5 per 100,000) compared to their White counterparts (14.1 per 100,000 and 4.5 per 100,000, respectively). Although the majority of NHPI people under age 65 are in working families, they have higher rates of poverty than White people (15% vs. 10%). Roughly half of NHPI people (54%) own a home compared to about three quarters of their White counterparts (76%). NHPI people have similar or better health outcomes compared to White people across a few health measures. NHPI people (both at 20%) have a similar likelihood of reporting fair or poor health and 14+ mentally unhealthy days compared to White people (16% and 15%, respectively). NHPI adults (6%) are less likely to have a heart attack or heart disease than White people (8%) yet have similar rates of heart disease-related mortality (173.2 per 100,000 vs. 173.1 per 100,000, respectively).

Among NHPI people, there is significant variation in key factors that influence health, including health coverage, income, and homeownership, with Marshallese people faring the worst across all examined measures. Among NHPI people under age 65, uninsured rates range from less than one in ten of Chamorro (8%), Samoan (9%), and Native Hawaiian (9%) people to nearly one in four (24%) Marshallese people. Homeownership rates also vary from roughly two-thirds of Fijian people (65%) to 14% of Marshallese people.

Data gaps prevent the ability to fully identify and understand health disparities for NHPI people. Data are insufficient or not disaggregated for NHPI people for many health and health care measures. Among available data, NHPI people fare worse than White people for the majority of measures. For some measures there is no significant difference, but this sometimes may reflect the smaller sample size for NHPI people in many datasets, which limits the power to detect statistically significant differences.

These data highlight the importance of continued efforts to address disparities in health and health care for NHPI people in ways that account for the diversity of the population and their experiences. Continued efforts to increase the availability of disaggregated data for NHPI people overall and by ethnicity, such as oversampling to generate adequate sample sizes to produce reliable estimates and changes to the collection and reporting of data on race and ethnicity, will also be important for improving the ability to identify and understand the disparities they face and assessing the impact of interventions to address them.

Overview of NHPI People in the U.S.

The NHPI population has grown and become more diverse over time. As of 2022, there were roughly 1.5 million people in the U.S. who identify as NHPI alone or in combination with another racial or ethnic group. The majority of NHPI people identify as NHPI and at least one other race, while just about one in three NHPI people identify as NHPI alone (36%) (Figure 1).

Most NHPI People Identify With More than One Race or Ethnicity

NHPI people trace their family origins to several islands in the Pacific Ocean with varying relationships with the U.S. Among people who identify as NHPI alone, 28% are Native Hawaiian. About one in five (18%) are Samoan, about one in eight are Chamorro (12%), and less than one in ten identify as Fijian (7%), Tongan (7%), or Marshallese (7%) (Figure 2). The remaining 22% identify as one of the remaining other Pacific Islander groups, including Palauan, Tahitian, Chuukese, Pohnpeian, Yapese, and other groups.

NHPI People Include People From Varied Ethnic Backgrounds

There is significant variation in the ethnic identity among NHPI people living in Hawaii compared to the continental U.S. Not surprisingly, among those who identify as NHPI alone, the majority of those residing in Hawaii are Native Hawaiian (58%), while ethnic identity is more mixed among those living in the continental U.S. (Figure 3).

More Than Half of NHPI People in Hawaii are Native Hawaiian, Compared to a Smaller Share in the Continental U.S.

Among NHPI people (alone or in combination with another race or ethnicity) living within the 50 states and DC, nearly half reside in Hawaii (26%) and California (22%) alone (Figure 4). Washington state (7%) accounts for the next largest share of NHPI people in the U.S., followed by Utah (4%) and Texas (4%). Many NHPI people also reside in their homelands and across the U.S. territories of Guam, Samoa, the Commonwealth of the Northern Mariana Islands, and the Freely Associated States (FAS) that include the Federated States of Micronesia, the Republic of the Marshall Islands, and the Republic of Palau. However, data for NHPI people living in the territories and FAS are limited and not reflected in this analysis.

About Half of NHPI People Live in Hawaii or California

Most NHPI people (92%) living in the U.S. are. citizens, however, citizenship status varies among NHPI ethnic groups, reflecting differences in birth citizenship rights across locations to which they trace their origins. Specifically, people born in Hawaii and the U.S. territories of Guam (Chamorro people), and Northern Mariana Islands are U.S. citizens by birth. People born in the U.S. territory of American Samoa are not granted citizenship but are considered U.S. nationals. People born in the FAS, which are part of the Compact of Free Association with the U.S., are not conferred U.S. citizenship at birth, but are guaranteed the right to live, work, and access health care in the U.S. Other Pacific Islands are independent nations and therefore people born in these countries are not provided U.S. citizenship at birth. Reflecting these differences, among NHPI people living in the U.S., Native Hawaiian and Chamorro people have small shares of noncitizens (both at 1%). A larger share of Samoan (11%), Tongan (18%), and Fijian (29%) people are noncitizens, while more than half (52%) of Marshallese people are noncitizens (Figure 5).

Citizenship Status of NHPI People Varies by Ethnic Background

(Back to top)

Health Coverage, Access, and Use

Overall, uninsured rates among NHPI people under age 65 are somewhat higher than uninsured rates among their White counterparts (9% vs. 7%) (Figure 6). This reflects lower rates of private coverage (67%) compared to White people (78%). Public coverage helps fill but does not fully offset this gap. Among people under age 65 who identify as NHPI alone, uninsured rates vary by ethnicity, ranging from about one in ten Chamorro (8%), Samoan (9%), Native Hawaiian (9%), and Fijian people (10%) to about one in seven (15%) Tongan people and about one quarter (24%) of Marshallese people.

Disparities Persist in Health Coverage for NHPI People, Particularly Among Some Ethnic Subgroups

Health coverage patterns also vary based on where NHPI people live. The uninsured rate for NHPI people living in Hawaii is about half that of those living in the continental U.S. (4% vs. 10%). This pattern is largely driven by more expansive Medicaid coverage, reflecting the state’s adoption of the Affordable Care Act (ACA) Medicaid expansion for low-income adults and other eligibility expansions. Hawaii also has a longstanding mandate for employers to offer health insurance to eligible employees which facilitates access to private coverage. Uninsured rates also vary across geographic regions, ranging from 7% in the Western U.S. to 16% in the Southern U.S. These geographic patterns in part reflect differences in Medicaid expansion status among states. Many of the remaining states that have not yet adopted the ACA expansion to low-income adults are in the South. NHPI people under age 65 living in non-expansion states are twice as likely to be uninsured as those in expansion states (16% vs. 8%) (Figure 7).

Health Coverage Varies Based on Where NHPI People Live

NHPI adults are more likely to report not having a usual doctor or provider or going without care due to cost than White adults but are less likely to say they went without an annual check-up. About a quarter of NHPI adults (24%) under age 65 report not having a personal provider compared to 17% of White adults (Figure 8). NHPI adults (18%) also are more likely to report not seeing a provider due to cost compared to 11% of White adults. However, NHPI adults are less likely to say they went without a routine checkup in the past 12 months than White adults (24% vs. 28%).

NHPI Adults Are More Likely To Report Not Having a Usual Health Care Provider and Going Without Care Due to Cost Compared to White Adults

NHPI people are more likely to report going without colorectal cancer screening compared to White people but are as likely to receive a mammogram or pap smear. Among those recommended for colorectal cancer screening, about four in ten (42%) NHPI people did not receive a colorectal cancer screening compared to about three in ten (30%) White people (Figure 9). As of 2022, among women ages 50-74 (the age group recommended for screening for breast cancer prior to updates in 2024, which lowered the starting age to 40), the share of NHPI women (34%) who did not receive a mammogram in the past two years was not significantly different from the share of White women (29%). Similarly, the difference in the share of NHPI women (31%) ages 21 to 65 years (the age group recommended for screening for cervical cancer) who did not receive a pap smear was not significantly different from their White counterparts (22%).

NHPI People Are As Likely as White People to Receive A Mammogram or Pap Smear, But Less Likely to Have a Colorectal Cancer Screening

(Back to top)

Health Outcomes of NHPI People

One in five NHPI adults report fair or poor health status (20%) and having 14+ mentally unhealthy days (20%), which are similar to the rates for White people (Figure 10).

About One in Five NHPI Adults Report Fair or Poor Health Status or 14 or More Mentally Unhealthy Days

NHPI women fare worse than their White counterparts across multiple measures of birth risks and outcomes. NHPI women have higher shares of preterm births (12% vs. 9%) and low birthweight births compared to White women (9% vs. 7%) (Figure 11). Notably, NHPI women (22%) are four times more likely than White women (5%) to begin receiving prenatal care in the third trimester or to receive no prenatal care at all. Additionally, NHPI teen birth rates (20.5 per 1,000) are more than two times higher than the rate among White teens (9.1 per 1,000) (Figure 12).

NHPI Women Fare Worse Than White Women Across Pregnancy-Related Measures
The Birth Rate Among NHPI Teens is More Than Two Times Higher Than the Rate Among White Teens

NHPI people have higher rates of pregnancy-related and infant mortality than White people. NHPI people have nearly five times higher pregnancy-related death rate than White people (62.8 vs. 14.1 per 100,000) (Figure 13). NHPI infants are nearly twice as likely to die as White infants (8.5 vs. 4.5 per 1,000) (Figure 14).

Pregnancy-Related Deaths Among NHPI People Nearly Five Times Higher Than Among White People
NHPI Infants Have a Nearly Two Times Higher Rate of Dying Than White Infant

Chronic Disease

NHPI adults are more than two times as likely to die from diabetes than White adults (Figure 15). Diabetes rates for NHPI people (15%) do not statistically differ from the rate for White adults (11%), but the diabetes death rate for NHPI people is more than twice as high as the rate for White adults (49.9 vs. 21.3 per 100,000). The diabetes mortality rate for NHPI people is based on a small number of observations and should be interpreted with caution.

NHPI People Are More than Twice As Likely to Die from Diabetes as White People

NHPI adults are less likely to have a heart attack or heart disease than White adults but are at similar risk of dying due to heart disease. While rates of heart attack or heart disease are lower for NHPI adults (6%) compared to White adults (8%), the rate of heart disease-related mortality is similar (173.2 per 100,000 vs. 173.1 per 100,000, respectively).

Cancer

During 2015-2019, the latest period for which disaggregated data for NHPI people were available, there were over 18,000 new cancer cases among NHPI people. Breast cancer is the most diagnosed cancer type among women across NHPI ethnic groups, as is the case for most other racial and ethnic groups, ranging from 25% among Samoan women to 44% among Fijian women. For Native Hawaiian, Samoan, Tongan, and Fijian men, the most commonly diagnosed cancer type is prostate cancer, while the most commonly diagnosed cancer for Chamorro men is lung cancer. While updated data as of 2021 is available for other racial and ethnic groups, disaggregated data on rates of cancer incidence are unavailable for NHPI people.

Overall, NHPI people have lower rates of cancer mortality than White people across most types of cancer. NHPI people have lower rates of all cancer-related deaths than White people (157.2 per 100,000 versus 171.6 per 100,000) (Figure 16). NHPI people have similar rates of female breast cancer mortality than White people (10.6 vs. 10.3 per 100,000). They have lower mortality rates of colon and rectum cancer (7.8 vs. 9.6 per 100,000), lung and bronchus cancer (29 vs. 33.2 per 100,000), and prostate cancer (6.3 vs. 7.5 per 100,000).

NHPI People Have A Lower Rate of Overall Cancer Mortality Than White People

Mental Health

Reported rates of mental illness among NHPI people are similar to White people, but research suggests mental illness could be underdiagnosed among NHPI people. About one quarter of NHPI adults (23%) report experiencing any mental illness in the past year, similar to their White counterparts (27%). The share of NHPI adults reporting serious mental illness is also similar to White adults (5% vs 7%) (Figure 17). NHPI people (17%) are nearly half as likely to report ever having mental illness compared to White people (32%). However, research suggests that a lack of culturally sensitive screening tools that detect mental illness, coupled with structural barriers could contribute to underdiagnosis of mental illness among people of color.

Nearly One in Four NHPI Adults Report Having Any Mental Illness in the Past Year

NHPI people are less likely to receive treatment compared with White people. 16% of NHPI people report receiving treatment in the past year compared to over one in four White people (26%) (Figure 18).

NHPI People Are Less Likely Than White People To Receive Mental Health Treatment

NHPI adults have lower rates of deaths by suicide and drug overdose than White people (Figure 19). As of 2022, the suicide death rate for NHPI adults (14.3 per 100,000) is lower than the rate for White adults (17.6 per 100,000). Between 2011 and 2021, Asian or Pacific Islander people experienced a faster increase in suicide death rates than White people. The data was not disaggregated and therefore the changes observed cannot specifically be attributed to Asian or NHPI racial groups, alone. Suicide data are not available for NHPI adolescents. NHPI adults have roughly half the rate of drug overdose deaths than their White counterparts (18.8 vs. 35.6 per 100,000). Between 2022 and 2023, the number of opioid overdose deaths among Asian or Pacific Islander people declined by 2%, a smaller decline than that of White people (-14%). Opioid overdose death data are combined for Asian and Pacific Islander people.

NHPI People Have Lower Rates of Death by Suicide Compared to White People

(Back to top)

Social And Economic Factors that Influence Health

Across ethnic groups, most NHPI people are in working families, but there is significant variation in family income among NHPI people. Most NHPI people under age 65 are in a family with at least one worker (77%). Although the majority are in working families, NHPI people under age 65 are more likely to have income below the poverty level than their White counterparts (15% vs. 10%), with the share ranging from 11% among Tongan and Fijian people to 27% among Marshallese people (Figure 20).

Household Income Varies Across NHPI Ethnic Groups

NHPI people have lower educational attainment compared to White people, but there is significant variation among NHPI people. Among adults ages 25 and older, one in five adults who are NHPI alone (19%) and one quarter of all NHPI adults (25%) report having a bachelor’s degree or higher compared to nearly four in ten White adults (38%) (Figure 21). Among NHPI people, the share with a bachelor’s degree ranges from 5% of Marshallese people to nearly one quarter (23%) of Chamorro people.

About One in Four NHPI People Have a Bachelor's Degree or Higher

About one in ten (8%) NHPI people report speaking English less than very well compared to one percent of White people (Figure 22). Among NHPI people, limited English proficiency varies by ethnicity, ranging from about 2% of Native Hawaiian people to 5% of Chamorro people and one third of Marshallese people (32%). 17% of Tongan people and about one in five Fijian people (21%) report speaking English less than very well.

About One in Ten NHPI People Report Speaking English Less Than Very Well

Overall, NHPI households (54%) have lower rates of homeownership compared to White households (76%) (Figure 23). Homeownership rates vary among NHPI people, ranging from about one in seven Marshallese households (14%) to about roughly half of Tongan households (51%), six in ten Native Hawaiian households (60%), and about two thirds of Fijian households (65%). Despite U.S. promises to return ancestral lands to Native Hawaiian people under the Hawaiian Homes Commission Act of 1920, home ownership rates among NHPI people in Hawaii remain at 56%. Some of the barriers to homeownership faced by Native Hawaiians include the high cost of living and the failures and long waitlists under the Hawaiian Homes Commission Act. The Maui wildfires have further increased housing demand and may exacerbate barriers to homeownership.

NHPI Households Have Lower Homeownership Rates Than White Households

NHPI people are more likely to live in “crowded” housing compared to White people, and this share is higher among NHPI people living in Hawaii compared to those living in the continental U.S. (Figure 24). Nearly one in five (18%) people who identify as NHPI alone or in combination with another race or ethnicity and about a quarter of people who identify as NHPI alone (27%) report living in crowded housing compared to 3% of White people. “Crowded housing” is defined as housing with more than one occupant per room (not counting bathrooms, porches, balconies, hallways, or unfinished basements, etc.). Among NHPI people, the share of people living in crowded housing ranges from 14% for Chamorro people to 64% for Marshallese people. About three in ten (29%) NHPI people living in Hawaii report living in crowded housing compared 7% of White people living in Hawaii and to 15% of NHPI people in the continental U.S. NHPI people have the highest share of people living in multigenerational housing —households containing three or more generations— compared to other racial and ethnic groups, which may contribute to the higher share reporting crowded housing. Family is considered a core value in NHPI culture and is defined very broadly to include extended family. Consequently, living in multigenerational households is more common among NHPI people and is considered a strength within the community. Additionally, Hawaii consistently ranks as the most expensive state to live in, which can also lead to crowded housing conditions.

NHPI People Are More Likely Than White People to Live in Crowded Housing

(Back to top)

  1. Data and research often assume cisgender identities and may not systematically account for people who are transgender and non-binary. The language used in this brief attempts to be as inclusive as possible while acknowledging that the data we are citing uses gender labels that we cannot change without misrepresenting the data. ↩︎

Medicaid Expansion is a Red and Blue State Issue

Published: Nov 27, 2024

Although health care did not figure prominently in the 2024 presidential election, with President-elect Trump returning to the White House and Republicans controlling Congress, significant changes to Medicaid are expected. One potential target for federal spending reductions is the Affordable Care Act’s (ACA) Medicaid expansion. The ACA expanded Medicaid coverage to nearly all adults with incomes up to 138% of the Federal Poverty Level ($20,783 for an individual in 2024) and now provides states with an enhanced federal matching rate (FMAP) of 90% for their expansion populations. While the expansion was originally mandatory for states, a Supreme Court decision in 2012 effectively made it optional and as of November 2024 all but 10 states have adopted the expansion. Twelve states have “trigger” laws in place that would automatically end expansion or require other changes if the federal match rate were to drop below 90%.

Rather than repealing the ACA outright, some conservative and Republican proposals would instead lower the federal match rate for the expansion population from 90% to the standard Medicaid match rate, which is calculated based on a state’s per capita income and ranges from 50% to 83%. The Congressional Budget Office estimated in 2022 that reducing the match rate for the expansion group would save the federal government $631 billion over 10 years. This financing change would shift a substantial amount of Medicaid spending from the federal government to states. States would then need to decide whether to use states funds to make up for the lost federal funding or cut coverage. Given the challenges states would face replacing substantial lost federal funds, the health coverage implications would likely be significant and could reverse gains in financial security, access to care, and health outcomes. A large body of prior research shows that Medicaid expansion has helped to reduce the uninsured and improve access, affordability, and financial security among the low-income population. More recent research shows improvements in health outcomes and continues to show positive effects for providers (particularly rural hospitals) and for sexual and reproductive health.

Because of the widespread adoption of the Medicaid expansion across states, the financial and coverage impacts will be felt by both states that voted for President-elect Trump and those that voted for Vice President Harris. This data note provides key facts on the Medicaid expansion using enrollment data as of March 2024 and FY 2023 spending data from the Medicaid Budget and Expenditure System (MBES).

Medicaid expansion has been adopted by 41 states including the District of Columbia, split nearly evenly between states that voted for Trump (21 states) and those that voted for Harris (20 states) (Figure 1). Over the past ten years, Medicaid expansion has been broadly adopted by states led by Republicans and Democrats. Consequently, any changes to the Medicaid expansion authority or financing structure will affect both red and blue states. While the data are presented by states that voted for Trump or Harris in the November 2024 elections, there are five states with Democratic governors that voted for Trump (Arizona, Kentucky, Michigan, North Carolina, and Pennsylvania) and three Republican-led states that voted for Harris (New Hampshire, Virginia, and Vermont). In total, there are 19 expansion states with Republican governors, and 22 expansion states (including DC) headed by Democrats. Ultimately, it will be state governors and legislatures that will respond to any federal policy changes.

States that Have Adopted the Medicaid Expansion by Presidential Election Voting Result

As of March 2024, over 21 million people were enrolled through the Medicaid expansion representing nearly a quarter of enrollment across all states and about three in ten Medicaid enrollees in expansion states (Figure 2). Medicaid expansion enrollment totaled 7.3 million in states that voted for Trump and 13.7 million in states that voted for Harris. Across all Medicaid expansion states, total Medicaid enrollment was 68.2 million and the majority of people (69%) were enrolled through traditional eligibility pathways. Medicaid expansion enrollment comprised a slightly larger share of enrollment in states that voted for Harris (33%) than in states that voted for Trump (28%). Expansion enrollment ranged from a high of 53% of total enrollment in Oregon to a low of 13% in North Carolina, which implemented Medicaid expansion coverage in December 2023 (Appendix Table 1). The variation across expansion states likely reflects several factors, including different poverty distributions and economic conditions across states as well as variation in state Medicaid eligibility levels for expansion and traditional groups.

Medicaid Expansion Enrollment as a Share of Total Medicaid Enrollment for All Expansion States and by 2024 Presidential Election Vote

About 4.3 million expansion enrollees live in states with some type of trigger law that would end expansion coverage or require review of expansion coverage to mitigate increases in state costs if federal funding for the expansion is reduced. Trigger laws require states to automatically end Medicaid expansion coverage or require them to take actions to ensure state costs do not increase if the federal matching rate for the Medicaid expansion drops below 90% or below a specified threshold. Not all of the laws would immediately end the Medicaid expansion, but enrollees in states with trigger laws are at greater risk of losing coverage, although some may be able to maintain coverage through other eligibility pathways in some states. Currently, nine states (Arizona, Arkansas, Illinois, Indiana, Montana, New Hampshire, North Carolina, Utah, and Virginia) have laws that require termination of the expansion if the share of federal funding drops. Laws in three additional states (Idaho, Iowa, and New Mexico) require the states to take some action to mitigate the fiscal impact of the loss of federal funds. Of the 12 states with trigger laws, eight states voted for Trump (Arizona, Arkansas, Idaho, Indiana, Iowa, Montana,  North Carolina, and Utah) and four states voted for Harris (Illinois, New Hampshire, New Mexico, and Virginia). While laws in the so-called “trigger” states require action, the substantial loss of federal funding would likely force all states to reassess whether to continue the expansion coverage.

In FY 2023, spending on the expansion group represented 20% of Medicaid spending across all states and over a quarter of Medicaid spending in expansion states (Figure 3). Medicaid spending totaled $863.9 billion for all states and $686.9 billion in the 40 states that had implemented expansion in 2023 (North Carolina did not implement expansion until December 2023 and, consequently, is not counted as an expansion state during FY 2023). Spending on the expansion group totaled $178.2 billion, or 26% of total Medicaid spending in those states, and federal spending was $158.3 billion. Due to the 90% federal match for expansion, federal spending represents a larger share of spending for the expansion group than for traditional enrollees. The share of spending for the expansion group is lower than its share of enrollment (26% vs. 31%), in part, because the traditional Medicaid group includes populations such as those with disabilities and seniors who have higher per-enrollee spending. Similar to enrollment, expansion spending as a share of total spending varied across states from a high of 43% in Montana to a low of 16% in Massachusetts (Appendix Table 2).

Medicaid Expansion Spending as a Share of Total Medicaid Spending for All Expansion States and by 2024 Presidential Election Vote

Appendix Tables

Medicaid Expansion Enrollment as a Share of Total Enrollment
Medicaid Expansion Spending as a Share of Total Medicaid Spending

Proposed Coverage of Anti-Obesity Drugs in Medicare and Medicaid Would Expand Access to Millions of People with Obesity

Published: Nov 26, 2024

The Biden administration has proposed to allow Medicare and require Medicaid to cover drugs used to treat obesity by reinterpreting the statutory language that currently prohibits coverage of drugs used for weight loss under Medicare and permits but does not require states to cover these drugs for weight loss under Medicaid. This reinterpretation reflects an evolution in the understanding of obesity as a disease and weight loss as conferring real health benefits in people with obesity rather than being merely for cosmetic purposes. It also comes amidst high and growing demand for and use of a relatively new class of highly effective, but also very expensive, drugs being used to treat obesity, known as GLP-1s.

Under current law, people on Medicare can get anti-obesity drugs covered by Part D, Medicare’s outpatient drug benefit, only if they are used for a medically accepted FDA-approved indication other than obesity, like diabetes or cardiovascular disease risk reduction. State Medicaid programs also have to cover these drugs for indications such as diabetes or cardiovascular disease risk reduction, but only 13 states currently cover these drugs for obesity treatment as well. These limitations on coverage in Medicare and Medicaid mean that millions of people who have obesity and might benefit from these drugs may be unable to access them due to their high prices. But even with these coverage limits in place, gross spending on these drugs for approved uses in Medicare and Medicaid has skyrocketed in recent years, totaling $4 billion in Medicaid in 2023 and close to $6 billion in Medicare in 2022 for selected GLP-1s.

The new Biden administration proposal would authorize Medicare and Medicaid coverage of anti-obesity medications for people with obesity but not people who are overweight. While coverage would be available for Medicare and Medicaid enrollees with obesity, Medicare Part D drug plans and state Medicaid programs could still apply utilization management tools such as prior authorization, which could limit access. According to the Centers for Medicare & Medicaid Services, the proposal would increase Medicare spending by $25 billion and Medicaid spending by $15 billion over 10 years (net of rebates) and would apply to around 3.4 million people with Medicare and 4 million people with Medicaid. Because Medicaid is jointly financed by the states and the federal government, CMS estimates the federal government would pay $11 billion and states would pay nearly $4 billion.

Rising prescription drug costs are an ongoing concern for states, and state Medicaid programs reported the high cost of obesity drugs as key reason for not expanding coverage prior this proposal. The potential cost to Medicare is lower than some other estimates because it assumes many people with obesity can already get Medicare coverage of these drugs for other medically accepted indications, and CMS’s proposal would not apply to people who are overweight. Nonetheless, the combination of high demand, new uses, and high prices for these treatments is likely to place tremendous pressure on Medicare spending, Part D plan costs, and premiums for Part D coverage over time.

KFF analysis has found most large employer firms currently do not cover GLP-1 drugs for weight loss and coverage in ACA Marketplace plans remains limited, but if finalized, the proposed change to Medicare and Medicaid coverage could put pressure on other payers to expand access. If it becomes official coverage policy, this change would also lift the burden off lawmakers in Congress who have repeatedly introduced legislation to authorize Medicare coverage of anti-obesity drugs but who may have been stymied by the potential cost of doing so. But as the Biden administration prepares to hand the reins over to the incoming Trump administration, a key question is whether the rule will be finalized as proposed under new leadership at CMS, changed in some way, or pulled back altogether.

What to Know Ahead of the Supreme Court Case on Youth Access to Gender Affirming Care

Published: Nov 26, 2024

Background

Youth access to gender affirming care has become an increasingly politicized and contentious issue in recent years. Today, 26 states have enacted laws restricting youth access to gender affirming care, most of which are facing legal challenges. On December 4th, the Supreme Court will hear a case challenging the constitutionality of such state restrictions for the first time. The case before the Supreme Court challenges the Tennessee ban (United States v. Skrmetti) under the Equal Protection Clause of the 14th Amendment. Both the plaintiffs, three families and a provider, who originally challenged the law (L. W. et al v. Skrmetti et al) and the Biden administration, as an intervener, requested review and the Court granted  certiorari in the challenge brought by the Biden administration.

The case has garnered significant attention with 84 amicus briefs having been filed, 32 in support of the petitioners, 51 in support of the respondents, and one in support of neither party. Amicus briefs in support of the petitioner include those from The American Academy of Pediatrics, The American Psychological Association, and the State of California with 19 other states, among others. Briefs filed in support of the respondents include those from the State of Kentucky with 21 other states, The Alliance Defending Freedom, and the Family Research Council, among others.

This brief provides background on gender affirming care and state bans, explains the legal challenge to the Tennessee law, and explores the potential Court ruling and impact on access across the country.

What is gender affirming care?

Gender-affirming care is a model of care which includes a spectrum of “medical, surgical, mental health, and non-medical services for transgender and nonbinary people” aimed at affirming and supporting an individual’s gender identity. Gender affirmation is highly individualized. Not all trans people seek the same types of gender affirming care or services and some people choose not to use medical services as a part of their transition.

Gender affirming medical care is a medically necessary evidence-based system of care that is supported by virtually all major U.S. medical associations. Decision making related to gender affirming care is a slow thoughtful process typically involving a team of providers, the patient, and in the case of minors, parents.

Among those who do seek medical care as a part of their transition, common services include puberty blockers, which temporarily delays puberty to allow a young person additional decision-making time, and hormone therapy, which enables individuals to develop physical traits that align with their gender identity. Surgeries are also sometimes a part of care but are relatively uncommon among adults and very rare among minors.

Research has found that adolescents with gender dysphoria who are denied access to medically necessary gender affirming care are at increased risk for significant behavioral health challenges including depression, eating disorders, substance use, self-harm, and suicidality.

What is the status of minor access to gender affirming care in the United States?

Access to gender affirming care for youth has been increasingly limited in the U.S. Arkansas became the first state to enact a youth gender affirming care ban in April 2021, with Arizona and Alabama following about a year later. Beginning in January 2023, the number of states enacting these policies rapidly proliferated and by August, it had reached 22 – a seven-fold increase in an eight-month period. As of November 2024, 26 states have such restrictions. While these laws mainly impact youth access to health care, some impact adult access too, and a majority of the laws include professional and/or civil penalties for health care practitioners who provide gender affirming care. Additionally, legal challenges are piling up, and laws in 17 of the 26 states are being challenged in court. The majority of cases are filed in federal courts and most have reached appellate courts.  Like the Tennessee case before the Supreme Court, most other cases also challenge state laws on 14th Amendment Equal Protection grounds, though other grounds are common as well. All of the cases filed in federal court that bring 14th Amendment Equal Protection claims, also bring 14th Amendment Due Process claims, largely focused on parental autonomy rights (i.e., the rights of parents to make decisions for their children). In some cases, alternate grounds are tied to provisions specific to an individual state’s law (e.g., if the state law includes provisions restricting gender affirming care in Medicaid) and some cases filed in state courts base claims on violation of state constitutional provisions.

States With Laws/Policies Enacted Restricting Minor Access to Gender Affirming Care, November 202

What are the key provisions in the Tennessee law (SB1)?

Tennessee law SB1 is the law prohibiting minor access to gender affirming care in the state that is being challenged at the Supreme Court. It was enacted on March 22, 2022, became effective July 1, 2023, and includes the following provisions:

  • Prohibits health care providers from providing or offering gender affirming care —  including puberty blockers, hormone therapy, and surgery — to minors. Additionally, “any person” is prohibited from providing puberty blockers or hormone prescriptions. The prohibition is inclusive of care provided via telehealth.
  • Providers violating SB1 are subject to discipline under Title 63 of TN code regulating health professionals (class B misdemeanor).
  • Creates a private right of action for minors/parents (when consent was not given) and outlines direct enforcement authority for the attorney general (regardless of consent given). Provides right to wrongful death action specifically when a minor’s death results from physical or emotional harm and there was no consent from parents.
  • As with all states with similar restrictions, provides an exclusion for care “to treat a minor’s congenital defect, precocious puberty, disease, or physical injury” unrelated to gender affirming care.
  • Provided a temporary period for minors to continue receiving care if they were already receiving prohibited care prior to the law’s enactment through March 31, 2024.

What happened with the case in the lower courts?

In the Spring of 2023, prior to the law’s effective date, three families and a provider challenged SB1 in federal court (U.S. District Court for the Middle District of Tennessee) on multiple grounds, including for violating the 14th Amendment Equal Protection Clause. The U.S. Department of Justice (DOJ) intervened in the case in support of the plaintiffs. The District Court granted in part and denied in part the plaintiffs request for a preliminary injunction, allowing minors in the state to retain access to gender affirming hormones and puberty blockers, but allowing the part of the law blocking surgeries and creating a right of action to be implemented. The state appealed the injunction to the 6th Circuit Court of Appeals and the appellate court reversed and remanded the District Court’s preliminary injunction, reinstating the ban in Tennessee (as well as the ban in Kentucky). In November 2023, both the plaintiffs and the US DOJ petitioned the Supreme Court to review their case.  (As noted above, the Supreme Court took the case based on the DOJ request.)

What is before the Supreme Court?

While the plaintiffs raised several legal theories in the original filing, the Supreme Court will only be reviewing one question:

Whether Tennessee Senate Bill 1 (SB1), which prohibits all medical treatments intended to allow “a minor to identify with, or live as, a purported identity inconsistent with the minor’s sex” or to treat “purported discomfort or distress from a discordance between the minor’s sex and asserted identity,” Tenn. Code Ann. § 68-33-103(a)(1), violates the Equal Protection Clause of the Fourteenth Amendment.” (Emphasis added.)

The U.S. government contends that the Tennessee’s law violates the 14th Amendment’s Equal Protections Clause because the law explicitly classifies minors based on sex and discriminates based on transgender status. The law prohibits treatment to minors classified as girls at birth that is available to minors classified as boys at birth and vice versa. For example, the government writes, “a teenager whose sex assigned at birth is male can be prescribed testosterone to conform to a male gender identity, but a teenager assigned female at birth cannot.“ The U.S. government cites the Tennessee law as evidence of the legislature’s intent: “SB1 bluntly declares that it draws those sex-based lines to “encourag[e] minors to appreciate their sex” assigned at birth.” Because the classification is based on sex, the law needs to be reviewed with heightened scrutiny and the U.S. government claims that the law does not pass this standard: “Tennessee has made no attempt to tailor the law to the State’s asserted health concerns.”

Tennessee contends that the ban does not constitute a sex-based classification: “SB1 includes no sex classification. It draws a line between minors seeking drugs for gender transition and minors seeking drugs for other medical purposes. And boys and girls fall on both sides of that line.”  Tennessee draws an analogy to reproductive rights cases that distinguish pregnancy and abortion from a sex classification, including Geduldig v. Aiello (in which the Supreme Court found pregnancy is not a sex-based classification), Bray v. Alexandria Women’s Health Clinic (in which the Supreme Court found that anti-abortion protesters were not in violation of the Equal Protection Clause because animus was to abortion, not women), and Dobbs v. Jackson Women’s Health Organization (in which the court wrote that state regulation of abortion is not a sex-based classification, despite equal protection claims not being before the court). Leaning on these cases, the state argues the law regulates medical care and is not sex discrimination, and therefore is not in violation of the 14th Amendment equal protection clause.

What is at stake with a Supreme Court decision?

The Court’s ruling in this case will impact laws restricting gender affirming care across the country and any future legal challenge to bans, at least on equal protection grounds.  Allowing the ban to stand would effectively leave the current patchwork of access to gender affirming care for minors, with different states permitting different levels of access to care. The 26 states with bans currently in place would likely keep them and others may follow suit. Under this scenario, where a young person lives will continue to dictate the access they have to gender affirming care and the number of those with limited access could increase.  If the Court rules this way, plaintiffs in other cases may continue to pursue legal challenges to the bans based on other grounds, such as the 14th Amendment Due Process clause.

If the Court rules that the Tennessee ban is unconstitutional, similar bans in other states would also be unconstitutional and minors would gain greater protections in accessing gender affirming care nationwide.

The court could also rule that the Tennessee law does classify minors based on sex and remand the case back to the lower court for further review.

The Court’s decision is expected in June 2025.

What might the impact of the incoming Trump Administration be?

The Supreme Court is hearing the case challenging the Tennessee ban at a time when state and federal actions around gender affirming care have become increasingly politicized. The court took the case at the request of the Biden administration. However, just over a month after hearing the case, President-elect Trump will take office and the Trump-Vance team has made clear that it will seek to limit access to gender affirming care through multiple mechanisms.

If the Court rules the Tennessee law is constitutional, it may be harder to challenge any new federal restrictions the Trump administration imposes.  Indeed, even if the Court rules the Tennessee law is unconstitutional because it is sex discrimination, the Trump administration may still put forward other restrictions to care, such as in Medicaid and Medicare, contending these are not addressed by the Tennessee case.

VOLUME 11

Concerns Over Fluoride in Water and Free Speech Violations

This is Irving Washington and Hagere Yilma. We direct KFF’s Health Misinformation and Trust Initiative and on behalf of all of our colleagues across KFF who work on misinformation and trust we are pleased to bring you this edition of our bi-weekly Monitor.


Summary

This volume of the Monitor explores the growing opposition to water fluoridation and its potential impact on dental health efforts. It also examines how misinformation about COVID-19 vaccines is influencing public health policies and trust in health authorities, as well as the complex issues surrounding the balance with free speech and mitigating health misinformation.


Recent Developments

Unsubstantiated Claims About Water Fluoridation Threaten Public Health Efforts

Kemal Yildirim / Getty Images

Growing opposition to water fluoridation, fueled by figures like Robert F. Kennedy Jr., is challenging this longstanding public health measure in the U.S. The CDC and other health experts endorse fluoridation as a safe and effective way to prevent cavities and promote dental health, but some fear that fluoride is a neurotoxin, and water fluoridation can cause fluorosis – a condition resulting from excessive fluoride consumption that affects the appearance of children’s teeth. Some also fear cognitive decline and even cancer. These claims, which have circulated since fluoride was first introduced into water supplies, have recently been amplified by misrepresentations of findings from an August 2024 U.S. National Toxicology Program (NTP) monograph. The NTP report suggests a potential link between high fluoride levels (above 1.5 mg per liter) and lower IQ in children, but only in regions with naturally high fluoride concentrations, not in U.S. public water supplies where fluoride is added at the much lower level of around 0.7 mg per liter.

Health experts explain that most studies linking fluoride to negative health effects examine samples with fluoride levels well above U.S. standards, concluding that fluoridation at recommended levels is safe. However, unverified claims about fluoride risks have begun to influence policy discussions. Some communities have already voted to remove fluoride from their water supplies. As more communities consider doing the same, experts warn that it could lead to increased dental health issues, especially in areas with limited access to dental care.

This debate reflects broader issues of public trust in health measures and scientific authority. For example, a popular post on X (formerly Twitter) from October 7 claimed that “the government put fluoride in our water and attacked anyone who questioned it,” falsely asserting that the NIH labeled fluoride “hazardous to human health.” By October 22, the post had amassed 2.8 million views, 17.8 thousand reposts, and 60.7 thousand likes. In response to such misinformation, overly simplistic public health messaging that categorizes fluoride as universally “safe” or “unsafe” may inadvertently fuel distrust. Instead, public health messaging could benefit from a more nuanced approach that explains how fluoride generally benefits dental health within recommended levels while acknowledging scientific uncertainties. This approach may help build a foundation of trust in public health guidance amidst a climate of skepticism.

Idaho Health Department Bans COVID-19 Vaccine Distribution, Reflecting Growing Misinformation and Eroding Public Trust

Luis Alvarez / Getty Images

On October 22, the Southwest District Health Division board in Idaho voted to stop distributing COVID-19 vaccines at its district clinics, citing alleged safety concerns. Although extensive research supports the safety and efficacy of COVID-19 vaccines, this decision marks the first instance of a U.S. health department banning their distribution. On social media, some vaccine opponents praised Idaho’s decision, framing it as “leading the way” in opposition to COVID-19 vaccines. Residents can still access COVID-19 vaccines at pharmacies and clinics not affiliated with the health department. However, such policies may undermine public trust in vaccines and limit access to essential health services, especially for vulnerable populations. The vote in Idaho aligns with a trend of local health departments making public health choices based on misleading or incomplete information. Last year, Texas banned the use of public funds to promote COVID-19 vaccinations, and the Florida Health Department continues to advise against COVID-19 mRNA boosters. These actions indicate that misinformation may not only reduce vaccination rates but also erode public trust in health authorities’ ability to handle future health crises. Studies suggest that addressing misinformation among those hesitant to receive COVID-19 vaccines remains difficult when trust in health institutions like the CDC is low.

Polling Insights:

Trusted messengers and information sources play an important role in efforts to combat the proliferation of health misinformation. KFF’s Health Misinformation Tracking Poll Pilot found that individual doctors are the most trusted source of information on health issues, with 93% of the public saying they have a great deal or a fair amount of trust in their own doctor to make the right recommendations on health issues. Most adults also say they trust government health agencies – including the CDC, FDA, or their state and local public health officials. While similar shares across partisans say they trust their doctor for health information, Republicans and independents are less likely than Democrats to trust the CDC, the FDA, and their state and local health authorities for such information.

Most Adults Have at Least a Fair Amount Of Trust in the CDC, FDA, or
 Their State and Local Health Officials to Make the Right Health Recommendations, Though Partisans are Divided

Balancing Free Speech and Public Health Becomes Difficult as Misinformation Discipline and Social Media Censorship Come into Focus

Nora Carol Photography / Getty Images

A federal judge’s decision to allow the Missouri v. Biden case to continue renews discussions on First Amendment rights and social media content moderation. Originally brought by Missouri and Louisiana, the case challenges the Biden administration’s communications with social media companies regarding COVID-19 information. The states allege that officials pressured these platforms to censor certain views. The Supreme Court dismissed the case in June, citing a lack of standing due to insufficient links between government influence and platform moderation, but the judge’s recent ruling allows further discovery to determine if the states have legal standing to proceed. As the states continue to look for evidence of government suppression of free speech, this case could impact public trust in health communication efforts and set new precedents for the government’s role in moderating online content.

The debate over First Amendment rights extends beyond social media to include medical advice shared by professionals both online and offline. During the COVID-19 pandemic, some health providers faced allegations of spreading misinformation, particularly regarding unverified treatments like ivermectin. However, regulating misinformation—even when spread by physicians—presents challenges due to First Amendment protections and the difficulty of distinguishing harmful speech from legitimate medical practice. State medical boards can discipline doctors for spreading harmful misinformation, but their authority varies by state. A recent study found that disciplinary actions against physicians for misinformation are rare, accounting for less than 1% of all medical board sanctions. Agencies like the FDA and the FTC can also discipline clinicians who spread false health information or engage in fraudulent practices. However, the Supreme Court’s decision to overturn the Chevron doctrine may make it harder for these agencies to regulate misinformation, as they may now face more legal challenges in doing so.


Research Insights

Training Community Health Educators Can Improve Confidence in Delivering Vaccine Education

FG Trade / Getty Images

A study in Vaccines explored a program aimed at equipping U.S. Extension professionals—community-based educators who connect local populations to research-based resources and support—with the tools to improve adult vaccination education, particularly during the COVID-19 pandemic. The intervention included a tailored toolkit designed to address key challenges such as maintaining community trust, connecting with medical experts, and enhancing Science Media Literacy to counter misinformation. Components like motivational interviewing, neuromarketing techniques, and targeted workshops were well-received and helped increase professionals’ confidence in delivering vaccine education. Through iterative feedback, the toolkit was refined for practical use, making it adaptable to different community needs. The researchers present a framework that could be applied to train other healthcare providers, emphasizing trust-building, clear communication, and the development of practical tools to combat misinformation and improve patient education.

Source: Austin, E. W., O’Donnell, N., Rose, P., Edwards, Z., Sheftel, A., Domgaard, S., … & Sutherland, A. D. (2024). Integrating Science Media Literacy, Motivational Interviewing, and Neuromarketing Science to Increase Vaccine Education Confidence among US Extension Professionals. Vaccines, 12(8), 869.

Sources of Fluoride Information for Mothers: The Role of Family, Healthcare Professionals, and Community Beliefs

SolStock / Getty Images

A 2022 study published in JAMA explores where mothers obtain information about fluoride use for their children’s dental health, focusing on various social sources such as family, healthcare professionals, and community members. The study found that while many mothers rely on these networks for fluoride-related advice, the information they receive is often conflicting, leading to confusion about fluoride’s safety and effectiveness. Some mothers trust family members or healthcare professionals, while others are influenced by community beliefs, leading to concerns about fluoride’s safety. The study highlights how inconsistent messages can make it difficult for mothers to evaluate the accuracy of fluoride information, suggesting that improving communication within these social networks could help address misinformation and support more informed decisions about children’s oral health.

Source: Burgette, J. M., Dahl, Z. T., Janice, S. Y., Weyant, R. J., McNeil, D. W., Foxman, B., & Marazita, M. L. (2022). Mothers’ sources of child fluoride information and misinformation from social connections. JAMA network open5(4), e226414-e226414.


AI & Emerging Technology

Leveraging AI for Efficient and Credible Health Misinformation Fact-Checking

Laurence Dutton / Getty Images

Artificial intelligence (AI) can be a tool in combatting health misinformation by offering the potential to automate and scale up fact-checking efforts. With misinformation spreading rapidly, particularly in online spaces, AI can help identify and debunk false health claims quickly and efficiently by quickly detecting claims, gathering supporting evidence, and assessing the accuracy of statements to verify information in real-time. Not everyone trusts AI for health information, but a study examining AI-assisted fact-checking found that the persuasive effect of fact-checking remained strong even when AI was involved, regardless of participants’ attitudes toward the technology. This suggests that AI can support fact-checking efforts without diminishing their impact, even among those skeptical of AI. The perception of AI as impartial may also reduce bias concerns and make fact-checking more credible. By leveraging AI in newsrooms, fact-checking processes can become faster and more efficient, allowing for broader coverage of health misinformation.

About The Health Information and Trust Initiative: the Health Information and Trust Initiative is a KFF program aimed at tracking health misinformation in the U.S., analyzing its impact on the American people, and mobilizing media to address the problem. Our goal is to be of service to everyone working on health misinformation, strengthen efforts to counter misinformation, and build trust. 


View all KFF Monitors

The Monitor is a report from KFF’s Health Information and Trust initiative that focuses on recent developments in health information. It’s free and published twice a month.

Sign up to receive KFF Monitor
email updates


Support for the Health Information and Trust initiative is provided by the Robert Wood Johnson Foundation (RWJF). The views expressed do not necessarily reflect the views of RWJF and KFF maintains full editorial control over all of its policy analysis, polling, and journalism activities. The Public Good Projects (PGP) provides media monitoring data KFF uses in producing the Monitor.

Coverage of Dental Services in Traditional Medicare

Published: Nov 25, 2024

NOTE: This analysis was updated in November 2024 to reflect changes in the most recent Physician Fee Schedule Final Rule.

Medicare does not offer broad coverage of dental services under traditional Medicare, but through recent regulatory action, the Biden Administration has taken steps to modify Medicare payment policies to expand the types of dental services that are covered. In Medicare Physician Fee Schedule Final Rules from recent years, the administration made changes to Medicare payment policies for certain dental services, in addition to other payment and policy changes. The 2023 rule clarified CMS’s interpretation of when medically necessary dental services can be covered and codified certain payment policies, and the 2023, 2024, and 2025 rules define new clinical scenarios for which Medicare payment can be made for dental services. This brief describes current law related to coverage and payment for dental services under Medicare and the rationale for changes to current policy, explains changes to dental payment and coverage included in these rules, and discusses the impact on Medicare and beneficiaries.

As explained in more detail below, these rules modestly expand the types of dental services that are covered under Medicare, including dental or oral examinations prior to any organ transplant surgery, cardiac valve replacement or valvuloplasty procedures, beginning in 2023, and dental or oral examinations prior to treatment for head and neck cancer beginning in 2024. Based on changes in the 2024 rule, Medicare will cover treatment to address dental complications after radiation, chemotherapy, and/or surgery for head and neck cancer, as well as dental or oral examinations prior to chemotherapy, chimeric antigen receptor (CAR) T-cell therapy, and the administration of high-dose bone-modifying agents when used in the treatment of cancer. Further, based on changes in the 2025 rule, Medicare will cover dental or oral examinations as well as diagnostic and treatment services to eliminate an oral or dental infection prior to or at the same time as Medicare-covered dialysis services for the treatment of end-stage renal disease.

While these changes are projected to benefit a small number of Medicare beneficiaries, they do not represent a broad expansion of Medicare coverage of dental services. Traditional Medicare does generally not cover routine preventive services including exams and x-rays, or coverage of more extensive services, including root canals and dentures. These changes will not substantially increase Medicare spending or covered dental services for a large number of Medicare beneficiaries. Absent a broader expansion of dental coverage under Medicare, people on Medicare who do not have a comprehensive source of dental coverage will continue to face relatively high out-of-pocket costs, particularly if they need extensive dental care that is unrelated to other covered medical services.

Medicare coverage of dental services is generally very limited

Since its establishment in 1965, Medicare has explicitly excluded coverage for dental services, except under limited circumstances. Limited or no dental coverage contributes to Medicare beneficiaries foregoing routine and other dental procedures. For example, in 2018, half of Medicare beneficiaries did not have a dental visit (47%), and cost was a major barrier to care for those who reported they couldn’t get dental care in the past year. Among those who used dental services, average out-of-pocket spending was $874 in 2018. Lack of dental care can exacerbate chronic medical conditions, such as diabetes and cardiovascular disease, and contribute to delayed diagnosis of serious medical conditions. While routine dental services are not covered by Medicare, many Medicare beneficiaries have access to some dental coverage through other sources: nearly half of all Medicare beneficiaries are enrolled in Medicare Advantage plans, almost all of which offer dental coverage as an extra benefit, but the scope of coverage varies by plan.

Under current law, Section 1862(a)(12) of the Social Security Act, Medicare is prohibited from making payments for “…services in connection with the care, treatment, filling, removal, or replacement of teeth or structures directly supporting teeth.” However, exceptions to this prohibition can apply in the context of inpatient hospital services “in connection with the provision of such dental services if the individual, because of his underlying medical condition and clinical status or because of the severity of the dental procedure, requires hospitalization in connection with the provision of such services.”

Current CMS policy has interpreted the Medicare statute to cover medically necessary dental services under both Parts A and B if they are “incident to and as an integral part” a covered procedure. For example, Medicare currently covers dental procedures, such as:

  • when the reconstruction of a ridge is performed as a result of and at the same time as the surgical removal of a tumor (for other than dental purposes);
  • extraction of teeth to prepare the jaw for radiation treatment of neoplastic disease; and
  • an oral or dental examination performed on an inpatient basis as part of a comprehensive workup prior to renal transplant surgery.

Interested stakeholders, including patient advocates, providers, and members of Congress have asked CMS to use its authority to expand Medicare coverage of medically necessary dental services. CMS has also received feedback that its interpretation of Section 1862(a)(12) of the Social Security Act has been “unnecessarily restrictive” and may contribute to inequitable care, particularly for older adults who are at high risk of poor oral health, which can exacerbate and complicate the treatment of other medical issues. Further, these stakeholders have asserted there are additional clinical scenarios where dental services are directly related to the clinical success of a covered service under Medicare Parts A and B.

To provide greater clarity on current dental coverage under Medicare and to respond to these stakeholders, in the 2023 physician payment final rule, CMS clarified its interpretation of the statute, codified certain payment policies, defined new scenarios where payment can be made for dental services, and outlined a process for more medically necessary dental services to potentially be covered under Medicare. In the 2024 and 2025 rules, CMS included additional scenarios where payment can be made for dental services and covered by Medicare.

The 2023 final rule clarifies CMS’s interpretation of when medically necessary dental services can be covered and codifies certain payment policies

In the 2023 final rule, CMS clarified its interpretation of the statute and permitted Medicare to make payment for dental services under Medicare Part A and B “that are inextricably linked to, and substantially related and integral to the clinical success of, certain other covered medical services” regardless of the setting, whether inpatient or outpatient.

With this clarification of the statute, the rule codified that dental services can continue to be made based on the interpretation that these services “are inextricably linked to, and substantially related and integral to the clinical success of, an otherwise covered medical service”, including:

  • dental or oral examination as part of a comprehensive workup prior to a renal organ transplant surgery;
  • reconstruction of a dental ridge performed as a result of and at the same time as the surgical removal of a tumor;
  • wiring or immobilization of teeth in connection with the reduction of a jaw fracture;
  • extraction of teeth to prepare the jaw for radiation treatment of neoplastic disease; and
  • dental splints only when used in conjunction with medically necessary treatment of a medical condition.

The 2023 final rule clarified that Medicare Parts A and B payment for dental services can occur only when dental and medical services are integrated, meaning medical and dental professionals must coordinate care. The rule also finalized a policy whereby Medicare can pay for ancillary services that are critical to the success of dental services, such as X-rays, administration of anesthesia, and use of an operating room.

Currently, for the limited circumstances under which Medicare pays for some dental services, Medicare payments to dentists are generally based on the physician fee schedule. For services that are not included on the fee schedule, regional Medicare Administrative Contractors (MACs), which are responsible for administering Medicare claims, determine the amount to be paid. The 2023 final rule continued this policy, allowing MACs to determine that payment can be made for dental services and the payment amount itself in other circumstances not specifically addressed in the rule.

The final rules define new clinical scenarios for which Medicare payment can be made for dental services

CMS evaluated clinical evidence for additional dental services to determine whether they are substantially related and integral to the clinical success of other covered services. Based on this evidence, payment can now be made under Medicare Parts A and B for:

2023 Rule

  • dental or oral examinations, including necessary treatment, performed as part of a comprehensive workup prior to any organ transplant surgery (rather than only renal organ transplant surgery), or prior to cardiac valve replacement or valvuloplasty procedures (beginning in 2023).
  • dental or oral examination, including necessary treatment, performed as part of a comprehensive workup in either the inpatient or outpatient setting prior to or at the same time as Medicare-covered treatments for head and neck cancer (beginning in 2024).

2024 Rule

  • diagnostic and treatment services to address dental or oral complications after radiation, chemotherapy, and/or surgery when used in the treatment of head and neck cancer (beginning in 2024).
  • dental or oral examinations, including necessary treatment, performed as part of a comprehensive workup prior to or at the same time as chemotherapy, chimeric antigen receptor (CAR) T-cell therapy, and the administration of high-dose bone-modifying agents (antiresorptive therapy) when used in the treatment of cancer (beginning in 2024).

2025 Rule

  • dental or oral examination as part of a comprehensive workup prior to, or at the same time as Medicare-covered dialysis services for the treatment of end-stage renal disease (ESRD) (beginning in 2025).
  • diagnostic and treatment services to eliminate an oral or dental infection prior to, or at the same time as, Medicare-covered dialysis services for the treatment of ESRD (beginning in 2025).

As part of the 2023 final rule, CMS described how it will use the Physician Fee Schedule annual rulemaking process to determine whether additional dental services should be considered for payment under Medicare. CMS will make this determination based on evidence from relevant peer-reviewed medical literature and research studies, clinical guidelines, or generally accepted standards of care for the suggested clinical scenario, and other supporting documentation. CMS used this process to determine that payment should be made for the dental services described above that were finalized in the 2024 and 2025 rules.

Impact on Medicare beneficiaries and payments

CMS has estimated that these changes will not result in a significant increase in Medicare spending or covered dental services for a large number of Medicare beneficiaries.

  • CMS estimated that approximately 190,000 additional dental services could be covered by Medicare prior to organ transplants, cardiac valve replacement, or valvuloplasty procedures beginning in 2023, at an additional annual cost of $200,000 to $2.55 million, depending on utilization.
  • CMS estimated an additional 155,000 beneficiaries might receive dental services for which Medicare could be paid relating to chemotherapy, Car T-cell therapy, and bone-modifying agents for cancer as well as treatment for head and neck cancers, beginning in 2024, at an additional annual cost of $130,000 to $2 million, depending on utilization.
  • CMS estimated the potential cost of the payment for dental services for beneficiaries with ESRD, which would apply to approximately 30,000 patients in traditional Medicare, would represent a small cost to the Medicare program of less than $1 million in any given year, even at varying levels of utilization.

How Pending Health-Related Lawsuits Could be Impacted by the Incoming Trump Administration

Published: Nov 25, 2024

Note: This content was updated on July 1, 2025 to reflect new regulations eliminating ACA Marketplace eligibility for DACA recipients.

Introduction

While much of health policy will be shaped by executive and legislative action under the incoming Trump administration, a variety of pending lawsuits also may be affected by the incoming administration, as it may choose to drop litigation that the Biden administration defended or pursued. The outcomes of these lawsuits could have significant impacts across many aspects of health care, including preventive services, abortion care, gender affirming care, Medicare drug price negotiations, nursing home staffing rules, private coverage consumer protections, and protections and health coverage for Deferred Action for Childhood Arrivals (DACA) recipients. While in many cases President-elect Trump has not commented publicly on the issues in these lawsuits, his record as president, comments on the campaign trail, and proposals from conservative groups suggest he might view these cases differently from the Biden administration. This brief provides an overview of these legal challenges, how they may be affected by the incoming Trump administration, and the implications of their potential outcomes.

Affordable Care Act

ACA Preventive Services

The outcome of a pending federal lawsuit, Braidwood Management Inc v Becerra, which challenges the ACA preventive services requirements, could put coverage of many preventive services at risk. The Biden administration is defending the ACA requirement and fighting the case. President-elect Trump has not publicly voiced an opinion on the case, but Project 2025, a set of policy proposals from conservative groups, calls for the federal government to issue new requirements for contraceptives and other women’s preventive services because of the pending case.

The ACA requires most private health insurance plans to cover a range of preventive services without any patient cost-sharing. In the case, Braidwood Management v. Becerra, Christian owned businesses and six individuals in Texas assert that (1) the requirements in the law for specific expert committees and a federal government agency to recommend covered preventive services is unconstitutional, and that (2) the requirement to cover preexposure prophylaxis (PrEP), medication for HIV prevention, violates their religious rights. In June 2024, the 5th Circuit Court of Appeals affirmed the district court’s ruling that the part of ACA’s preventive services coverage requirement (services recommended by United States Preventive Services Task Force (USPSTF) is unconstitutional) but that only the plaintiffs are permitted to exclude USPSTF recommended services from their plans. The plaintiffs’ claim that the Secretary of HHS’s ratification of HRSA and ACIP recommendations violates the Administrative Procedure Act was sent back to the lower court for further briefing and a judgment. In September 2024, the Biden Administration petitioned the Supreme Court to review the 5th Circuit’s decision. The Supreme Court has not yet decided whether to take the case. If the Trump administration does not defend the case, a state might join the lawsuit to defend the ACA’s preventive services requirement just as California intervened in the case brought by Texas challenging the ACA when the first Trump administration did not defend the federal law.

Private Coverage Consumer Protection Regulations

Lawsuits have recently been filed challenging Biden administration rules that regulate so-called “junk” insurance products that do not provide comprehensive health insurance coverage, which the Trump administration may not defend. For example, designed for people who experience a temporary gap in health insurance coverage, short-term, limited duration (short-term plans) plans typically offer fewer covered benefits and consumer protections compared to plans that meet ACA standards. The duration and renewability of short-term plans have been the subject of changing federal regulations, with the Obama administration in 2016 restricting coverage to less than three months without renewability, and the Trump administration in 2018 expanding the permitted coverage duration to less than 12 months with the ability to renew coverage for up to an additional 24 months. The Biden administration’s 2024 regulation limits short-term plan coverage to three months plus a one-month extension. A lawsuit was recently filed in a Texas federal court, American Association of Ancillary Benefits v. Becerra et. al, challenging this regulation as beyond the authority of the agency under the Administrative Procedure Act. That lawsuit also challenges new standards in the regulation that add consumer protections for fixed indemnity products. Fixed indemnity plans pay a specific amount if someone is sick or hospitalized. Like short-term plans, fixed indemnity plans do not have to meet most of the ACA’s consumer protections. Another lawsuit challenges the same regulation, questioning new consumer notice requirements for fixed indemnity products. The new Trump administration may not defend these actions, instead reinstating Trump-era rules for these plans or seeking to incorporate them into legislation.

Less clear is the what the Trump administration will do to defend various lawsuits challenging Biden administration regulations that implement surprise billing protections in the 2020 No Surprises Act. The No Surprises Act (NSA), signed into law by President Trump in 2020, protects patients with private insurance from surprise medical bills in certain situations when the patient receives care from an out-of-network hospital or clinician that they did not choose. The law requires health plans to cover surprise bills at in-network rates and prohibits out-of-network providers at certain in-network facilities from billing patients directly for the remainder of the bill. Biden administration regulations implementing these protections have been challenged in several lawsuits. Many of these cases are still working their way through lower courts, but two recent Fifth Circuit decisions in separate lawsuits brought by the Texas Medical Association throw out some parts of Biden administration regulations that set out how disputes between providers and insurers about out-of-network rate are resolved, while retaining other parts of Biden administration regulations on other aspect of the NSA. While consumers are still shielded from receiving surprise balance bills in many instances, the end result of these legal challenges could be an increase in insurance premiums and out-of-pocket costs for consumers.

DACA Program and ACA Marketplace Coverage Expansion

The future of the DACA program remains uncertain due to ongoing litigation, and the Trump Administration has finalized regulations to eliminate the ACA health coverage expansion for DACA recipients. DACA was established via executive action in June 2012 to protect certain undocumented immigrants who were brought to the U.S. as children from removal proceedings and provide them work authorization. The first Trump administration sought to end DACA but was blocked by the Supreme Court in 2020. The Biden administration issued regulations in 2022 to preserve DACA, but in September 2023, a district court in Texas ruled the DACA program unlawful, preventing implementation of the regulations while the case awaits a decision in the Fifth Circuit Court of Appeals. Under the pending ruling, the Department of Homeland Security is processing DACA renewal requests and related employment authorizations but not initial DACA requests. In May 2024, the Biden administration issued regulations to extend eligibility for ACA Marketplace coverage with subsidies to DACA recipients, who were previously ineligible for federally funded health coverage. The regulation became effective November 1, 2024. In August 2024, a group of 19 states filed a lawsuit against the federal government alleging that the coverage expansion for DACA recipients violates the Administrative Procedure Act. On December 9, 2024, a federal court in North Dakota granted the plaintiffs’ motion by blocking the ACA coverage expansion from being implemented in the 19 states that filed the lawsuit (AL, AR, FL, IA, ID, IN, KS, KY, MS, MT, ND, NE, NH, OH, SC, SD, TN, TX, VA). On December 16, 2024, the U.S. Court of Appeals for the Eighth Circuit issued a temporary stay of the federal court’s injunction, temporarily allowing DACA recipients in all states to sign up for ACA Marketplace coverage. However, on December 23, 2024, the U.S. Court of Appeals for the Eighth Circuit vacated the administrative stay, thereby making DACA recipients in the aforementioned 19 states ineligible for ACA Marketplace coverage again. The Trump administration said that it would try again to eliminate DACA protections after the first attempt failed in 2020. Given its views generally on immigration issues and DACA specifically, the Trump administration is presumably unlikely to appeal any ruling against DACA or the coverage expansion. In an interview prior to his inauguration, President-elect Trump indicated that he would work on addressing the status of “Dreamers” and indicated a willingness to work with Democrats on the issue, although the details of this proposed plan remain unclear. On June 25, 2025, the Centers for Medicare and Medicaid Services (CMS) finalized a rule that will once again exclude DACA recipients from the definition of “lawfully present” immigrants for the purposes of health coverage, making them ineligible to purchase coverage through the ACA Marketplaces beginning 60 days after the final rule’s publication. Elimination of the coverage expansion could leave thousands of DACA recipients without an affordable coverage option while elimination of the DACA program would put the over half a million DACA recipients, a majority of whom are working and many of whom have U.S.-born children, at risk of deportation.

Reproductive Health and Abortion Care

Medication Abortion

Access to mifepristone, one of the pills used in the medication abortion regimen, could be limited if the Trump administration does not defend pending litigation, amends the FDA rules, or enforces the Comstock Act. In November 2022, Alliance for Hippocratic Medicine (a group of anti-abortion medical organizations) challenged the FDA’s 2000 approval of mifepristone on procedural grounds, as well as recent changes to the regulation of the medication that eliminated the in person dispensing requirement by a physician and enabled to be mailed to patients following a telehealth consultation, as being beyond the FDA’s authority. In addition, they contended that an 1873 anti-obscenity law, the Comstock Act, prohibits the mailing of medications used for abortion. In June 2024, the Supreme Court unanimously ruled that the Alliance for Hippocratic Medicine and the individual doctors lacked legal standing to sue the FDA, but did not address the claims made by the anti-abortion challenges. However, the case continues at the district court with three state interveners (Kansas, Idaho, and Missouri) who may have legal standing. The Trump administration is not expected to defend the FDA’s actions challenged in this lawsuit. While President-elect Trump does not have a stated position on the case or on medication abortion, Project 2025 is clear in its opposition to the FDA’s approval of mifepristone and also endorses enforcement of the Comstock Act, which would effectively ban the mailing and distribution of abortion pills within the country, even in states that currently allow abortion without restrictions.

Emergency Medical Treatment and Labor Act (EMTALA) and Emergency Abortion Care

Pending litigation could determine whether states can implement abortion bans without health exceptions. Shortly after Roe v Wade was overturned, the Biden administration issued guidance in July 2022 regarding the enforcement of EMTALA, a federal law requiring hospitals to provide stabilizing treatment to patients. The guidance clarified that hospitals and physicians have obligations to provide stabilizing care, including abortion, to preserve the health of a pregnant person, not only in situations where abortion is necessary treatment to save a patient’s life. Six states (AR, ID, MS, OK, SD, and TX) have no health exception to their state abortion ban. After the guidance was issued, the Biden administration sued the state of Idaho to block the state law’s enforcement to the extent it conflicts with EMTALA, a challenge that ultimately reached the Supreme Court. In June 2024, the Supreme Court dismissed the case, Moyle v. United States (consolidated with United States v. Idaho) and returned the case to the lower court. While this case proceeds, Idaho is blocked from enforcing its abortion ban when abortion is necessary to prevent serious harm to the patient’s health. However, in a similar case, Texas successfully sued the Biden administration to block enforcement of the EMTALA guidance in Texas. The Biden administration asked the Supreme Court to review the Texas case, but the Court declined. President-elect Trump says he believes in exceptions for “life of the mother” but has not weighed in on health exceptions. Project 2025 authors call for the reversal of the Biden administration’s EMTALA guidance, which the new Trump administration could do right away, and withdrawal of federal lawsuits challenging state abortion bans without health exceptions.

Reproductive Health Privacy Regulation

A Biden administration regulation on reproductive health privacy is at risk, as the Trump administration may not defend legal challenges to the rule, as well as to parts of the HIPAA privacy regulation. In April 2024, HHS finalized a regulation adding a new category of protection to HIPAA privacy regulations for the use and disclosure of reproductive health information in certain circumstances. The rule prohibits health care providers, health plans and others from disclosing, for example, information about reproductive health care such as abortion or contraception counseling obtained legally, to a law enforcement agency seeking to investigate or impose legal liability related to that care. The state of Texas has challenged these rules and existing HIPAA standards as preventing the state from enforcing its own laws restricting abortion and other reproductive health care, including gender affirming care. The state argues in a lawsuit filed in September that HHS went beyond its authority provided in the HIPAA law and seeks to set aside these protections. Another lawsuit by a Texas physician against HHS makes similar allegations, and is also pending in a Texas federal court. Most of the reproductive health privacy rule will be effective on December 23, 2024, unless blocked by the court in these cases. If the rule becomes effective, the Trump administration could take administrative action to rescind this rule and perhaps alter existing HIPAA protections so states have greater leeway to require disclosure of reproductive health information.

Pregnant Workers Fairness Act

The outcome of pending litigation and potential regulatory changes under the new Trump administration will determine whether employers must provide accommodations to employees after an abortion. The Biden administration issued a final rule and interpretive guidance to implement the Pregnant Workers Fairness Act, which requires a covered entity to provide reasonable accommodations to a qualified employee’s or applicant’s known limitations related to, affected by, or arising out of pregnancy, childbirth, or related medical conditions, unless the accommodation will cause an undue hardship on the operation of the business of the covered entity. The Biden administration includes abortion in the definition of “pregnancy, childbirth or related medical conditions.” There are several ongoing lawsuits in federal courts challenging this rule that the incoming Trump administration is not likely to defend. The Trump administration may issue new rules that do not include abortion in the definition of “pregnancy, childbirth or related medical conditions.”

Federal Title X Family Planning Program

The structure of the Title X program could be reshaped by ongoing litigation, and the incoming Trump administration could reinstate their prior regulations that were rescinded by Biden. For more than 50 years, the federal Title X program has provided family planning services to nearly four million low-income people a year through a national network of clinics. The first Trump administration issued Title X regulations that prohibited grantees from referring clients for abortion services or having co-located family planning and abortion services which led to the withdrawal or disqualification of almost a quarter of the sites from the Title X network. The Biden administration issued regulations to reverse the first Trump administration’s policies.

The ability of states to ban abortion has added a new layer of litigation to the program. Several states that ban abortion are challenging counseling and referrals for abortion requirements under Title X. There is also ongoing litigation brought by Ohio and 11 other states contending that the Biden administration rules violate a section of the Title X law that states “none of the funds appropriated under Title X can be used in programs where abortion is a method of family planning.” In a 1991 decision, Rust v Sullivan, the Supreme Court deferred to the agency’s interpretation of that provision. However, in June 2024, the Supreme Court overturned the Chevron deference to agency interpretation of federal laws, and it is likely that the Supreme Court will ultimately decide the “correct” interpretation of that provision in a future case.

Finally, a provision requiring confidentiality–including for minors–as a criterion for receiving federal Title X funding nationally could be at risk. As a result of a privately filed lawsuit (Deanda v. Becerra) minors in Texas must receive parental consent before obtaining contraceptive services at Title X clinics to comply with the state’s parental consent law. The Texas Attorney General recently filed a new lawsuit seeking to block nationwide enforcement of this provision. Some states, including Texas, require parental consent to get contraception for those who are not married or legally emancipated. Project 2025 calls for the reinstatement of the first Trump administration rules. The new administration could also revise the rules to eliminate the requirement for confidential services to minors, which would likely end the litigation on all these cases.

Gender Affirming Care

Gender Affirming Care Ban

The Trump administration may not support a pending challenge to a Tennessee law prohibiting gender affirming care services for minors. In the wake of a proliferation of laws curtailing minor access to gender affirming care and litigation challenging these state restrictions, the Supreme Court agreed to hear a case challenging the Tennessee ban (United States v. Skrmetti). Both the plaintiffs in the Tennessee case and the Biden administration, as an intervener, requested review. The Supreme Court granted the Biden administration’s request for review and scheduled oral argument on December 4, 2024. The Court is presented with the question of whether Tennessee’s law, which prohibits core gender affirming care services for minors, violates the equal protection clause of the 14th Amendment. Given President-elect Trump’s record to date, his administration would presumably be unlikely to support the plaintiffs as the Biden administration has. As the Court accepted the petition from the Biden administration’s Department of Justice, the future of the case is uncertain. The Court might hear the case as scheduled in December, before the administration changes, and issue its’ decision in June 2025. It’s also possible that the state of Tennessee will ask for the court to reconsider its review given the impending change of administrations.

Gender Identity Protections (Section 1557)

The outcome of pending litigation, and how the incoming Trump administration engages with it, as well as regulatory changes, will determine the reach of nondiscrimination protections for LGBTQ people. A group of 15 states sued HHS (Tennessee et al. v. Becerra et al.), challenging the Biden administration’s final rule implementing section 1557 of the ACA. Section 1557 holds the law’s major nondiscrimination protections, including those on the basis of sex, which the Biden administration interpreted to include protections on the basis of sexual orientation and gender identity. In July 2024, the district court (S.D. Miss) granted the plaintiffs’ request to block HHS from enforcing provisions of the rule related to gender identity nationwide while the case proceeds. HHS ﷟appealed the ruling to the 5th Circuit and also asked the lower court to stay proceedings pending the outcome of their appeal. The Trump administration could drop the appeal and halt any intervention with the lower court, favoring the ruling currently in place, at least until the administration issues a revised regulation.

Gender Dysphoria Disability Protections

Disability law nondiscrimination protections for people with gender dysphoria could be weakened if the Trump administration chooses not to defend a Biden regulation currently being challenged and/or issues new rules without protections. A group of 17 states sued HHS (State of Texas et al v. Becerra et al), over a nondiscrimination rule implementing amendments to its section 504 of the Rehabilitation Act of 1973 (section 504) regulation. In the preamble to the final rule, HHS states that in certain circumstances, gender dysphoria may be protected under section 504, a federal law proving nondiscrimination protections for people who have disabilities. In adopting this protection, HHS agreed with a recent Fourth Circuit case, Wiliams v. Kincaid, which concluded that gender dysphoria may constitute a disability under section 504 and the Americans with Disabilities Act, if certain conditions are met. The plaintiffs challenging the regulation argue that HHS exceeded its statutory authority with the rule, that the rule was arbitrary and capricious, and unconstitutional. The Trump administration could choose not to defend the regulation and/or issue new rules without explicitly naming these protections.

Medicare

Medicare Drug Price Negotiation Program

The new Medicare drug price negotiation program is the subject of several pending lawsuits, and it is uncertain whether the Trump administration will continue to defend the program. The Inflation Reduction Act of 2022, signed into law by President Biden in August 2022, includes a requirement for the Secretary of HHS to negotiate prices with drug companies for certain drugs covered under Medicare. The Centers for Medicare & Medicaid Services is due to announce the list of up to 15 Part D drugs to be selected for the second round of price negotiation by February 1, 2025, after concluding the first round of negotiation for 10 Part D drugs in August 2024.

Since June 2023, several lawsuits have been filed challenging the drug price negotiation program by manufacturers of selected drugs and entities representing the pharmaceutical industry. These lawsuits – nine of which remain, as of November 2024 – have raised several constitutional and statutory challenges against the program. To date, none of these lawsuits have been decided in favor of the pharmaceutical industry plaintiffs and HHS has prevailed on the substantive questions at hand, but most cases are either in the briefing stage or awaiting decisions before various U.S. appellate courts. In the event of conflicting rulings, an eventual hearing of one or more of these cases by the Supreme Court would likely be the outcome, but the timing of that is uncertain. If the plaintiffs were to prevail in one or more of these lawsuits, HHS could be blocked from continuing to implement some or all aspects of the program, which would negate savings to the Medicare program and people with Medicare associated with drug price negotiation. It is unknown to what extent HHS under the incoming Trump administration will continue to defend the Medicare drug price negotiation program in court, since the Trump campaign articulated no position on it.

Nursing Homes

Nursing Home Staffing

Several ongoing lawsuits are challenging new nursing home staff rules issued by the Biden administration, and it is unclear whether the Trump administration will defend the rule, support litigation opposing the rule, or issue new regulations. In response to longstanding staffing shortages in nursing facilities and quality concerns, the Centers for Medicare & Medicaid Services released a highly anticipated final rule in April 2024 that created new requirements for nurse staffing levels in nursing facilities. The final rule requires facilities to have a registered nursing on staff 24 hours per day, 7 per days per week and to meet minimum levels of nursing care per resident per day starting in 2026 for urban facilities and in 2027 for rural facilities. KFF estimates that only 19% of nursing facilities would currently meet the required number of staffing hours in the final rule if it took effect immediately.

Several lawsuits have been filed in opposition to the final rule, including lawsuits filed by nursing home industry groups, Texas’ attorney general, and a group of Republican state attorneys general. The legal challenges have overlapping claims including that the rule exceeds CMS’s statutory authority, the rule needs Congressional rather than agency action, and the rule is arbitrary and capricious, in violation of the Administrative Procedure Act. Opponents of the staffing rule have expressed concerns about the expected impact of the rule on costs for nursing homes and states. It is not clear whether the Trump administration will defend the nursing home staffing final rule in court, support the litigation in opposition to the rule, or issue new regulations to scale back the provisions in the staffing rule.

Poll Finding

The Role Health Care Issues Played in the 2024 Election: An Analysis of AP VoteCast

Published: Nov 25, 2024

Findings

The outcome of the 2024 presidential election is settled with Republicans regaining control of the U.S. house and controlling the U.S. Senate, with President-elect Donald Trump set to begin a second term in January 2025. With most votes counted and races called, this analysis takes a deeper dive into the role that health care issues played in the 2024 race. In the first presidential election since the overturning of Roe v. Wade and amid voters’ increased anxieties about the country’s economic direction, health care issues influenced voters’ decisions in complicated but rational ways.

In the 2022 midterm elections, Democratic candidates were able to capitalize on their base’s enthusiasm for protecting reproductive rights to encourage turnout in key electoral races. Two years post-Dobbs, voters in 10 states (including some staunchly Republican states) were directly voting on ballot measures aimed at expanding or protecting abortion access in their states, presenting a real test for abortion rights advocates who had seen other conservative states enshrine abortion rights or push back on restrictions through ballot initiatives in 2022 and 2023. Nationally, while abortion hadn’t risen to a top campaign issue when President Biden was the Democratic candidate – perhaps due to his reticence on the issue – when Vice President Harris became the nominee, the issue became more salient for voters who were confronted with two very different candidates talking about their positions on reproductive rights. President-elect Trump had successfully garnered support from the pro-life contingent of the Republican Party due to his Supreme Court appointments who overturned Roe, while he repeatedly stated throughout his campaign that he was not in favor of passing a national ban. Vice President Harris, on the other hand, embraced reproductive freedom as a core campaign issue during her short bid for president.

Yet, abortion policy never rose to a top campaign issue for voters. Instead, concerns about inflation continued to take center stage, and candidates on both sides of the aisle were tasked with crafting messages about how they would address voters’ economic concerns. Previous KFF polls before and during the campaign documented the important role that health care expenses played in voters’ economic worries.

This analysis examines the role that abortion policy and abortion-related state ballot initiatives, as well as the economy and health care costs, played in the 2024 election. In partnership with The Associated Press (AP), KFF added supplemental questions to AP VoteCast, a survey of around 120,000 voters conducted nationally and in 48 states, to provide a deep dive into how voters were weighing health care issues as they made their decisions. These questions and KFF’s analysis shed light on the role health care issues, including abortion, played in shaping the concerns voters brought to the ballot box, as well as their decisions about whether to vote and whom to vote for.

Key Findings

  • President-elect Trump won key electoral victories in four states where voters also chose to expand or protect abortion access. Trump garnered small but important shares of votes from those who voted in favor of ballot measures protecting abortion access, including support from about a third of those who voted in favor of abortion access in Missouri and three in ten voters in the battleground states of Nevada and Arizona. Large shares of pro-Trump, pro-abortion voters say they think abortion should be legal, but few say it is the most important factor in their vote. In addition, in Arizona, a substantial share of this group (more than a quarter) are young men, who are less motivated by the issue of abortion than by other issues.
  • Voters in seven states voted to expand abortion access through abortion-related ballot measures, while the ballot measures to expand or protect abortion access failed in Florida, South Dakota, and Nebraska.1  In Florida, while the ballot measure failed to reach the 60% threshold required to pass in the state (57% voted “yes”), it garnered support from majorities of voters across key demographics (including large majorities of Democratic voters (93%), Black voters (83%), independent voters (72%), women voters (66%), and Hispanic voters (65%)). However, most Florida Republicans opposed the measure (58%). Similarly, in Nebraska and South Dakota, large majorities of Republicans opposed expanding abortion access – helping to ensure the ballot measures’ defeat. And, while majorities of women voters in Nebraska voted in favor of expanding abortion rights, a majority of South Dakota women voters voted against.
  • Nationwide, abortion continued to be a motivating factor for a notable share of women voters in 2024. About three in ten women voters said abortion policy was the “single most important factor” in their vote, including 44% of Black women, 39% of Hispanic women, and one third of women voters between the ages of 18 and 44. Black women and Hispanic women were also more likely than White women to say abortion policy had a major impact on their decision to turn out and which candidate they supported. Black and Hispanic women disproportionately voted for Vice President Harris over President-elect Trump.
  • Voters’ economic anxieties were pervasive throughout the 2024 presidential campaign, and four in ten (39%) voters said “the economy and jobs” was the most important issue facing the country. With this in mind, voters also said they were worried about being able to afford many household expenses, including the cost of health care. President-elect Trump garnered majority support among voters who were most concerned with the cost of household expenses, including over half (58%) of voters who said they were “very concerned” about their own health care costs – even as Harris was seen as the more trusted candidate on health care. Overall, President-elect Trump had a ten-point advantage over Vice President Harris on who voters trust to better handle the economy.

Abortion Ballot Initiatives

In the 2024 election, voters in 10 states were asked to cast ballots on abortion-related ballot measures. In all of the states, the ballot measures were aimed at protecting or expanding abortion access, while Nebraska’s ballot also included a competing measure curtailing abortion rights. Voters in seven states voted to expand abortion access, while the ballot measures to expand or protect abortion access failed in Florida, South Dakota, and Nebraska. To see a complete explanation of the abortion-related ballot measures and the outcome of the election, check out KFF’s dashboard.

About half of voters in each of the 10 states said the outcome of the abortion ballot initiative was “very important” to them. This includes majorities of voters who said they cast their ballot in support of the ballot measures in each of the 10 states. Voters who were opposed to the ballot measures were less likely than their counterparts to say the outcome of the ballot initiative on abortion was “very important” to them, except in Nebraska and South Dakota – two states where the ballot measure seeking to expand abortion access failed. In both these states, majorities of voters on both sides of the ballot measure said the outcome of the measure was “very important” to them – suggesting that both sides were equally motivated by the potential outcome of these ballot measures.

In Florida, the ballot measure failed to reach the 60% threshold needed to pass.2  About six in ten Florida voters who voted in favor of expanding abortion access said the outcome of the ballot measure was “very important” to them compared to nearly half of voters who voted against the ballot measure in the state who said the same, suggesting while enthusiasm for the outcome of the ballot measure was on the pro-access side, it wasn’t enough to overcome the high vote percentage threshold required by Florida law.

Voters Who Voted in Support for Abortion Measures Were More Likely To Prioritize Outcome of Ballot Measure, Except in States Where Ballot Measures Failed

President-elect Trump won key electoral victories in four states where voters also chose to expand or protect abortion access. Across the ten states with abortion ballot measures, Trump garnered small but important shares of votes from those who voted in favor of ballot measures protecting abortion access, including support from about a third of those who voted in favor of abortion access in Missouri and at least three in ten voters in the battleground states of Nevada and Arizona.

In States With Abortion on the Ballot, Notable Share of Those Who Voted to Protect Abortion Rights Also Voted for Trump

Arizona and Nevada: Two Battleground States

Arizona and Nevada are two swing states that President-elect Trump won and a majority of voters passed ballot measures expanding abortion access. This is largely due to significant shares of Republican voters in each of the states voting in favor of expanding abortion access.

Arizona’s Proposition 139 (“Right to Abortion”) proposed enshrining the right to abortion in the state constitution, allowing abortion until fetal viability or at any stage in cases where the pregnant person’s health or life is at risk. The ballot measure will add an amendment to the Arizona state constitution which will provide protections similar to those in place at the federal level before Roe v. Wade was overturned. Arizona law currently bans abortions after 15 weeks. Majorities of voters across age groups and gender voted in support of Proposition 139, even as fewer men said the outcome of the measure was “very important” to them. Nearly eight in ten Black voters and three in four Hispanic voters in Arizona voted in support for expanding abortion access, as did nearly two in three White voters.

Majorities of Key Voting Groups Voted "Yes" on Arizona Proposition 139

Yet, the proposition was viewed largely through a partisan lens. The vast majority of Democratic voters and those who voted for Kamala Harris in the state also voted in support of the proposition (95% and 94%, respectively). On the other hand, most Republicans in the state and those who voted for Donald Trump voted against the proposition, yet about four in ten in both groups voted in favor of the measure. Importantly, while about three-fourths of Democratic voters and Harris voters in the state said the outcome of the ballot measure was “very important” to them, less than half of independent voters, Republican voters, and Trump voters said the same.

Support for Arizona Proposition 139 Was Largely Partisan With Large Majorities of Democratic Voters Voting "Yes"

Nevada’s ballot featured the Right to Abortion Initiative, Question 6, which sought to affirm a constitutional right to abortion up to fetal viability and after viability in cases where the pregnant person’s life or health is endangered.3  Similar to Arizona, majorities of voters across age groups, race and ethnicity, and gender voted in support of the measure – but with more variation. For example, a much larger majority of younger voters ages 18-29 in Nevada voted in support of the measure (80%) compared to older voters (63%), ages 65 and older. Younger voters were also twenty points more likely than their older counterparts to say the outcome of the initiative was “very important” to them. In addition, while two-thirds of men voted in support of the measure, just four in ten said the outcome of the initiative was “very important” to them. Less than half of white voters said the outcome of the initiative was “very important” to them, even as two-thirds voted in support.

Younger Voters, Voters of Color Were Much More Likely To Vote in Favor of Nevada Abortion Access, Say the Outcome Was Important to Them

The measure passed, receiving support from over nine in ten Nevada Democrats (94%) and those who voted for Harris (93%), as well as nearly half of Republicans (46%) and those who voted for Trump (46%). While nearly half of Republican voters and Trump voters supported the measure, just three in ten said the outcome of the ballot measure was “very important” to them.

Most Democratic and Independent Voters Supported Nevada’s Right to Abortion, As Did Half of Republican Voters
Who Were the Pro-Trump and Pro-Abortion Voters?

In all 10 states with abortion-related ballot measures, a larger share of voters voted in favor of abortion access than voted for either presidential candidate. This is largely due to significant shares of Republicans and Democrats voting in favor of the ballot measures, suggesting that partisans may agree more on abortion policy than on the candidate they want to guide national legislation on abortion access. Throughout the campaign, Trump said that abortion laws should be left to the states and that he didn’t plan on signing a national abortion ban, while Harris, on the other hand, said she would sign a national law to restore the abortions rights set by Roe.

This analysis focuses on two key battleground states and finds the demographic profile of pro-abortion ballot measure voters who also voted for President-elect Trump looks very different than the Democratic voters who voted in favor of abortion access in terms of how motivated they were by the issue. Yet, Trump voters who voted in support of abortion access also differ from the other segment of Republican voters (those opposed to the ballot measure) in their views on abortion access legality.

Young men represent the largest segment of Trump voters who voted in support of abortion access in Arizona. More than a quarter (28%) of pro-abortion Trump voters were men between the ages of 18 and 49, while older women represent the largest segment of Harris voters who voted in support of abortion access (31%). Unsurprisingly, partisanship matters a lot. Republican men and Republican women constitute nearly all of pro-abortion Trump voters.

Trump voters who voted in favor of abortion access were much less motivated by the issue of abortion compared to Harris voters who supported the ballot initiative. While four in ten (43%) Harris voters who supported the abortion initiative said that abortion was the single most important factor to their vote, just one in seven (15%) pro-abortion Trump voters said the same. While large majorities of Harris supporters who voted for the ballot measure said the issue of abortion impacted whether they turned out to vote (81%) and who they voted for (76%), far fewer Trump supporters who voted for abortion access said the same.

Four in Ten Harris Supporters in Arizona said Abortion Policy Was Their Most Important Voting Factor; Few Trump Supporters Said the Same

When comparing Trump supporters who voted for and against the ballot measure, supporters of the Arizona abortion initiative tended to be younger (51% were under age 50 compared to 39% of anti-abortion Trump voters). About seven in ten (71%) Trump voters who supported the measure said abortion should be legal in all or most cases, while the large majority of Trump voters who voted against the measure said it should be illegal in all or most cases. Among both groups, few (about one in eight) said abortion was the single most important factor in their vote.

Voters in Arizona Who Supported Abortion and Voted for Trump Were Younger, More Pro-Choice Than Anti-Abortion Trump Voters

Some of the same patterns in Arizona were also present in Nevada, with pro-abortion Harris voters more likely to rate abortion as the single most important factor than pro-abortion Trump voters, and pro-abortion Trump voters being more likely than anti-abortion Trump voters to say they think abortion should be legal in at least most cases. In Nevada, there wasn’t as much of an age and gender difference between Harris supporters and Trump supporters who voted in favor of the ballot measure, with 18-49 year old men representing about a fifth of each voting group.

Nevada Voters Who Supported Trump and Abortion Rights Were Younger and More Likely To See Abortion as a Factor, Compared to Anti-Abortion Trump Voters

Voters in South Dakota, Florida, and Nebraska Rejected Constitutional Amendments Which Would Have Invalidated Current State Bans or Restrictions

For the first time since voters have been asked to vote on abortion access since the Dobbs decision, abortion-related ballot measures failed to pass in three states—Florida, Nebraska, and South Dakota. In each of these three states, the views and motivations of Republican voters proved to be important in determining the future of abortion access.

Florida

Florida’s Amendment 4, the “Florida Right to Abortion Initiative,” would have amended the state constitution to enshrine the right to abortion until the point of fetal viability or to protect the mother’s health. While a majority (57%) of the electorate voted in favor of the initiative, it failed to meet the 60% supermajority required to pass.4  Therefore, Florida’s current 6-week abortion ban will remain in effect in the state.

While the ballot measure failed to reach the 60% threshold, large majorities of Democratic voters (93%), Black voters (83%), and independent voters (72%) in the state voted in favor. About two-thirds of women voters (66%) and Hispanic voters (65%) also supported the measure, as well as six in ten White voters (60%) and male voters (61%). While most Republicans opposed the measure, around four in ten (42%) voted in favor.

Though Majorities of Florida Voters Voted in Favor of the Abortion Rights Initiative, The Measure Did Not Reach the 60% "Yes" Threshold

Nebraska

Nebraska was the only state in this election cycle to have two competing abortion-related ballot measures. One, Initiative 434, would have established a fundamental right to abortion until fetal viability or when needed to protect the life or health of the pregnant person at any time during pregnancy, while Initiative 439, which passed, has amended the constitution to ban abortions past the first trimester, except in medical emergencies or when the pregnancy is a result of rape or incest. The state’s current 12 week ban will stay in effect, and the legislature cannot enact any protections beyond the first trimester – 14 weeks gestation.

Support for the two ballot measures was largely divided along partisan lines, with nine in ten (89%) Democrats supporting the “Right to Abortion Initiative” and about three-quarters (76%) of Republicans supporting the measure restricting abortion access. Among independent voters, a larger share supported the measure expanding abortion access (60%) than the one restricting abortion access (42%).

Over half (58%) of male voters in Nebraska voted in favor of the restrictive abortion initiative, while similar shares (57%) of women voters voted in favor of the initiative to expand abortion rights.

Majorities of Democrats, Young Adults in Nebraska Supported the Ballot Measure Enshrining Abortion Access; Republicans and Older Voters Supported the Measure Banning Abortion After the First Trimester

South Dakota

South Dakota voters rejected Amendment G, which would have amended the state constitution so that the government could only prohibit abortion after the end of the second trimester, except when necessary to preserve the life or health of the pregnant person.

Four in ten (41%) voters in South Dakota supported the measure, though there were pronounced partisan differences. Nine in ten (90%) Democrats, voted in favor of the measure, compared to about one in five Republican voters including a quarter (25%) of Republican men and one in five (19%) Republican women. A larger share of voters, including six in ten (59%) voters ages 45 and older, voted against the amendment rather than in support. Women, ages 18-44, were more divided with about half saying they voted “yes” (48%), and 52% saying they voted “no.”

Majorities of South Dakota Voters Across Gender and Age Voted Against the Ballot Measure to Expand Abortion Rights; Nine in Ten Democrats in the State Voted "Yes" on the Measure

Abortion as a Voting Issue

Abortion continued to be a motivating factor for a notable share of voters in 2024, especially a core constituent of the Democratic base – women. Overall, a quarter (25%) of voters said abortion was the “single most important” factor to their vote, similar to the share in 2022 who said the Supreme Court overturning Roe v. Wade was the most important factor (24%). In addition, about four in ten voters (43%) in 2024 said abortion had a major impact on their decision about whether to turn out, and over half (56%) said it had a major impact on which candidates they supported.

Abortion Remains a Motivating Factor Among Voters

While the overall share of voters who said abortion had an impact on their vote is unchanged from the 2022 midterm elections, it ranked well behind two key factors for voters: the future of democracy in this country and the high prices for gas, groceries, and other goods. Abortion policy also ranked behind the future of free speech in this country and the situation at the U.S.-Mexico border. For Democratic voters, abortion policy ranked above all other issues other than the future of democracy, and Democrats were more than twice as likely as Republicans to say abortion policy was the “single most important factor” to their vote.

One in Four Voters Said Abortion Was the Single Most Important Factor to Their Vote, With Larger Shares Citing the Future of Democracy or High Prices for Essential Goods

The impact of abortion policy on voters’ decisions stands out among certain groups of voters, namely groups of women voters. Three in ten women voters said abortion policy was the “single most important factor” in their vote, including 44% of Black women, 39% of Latina women, and one third of women voters between the ages of 18 and 44. Similar shares of college educated women and women without college degrees said abortion policy was the “single most important factor” in their vote.

In addition, majorities of several groups of women voters said abortion policy had a “major impact” on their decision to turn out and which candidates they supported. More than half of women ages 18 to 44, Black women, and Hispanic women said abortion policy had a major impact on their turnout in the election. Additionally, two thirds or more of Black women voters and Hispanic women voters said abortion policy had a major impact on which candidates they supported. Vice President Harris garnered majority support among Black and Hispanic women.

Large Shares of Young Women Voters and Black Women Voters Said Abortion Was the Single Most Important Factor to Their Vote, With Majorities Saying it Had a Major Impact on Their Decision to Vote

Vice President Harris Did Better Among Voters Who Prioritized Abortion

A large majority of voters (69%) who said abortion was the single most important factor to their vote supported Vice President Harris. The only other issue that one candidate had such a strong advantage on was among those who said the situation at the U.S.- Mexico border was their most important factor in their vote, a group that overwhelmingly voted for President-elect Trump. Other issues, such the future of democracy or high prices for gas, food, and groceries, were more mixed with an advantage for Harris on the former, and Trump on the latter. Voters whose most important issue when voting was the future of free speech in this country split between Harris (45%) and Trump (54%).

Harris Gained Majority Support Among Voters Who Said Abortion Was The Most Important Factor to Their Vote, While Trump Gained Support From Those Who Cited High Prices, the Border

Health Care Costs and Other Issues

Voters’ economic anxieties were pervasive throughout the 2024 presidential campaign, and four in ten (39%) voters said “economy and jobs” was the most important issue facing the country. With this in mind, voters also said they were worried about being able to afford many household expenses, including the cost of health care. Two-thirds (67%) of voters said they were “very concerned” about the cost of food and groceries, followed by more than half who said the same about affording their own health care costs (54%). About half of voters said they were “very concerned” about being able to afford the cost of their housing (51%) or the cost of gas (48%).

Two-Thirds of Voters Say They Are "Very Concerned" About the Cost of Food and Groceries, Half Say the Same About Health Care Costs

Overall, President-elect Trump had a ten-point advantage over Vice President Harris on who voters trust to better handle the economy. Trump’s advantage on the economy was present among voters, regardless of age, but varied among other groups. For example, his advantage was larger among White voters and men voters. Hispanic voters were split on which candidate they trusted to do a better job handling the economy, while Black voters were much more likely to say they trusted Harris to do a better job. Women voters, on the other hand, were also split on which candidate they trusted on the economy.

Democratic voters predictably gave Harris a big advantage and Republican voters gave Trump the advantage, while independent voters also gave Trump the advantage. Fifteen percent of independent voters said they trusted neither candidate on the economy.

Over Half of Men, White Voters, Older Voters, and Republicans Said Trump Is Better Able to Handle the Economy; Large Majorities of Democrats and Black Voters Said Harris Is Better

President-elect Trump garnered majority support among voters who were most concerned with the cost of household expenses, including over half (54%) of voters who said they were “very concerned” about their own health care costs – even as Harris was seen as the more trusted candidate on health care. Trump also garnered majority support among voters who were very concerned about the costs of gas (67%), food (61%), and housing (56%).

President Elect Trump Garnered Majority Support Among Voters Who Were Most Worried About Personal Economic Expenses

Methodology

AP VoteCast is a survey of more than 115,000 voters conducted nationally and in 48 states by NORC at the University of Chicago for The Associated Press, Fox News, PBS NewsHour, and The Wall Street Journal beginning on Oct. 28 and concluding as polls close on Nov. 5, 2024. AP VoteCast conducts interviews with a random sample of registered voters drawn from state voter files and combines them with interviews from self-identified registered voters selected using nonprobability approaches. It also includes interviews with self-identified registered voters conducted using NORC’s probability-based AmeriSpeak panel, which is designed to be representative of the U.S. population. Interviews are conducted in English and Spanish.

Note: Party labels include partisan leaning independents.

Find more details about AP VoteCast’s methodology at https://www.ap.org/content/politics/elections/ap-votecast/about.

Endnotes

  1. The other ballot measure in Nebraska, which did pass, amended the state constitution to ban abortion after the first trimester except in medical emergencies or when the pregnancy is the result of rape or incest. ↩︎
  2. While most states with abortion on the ballot required a simple majority for the measure to pass, Florida’s measure required 60% to pass. ↩︎
  3. Ballot measures have to pass in two successive general elections in Nevada. This measure will have to appear on the ballot again in 2026 before the proposed amendment is added to the Nevada constitution. ↩︎
  4. Only California (66.88%) and Vermont (76.77%) passed abortion measures protecting abortion by more than 60% in the past — this election Arizona (61.6%) Colorado (62%) Maryland (75.8%) Nevada (64.4 %) and New York (62%) exceeded 60%. ↩︎