Potential Health Policy Administrative Actions in the Second Trump Administration
President-elect Trump could exercise executive branch authority through administrative action to quickly move forward on some policy changes without congressional action.
This is a quick guide to potential health policy administrative actions under the incoming Trump administration based on campaign positions and statements by President-elect Trump, President Trump’s record during his first administration, and expected actions that would reverse or modify regulations or guidance issued by the Biden administration. Click the + to expand for details of each potential action.
Note: This is not an exhaustive list of possible administrative actions by President-elect Trump and the guide may be updated as new information becomes available up until his inauguration on January 20, 2025.
Affordable Care Act
Using authority under the Affordable Care Act, the first Trump administration issued the first price transparency requirements. The Biden administration built on the Trump-era rules on price transparency to address implementation challenges and compliance. President-elect Trump, on his 2024 campaign site, vowed to continue his previous efforts regarding price transparency. Potential future administrative efforts could include addressing concerns regarding data quality and continuing enforcement activities.
The incoming Trump administration may wish to alter current operational Marketplace enrollment standards and may narrow opportunities for enrollment. For example, the Trump administration may do away with certain special enrollment opportunities created by the Biden administration, shorten the open enrollment window for states using Healthcare.gov, or allow state-based exchanges more leniency in setting different open enrollment periods. The first Trump administration reduced the length of the open enrollment period.
In his first term, President Trump’s administration allowed enhanced direct enrollment sites (EDEs), which permit brokers to enroll people in ACA Marketplace coverage directly through a web broker website, bypassing Healthcare.gov. More recently, there have been concerns that some brokers are fraudulently enrolling or switching plans without the consumer’s consent. The Biden administration has responded by suspending certain brokers and taking other steps to ensure consumers consent to any changes in their coverage. The incoming Trump administration may take additional action to curb fraud. There are many possible approaches to addressing fraud, some of which could make it harder for consumers to enroll in coverage.
The first Trump administration significantly cut funding by 84% for the ACA’s Navigator programs, which provide outreach, education, and enrollment assistance to consumers on the Marketplace and Medicaid. The administration also cut outreach funding by 90%. These actions may have contributed to stagnating Marketplace enrollment during his time in office. The Biden administration restored outreach and enrollment assistance and funding for Navigators. The current Navigator grant program period runs through August 2029, but the next Trump administration could cut funding for other marketing or consumer education and outreach activities.
The ACA requires people enrolled in qualified health plans that offer abortion benefits to pay for that coverage using private, not federal, dollars. As a result, plans have been required to segregate payments for abortion coverage. Under the Obama and Biden administrations, issuers have been permitted to segregate the nominal payment for abortion coverage after the consumer paid the total bill. The first Trump administration issued final regulations that would have required two separate bills and payments, one for abortion coverage and another for the rest of the premium. The implementation of these regulations was blocked by court order. The incoming Trump administration may re-issue these rules.
The first Trump administration encouraged state flexibility in implementing ACA private coverage reforms, mostly by approving reinsurance waivers that were sought by both red and blue states. If enhanced subsidies in the Inflation Reduction Act expire, leading to a return of the “subsidy cliff,” there may be renewed desire for reinsurance waivers or other state-specific changes to the ACA markets.
The Trump administration may reinstate the standards for STLDs issued during his first term. STLDs offer fewer covered benefits and consumer protections compared to plans that meet ACA standards and, as a result, typically have lower premiums but increased financial risk for enrollees. In 2017, President Trump issued an executive order directing HHS to take steps to expand the availability of STLDs. The following year, HHS finalized a new regulation expanding their duration and renewability from three months to 36 months. In 2024, the Biden administration issued a final regulation limiting their total duration to four months (the rule is in effect but facing legal challenges). The Trump administration could reverse this action.
AHPs allow small employers and professional associations to band together to purchase group health insurance for their employees and members. During his first term, President Trump relaxed federal standards for AHPs, allowing certain AHPs to be considered single large group employer plans, which are exempt from the ACA’s individual and small group market standards. A federal judge invalidated the new rule, which the Trump administration appealed. The appeal was paused when President Biden took office, and his administration subsequently rescinded the rule. The next Trump administration may take action to reinstate expanded access to AHPs, though it is unclear whether a similar rule would hold up under potential legal scrutiny.
Section 1557 holds the health law’s major nondiscrimination protections, including those on the basis of sex, which the Biden administration interpreted to include protections on the basis of sexual orientation and gender identity. In his first term, Trump issued guidance indicating that sex protections would extend only to individuals based on their biological sex assigned at birth. His administration would likely issue a new regulation akin to this, removing LGBTQ protections. Additionally, in his first term, Trump used the regulation as a vehicle to remove sexual orientation and gender identity protections from other regulations outside of 1557, and he may pursue this approach again. Section 1557 implementing regulations have been heavily litigated across the Obama, Trump and Biden administrations, and legal challenges are likely to continue. Additionally, the impact of the Supreme Court ruling in Loper Bright v. Raimondo, finding that regulations like those implementing 1557 are no longer entitled to judicial deference where a statute is ambiguous, is yet to be seen. At the same time, some courts have found that 1557 protections exist within the ACA statute itself, outside of rulemaking.
Abortion
Over the past decade, the FDA has approved changes in the Risk Evaluation and Mitigation Strategies (REMS) (special conditions FDA applies to some drugs) that have broadened access to medication abortion pills. Prior to the most recent REMS modifications, the pills could only be prescribed and dispensed in person by a physician. The updated REMS extends the time period that medication abortion can be used during a pregnancy (from 7 weeks to 10 weeks of pregnancy) and allows access via telehealth, mailing of pills, and availability through retail pharmacies. Given the ongoing federal litigation related to the recent REMS and the approval of mifepristone, the new FDA leadership could review those revisions and potentially revert to older restrictions on mifepristone. President-elect Trump recently indicated he will probably not restrict access to medication abortion but left room to change his position.
An 1873 anti-obscenity law, the Comstock Act, prohibits the mailing of medications used for abortion. The Biden administration’s Department of Justice determined that the Act only applies when the sender intends for the material or drug to be used for an illegal abortion, but since there is no way to determine the intent of the sender, they did not recommend enforcement. While President-elect Trump has said he would not enforce the Comstock Act, Vice President-elect Vance and many anti-abortion Republicans have called for enforcement of the law. The Trump administration could decide to interpret the Act differently than the Biden DOJ and prohibit mailing of abortion medications and supplies to all states, which would be a de facto national abortion ban.
Shortly after Roe v. Wade was overturned, the Biden administration issued guidance in July 2022 regarding the enforcement of the EMTALA, a federal law requiring hospitals to provide stabilizing treatment to patients. The guidance clarified that hospitals and physicians have obligations to provide stabilizing care, including abortion, to preserve the health of a pregnant person, not only in situations where abortion is necessary to save a patient’s life. Six states (AR, ID, MS, OK, SD, and TX) have no health exception to their state abortion ban. President-elect Trump says he believes in exceptions for “life of the mother” but has not weighed in on health exceptions. Given the ongoing federal litigation on the Biden EMTALA guidance, the next Trump administration could reverse the guidance or limit enforcement of EMTALA violations.
In April 2024, HHS finalized a regulation adding a new category of protection to HIPAA privacy regulations for the use and disclosure of reproductive health information in certain circumstances. The rule prohibits health care providers, health plans and others from disclosing, for example, information about reproductive health care, such as abortion or contraception counseling obtained legally, to a law enforcement agency seeking to investigate or impose legal liability related to that care. Most of the reproductive health privacy rule will be effective on December 23, 2024. The Trump administration may take administrative action to rescind this rule and perhaps alter existing HIPAA protections giving states greater leeway to require disclosure of reproductive health information. In addition, the Trump administration might choose not to defend pending litigation that challenges HIPAA privacy standards that limit states’ ability to disclose reproductive health information to law enforcement authorities.
In the wake of the Dobbs ruling in 2022, HHS issued guidance reiterating to retail pharmacies the prohibitions on discrimination, and the application of these rules to supplying prescribed medications such as contraceptives as well as medications that could affect pregnancy outcomes. The Trump administration could rescind this guidance to address a legal challenge filed by the state of Texas.
During the Biden administration, the VA issued a rule in 2022 (finalized without changes in 2024) amending the Department’s medical regulations authorizing the VA to provide abortion services to veterans and CHAMPVA beneficiaries in all states when the pregnancy is the result of rape or incest, or if the life or the health of the pregnant person is endangered. The rule also allowed for the provision of abortion counseling in the VA. Prior to this rule change, the VA was prohibited from providing any abortion services, with no exceptions allowed, a standard stricter than the Hyde Amendment. Should the next Trump administration revoke this rule, the VA may return to a policy banning the provision of any abortion care in response to opposition by House Republicans and Attorneys General in states with abortion bans.
In 2023, the Department of Defense (DoD) approved a new policy providing travel and transportation allowances for troops and their dependents who must go out of their area to obtain an abortion or fertility care (troops and spouses). The Department also provides up to three weeks of administrative absence, including to accompany a dependent, to obtain abortion or fertility services. The policy also gives service members up to 20 weeks to notify their superiors about a pregnancy and states that clinicians should maintain a service member’s privacy and not inform a commanding officer about a pregnancy. These policies could be reversed or amended by new DoD leadership. There have been calls by anti-abortion lawmakers to rescind this policy.
The Biden administration issued a final rule and interpretive guidance to implement the Pregnant Workers Fairness Act, which requires a covered entity to provide reasonable accommodations to a qualified employee’s or applicant’s known limitations related to, affected by, or arising out of pregnancy, childbirth, or related medical conditions, unless the accommodation will cause an undue hardship on the operation of the business of the covered entity. The Biden administration includes abortion in the definition of “pregnancy, childbirth or related medical conditions.” There are several ongoing lawsuits in federal courts challenging this rule that the incoming Trump administration is not likely to defend. The Trump administration may issue new rules that do not include abortion in the definition of “pregnancy, childbirth or related medical conditions.”
In 2019, under the first Trump administration, the NIH issued a new policy that required applicants for NIH research funds to undergo an ethics review if their study involved fetal tissue derived from abortions. Fetal tissue research has been used to study human development, immune function, vaccine development, and other biomedical research on certain cancers and chronic conditions. The first Trump administration also prohibited the use of federal dollars to purchase fetal tissue for biomedical studies by government employees. The Biden administration reversed these limitations, but the incoming Trump administration is expected to reinstate them.
The ACA requires people enrolled in qualified health plans that offer abortion benefits to pay for that coverage using private, not federal, dollars. As a result, plans have been required to segregate payments for abortion coverage. Under the Obama and Biden administrations, issuers have been permitted to segregate the nominal payment for abortion coverage after the consumer paid the total bill. The first Trump administration issued final regulations that would have required two separate bills and payments, one for abortion coverage and another for the rest of the premium. The implementation of these regulations was blocked by court order. The incoming Trump administration may re-issue these rules.
During the first Trump administration, CMS revoked Obama-era guidance that reiterated federal Medicaid policy requiring free choice of provider for Medicaid enrollees using family planning services. Additionally, CMS also approved a Section 1115 waiver application from Texas that excluded clinics that offer both family planning and abortion services from participating in the state’s family planning program, in direct violation of federal Medicaid policy. Elimination of federal funds to clinics that offer both contraception and abortion services is a priority of conservative lawmakers, and it is expected that if more states submit similar waiver requests, the Trump administration would approve them.
President-elect Trump is expected to reinstate, through executive action, the expanded Mexico City Policy, or “Protecting Life in Global Health Assistance,” issued in his first term. The Mexico City Policy, first announced in 1984 by the Reagan administration, has been rescinded and reinstated by subsequent administrations along party lines ever since. Before the first Trump administration, the policy, when in effect, required foreign NGOs to certify that they would not “perform or actively promote abortion as a method of family planning” using funds from any source (including non-U.S. funds) as a condition of receiving U.S. global family planning assistance. In 2017, President Trump reinstated but also significantly expanded the policy to apply it to the vast majority of other U.S. global health assistance, including PEPFAR, for the first time. Some have recommended that President-elect Trump expand the policy even further.
Contraception
The first Trump administration issued Title X regulations that prohibited sites that receive Title X funding from referring pregnant clients seeking abortion to abortion providers, requiring referrals to prenatal or adoption options. They also disqualified all sites that had co-located family planning and abortion services or were affiliated with abortion providers. This led to the withdrawal of almost a third of the sites from the Title X network and was associated with a sharp drop in the number of patients served by the program. The Biden administration reversed these changes, and the next Trump administration could reinstate them.
In October 2024, the Biden administration proposed a new rule that would build on the ACA’s coverage requirements and expand coverage of contraception without cost-sharing for those with private insurance. If finalized, most private insurers would be required to cover all FDA-approved methods without cost sharing unless the plan also covers a therapeutic equivalent without cost-sharing. In addition, plans would need to cover over-the-counter (OTC) contraceptives without a prescription from a clinician, and insurers would also be required to disclose to enrollees that OTC contraceptives like Opill and emergency contraception are included in this coverage. The proposed rule also addresses new coverage requirements for other OTC contraceptive methods, such as male condoms. Assuming the Biden administration finalizes this rule, the new Congress and President-elect Trump could overturn it within the first 60 days using the Congressional Review Act.
Medicaid
The Biden administration finalized two rules designed to make it easier for eligible individuals to enroll in and retain Medicaid and CHIP coverage and to facilitate transitions to Basic Health Plan or Marketplace coverage for those who are no longer eligible. The Medicare Savings Program (MSP)rule helps eligible Medicare beneficiaries more easily access Medicaid coverage of Medicare premiums and cost sharing through the MSPs. The second rule simplifies application, enrollment, and renewal processes for Medicaid, CHIP and the Basic Health Program enrollees and removes access barriers for children in CHIP, including waiting periods, lifetime limits on coverage, and lock-out periods for failure to pay premiums. Each rule is expected to increase Medicaid enrollment by about one million people. The Trump administration could delay implementation of provisions that have not yet gone into effect or issue new regulations that would undo some or all of the rule’s provisions. The impact of those actions may be less significant for the MSP rule, which had been implemented by most states as of October 2022, according to a KFF survey. During his first term, the Trump administration issued guidance calling for more frequent eligibility checks between renewal periods.
Section 1115 Medicaid demonstration waivers offer states an avenue to test new approaches in Medicaid that differ from what is required by federal statute, so long as the approach is likely to “promote the objectives of the Medicaid program.” Waivers generally reflect priorities identified by states as well as changing priorities from one presidential administration to another. Each administration has some discretion over which waivers to approve and encourage, but that discretion is not unlimited. The Trump administration’s Section 1115 waiver policy emphasized work requirements – which were challenged in court – and other eligibility restrictions and capped financing. During President Trump’s first term, CMS also made changes to 1115 waiver budget neutrality policy, limiting the amount of federal funds that could be used for waiver spending.
The Biden administration finalized major Medicaid regulations designed to promote quality of care and advance access to care for Medicaid enrollees. The Access rule addresses several dimensions of access: increasing provider rate transparency and accountability, standardizing data and monitoring, and creating opportunities for states to promote active enrollee engagement in their Medicaid programs. The rule also includes many provisions governing access to home care (also known as home- and community-based services or HCBS), which include ensuring that at least 80% of spending on certain services be spent on compensation for direct care workers and requiring states to report the number of people on waiting lists for care. The Managed Care rule addresses Medicaid managed care access, financing, and quality, including strengthening standards for timely access to care and states’ monitoring and enforcement efforts. The Trump administration could delay implementation of certain provisions, which would reduce regulation of managed care companies and other providers while rolling back enrollee protections, payment transparency, and improved access. Alternatively, the Trump administration could issue new regulations that would undo all or some of the provisions in the final regulations. During his first term, President Trump took administrative action to change Medicaid managed care rules, including relaxing rules around network adequacy and beneficiary protections.
During the first Trump administration, CMS revoked Obama-era guidance that reiterated federal Medicaid policy requiring free choice of provider for Medicaid enrollees using family planning services. Additionally, CMS also approved a Section 1115 waiver application from Texas that excluded clinics that offer both family planning and abortion services from participating in the state’s family planning program, in direct violation of federal Medicaid policy. Elimination of federal funds to clinics that offer both contraception and abortion services is a priority of conservative lawmakers, and it is expected that if more states submit similar waiver requests, the Trump administration would approve them.
Immigration and Health
DACA was originally established via executive action in June 2012 to protect certain undocumented immigrants who were brought to the U.S. as children from removal proceedings and receive authorization to work for renewable two-year periods. During his prior term, President-elect Trump sought to end DACA but was blocked by the Supreme Court in 2020. The Biden administration issued regulations in 2022 to preserve DACA protections. In addition, in May 2024, the Biden administration published regulations to extend eligibility for Affordable Care Act (ACA) Marketplace coverage with premium and cost-sharing subsidies to DACA recipients, who were previously ineligible for federally funded health coverage options. The regulation became effective November 1, 2024. DACA and the coverage expansion are facing legal challenges, which could result in them being eliminated. Additionally, Trump administration officials have indicated that the administration will try to eliminate the program again during his second term. However, in a recent interview, President-elect Trump said he will work on addressing the status of “Dreamers,” and indicated a willingness to work with Democrats on that issue. There are over half a million active DACA recipients, a majority of whom are working and many of whom have U.S.-born children, who could be at risk of deportation if the program is eliminated. Elimination of the coverage expansion for DACA recipients would leave the nearly 100,000 uninsured DACA recipients it is estimated to cover without an affordable coverage option.
President-elect Trump could reinstate his first administration’s changes to public charge policies. Under longstanding immigration policy, federal officials can deny entry to the U.S. or adjustment to lawful permanent resident (LPR) status (i.e., a “green card”) to someone they determine to be a public charge. During his prior term, President-elect Trump issued regulations in 2019 that broadened the scope of programs that the federal government would consider in public charge determinations to newly include the use of non-cash assistance programs like Medicaid and the Children’s Health Insurance Program (CHIP). The Biden administration rescinded these changes in 2021. Research suggests that the 2019 changes made by the Trump administration increased fears among immigrant families about participating in programs and seeking services, including health coverage and care. As of November 2024, President-elect Trump has not indicated whether his administration plans to reinstate his first-term changes to public charge policy.
President-elect Trump has stated that he will use the U.S. military to carry out mass deportations of tens of millions of undocumented immigrants residing in the U.S., many of whom have been living and working in the country for decades. Such a policy could lead to family separations as well as mass detentions, which can have negative implications for the mental health and well-being of immigrant families and also put their physical health at risk. Mass deportations also could negatively impact the U.S. workforce and economy, where immigrants make significant contributions through outsized roles in certain occupations, including health care, and through billions of dollars in tax contributions.
President-elect Trump has said that he will sign an executive order to end birthright citizenship for the children of some immigrants despite it being a right guaranteed under the U.S. Constitution. This proposed action would limit access to health coverage and care for the children of immigrants since they may not have lawful status. It may also have broader ramifications for the nation’s workforce and economy, potentially exacerbating existing worker shortages, including in health care, where adult children of immigrants play an outsized role as physicians, surgeons, and other practitioners.
President-elect Trump plans to reinstate Migrant Protection Protocols, often referred to as the “Remain in Mexico” policy, which his administration first implemented in 2019. Under this policy, asylum seekers are required to remain in Mexico, often in unsafe conditions, while they await their immigration court hearings. The Biden administration ended this policy in 2022 following some legal challenges. However, it implemented a series of increasingly restrictive limits on asylum eligibility in 2023 and 2024 in response to a high number of border encounters.
During his first term, President-elect Trump set the annual refugee admissions ceiling at its lowest levels, ranging from 50,000 in 2017 to a historic low of 18,000 in 2020, and it is likely that he will reduce the admissions ceiling for refugees in his second term. The President-elect has also said that he will close the CBP One application created by the Biden administration, which allows asylum seekers to seek lawful entry to the U.S. by making an interview appointment with the DHS, which could lead to “mass cancellation of appointments” and possibly an increase in attempts to cross the border outside of ports of entry. Trump also has indicated that he will roll back temporary protected status (TPS) designations for some immigrants, including those from Haiti. TPS designations protect immigrants from countries deemed unsafe by the DHS from deportation and provide them with employment authorization but do not provide a pathway to long-term residency or citizenship. As of March 2024, over 860,000 immigrants from 16 countries were protected by TPS. Loss of TPS would put people at risk for deportation, which could contribute to family separation, which in turn can have negative impacts on the mental and physical health of immigrant families and broader negative consequences for the workforce and economy.
LGBTQ Health Policy
Section 1557 holds the health law’s major nondiscrimination protections, including those on the basis of sex, which the Biden administration interpreted to include protections on the basis of sexual orientation and gender identity. In his first term, Trump issued guidance indicating that sex protections would extend only to individuals based on their biological sex assigned at birth. His administration would likely issue a new regulation akin to this, removing LGBTQ protections. Additionally, in his first term, Trump used the regulation as a vehicle to remove sexual orientation and gender identity protections from other regulations outside of 1557, and he may pursue this approach again. Section 1557 implementing regulations have been heavily litigated across the Obama, Trump and Biden administrations, and legal challenges are likely to continue. Additionally, the impact of the Supreme Court ruling in Loper Bright v. Raimondo, finding that regulations like those implementing 1557 are no longer entitled to judicial deference where a statute is ambiguous, is yet to be seen. At the same time, some courts have found that 1557 protections exist within the ACA statute itself, outside of rulemaking.
Trump has stated that he would “sign a new executive order instructing every federal agency to cease all programs that promote the concept of sex and gender transition at any age.” This suggests taking administrative actions that could limit access to programs, services, or protections for LGBTQ people. It is also expected that Trump would rescind Biden administration executive orders aimed at promoting equity, protections, and data collection for LGBTQ people, including in health care.
Trump has stated that he would use “federal health and safety standards” to limit minor access to gender affirming care, including by “declar[ing] that any hospital or healthcare provider…[providing prescription or surgical gender affirming care to a] minor youth will no longer meet federal health and safety standards for Medicaid and Medicare—and will be terminated from the program.” This would significantly limit the ability of providers and facilities offering this care.
Public Health
During his first term, President Trump spearheaded the successful “Operation Warp Speed”, the federal government’s effort to support rapid research on and development of COVID-19 vaccines. However, he has also questioned vaccine mandates, threatening to withdraw education funding from schools that require vaccines, and shown support for the false link between vaccination and autism. In addition, President-elect Trump has announced his intention to nominate Robert F. Kennedy Jr. as Secretary of Health and Human Services and Tom Weldon as the Director of the Centers for Disease Control and Prevention, each of whom has expressed concerns about vaccine safety and promoted the false claim that childhood vaccinations are linked to autism. While both President-elect Trump and Kennedy have said they won’t take at least certain vaccines away from people, and the federal government cannot impose or revoke vaccine requirements for children in school, or enforce other broad vaccine mandates at the national level (with potential exceptions in limited cases during times of a declared public health emergencies), federal officials do have significant authority to affect vaccine policy and access. This includes the ability to: influence or bypass federal advisory committees regarding vaccine approvals and recommendations; adjust criteria for vaccine approvals and reviews; change federal vaccine-related liability policies, which could weaken or eliminate liability protections for vaccine manufacturers; end emergency use authorization, currently granted under section 564 of the Federal Food, Drug, and Cosmetic Act, of certain COVID-19 vaccines; make some state or local funding contingent on certain policies (such as ensuring no vaccine mandates for schools); and communicate to the public in ways that question the value and safety of vaccines, which in turn could contribute to growing mistrust and further reductions in vaccine coverage.
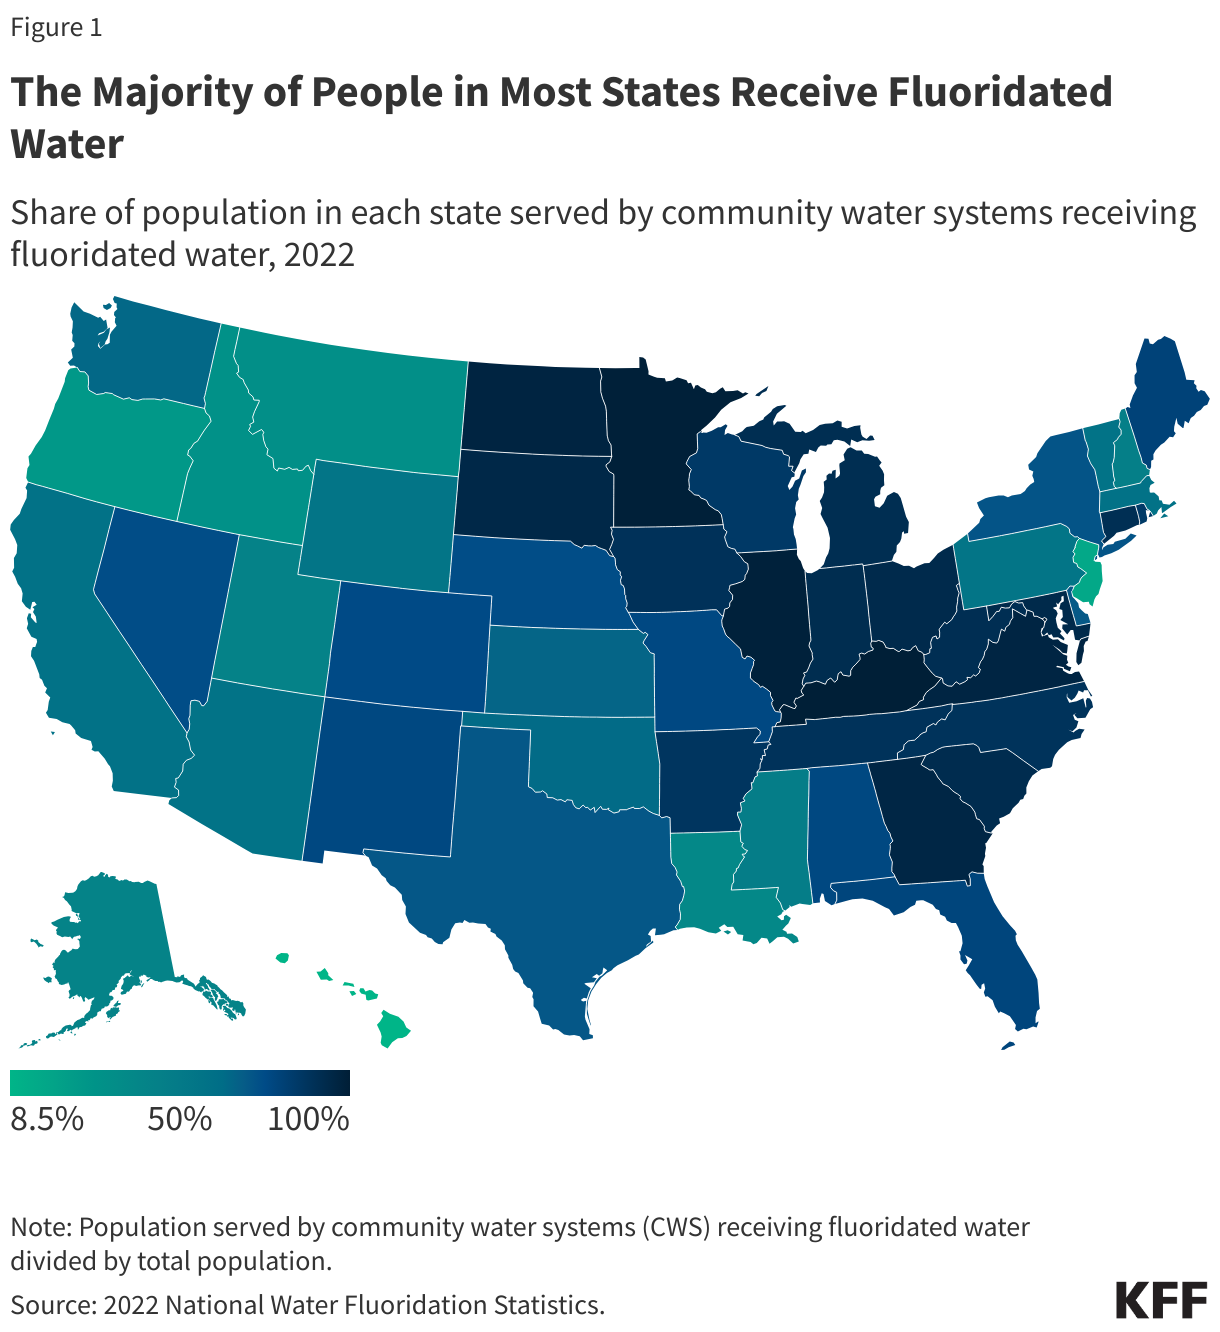
President-elect Trump’s intention to nominate Robert F. Kennedy Jr., who has long been critical of water fluoridation, as Secretary of Health and Human Services has raised questions about the potential for the new administration to influence water fluoridation practices in the United States; indeed, Kennedy has said the incoming administration will recommend that fluoride be removed from public water on day one. While the federal government cannot require state and local communities to fluoridate their water or remove fluoridation requirements already in place, the Environmental Protection Agency regulates maximum allowable fluoride levels and the Centers for Disease Control and Prevention provides guidance to state and local communities on optimal levels of fluoride. Both agencies could seek to re-evaluate regulations (in the case of EPA) or guidance (in the case of CDC), which could affect fluoridation practices across the country. In fact, a U.S. district judge recently ordered the EPA to take further regulatory action on fluoride and the EPA is reviewing the court decision.
Racial Health Equity and DEI Initiatives
During his first term, President Trump took executive action to prohibit federal agencies and contractors from providing training based on “divisive concepts” such as racism and sexism. The Biden administration revoked the executive order by President Trump and identified advancing racial equity as a whole-of-government federal priority. It took action to advance equity through a series of executive orders that led to the creation of Equity Action Plans across agencies and facilitated a wide array of federal actions focused on reducing health disparities. It is likely that President-elect Trump will rescind many Biden administration actions focused on equity and pursue actions to eliminate DEI initiatives. As a candidate, he vowed to focus on “anti-White” racism, not racism against people of color. It has been reported that supporters of President-elect Trump have drafted an executive order that would eliminate programs that promote DEI. President-elect Trump also made earlier statements indicating that he would pursue policies to address what he says is a “definite anti-White feeling in America” and bring federal civil rights cases against schools that engage in racial discrimination “under the guise of equity.” Such actions could impede efforts to increase the diversity of the health care provider workforce. Research suggests affirmative action bans have contributed to a decline in enrollment of medical school students who are underrepresented students of color.
Global Health
President-elect Trump is expected to reinstate, through executive action, the expanded Mexico City Policy, or “Protecting Life in Global Health Assistance,” issued in his first term. The Mexico City Policy, first announced in 1984 by the Reagan administration, has been rescinded and reinstated by subsequent administrations along party lines ever since. Before the first Trump administration, the policy, when in effect, required foreign NGOs to certify that they would not “perform or actively promote abortion as a method of family planning” using funds from any source (including non-U.S. funds) as a condition of receiving U.S. global family planning assistance. In 2017, President Trump reinstated but also significantly expanded the policy to apply it to the vast majority of other U.S. global health assistance, including PEPFAR, for the first time. Some have recommended that President-elect Trump expand the policy even further.
Since 2021, countries that are members of the World Health Organization (WHO) have been negotiating a new global ‘pandemic agreement’ to address weaknesses identified during the international response to COVID-19. The Biden administration has supported the concept and engaged in the process since it began. However, President-elect Trump has stated that under his administration, U.S. engagement with the negotiations will be “immediately terminated,” and several Republican members of Congress have also raised concerns about the U.S. signing on to such a treaty. Without U.S. support, the prospects of a new treaty would be significantly weakened.
Halt funding for and withdraw from the World Health Organization (WHO). President-elect Trump has stated his intention to halt U.S. funding for and withdraw the U.S. from membership in WHO. During his first term, he froze U.S. funding to WHO and initiated a process to terminate U.S. membership over critiques of WHO’s role in the global COVID-19 response. Under U.S. law, an administration must notify WHO of its intention to withdraw, which becomes official one year after such notification. President Biden took office before this time period was met, and he reversed President Trump’s decision and restored funding. The U.S. has historically been one of the largest funders of WHO, with U.S. contributions ranging between $163 million and $816 million annually over the last decade.
President-elect Trump has stated that his second administration will rejoin the Geneva Consensus Declaration, an October 2020 statement that was initially crafted and signed by the U.S. – along with 31 other countries – and meant to enshrine certain values and principles related to women’s health and family, including a rejection of the “international right to abortion.” The Biden administration withdrew the U.S. from the Geneva Consensus Declaration in 2021.
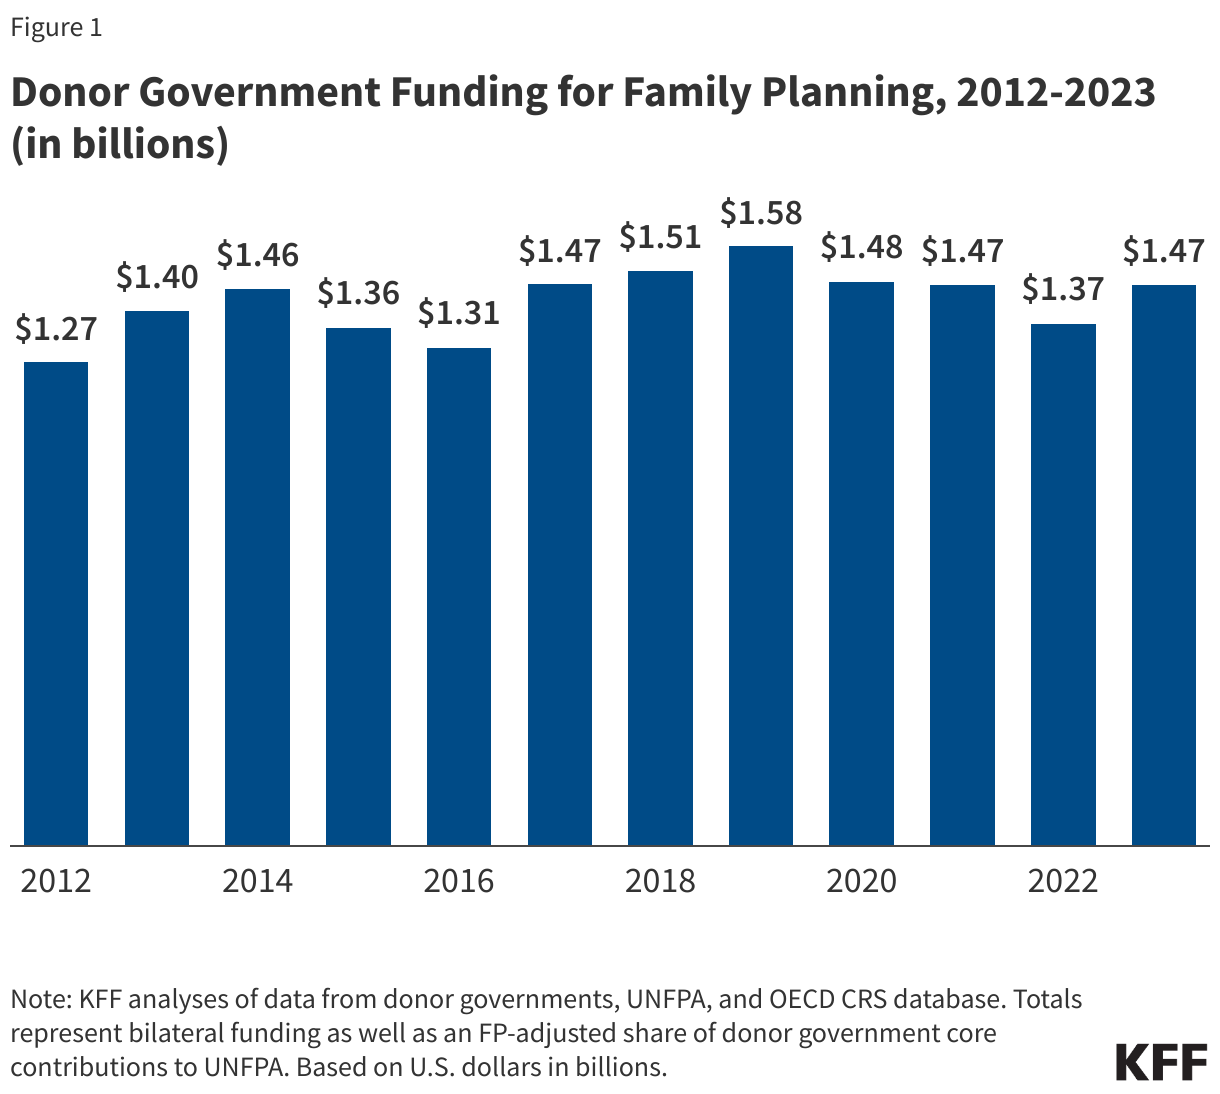
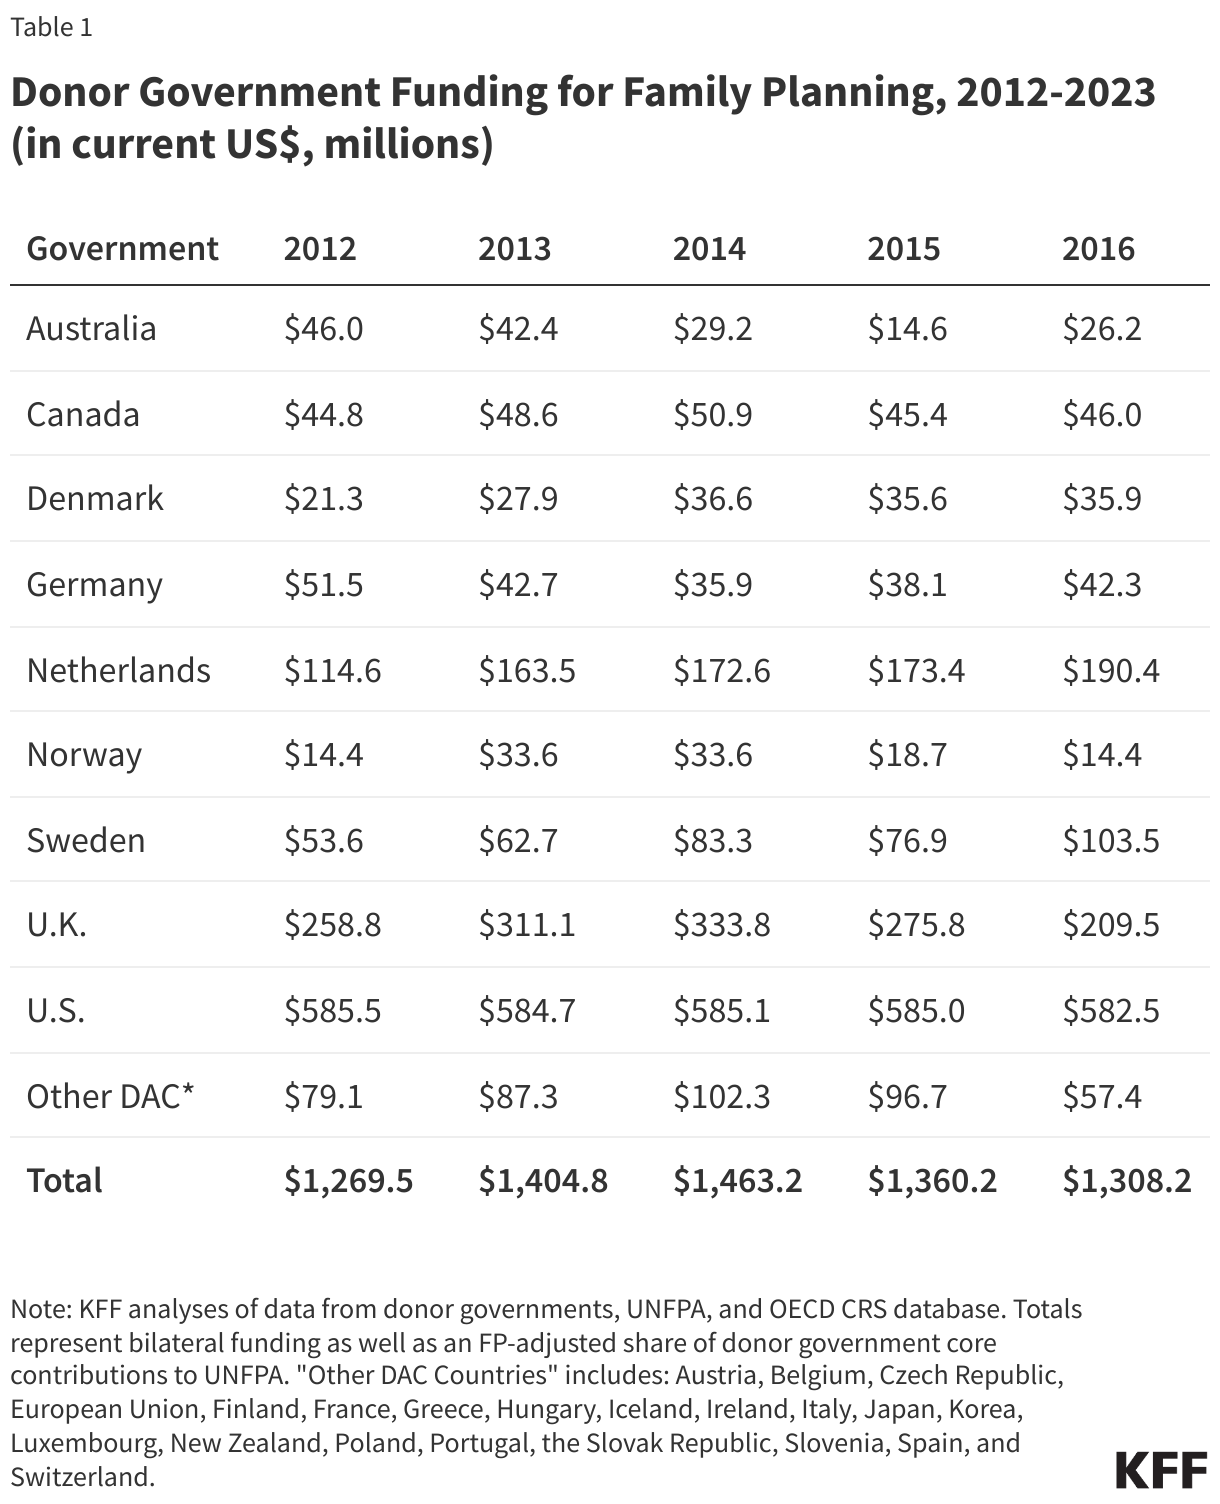
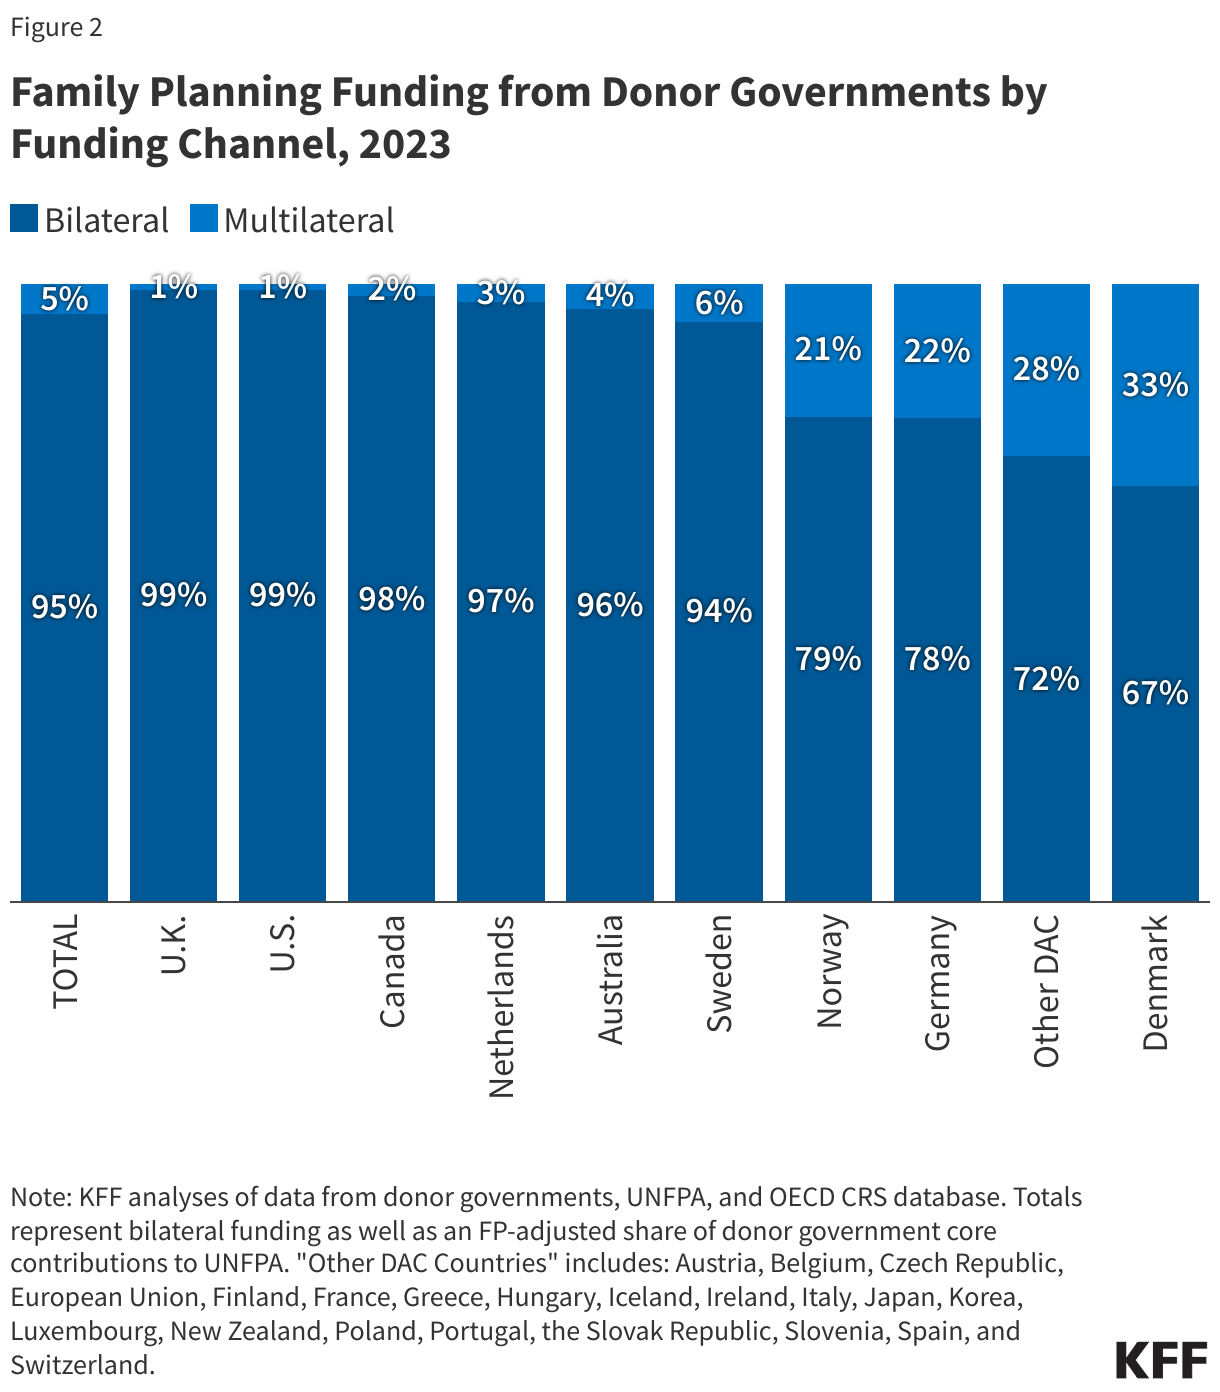
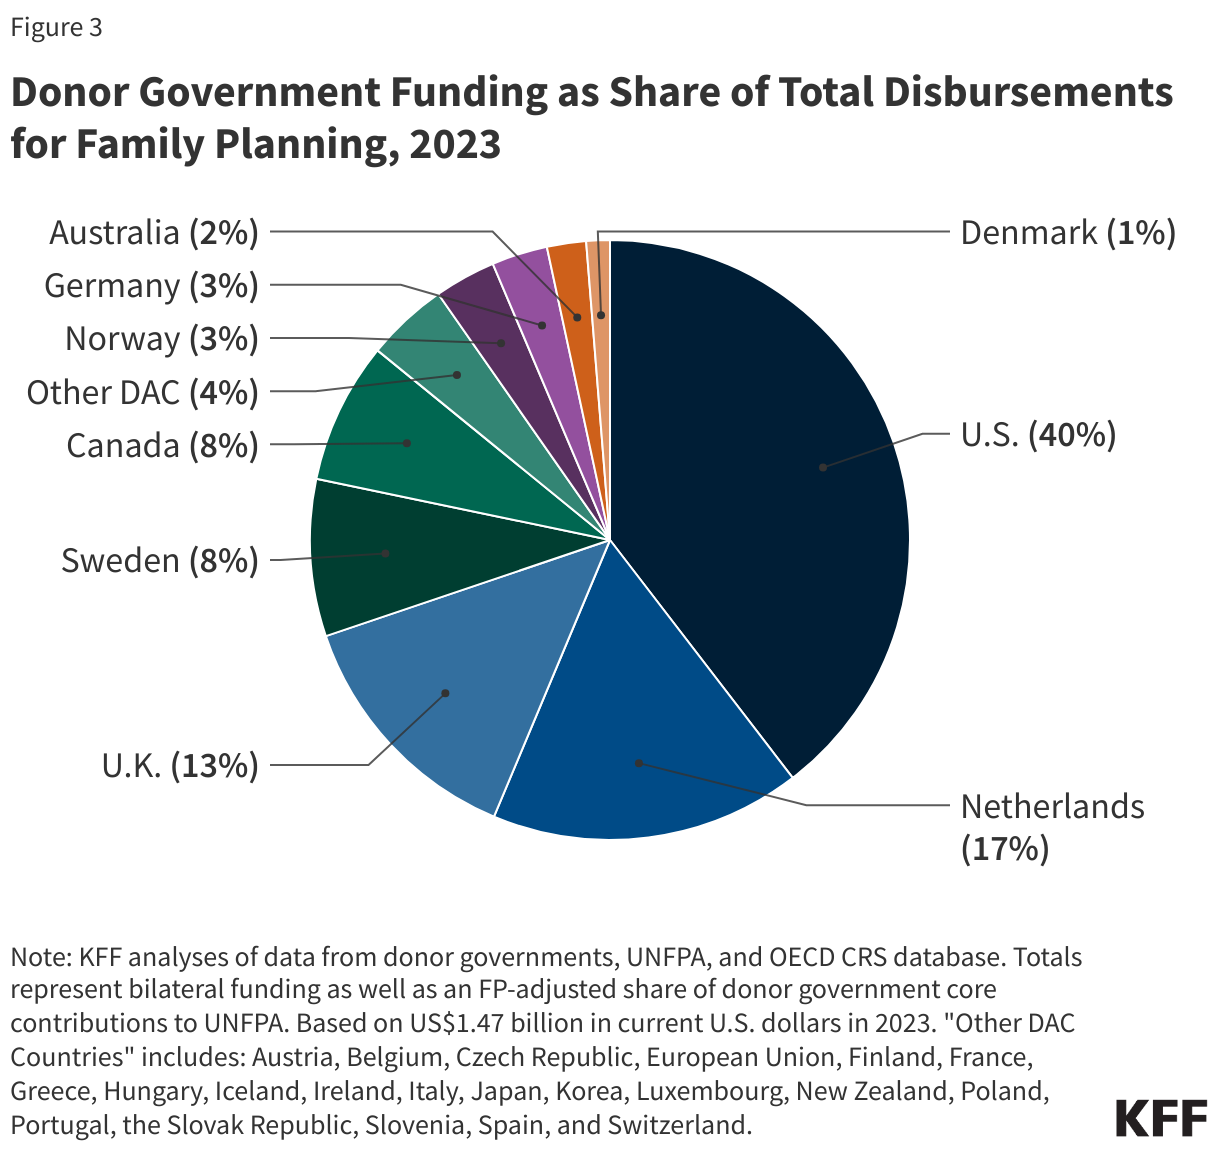
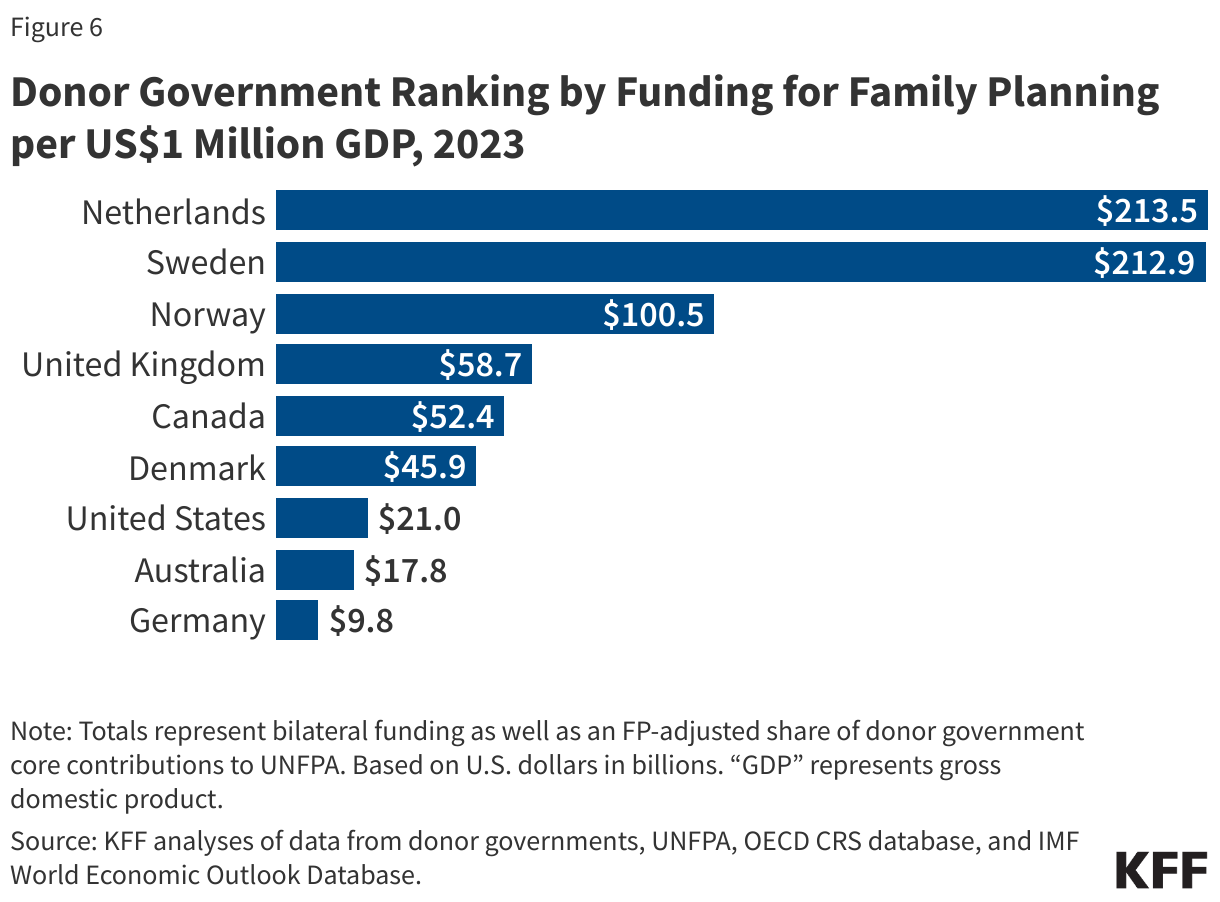
President-elect Trump is expected to again withhold U.S. funding from the United Nations Population Fund (UNFPA, the lead U.N. agency focused on global population and reproductive health) by using the Kemp-Kasten amendment, a provision of U.S. law that states that no U.S. funds may be made available to “any organization or program which, as determined by the president of the United States, supports or participates in the management of a program of coercive abortion or involuntary sterilization.” To date, there has been no evidence that UNFPA supports these activities. In FY 2023, the U.S. contributed $194.4 million to UNFPA, making it the largest government contributor to UNFPA.
Prescription Drugs
President-elect Trump is expected to reinstate an element of a 2020 executive order that would have removed essential medicines, medical countermeasures, and critical inputs to drugs and medical devices from U.S. commitments under the World Trade Organization Agreement of Government Procurement (WTO GPA). This proposal was withdrawn by the Biden administration in April 2021. The overarching goal of the 2020 executive order was to enhance the domestic production of essential medicines, medical countermeasures, and critical inputs in the face of supply chain vulnerabilities and drug shortages. The effect of removing these items from trade agreements would have meant that government agencies in the U.S. would have been unable to procure items on a list of essential medicines, medical countermeasures, and critical inputs developed by the U.S. Food and Drug Administration from other countries that are parties to the GPA. Although the Biden administration withdrew the trade-related proposal, it took other actions to bolster pharmaceutical supply chains and enhance U.S. manufacturing to address drug shortages.
Fentanyl
President-elect Trump stated that on his first day in office he will impose tariffs on imports from Mexico and Canada at 25% and an additional 10% on imports from China. He has stated that implementing tariffs will reduce the amount of fentanyl entering the U.S. and will address immigration concerns. Some suggest that tariffs may hinder progress on the fentanyl crisis made under the Biden administration, potentially by compromising coordination between the U.S. and other countries, and may also provoke retaliatory actions and increase the cost of consumer goods in the U.S. During his first term, President Trump imposed smaller tariffs under the 1962 Trade Expansion Act and the Trade Act of 1974. In November 2024, legislation was introduced to limit the implementation of import tariffs without Congressional approval and was referred to the House Committees on Foreign Affairs and Ways and Means.
President-elect Trump stated that he will “Deploy all necessary military assets, including the U.S. Navy, to impose a full naval embargo on the cartels, to ensure they cannot use our region’s waters to traffic illicit drugs to the U.S.” In 2024, the Drug Enforcement Administration reported that fentanyl is most often traced to production by cartels in Mexico and the illegal transfer of chemical precursors required to produce fentanyl from certain manufacturers in China. While the Drug Enforcement Administration ties fentanyl production to cartels in Mexico, most fentanyl is trafficked into and through the U.S. by American citizens, not migrants.
President-elect Trump stated that he will direct federal law enforcement to intensify their efforts against gangs and organized crime, including strengthening the role of the Immigration and Customs Enforcement Agency (ICE). ICE has been involved with identifying fentanyl distribution networks and is already authorized to delegate certain immigration officer functions to local law enforcement officers. President-elect Trump also intends to invoke the Alien Enemies Act to deport “known or suspected” non-citizen drug dealers and cartel members. The Alien Enemies Act is a 1798 wartime authority that has only been invoked three times in U.S. history and may face legal challenges.
Interest in faith-based treatment has grown, but many faith-based organizations are less likely to provide or accept patients using medications for opioid use disorder despite evidence showing reduced mortality. President-elect Trump plans to expand family leave protections for those seeking addiction treatment, which may build on the Family Medical Leave Act (FMLA). FMLA currently offers some employment protections for substance use treatment.
Long-term Care
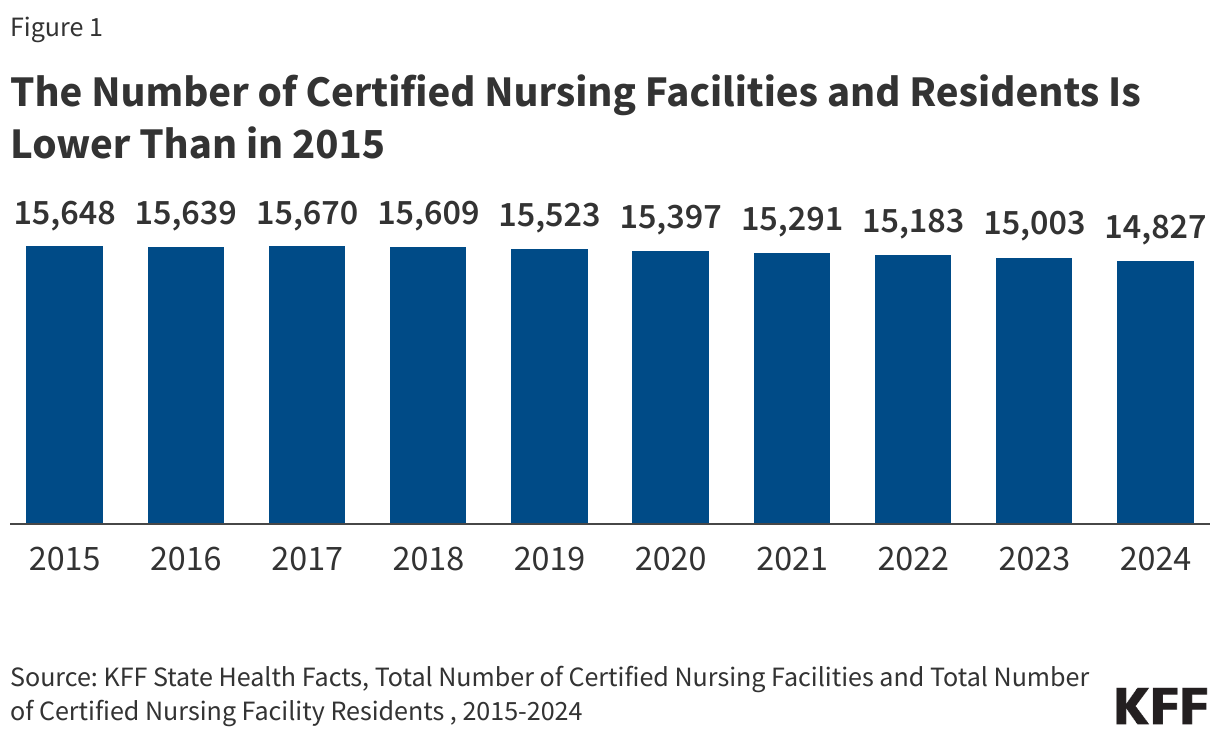
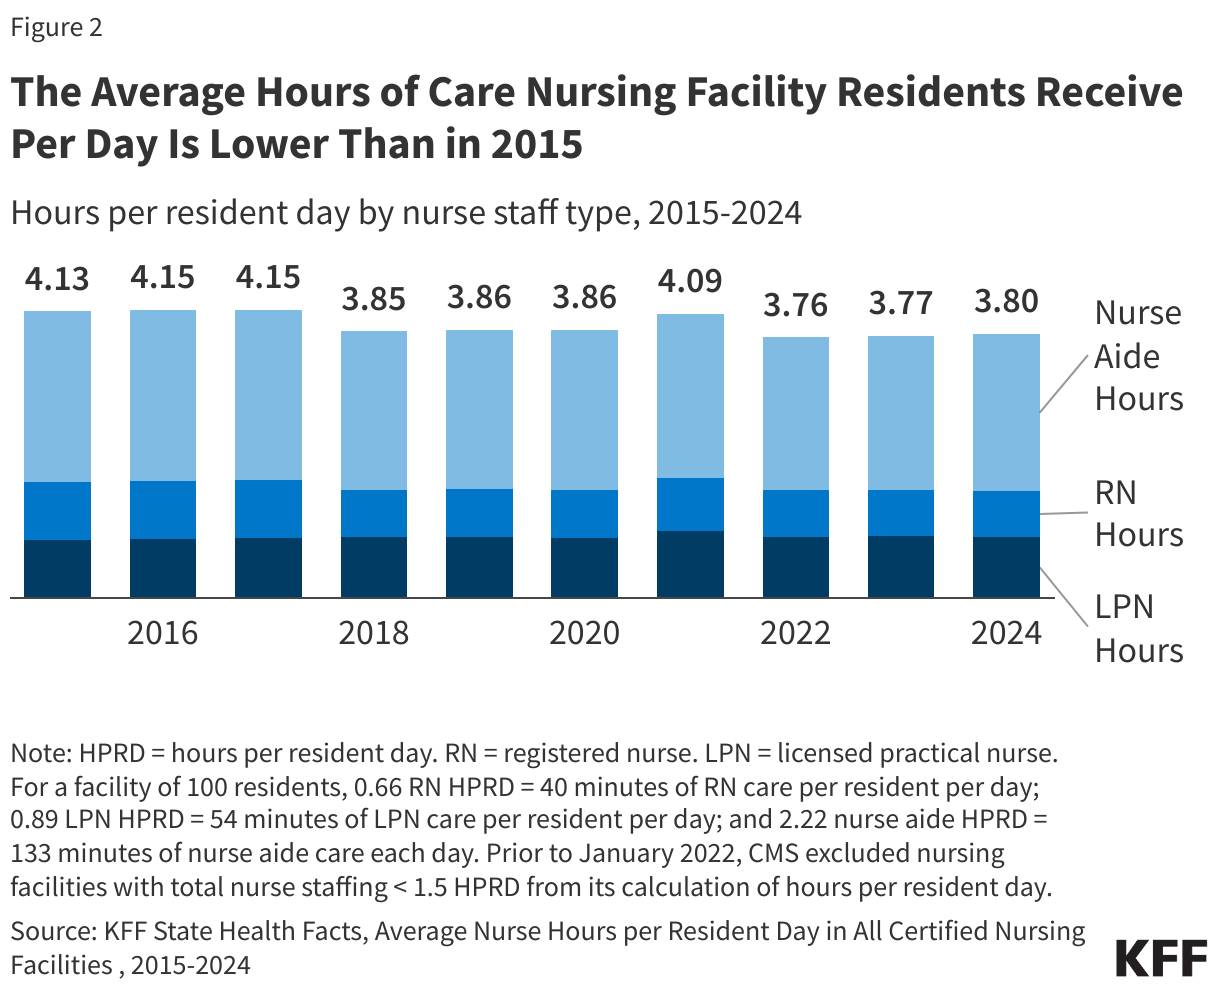
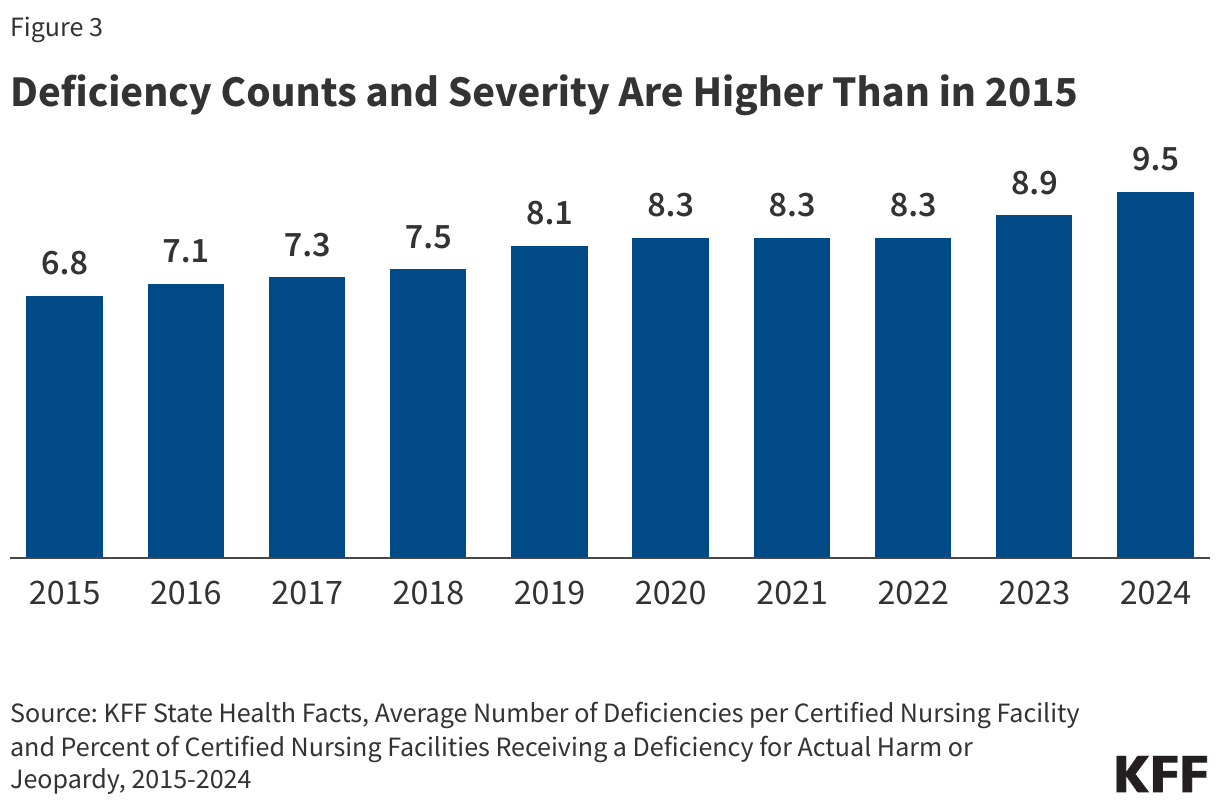
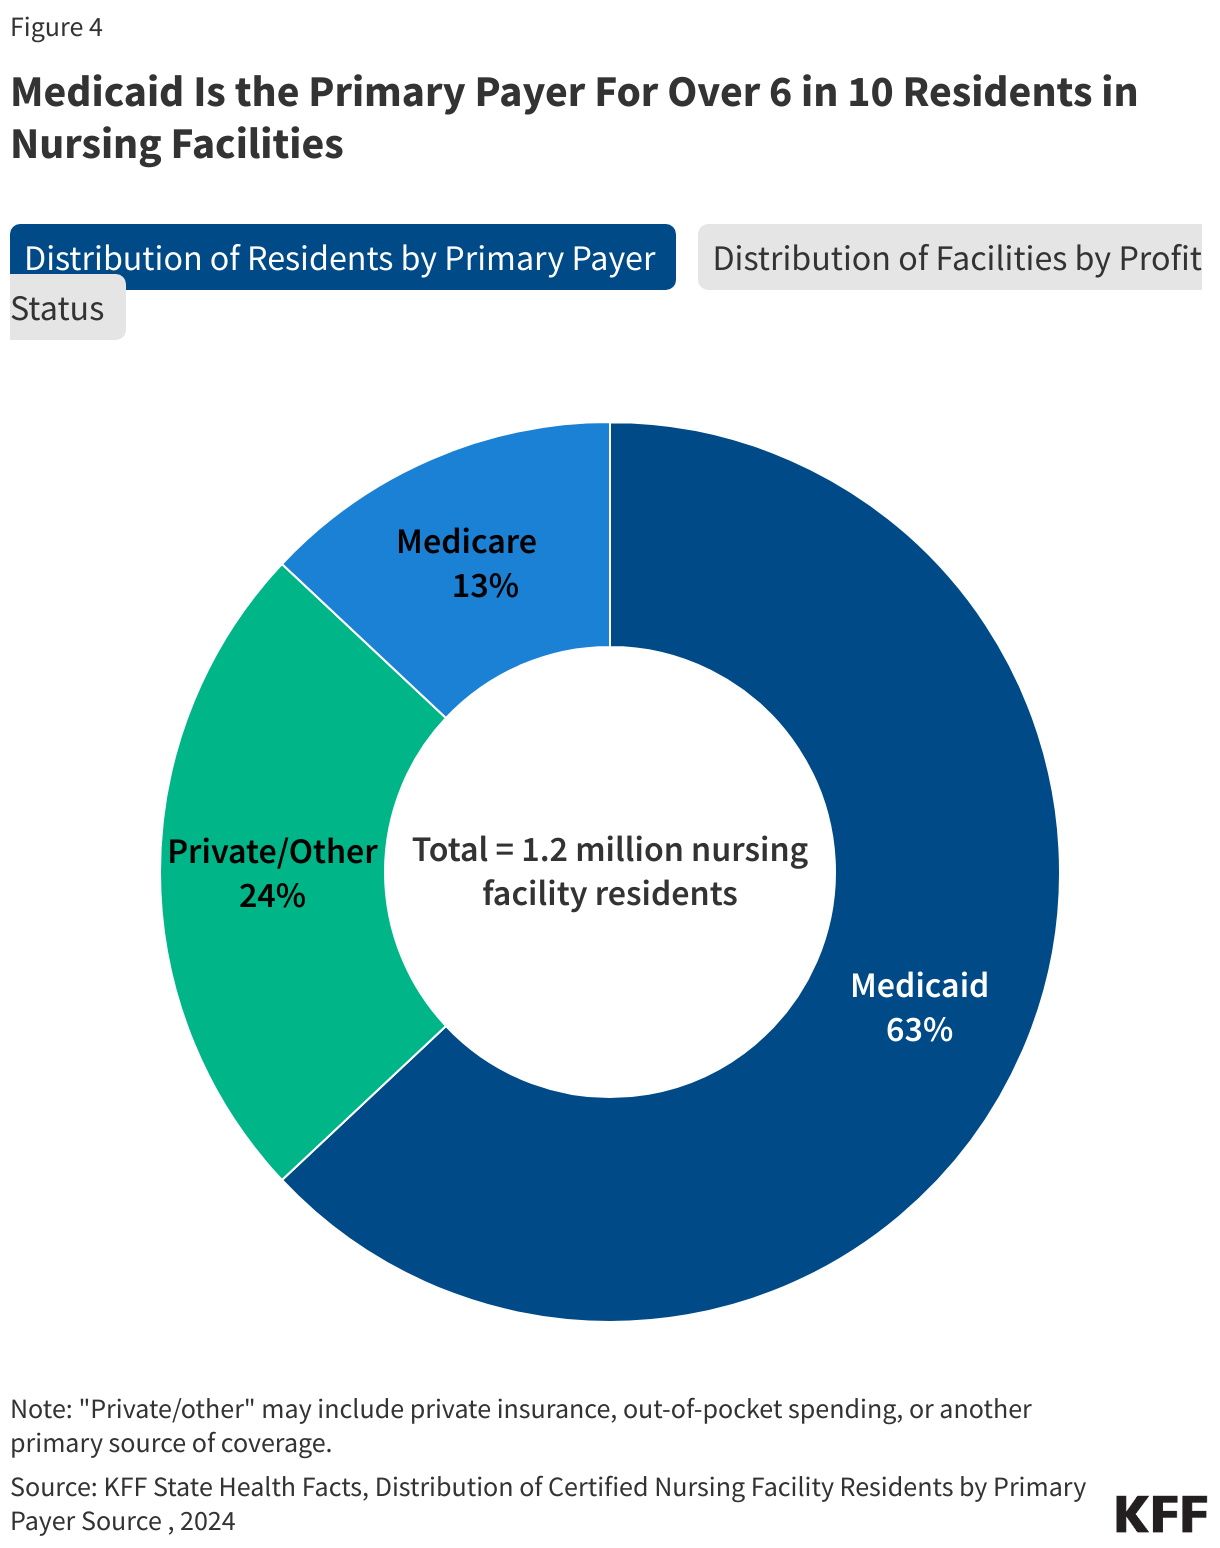
During President Trump’s first term, CMS proposed regulations that rolled back or relaxed many of the 2016 Obama-era regulations, categorizing them as “unnecessary, obsolete, or excessively burdensome.” The 2019 proposed regulations would have reduced the frequency of facility assessments from annually to biennially, removed the requirement that an infection preventionist work at a facility part-time, and removed the 14-day prescription limit for psychotropic drugs. Those regulations were not finalized during his first term, likely due to the onset of the COVID-19 pandemic, but President-elect Trump may reissue them or issue similar ones in a second term. The incoming administration may issue new regulations to undo regulations issued by the Biden administration that established the first-ever requirements for minimum staffing levels for nursing facilities. The incoming Trump administration could also choose not to defend the rule from legal challenges or support litigation opposing the rule. It is not clear if the incoming Trump administration will maintain and implement regulations issued under the Biden administration aimed at promoting transparency around nursing facility ownership.


 Irving Washington
  Hagere Yilma