How Has Insurer Participation in the ACA Marketplaces Changed in 2026?

Authors: Jared Ortaliza, Justin Lo, Matt McGough, and Cynthia Cox
Published: Jun 11, 2026

Editorial Note

This brief was updated on June 22, 2026 to correct insurer counts for Minnesota.

For the first time since the enhanced premium tax credits were introduced in 2021, insurer participation in the ACA Marketplaces has gone down. This drop follows the expiration of the enhanced premium tax credits at the end of 2025 and is primarily driven by the exit of Aetna CVS from 17 states as well as exits from other insurers. While the average number of insurers per state offering plans in the Marketplaces in 2026 is lower than in the years after the enhanced premium tax credits were established, more insurers are now offering plans than were before the enhanced tax credits.  

Key Findings

  • The average number of issuers offering plans in the ACA Marketplaces has declined from a record high of 9.6 issuers per state in 2025 to 9.0 issuers per state in 2026.
  • In total, 19 states experienced a net decrease in the number of issuers offering ACA Marketplace plans.
  • 1 in 3 counties has fewer participating ACA insurers than last year. In 165 counties, only one issuer is offering plans on the ACA Marketplace, up from 93 counties in 2025.

Insurer Participation

National Level

Figure 1

Nationally, average insurer participation in the ACA Marketplaces has decreased from the record high of 9.6 insurers per state in 2025 to 9.0 insurers per state in 2026. This decrease follows the nationwide departure of CVS from the Exchanges and marks the first time since 2018 that the average number of insurers in the ACA Marketplaces has gone down. Insurer participation on the ACA Marketplaces fell in 2017 with the exit of UnitedHealthcare from most states. In 2018, following several attempts to repeal the ACA in Congress as well as changes to enforcement of the individual mandate and payments for cost-sharing reductions, many more insurers exited or scaled back their participation. As the Marketplace stabilized in the following years, participation in the ACA Marketplaces steadily grew with some insurers returning to the Marketplace and several others expanding their footprints.

One factor that contributes to the number of insurers participating in the Marketplaces is the number of people with coverage. After the introduction of the enhanced premium tax credits in 2021, enrollment in the Marketplaces reached new records. In line with this trend, the number of insurers offering plans in the ACA Marketplaces increased significantly in 2022. Data shows that after the expiration of the enhanced premium tax credits, 2026 Open Enrollment Period sign-ups declined by over one million people relative to last year; and the number of people who pay to maintain and “effectuate” their coverage will likely decline throughout the year. KFF estimates that average effectuated enrollment in the Marketplaces could decline by about five million people from 2025 to 2026.

ACA Marketplace enrollment declines affect the size of the potential market for insurers and, potentially, the risk pool—to the extent that healthier than average enrollees are more likely to drop coverage. As people leave the Marketplace, insurers may reassess the profitability of their Marketplace participation and more may decide to pull out in the future, either fully or in select states. Several insurers have already announced departures for the 2027 plan year. KFF’s Insurer Participation Tracker maps announced insurer exits and entries for 2027.

State Level

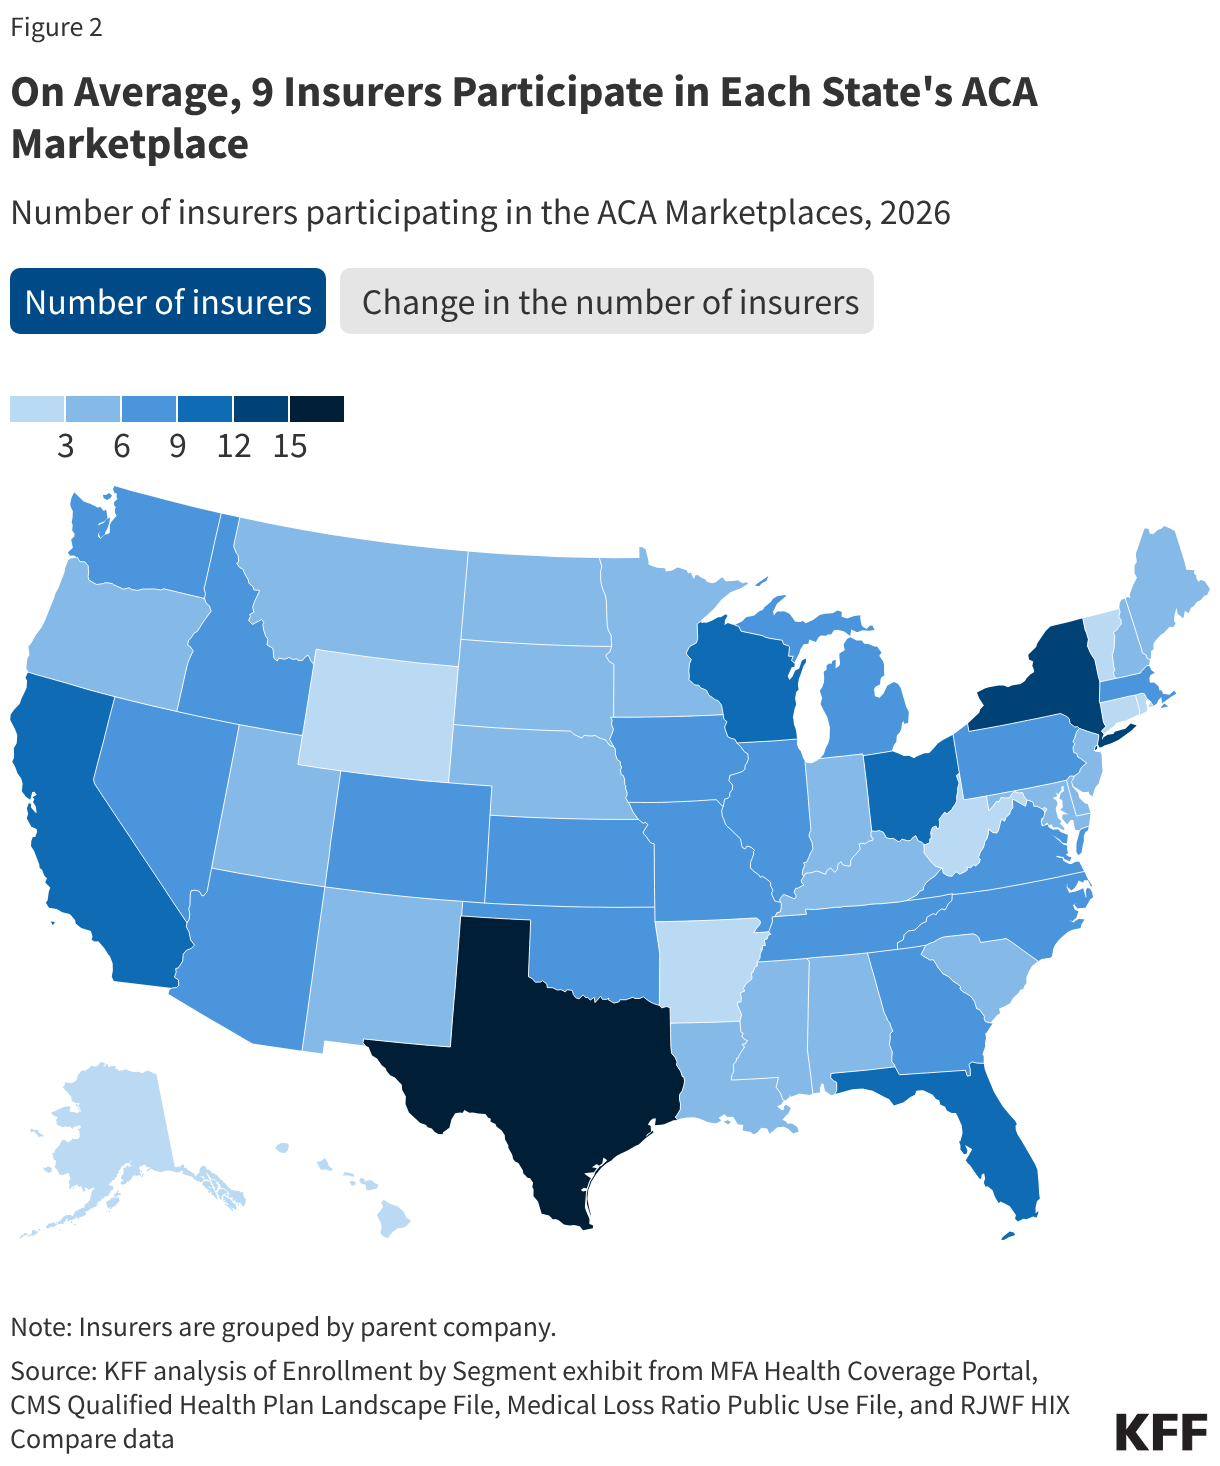
On Average, 9 Insurers Participate in Each State's ACA Marketplace (Choropleth map)

The five states with the most insurers offering plans in their ACA Marketplaces in 2026 are Texas (15), New York (12), California (11), Florida (11), and Wisconsin (11). Going into 2026, most states had the same number of issuers participating in their Marketplaces as in 2025.

In 19 states, the number of insurers offering ACA Marketplace plans in 2026 is lower than in 2025. Illinois and Michigan saw the greatest net decrease in the number of carriers, with three fewer insurers participating in their Marketplaces than in 2025. This decrease resulted from insurers exiting the Marketplace or being acquired by another insurer, reducing the overall number operating in a state. In Minnesota, Medica began administering UCare plans after the latter entered receivership.

Four states (Alabama, Iowa, Louisiana, and Washington) experienced a net increase of one insurer. For example, Oscar Health newly joined the Exchange in Alabama and Elevance Health (doing business as Wellpoint) began offering plans in Washington.

The most prominent insurer in the Marketplace is UnitedHealth, which offers Marketplace plans in 30 states. Some of the other major players currently in the Marketplace include Centene Corporation (29 states), Oscar Health (20 states), Elevance Health (18 states), Molina Healthcare (14 states), Cigna Health (11 states), and Kaiser (10 states). CVS, which ran Aetna plans in the ACA Marketplaces, was a significant insurer participating in the ACA Marketplaces in 2025. Before leaving the Marketplace for plan year 2026, CVS Aetna offered plans in 17 states.

Some of the aforementioned insurers are among those with the largest number of enrollees in the individual market (the vast majority of which was made up of people in the Marketplace in 2025). For example, in 2024, 18% of people in the individual market were enrolled in a plan offered by the Centene Corporation and 8% of individual market enrollees were in a plan offered by CVS.

County Level

Figure 3

Even if an insurer remains in a state, it may significantly change its footprint from year to year. Insurers adjust their footprints by expanding into some counties or withdrawing from others. For example, UnitedHealth scaled back its footprint in Kansas from 87% of counties in 2025 to 33% in 2026, and in South Carolina from 72% of counties in 2025 to 37% in 2026. However, it also expanded its service area in Oklahoma, offering plans in 74% of counties in 2026, up from 18% in 2025. Another major player in the ACA Marketplaces, Centene Corporation, went from offering plans in all counties in North Carolina in 2025 to 63% of counties in 2026. This decrease is driven by the exit of WellCare (a subsidiary of Centene) from the North Carolina Marketplace starting in 2026. In Iowa, Centene’s footprint increased from 33% to 59% of its counties going from 2025 to 2026.

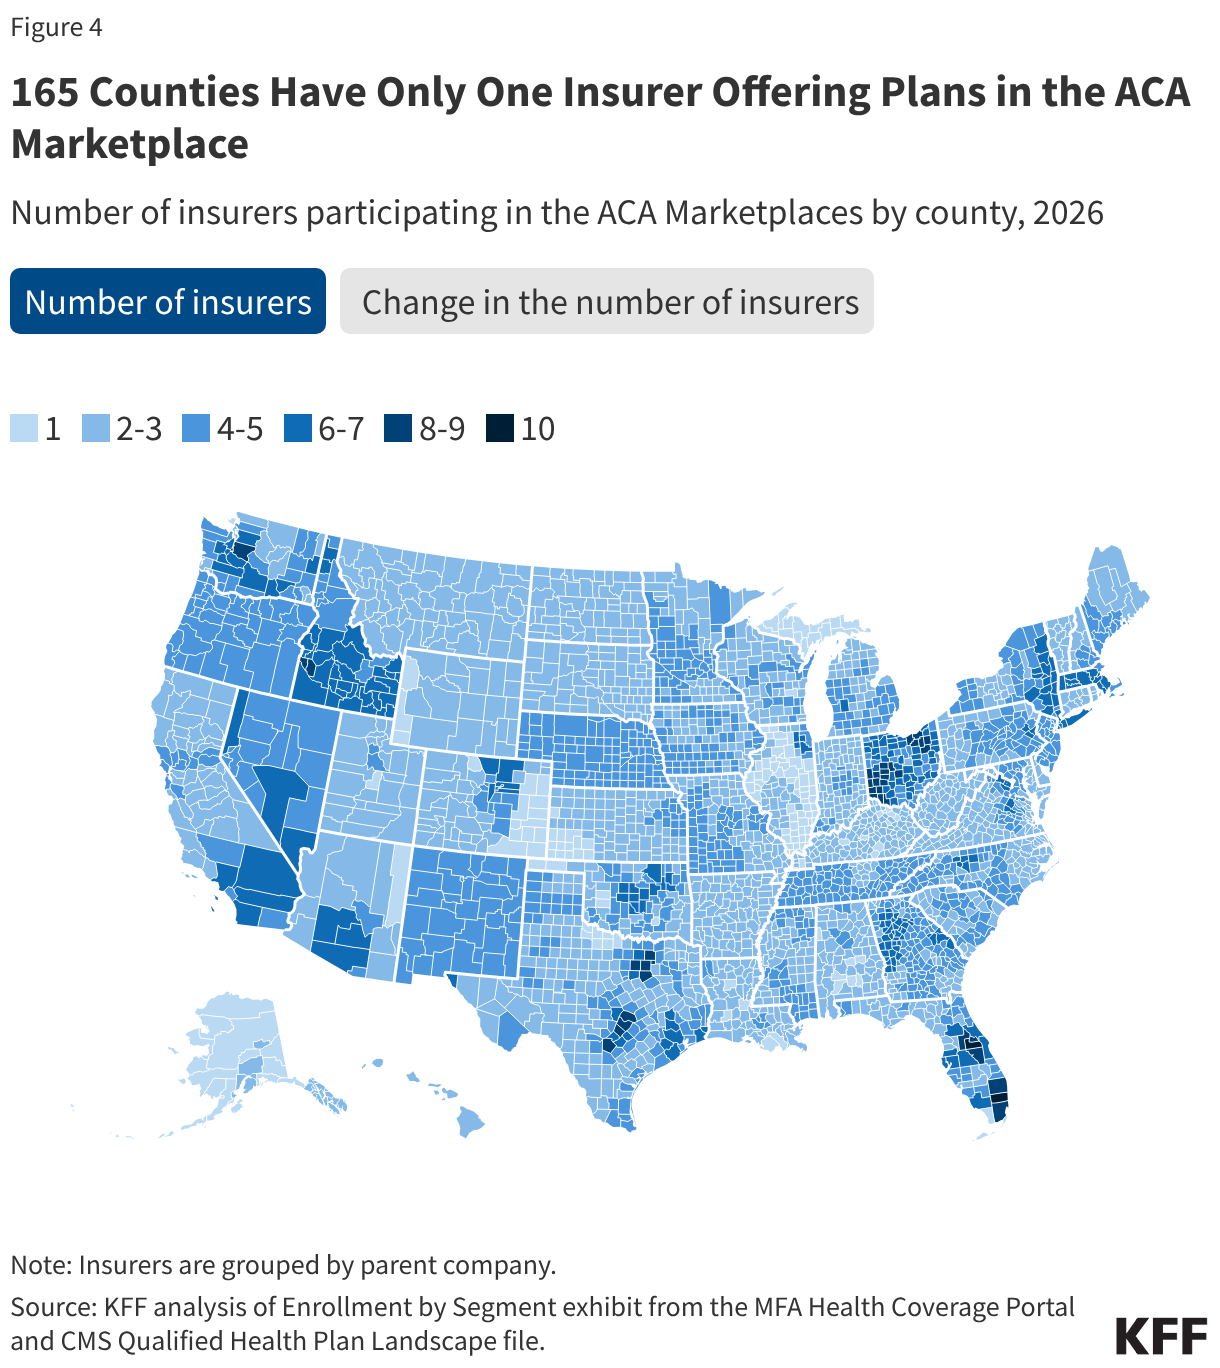
165 Counties Have Only One Insurer Offering Plans in the ACA Marketplace (Choropleth map)

In 2026, 1 in 3 counties saw a decrease in the number of insurers participating in the Marketplaces. The counties that experienced the greatest number of insurers leaving were in Wisconsin, which saw two insurers (Chorus Community Health Plan and Molina Healthcare) exiting the ACA Marketplace entirely as well as shrinking presence of others (namely, CareSource and University Health Care and Gundersen Lutheran). Some counties in North Carolina and Michigan also experienced significant declines in the number of participating insurers, with as many as three carriers leaving counties starting in 2026.

In total, 165 counties have only one insurer offering plans in the ACA Marketplaces in 2026. For 90 of these counties, this is a result of insurers not offering plans in that county anymore starting in 2026. For the remaining 75 one insurer counties, the number of carriers offering plans remains the same as in 2025.

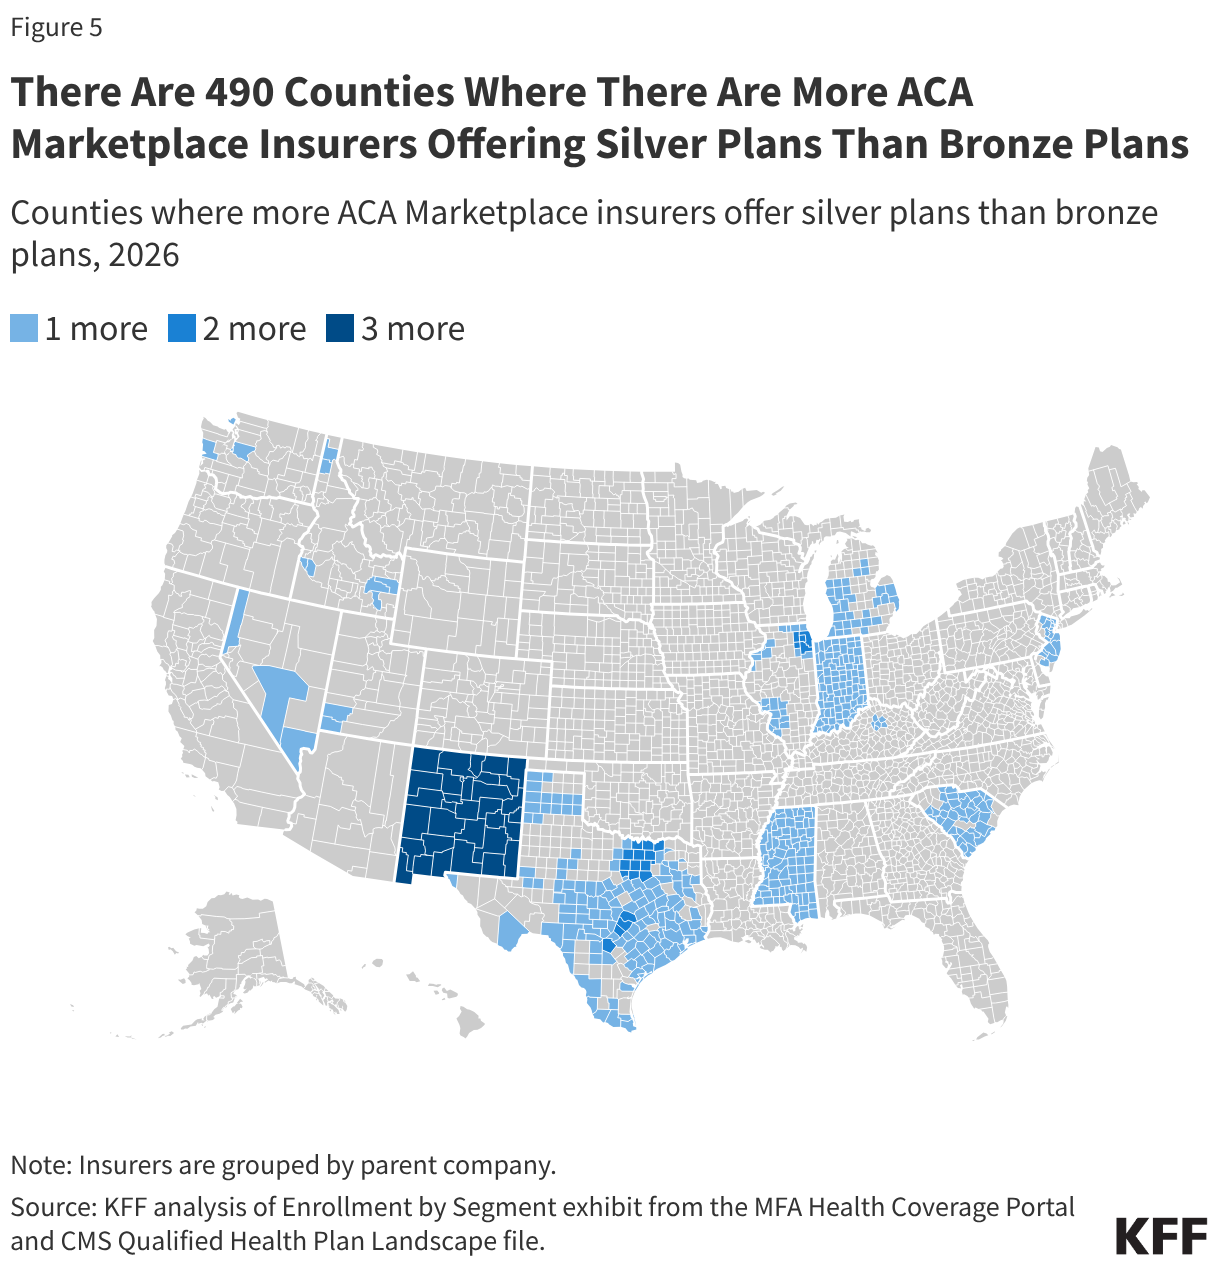
There Are 490 Counties Where There Are More ACA Marketplace Insurers Offering Silver Plans Than Bronze Plans (Choropleth map)

Issuers do not always offer bronze plans. By law, every ACA Marketplace insurer must offer at least one silver and gold plan wherever they sell coverage. In 2026, there were 490 counties (predominantly located in New Mexico, Indiana, Mississippi, New Jersey, Texas, and South Carolina) where some participating insurers decided not to offer bronze plans. In these places, the selection of plans for consumers who wish to decrease their premium payments by buying a lower coverage metal level may be reduced. However, for 433 of these 490 counties, at least two insurers offer bronze plans.

Methods

The Qualified Health Plan Individual Medical Landscape File and Robert Wood Johnson Foundation (RWJF) HIX Compare file were used to determine the number of insurers participating in states using the federal platform and state-based Exchanges, respectively. HIOS IDs from these files were mapped to the 2024 MR Submission Template Header to determine the NAIC Code for each insurer, which was then joined with 2025 data from Mark Farrah Associates’ Enrollment by Segment Exhibit (downloaded December 9, 2025) to identify the parent company associated with each insurer. In cases when a parent company is not successfully identified through the MR Submission Template Header and the Enrollment by Segment Exhibit, additional work was done to identify and manually assign either the NAIC code or parent company name for each plan.  Insurer in this analysis refers to parent company, irrespective of the name under which it does business across states.

The following manual additions/changes were also made:

  • Data for New York was adjusted to include Anthem Blue Cross and Blue Shield HP, Anthem Blue Cross HP, and Independent Health.
  • Bronze plans identified to be in San Juan County, Washington after combining the RWJF datasets together were removed.
  • The parent company for UCare Plans in Minnesota in 2026 was changed to Medica to reflect Medica's acquisition of UCare's individual market contracts.

HIX Compare insurer plan availability is reported by rating area—which may contain multiple counties—in conjunction with insurer participation reported by county. County-level insurer counts of plans in state-based Marketplaces may consequently be overstated when the insurer does not offer a given plan in a county but offers other plans in the same county, notably for plans of a given metal level. Although plan availability can vary within a county (such as by ZIP code), a plan is considered as available if offered anywhere in the county.

Appendix

Appendix Figure 1

VOLUME 48

Rare or Unverified Outcomes Shape Vaccine Safety and Gender Care Debates


Highlights

Two recent federal actions, including a memo about alleged COVID-19 vaccine deaths and settlements creating a “detransition clinic,” show how official actions can present uncertain or uncommon outcomes as representative and lend credibility to narratives that go beyond what evidence supports.


Recent Developments

Official Actions Elevate Uncertain or Uncommon Outcomes in Debates Over Vaccine Safety and Gender-Affirming Care

Official actions can elevate unverified or uncommon outcomes in ways that shape public perceptions beyond what evidence suggests. Two developments show how such actions can lend weight to narratives not borne out by evidence, one by overstating a causal link not supported by data, and the other by creating an institution based on a premise research does not support.

FDA Analysis of Pediatric Deaths After COVID Vaccination Shows Weaker Link Than Officials Claimed

A small number of unverified reports became the basis for a claim of definitive, widespread harm when, last November, then-FDA vaccine chief Vinay Prasad told agency staff in an internal memo that at least 10 children had died “after and because of” receiving a COVID-19 vaccine, using that claim to argue for changes to vaccine approval and oversight.

The underlying analysis made public last month, however, found no deaths definitively linked to COVID-19 vaccination. The FDA reviewed 96 reports of child deaths submitted to the Vaccine Adverse Event Reporting System (VAERS) through August 2025. Using WHO criteria and reviews of medical records and death certificates, officials concluded that none were “certain” to be linked to vaccination. Five were classified as “possible” and two as “probable,” but the report notes alternative explanations could not be ruled out. Most cases involved myocarditis, a rare heart inflammation that can also be caused by common infections, including COVID-19 itself.

The original memo presented preliminary findings with a certainty the underlying data did not support and did not reflect the limitations of VAERS, which is not intended to establish causality. The communication of vaccine safety information may be especially consequential at a time when confidence in COVID-19 vaccine safety remains lower than confidence in other childhood vaccines: KFF’s January Tracking Poll on Health Information and Trust found that eight in ten (81%) adults expressed confidence in the safety of MMR vaccines for children, compared to fewer than half (48%) who said the same about COVID-19 vaccines, though views of the COVID-19 vaccines are largely partisan.

Settlements Create “Detransition Clinic” Amid Narratives That Overstate Transition Regret

New efforts related to gender-affirming care for minors have presented cases of “detransition” or transition regret as representative of broader outcomes or a pattern of harm, though research finds both to be uncommon outcomes. Claims about “irreversible harm” often rely on inflated statistics, anecdotal stories, or misleading characterizations of surgeries for minors, which are rare and generally not recommended for younger adolescents. While some transgender people do choose to detransition, specialized clinics are not required to support this care.

Legal settlements reached last month between Texas Children’s Hospital, the Texas attorney general, and the U.S. Department of Justice may implicitly reinforce those narratives by creating what state officials called the country’s first “detransition clinic,” a facility for patients who want to stop or reverse a gender transition. The creation of such a clinic contrasts with research about gender-affirming care in practice. Many youth transition by making easily reversible social changes, like changes in clothing, names, or pronouns. Among transgender people who pursue medical transition, detransition is uncommon and transition regret rates are low. Many who do detransition cite pressure and discrimination rather than regret or a change in gender identity. Major medical associations continue to support gender-affirming care for minors when delivered carefully and with clinical oversight.

By creating a dedicated clinic, the settlements may reinforce narratives that frame regret and detransition as common outcomes. Additionally, DOJ’s involvement adds to the pressure providers have experienced in the face of a range of administration actions aimed at limiting this care, with effects potentially extending beyond Texas. At least 40 health care institutions have walked back such services since January 2025, generally citing external pressure rather than concerns about safety or effectiveness.

Why It Matters: When unrepresentative or unconfirmed cases are presented through official channels as representative of broader patterns of harm, they can appear to carry a credibility that the underlying evidence does not support.


What We’re Watching

Public Health Officials Are Tailoring Measles Vaccination Communication Strategies to Local Contexts Amid Declining Institutional Trust

As the ongoing measles outbreak surpasses 2,030 confirmed cases nationwide this year as of June 4, state health officials are adapting their communication strategies in response to declining trust in public health institutions and vaccines. In Utah, which has seen more than 600 cases since the outbreak began, officials have pursued a strategy of what they call “coordinated autonomy.” State health officials say they are coordinating with local health departments and trusted community figures like religious leaders to carry vaccine messaging, while deliberately avoiding a standardized state-wide response. This decentralized approach that relies on localized decision-making and voluntary behavior was shaped by post-COVID-19 pandemic distrust. According to reporting, Utah officials anticipate that a more coordinated response could backfire in communities where trust in government public health authorities has eroded. In practice, this has meant local health departments tailoring their own outreach. In southwest Utah, for example, officials have used weekly radio spots, press releases, and direct outreach to religious leaders, and focused messaging on asking residents who suspected they had measles to call before visiting a clinic.

Some other states with recent outbreaks, including South Carolina, rolled out a more state-wide, top-down public health response. Top-down approaches typically involve large-scale coordinated campaigns, and in South Carolina, this included mobile clinics, quarantine of unvaccinated individuals exposed to the virus, and structured briefings, alongside community outreach. These measures, while still more targeted than a broad COVID-style response, relied more on statewide coordination and a centralized approach. Cases in Utah have declined and South Carolina’s outbreak has been declared over, but whether and how much the different strategies contributed to those trends is difficult to assess.

The difference in approach represents a broader challenge in public health and vaccine communication that the current low-trust environment has made more difficult to navigate. Community-based approaches, particularly those relying on trusted local messengers, have shown effectiveness at building vaccine confidence in previous outbreaks, especially when messengers adapt to specific community concerns. Top-down approaches have also shown effectiveness at the population level. Research shows these approaches are particularly effective when barriers to vaccination are primarily about access or awareness and when existing infrastructure, like school vaccine requirements and established provider-patient relationships, provides a foundation for outreach. They may be less effective, though, in reaching strongly hesitant or polarized populations. Evidence on what strategies are most effective in the current low-trust environment remains limited.

Why It Matters: As research evolves, the strategies that work in one community may not work in another, and understanding what drives those differences is increasingly relevant to how outbreaks are managed.

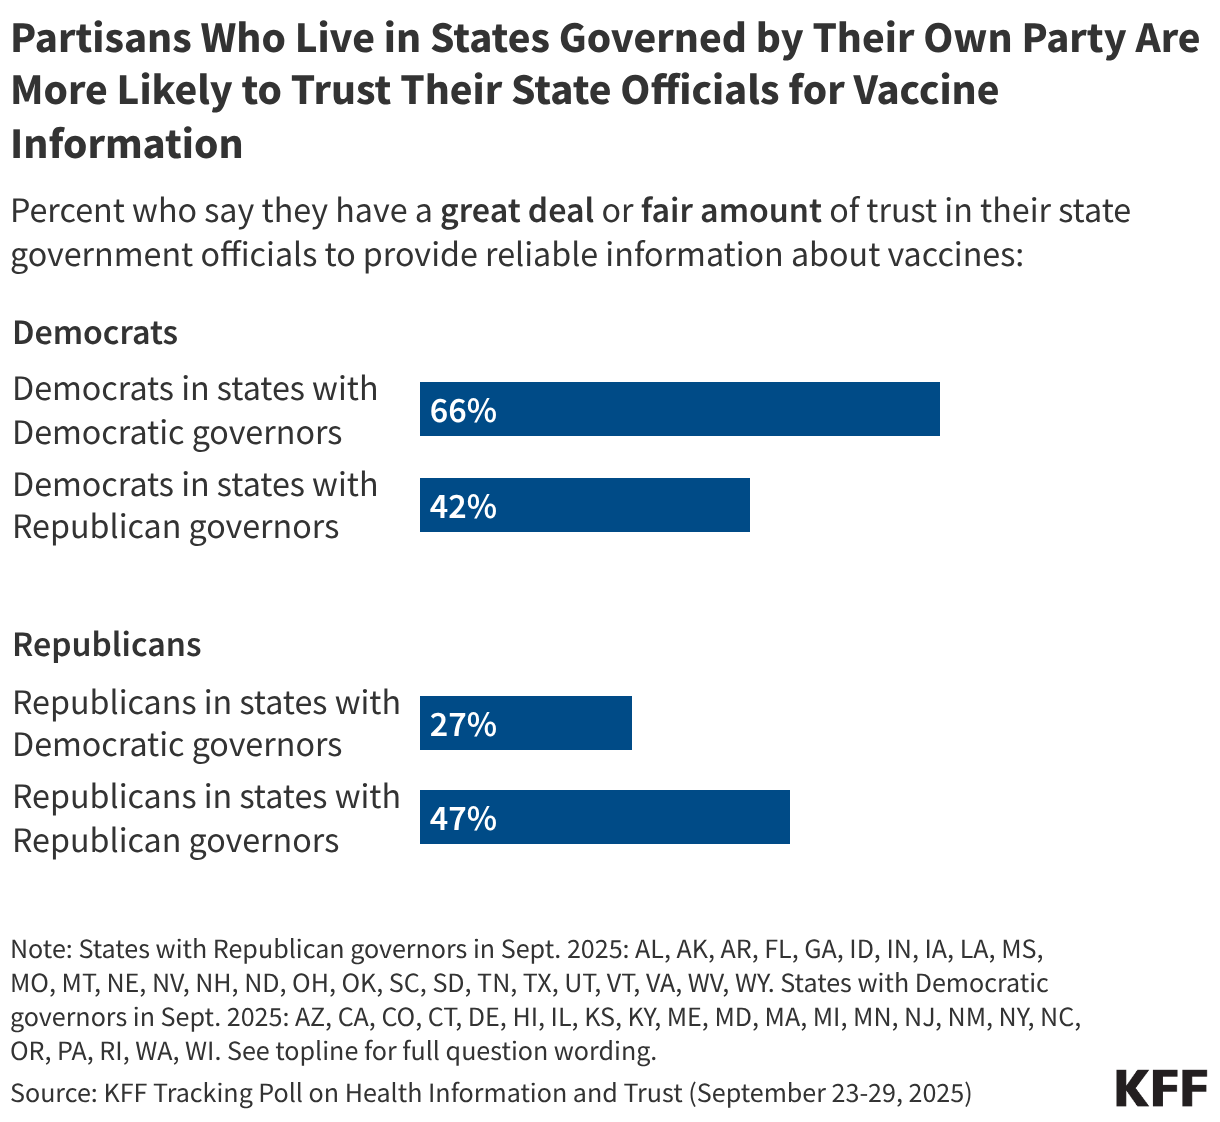
Polling Insights: KFF polling has found that public trust in both federal health agencies and state government officials to provide reliable vaccine information has declined since the beginning of the COVID-19 pandemic. Prior KFF polling has also found that trust in state officials for vaccine information varies depending on whether people share the same political party as their state leadership. Democrats living in states with Democratic governors were more likely than Democrats in Republican-governed states to express trust in their state officials for vaccine information (66% v. 42%), as were Republicans living in states with Republican governors compared to Republicans in Democratic-governed states (47% v. 27%). This interplay of partisanship and trust may further impact how the public responds to public health communication strategies on the state and local level.

Split bar chart showing trust in state officials to provide reliable information about vaccines among Democrats and Republicans.

Knowledge Gaps About STIs and STI Prevention Persist

More than 2.2 million cases of chlamydia, gonorrhea, and syphilis were reported nationwide in 2024, 13% higher than a decade ago. Accurate understanding of how sexually transmitted infections (STIs) spread and which can be prevented may help address these rates, but a poll from the Annenberg Public Policy Center shows persistent gaps in knowledge and some enduring misconceptions about common STIs.

Most Americans understand the basics of how STIs spread, correctly identifying common transmission routes, though 1 in 5 (20%) incorrectly said sitting on a toilet seat was a risk. Knowledge about which STIs can be prevented through vaccination was more uneven. Awareness was highest for human papillomavirus (HPV), with 68% correctly identifying that a vaccine exists, though 14% incorrectly said it would lead teenagers to engage in risky sexual behavior. Less than half (42%) were aware that mpox was vaccine-preventable, and for infections with no available vaccine, like HIV and genital herpes, at least half were unsure or incorrectly believed vaccines existed.

Why It Matters: These gaps in public knowledge may contribute to vaccination decisions, even for infections where vaccines are available and recommended. The KFF/The Washington Post Survey of Parents, for example, found that about one in five (19%) parents of children under age 9 (who are not yet eligible for the HPV vaccine) said they would “probably not” or “definitely not” vaccinate their child for HPV, and another one in five (22%) were not sure. In open-ended responses, some parents who said they would not vaccinate their child for HPV cited concerns that the vaccine is associated with unsafe sexual behavior, while others cited concerns over side effects and safety.


AI & Emerging Technology

Researchers Explore Whether AI Can Help Build Resistance to False Health Claims

As about one-third of adults now turn to AI chatbots and other AI tools for health information, researchers are examining both the risks AI poses for the information environment and ways it might be used to counter false health claims. One line of research draws on “cognitive inoculation,” exposing people to weakened forms of misleading claims before they encounter them. The approach can function similarly to a vaccine by helping build resilience to false claims.

A study published this spring tests whether AI can extend that approach through personalized conversation, which has historically been harder to deliver at scale. Researchers built a chatbot to guide users through structured conversations about health-related misconceptions, including about binge drinking and the link between physical activity and mental health. The chatbot presented itself as a believer of these misconceptions and guided users to find evidence refuting them. Researchers compared the chatbot against reading an educational essay and writing refutations of common misconceptions, finding that the chatbot outperformed both alternatives in helping participants maintain confidence in accurate beliefs after exposure to a false claim.

AI is often discussed as a vector for false health claims, but this study offers an early signal that it may also help counter them. The small sample size and narrow focus make the findings difficult to generalize, and more research is needed before drawing broader conclusions.

About The Health Information and Trust Initiative: the Health Information and Trust Initiative is a KFF program aimed at tracking health misinformation in the U.S., analyzing its impact on the American people, and mobilizing media to address the problem. Our goal is to be of service to everyone working on health misinformation, strengthen efforts to counter misinformation, and build trust. 


View all KFF Monitors

The Monitor is a report from KFF’s Health Information and Trust initiative that focuses on recent developments in health information. It’s free and published twice a month.

Sign up to receive KFF Monitor
email updates


Support for the Health Information and Trust initiative is provided by the Robert Wood Johnson Foundation (RWJF). The views expressed do not necessarily reflect the views of RWJF and KFF maintains full editorial control over all of its policy analysis, polling, and journalism activities. The data shared in the Monitor is sourced through media monitoring research conducted by KFF.

House Appropriations Committee Releases FY 2027 Labor, Health and Human Services, Education, and Related Agencies (Labor HHS) Appropriations Bill & Accompanying Report

Published: Jun 10, 2026

The House Appropriations Committee released its Fiscal Year 2027 Labor, Health and Human Services, Education, and Related Agencies (Labor HHS) appropriations bill on June 4, 2026 and accompanying explanatory report on June 8, 2026.

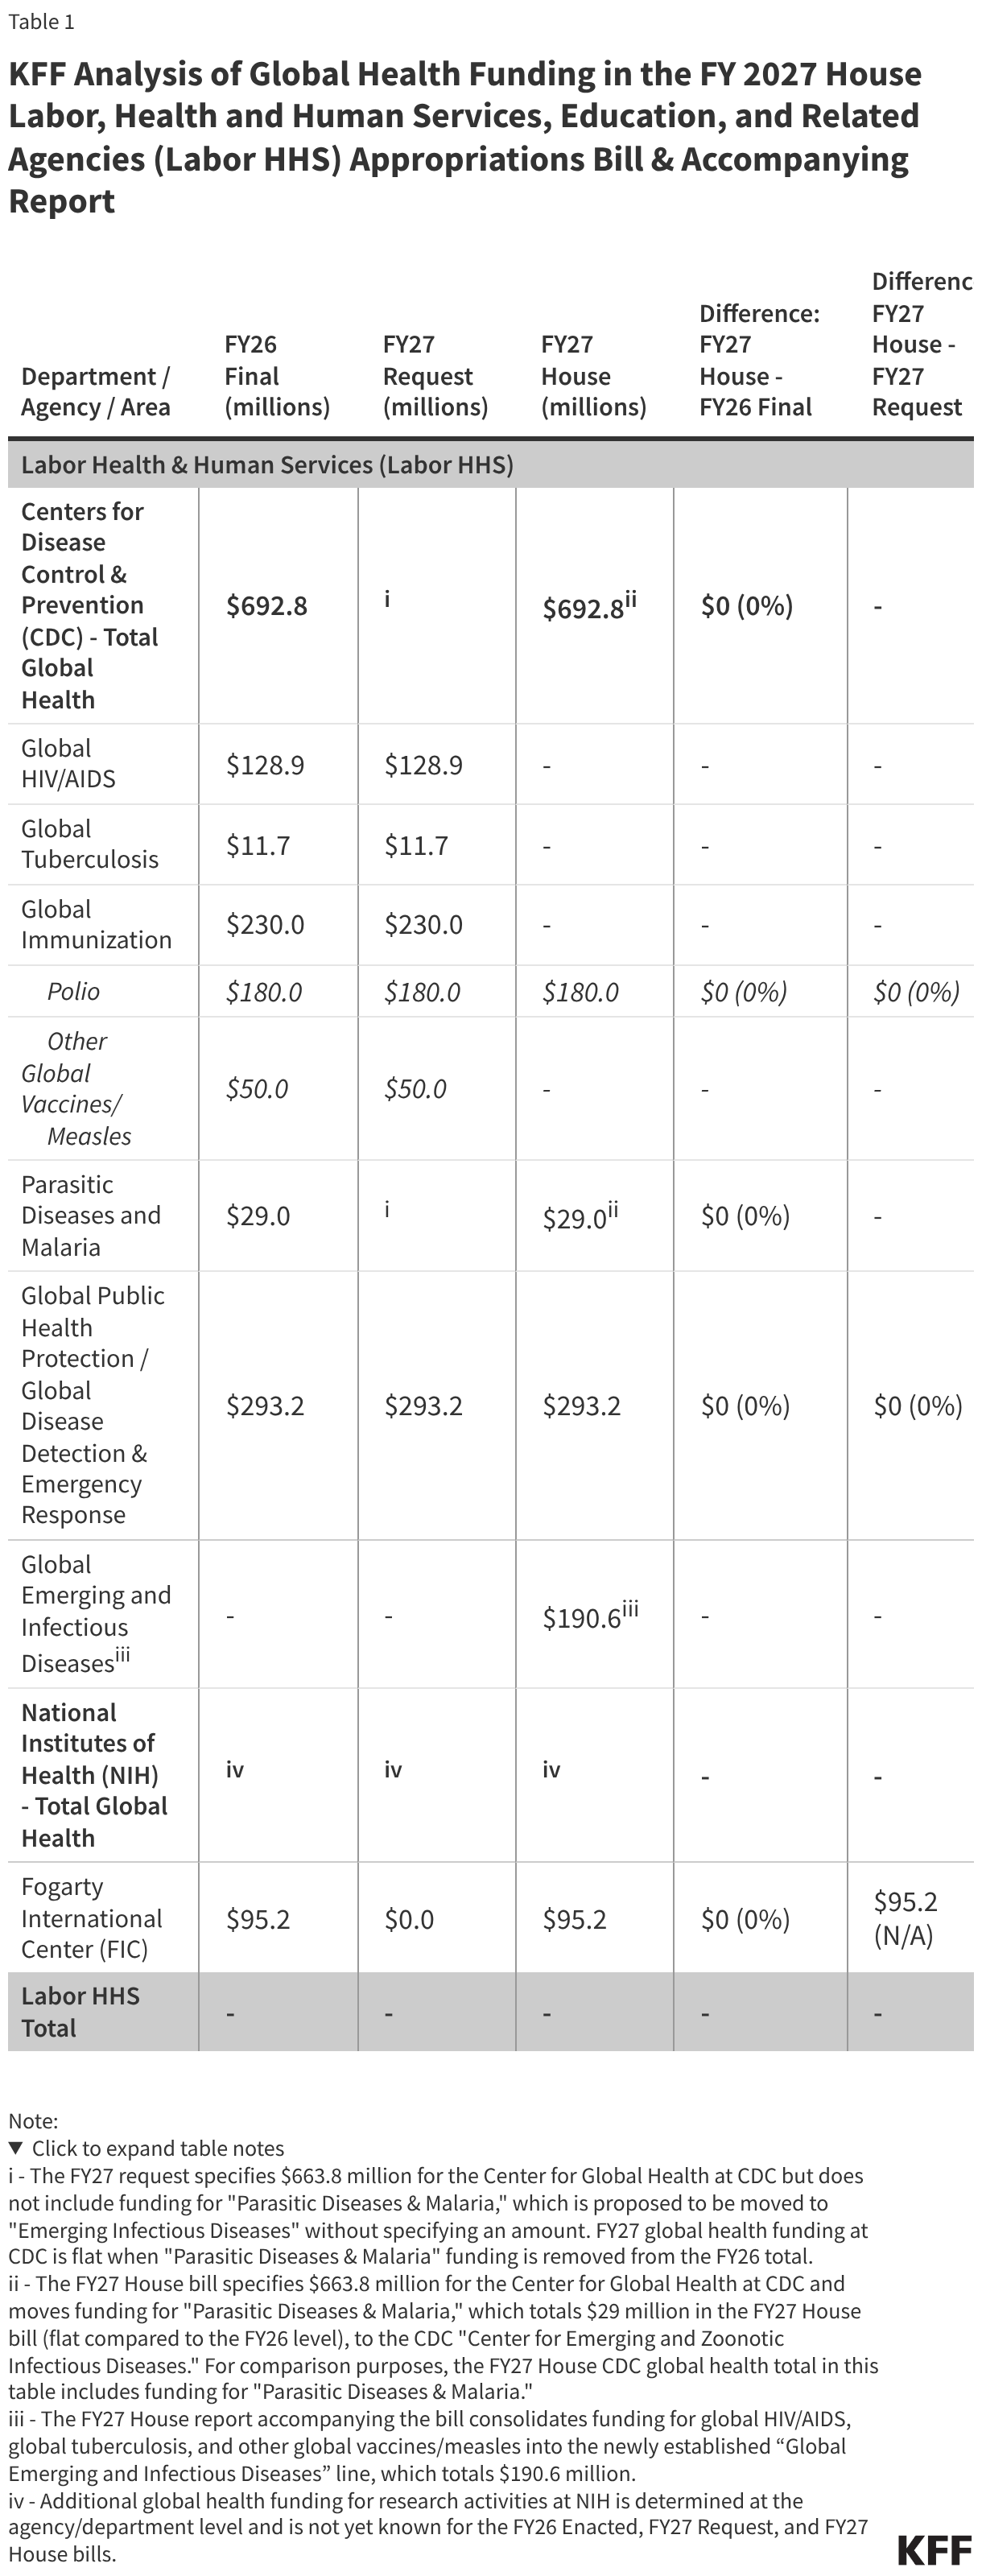
While most U.S. global health funding is provided to the State Department through a separate appropriations bill (see the KFF budget summary on this funding here), the Labor HHS appropriations bill includes funding for global health programs at the Centers for Disease Control and Prevention (CDC) as well as funding for global health research activities at the National Institutes of Health (NIH). Total global health funding at CDC and NIH through the Labor HHS bill is not yet known, as funding for some programs (i.e. global HIV/AIDS and malaria research) at NIH is determined at the agency level rather than specified by Congress in annual appropriations bills. Funding for global health in the Labor HHS bill remained flat compared to the FY 2026 level as follows:

  • CDC: Funding for global health programs at CDC totals $693 million, flat compared to the FY 2026 enacted level. This total includes funding provided for parasitic diseases and malaria, which the House bill moved to CDC’s Center for Emerging and Zoonotic Infectious Diseases but is included in the total here for comparison purposes. Within CDC, funding for polio and global public health protection were maintained at the FY 2026 level, and all other program areas (global HIV/AIDS, global tuberculosis, measles and other vaccine preventable diseases) were consolidated into the newly established “Global Emerging Infectious Diseases” line. The House report also directs “continued coordination with the State Department’s Bureau of Global Health Security and Diplomacy” on the implementation of the President’s Emergency Plan for AIDS Relief (PEPFAR) and other global health programs, “provides funding to be programmed by the CDC Director to sustain in-country health security capacities with international partners,” as well as “directs CDC to prioritize existing CDC international staffing, and to provide a briefing to the Committee not later than 90 days after enactment of this Act on the status of its engagement with the Department of State, the agency’s current global health workforce capacity, overseas staffing footprint, and plans to bolster core global health security and infectious disease response capabilities.”
  • NIH: Funding for global health research activities at the Fogarty International Center (FIC) at NIH totals $95 million, the same level as the FY 2026 enacted amount.

In addition, Section 235 under the Labor HHS section of the bill specifically states that funding “shall be for the budget activities, and in the amounts specified in the table under each such heading in the report accompanying this Act” instructing the administration to provide the amounts for the areas specified.

See the table below for additional details on global health funding. See other budget summaries and the KFF budget tracker for details on historical annual appropriations for global health programs.

KFF Analysis of Global Health Funding in the FY 2027 House Labor, Health and Human Services, Education, and Related Agencies (Labor HHS) Appropriations Bill & Accompanying Report (Table)

Analysis of U.S. and Global Fund Funding Reductions in MOU Countries

Published: Jun 10, 2026

Worsening fiscal constraints and changing policy priorities have resulted in significant funding cuts to global health and development programs. While these reductions predated the cuts and disruptions made by the U.S. government last year, they were exacerbated by U.S. actions. The Organisation for Economic Co-operation and Development (OECD) recently reported that international aid fell significantly in 2025, driven primarily by the U.S., and that further declines are likely on the horizon. The health sector has not been immune to these pressures. The U.S. government and the Global Fund to Fight AIDS, Tuberculosis and Malaria (Global Fund), the top two donors1 to global health in low- and middle-income countries, each took actions to reduce funding to countries starting last year and plan to further reduce funding going forward. Under the Trump administration, the U.S., as part of its new America First Global Health Strategy (AFGHS) “MOU” agreements with countries, plans to reduce funding by billions over the next few years. The Global Fund, due to reduced contributions from the U.S. and other donors, is also reducing funding in the same set of countries. Together, the U.S. and Global Fund reductions serve as a “one-two punch” to countries, who will be faced with significantly fewer resources in the coming years.

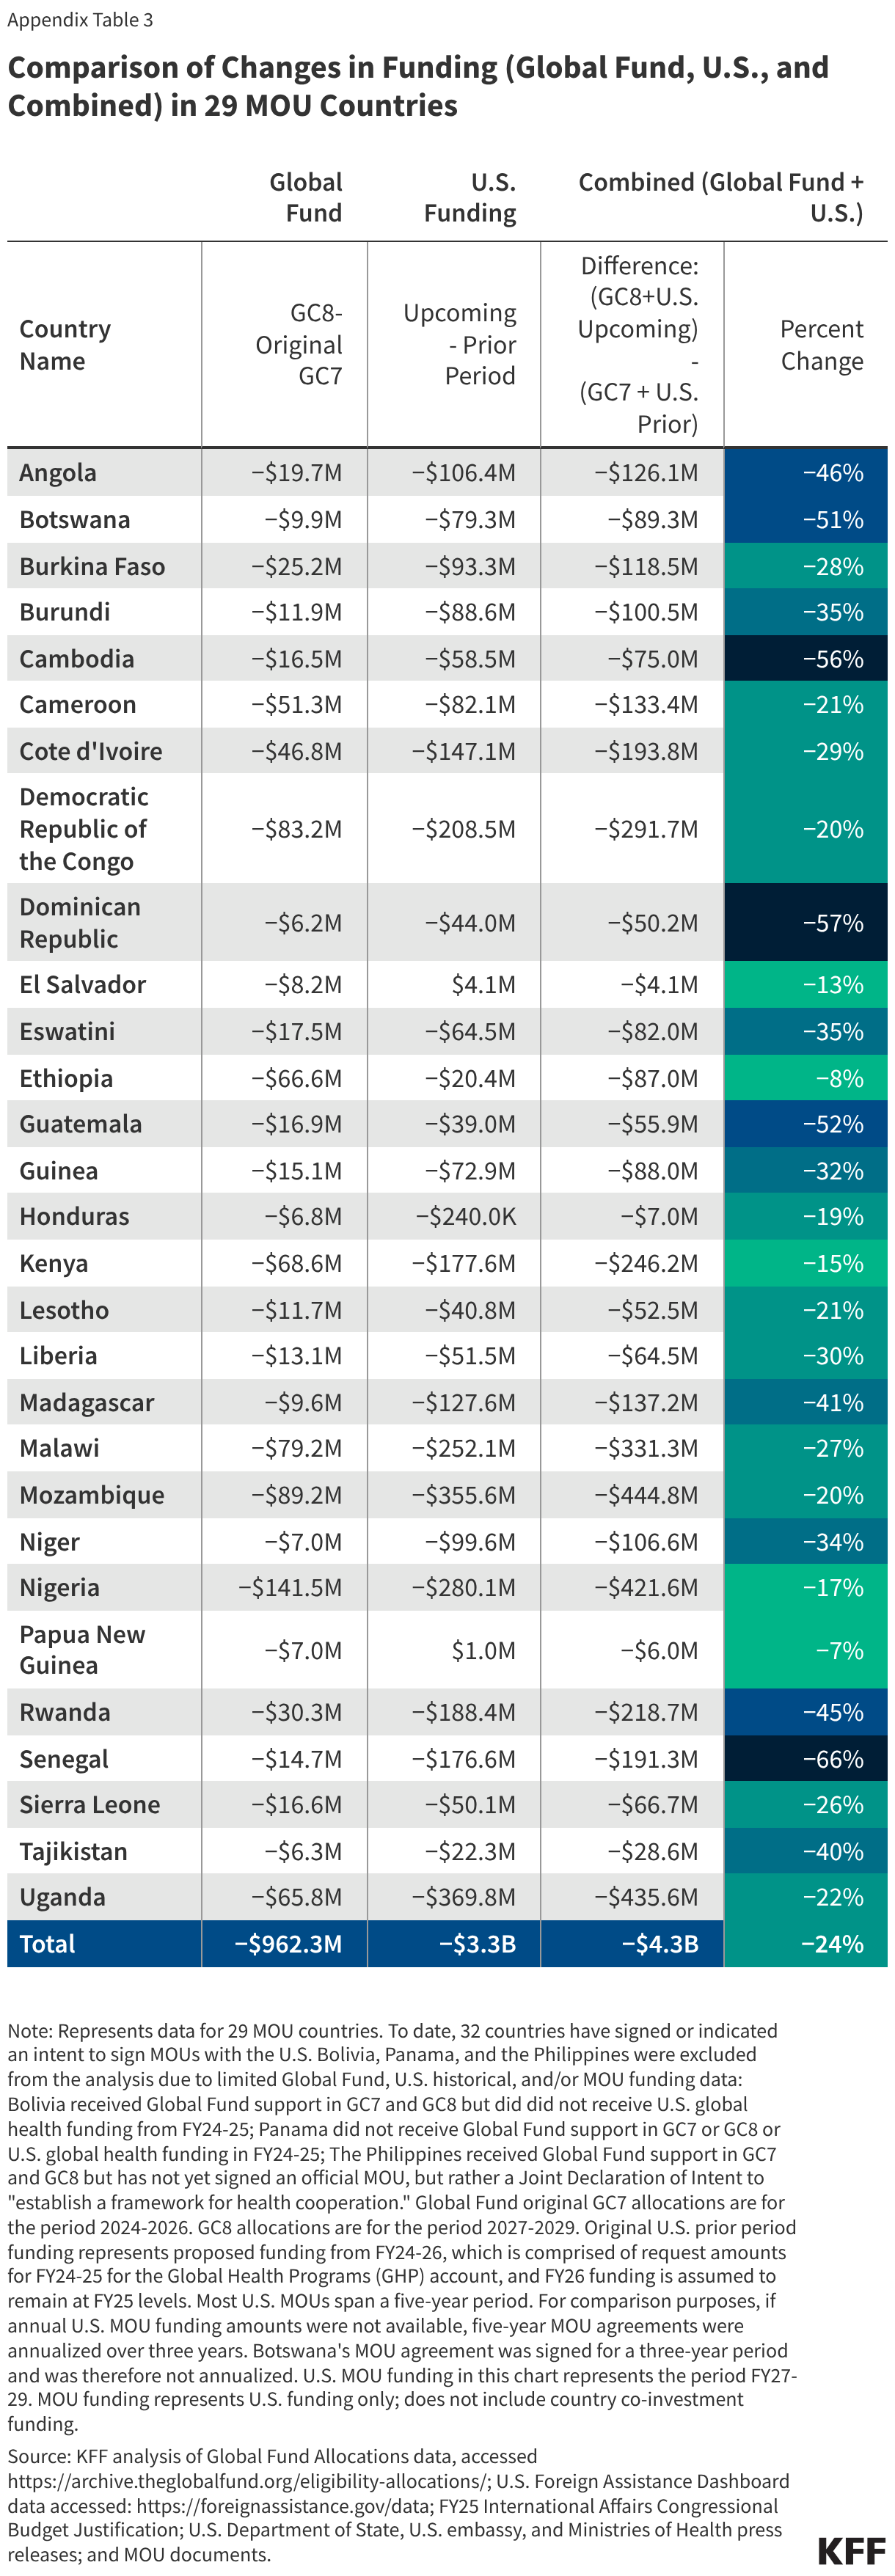
This analysis assesses the magnitude of these combined funding cuts in 29 U.S. MOU countries between 2026 and 2029, relative to prior funding levels (see methodology for more details). As it shows, the combined decline is estimated to total $4.3 billion– a 24% drop relative to prior funding levels — most of which (77%) is driven by the U.S.  The cumulative cut, taking into account unexpected reductions in 2026, was even larger, reaching $5.8 billion. Moreover, further declines are likely to occur after this period.2 Such funding declines are unprecedented in the modern-day era of global health, which saw the creation of the President’s Emergency Plan for AIDS Relief (PEPFAR), the U.S. government’s flagship global health program, and of the Global Fund in the early 2000s, both of which helped to usher in significant new resources for global health.

Findings

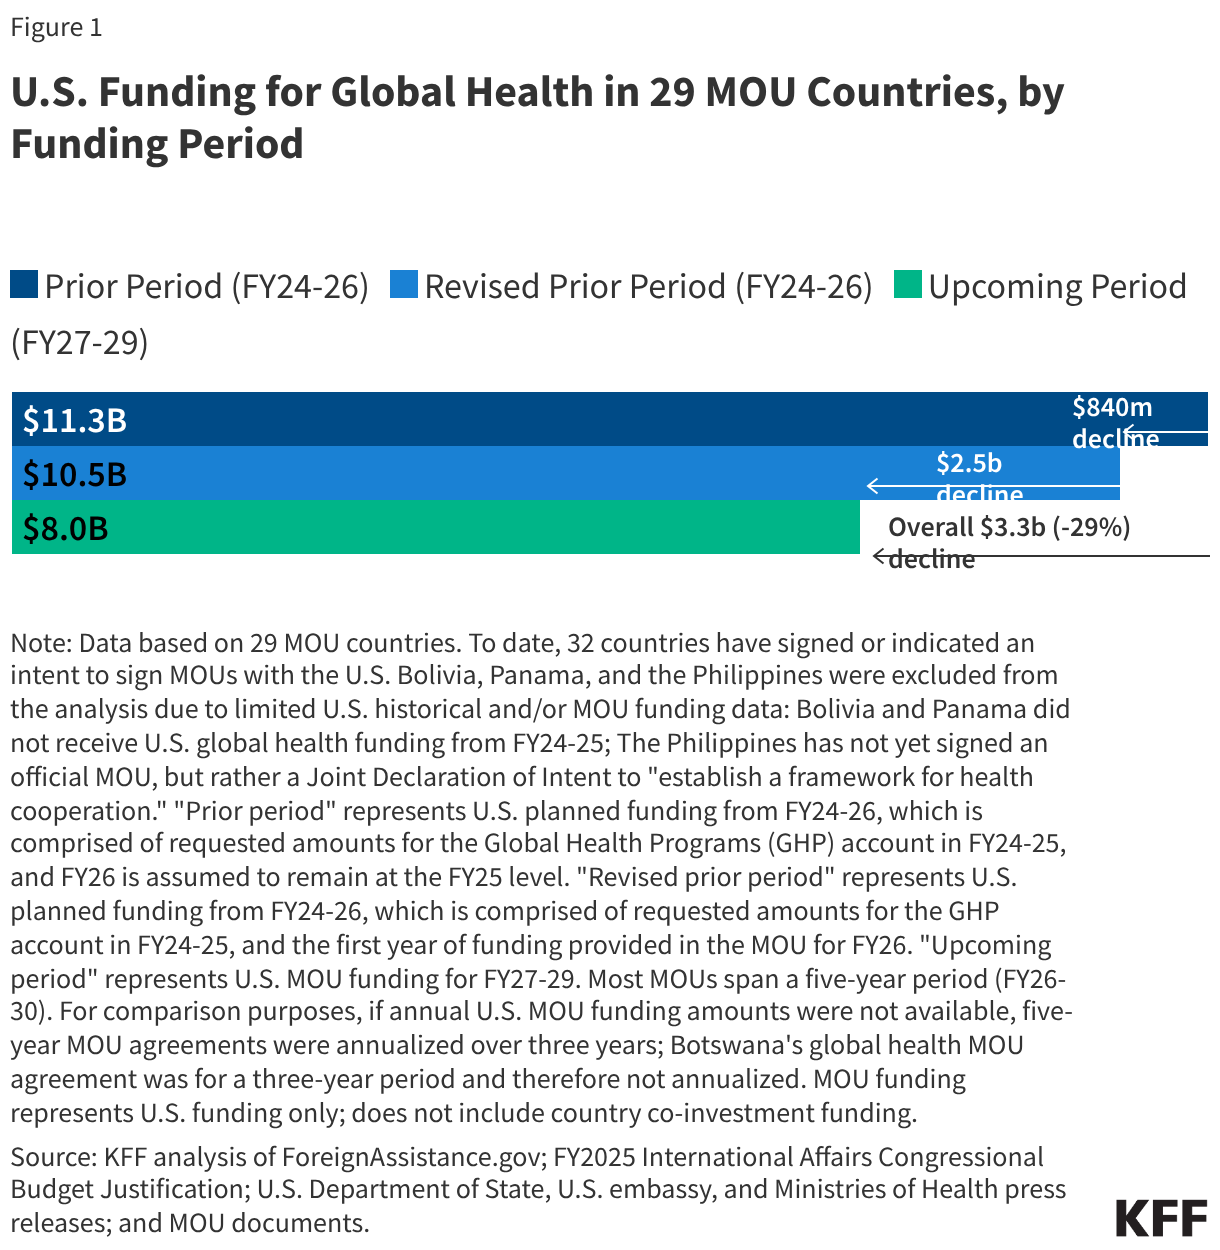
The U.S. government is planning steep funding cuts to countries for health programs. In the 29 MOU countries analyzed, these cuts are estimated to total $3.3 billion by 2029, a 29% drop relative to prior funding levels.

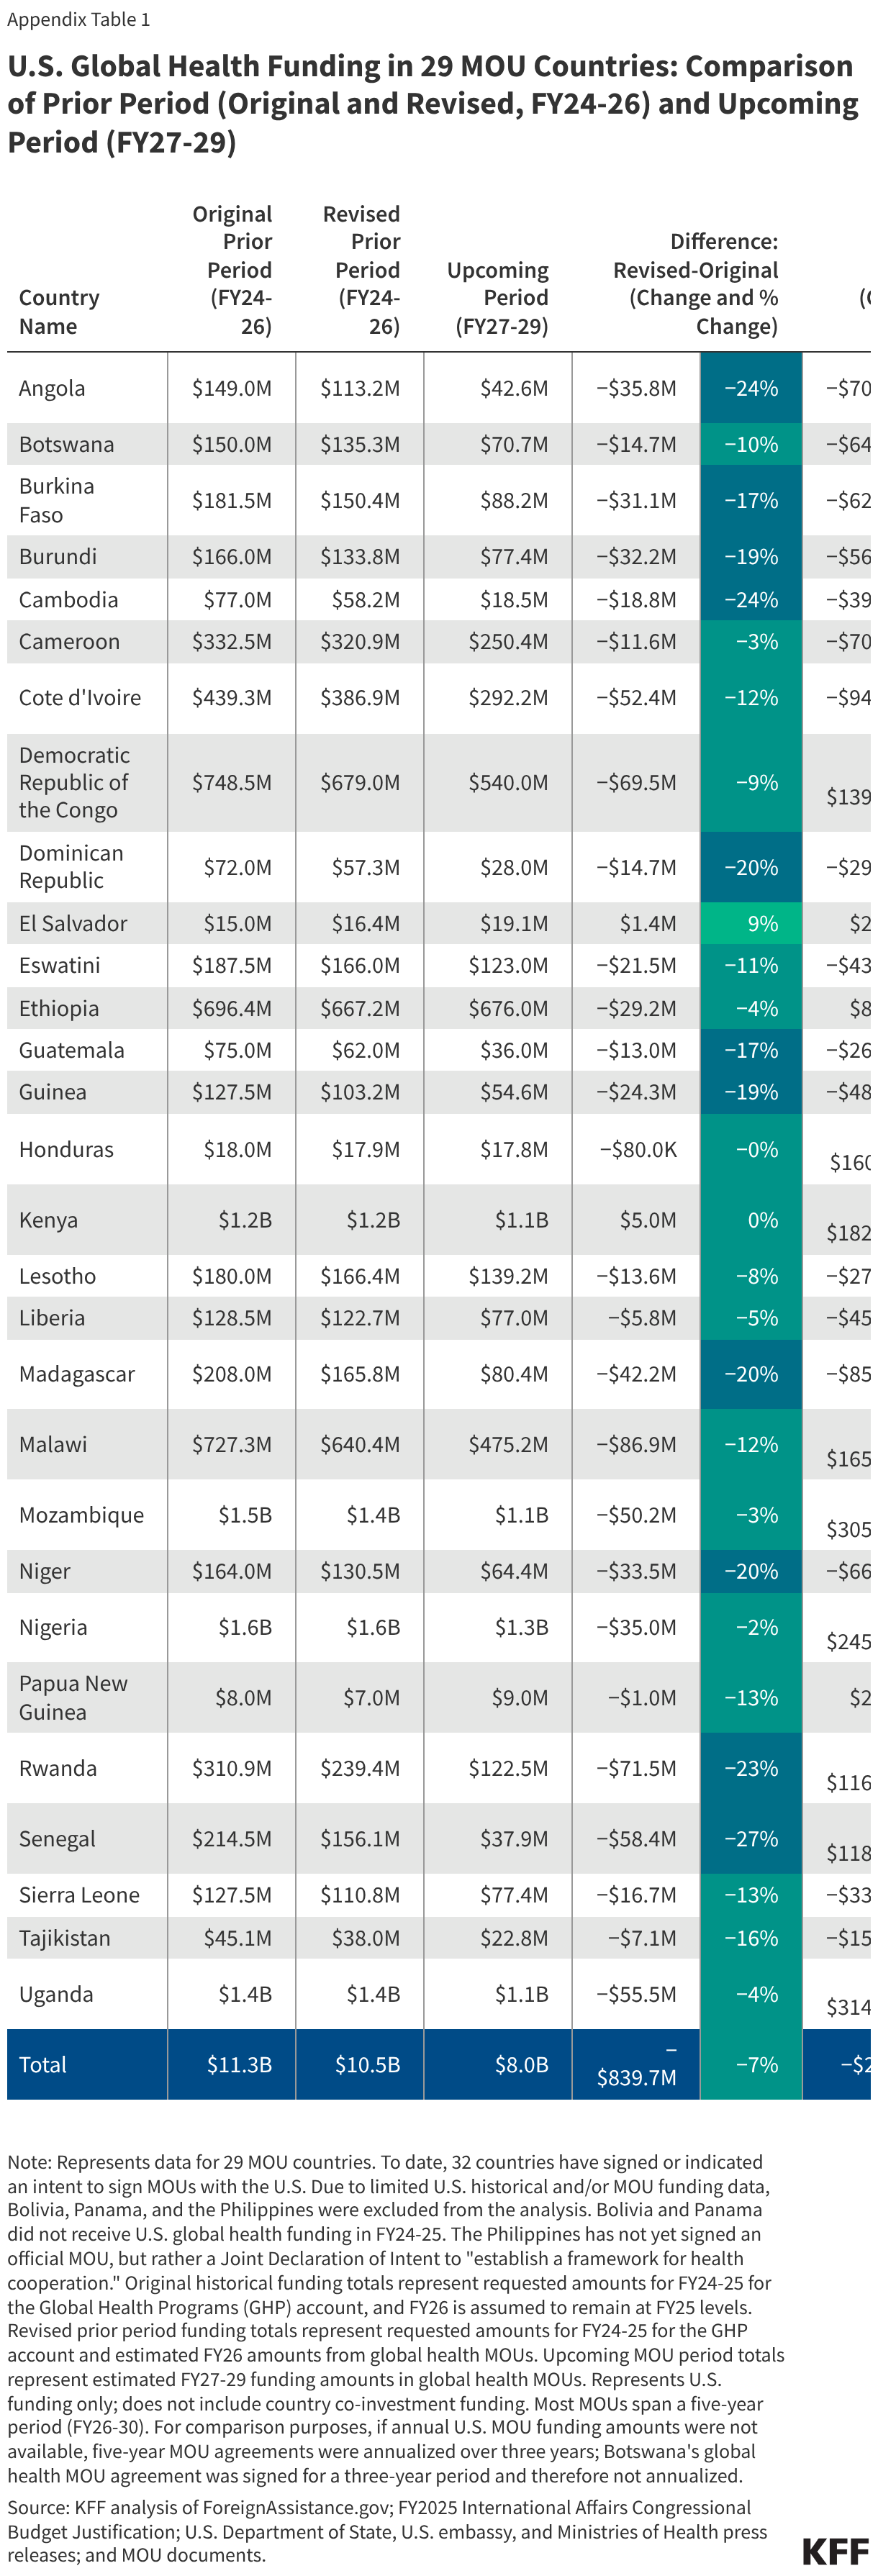
  • Overall, funding in these 29 countries is estimated to decline from $11.3 billion over the prior three-year period (2024-2026) to $8 billion for the next three-year period (2027-2029), a 29% decline. This decline reflects two factors: first, after several years of stable funding for countries, the administration announced significant reductions starting in 2026, relative to prior levels, estimated to be $840 million, or 7%; second, further reductions of $2.5 billion or 23% are planned for 2027-2029 (see Figure 1).
  • Almost all 29 countries will face funding reductions.3 The countries with the biggest reductions in dollar terms are Uganda ($370 million), Mozambique ($356 million), Nigeria ($280 million), and Malawi ($252 million). Reductions range from 1% in Honduras to 82% in Senegal, with 12 countries experiencing reductions of 50% or greater (see Appendix Table 1).
U.S. Funding for Global Health in 29 MOU Countries, by Funding Period (Grouped Bars)

In these same 29 countries, Global Fund support is expected to decline by almost $1 billion over the next three years, a 15% drop compared to the prior period.4

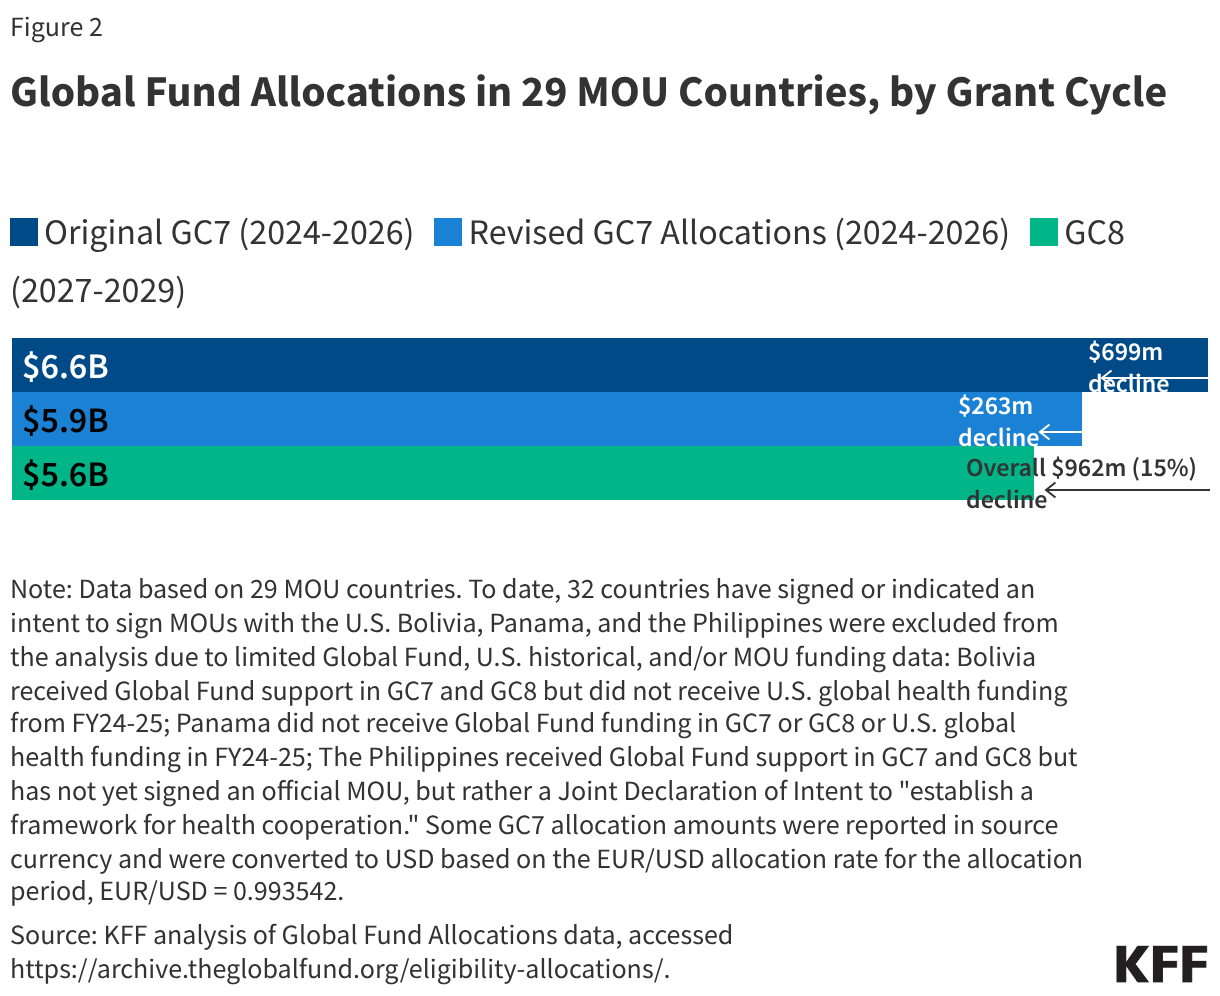
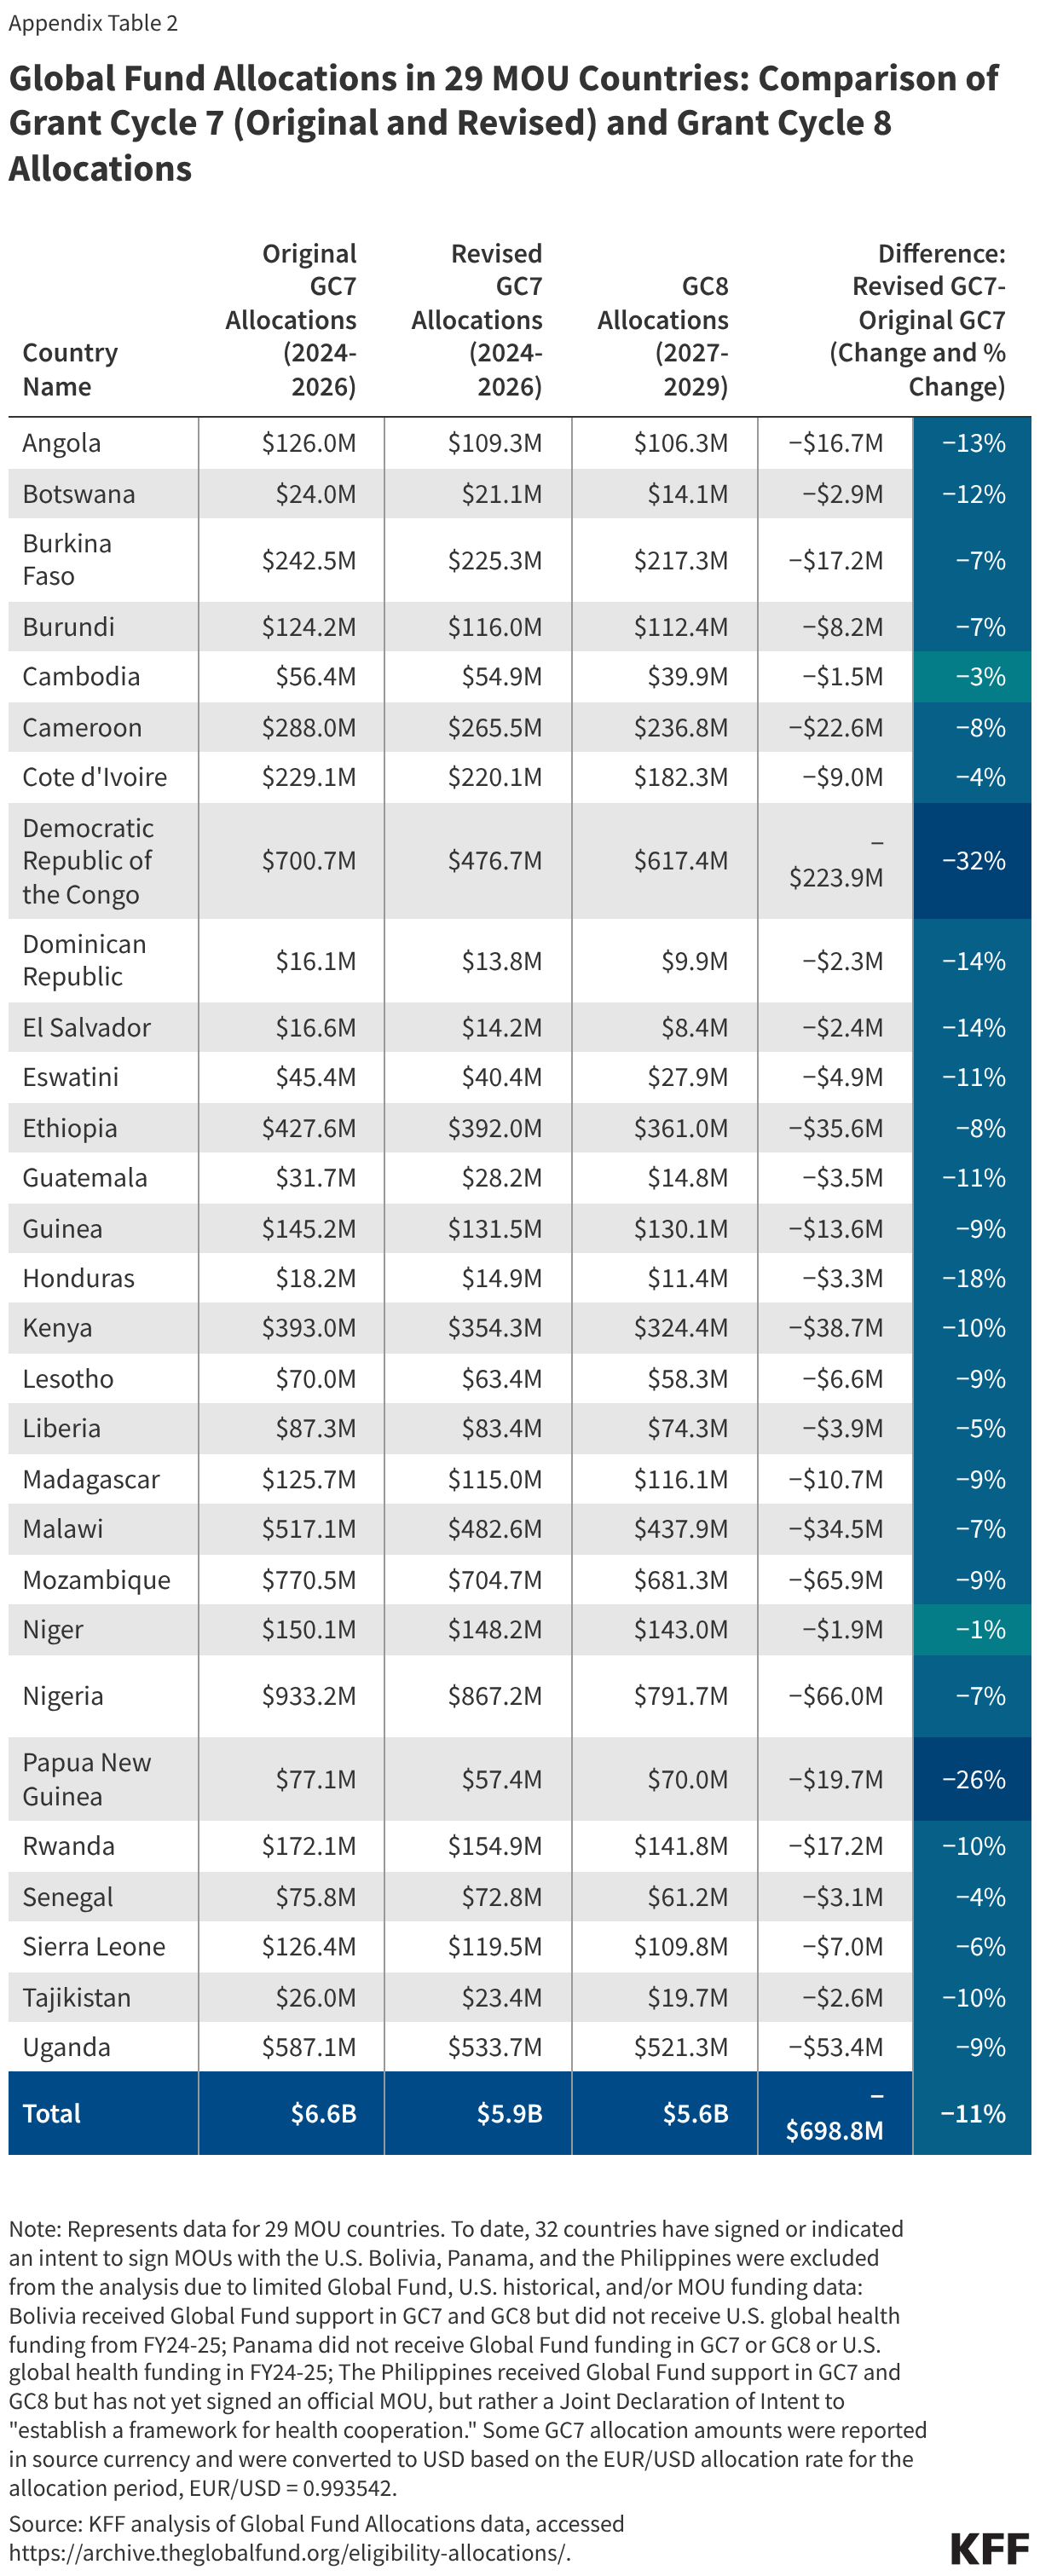
  • Global Fund support will decline from $6.6 billion in the 2024-2026 country allocation period (grant cycle 7, or GC7) to $5.6 billion in the 2027-2029 allocation period (grant cycle 8, or GC8), a decline of $962 million or 15%. This decline is the result of the following two factors: a reduction in the original funding allocated to countries for GC7, due to unexpected shortfalls in donor contributions to the Global Fund (a reduction of $699 million or 11% from the original to revised allocations), and further reductions planned for GC8 due to ongoing funding constraints (a reduction of $263 million or 4% from revised GC7 allocations to GC8 allocations) (see Figure 2).
  • All 29 MOU countries will face Global Fund reductions. The countries with the biggest dollar reductions in GC8 (compared to the original allocations for GC7) are Nigeria ($141 million), Mozambique ($89 million), and the Democratic Republic of the Congo ($83 million). Reductions range from 5% in Niger to 53% in Guatemala (see Appendix Table 2).
Global Fund Allocations in 29 MOU Countries, by Grant Cycle (Grouped Bars)

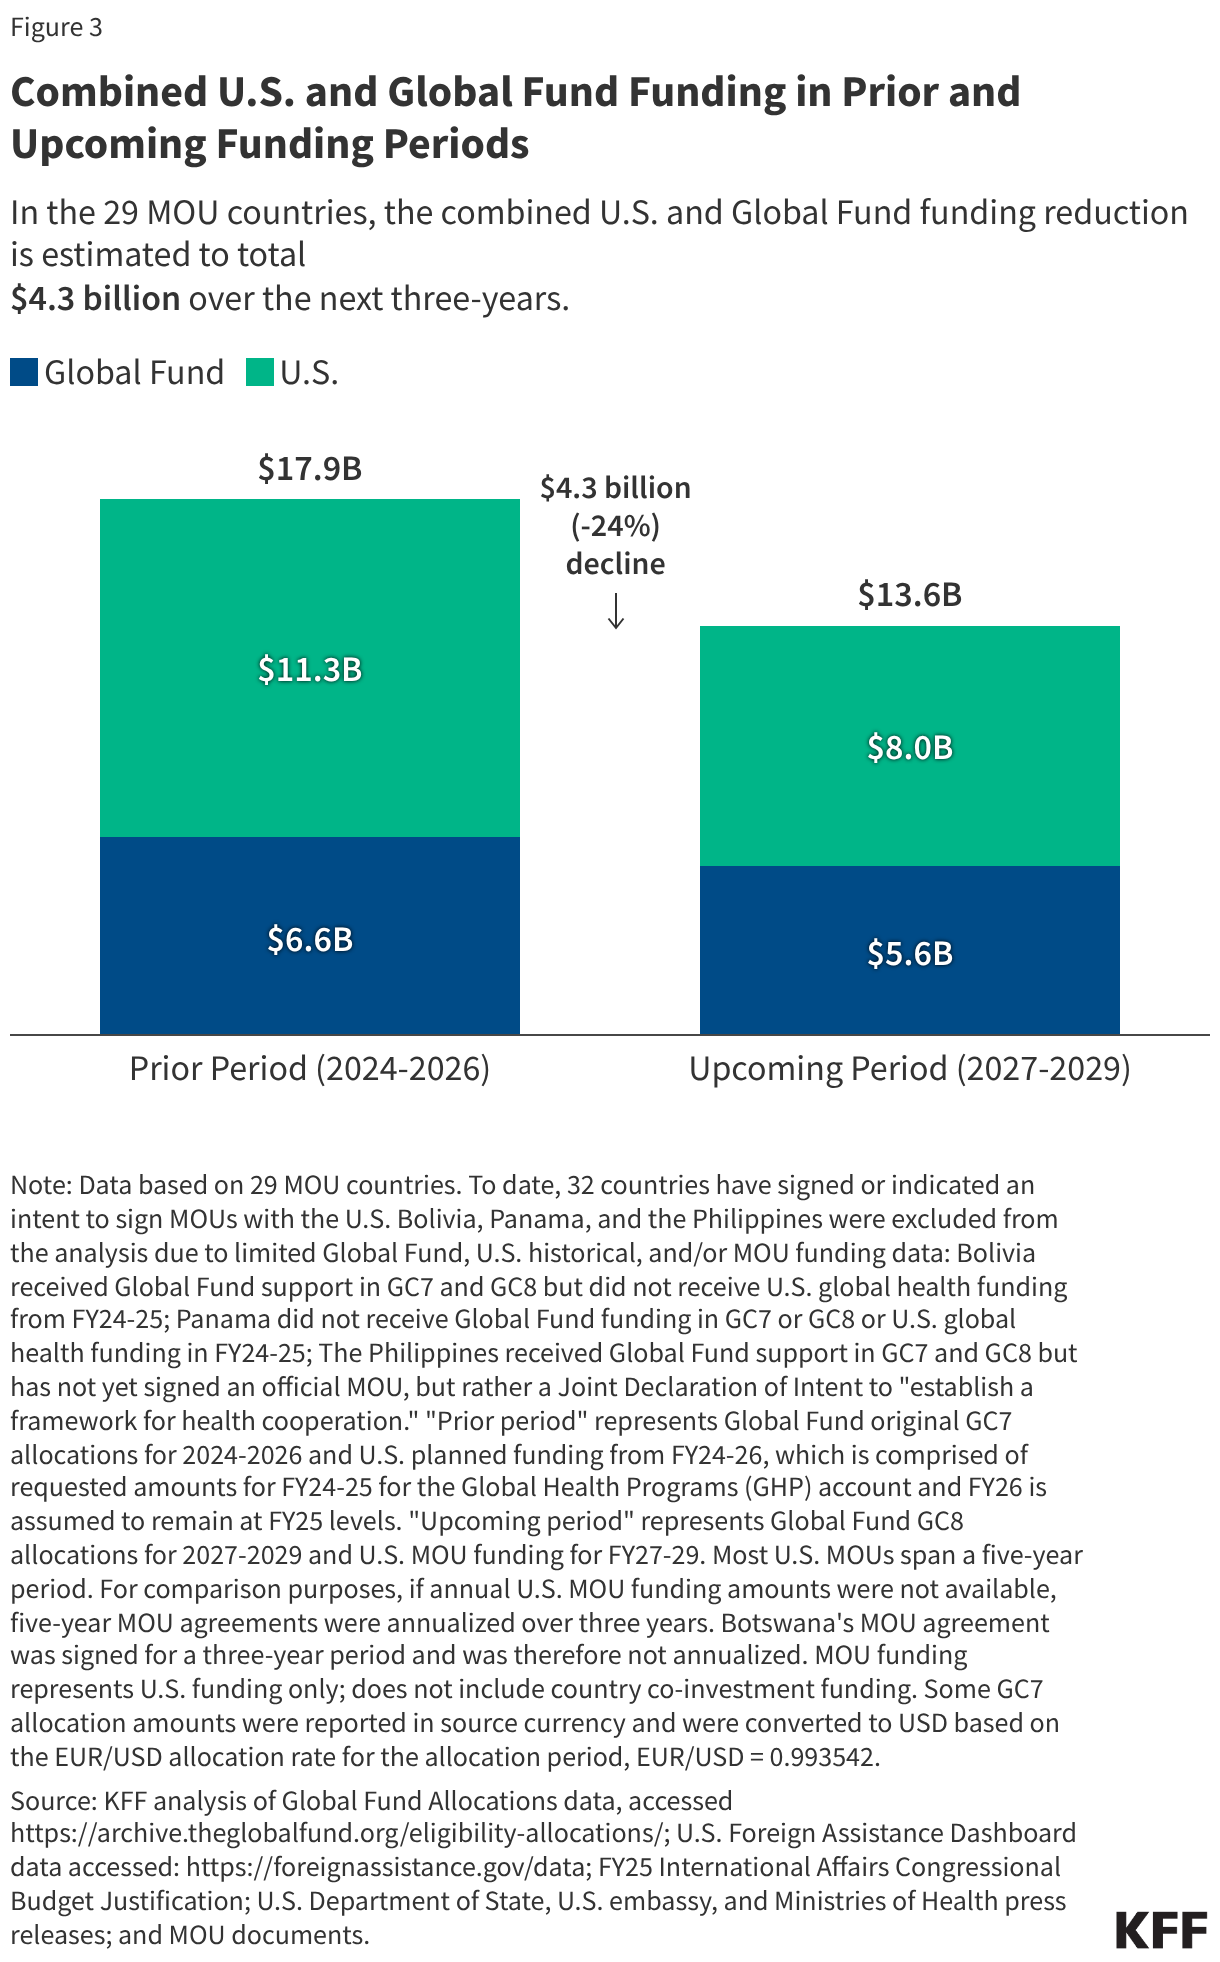
The combined funding reduction from the U.S. and the Global Fund in these 29 countries is estimated to total $4.3 billion through 2029, a 24% decline (see Figure 3). The U.S. accounts for more than three quarters (77%) of the drop.

  • About half (15) of the MOU countries will experience funding reductions of $100 million or more, with the largest reductions in Mozambique ($445 million), Uganda ($436 million), Nigeria ($422 million), and Malawi ($331 million). Reductions range from 7% in Papua New Guinea to 66% in Senegal (see Appendix Table 3). The cumulative cut, taking into account unexpected reductions in 2026, was even larger, reaching $5.8 billion.
  • In addition to these funding reductions, these countries also face co-financing requirements from both the U.S. and the Global Fund  – with the U.S. requirement occurring for the first time – which could, in some cases, intensify the fiscal impact on recipient countries while offsetting some of the effect of the reductions on global health programs.
Combined U.S. and Global Fund Funding in Prior and Upcoming Funding Periods (Stacked column chart)

Looking beyond 2029, further declines are expected from the U.S., with an uncertain forecast from the Global Fund, as other donor governments are scaling back.

  • The U.S. government plans to scale back funding in these 29 countries by an additional $2 billion in 2030 as it seeks to move programs to country governments (the full cut planned for 2027-2030 is estimated to be $5.3 billion).
  • While the funding envelope for the Global Fund’s next grant cycle (GC9) is not yet known,5 the fiscal environment suggests additional reductions may lie ahead. In addition, five of the 29 MOU countries will transition out of Global Fund eligibility for at least one disease (HIV, TB, or malaria) by the next grant cycle: Botswana, the Dominican Republic, El Salvador, Guatemala, and Honduras.6
  • More broadly, other donor governments (that provide direct aid to countries as well as support for the Global Fund) have also been scaling back their health and development assistance.

Funding declines of this magnitude are unprecedented in the modern-day era of global health, which saw the creation of the Global Fund in 2002 and the launch of PEPFAR in 2003, both of which helped to usher in significant new resources for global health.

  • As such, this next period will mark a significant departure in the global health response, with countries expected to move increasingly away from dependency on external support for health, while simultaneously ramping up their own expenditures. This will likely pose challenges for at least some of these countries, particularly those facing significant co-financing requirements and experiencing or at risk of debt distress and/or fragility or conflict, and will impact the millions of people whose health has benefited from these efforts.

Appendix

U.S. Global Health Funding in 29 MOU Countries: Comparison of Prior Period (Original and Revised, FY24-26) and Upcoming Period (FY27-29) (Table)
Global Fund Allocations in 29 MOU Countries: Comparison of Grant Cycle 7 (Original and Revised) and Grant Cycle 8 Allocations (Table)
Comparison of Changes in Funding (Global Fund, U.S., and Combined) in 29 MOU Countries (Table)

Methodology

To assess the impact of funding changes on countries that receive U.S. and Global Fund funding for global health activities, we analyzed funding in three ways. For the 29 countries with signed MOUs and available data, we compared 1.) U.S. MOU funding to historical U.S. planned and proposed funding amounts, 2.) the Global Fund Grant Cycle 8 (GC8) allocations to Grant Cycle 7 (GC7) allocations (both original and reduced GC7 amounts), and 3.) the combined impact of funding changes to U.S. and Global Fund funding. U.S. planned/proposed funding amounts were obtained from ForeignAssistance.gov for FY24, the FY2025 International Affairs Budget Request for FY25 (and FY26 original amounts), and MOU agreements for FY26 revised amounts. U.S. MOU funding amounts were obtained from U.S. Department of State, U.S. embassy, and Ministries of Health press releases, as well as MOU documents if available. Global Fund allocations were obtained from the Global Fund’s ‘Eligibility, Allocations & Funding’ data: https://archive.theglobalfund.org/eligibility-allocations/.

U.S. Funding Comparison: In countries that have signed bilateral global health agreements with the U.S., we compared U.S. MOU funding to what countries had historically received from the U.S. for global health in prior years. “Original prior period” funding represents FY24-FY26 funding; FY24-FY25 represent requested amounts and FY26 was assumed to remain at the FY25 level. “Revised prior period” funding represents FY24-FY26 funding; FY24-FY25 represent requested amounts and FY26 represent the first year of funding (FY26) provided in the MOUs. Most signed MOUs span a five-year period (FY26-FY30). To match the Global Fund’s three-year grant cycle period, if annual funding amounts were not available, five-year funding was adjusted to estimate a three-year total (for FY27-FY29) and compared to the prior three-years of U.S. proposed funding (FY24-FY26). For countries whose annual MOU amounts are not yet available (all but eight), MOU funding amounts were calculated to be spread evenly throughout the five-year period. Based on the eight MOU countries whose annual funding amounts were available (Cameroon, Ethiopia, Kenya, Liberia, Mozambique, Nigeria, Rwanda, and Uganda, which together account for 70% of U.S. MOU funding over the five-year period), the U.S. provides more funding to countries in earlier years of the MOU agreement, with steeper cuts occurring at the end of the five-year MOU period. While 32 countries to date have signed or indicated an intent to sign MOUs with the U.S., for comparison purposes, this analysis is based on 29 countries, as three (Bolivia, Panama, and the Philippines) have limited data on Global Fund allocations, U.S. historical, and/or planned MOU funding (Bolivia received Global Fund support in GC7 and GC8 but did not receive U.S. funding for global health in FY24-FY25; Panama did not receive Global Fund support in GC7 or GC8 and did not receive U.S. funding for global health in FY24-FY25; and the Philippines received Global Fund support in GC7 and GC8 but did not sign an official MOU but rather a declaration of intent to “establish a framework for health cooperation”).

Global Fund Comparison: In the same set of 29 countries, we compared GC8 allocations to GC7 (both original and reduced) allocations. The GC7 replenishment period was 2023-2025 with the country implementation/allocation period spanning 2024-2026; The GC8 replenishment period is 2026-2028, with the country implementation/allocation period spanning 2027-2029. Some GC7 allocation amounts were reported in source currency and were converted to USD based on the EUR/USD allocation rate for the allocation period, EUR/USD = 0.993542.

Combined Funding (Global Fund + U.S.) Comparison: To assess the combined impact of Global Fund and U.S. funding changes in MOU countries, we compared the sum of the original GC7 allocations and U.S. historical global health funding over the same period (FY24- FY26) with the sum of the GC8 allocations and U.S. MOU funding for the following period (FY27-FY29). If annual U.S. MOU amounts were not available, three-year adjusted totals were used.

Jen Kates currently serves on the board of the Global Fund to Fight AIDS, Tuberculosis and Malaria.


  1. The U.S. government has historically provided a third of the Global Fund’s funding. Even without this amount, however, the Global Fund still ranks as the number two donor to global health. ↩︎
  2. For comparison purposes with the Global Fund’s grant period, this analysis focuses on a three-year funding period. The full scope of most U.S. MOUs encompasses five years. Overall, $20.3 billion ($12.8 billion in U.S. funding and $7.5 billion in country co-financing) has been announced for 32 countries over the next five years (FY26-FY30). Compared to the prior five years (FY21-FY25), U.S. funding would decline by approximately $6 billion or 32%. See the KFF Tracker on America First MOU Bilateral Global Health Agreements for more details on the full scope of the MOUs.  ↩︎
  3. While El Salvador and Papua New Guinea would experience increases in funding compared to the prior three-year period ($4 million or 28% for El Salvador and $1 million or 13% for Papua New Guinea), these countries would still see drops over the full five-year period of the MOU (a 33% reduction in El Salvador and 26% reduction in Papua New Guinea compared to the prior five-year period). See the KFF Tracker on America First MOU Bilateral Global Health Agreements for more detail. ↩︎
  4. More broadly, Global Fund funding to all 103 countries it supports will decline by $2.3 billion in GC8, compared to the original allocations for GC7. ↩︎
  5. The Global Fund raises funding in three-year “replenishment” cycles. The amount raised determines the amount available for country allocations. The replenishment conference for GC9 (2029-2031 replenishment period and 2030-2032 country implementation period) will take place in 2028. ↩︎
  6. The Philippines, which is also a U.S. MOU country but was not included in this analysis, will also transition out of Global Fund eligibility for at least one disease component in the next grant cycle. ↩︎

Women’s Health Insurance Coverage

Published: Jun 9, 2026

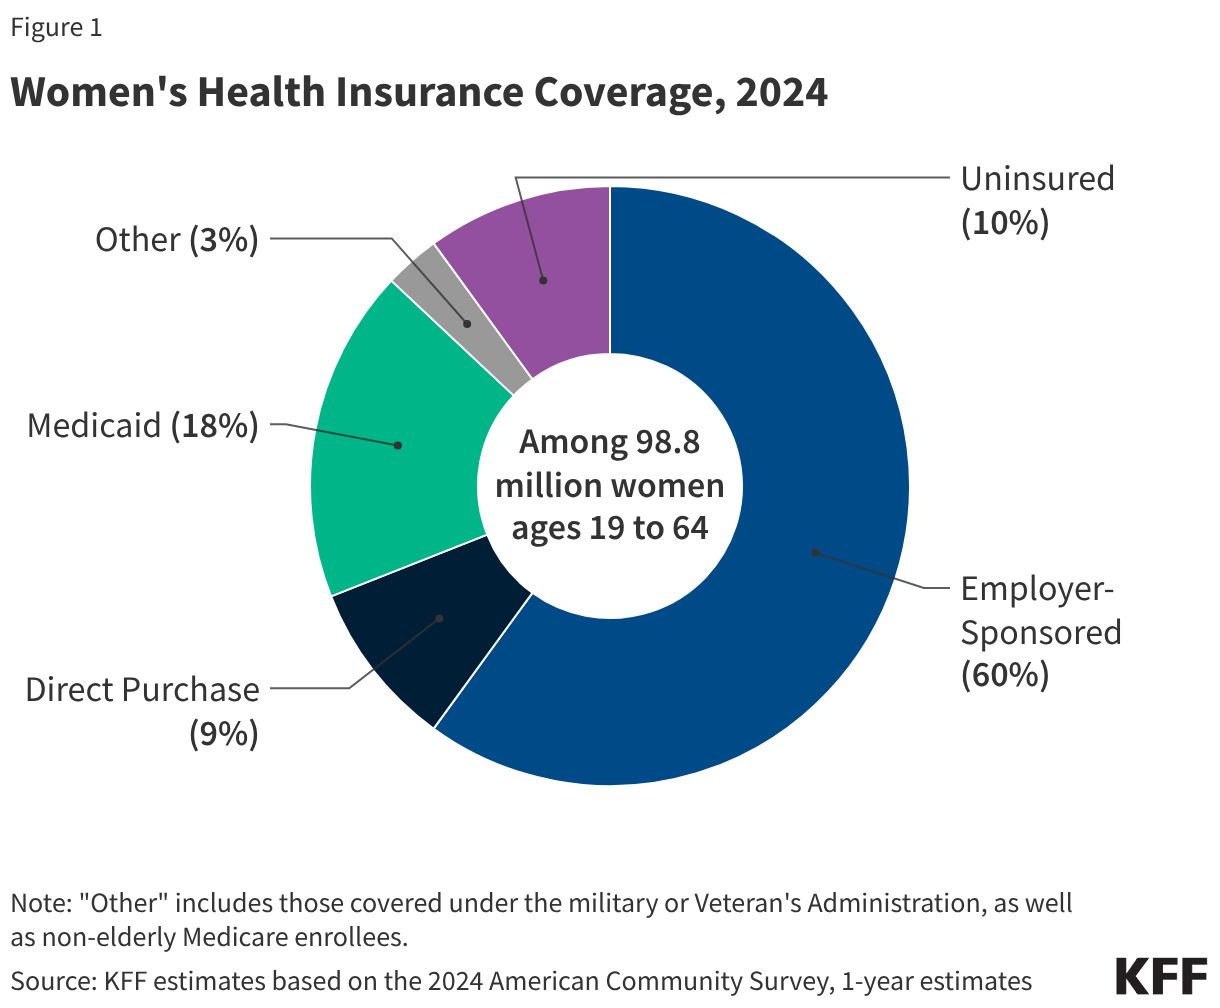
Health insurance coverage is an important factor in making health care affordable and accessible to women.1 Women with health coverage are more likely to obtain needed preventive, primary, and specialty care services, and have better access to new advances in women’s health. Among the 98.8 million women ages 19 to 64 residing in the U.S., most (90%) had some form of coverage in 2024. Over the past decade, the Affordable Care Act (ACA) has expanded access to affordable coverage through a combination of Medicaid expansions, private insurance reforms, and premium tax credits. However, while the uninsured rate has declined significantly in the past decade, gaps in private sector coverage, enrollment and eligibility barriers in publicly-funded programs, and persistent affordability challenges have left one in ten women uninsured. In addition, recent federal policy changes in Medicaid and the expiration of the ACA enhanced premium tax credits are expected to lead to a significant increase in the number of uninsured over the next several years. This factsheet reviews major sources of coverage for women residing in the U.S. in 2024, discusses the impact of the ACA on women’s coverage, and the coverage challenges that many women continue to face.

Sources of Health Insurance Coverage

Employer-Sponsored Insurance

Approximately 59.7 million women ages 19-64 (60%) received their health coverage from employer-sponsored insurance in 2024 (Figure 1).2

Women's Health Insurance Coverage, 2024 (Donut Chart)
  • Women in families with at least one full-time worker are more likely to have job-based coverage (70%) than women in families with only part time workers (33%) or without any workers (16%).3
  • In 2024, annual insurance premiums for employer sponsored insurance averaged $8,951 for individuals and $25,572 for families. Family premiums have increased 24% between 2019 and 2024. On average, workers paid 16% of premiums for individual coverage ($1,368) and 25% for family coverage ($6,296) with the employers picking up the balance.

Non-Group Insurance

The ACA expanded access to the non-group or individually purchased insurance market by offering premium tax credits to help individuals afford coverage purchased through state-based health insurance Marketplaces. It also included many insurance reforms to alleviate some of the long-standing barriers to coverage (such as gender rating, lack of maternity coverage, and pre-existing condition exclusions, having a disproportionate effect on women) that were common in the non-group insurance market prior to the ACA. In 2024, about 9% of women ages 19 to 64 (approximately 8.9 million women) and 9% of their male counterparts purchased insurance in the non-group market.4 This includes individuals who purchased private policies from the ACA Marketplace in their state, as well as those who purchased coverage from private insurers that operate outside of Marketplaces under similar rules.

  • Most individuals who seek insurance policies in their state’s Marketplace qualify for assistance with the costs of coverage. Individuals with incomes below 400% of the Federal Poverty Level (FPL) ($65,280 for an individual under 65 in 2024) can qualify for assistance in the form of federal tax credits which lower premium costs.
  • Enhanced federal subsidies that began as part of two COVID era bills that temporarily increased the amount of financial assistance already eligible marketplace enrollees received as well as extended Marketplace subsidies to people with incomes above 400% FPL expired and were not renewed by Congress. As a result, out-of-pocket premium payments for Marketplace enrollees have risen 58% on average, making health coverage unaffordable for some individuals. A KFF survey shows that nearly one in ten (9%) of 2025 Marketplace enrollees has become uninsured.   
  • The ACA set new standards for all individually purchased plans, including plans available through the Marketplace as well as those that existed prior to the ACA. The ACA bars plans from charging women higher premiums than men for the same level of coverage (gender rating) or from disqualifying women from coverage because they had certain pre-existing medical conditions, including pregnancy. All direct purchase plans must also cover certain “essential health benefits” (EHBs) that fall under 10 different categories, including maternity and newborn care, mental health, and preventive care.

Medicaid

The state-federal program for individuals with low-incomes, Medicaid, covered 18% of adult women ages 19 to 64 in 2024, compared to 14% of men. Historically, to qualify for Medicaid, women had to have very low incomes and be in one of Medicaid’s eligibility categories: pregnant, mothers of children 18 and younger, a person with a disability, or over 65. Women who didn’t fall into these categories typically were not eligible regardless of how poor they were. The ACA allowed states to broaden Medicaid eligibility to most individuals with incomes less than 138% of the FPL regardless of their family or disability status, effective January 2014. As of March 2026, 40 states and DC have expanded their Medicaid programs under the ACA.

  • Medicaid covers the poorest population of women. Forty-three percent of women with lower incomes (below 200% FPL) and 51% of women living below the federal poverty level (100% FPL) have Medicaid coverage.5
  • By federal law, all states must provide Medicaid coverage to pregnant women with incomes up to 133% of the federal poverty level (FPL) through 60 days postpartum. However, in recent years, there has been a growing interest in expanding the length of the postpartum coverage period, and to date, all but one state has opted to take steps to extend postpartum Medicaid coverage to 12 months.
  • H.R. 1, the 2025 budget reconciliation law, made significant changes to the Medicaid program. For the first time, Medicaid eligibility for adults in the ACA Medicaid expansion group will be conditioned on meeting work requirements starting January 1, 2027. KFF research shows that most adult women covered by Medicaid meet work requirements or would qualify for one of the law’s exemptions, but many would be at risk of losing coverage because of the administrative burdens related to reporting requirements. The Congressional Budget Office (CBO) estimates that these requirements will reduce federal Medicaid spending by $326 billion over the next 10 years but will also increase the number of uninsured by 5.3 million in 2034.
  • Medicaid financed 40% of births in the U.S. in 2024, is a major source of publicly-funded family planning services, and accounts for over half (61%) of all long-term care spending, which is critical for many frail elderly women.
  • Under federal law Medicaid coverage of abortion is very limited. The federal Hyde Amendment prohibits federal spending on abortions, except when the pregnancy is a result of rape or incest, or when it jeopardizes the life of the pregnant person. Among the 37 states and DC where the provision of abortion is legal, 17 states and DC follow the Hyde restrictions, while the other 20 states use their own unmatched funds to pay for abortions for Medicaid enrollees who seek abortion in other circumstances.

On average, women have lower incomes and have been more likely than men to meet Medicaid’s traditional eligibility categories; pregnant, parent of children under 18, disabled, or over 65. As a result, women are more likely than men to qualify for Medicaid and less likely to be uninsured. In 2024, 13% of men ages 19-64 were uninsured compared to 10% of women in the same age bracket (9.8 million women).

Uninsured women often have inadequate access to care, get a lower standard of care when they are in the health system, and have poorer health outcomes. Compared to women with insurance, uninsured women have lower use of important preventive services such as mammograms, Pap tests, and timely blood pressure checks. They are also less likely to report having a regular doctor.

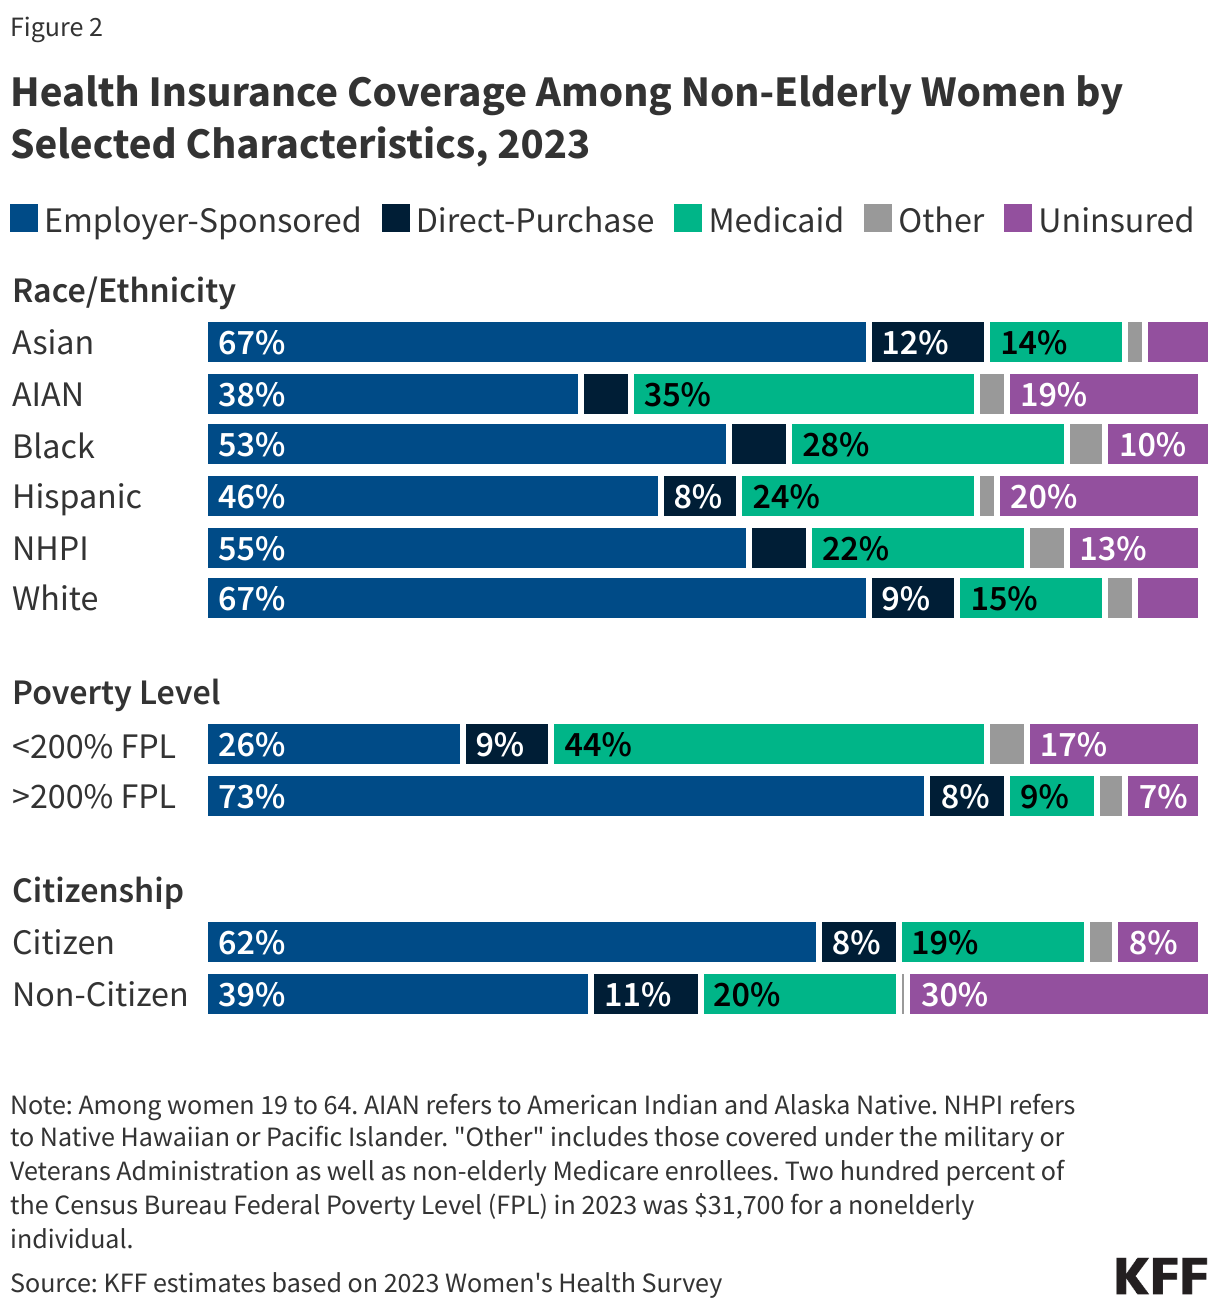
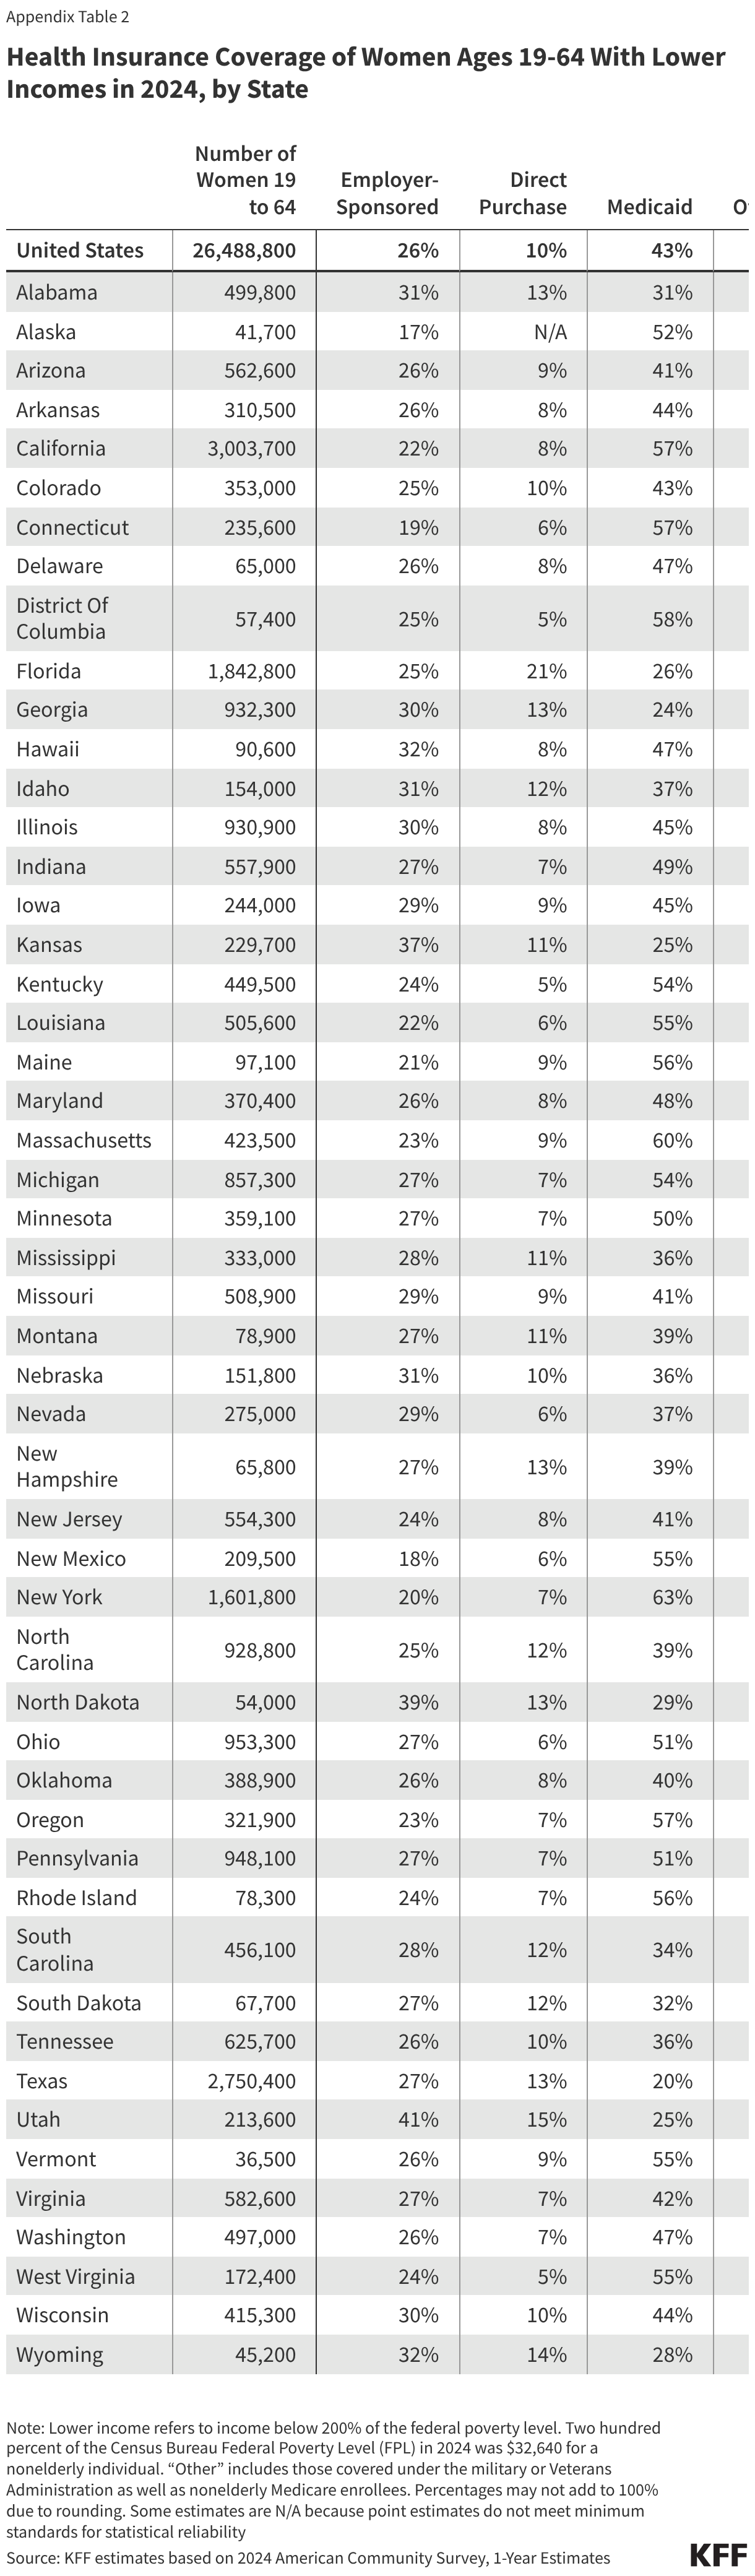
  • Women with lower incomes, women of color, and women who are non-citizens are at greater risk of being uninsured (Figure 2). One in five (18%) women with incomes under 200% of the FPL ($32,640 for an individual in 2024) are uninsured (Appendix Table 2), compared to 7% of women with incomes at or above 200% FPL. One in five Hispanic (20%) and American Indian and Alaska Native (19%) women are uninsured. A higher share of women in single parent households are uninsured (11%) than women in two-parent households (7%) (data not shown).6
Health Insurance Coverage Among Non-Elderly Women by Selected Characteristics, 2024 (Stacked Bars)
  • The majority of women who are uninsured live in a household where someone is working: 69% are in families with at least one adult working full-time and 83% are in families with at least one part-time or full-time worker.7
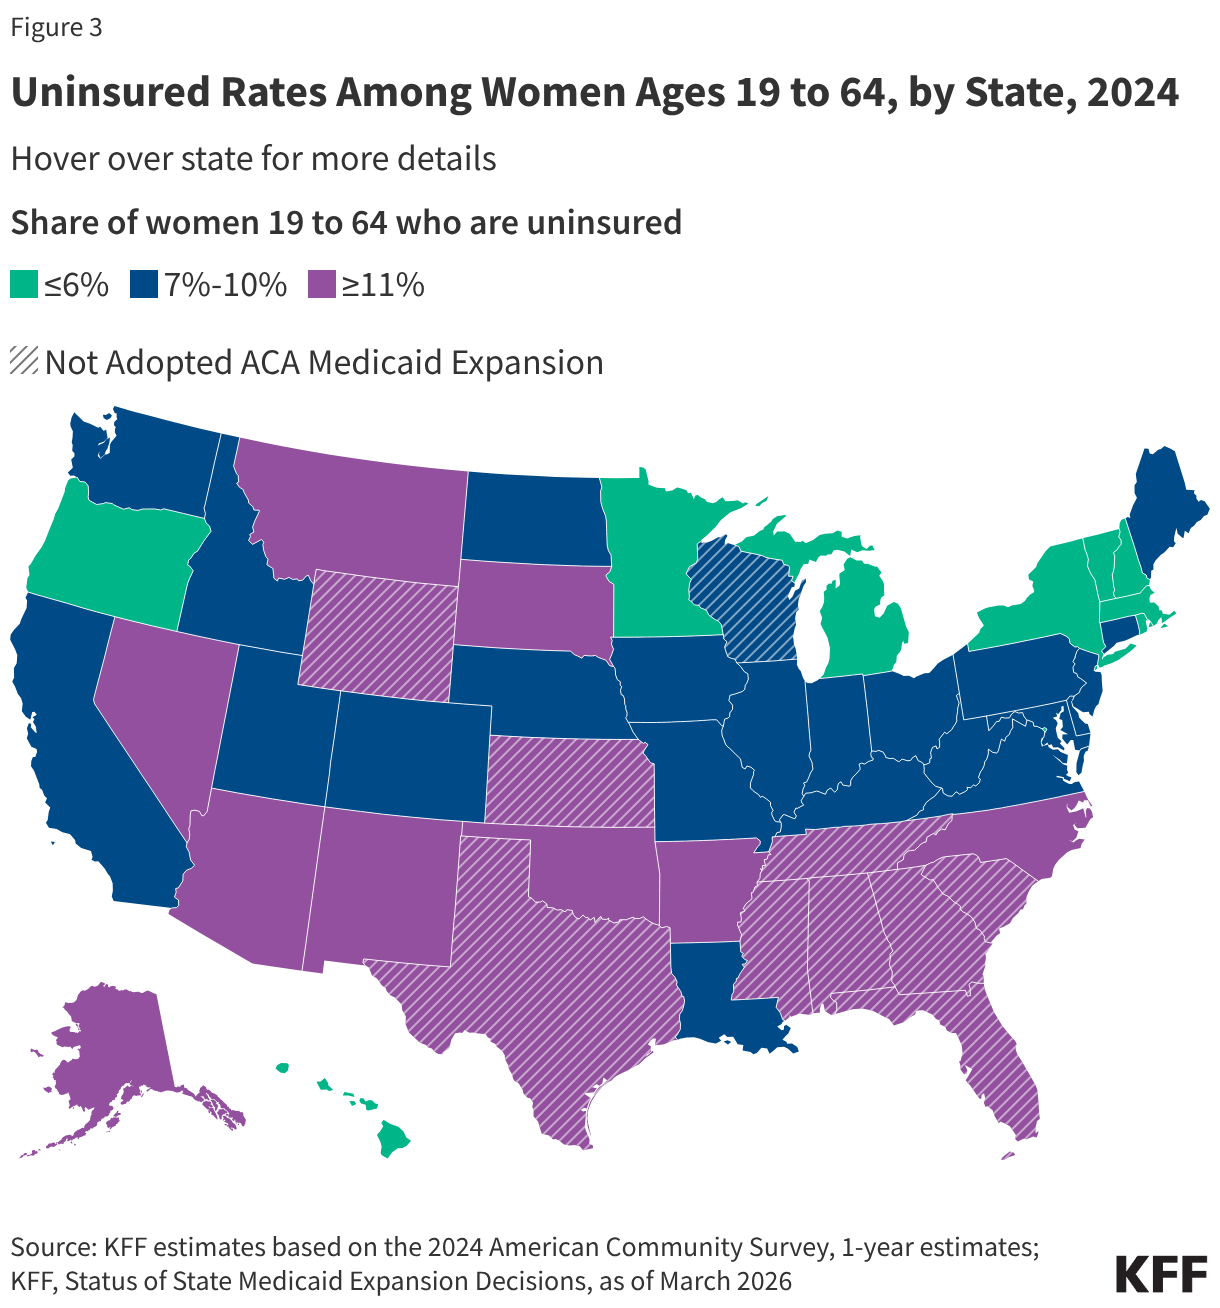
  • There is considerable state-level variation in uninsured rates across the nation, ranging from 20% of women in Texas to 3% of women in Massachusetts (Figure 3). Of the 18 states with uninsured rates above the national average (10%), nine have not adopted the ACA Medicaid expansion.
Uninsured Rates Among Women Ages 19 to 64, by State, 2024 (Choropleth map)
  • In states that have not adopted the ACA Medicaid expansion, approximately 576,000  women with household incomes below the federal poverty level and are uninsured fall into a “coverage gap” because they earn too much to qualify for Medicaid but not enough to qualify for Marketplace premium tax credits. Other uninsured women are not eligible for any assistance with health coverage due to their immigration status, their income, or because they have an offer of coverage from an employer even if can’t afford the premiums.
  • Between the changes to Medicaid made by H.R. 1 and the expiration of the enhanced ACA tax credits, CBO estimates that the number of uninsured people will increase by more than 14 million by 2034.

Scope of Coverage and Affordability

The ACA set national standards for the scope of benefits offered in private plans. In addition to the broad categories of essential health benefits (EHBs) offered by marketplace plans, all privately purchased plans must cover maternity care, which had been historically excluded from most individually purchased plans prior to the ACA. In addition, most private plans must cover preventive services without co-payments or other cost sharing. This includes screenings for breast and cervical cancers, well woman visits (including prenatal visits), prescribed contraceptives, breastfeeding supplies and supports such as breast pumps, and several STI services. Twenty-five states have laws banning coverage of most abortions from the plans available through the state Marketplaces. These restrictions were in place prior to the Supreme Court’s 2022 decision to overturn Roe v Wade.

Affordability of coverage continues to be a significant concern for many women, both for those who are uninsured as well as those with coverage. The leading reason why uninsured adults report that they haven’t obtained coverage is that it is too expensive. Under employer-sponsored insurance, the major source of coverage for women, 65% of all covered workers with a general annual deductible have deductibles of $1,000 of more for single coverage. With the impending growth in the uninsured due to the expiration of the enhanced subsidies in the Individual market and the implementation of major changes to Medicaid from H.R. 1, health care affordability will grow as a major national problem for increasing numbers of women.

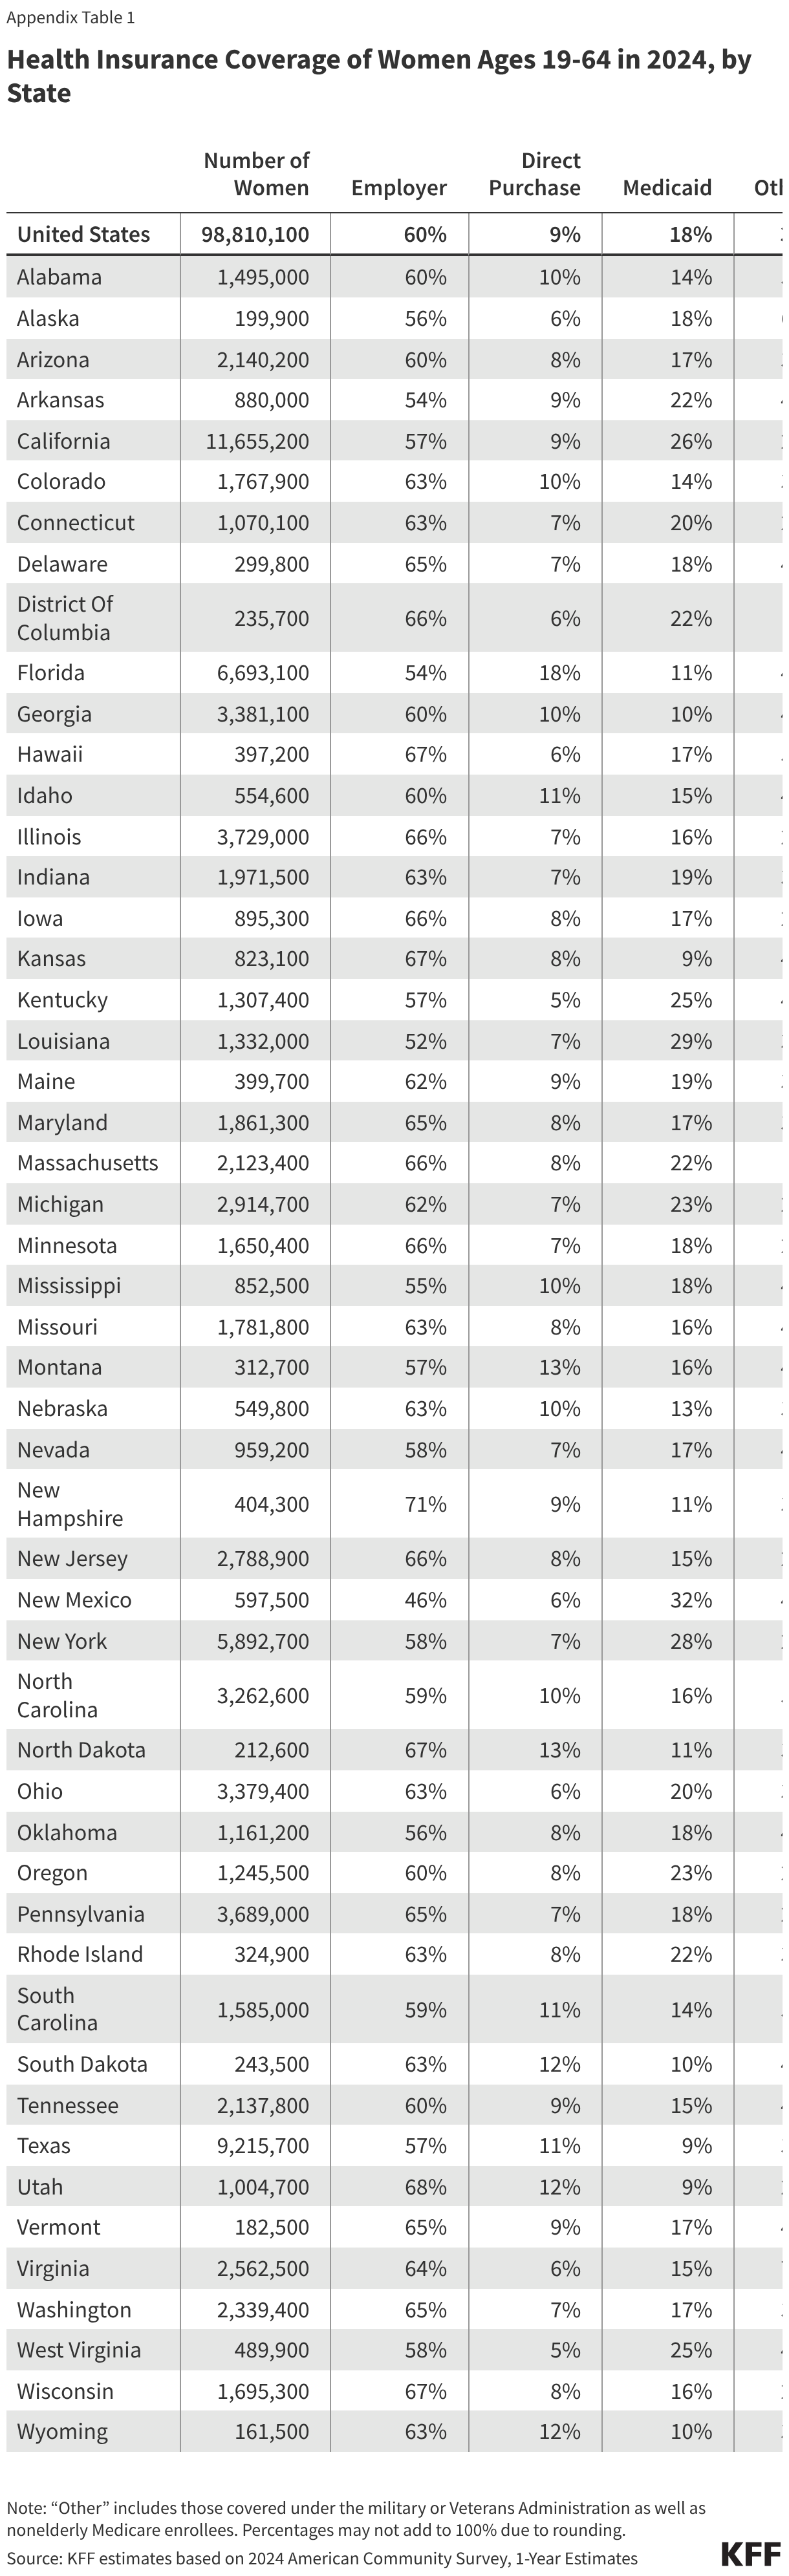
Health Insurance Coverage of Women Ages 19 to 64 in 2024, by State

Health Insurance Coverage of Women Ages 19-64 in 2024, by State (Table)

Health Insurance Coverage Women Ages 19 to 64 with Lower Incomes in 2024, by State

Health Insurance Coverage of Women Ages 19-64 With Lower Incomes in 2024, by State (Table)

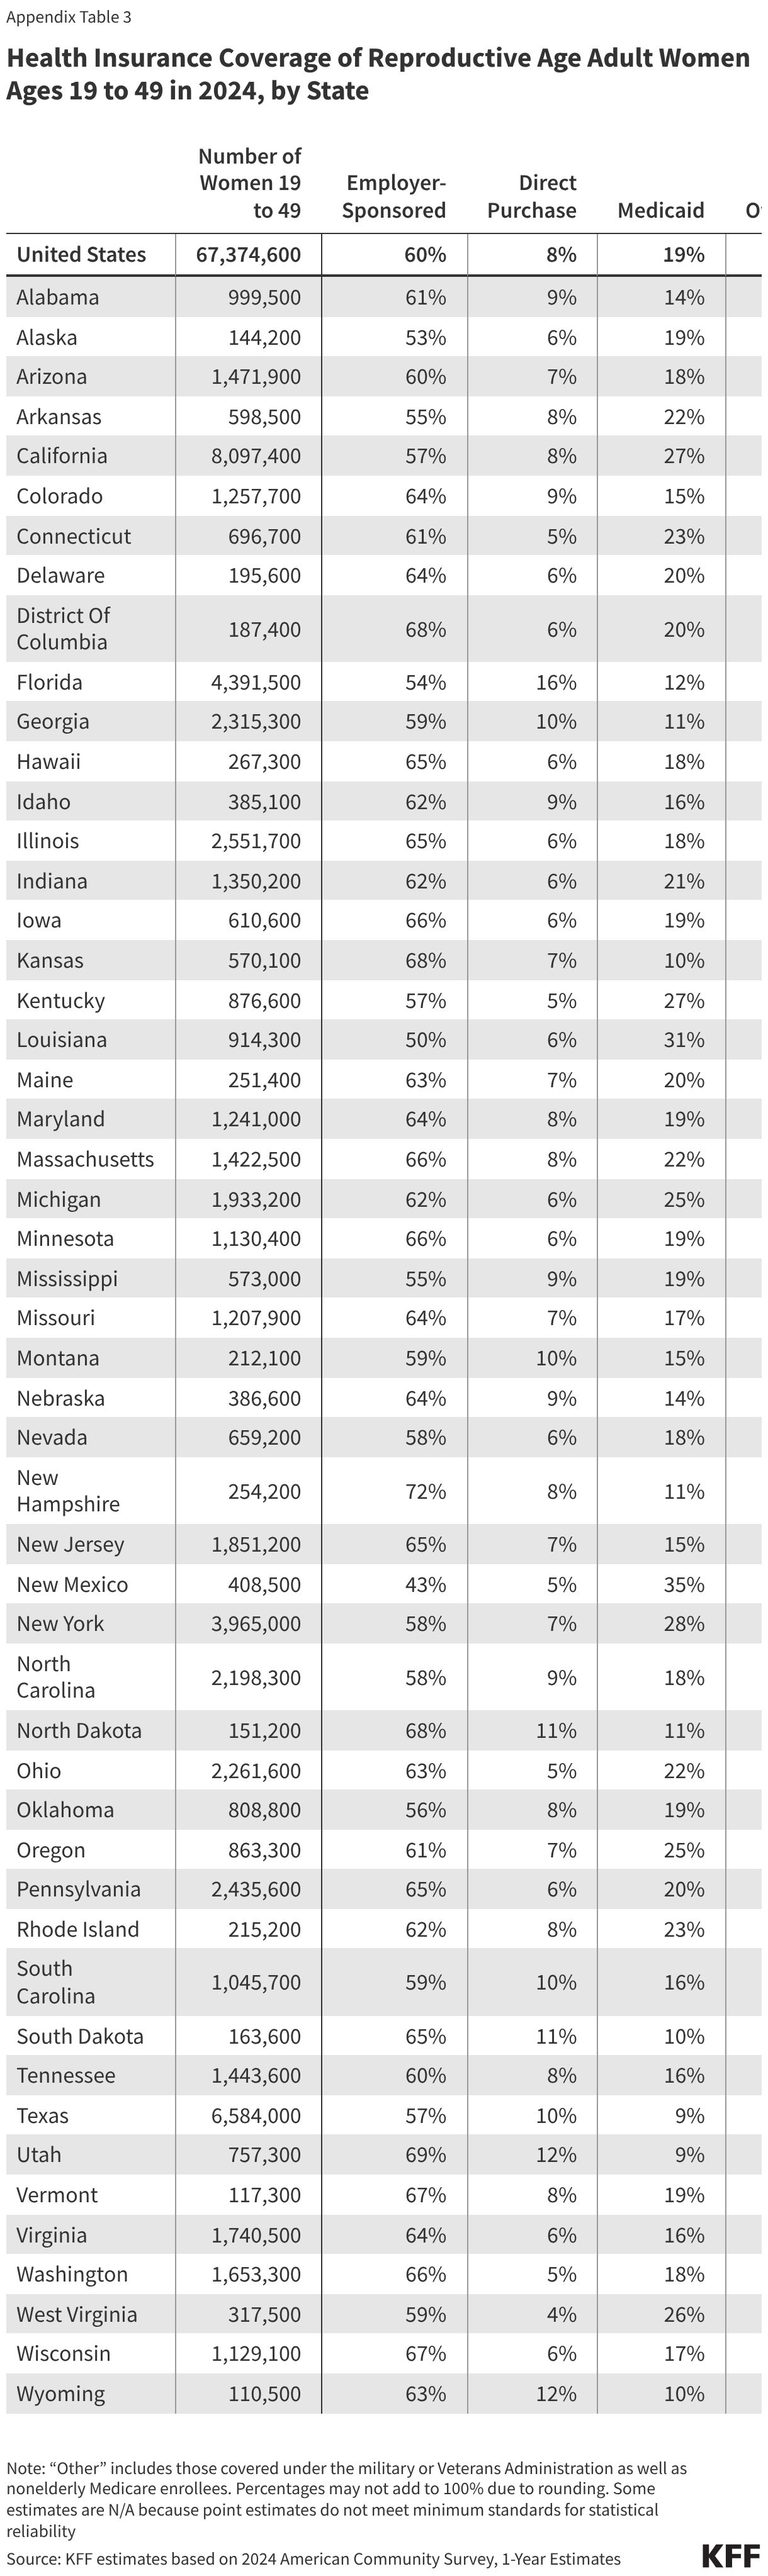
Health Insurance Coverage of Reproductive Age Adult Women Ages 19-49 in 2024, by State

Health Insurance Coverage of Reproductive Age Adult Women Ages 19 to 49 in 2024, by State (Table)

  1. This factsheet is based on KFF analysis of data from the American Community Survey (ACS), which stratifies data by an individual's sex as male or female. Throughout this brief we refer to “women” but recognize that not all people who are born as females identify as "women." ↩︎
  2. KFF estimates based on 2024 American Community Survey, 1-Year Estimates. ↩︎
  3. Ibid. ↩︎
  4. Ibid. ↩︎
  5. Ibid. ↩︎
  6. KFF estimates based on 2024 American Community Survey, 1-Year Estimates. ↩︎
  7. Ibid. ↩︎

Key Global Health Positions and Officials in the U.S. Government

Published: Jun 9, 2026

This tracker is updated periodically and currently reflects major positions known to be filled or likely to be retained thus far in the second Trump administration (other key roles will be added as filled). Some of the officials noted in this tracker may be on administrative leave and not performing the duties of their roles under direction from the Trump administration.

PositionOfficial
WHITE HOUSE/EXECUTIVE OFFICE OF THE PRESIDENT
National Security Advisor/Assistant to the President for National Security Affairs, National Security Council (NSC)Marco Rubio
Director, Office of National AIDS Policy (ONAP)Vacant
Director, Office of Management and Budget (OMB)Russ Vought
U.S. Trade Representative, Office of the United States Trade Representative (USTR)Jamieson Greer
Director, Office of Science and Technology Policy (OSTP)Michael Kratsios
Director, Office of Pandemic Preparedness and Response Policy (OPPR)Sara Brenner
U.S. Coordinator for Global Health SecurityVacant
DEPARTMENT OF STATE
Secretary of StateMarco Rubio
Permanent U.S. Representative to the United Nations, U.S. Mission to the United NationsMike Waltz
Senior Official, Under Secretary for Foreign Assistance, Humanitarian Affairs and Religious FreedomJeremy Lewin
Ambassador-at-Large for Global Health Security and DiplomacyJohnny Figueroa (Designate)
Global AIDS Coordinator, Bureau of Global Health Security and DiplomacyJohnny Figueroa (Designate)
Jeffrey Graham
Principal Deputy Assistant Secretary for Global Health Security and Diplomacy; Deputy Assistant Secretary for PEPFAR and Health Programs, Bureau of Global Health Security and DiplomacyRebecca Bunnell
Senior Advisor for Global Health Security and Diplomacy, Bureau of Global Health Security and DiplomacyBrad Smith
Assistant Secretary, Bureau of Democracy, Human Rights, and LaborRiley Barnes
Assistant Secretary, Bureau of Population, Refugees, and MigrationAndrew Veprek
Senior Bureau Official, Bureau of International Organization AffairsMcCoy Pitt
Assistant Secretary of State for Oceans and International Environmental and Scientific Affairs (OES)John Thompson
DEPARTMENT OF HEALTH AND HUMAN SERVICES (HHS)
SecretaryRobert F. Kennedy Jr. 
Director, Office of Global Affairs (OGA)Bethany Kozma
Assistant Secretary for HealthBrian Christine
Surgeon GeneralNicole Saphier (Designate)
Stephanie Haridopolos
Principal Deputy Assistant Secretary for Preparedness and Response, Administration for Strategic Preparedness and Response (ASPR)John Knox
Director, Center for the Biomedical Advanced Research and Development Authority (BARDA), ASPRGary Disbrow
HHS/CENTERS FOR DISEASE CONTROL AND PREVENTION (CDC)
DirectorErica Schwartz (Designate)
Jay Bhattacharya
Director, Office of Readiness and ResponseHenry Walke
Director, Washington OfficeAnstice Brand Kenefick
Director, Global Health Center (GHC)Paige Alexandra Armstrong
Director, Division of Global Health Protection, GHCBenjamin Park
Director, Division of Global HIV and TB, GHCHank Tomlinson
Director, Global Immunization Division, GHCJohn Vertefeuille
Director, Division of Parasitic Diseases and Malaria, National Center for Emerging and Zoonotic Infectious Diseases (NCEZID)Simon Agolory
Director, Influenza Division, National Center for Immunization and Respiratory Diseases (NCIRD)Vivien Dugan
HHS/NATIONAL INSTITUTES OF HEALTH (NIH)
DirectorJay Bhattacharya
Director, National Institute of Allergy and Infectious Diseases (NIAID)Jeffrey Taubenberger
Director, Office of Global Research, NIAIDJoyelle Dominique
Director, Division of AIDS, NIAIDRobert Eisinger
Director, Division of Microbiology and Infectious Diseases (DMID), NIAIDDavid Spiro
Director, Vaccine Research Center, NIAIDTed Pierson
Director, Office of AIDS Research (OAR); NIH Associate Director for AIDS ResearchGeri Donenberg
Director, Fogarty International Center (FIC); NIH Associate Director for International ResearchPeter Kilmarx
Director, Center for Global Health, Office of the Director, National Cancer InstituteSatish Gopal
Director, Office of Global Health, Office of the Director, National Institute of Child Health and Human DevelopmentVesna Kutlesic
Director, Center for Global Mental Health Research, National Institute of Mental HealthLeonardo Cubillos
HHS/FOOD & DRUG ADMINISTRATION (FDA)
CommissionerMarty Makary
Deputy Commissioner for Policy, Legislation, and International AffairsGrace Graham
Associate Commissioner for Global Policy and StrategyMark Abdoo
HHS/HEALTH RESOURCES AND SERVICES ADMINISTRATION (HRSA)
AdministratorThomas Engels
Associate Administrator, Bureau of HIV/AIDSHeather Hauck
Director, Office of Global Health, Office of Special Health InitiativesMelissa Ryan Kemburu
DEPARTMENT OF DEFENSE (DoD)
SecretaryPete Hegseth
Assistant Secretary of Defense for Health Affairs, Personnel and Readiness (P&R)Keith Bass
Commander, Naval Medical Research Command (NMRC)Eric Welsh
Director, DoD HIV/AIDS Prevention Program (DHAPP)Brad Hale
Commander, Walter Reed Army Institute of Research (WRAIR)Brianna Perata
Director, U.S. Military HIV Research Program (MHRP)Julie Ake
Chief, Armed Forces Health Surveillance Division (AFHSD)Richard Langton
Chief, Global Emerging Infections Surveillance (GEIS), AFHSDBrett Swierczewski
OTHER AGENCIES AND DEPARTMENTS
Peace Corps*: DirectorChristopher Landau
Council of the Inspectors General on Integrity and Efficiency*: Chair, Pandemic Response Accountability CommitteeWilliam Kirk
Council of the Inspectors General on Integrity and Efficiency*: Executive Director, Pandemic Response Accountability CommitteeKenneth Dieffenbach
Department of Agriculture (USDA): SecretaryBrooke Rollins
Environmental Protection Agency (EPA)*: Assistant Administrator for International and Tribal AffairsUsha-Maria Turner
Department of Homeland Security (DHS): Chief Medical OfficerSean Conley
Notes: Acting officials in italics. Officials who the White House has signaled it intends to nominate or who are formally awaiting Senate confirmation are noted as “Designate.” tbd means to be determined. As of June 9, 2026. Also see NIH/FIC, Global Health Initiatives at NIH, available at: https://www.fic.nih.gov/Global/Global-Health-NIH/Pages/institute-center-ics-global-health.aspx.

What to Know About Recent Federal Actions Involving State Medicaid Program Integrity

Published: Jun 9, 2026

The Trump Administration continues its focus on rooting out fraud, waste, and abuse in federal programs, including Medicaid. In March 2026, President Trump issued an Executive Order establishing the Task Force to Eliminate Fraud, chaired by Vice President J.D. Vance. In May 2026, the Centers for Medicare and Medicaid Services (CMS) announced a six-month nationwide moratoria (or pause) on the enrollment of new Medicare hospice and home health agency providers. The Department of Health and Human Services (HHS) has also taken nationwide and state-specific action in the Medicaid program, including:

CMS state-specific financial action and inquiries:

  • In early 2026, CMS used multiple procedures simultaneously to address potential fraud in Minnesota, including deferring (or pausing) $350 million in federal Medicaid funding for past expenditures.
  • In May 2026, CMS issued what it reports is the largest deferral in its history, deferring $1.3 billion in federal Medicaid funding for past expenditures in California.
  • CMS has also sent letters seeking information about Medicaid program integrity, provider oversight, and fraud prevention to California, Florida, Maine, and New York.

50-state requests/reviews:

  • In April 2026, CMS sent a letter (the same letter went to all states and DC) asking all state Medicaid programs to “swiftly revalidate” Medicaid providers at high risk of “waste, fraud, abuse, and corruption” and to provide a broader strategy on provider revalidations to CMS within 30 days.
  • In May 2026, CMS announced the HHS Office of the Inspector General (HHS-OIG) would be initiating a review of every state’s Medicaid Fraud Control Unit (MFCU) before its next annual recertification. In June 2026, three weeks after the 53 state/territory Medicaid Fraud Control Units (MFCUs) received notice that they would be under review, HHS announced that it is denying the Hawaii MFCU’s annual recertification, which discontinues federal funding for the Fraud Control Unit.

Federal request for information:

  • In February 2026, CMS released a Request for Information (RFI) seeking input on how CMS can more effectively combat fraud, waste, and abuse in Medicaid/CHIP, Medicare, and the ACA Marketplaces.

There are no reliable measures of fraud against Medicaid. Measuring fraud is difficult, in part, because it can only be determined with certainty after the fact and if it is identified (through recovery and enforcement actions). Recovery and enforcement data show that in 2025 the 53 state and territory Medicaid Fraud Control Units reported $2 billion in recoveries1.

The current use of payment deferrals, given the magnitude of federal funding at stake and the time it takes to resolve administrative disputes, creates uncertainty and could be destabilizing for state budgets. If states have inadequate funding to maintain existing Medicaid programs, they may face difficult decisions regarding how to limit Medicaid spending or divert spending from other state programs. Additionally, new program integrity requests come at a time when states are facing historic reductions in federal Medicaid funding and new administrative requirements, including implementing work requirements and more frequent eligibility renewals for Medicaid expansion adults. Against this backdrop, this brief describes recent HHS actions (state-specific and nationwide) related to Medicaid program integrity and outlines some open questions going forward.

How has CMS engaged with individual states on program integrity?

CMS focused its increased state-specific Medicaid oversight first on Minnesota. In response to potential fraud in Minnesota, CMS applied a new approach by separately using both deferrals of payments for services already delivered and announcing potential withholding of future federal funds. In January 2026, CMS announced the potential withholding of future federal funds ($515 million in federal Medicaid matching payments per quarter) but has since accepted Minnesota’s corrective action plan. This resolves the threat of the withhold, provided the state successfully implements the corrective action plan. The corrective action plan includes 17 specific elements (e.g., a pause on accepting new providers into 13 high-risk Medicaid service categories, revalidation of more than 5,500 Medicaid providers, increased use of data analytics to review claims before they are paid) as well as specific implementation dates. CMS’s approval of the corrective action plan does not resolve the ongoing, separate, deferral process.

As of June 8, 2026, CMS has deferred federal payments totaling $350 million for Medicaid expenditures incurred by Minnesota. The first deferral, announced February 25, 2026, temporarily halts $259 million in federal payments for expenditures incurred in quarter four of FY 2025, and remains in place after a District Court denied the state’s request to block the CMS action and require it to release the funds to the state. While the ruling noted that the deferral “likely complies with the controlling federal regulations” it also noted the deferral is “historically unprecedented in its size and timing” (Figure 1).

On April 29, 2026, CMS notified Minnesota that it was deferring an additional $91 million in federal Medicaid funding for past expenditures incurred in quarter one of FY 2026, bringing the total amount of deferred federal funds to $350 million. On May 7, 2026, the District Court granted a joint motion submitted by both CMS and Minnesota, which pauses litigation “for 120 days so that [CMS and Minnesota] can attempt to resolve the deferrals.” CMS and Minnesota must submit a status report to the Court by September 3, 2026.

Figure 1

Previously, CMS requested documentation from Minnesota for Medicaid fee-for-service and managed care encounters to determine the allowability of the deferred state expenditures. The typical process to resolve a deferral can take months as the state and CMS have specific, sequential timeframes for response (which can also be extended); however, it’s unclear how the typical timeframe aligns with the 120-day litigation pause. In the meantime, Minnesota will remain without access to the deferred federal funds.

CMS has also deferred $1.3 billion in federal funds for California. CMS announced this deferral on May 13, 2026, reporting it as the largest in CMS history. Unlike the compliance (withholding) process, which requires an initial hearing opportunity before CMS may impose financial penalties, a deferral pauses federal payments for state claims until the state can demonstrate the allowability of those claims. The deferral halts reimbursement for the federal share of certain expenses California claimed in quarter four of FY 2025. Of the $1.3 billion in deferred funds, $1.1 billion are deferrals of home care (services that help older adults and people with disabilities with self-care) expenditures, while the remaining $200 million is part of an ongoing federal review of a variety of claims unrelated to home care (Box 1). The state reiterated that increased spending on Medicaid home care reflects state and federal policy choices to increase the availability of home care.

Box 1. CMS deferred $1.1 billion in federal financial participation for home care services claimed by California in quarter four of FY 2025.

On April 2, 2026, CMS requested that within 2 weeks California provide claims data related to certain home care services. California requested an extension, which CMS declined. The state submitted two rounds of partial data, completing the request on May 7, 2026. However, CMS reported that due to the lag in time it took the state to respond, it derived the home care deferral amount using the following estimation processes:

  • $501 million (44%) of the home care deferral was determined based on the “significant growth” observed in the state’s claiming (between FFY 2023 and FFY 2025) relative to other states. CMS calculated this deferred amount “to estimate the questionable claims related to [CMS’s] concerns with the growth rate and was used for deferral purposes since the state did not timely provide the requested data.”
  • $632 million (56%) of the home care deferral was derived by applying “program integrity metrics” to identify “statistical outliers” and delayed claims from the data California supplied in response to the CMS’s request. The deferral letter does not describe how statistical outliers are identified.
  • California previously supplied detailed context related to the growth in home care spending and described the state’s fraud prevention data analytics strategies in their February 2026 response to CMS’s inquiry into the state’s program integrity operations.

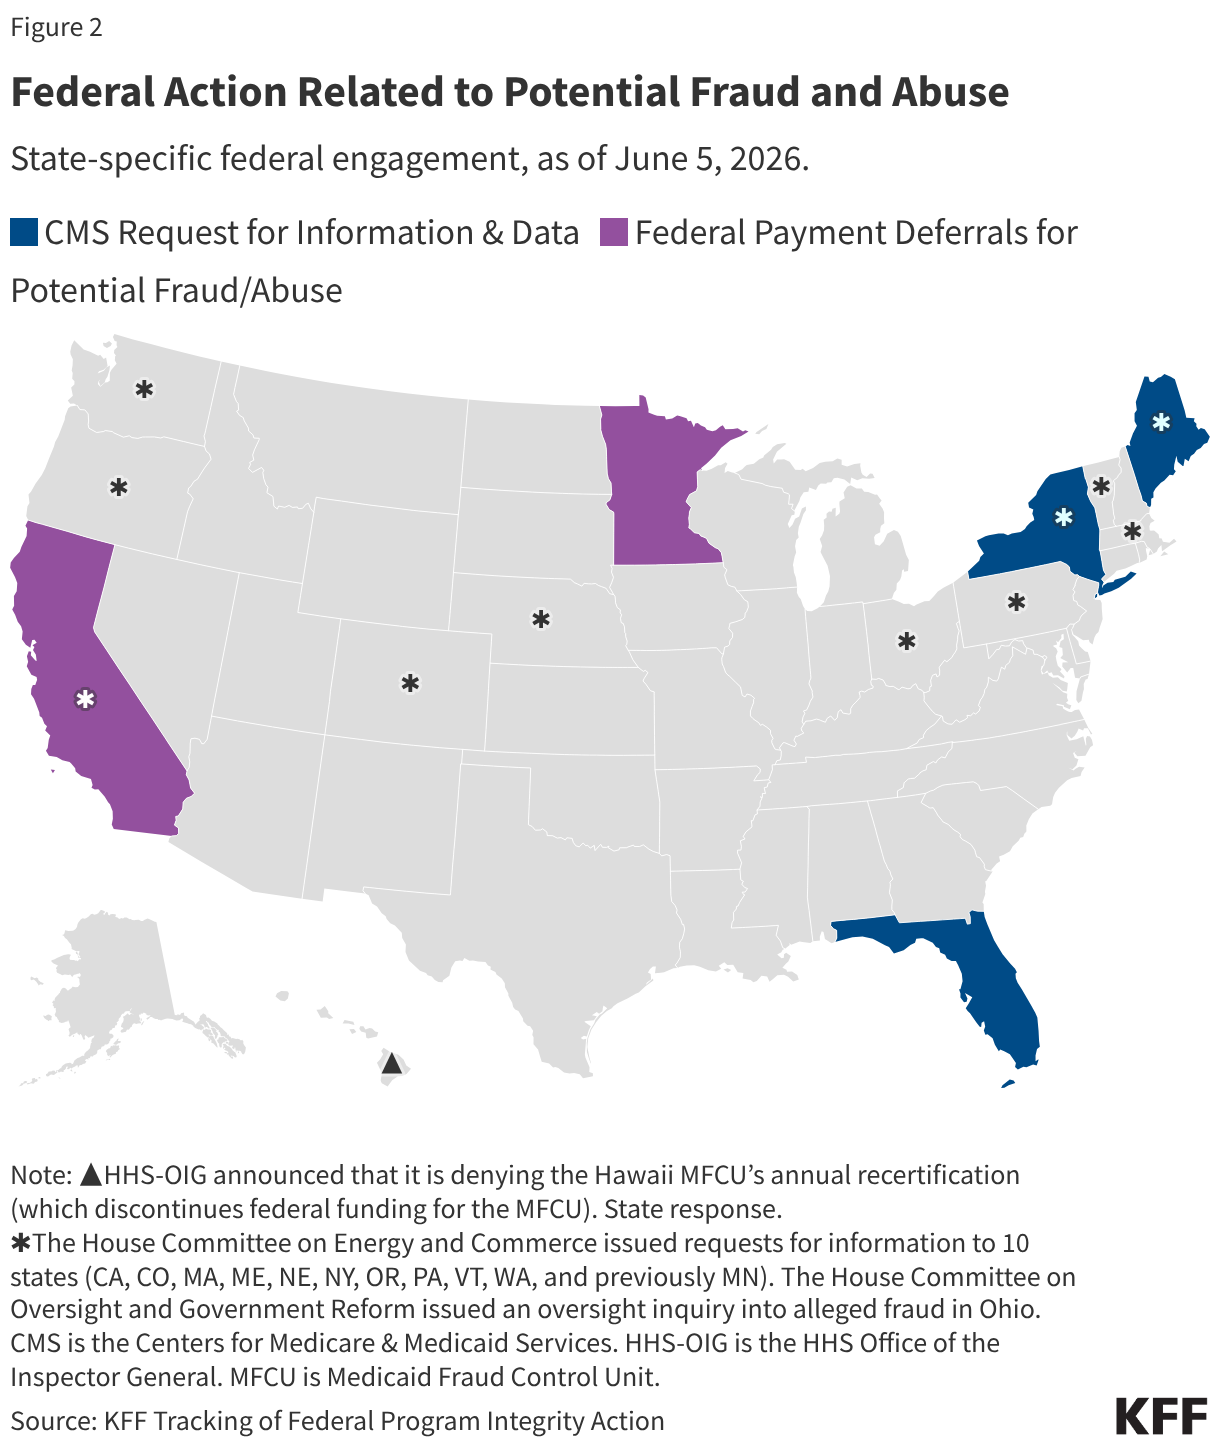
With deferrals, CMS pauses payment for state Medicaid expenditures that have already occurred and requires the state to provide additional information demonstrating that expenditures are “allowable.” If CMS ultimately disallows some or all of the federal matching payments that have been deferred, the state could request reconsideration from CMS or appeal with the Departmental Appeals Board. If an appeal is unsuccessful, the state could seek relief in U.S. District Court. While CMS and Congress2 have initiated probes into other state Medicaid programs, requesting detailed information about each state’s program integrity policies and procedures, CMS has only publicly announced deferrals in two states (Minnesota and California) and compliance action (resulting in a corrective action plan) in Minnesota (Figure 2).

Federal Action Related to Potential Fraud and Abuse (Choropleth map)

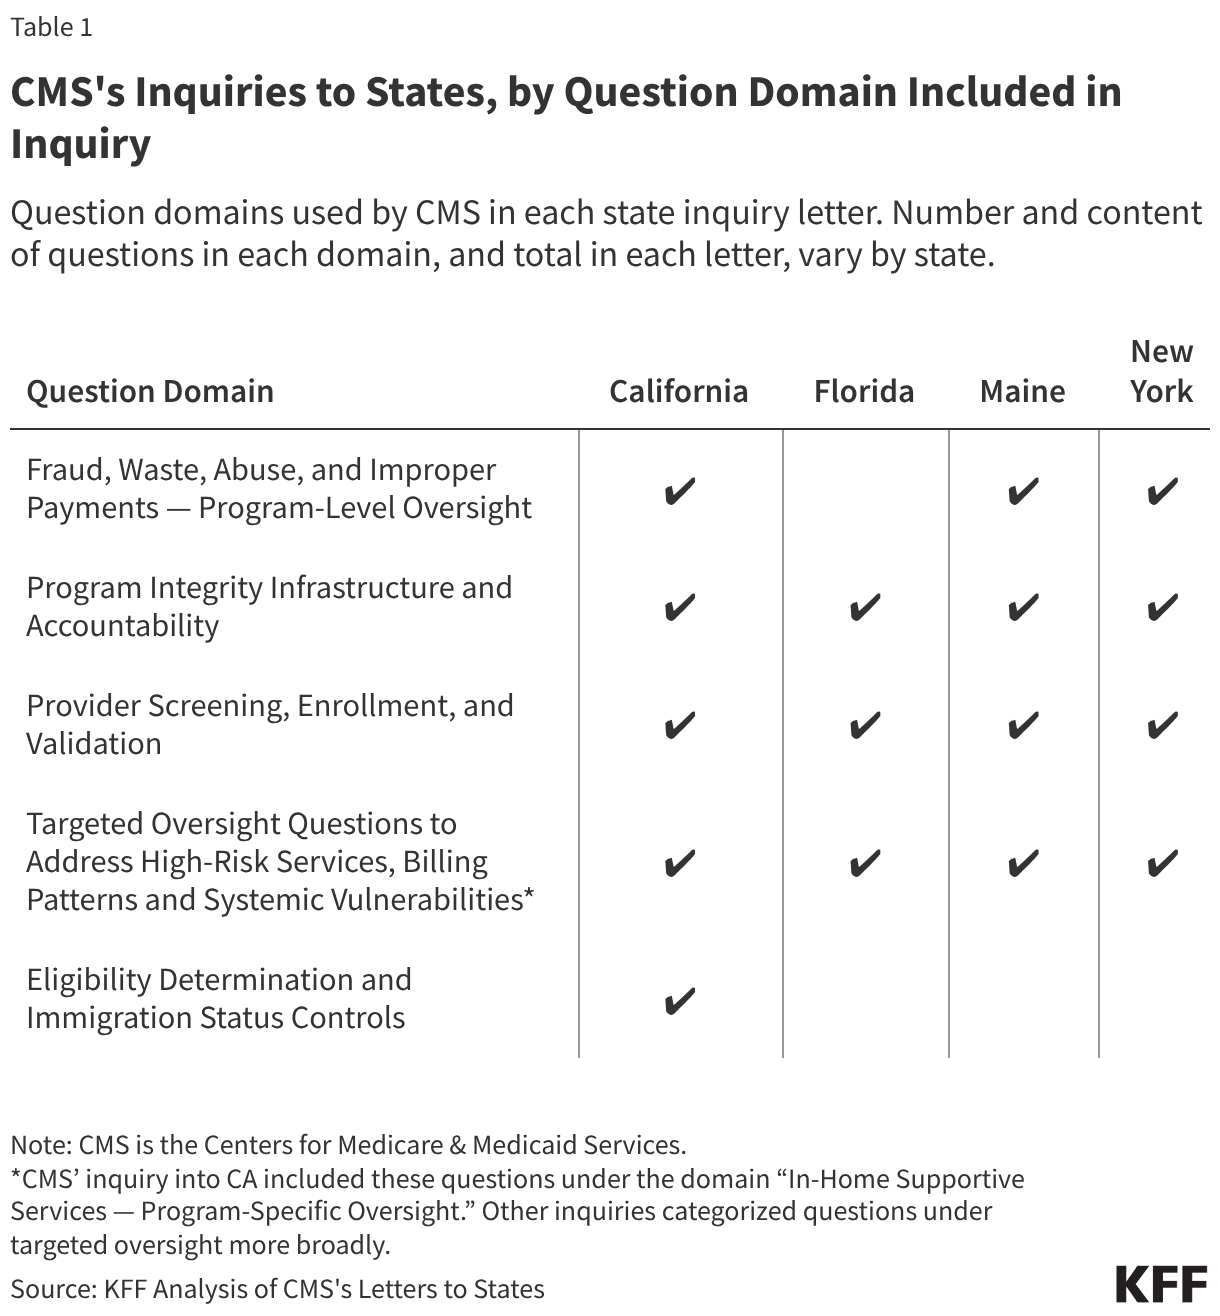
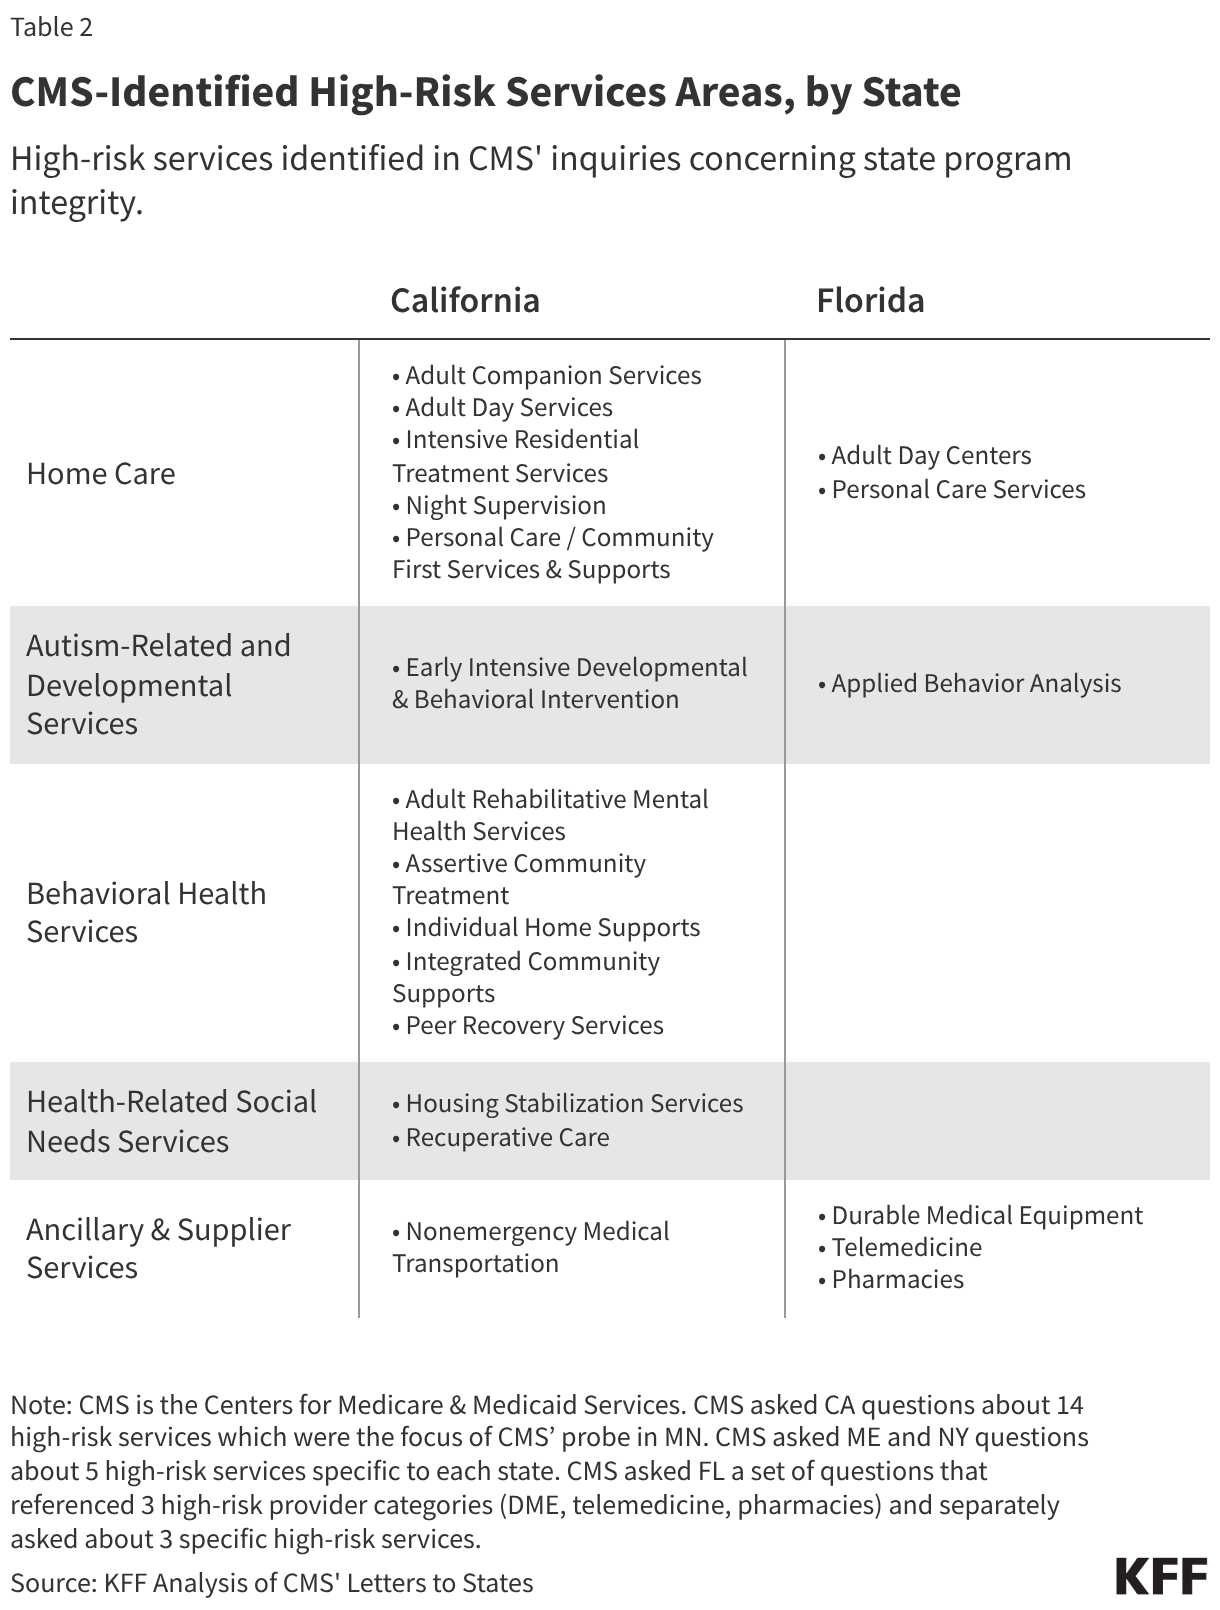
In addition to taking compliance action (MN) and issuing deferrals (CA, MN), CMS has sent letters seeking detailed information about Medicaid program integrity to four states (CA, FL, ME and NY) (Figure 2). In each letter, CMS posed a series of program integrity related questions (Table 1). States were asked to supply program integrity process and policy information as well as specific data. The inquiries could provide some insight into broader federal program integrity priorities, and/or could be part of a process that eventually leads to compliance action or payment deferrals. CMS laid out context for each inquiry including concerns stemming from recent fraud cases in the state and/or analyses of state claims showing growth in the use of certain “high-risk” services, although CMS publicly confirmed errors in analysis related to New York Medicaid data. The high-risk services cited by CMS are specific to each state, except for California (for which CMS cited the 14 high-risk services of focus in Minnesota) (Table 2). The high-risk services (e.g., behavioral health or certain autism-related services, home care, or non-emergency medical transport (NEMT) services) identified by CMS (across states) may have risk factors or vulnerabilities (e.g., new, complex, or hard-to-verify services, or services delivered outside traditional health care settings).

CMS's Inquiries to States, by Question Domain Included in Inquiry (Table)

As of June 8, two state responses have been made public. California and Maine have made their responses to CMS’s inquiries publicly available. Both states:

  • Provided detailed answers to CMS questions and additional context in response to the motivating factors described in the CMS letters.
  • Emphasized that the trends reported by CMS do not necessarily indicate fraud, waste, or abuse, but instead are the result of policy and payment choices (approved and often encouraged by CMS) to increase enrollees’ access to and use of certain services (e.g., home care and behavioral health services).
  • Characterized existing program integrity infrastructure and program integrity processes as robust, with multi-layered safeguards, reporting current practices often go beyond minimum federal requirements.
CMS-Identified High-Risk Services Areas, by State (Table)

What new provider revalidation actions have been initiated by CMS?

On April 23, 2026, CMS sent a letter to all 50 Governors and issued a State Medicaid Director (SMD) letter asking states to “swiftly” re-validate “high-risk” Medicaid providers and to develop a comprehensive two-year provider revalidation strategy to submit to CMS. Providers must meet certain state and federal requirements to be eligible to participate in the Medicaid program. States3 must screen every provider that applies to participate in Medicaid before the provider initially enrolls in Medicaid and again at renewal of a provider’s enrollment. Screening requirements increase based on the risk category assigned to the provider (by the state, within federal parameters).4 Under minimum federal requirements, all providers undergo license verification and are checked against federal databases. In addition to these screening and verification steps, moderate- and high-risk providers must pass a site visit, and high-risk providers must pass fingerprint background checks. Under minimum federal rules, a provider is designated “high-risk” according to criteria, including based on provider type (e.g. newly enrolling home health agencies and durable medical equipment (DME) suppliers) or past program integrity issues (e.g., excluded by HHS-OIG or a state Medicaid agency or subject to a payment suspension (based on credible allegation of fraud) within the past 10 years). Screening and verification activities are performed again during renewal of the provider’s enrollment. States must renew every Medicaid provider’s enrollment validation no less frequently than every five years.

CMS requested that states confirm whether they will immediately revalidate “high-risk” Medicaid providers. CMS acknowledges that factors contributing to fraud are multi-faceted and require a comprehensive approach to address; however, CMS notes revalidating high-risk providers immediately may help deter criminal actors and allow federal/state governments to suspend or terminate them from the program. CMS notes classes of Medicaid providers with less rigorous enrollment and billing requirements (e.g., CMS cites providers without a National Provider Identifier (NPI) are most vulnerable to fraud. States have flexibility to designate which providers are “high-risk,” though CMS expects the definition to include any provider without an NPI (Box 2).

CMS requested that states notify them of their intent to carry out immediate revalidation of high-risk providers within 10 days of receipt of the letter, along with a proposed timetable for revalidation. CMS noted that failure to immediately revalidate high-risk providers would be “considered as we [CMS] evaluate the likelihood of fraud in each state moving forward.” Some states have publicly expressed their intent to conduct accelerated, off-cycle provider revalidation exercise, while others have emphasized compliance with CMS’s request as part of a broader, coordinated fraud prevention effort.

Box 2. An NPI is a unique ID number that identifies the provider who referred, ordered, or delivered services billed on health care claims.

NPIs were introduced in 19965 to improve efficiency and reduce errors in electronic health care claims. Federal law requires an NPI from all medical providers (e.g. physicians, dentists, or nurses) and organizations (e.g. hospitals, pharmacies, or physician practices) who participate in electronic health care claims. Non-medical providers may deliver certain Medicaid services, particularly home care services; these providers may not have an NPI due to federal rules describing who is required and permitted to obtain an NPI.

CMS also requested that states develop a broader strategy on provider revalidations. CMS requested states develop and submit a comprehensive two-year provider revalidation strategy within 30 days of receipt of the letter as well as the strategy’s results upon completion. CMS notes the provider revalidation strategy should be tailored to the unique landscape of the state and prioritize a comprehensive review and revalidation of the state’s enrolled Medicaid providers. CMS asks states to increase oversight of high-risk providers (including by adopting off-cycle or more frequent revalidation intervals than the minimum five-year requirement and potentially prioritize high-risk providers who have not been screened within the past 12 months for revalidation.) CMS notes that states should define the scope and priorities of their provider revalidation strategies, but asked that certain elements be included:

  • Methodology and timeline for conducting off-cycle revalidation, with a focus on high-risk providers (including those without an NPI)
  • Metrics to measure the revalidation strategy effectiveness
  • Approach for confirming provider information is accurate and up to date, on an ongoing basis (across fee-for-service and managed care delivery systems) approach to coordinating with relevant law enforcement partners

How has HHS-OIG heightened scrutiny of state Medicaid fraud control units (MFCUs)?

On May 13, 2026, HHS Investigator General Bell sent a letter to every state Attorney General communicating a stance of “insistence on rigid MFCU compliance” with requirements and performance standards that will be enforced through “robust review” by the HHS-OIG. Each state must have a Medicaid Fraud Control Unit (MFCU) to investigate fraud and prosecute or refer to prosecution individuals or entities defrauding Medicaid. MFCUs are required to operate independently from state Medicaid agencies. MFCUs are usually a part of the State Attorney General’s office and are primarily funded by federal matching funds6 from HHS-OIG (not CMS). While MFCUs and state Medicaid agencies closely cooperate, each has distinct roles and responsibilities. MFCUs investigate potential Medicaid fraud/abuse. In 2025, MFCUs reported 1,185 convictions and $2 billion in recoveries (or $4.64 for every $1 spent). State Medicaid agencies implement a wide range of strategies to prevent and detect fraud, waste, and abuse. (For example, state Medicaid agencies screen and enroll providers, conduct data analytics and surveillance (e.g., to detect unusual billing patterns and outliers/anomalies), perform audits, and create fraud/abuse reporting channels for providers and enrollees.)

Federal requirements and performance standards serve as the basis for MFCU annual recertification by HHS-OIG (which oversees MFCUs). When a MFCU applies for annual recertification, the MFCU submits performance and budget data, including staffing, costs, case numbers and outcomes, and other information requested by HHS-OIG. HHS-OIG may conduct an onsite review of the MFCU. In the May 13 letter, the HHS-OIG communicated to states that “As your MFCU’s annual recertification deadline approaches, [HHS-OIG] will be reaching out … to review the effectiveness of your MFCU, as well as its compliance with program requirements,” further noting that “noncompliance with your MFCU obligations can take your State’s entire Medicaid program out of compliance.” While the letter from HHS-OIG does not communicate an upcoming policy change related to MFCU requirements, MFCUs may face increased scrutiny and pressure to produce enforcement outcomes that satisfy HHS-OIG. In June 2026, three weeks after 53 state/territory Medicaid Fraud Control Units (MFCUs) received notice that they would be under review, HHS announced that it is denying the Hawaii MFCU’s annual recertification, which discontinues federal funding for the Fraud Control Unit. A statement from the Governor confirmed the state’s Medicaid program remains in good standing.

What is the CRUSH Request for Information (RFI)?

On February 25, 2026, CMS issued a Request for Information (RFI) for the “Comprehensive Regulations to Uncover Suspicious Healthcare” (CRUSH) initiative. In this RFI, CMS requested information on how to strengthen program integrity efforts across CMS programs (e.g., Medicare, Medicaid, CHIP, and the Affordable Care Act Marketplace). RFI responses were due March 30, 2026. CMS requested information about specific topics, including:

  • Potential expansions or modifications to existing program integrity laws/rules
  • Enhanced provider enrollment and identity verification
  • State-level program integrity oversight, particularly of high-risk services

Responses to the RFI include potential actions the federal government could take to improve program integrity, including recommendations for how CMS can support states. While an RFI is an official process that agencies commonly use to collect information from the public to inform a future rule, the RFI does not commit CMS to take any specific action, and future rulemaking does not always occur nor lead to regulation taking effect. CMS or its contractors are likely still conducting comprehensive reviews of stakeholder responses to the RFI, but more than 500 responses to the RFI are publicly available. A variety of organization types responded to the RFI including respondents from health care industries, trade associations, policy research organizations, and advocacy groups.

The Medicaid and CHIP Payment and Access Commission (MACPAC), a nonpartisan federal legislative branch agency that provides recommendations to Congress, built upon the body of existing MACPAC work in their response. Recommendations included:

  • Comprehensively review existing federal requirements to reduce duplication and focus on requiring or supporting activities that deliver returns on investment
  • Enhance payment transparency and data sharing
  • Examine existing barriers to program integrity in managed care and promote successful state practices

Recent CMS action related to program integrity has been focused both on specific states as well as initiatives and requests that affect all states. Many open questions remain, including:

  • Whether future compliance actions or deferrals will impact states beyond Minnesota and California,
  • Whether state responses to CMS’s provider revalidation exercise will become public, including comprehensive details on how provider classes are categorized as “high-risk,”
  • What are the implications of the focus on providers without NPIs (will more non-medical providers obtain NPIs, or will there be fewer providers for certain services?)
  • Whether the OIG letter to state Attorneys General will lead to an increase in indictments, convictions, and fraud recoveries by state MFCUs,
  • Whether CMS pursues rulemaking or sub-regulatory action following the RFI,
  • Whether CMS and HHS-OIG have capacity to carry out recently announced activities,
  • Whether Congress will enact legislation changing current Medicaid program integrity requirements, and,
  • Whether increased oversight requires trade-offs with access to care or services.

  1. The FY 2025 MFCU Statistical Chart notes that “Recoveries are defined as the amount of money that defendants are required to pay as a result of a settlement, judgment, or prefiling settlement in criminal and civil cases and may not reflect actual collections. Recoveries may involve cases that include participation by other Federal and State agencies.” ↩︎
  2. On March 5, 2026, the House Committee on Energy and Commerce issued inquiries to 10 states requesting information about state Medicaid program integrity (Figure 2). ↩︎
  3. States are permitted to delegate provider screening responsibilities to managed care organizations but must maintain oversight of screening activities. ↩︎
  4. Federal law requires that states assign ‘limited,’ ‘moderate,’ or ‘high,’ risk categories to providers. States assign risk categories to providers based on several guidelines, including the Medicare risk category for that provider type, provider-specific risk factors (e.g., receiving a prior Medicaid overpayment), and audit findings assessing the fraud, waste, or abuse risk of a specific provider type. While federal rules establish minimum risk levels, states can choose to use higher risk levels across a provider type and can change a provider’s risk level based on new information (e.g., following credible allegations of fraud, waste, or abuse). ↩︎
  5. NPIs were introduced and mandated by the Health Insurance Portability and Accountability Act (HIPAA). ↩︎
  6. The federal government reimburses states for MFCU costs. States that have operated MFCUs for longer than 12 quarters receive reimbursement for 75% of allowable costs incurred operating a MFCU; states contribute the other 25% share. ↩︎

The Business of Health with Chip Kahn

Can AI Break the “Measurement Paradigm?”

June 9, 2026

Video

Audio

About this Episode


Episode 7, AI Series: How do we know if AI use in health care actually makes patients better? Chip talks with Dr. David Bates — a veteran physician leader at Mass General Brigham and the Brigham and Women’s Hospital and co-director of the Center for Artificial Intelligence and Bioinformatics Learning Systems — about measuring patient outcomes reliably and in real time to create a strong foundation for everything else in health care administration — clinical deployment, payment reform, consumer transparency, and accountability. David has spent his career at the center of this challenge and his research helped inform To Err Is Human: Building a Safer Health System, the landmark 1999 report by the U.S. Institute of Medicine that revealed the high frequency of preventable medical errors in health care.

The Host


Headshot photo of Chip Kahn wearing a navy blue suit with a red tie, red pendant on lapel, and glasses.

Sr. Visiting Fellow

Charles N. Kahn III is a senior visiting fellow at KFF. He is also a visiting senior fellow at the American Enterprise Institute and a nonresident senior scholar at the University of Southern California’s Schaeffer Center for Health Policy & Economics. He serves as co-chair of the international Future of Health collaborative.

Guest


Dr. David W. Bates is the Medical Director of Clinical and Quality Analysis, Information Systems at Mass General Brigham, and also serves as the Chief of the Division of General Internal Medicine and Primary Care at Brigham and Women’s Hospital. He is a Professor of Medicine at Harvard Medical School and Professor of Health Policy and Management at the Harvard School of Public Health, where he is the Co-Director of the Program in Clinical Effectiveness. Dr. Bates has been recognized for several years by Modern Healthcare magazine as one of the “100 most powerful” individuals in U.S. health care.

Resources


SERIES

This weekly podcast features insightful conversations between host Chip Kahn and his guests, who discuss the business of health care, connecting the dots between the health care business, policy, and patients.

The podcast’s first series on AI in health care illuminates how AI is changing health care, and features guests who are deploying this technology, managing its consequences, and designing policy around it.

An Update on Medicaid, Title X and Planned Parenthood

Published: Jun 8, 2026

Editorial Note: This brief expands and updates a prior KFF analysis on the impact of Title X and Medicaid funding on Planned Parenthood. 

Planned Parenthood clinics comprise a substantial portion of the nation’s reproductive health safety net. In recent years, actions across multiple branches of government—including federal agencies, Congress, the courts, and state governments—have placed considerable financial pressure on the organization, with implications for patient access to care. This pressure has primarily focused on the two main sources of public funding for these clinics: the federal Title X family planning program and Medicaid. This brief focuses on the status of these efforts as they affect Planned Parenthood clinics since 2025.

A series of federal policy and judicial actions in 2025 significantly restricted funding streams for Planned Parenthood affiliates. In the spring of 2025, the federal Title X family planning program withheld grant payments to 144 Planned Parenthood sites in 20 states. On June 26, 2025, the Supreme Court issued its decision in Medina v. Planned Parenthood South Atlantic. The ruling allowed state Medicaid programs to disqualify Planned Parenthood clinics from their networks of participating providers. Shortly thereafter, on July 4, 2025, the One Big Beautiful Bill Act (OBBBA) was enacted, establishing a one-year prohibition on federal funding for Medicaid reimbursements to Planned Parenthood clinics for services provided to Medicaid enrollees in all states. Collectively, these policy shifts have resulted in notable funding losses and financial instability for these clinics, with implications for health care access for low-income individuals and Medicaid beneficiaries who rely on them for family planning and preventive services.

In response to federal Medicaid and Title X funding restrictions, at least eleven states have enacted legislative measures or relied on executive action to use state-only funds to mitigate financial losses for Planned Parenthood and other reproductive health safety net clinics. State strategies varied from covering full funding gaps on an ongoing basis to appropriating specific emergency grants and supplemental allocations. For instance, California has committed over $230 million in state funds and emergency grants to stabilize its extensive network of clinics, while other states like Maine, New Jersey, Oregon, Connecticut, Illinois, Massachusetts, and New Mexico have authorized targeted allocations ranging from $2 million to $8 million to offset lost federal Medicaid and delayed Title X funds. Additionally, states like Colorado, New York, and Washington have implemented statutory mechanisms or supplemental budget proposals to guarantee continued state-level reimbursement for prohibited entities with the goal of preserving patient access to family planning, contraception, cancer screenings, and Sexually Transmitted Infection (STI) services for low-income and Medicaid beneficiaries. 

Eight Planned Parenthood grantees from Ohio, Northern and Southern New England, Utah, Virginia, North and South Carolina, and the Minnesota/Dakotas regions received the final year of Title X funding out of a five-year grant cycle in April of this year. However, a recently released FY27 Notice of Funding Opportunity for the next round of Title X Service Grants projects a change in programmatic priorities from contraceptive access and pregnancy prevention to fertility-awareness based methods and family formation, which could signal a shift in the types of entities funded by the Title X program. During the first Trump Administration, HHS not only revised the guidelines, they formally changed the Title X regulations so that clinics that offered abortion referrals or that had co-located abortion services were disqualified from participating in the program. Approximately one quarter of the Title X network, including over 400 Planned Parenthood clinics, across the country, stopped receiving Federal Title X support as a result of this policy. Many of the clinics later rejoined the Title X program after the Biden Administration reversed the Trump Administration regulations. While the Biden Administration regulations have not yet been rescinded by the current administration, it is still unknown whether the Trump Administration will change the Title X regulations to be similar to the first Trump Administration regulations that prohibited Title X funded clinics from having co-located abortion services and providing abortion referrals, but the new funding guidelines signal a shift in priorities.

Status of Planned Parenthood Network 

The Title X program supports a network of approximately 4,000 clinics across the country to offer free or reduced cost family planning services to low-income and uninsured people. Nationally, 247 Planned Parenthood clinics in 29 states, half (50%) of Planned Parenthood clinics nationwide, currently participate in the Title X program (Figure 1). This is down slightly from the 297 Planned Parenthood clinics that participated in the program a year ago in 34 states and DC. California, Texas, and Ohio saw the biggest decreases in Planned Parenthood participation in the Title X program. Other Title X grantees also include Planned Parenthood sites in their network of clinics.

Figure 1

Since January 2025, 57 Planned Parenthood clinics across 20 states have closed or consolidated with other sites. It is not clear how many of these closures are due to the losses in Medicaid and Title X funding or mergers with other clinics, but these closures reflect a reduction in access points for reproductive health care.

Planned Parenthood and Medicaid 

The Supreme Court’s Medina decision and the “One Big Beautiful Bill Act” that was signed into law in July 2025 both affect Planned Parenthood’s ability to serve and be reimbursed for care they provide to patients with Medicaid. It is still too soon to assess the direct impact of Medicaid and Title X actions on Planned Parenthood and the patients they serve, beyond clinic closure data. KFF has updated its previous analysis of Planned Parenthood family planning service provision, presented in an earlier brief, based on claims from the 2023 Transformed Medicaid Statistical Information System (T-MSIS) data, the newest data currently publicly available.  

Nationally, one in ten (10%) reproductive age women covered by Medicaid who received family planning services got their care at a Planned Parenthood clinic, which is similar to the 11% in 2021 (Figure 2). All state Medicaid programs are required to cover family planning services, which include contraception, STI services, Pap smears, and pelvic and breast exams free of cost-sharing to all their beneficiaries. The share of Medicaid beneficiaries using family planning services who rely on Planned Parenthood varies considerably by state, ranging from three in ten women with Medicaid in California (29%), to no women in North Dakota and Wyoming where Planned Parenthood does not have a presence.

In 2023, Planned Parenthood Clinics Provided Family Planning Services to Medicaid Beneficiaries in Almost All States (Choropleth map)

According to Planned Parenthood’s data, the majority of people go to Planned Parenthood clinics for contraceptive services, STI testing, pregnancy testing, and gynecological services. KFF analysis of national Medicaid claims finds that eight in ten female Medicaid beneficiaries ages 15 to 49 who got family planning care at a Planned Parenthood clinic in 2023 received contraceptive services and over half received STI services (Figure 3). More than half also got gynecological services like a Pap smear, HPV screening, or a pregnancy test. Many people receive multiple family planning services throughout a year, and Figure 4 shows the breadth of services provided to female and male Medicaid enrollees.

The Majority of Medicaid Beneficiaries Who Received Family Planning Services at a Planned Parenthood Clinic Received Contraceptive and STI Services (Column Chart)
Planned Parenthood Provides Millions of Preventive Health Services to Medicaid Enrollees in 2023 (Stacked Bars)

Looking Ahead 

The federal Medicaid funding ban for Planned Parenthood in the OBBBA is set to expire on July 4, 2026, but there have been discussions and proposals to attempt to extend it on Capitol Hill. While both the House and Senate 2026 Budget Resolutions do not extend the 2025 funding ban, continuing the ban is potentially on the table if Congress pursues a third budget reconciliation bill. In the absence of the funding ban, it is likely that some of the states that have attempted to restrict Medicaid funding to Planned Parenthood could exclude clinics from their Medicaid programs in light of the Supreme Court’s ruling on Medina v. Planned Parenthood South Atlantic. Finally, for the second year in a row, the president’s budget for 2027 does not include funding for the Title X program. While Congress is unlikely to approve all of the president’s budget proposals, funding for Title X and Planned Parenthood could become an issue in budget deliberations.  

Methods 

Data: This analysis used the 2023 Release 1 T-MSIS Research Identifiable Files, specifically the other services (OT) claims files merged with the demographic-eligibility (DE) files.  

Identifying Planned Parenthood Providers: To identify family planning services provided at a Planned Parenthood clinic the NPPES NPI Registry was used to search for Planned Parenthood and PPFA in the Organization Name field to create a list of Planned Parenthood organization NPIs. 

Identifying Family Planning Services: Diagnosis and procedure codes in the other services header and line claims files were used to identify the following family planning services: contraceptive services, STI services, gynecological services including Pap smear and HPV testing, as well as pregnancy testing. A family planning diagnosis was required for inclusion. A list of diagnosis and procedure codes is available upon request. 

State exclusion criteria: GA and IL were excluded due to data quality concerns. GA had unusable Billing Provider NPI data according to the DQATLAS. There were no Planned Parenthood providers identified in IL despite their extensive network of Planned Parenthood clinics, which leads us to believe there is an issue with the Billing Provider NPI. It appears that the Servicing Provider NPI is copied onto the Billing Provider NPI field in IL, making Billing Provider NPI unusable.

Medicare Advantage in 2026: Premiums, Out-of-Pocket Limits, Supplemental Benefits, and Prior Authorization

Authors: Meredith Freed, Jeannie Fuglesten Biniek, Anthony Damico, and Tricia Neuman
Published: Jun 5, 2026

People with Medicare have the option of receiving their Medicare benefits through the traditional Medicare program administered by the federal government or through a private Medicare Advantage plan, such as an HMO or PPO. In Medicare Advantage, the federal government contracts with private insurers to provide Medicare benefits to enrollees. Medicare pays insurers a set amount per enrollee per month, which varies depending on the county in which the plan is located, the health status of the plan’s enrollees, the plan’s quality star rating, and the plan’s estimated costs of covering Medicare Part A and Part B services.

The plans use the payments from the federal government to pay for Medicare-covered services, and in most cases, to also pay for supplemental benefits and reduced cost sharing, which are attractive to enrollees. Plans are able to offer these additional benefits, often without charging an additional premium for Part D prescription drugs or supplemental benefits, because in 2026, they receive an additional $2,664 per enrollee above their estimated costs of providing Medicare-covered services, according to the Medicare Payment Advisory Commission (MedPAC). This portion of plan payments, also called the rebate, has increased substantially in the last several years, more than doubling since 2018.

Plans are also able to lower costs, which help finance these supplemental benefits, through cost management tools, such as prior authorization requirements and provider networks. Prior authorization requirements are used to assess whether health care services are medically necessary before they are covered to reduce unnecessary costs, though they may also impose barriers to receiving care. Medicare Advantage plans often have a limited network of providers, which can restrict beneficiary choice of physicians and hospitals. More than half of Medicare Advantage beneficiaries are enrolled in HMO plans that typically do not cover out-of-network services.

This brief provides information about Medicare Advantage plans in 2026, including premiums, out-of-pocket limits, supplemental benefits, and prior authorization, as well as trends over time. A companion analysis examines trends in Medicare Advantage enrollment.

Highlights for 2026:

  • In 2026, three quarters (75%) of enrollees in individual Medicare Advantage plans with prescription drug coverage pay no premium other than the Medicare Part B premium, which is a selling point for enrollees, particularly those living on modest incomes. The average supplemental premium, including Medicare Advantage enrollees who pay no supplemental premium, is $15 a month. Individual Medicare Advantage plans are available to all beneficiaries with Medicare Part A and Part B, unlike special needs plans (SNPs) or group plans offered to retirees by an employer or union.
  • More than 6 in 10 enrollees in individual Medicare Advantage plans with prescription drug coverage are in HMOs (61%), 38% are in local PPOs, and less than 1% are in regional PPOs in 2026. HMOs generally only cover services provided in-network, but tend to have lower supplemental premiums, which were $12 a month, on average, in 2026. PPOs cover services received out-of-network, typically for higher cost sharing, and tend to charge higher supplemental premiums, which were $18 a month, on average, in 2026.
  • The average out-of-pocket limit for Medicare Advantage enrollees is $5,421 for in-network services and $9,825 for in-network and out-of-network services combined in 2026. The average out-of-pocket limit for in-network services is higher for PPOs ($6,592) than HMOs ($4,636). Traditional Medicare does not have an out-of-pocket limit, but Medicare Advantage plans are required to cap patient costs.
  • Most Medicare Advantage enrollees are in plans that offer supplemental benefits not covered by traditional Medicare, such as vision, hearing and dental. From 2025 to 2026, access to dental, vision, and hearing benefits for Medicare Advantage enrollees remained stable. However, there were decreases in the share of individual plan enrollees in plans providing over-the-counter benefits, meal benefits, remote access technologies, transportation benefits, and bathroom safety devices. The share of SNP enrollees in plans that offered in-home support services increased, while the share of SNP enrollees in plans that offered transportation benefits, bathroom safety devices, and remote access technologies decreased.
  • About one third of enrollees (31%) are in plans that also reduce the Part B premium ($202.90 per month in 2026), most often by less than $10 a month. Among enrollees in individual Medicare Advantage plans, nearly a third (32%) received a reduction in their Part B premium in 2026, the same as in 2025. Among enrollees in individual plans that offer reduced Part B premiums as a supplemental benefit, 39% are in plans that reduce premiums by less than $10 a month, while about 32% are in plans that reduce Part B premiums by $100 or more per month.
  • Nearly all Medicare Advantage enrollees (99%) are in plans that require prior authorization for some services, which is rarely used in traditional Medicare. Prior authorization is most often required for relatively expensive services, such as inpatient hospital stays (acute: 97%; psychiatric: 93%), skilled nursing facility stays (95%), Part B drugs (94%), and home health services (90%) and is rarely required for preventive services (6%).

In 2026, three quarters of Medicare Advantage enrollees (75%) are in plans with no premium other than the Part B premium.

In 2026, most people (75%) enrolled in individual Medicare Advantage plans with prescription drug coverage (MA-PDs) pay no premium other than the Medicare Part B premium ($202.90 in 2026) (Figure 1). The MA-PD supplemental premium includes both the cost of Medicare-covered Part A and Part B benefits and Part D prescription drug coverage. In 2026, 96% of Medicare Advantage enrollees in individual plans open for general enrollment are in plans that offer prescription drug coverage.
Distribution of Medicare Advantage Prescription Drug Plan (MA-PD) Enrollees, by Supplemental Premium, 2026 (Donut Chart)

Altogether, including those who do not pay a supplemental premium, the average enrollment-weighted supplemental premium in 2026 is $15 per month, and averages $8 per month for just the Part D portion of covered benefits, substantially lower than the average premium of $36 for stand-alone prescription drug plans (PDP) in 2026. Higher average PDP premiums compared to the MA-PD drug portion of premiums is due in part to the ability of MA-PD sponsors to use rebate dollars from Medicare payments to lower their Part D premiums. When a plan’s estimated costs for Medicare-covered services are below the maximum amount the federal government will pay private plans in an area (known as the benchmark), the plan retains a portion of the difference, known as the “rebate” (See How Medicare Pays Medicare Advantage Plans: Issues and Policy Options for additional information on how Medicare sets payment rates). According to MedPAC, rebates average nearly $2,400 per enrollee in 2026 for individual plans, with individual plans allocating $600 or 26% of these rebates for Part D benefits, including reducing Part D premiums.

For the 25% of beneficiaries in plans that charge a MA-PD premium (5.0 million), the average premium is $59 per month, and averages $40 for the Part D portion of covered benefits.

Supplemental premiums paid by Medicare Advantage enrollees steadily declined between 2015 and 2025 but increased slightly in 2026.

Average supplemental MA-PD premiums declined from $36 per month in 2015 to $13 per month in 2025, but increased to $15 per month in 2026 (Figure 2). Average supplemental MA-PD premiums have declined markedly for local PPOs, falling from $65 per month in 2015 to $15 per month in 2025, but increased to $18 per month in 2026. Supplemental premiums for HMOs have also declined steadily from $28 per month in 2015 to $11 per month in 2025, increasing slightly to $12 per month in 2026. Only regional PPOs, which represent a very small and declining share of enrollment, have seen an increase in plan premiums over this time from $36 per month in 2015 to $75 in 2025, increasing again to $89 per month in 2026.

More than 6 in 10 individual Medicare Advantage enrollees in plans with prescription drug coverage are in HMOs (61%), 38% are in local PPOs, and less than 1% are in regional PPOs in 2026. The reduction in supplemental premiums for nearly all plans is driven in part by the decline in supplemental premiums for local PPOs and HMOs, that account for a rising share of enrollment over this time period, as well as the increase in rebates paid by Medicare to these plans.

Since 2015, a rising share of plans estimate that their cost of providing Medicare Part A and Part B services (the “bid”) is below the benchmark, and as plan bids have declined, the rebate portion of plan payments has increased. Additionally, because rebates are adjusted for the health status of enrollees, rebates have increased as risk scores have increased. (A risk score is a measure that reflects an enrollee’s expected health care costs based on their health status and demographic characteristics, with higher risk scores translating to higher payments to plans.) As mentioned above, plans are allocating some of these rebate dollars to lower the Part D portion of the MA-PD premium. According to MedPAC, rebates for individual plans have increased from an average of about $924 per enrollee in 2015 to nearly $2,400 per enrollee in 2026. This trend contributes to greater availability of zero-premium plans, which brings down average premiums.
Average Monthly Medicare Advantage Prescription Drug Plan Supplemental Premiums, Weighted by Plan Enrollment, 2010-2026 (Line chart)

The average out-of-pocket limit for Medicare Advantage enrollees is $5,421 for in-network services and $9,825 for both in-network and out-of-network services (PPOs) in 2026.

Since 2011, federal regulation has required Medicare Advantage plans to provide an out-of-pocket limit for services covered under Parts A and B. In contrast, traditional Medicare does not have an out-of-pocket limit for covered services.

In 2026, the out-of-pocket limit for Medicare Advantage plans may not exceed $9,250 for in-network services and $13,900 for in-network and out-of-network services combined, though plans can offer lower limits than the maximum. These out-of-pocket limits apply to Part A and B services only, and do not apply to Part D spending, which has a separate out-of-pocket limit of $2,100 in 2026. The size of Medicare Advantage provider networks for physicians vary greatly across counties and across plans in the same county, with beneficiaries having access to about half of the physicians available to traditional Medicare beneficiaries in their area, on average.

In 2026, the average out-of-pocket limit for Medicare Advantage enrollees is $5,421 for in-network services, including those enrolled in both HMOs and PPOs. The average out-of-pocket limit both in-network and out-of-network services combined, which applies to just PPOs, is $9,825 (Figure 3).
In 2026, the Average Out-Of-Pocket Limits for Medicare Advantage Enrollees Are ,421 for In-Network Services and ,825 for In-Network and Out-Of-Network Services Combined (Bar Chart)

HMOs generally only cover services provided by in-network, and the average out-of-pocket (in-network) limit is $4,636. Enrollees in HMOs are generally responsible for 100% of costs incurred for out-of-network care, so typically do not have a limit for out-of-network services. These numbers also include about 6 million Medicare Advantage enrollees that are in HMO Point-of-Service plans (HMO-POS), which generally operate the same as HMOs, but give enrollees the option of receiving specified services outside of the HMO plan's provider network, though these services typically cost more than services received in-network and may require prior approval. PPOs cover services delivered by out-of-network providers but charge enrollees higher cost sharing for this care. The average out-of-pocket limit for in-network services for PPOs is $6,592.

Average out-of-pocket limits for in-network services generally declined between 2017 and 2023 but have increased since then, with average limit for in-network services decreasing by nearly $600 from 2017 ($5,253) to 2023 ($4,685), before increasing by about $700 from 2023 to 2026 ($5,421).

Most Medicare Advantage enrollees, including enrollees in special needs plans (SNPs), are in plans that offer some benefits not covered by traditional Medicare in 2026.

Virtually all enrollees in individual Medicare Advantage plans (those generally available to Medicare beneficiaries) are in plans that offer primarily health related supplemental benefits including eye exams and/or glasses (more than 99%), dental care (98%) hearing exams and/or aids (95%), and a fitness benefit (91%) (Figure 4). Similarly, most enrollees in SNPs are in plans that offer these benefits. However, benefits such as in-home support services are less common for enrollees in both individual plans (10%) and SNPs (38%). This analysis excludes employer-group health plans because employer plans do not submit bids, and available data on supplemental benefits may not be reflective of what employer plans actually offer.

Though these benefits are widely available, the scope of specific services varies. For example, a dental benefit may include preventive services only, such as cleanings or x-rays, or more comprehensive coverage, such as crowns or dentures. Plans also vary in terms of cost sharing for various services and limits on the number of services covered per year, many impose an annual dollar cap on the amount the plan will pay toward covered service, and some have networks of dental providers that beneficiaries must choose from.

SNPs restrict enrollment to beneficiaries with significant or relatively specialized care needs, or who qualify because they are eligible for both Medicare and Medicaid. Enrollees in SNPs have greater access than other Medicare Advantage enrollees to transportation (73% vs 22%), meal benefits (81% vs 65%), bathroom safety devices (60% vs 21%), over-the-counter benefits (98% vs 68%), and in-home support services (38% vs 10%). Enrollees in SNPs who are dually eligible for Medicare and Medicaid may also have access to similar benefits through Medicaid.

It is not known what share of enrollees have used these benefits because data are not yet available.
Share of Medicare Advantage Enrollees in Plans with Extra Benefits by Benefit and Plan Type, 2026 (Split Bars)

As of 2020, Medicare Advantage plans have been allowed to include telehealth benefits as part of the basic Medicare Part A and B benefit package – beyond what was allowed under traditional Medicare prior to the public health emergency, which has again been extended to December 31, 2027. Therefore, these benefits are not included in the figure above because their cost is not covered by either rebates or supplemental premiums. Medicare Advantage plans may also offer supplemental telehealth benefits via remote access technologies and/or telemonitoring services, which can be used for those services that do not meet the requirements for coverage under traditional Medicare or the requirements for additional telehealth benefits (such as the requirement of being covered by Medicare Part B when provided in-person). Less than half of enrollees in both individual plans and SNPs are in plans that offer remote access technologies (43% and 39%, respectively), and just 2% of enrollees in individual plans and 1% of enrollees in SNPs have access to telemonitoring services.

Nearly all Medicare Advantage enrollees are in plans that offer vision, dental, and hearing benefits, similar to 2025, while fewer are offered over-the-counter benefits, meals, remote access technologies, transportation, and bathroom safety devices.

In 2026, there were changes to the share of enrollees in plans that offer specific benefits compared to 2025. The same share of enrollees in individual plans are in plans that offer eye exams and/or eyeglasses, dental benefits, and hearing exams and/or aids (Figure 5). However, smaller shares of enrollees are in plans that offer over-the-counter benefits (68% in 2026 vs 79% in 2025), meal benefits (65% in 2026 vs 70% in 2025), remote access technologies (43% in 2026 vs 49% in 2025), transportation benefits (22% in 2026 vs 28% in 2025), and bathroom safety devices (21% in 2026 vs 32% in 2025).

For those in Special Needs Plans (SNPs), similar shares of enrollees are in plans that offer eye exams and/or eyeglasses, dental benefits, and hearing exams and/or aids compared to 2025. Larger shares of SNP enrollees are in plans that offer in home-support services (38% in 2026 vs 11% in 2025). However, smaller shares of SNP enrollees are in plans that offer transportation benefits (73% in 2026 vs 80% in 2025), bathroom safety devices (60% in 2026 vs 68% in 2025), and remote access technologies (39% in 2026 vs 46% in 2025).

Despite concerns that recent changes to Medicare Advantage payment may impact the availability of extra benefits, overall, Medicare Advantage enrollees have not experienced a substantial loss in access to supplemental benefits, particularly dental, vision, hearing, and fitness benefits. However, the availability of some supplemental benefits, such as those mentioned above, has decreased over the last few years, down from a peak in 2023. This analysis also does not account for any changes to the design of benefits, which could make benefits more or less generous, such as changes to eligibility for these benefits, networks of providers, required cost sharing, or the generosity coverage.

Additionally, while CMS collects data on the use and spending for supplemental benefits, these data are not currently available to researchers or consumers. Further, CMS does not collect detailed data on prior authorization requests and denials for these benefits.

Share of Medicare Advantage Enrollees In Plans with Select Extra Benefits, by Benefit and Plan Type, 2016-2026 (Small multiple column chart)

Nearly one-third (31%) of enrollees are in plans that offer a rebate against the Part B premium, though the dollar values of the rebates are often small.

In 2026, about one-third (32%) of individual plan enrollees were in plans that offer a Part B rebate, the same as in 2025. Although the Part B rebate is often used in Medicare Advantage marketing (sometimes described as “money back in your Social Security check”), for most enrollees, the dollar value of the rebate is small relative to the $202.90 standard Part B premium in 2026. Among the 6.7 million beneficiaries in an individual Medicare Advantage plan that provides a Part B rebate, 39% (2.6 million) are in plans that offer rebates of less than $10 a month, though about one-third (32%; 2.2 million) are in plans that offer rebates of $100 or more per month. (Figure 6). In other words, about 12% of all Medicare Advantage enrollees in individual plans get $10 a month off their monthly Part B premium, while 10% get $100 or more off their monthly premium.

In 2026, 30% of SNP enrollees were in plans that offer a Part B rebate, down from 44% in 2025. Among all SNP enrollees, 22% are in plans with a rebate of less than $10 a month. Most SNP enrollees are dually eligible for Medicare and Medicaid, and Medicaid pays the Part B premiums on their behalf (except in Puerto Rico). When dually-eligible individuals enroll in a Medicare Advantage plan with a Part B rebate, the state Medicaid program receives the Part B premium rebate payment from the plan (except in Puerto Rico).

Distribution of Part B Rebate Amounts Among Medicare Advantage Enrollees, 2026 (Split Bars)

Enrollees in SNPs are more likely to be in plans that offer Special Supplemental Benefits for the Chronically Ill (SSBCI) than other Medicare Advantage enrollees.

Beginning in 2020, Medicare Advantage plans have also been able to offer supplemental benefits that are not primarily health related for chronically ill beneficiaries, known as Special Supplemental Benefits for the Chronically Ill (SSBCI). In addition, Medicare Advantage plans participating in the Value-Based Insurance Design Model (which was discontinued at the end of 2025) also offered these non-primarily health related supplemental benefits to their enrollees, but used different eligibility criteria than required for SSBCI, including offering them based on an enrollee’s socioeconomic status (e.g., LIS eligibility) or whether the enrollee lives in an underserved area. While this analysis provides information on the share of Medicare Advantage enrollees in plans that offer these SSBCI benefits, data on how many beneficiaries use these benefits and how often they use them are not currently available.

In 2026, the share of Medicare Advantage enrollees offered SSBCI is highest for food and produce—8% of individual plan enrollees (1.8 million), and the vast majority (93%) of SNP enrollees (7.6 million) are offered this benefit (Figure 7).

The other SSBCI benefits that are most commonly offered are:

  • General supports for living (e.g., housing, utilities) (6% for individual plans vs 79% for SNPs)
  • Transportation for non-medical needs (5% for individual plans vs 36% for SNPs)
  • Pest control (3% for individual plans vs 26% for SNPs)
  • Meals beyond a limited basis (2% for individual plans vs 12% for SNPs)
  • A social needs benefit (e.g., community programs)(2% for individual plans vs 19% for SNPs)
  • Indoor air quality equipment and services (e.g., air conditioning units)(2% for individual plans vs 24% for SNPs)
  • Services supporting self-direction (e.g., power of attorney for health services, financial literacy classes) (2% for individual plans vs 6% for SNPs)
  • Complementary therapies (those offered alongside traditional medical treatment) (1% for individual plans vs 2% for SNPs)
  • Structural home modifications (0.04% for individual plans vs 5% for SNPs)
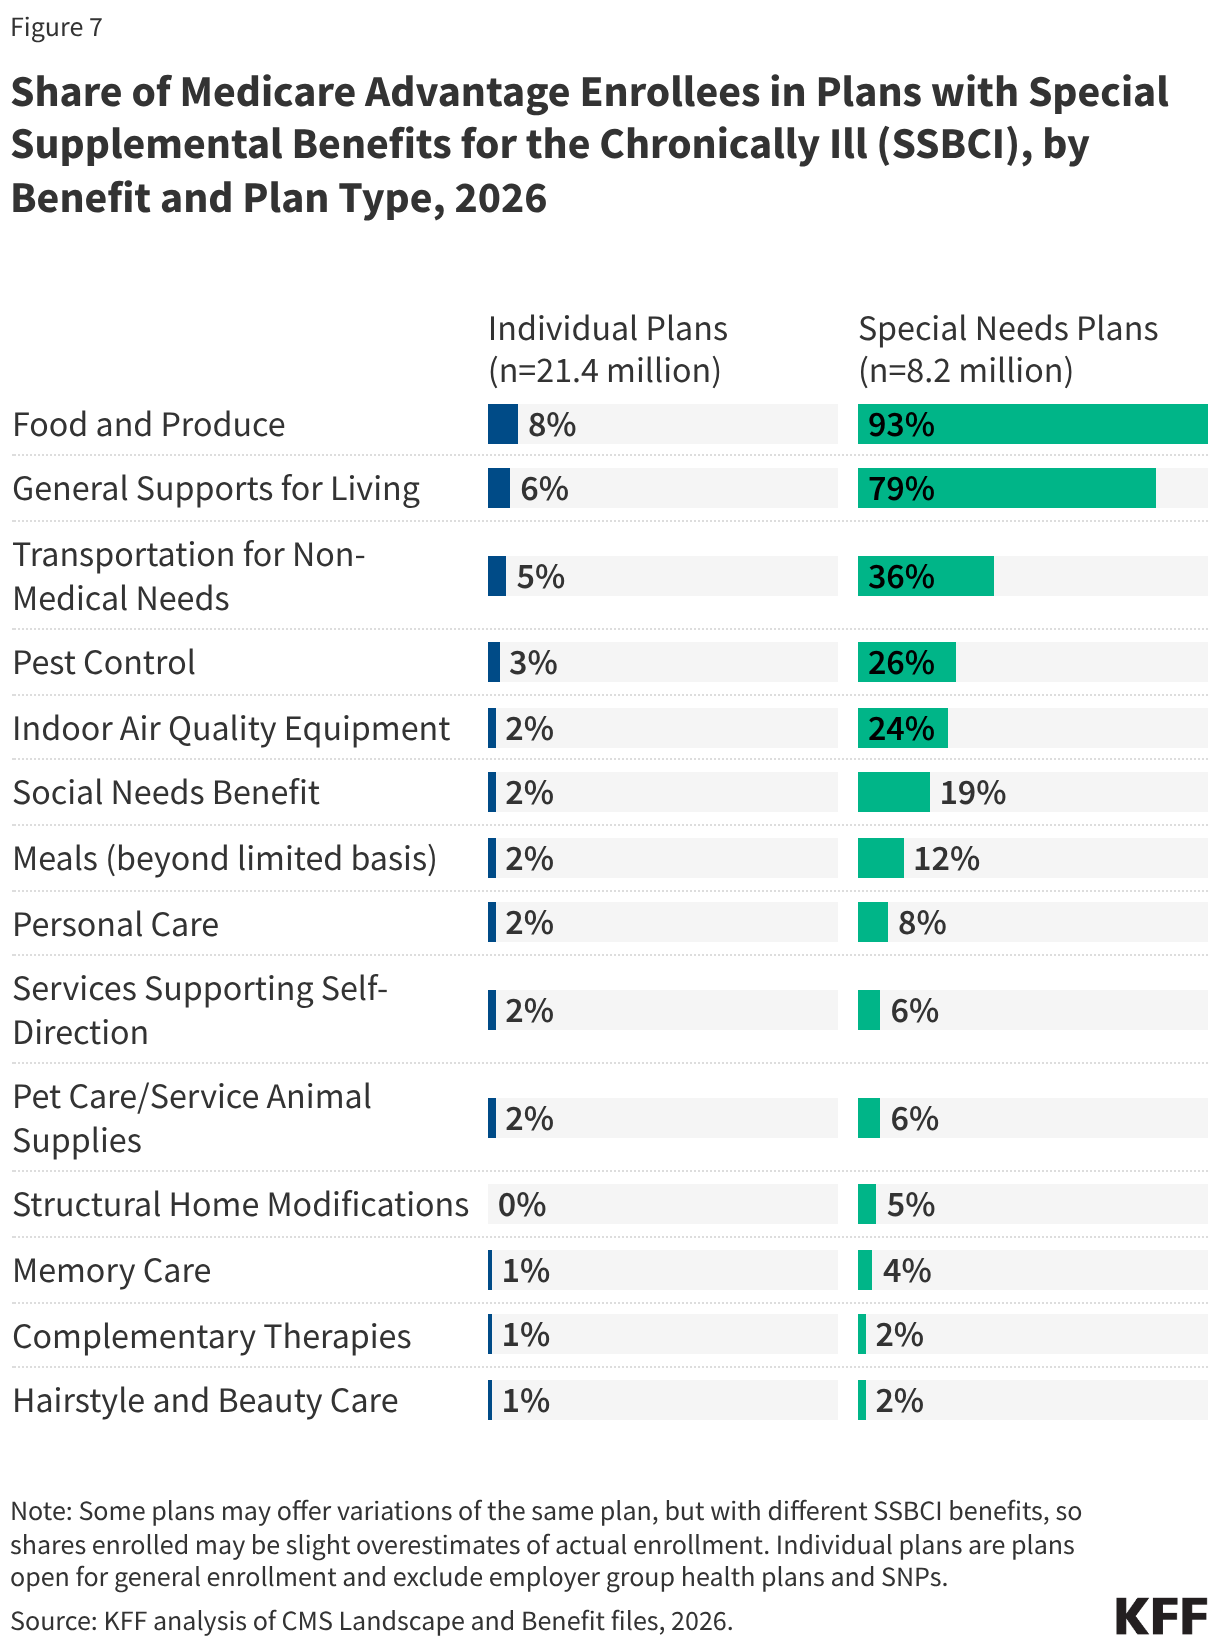
Share of Medicare Advantage Enrollees in Plans with Special Supplemental Benefits for the Chronically Ill (SSBCI), by Benefit and Plan Type, 2026 (Split Bars)

In addition to the 10 initially enumerated examples of SSBCI provided by CMS, plans are also able to offer “other” extra benefits specified by the plan, including pet care/service animal supplies (2% in individual plans and 6% for SNPs), personal care (2% in individual plans and 8% for SNPs), memory care (1% in individual plans and 4% for SNPs), and hairstyling and beauty care (1% in individual plans and 2% for SNPs). However, this is not an exhaustive list of additional benefits plans may offer.

While the share of enrollees with plans that offer some SSBCI benefits has increased since 2021, such as food and produce, growth for other benefits has been much slower.

Though the share of SNP enrollees in plans with food and produce benefits and general supports for living benefits has grown considerably since 2021, the share of enrollment in plans for other SSBCI benefits has grown much more slowly, particularly for enrollees in individual plans (Figure 8). For example, the share of SNP Medicare Advantage enrollees with food and produce benefits has more than quadrupled from 21% in 2021 to 93% in 2026—with the sharpest growth from 2024 (49%) to 2025 (94%)—while for individual plans, food and produce benefits are far less common. The share of enrollees with these benefits increased modestly from 2021 to 2023 (from 7% to 16%) but has declined back to 8% in 2026. For general supports for living benefits, the share of SNP Medicare Advantage enrollees with these benefits has also significantly increased from 10% to 79%—with the sharpest growth from 2024 (43%) to 2025 (80%)—while for individual plans, the share more than tripled to 2025, from 3% to 10%, but has declined back to 6% in 2026.

Like for other supplemental benefits, the scope of services for SSBCI benefits varies. For example, many plans offer a specified dollar amount that enrollees can use toward a variety of benefits, such as food and produce, utility bills, rent assistance, and transportation for non-medical needs, among others. This dollar amount is often loaded onto a flex card or spending card that can be used at participating stores and retailers, which can vary depending on the vendor administering the benefit. Depending on the plan, this may be a monthly allowance that expires at the end of each month or rolls over month to month until the end of the year, when any unused amount expires.

Share of Medicare Advantage Enrollees in Plans with Special Supplemental Benefits for the Chronically Ill (SSBCI), by Benefit and Plan Type, 2021-2026 (Split Bars)

Nearly all Medicare Advantage enrollees are in plans that require prior authorization for many higher-cost services.

Medicare Advantage plans can require enrollees to receive prior authorization before a service will be covered, and nearly all Medicare Advantage enrollees (99%) are in plans that require prior authorization for some services in 2026 (Figure 9). Prior authorization is most often required for relatively expensive services, such as inpatient hospital stays (acute: 97%; psychiatric: 93%), skilled nursing facility stays (95%), Part B drugs (94%), and home health services (90%) and is rarely required for preventive services (6%). Prior authorization is also required for the majority of enrollees for some extra benefits (in plans that offer these benefits), including preventive dental services, and hearing and eye exams.
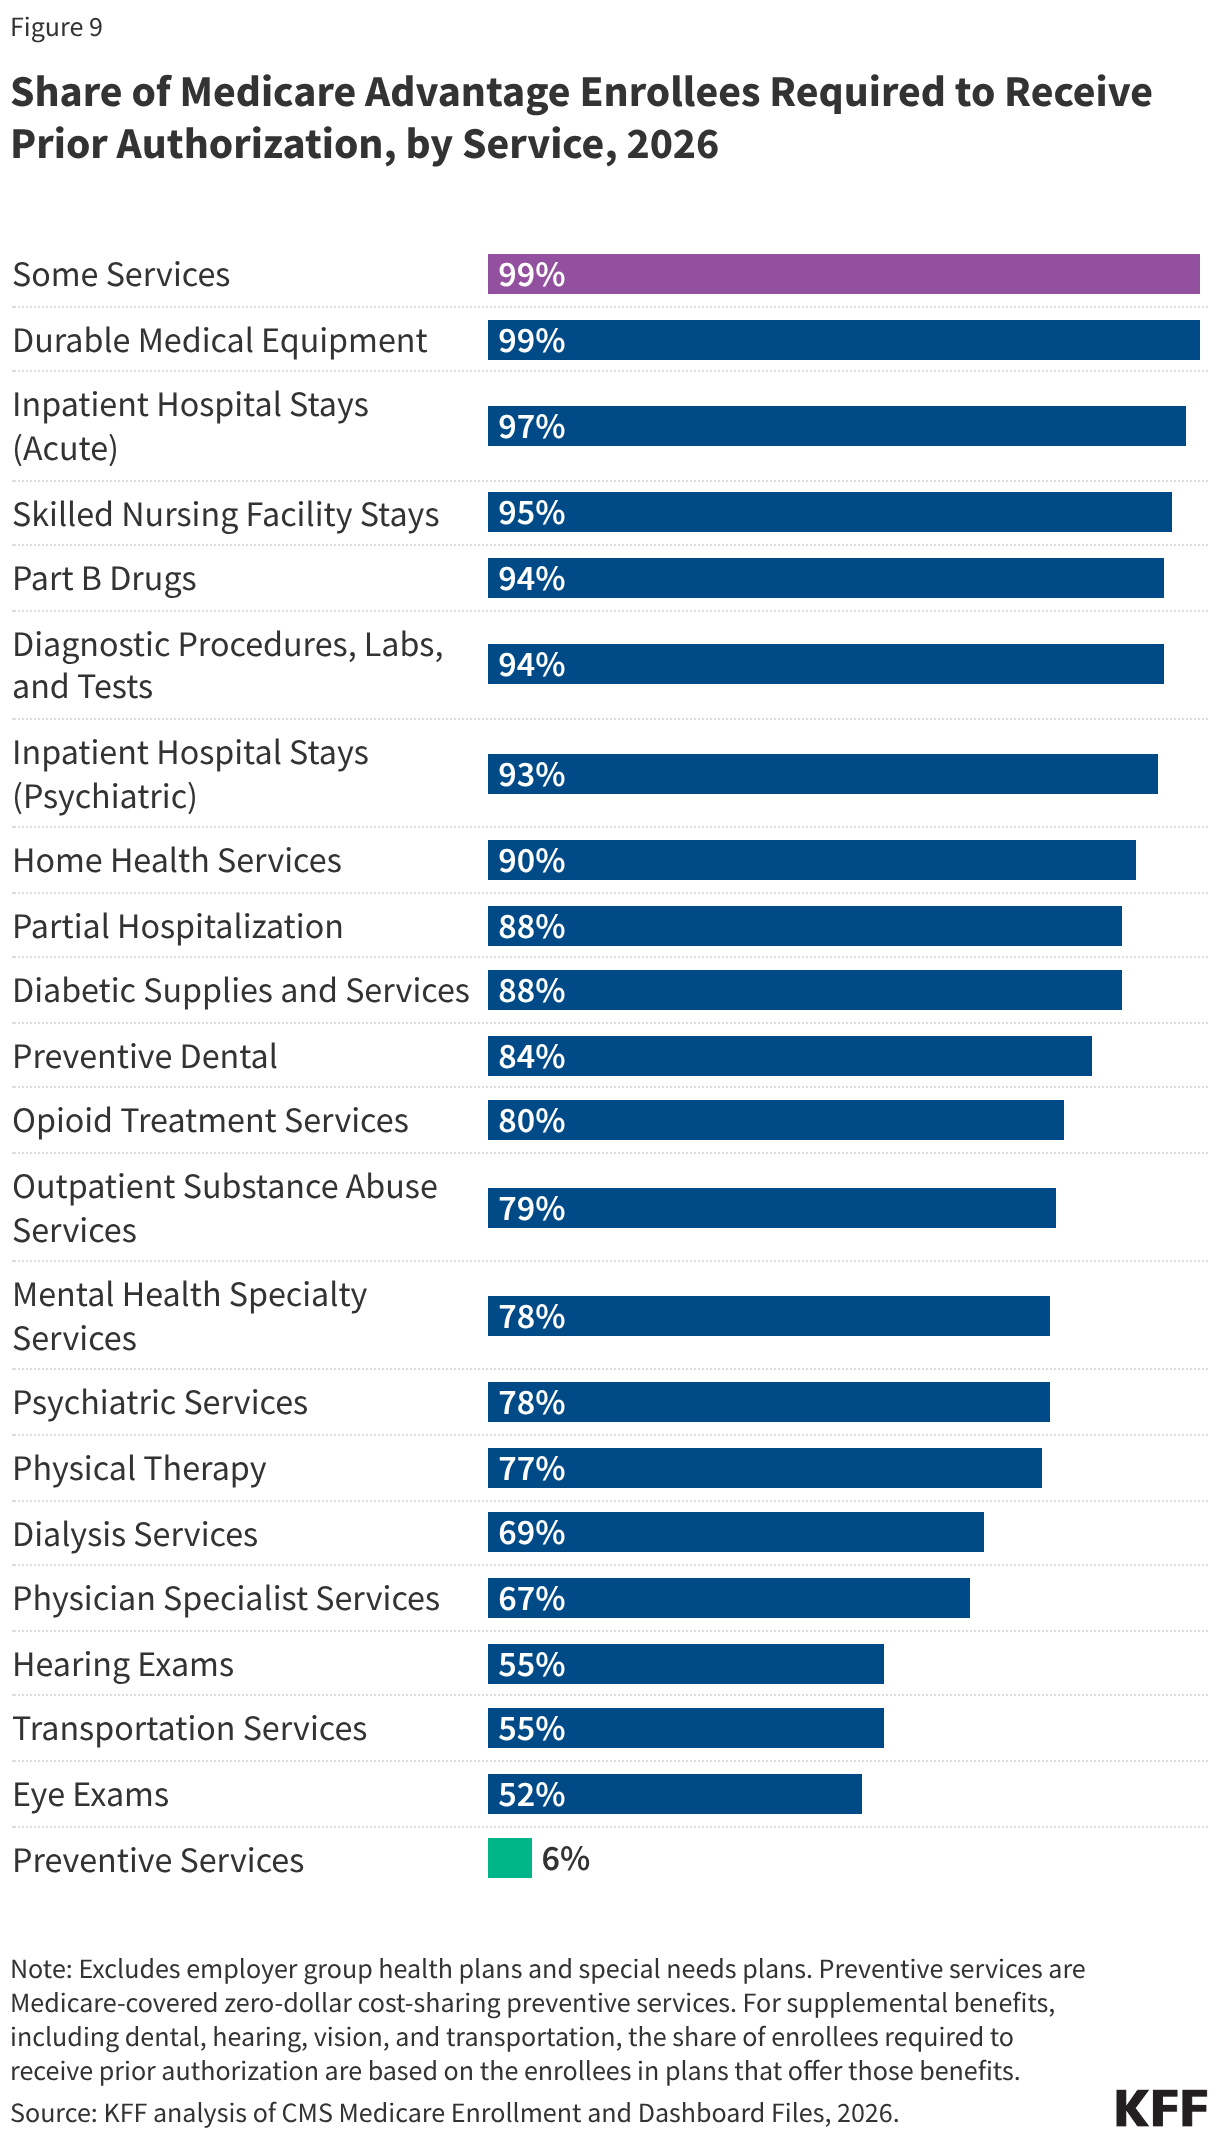
Share of Medicare Advantage Enrollees Required to Receive Prior Authorization, by Service, 2026 (Bar Chart)

The number of enrollees in plans that require prior authorization for one or more services stayed around the same from 2025 to 2026. In contrast to Medicare Advantage plans, traditional Medicare does not generally require prior authorization for services and does not require step therapy for Part B drugs. However, the Center for Medicare & Medicaid Innovation (CMMI) is testing a new model, the Wasteful and Inappropriate Service Reduction (WISeR) Model, that uses technologies such as artificial intelligence to apply prior authorization for a limited set of services in six states in traditional Medicare.

In 2024, nearly 53 million prior authorization requests were submitted to Medicare Advantage insurers, with insurers denying 4.1 million or nearly 8% of those requests. While Medicare Advantage insurers are required to publish some data on timeliness and use of prior authorization, information is not currently available on how prior authorization requests, denials, and appeals vary by type of service, plan, or enrollee characteristics because CMS does not collect or report this information.

Methods

This analysis uses data from the Centers for Medicare & Medicaid Services (CMS) Medicare Advantage Enrollment, Benefit and Landscape files for the respective year.

In previous years, KFF had used the term Medicare Advantage to refer to Medicare Advantage plans as well as other types of private plans, including cost plans, PACE plans, and HCPPs. However, since 2022, KFF has excluded cost plans, PACE plans, HCPPs in addition to MMPs. We exclude these other plans as some may have different enrollment requirements than Medicare Advantage plans (e.g., may be available to beneficiaries with only Part B coverage) and in some cases, may be paid differently than Medicare Advantage plans. These exclusions are reflected in both current data as well as data displayed trending back to 2010.

In previous years, KFF’s analysis of average out-of-pocket limits in Medicare Advantage excluded HMOs that are Point-of-Service plans (HMO-POS), which allow out-of-network care for certain services, because they represented a relatively small share of HMO enrollment at the time (e.g., 10% in 2017). However, HMO-POS enrollment has grown substantially and now accounts for nearly half (46%) of HMO enrollment in Medicare Advantage. As a result, these plans are included in the current analysis to better reflect the experience of a substantial share of Medicare Advantage enrollees in HMOs. 

Meredith Freed, Jeannie Fuglesten Biniek, and Tricia Neuman are with KFF. Anthony Damico is an independent consultant.