KFF designs, conducts and analyzes original public opinion and survey research on Americans’ attitudes, knowledge, and experiences with the health care system to help amplify the public’s voice in major national debates.
Analysis: A Proposal Like Biden’s Health Plan Would Lower the Cost of ACA Marketplace Coverage for Nearly All Potential Enrollees and Lower Premiums for Over 12 Million Workers With Employer Coverage
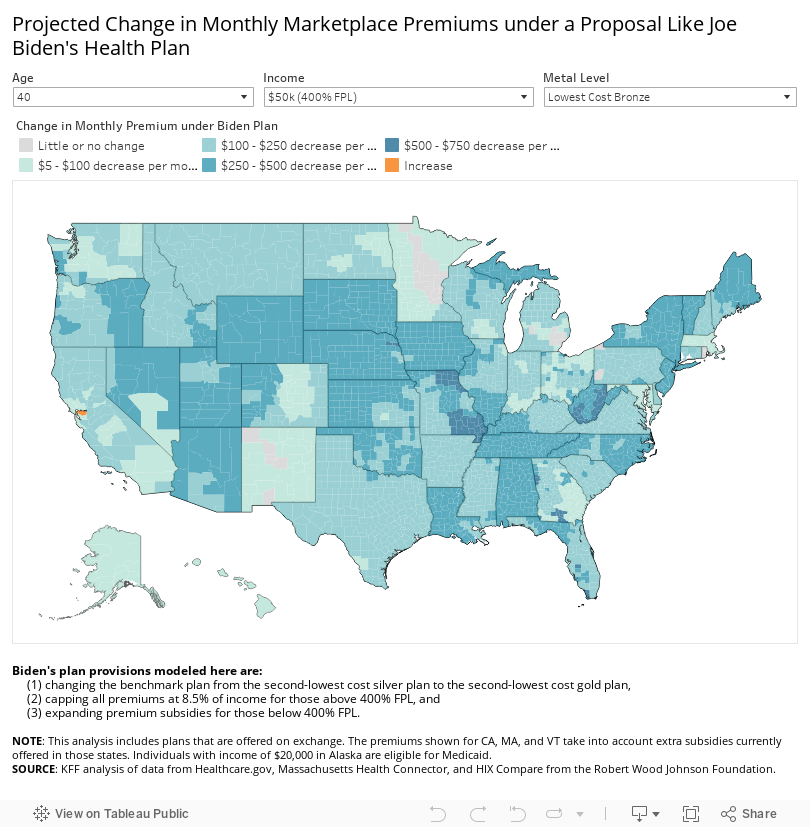
Interactive Maps Show Affordability of 2020 Marketplace Premiums by County, and Projected Changes Under a Proposal Like Biden’s
A new KFF analysis finds that expanding Affordable Care Act (ACA) premium subsidies like Democratic presidential nominee Joe Biden has proposed would lower the cost of Marketplace coverage for nearly all potential enrollees, including the uninsured and others currently priced out of the Marketplace.
While the former Vice President’s plan to create a public option has received substantial public attention, his companion proposal to expand ACA marketplace subsidies has been less discussed, even as it has the potential to affect the affordability of health insurance for many Americans. The plan is also projected to more than double federal marketplace spending, according to Biden campaign officials.
Premium savings would be greatest for older people with incomes just above $400% of poverty, where current subsidy eligibility cuts off. A 60-year-old making $50,000 would go from paying $1,029 on average per month for the second-lowest cost gold plan to paying $354 per month under a Biden-like proposal, a savings of $675 (or 66%) per month.
The cost savings would be even more substantial for people living in rural areas, where premiums are often higher. Currently, a 60-year-old making $50,000 in Floyd County, Georgia would pay $1,903 per month (45.7% of income) for the second-lowest-cost gold plan; a Biden-like proposal would reduce his monthly costs to $354 for the same level of coverage (8.5% of income).
Under the current law, the maximum premium contribution is capped at just under 10% of income and is benchmarked to a mid-level silver plan. Biden’s plan caps premium contributions at 8.5% of an enrollee’s income for a benchmark gold plan, making lower-deductible plans more affordable for consumers. The proposal also removes the upper income limit on premium subsidies, eliminating the so-called “subsidy cliff,” after which people making more than 400% of poverty ($49,960 for an individual, or $103,000 for a family of four) must pay the full price for their coverage.
The analysis focuses on Biden’s plan to enhance premium subsidies under the ACA. His plan also includes a new public option, available through the Marketplace and administered by Medicare, which would provide zero-premium coverage to adults in the Medicaid coverage gap – those with incomes below 138% of poverty, but living in states that have not expanded Medicaid under the ACA.
Additionally, people with employer-based coverage would be allowed to buy into the public option or enroll in another Marketplace plan if the cost of the coverage offered by their employer exceeds Biden’s proposed premium cap of 8.5% of household income. KFF estimates that 12.3 million people could save money by switching to a Marketplace plan under a proposal like Biden’s plan.
The issue brief includes interactive maps that allow users to see the most and least affordable ACA premiums by county in 2020, and how premiums would be projected to change if Biden’s proposed reforms were implemented. The analysis does not account for how the creation of a public option may impact pricing across the Marketplace, including Marketplace subsidies or the net cost of non-benchmark plans, nor does it estimate the increase in federal spending necessary to fund Biden’s plan.
The Affordable Care Act (ACA) has led to historic decreases in the uninsured rate, but about 11% of non-elderly Americans remain uninsured and the ACA Marketplaces can have high premiums and deductibles. Left out of the ACA’s affordable coverage expansion are those who buy their own insurance on the individual market but are ineligible for financial assistance. The ACA’s premium tax credits hold down premium payments for Marketplace shoppers whose incomes are between one and four times the federal poverty level ($12,490 – $49,960 for an individual in 2020). This subsidy structure has led to a lack of affordable individual market coverage options for people below poverty who live in states that do not expand Medicaid, and people shopping for their own coverage with incomes just above 400% of poverty across all states. In addition, people who are eligible for ‘affordable’ employer-sponsored insurance are ineligible for marketplace subsidies under current law. However, workers can be required to contribute as much as 9.78% of their household income for self-only coverage under an ‘affordable’ job-based plan, an amount much greater than some low-wage workers would have to pay for a subsidized marketplace plan were they eligible, and there is no limit on what workers with families might have to pay in premiums for employer coverage.
In years when there have been steep increases in exchange premiums, those receiving a subsidy have been protected from premium hikes, while those ineligible for subsidies face the full increase and may be priced out of coverage. Enrollment in the individual market increased from about 11 million before the ACA to a peak of 17 million in 2015 and 2016. Steep premium increases for the 2017 and 2018 plan years coincided with sharp reductions in signups, particularly among people not receiving subsidies. Currently, more than 13 million people are enrolled in individual market coverage.
Additionally, high deductibles have created affordability challenges even for those with premium subsidies. The ACA includes an additional type of financial assistance, called a cost-sharing subsidy, which brings down deductibles and copayments, but only Marketplace purchasers whose incomes are between 1 and 2.5 times the poverty level are eligible for this help. People outside of this income range typically face deductibles of several thousand dollars or more, with silver (mid-level plan) deductibles reaching an average of about $4,450 for a single person in 2020. High deductibles can also discourage people from enrolling in coverage in the first place.
While there is general agreement that high premiums and deductibles for those without a subsidy are critical problems facing the ACA Marketplace, the 2020 presidential candidates differ in their proposed solutions. President Trump has advocated repeal of the ACA and his administration currently supports a lawsuit that would overturn the law. If successful, the lawsuit could lead to significant coverage losses. President Trump has also expanded the availability of short-term plans, which have lower premiums than ACA-compliant plans because they do not have to follow the ACA’s rules, particularly coverage of pre-existing conditions. Short-term plans do not qualify for ACA premium subsidies, but the Trump administration has issued guidance allowing state waivers that would redirect premium subsidies to short-term plans under certain circumstances.
Former Vice President Joe Biden, on the other hand, has supported building on the ACA framework by expanding subsidies and creating a new public option. While Biden’s public option proposal has received significant attention, his proposal to expand ACA premium subsidies has not been the subject of much public discussion or analysis, especially his plan to extend eligibility for subsidies to people with employer coverage. In this analysis, we examine current insurance affordability challenges under the ACA, and the effects of a proposal like Biden’s to expand subsidies for people currently purchasing Marketplace or employer coverage. We find that:
The cost of ACA Marketplace coverage would be lower for nearly all current Marketplace enrollees, as well those who are currently priced out of the market.
A 40-year-old making $50,000 would go from paying $522 per month for the second-lowest cost gold plan to paying $354 per month under a Biden-like proposal, a savings of $168 (or 32%) per month.
More than 12 million people with employer-based insurance would pay a smaller share of their income towards premiums by switching into a Marketplace plan under premium caps similar to those Biden has proposed.
While a proposal like Biden’s would make coverage more affordable for a significant number of people, they would also increase federal spending, which we do not attempt to estimate here. The Biden campaign has estimated that Biden’s health plan would more than double federal Marketplace spending over 10 years.
How Affordable are Marketplace Plans under Current Law?
The map below shows premium affordability for people with various incomes and ages under current law. The ACA provides sliding scale subsidies that cap an individual’s required premium contribution toward a benchmark plan (the second-lowest-cost silver plan) at a certain percent of one’s income. The amount of premium tax credit equals the actual cost of the benchmark plan minus the individual’s required contribution. Premium tax credits are available to Marketplace purchasers whose incomes are between 100% and 400% of the federal poverty level. Cost-sharing reductions are available to Marketplace shoppers who have incomes between 100% and 250% of poverty. Those whose income is below 150% of poverty receive the most generous cost-sharing assistance, though in states that have expanded Medicaid most of this group are enrolled in Medicaid rather than the Marketplace.
Marketplace participants can apply their premium tax credits to other plans that are more or less expensive than the benchmark plan. For example, someone may decide to enroll in the cheapest bronze plan offered on the marketplace and, if the premium tax credit amount equals or exceeds the cost of that plan, she can enroll for free. Approximately 4.7 million uninsured individuals were eligible for zero premium bronze plans at the start of 2020. The tradeoff, however, is that bronze plans typically have much higher deductibles ($6,500 on average). Cost-sharing subsidies are only offered through silver-tier marketplace plans. A consumer might also decide to enroll in a plan that costs more than the benchmark plan – for example, she might prefer a more expensive gold plan with a lower deductible; on average, gold plan deductibles are about $1,500 per year for an individual. If so, the net premium payment after applying the tax credit will be more than the benchmark plan would have cost.
For people receiving both premium and cost-sharing assistance, ACA Marketplace plan subsidies are more comprehensive. For example, the average 60-year-old making $20,000 (160% of poverty) pays $77 per month (less than 5% of their income) on a silver plan, and has a deductible of less than $800.
Those with higher incomes who are still within the subsidy range face higher costs. For example, at a $49,000 income (392% of poverty), the typical 60-year-old would pay $399 per month (just under 10% of their income) with a typical deductible approaching $4,450 for the same silver plan. This person is still receiving a monthly subsidy of $579 for help paying the premium, but they are not eligible for a reduced deductible.
Marketplace shoppers who are not eligible for any assistance face high and rising costs. If a 60-year-old’s income is $50,000 (just over 400% of poverty), she is no longer eligible for subsidies and would have to pay full price for a silver plan – $979 per month, or 23% of her income, with a deductible of about $4,450. This is an example of the so-called “subsidy cliff,” described more below and shown in Figure 3. The subsidy cliff is less pronounced for younger enrollees. People ineligible for subsidies can reduce premium costs by choosing a less expensive bronze plan, though this would not necessarily eliminate the subsidy cliff. The national average premium for the lowest cost bronze plan in 2020 for a 60-year old costs $622 per month, or nearly 15% of gross income for someone earning $50,000 (Figure 3). In addition, deductibles under bronze plans are even higher, averaging $6,506 in 2020.
Figure 1
What Changes would Biden Make to ACA Marketplace Subsidies?
In this portion of the analysis, we focus on the effects of Joe Biden’s health plan on people who are currently purchasing their own coverage, or who would be purchasing this coverage but have been priced out. Biden has proposed building on the ACA by increasing the amount of financial assistance and expanding subsidy eligibility beyond the current range of 100-400% of poverty for Marketplace purchasers. In his plan, Biden would peg the benchmark for premium tax credits to the second-lowest cost gold plan instead of the current silver benchmark, meaning premium subsidies would be higher and Marketplace purchasers could more easily afford a lower-deductible plan.
Biden would reduce the maximum premium contribution cap to 8.5% of an enrollee’s income for a benchmark gold plan (currently the cap on enrollees’ contributions toward the benchmark silver plan is just under 10% of income). He would also remove the upper income limit on premium subsidies, extending the new 8.5% premium cap to higher-income enrollees, and so eliminating the “subsidy cliff.”
The Biden plan presumably would lower the required contribution for subsidy-eligible individuals at all income levels. Though his plan does not specify amounts, this analysis assumes required contribution amounts described in H.R. 1884, a measure passed in the House of Representatives in 2020 that also caps required individual premium contribution amounts at 8.5% of income and eliminates the subsidy cliff. In this bill, for example, people with income of 160% FPL, who must contribute 4.59% of their income toward the cost of the benchmark plan under current law, would only have to contribute 2.4% of their income toward the cost of the benchmark plan.
In addition, Biden would allow workers with an offer of job-based coverage to enroll in Marketplace plans with subsidies if that would be a better deal. Under current law, employees qualify for Marketplace subsidies only if their employer’s plan is deemed unaffordable or does not satisfy minimum coverage requirements. Employer coverage is considered unaffordable if the worker’s premium contribution for self-only amounts to more than 9.78% of household income. The affordability test for employer-sponsored coverage offered to family members also is based on the cost of self-only coverage. As a result, if an employer pays the full premium for its workers but contributes nothing toward the cost of family coverage, family members are still considered to have an offer of “affordable” employer-sponsored coverage and so are ineligible for Marketplace subsidies; this is sometimes referred to as “the family glitch.” (See below for analysis of how many people with employer coverage could benefit from this change.)
Biden would also create a public option that would be open to all Marketplace participants. People who live in states that have not adopted the ACA Medicaid expansion and who make less than 138% of the poverty line would be automatically enrolled in the public option with no premium. The public plan would also negotiate payment rates with doctors and hospitals with a goal of reducing overall health plan costs.
Biden’s campaign estimates that his plan would bring the uninsured rate down to 3%. In addition to the subsidy expansion and public option components of his plan, Biden has said that he would reinstate the individual mandate penalty, pass legislation to protect patients from surprise bills, block mergers that threaten competition in the health care industry, and allow the federal government to negotiate pharmaceutical prices.
How would a proposal like Biden’s affect premiums for people buying their own coverage?
We find that, by implementing a proposal like Biden’s to benchmark premium tax credits to the cost of more generous gold plans and capping premium payments at 8.5% of income, many individuals currently purchasing their own insurance could pay lower premiums for more generous coverage.
Average premium changes: On average across the U.S., a 40-year-old person making $20,000 (160% of poverty) would go from paying $139 to $39 per month for the second-lowest cost gold plan. A 40-year-old making $45,000 (360% of poverty) would go from paying $429 per month for the second-lowest cost gold plan under current law to $296 per month under a Biden-like proposal, a savings of 31% or $133 per month. A 40-year-old who makes $50,000, and thus is currently unsubsidized, would go from paying $522 per month to paying a subsidized premium of $354 for a gold plan.1
The savings would be largest for older enrollees whose incomes are just above the current subsidy threshold. For example, a 60-year-old making $50,000 (just over 400% of the poverty line) would go from paying an average of $1,029 per month (25% of income) to $354 (8.5% of income) for a gold plan, a savings of 66% (Table 1).
Table 1: National Average Change in Monthly Premium and Annual Deductible for Enrollee at $50,000 Income(Just over 400% of Poverty)
Bronze Plan (Typical Deductible of $6,500)
Gold Plan (Typical Deductible of $1,500)
Current Law
Biden’s Proposal
% Change
Current Law
Biden’s Proposal
% Change
60 year old
$622
$30
-95%
$1,029
$354
-66%
40 year old
$324
$160
-51%
$522
$354
-32%
27 year old
$272
$186
-32%
$437
$349
-20%
Note: This table shows enrollment-weighted average premiums for the lowest-cost bronze plan and the second-lowest cost gold plan in each county, based on premiums in effect in 2020. The payment for the second-lowest cost gold plan under the Biden plan would be set as a certain percent of one’s income. Estimated costs of bronze plans do not take into account any impact of the new public plan option on premiums or subsidy amounts.
Importantly, in addition to lowering what people would pay in premiums for marketplace plans, the Biden proposal would mean that many people could more easily afford to purchase more generous Marketplace plans with lower deductibles. For example, using national average Marketplace plan premiums, a 40-year-old making $50,000 (just above the subsidy range under current law) would go from paying $522 per month (nearly 13% of her income) to paying $354 per month (8.5% of her income, a savings of 32%) for a gold plan with a typical deductible of about $1,500.
County-by-county premium changes: The cost difference is particularly dramatic for middle-income enrollees who are older and those living in rural areas, where premiums tend to be higher. On average, a 60-year-old making $50,000 would go from paying $888 per month (21.3% of her income) for a silver plan to $354 monthly (8.5% of her income) for a gold plan. A 40-year-old making $50,000 in Floyd County, Georgia, would go from paying $896 monthly (21.5% of her income) for the second-lowest cost gold plan to paying $354 monthly (8.5% of her income), a yearly savings of $6,504. The map below shows the effects on premiums of a plan that benchmarks premium subsidies to the second-lowest cost gold plan in each county, caps premium payments at 8.5% of income, and further enhances premium subsidies for the current subsidy-eligible population (Figure 2).
It is important to note that the premium estimates in this paper do not account for the potential impact of Biden’s proposed public option plan on Marketplace subsidies and the net cost for a non-benchmark plan. It is not yet known how the public option will be factored into the benchmark plan calculations or the extent to which the public option plan will be able to negotiate lower payment rates with doctors or hospitals, both of which could impact pricing across the Marketplace. These limitations are discussed further in the methods section.
Elimination of the “subsidy cliff”: Savings are most pronounced for older, middle- and upper-middle income enrollees because, under Biden’s proposal, there would no longer be a subsidy cliff. Currently, the subsidy cliff is most extreme for older enrollees due to age rating: On average, a 60-year-old making just above the subsidy range pays 15% of their income for a bronze premium, but this payment would drop to around 1% of their income under Biden’s plan as the enrollee would become eligible for financial assistance (Figure 3). Premium subsidies would gradually taper off at higher incomes where they are no longer needed to make plans affordable.
Figure 3
Biden’s proposed changes would have varying impacts in different parts of the country, depending in large part on the prices of gold plans currently, and what those prices are relative to the cost of other metal tiers. In general, the largest gains in affordability would go to middle and upper-middle-income, older enrollees living in rural areas since this group typically pays the highest premiums under current law, and to many people below the poverty line who live in states that have not expanded Medicaid (those in the “Medicaid gap”) since they are currently not eligible for Marketplace subsidies despite their low incomes.
Since Biden’s plan does not place an upper income limit on subsidy eligibility, an older adult in Lowndes County, Georgia, where gold plans are the most expensive in the country, could theoretically receive a subsidy even if their income exceeds $300,000 per year. Currently, under the ACA, a hypothetical 64-year-old with a $300,000 income in Lowndes County, Georgia would pay $2,692 per month for a gold plan, or 11% of their income; this would drop to $2,125 (8.5% of their income) under a plan like Biden’s. This is an extreme hypothetical scenario and it is unlikely a person with this income would be purchasing their own coverage, but it demonstrates how unaffordable premiums can be under current law for people who are not receiving subsidies.
Premium subsidy changes for other groups: Adults who are in the Medicaid coverage gap – whose income is too low to qualify for Marketplace subsidies and who live in states that have not expanded Medicaid – would see the largest gains in affordability under the Biden plan. They would be eligible for, and automatically enrolled in, the new public plan option for zero premium. For example, a 60-year-old making $10,000 per year (80% of poverty) and living in a non-expansion state would go from having to pay $687 per month for the lowest-cost bronze plan currently available (over 80% of their income) to having the option of at least one plan with no premium under Biden’s proposal. Changes in affordability for coverage gap individuals are not reflected in the map in Figure 2.
Other enrollees may see no change to their premium contribution or could theoretically see premium increases in rare cases. People living in certain areas where gold plans already cost less than 8.5% of their income may not see much change in their own premium contributions. Subsidies may actually shrink in counties where, due to a practice called “silver loading,” gold plans are currently cheaper than the benchmark silver plan. For example, a 40-year-old making $40,000 in Fremont County, Wyoming, would go from paying $197 (5.9% of income) to $243 (7.3% of income) per month for the second-lowest cost gold plan. We use current day premiums as the basis of this analysis but, if Biden’s proposal ultimately becomes law, the practice of silver loading might also change or end.
Additionally, some states already have used state-only funds to supplement marketplace subsidies and/or extend them to more people. For example, California uses state dollars to extend Marketplace subsidies to people earning up to 600% of the poverty line. If Biden’s proposal ultimately were enacted, it is unclear whether states like California, Vermont, and Massachusetts would continue offering additional subsidies, so we do not factor in state-sponsored subsidies in Biden’s proposal.
How could a proposal like Biden’s affect premiums for people who enroll in coverage through an employer?
Biden’s proposal would allow those with an offer of employer-sponsored insurance to buy into the Marketplace. While the figures above illustrate how premiums would change only for people currently eligible to buy subsidized marketplace plans, there would also be substantial savings for many who currently have employer plans.
Biden’s health care proposal would eliminate the ACA’s “firewall” and “family glitch,” which make workers and their family members ineligible for premium tax credits if any worker in the family is offered “affordable” health insurance through their employer. Instead, people who are offered insurance through their work would be allowed to enroll in the public option plan and be eligible for Marketplace premium subsidies. Employer-based coverage is the largest source of insurance for non-elderly people in the U.S., and introducing the option to choose subsidized Marketplace coverage over an offer of job-based insurance could improve the affordability of coverage for many individuals and households, particularly those with lower-income workers who would otherwise qualify for substantial marketplace subsidies.
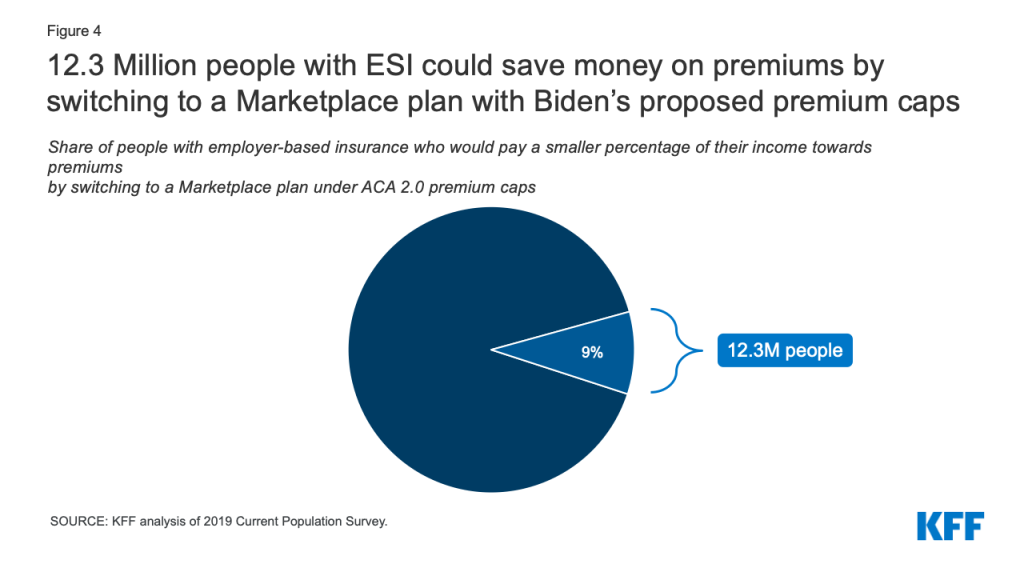
Figure 4: 12.3 Million people with ESI could save money on premiums by switching to a Marketplace plan with Biden’s proposed premium caps
We estimate that 12.3 million people who currently have employer-based insurance are paying a larger portion of their income towards premiums than they would be if they purchased a Marketplace plan under premium caps comparable to what Biden has proposed, which would be no more than 8.5% of household income. While 12.3 million constitutes less than 10% of total enrollment in employer-sponsored coverage today, it exceeds the number of people who were enrolled in marketplace plans at the start of the year (11.4 million).
In addition to comparing premiums, people deciding whether to switch from employer coverage to a marketplace plan might also consider the relative level of cost-sharing. Today, gold Marketplace plans (the new benchmark plan under the Biden proposal) have annual deductibles averaging about $1,500, compared to an average single deductible of $1,655 for people in employer plans that had an annual deductible in 2019. In 2019, 28% of covered workers were enrolled in a job-based plan with a deductible of $2,000 or more. Low-income workers with employer coverage could also qualify for cost-sharing reductions that would lower deductibles for Marketplace plans.
The decision to switch from employer-based coverage to a Marketplace plan might also take into account a comparison of provider networks. The majority of Marketplace plans today are closed network (e.g., HMO) or narrow network plans that limit an enrollee’s choice of doctors and hospitals. Under the Biden proposal, a new public option would be offered through the Marketplace and administered by the traditional Medicare program, whose provider network includes nearly every hospital and physician in the U.S.
Discussion
ACA Marketplace premiums have fallen a bit, on average, over the last two years. However, premiums and cost-sharing for even the least expensive ACA plans remain unaffordable for some middle-income people, particularly older people who face higher premiums, and impoverished people in states without Medicaid expansion. The more than two million people who fall into the Medicaid coverage gap in states that have not expanded Medicaid face the most pressing affordability challenges, since they are not eligible for either Marketplace subsidies or Medicaid despite living below the poverty line. Many enrollees who currently receive premium subsidies are ineligible for much or any cost sharing reductions, and as a result, often face high deductibles that may limit how often they can afford to actually use their insurance. High deductibles could also discourage some people from buying coverage in the first place. Additionally, people with an employer offer that costs nearly 10% of their income for self-only coverage are currently not eligible for Marketplace subsidies, even if that plan cannot affordably cover the worker’s entire household.
Joe Biden proposes to expand ACA subsidies, which would lower the cost of Marketplace coverage for nearly all potential enrollees, including many uninsured people who have been priced out of the Marketplace altogether. Older, middle- and upper-middle-income people would see substantial savings under these proposals: an average 60-year-old making $50,000 (just above the current subsidy threshold) would see their Marketplace premiums decrease by 95% for a bronze plan and by 66% for a lower-deductible gold plan. Premiums would fall dramatically in West Virginia, Georgia, Wyoming, Missouri, South Dakota, and Nebraska, since unsubsidized Marketplace premiums are currently unaffordable in many rural parts of these states. Allowing people with employer-sponsored insurance to buy into the public option and purchase subsidized Marketplace coverage also has the potential to improve the affordability of health insurance for millions of people who are currently tied to their employer’s plan.
With these expanded subsidies and the creation of a public option, Biden’s proposal would increase the cost of operating the Marketplace. In 2019, the federal government spent nearly $55 billion in premium subsidies for Marketplace enrollees, and the Congressional Budget Office projects that the government will spend about $610 billion total on Marketplace subsidies between 2021 and 2030. This figure would likely increase significantly under Biden’s proposed changes, driven in part by those who transition from employer-sponsored insurance to the individual market. Biden’s campaign estimates that his health care plan, including the public option and the subsidy expansion, would cost an additional $750 billion over 10 years. Biden plans to pay for the plan by raising income taxes on high-income people and raising the capital gains tax.
In contrast to Biden’s plan to build on the ACA, President Trump has supported proposals to repeal and replace the ACA. The Trump administration has focused on addressing affordability problems by loosening regulations on short-term, limited duration health plans that generally have lower premiums than ACA-compliant coverage, in large part because these plans can exclude people with pre-existing conditions and may not cover certain services, thus shifting higher out-of-pocket costs to those who are sick. The Trump administration also supports a lawsuit that seeks to overturn nearly all parts of the ACA and, without a replacement plan, would lead to significant coverage losses.
Appendix
Appendix Table 1: Change in Monthly Bronze Premium under Biden’s Proposal
Lowest Bronze (Current Law)
Lowest Bronze (Proposed Changes)
Income
FPL
27 year old
40 year old
60 year old
27 year old
40 year old
60 year old
$20,000
160%
$5
$3
$1
$0
$0
$0
$25,000
200%
$37
$24
$3
$0
$0
$0
$30,000
240%
$91
$73
$14
$12
$4
$0
$35,000
280%
$156
$136
$41
$45
$26
$0
$40,000
320%
$209
$194
$82
$88
$62
$2
$45,000
360%
$234
$232
$116
$135
$107
$10
$50,000
400%
$272
$324
$622
$186
$160
$30
$60,000
480%
$274
$331
$666
$231
$223
$71
$70,000
560%
$274
$331
$680
$253
$273
$122
$80,000
641%
$274
$331
$687
$265
$301
$182
$90,000
721%
$274
$331
$687
$270
$316
$245
$100,000
801%
$274
$331
$687
$273
$325
$308
Note: This table shows enrollment-weighted average premiums for the lowest-cost bronze plan. The payment for the second-lowest cost gold plan is set as a certain percent of one’s income. However, the lowest-cost bronze plan payment could change, depending on how insurers and the public option plan are priced relative to the gold benchmark.
Appendix Table 2: Change in Monthly Gold Premium under Biden’s Proposal
Second-Lowest Gold (Current Law)
Second-Lowest Gold (Proposed Changes)
Income
FPL
27 year old
40 year old
60 year old
27 year old
40 year old
60 year old
$20,000
160%
$128
$139
$213
$39
$39
$39
$25,000
200%
$191
$202
$275
$83
$83
$83
$30,000
240%
$254
$265
$339
$140
$140
$140
$35,000
280%
$321
$333
$405
$192
$193
$193
$40,000
320%
$373
$391
$464
$243
$243
$243
$45,000
360%
$398
$429
$505
$296
$296
$296
$50,000
400%
$437
$522
$1,029
$349
$354
$354
$60,000
480%
$439
$529
$1,075
$395
$419
$425
$70,000
560%
$439
$529
$1,089
$417
$470
$496
$80,000
641%
$439
$529
$1,095
$428
$498
$567
$90,000
721%
$439
$529
$1,095
$434
$513
$637
$100,000
801%
$439
$529
$1,095
$436
$522
$707
Note: This table shows enrollment-weighted average premiums for the second-lowest cost gold plan. The payment for the second-lowest cost gold plan is set as a certain percent of one’s income. However, the lowest-cost bronze plan payment could change, depending on how insurers and the public option plan are priced relative to the gold benchmark.
Methods
We analyzed data from the 2020 Individual Market Medical files to determine premiums and the benchmark amounts to calculate premium tax credits for the scenarios presented. These files are available at data.healthcare.gov. Premiums for state-based Marketplaces are from KFF analysis of data received from Massachusetts Health Connector, Covered CA, and KFF analysis of data published by HIX Compare from the Robert Wood Johnson Foundation. This analysis only includes on-exchange plans. Off-exchange plans generally have similar premiums to on-exchange plans with the exception of silver plans, which often include an additional premium load on-exchange only to account for cost-sharing reductions insurers must provide to some exchange enrollees.
All averages are weighted by county-level 2019 plan selections. 2019 plan selections come from the 2019 Marketplace Open Enrollment Period County-Level Public Use file provided by CMS, available here. In states running their own exchanges, we gathered county-level plan selection data where possible and otherwise estimated county plan selections based on the county population in the 2010 Census and total state plan selections in the 2019 OEP State-Level Public Use File provided by CMS, available here.
The premium caps used to model Biden’s proposal are shown in Table 3.
Table 3: Premium Cap, by Income
Income% Poverty
Premium Cap
Current Law, 2020(% of income for 2nd lowest cost silver plan)
Biden’s Proposal(% of income for 2nd lowest cost gold plan)
Under 100%
No Cap
0% (in public option)
100% – 138%
2.06%
0% (in public option)
138% – 150%
3.09% – 4.12%
1% – 2%
150% – 200%
4.12% – 6.49%
2% – 4%
200% – 250%
6.49% – 8.29%
4% – 6%
250% – 300%
8.29% – 9.78%
6% – 7%
300% – 400%
9.78%
7% – 8.5%
Over 400%
No Cap
8.5%
Note: Note that tax credits for the 2020 benefit year are calculated using 2019 federal poverty guidelines.Source: Kaiser Family Foundation
This analysis has some limitations. While Biden also supports a new public option, the premium payments shown in this paper do not account for the public option. The Biden plan does not specify two details about the public plan that we would need to know to estimate how the public plan could impact Marketplace subsidies and, in particular, an individual’s net cost for a non-benchmark plan. First, the Biden plan, does not specify how much lower public plan provider payments might be compared to those paid by commercial insurers today. To the extent a public option negotiates lower payment rates for doctors and hospitals, the premium for the public option would be lower and might also lead competing private health insurance plans to lower their premiums. In addition, the Biden plan does not explain how the public option would be factored into the benchmark plan calculations. If the public plan is counted in determining the second-lowest-cost gold plan, and if the public plan premium is cheaper than the second-lowest-cost commercial gold plan, then the amount of premium tax credit dollars would be reduced for everyone. This would not affect what people pay for the benchmark plan – that amount is always equal to a sliding-scale percentage of household income. But it could increase what people pay for plans other than the benchmark plan because an individual’s payment for all other plans equals the plan’s actual premium minus the premium tax credit for that individual. Because we did not take into account effects of a new public plan offering, the figures in this analysis could overstate the cost of a bronze plan in some cases.
We used data from the 2019 Current Population Survey to estimate the number of people with employer-based insurance who are paying a higher share of their income on premiums now than they would be if they switched to a Marketplace plan under premium caps comparable to what Biden has proposed. To do so, we aggregated income and premium payments at the tax unit level. To reflect 2020 values, we adjusted tax unit income for inflation and adjusted tax unit premium payments using the average growth in employer sponsored premiums from KFF’s Employer Health Benefits Survey, depending on whether the tax unit had single or family coverage. We then deflated tax unit premiums to reflect the tax unit’s current after-tax premium based on the unit’s marginal tax rate and payroll tax liability. We used this adjusted premium value to calculate the share of the unit’s income that was going towards premiums, and compared that percentage to the premium caps that would apply to the unit as outlined in HR. 1884 (Appendix Table 3).
Endnotes
A person making $50,000 is currently eligible for subsidies only in California, as the state funds additional subsidies for those who make less than 600% of poverty. Vermont and Massachusetts also provide additional state-funded subsidies to Marketplace enrollees, but these subsidies do not extend above 400% of poverty. ↩︎
The payment for the second-lowest cost gold plan is set as a certain percent of one’s income. However, the lowest-cost bronze plan payment could change under Biden’s proposal, depending on how the public option plan is priced relative to the gold benchmark. ↩︎
Here’s our recap of the past week in the coronavirus pandemic from our tracking, policy analysis, polling, and journalism.
The United States surpassed the grim milestone of 200,000 confirmed deaths related to COVID-19 this week and is on the verge of 7 million total cases. However, a KHN article reporting on California’s death totals in the first five months of the pandemic suggests that about 5,000 “excess” deaths not attributed to COVID-19 – an unusually high number — could be partially due to an undercount of officially reported COVID-19 related deaths.
With the school year underway and localities taking varying approaches to school attendance, a new KFF brief examines not only the published studies on COVID-19 risks for children, but also broader health and economic impacts the pandemic has had on them and their families.
As the country awaits a vaccine and Americans worry about political pressure leading to premature approval of one, a KHN article examines the safety monitoring board that will be making these critical decisions.
Here are the latest coronavirus stats from KFF’s tracking resources:
Global Cases and Deaths: Total cases worldwide surpassed 32 million this week – with an increase of approximately 2 million new confirmed cases in the past seven days. There were approximately 35,700 new confirmed deaths worldwide, bringing the total to nearly 981,800 confirmed deaths.
U.S. Cases and Deaths: Total confirmed cases in the U.S. neared 7 million this week. There was an approximate increase of 303,200 confirmed cases between September 18 and September 24. Approximately 5,200 confirmed deaths in the past week brought the total in the United States to approximately 202,800.
Children’s Health and Well Being During the Coronavirus Pandemic (Issue Brief)
Medicaid Maintenance of Eligibility (MOE) Requirements: Issues to Watch When They End (Issue Brief)
Medicaid Emergency Authority Tracker: Approved State Actions to Address COVID-19 (Issue Brief)
Updated: COVID-19 Coronavirus Tracker – Updated as of September 24 (Interactive)
Updated: State Data and Policy Actions to Address Coronavirus (Interactive)
At U.N., China, Russia, U.S. Spar Over Pandemic Responses; African Nations Call For Fiscal Support; Guterres Urges Nations To Cooperate On COVID-19, Climate Change (KFF Daily Global Health Policy Report)
The debate over school openings has highlighted the implications of the coronavirus pandemic for children and their families. While experts continue to gather data on children’s risk for contracting and transmitting coronavirus, current research suggests that though children are more likely to be asymptomatic and less likely to experience severe disease than adults, they are capable of transmitting to both other children and adults. In addition to the risk of disease and illness, COVID-19 has led to changes in schooling, health services delivery, and other disruptions of normal routines that will likely affect children’s health and well-being, regardless of whether they are infected.
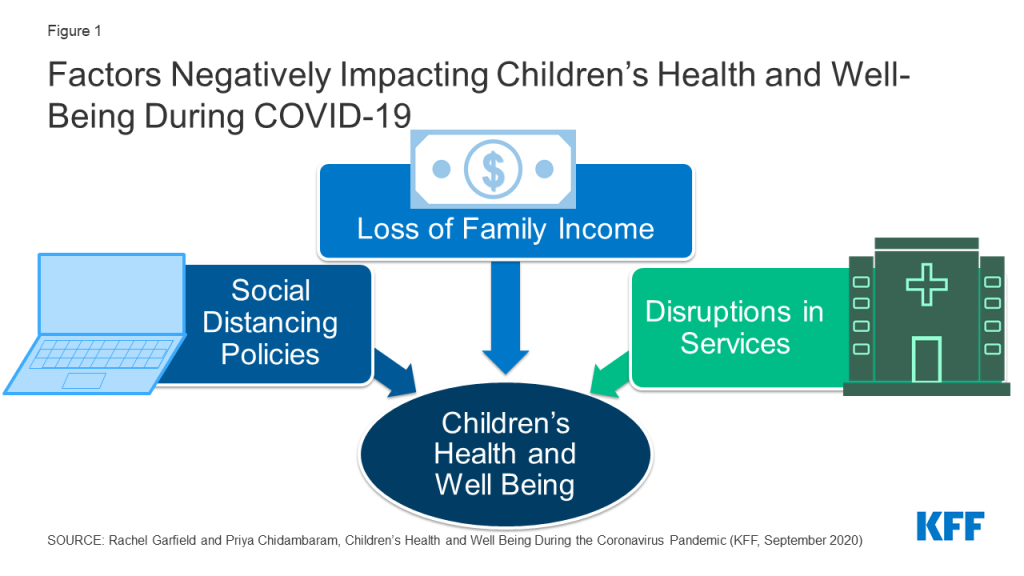
This brief examines how a range of economic and societal disruptions stemming from COVID-19 may affect the health and well-being of children and families. It draws on published literature as well as pre-pandemic data from the National Survey of Children’s Health and the National School-Based Health Care Census, recent survey data on experiences during the pandemic, data tracking the number of cases resulting from school openings, and preliminary reports based on claims data evaluating service utilization among Medicaid and CHIP child beneficiaries. It finds that school openings/closures, social distancing, loss of health coverage, and disruptions in medical care could negatively impact the health and well-being children in the US (Figure 1).1 Key findings include:
Students who attend in person school face direct risks of contracting coronavirus, with early tracking documenting nearly 12,400 cases across 3,900 schools. Risks due to school attendance may be higher for low-income children or children of color, whose families may be less likely to afford alternative schooling arrangements or private transportation to school. A July KFF poll found that parents of color were significantly more likely than White parents to say they were worried about their child contracting coronavirus due to school attendance and that their school lacked adequate resources to safely reopen.
Students who do not attend school in person also face health risks, including difficulty accessing health care services typically provided through school, social isolation, and limited physical activity. Millions of children access health services through school-based health clinics, school screening and early intervention programs, and on-site counseling, and these services may be suspended in schools that are not open for in person instruction. Children also may be missing opportunities for social connections or exercise, as three-quarters of school-age children take part in a sport, club, or other organized activity or lesson, many of which may be suspended. A quarter of children do not live in a neighborhood with access to sidewalks or walking paths, which could limit physical activity. KFF polls show high rates (67%) of parent concern for their children’s social and emotional health due to school closures.
Both students attending and not attending in-person school may face emotional or behavioral challenges due to disruptions to routines as well as increases in parent stress and family hardship. Early research has documented high rates of rates of clinginess, distraction, irritability, and fear among children, particularly younger children, as well as increases in some substance use among adolescents, and one survey found that nearly a third of parents said their child had experienced harm to their emotional or mental health. Parent stress due to childcare, schooling, lost income, or other pandemic-related pressures can negatively affect children’s emotional and mental health, harm the parent-child bond and have long-term behavioral implications, and have serious implications for children at risk of abuse or neglect. Exposure to adverse childhood experiences have documented effects of lifelong physical and mental health problems.
Children are also experiencing consequences of the economic fallout of the pandemic, with at least 20 million children living in a household in which someone lost a job. Though the large majority of children who lose access to employer-sponsored insurance due to job loss are eligible for Medicaid or CHIP, some parents may not enroll children in coverage due to challenges completing the application, lack of knowledge or understanding of eligibility, or other reasons. Many families experiencing loss of income, food insufficiency, or problems paying rent since the pandemic have children, and school closures may make it challenging for the 20 million students who receive free or reduced price lunch to access those meals.
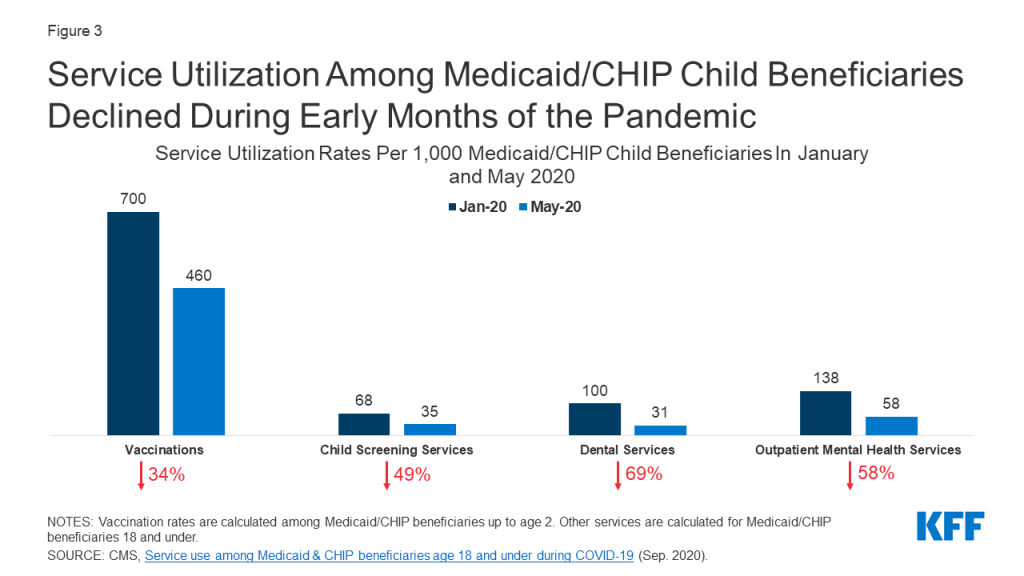
Parents may be delaying preventative and ongoing care for their children due to social distancing policies as well as concerns about exposure. Reports based on health care claims show declines in rates of vaccinations, child screenings, dental services, and outpatient mental health services among Medicaid/CHIP child beneficiaries (Figure 3). Other administrative data show declines in vaccine orders and administration, particularly among children older than 24 months. It is likely that parents may be delaying care due to concerns about contracting illness or cost concerns, and providers may have limited capacity due to changes in operations to safely treat patients. These delays in care may disproportionately impact the 13 million children with special health care needs who require ongoing care to address their complex needs.
Children’s lower risk of serious illness due to COVID-19 has led most discussion and policy debate over the pandemic to focus on adults at high risk, though the recent debate over school openings has shifted focus to children’s health and well being. Many children are currently facing substantial access barriers, emotional strain, and financial hardship that could have long-term repercussions for their lives. Policies to ensure access to needed health services, particularly behavioral health services, as well as facilitate access to social services to support families with children, can help address some of the consequences children are currently facing.
Figure 1: Factors Negatively Impacting Children’s Health and Well-Being During COVID-19
Introduction
The debate over school openings has highlighted the implications of the coronavirus pandemic for the nation’s 76 million children and their families. Experts continue to gather data on the children’s risk for contracting and transmitting coronavirus, but current research suggests that though children are more likely to be asymptomatic and less likely to experience severe disease than adults, they are capable of transmitting to both children and adults. As of September 17th, 2020, state data indicated that there were over half a million COVID-19 cases among children nationwide, accounting for just over 10% of all cases (children make up about a quarter of the population in the US); however, new cases among children in the period September 3rd through September 17th represented a 15% increase over the prior two week period. In addition, social distancing policies and the economic downturn have important implications for the health and well-being of children, particularly low-income children and children of color. These groups faced increased health, social, and economic challenges prior to the pandemic, and research shows that, like adults, minority and socioeconomically disadvantaged children have a higher risk of contracting coronavirus. This brief provides analysis of the potential implications of the COVID-19 pandemic for children’s mental and physical health, well-being, and access to and use of health care.
Health Risks due to School Openings/Closures and Social Distancing Policies
States and school districts have made varying decisions about how to conduct school in the 2020-21 academic year. As of September 23rd, only Puerto Rico and the District of Columbia had statewide school closures in effect, with five additional states having regional mandatory closures, while four states ordered in-person instruction to be available full or part time. The remaining states have left school operations decisions to localities or are using a hybrid (in-person and on-line) approach to school openings. Most states have given child care facilities, which serve younger children up to Pre-K, the option to open, sometimes with restrictions on class size or other operations.
Students who attend in person school face direct risks of contracting coronavirus, with early tracking documenting nearly 12,400 cases across 3,900 schools. A KFF review found that evidence is mixed about whether children are less likely than adults to become infected when exposed, and while disease severity is significantly less in children, a small subset become quite sick. It further found that though school openings in many other countries have not led to outbreaks among students, the US has much higher rates of community transmission and lower testing and contact tracing capacity and may fare differently. In addition, experience from other countries as well as child care centers in the US shows that school-associated outbreaks do occur, and children do transmit the virus. KFF polling data from July 2020 showed high rates of parent concern over health risks due to school re-opening, with 70% of parents of a child age 5-17 saying they were somewhat or very worried about their child getting sick from coronavirus due to school attendance; parents of color were more likely to express this concern (91% versus 55% of White parents) and also more likely to say their child’s school lacks the resources to safely reopen (82% versus 54% of White parents). As of September 22nd, The National Education Association has confirmed nearly 12,400 cases in Pre-K to high school students across the country. Given the lack of universal testing among students in school and higher likelihood of children being asymptomatic, the number of cases is likely higher than what is reported. Children who contract coronavirus may also pose a risk beyond their school community, as 3.3 million adults age 65 or older live in a household with a school-age child.
The risks of contracting coronavirus due to school may be greater for low-income or minority students due to differences in school structure and commuting patterns. Risks due to schooling and parent decisions about the school year have exposed and exacerbatedinequities in the education system. Children in lower-income families are less likely to have access to a “learning pod” that supports in-home instruction and are less likely to have adequate computing resources at home for distance learning and thus may be less likely to opt out of in-person instruction. In addition to higher risk due to in-person attendance, minority or low-income children may be at higher risk from transportation to and from school, as students from low-income households may lack alternatives to school transportation or live in neighborhoods without safe walking routes to school. Data from the 2017 National Household Travel Survey indicates that a higher share of low-income students ride a school bus compared to non-low-income students (60% vs. 45%). Furthermore, Black students travel farther than White and Hispanic students to school. Longer commute times on school busses and other forms of public transportation may put students at higher risk for contracting the virus due to the increased time spent in an enclosed and crowded space.
Students who do not attend school in person may face difficulty accessing health care services typically provided through school. School based health clinics (SBHCs) provide primary care and behavioral health services to nearly 6.3 million students across over 10,600 public schools in the US, accounting for nearly 13% of students nationwide. These clinics are primarily located in schools that serve high concentrations of low-income students and predominantly serve students in grades 6 and above. Additionally, only a small share (just over 10%) of SBHCs are telehealth clinics, with the remainder offering all or most services in person. While some SBHCs may remain open if they serve the broader community, with schools closing, many other SBHCs have likely also shut down, eliminating a source of care for students that rely on them. Outside of SBHCs, schools also provide screening, early intervention, and other health care to their students. In 2016-2018, nearly 1 in 4 students between the ages of 5 and 17 had their vision tested at school (23%), and nearly 10% of children between the ages of 3 and 17 with Autism Spectrum Disorder were first diagnosed by a school psychologist or counselor. About 200,000 students across the US between the ages of 10 and 17 reported using the nurse’s office or athletic trainer’s office as their usual source of care,2 and pre-pandemic, 58% of adolescents who used mental health services received these services in an educational setting, with higher rates among low-income, minority students.
Social distancing policies may result in reduced social connections and physical activity for children. Over three-quarters of older children between the ages of 6 and 17 take part in sports after school or on weekends, are a member of club or organization after school or on weekends, or take part in another form of organized activity or lesson, such as music, dance, language, or other arts.3 Many of these activities are likely cancelled or curtailed due to social distancing policies (even if schools open), leaving many children without social or physical engagement. Parents report high rates of concern about limited social interaction, with data from a July KFF Tracking Poll finding that 67% of parents are worried their children will fall behind socially and emotionally if schools do not reopen. Additionally, as recreational facilities remain closed, opportunities to exercise or spend time outdoors may be limited. Over 1 in 4 families do not live in a neighborhood with sidewalks or walking paths, which could limit children’s ability to spend time outdoors and maintain health.4
Both students attending and not attending in-person school may face emotional or behavioral challenges due to disruptions to routines. There have been widespread reports of the challenges that the disruptions and stress due to pandemic pose to children’s mental health or behavior. Early research reported high rates of clinginess, distraction, irritability, and fear among children, with younger children being more likely to exhibit these behaviors. In a June 2020 survey, 29% of parents reported that their child had already experienced harm to their emotional or mental health. Children with pre-existing mental or behavioral health problems may be at particularly high risk; prior to the pandemic, more than one in ten adolescents ages 12 to 17 had depression or anxiety. Pre-pandemic rates of mental illness were higher among children of color, and these children were also less likely to receive treatment for their mental or emotional problems. Substance use is also a concern, and research has found increases in solitary substance use among adolescents during the pandemic, which is associated with poorer mental health and coping. Behavioral health treatments involve frequent contact with therapists and regular follow-up that may be compromised with limited access to services or school closures during the pandemic. Research has documented long-term effects of adverse childhood experiences, including lifelong physical and mental health problems.
Increases in parent stress may also negatively affect children’s health. With long-term closures of schools and childcare centers, many parents are experiencing new challenges in childcare, homeschooling, and disruption to normal routines. Prior to the pandemic, over half (52%) of all children between the ages of 0-5 received at least 10 hours of care per week from someone other than their parent or guardian, including day care centers, preschools, or Head Start programs.5 During the pandemic, nearly all adults in households with children in school reported a disruption to normal schooling. With many sources of care unavailable, parents who are still working (either in person or via telework) are having to balance childcare or schooling with work. KFF Tracking Polls conducted following widespread shelter-in-place orders found that over half of women and just under half of men with children under the age of 18 have reported negative impacts to their mental health due to worry and stress from the coronavirus.6 Parent stress in coping with the pandemic can negatively affect children’s emotional and mental health, harm the parent-child bond and have long-term behavioral implications, and have serious implications for children at risk of abuse or neglect. A survey conducted in late March 2020 found that a majority of parents (61%) shouted, yelled or screamed at their children at least once in the past 2 weeks and 20% spanked or slapped their child at least once in the past 2 weeks. Social distancing may mean that children have less access to support systems outside members of the household.
Health Risks due to Loss of Family Income
COVID-19 has led to a surge in unemployment and income declines for many families with children. Social distancing policies required to address the crisis have led many businesses to cut hours, cease operations, or close altogether. KFF estimates of job loss between March 1st and May 2nd, 2020 find that over 20 million children are in a family in which someone lost a job. Job losses have continued since that date, and a greater number of children may be in a family in which someone retained their job but has experienced some loss of income. Data from the Census Bureau’s Household Pulse Survey show that as of August 31st, just over half of adults who have children in the household experienced some loss of employment income since March 13th, 2020, a higher rate than adults without children (42%), and over 30% of adults with children expected a loss of income in the next four weeks (Figure 2).
Job loss may lead to disruptions in children’s health coverage, though most children in families losing employer-sponsored health insurance are likely eligible for coverage under the ACA. KFF analysis of job loss and potential loss of employer coverage as of early May found that millions of people who lost their job as of May 2 were at risk of losing their employer health benefits, and over 6 million people at risk of losing ESI and becoming uninsured are children. The vast majority of these children are eligible for coverage through Medicaid or CHIP, but it is unclear whether they will be enrolled in coverage. Between 2016 and 2018, over one-third of families who had a gap in insurance coverage attributed that gap to unaffordable insurance, health insurance cancellation due to overdue premiums, or a change in employer or employment status. Coverage losses among children will negatively affect their ability to access needed care.7 ,8 ,9 ,10
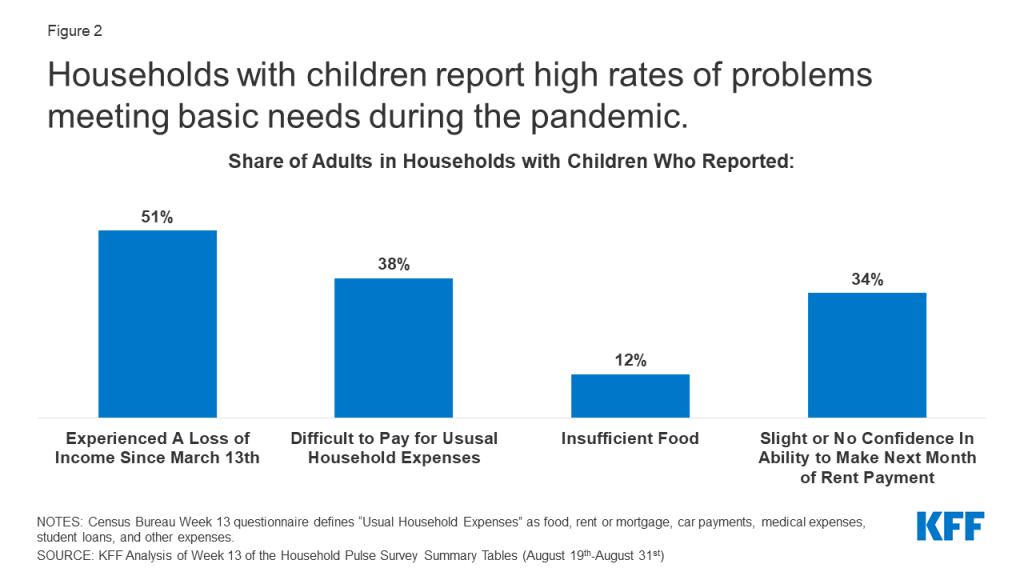
Loss of family income also affects parents’ ability to provide for children’s basic needs. Data from the August 19-31 Household Pulse Survey shows that 38% of adults in households with children said it was somewhat or very difficult to pay for usual household expenses during the pandemic, a higher share than among adults without children (26%) (Figure 2). The share of households with children who sometimes or often did not have sufficient food to eat increased during the pandemic, with 10% of these households reporting insufficient food prior to March 13th, as compared to 12% as of August 31st. Food insufficiency is particularly pronounced for Black (20%) and Latino (16%) households with children when compared to White (9%) households. Additionally, over one third (34%) of adults in households with children reported only slight or no confidence in their ability to make the next month of rent payment (Figure 2).
Figure 2: Households with children report high rates of problems meeting basic needs during the pandemic.
School closures may further limit low-income children’s ability to access food through free- and reduced-price school meal programs. Just over 1 in 3 students between the ages of 5 and 17 qualifies for a free or reduced cost meal.11 Given that these students often depend on school for two meals a day, school closures may limit their ability to eat regularly and access nutritious food. States and localities are working to continue school meal programs under waivers from the US Department of Agriculture that enable them to provide meals under the Summer Food Service Program or Seamless Summer Option and through new authority to expand the availability of these programs. However, research indicates that only a small share (15%) of the nearly 30 million children who received meals through the program prior to the pandemic continue to do so.
Health Risks due to Disruptions in Health and Social Services
Preliminary reports based on claims data show significant declines in service utilization among Medicaid/CHIP beneficiaries under the age of 18 between January and May 2020, which may be due to social distancing policies as well as concerns about exposure (Figure 3). Prior to the pandemic, utilization of preventive and primary care was generally high among children: In 2018, the large majority (96%) of children had a regular source of health care, nearly 90% had received a well-child visit in the past year, and only a small share (2.5%) delayed care due to cost. However, early analysis of claims data by the Center for Medicare and Medicaid Services (CMS) shows substantial declines in use of regular and preventive care. Among Medicaid and CHIP beneficiaries under the age of 2, vaccination rates dropped nearly 34% between January and May 2020. Other services, such as child screening services, dental services, and outpatient mental health services, dropped 50% or more between January and May 2020 for Medicaid and CHIP beneficiaries 18 or younger (Figure 3). Other administrative data across payers show substantial declines in vaccine orders and administration, particularly among children older than 24 months, with cumulative doses of noninfluenza vaccines ordered dropping by more than 3 million by mid-April 2020 compared to the same time in 2019. Parents may be delaying care due to concerns about contracting illness or, for those with private insurance, cost, and providers may have limited capacity due to changes in operations to safely treat patients.
Figure 3: Service Utilization Among Medicaid/CHIP Child Beneficiaries Declined During Early Months of the Pandemic
Though some data shows increases in use of telehealth services among children during the pandemic, it has not offset declines in in-person visits. A July 2020 study found that, prior to the pandemic, only 15% of pediatricians reporting using telemedicine, and many pediatric practices have had to quickly adapt to provide telehealth services during the pandemic. Medicaid, which provides health coverage for nearly 40% of children in the US, is allowing the use of telehealth for Medicaid-funded well-child visits and services, but as of July 23, only 15 states had issued telehealth guidance for child well-care and EPSDT visits and 16 states had issued guidance to providers to allow for telehealth or remote care delivery for early childhood intervention services. Preliminary reports by CMS based on Medicaid claims data shows that delivery of any services via telehealth to children increased by over 2,500% from February to April 2020, but these increases did not offset declines in in-person visits and utilization still declined substantially across many services.
Challenges accessing health services are particularly problematic for the 13 million children with special health care needs (CSHCN). Children with special health care needs require ongoing care and specialized services due to intellectual/developmental disabilities, physical disabilities, and/or mental health disabilities. These disabilities may include asthma, cerebral palsy, cystic fibrosis, diabetes, muscular dystrophy, brain injury, or epilepsy. Many of these children rely on continual care, especially those who have ongoing complications or who have recently had procedures. However, due to social distancing rules and risk of exposure in health care settings, CSHCN may forgo necessary care. Additionally, CSHCN and their families rely on home-based medical caregiving to supplement other sources of care. These include children with particularly complex care needs who may rely on nursing care to live safely at home with a tracheotomy or feeding tube. However, given staffing shortages and other complications brought on by the pandemic, home nursing and aide services may no longer be an option for many families.
The pandemic has led to many services in child welfare systems being cut back or postponed, leading to concerns of both increased child abuse and decreased reporting. Many child welfare agencies have cut back on in-person inspections of homes, which puts vulnerable children at even greater risk for abuse and neglect. Child welfare professionals also report concern that the pandemic will fuel a rise in child abuse and neglect, given the increasing stress on families and working parents. There are also concerns of decreased reporting of child abuse and neglect that may stem from social distancing policies. States including Wisconsin, Oregon, Pennsylvania, and Illinois saw reports of child abuse fall between 20% and 70% in the month of March, likely due to children being kept away from locations where there are professionals who are trained to identity and report scenarios of child abuse and neglect. The pandemic may also lead to an increased need for child welfare services, as increased financial pressures on families negatively impact parents’ relationships with their children. This additional need could remain unmet as the child welfare system struggles to handle its current caseload and families in need with the additional complications presented by COVID-19.
Looking Ahead
The coronavirus pandemic is an unprecedented event in most people’s lifetimes, leading to extraordinary high risk to health and well-being. Children’s lower risk of serious illness due to COVID-19 has led most discussion and policy debate over the pandemic to focus on adults at high risk, though the recent debate over school openings has shifted focus to children’s health and well-being. With many schools re-opening, tracking cases and serious illness among children and understanding who is at highest risk can help policymakers design education and support systems to minimize exposure, risk, and illness. In addition, many children are already facing substantial access barriers, emotional strain, and financial hardship that could have long-term repercussions for their lives. This analysis underscores the importance of pursuing safe approaches to opening schools to balance physical and emotional health. Policies to facilitate enrollment in health coverage, ensure access to health services, particularly behavioral health services, as well as facilitate access to social services to support families with children, can help address some of the consequences children are currently facing.
Endnotes
KFF analysis of 2016-2018 National Survey of Children’s Health ↩︎
KFF analysis of 2016-2018 National Survey of Children’s Health ↩︎
KFF analysis of 2016-2018 National Survey of Children’s Health ↩︎
KFF analysis of 2016-2018 National Survey of Children’s Health ↩︎
KFF analysis of 2016-2018 National Survey of Children’s Health ↩︎
Percent of women with children under the age of 18 reporting negative mental health impacts due to worry and stress from the coronavirus outbreak: 57% (KFF Health Tracking Poll conducted March 25-30, 2020), 53% (KFF Health Tracking Poll conducted May 13-18, 2020), and 59% (KFF Health Tracking Poll conducted July 14-19, 2020).Percent of men with children under the age of 18 reporting negative mental health impacts due to worry and stress from the coronavirus outbreak: 32% (KFF Health Tracking Poll conducted March 25-30, 2020), 28% (KFF Health Tracking Poll conducted May 13-18, 2020), and 49% (KFF Health Tracking Poll conducted July 14-19, 2020). ↩︎
Leighton Ku and Matthew Broaddus, Coverage of Parents Helps Children, Too (Center on Budget and Policy Priorities, October 2006), http://www.cbpp.org/cms/?fa=view&id=754. ↩︎
Health insurance and access to care improve health outcomes, including viral suppression, for people with HIV in the United States (U.S.). Our prior research documented an increase in insurance coverage among people with HIV, after implementation of the Affordable Care Act (ACA). In this update, we find that in 2018, just 1 in 10 (11%) nonelderly people with HIV were uninsured, a rate on par with that of the general population (10%).
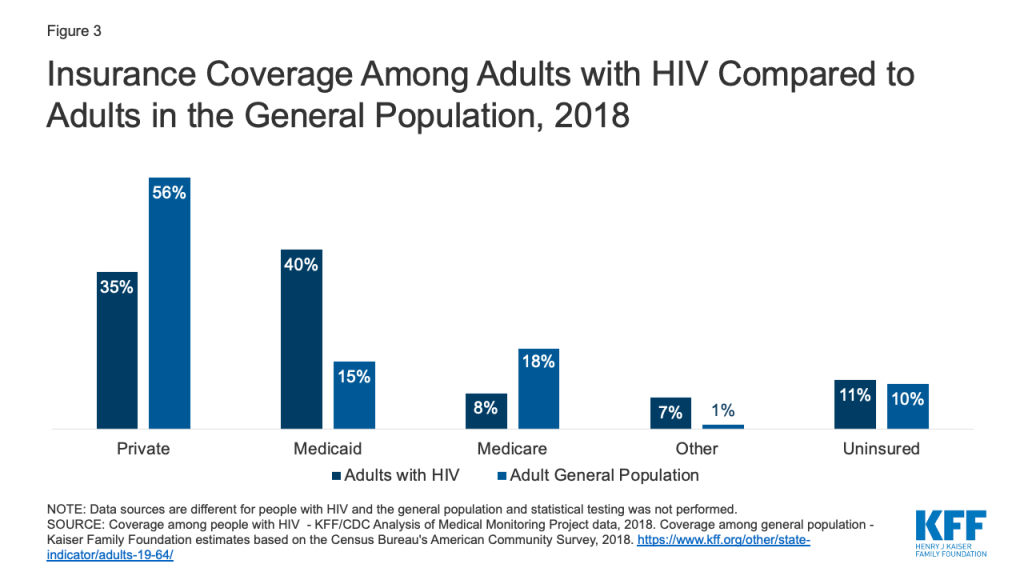
While the overall rate of uninsurance is now similar for people with HIV and the population overall, there are substantial differences in the type of coverage. Medicaid plays a much more significant role for people with HIV compared to the general population (40% v. 15%), and it is their single largest source of coverage, and people with HIV are much less likely to be covered by private insurance (35% v. 56%).
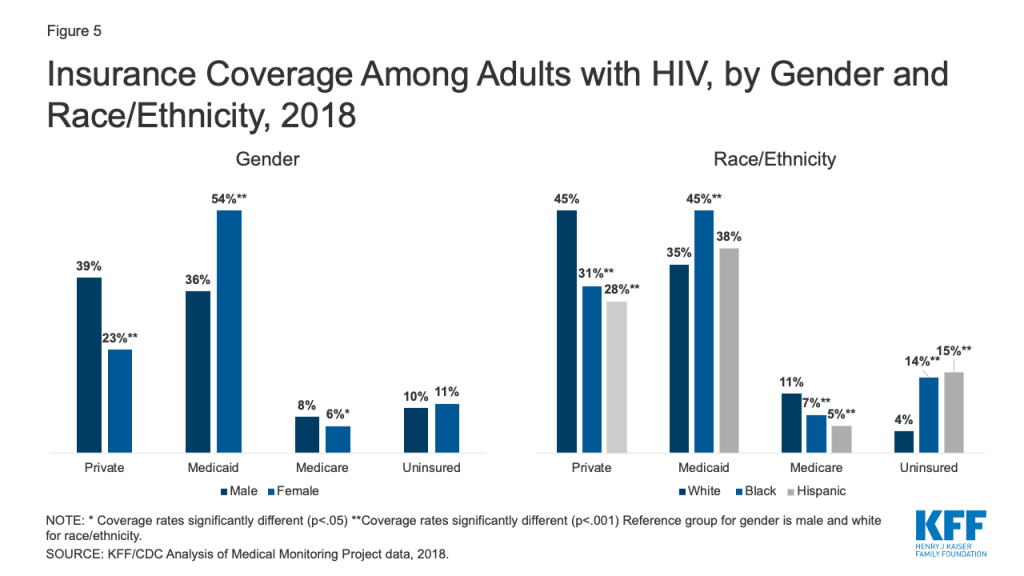
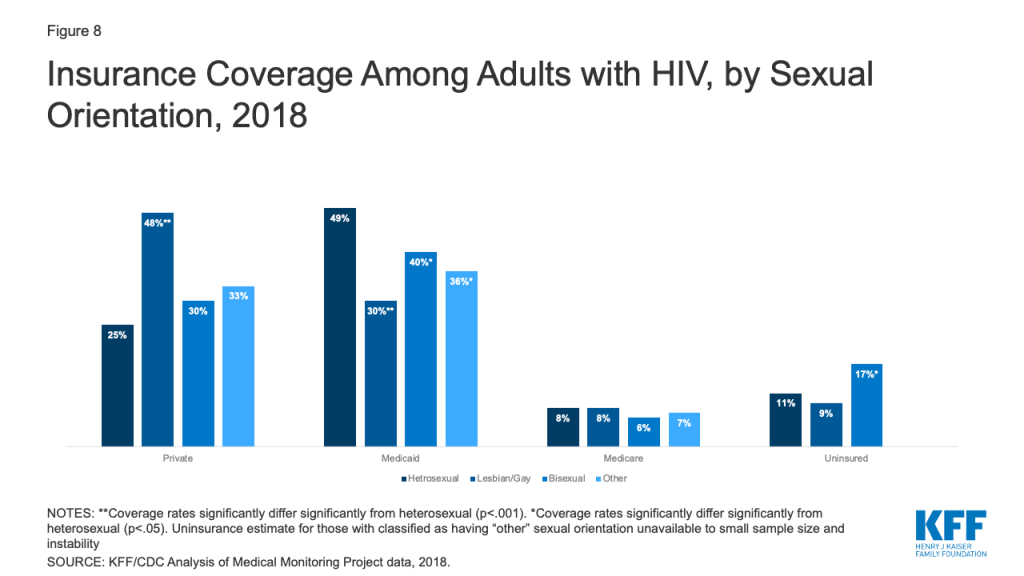
We observed coverage differences among adults with HIV by a range of demographic indicators. For example, men with HIV were almost twice as likely to have private coverage than women. Whites were also more likely to have private coverage compared to Blacks and Hispanics, who were more than three times as likely to be uninsured. We also noted differences by income, place of birth, and sexual orientation.
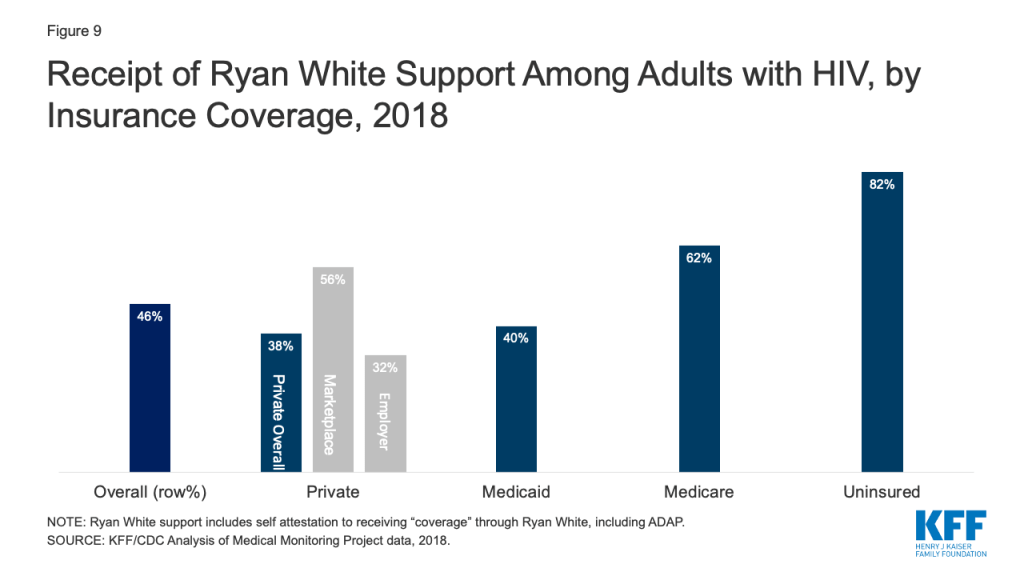
The Ryan White HIV/AIDS Program plays a major role in providing outpatient care and support services to people with HIV, regardless of insurance coverage. In 2018, almost half of all people with HIV (46%) relied on Ryan White, including more than eight in ten (82%) of those who are uninsured.
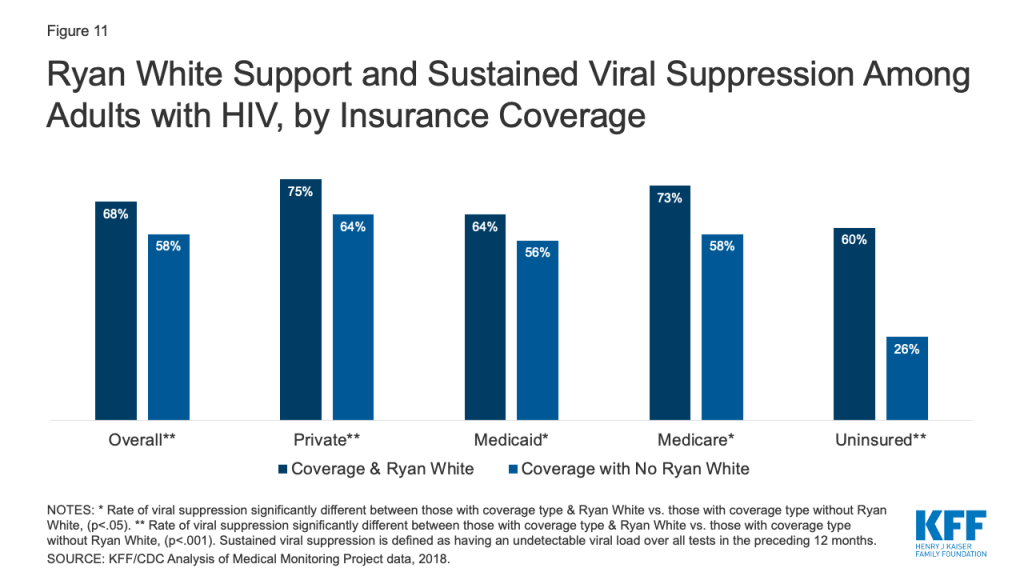
Finally, we find that sustained viral suppression rates varied by payer, and were higher among those with private insurance or Medicare, compared to the uninsured. Viral suppression among those with Medicaid was not significantly different from the uninsured, a finding that could reflect the equalizing role of the Ryan White Program for the uninsured and lower incomes among individuals in these coverage groups. Additionally, those with Ryan White support were significantly more likely to have sustained viral suppression compared those without, regardless of payer.
Introduction
Health insurance coverage and access to care improve health outcomes, including viral suppression, for people with HIV in the United States. Our previous work, based on analysis of nationally representative data from the Centers for Disease Control (CDC) and Prevention’s Medical Monitoring Project (MMP), demonstrated that implementation of the Affordable Care Act’s (ACA) 2014 coverage provisions increased insurance coverage among adults with HIV. In this analysis, using the same data source and building on recent work, we provide a detailed analysis of coverage in 2018, including by state Medicaid expansion status, race/ethnicity, gender, and income. For the first time, we include data on coverage among people with HIV by place of birth and sexual orientation.
Findings
Overall Coverage Findings
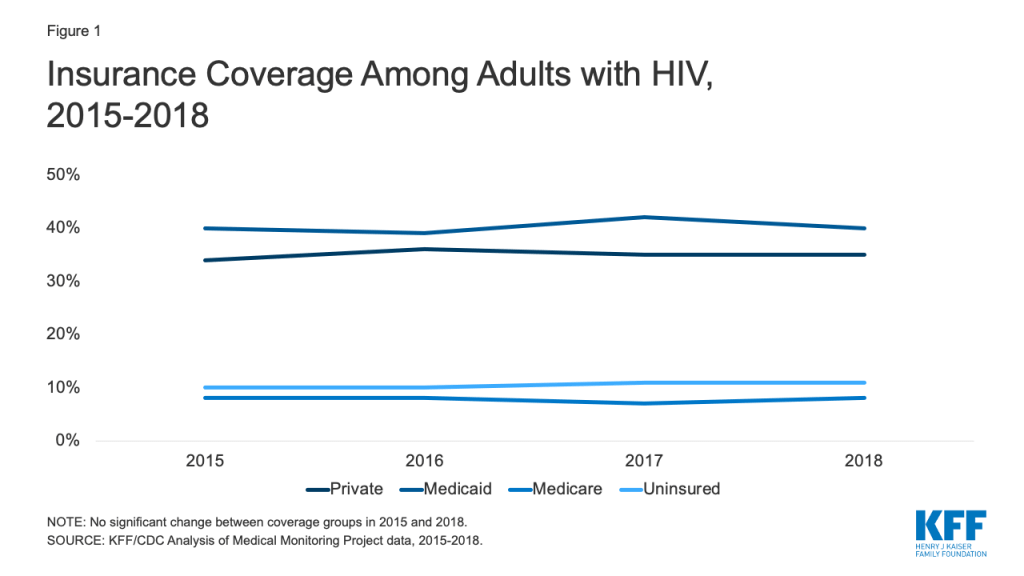
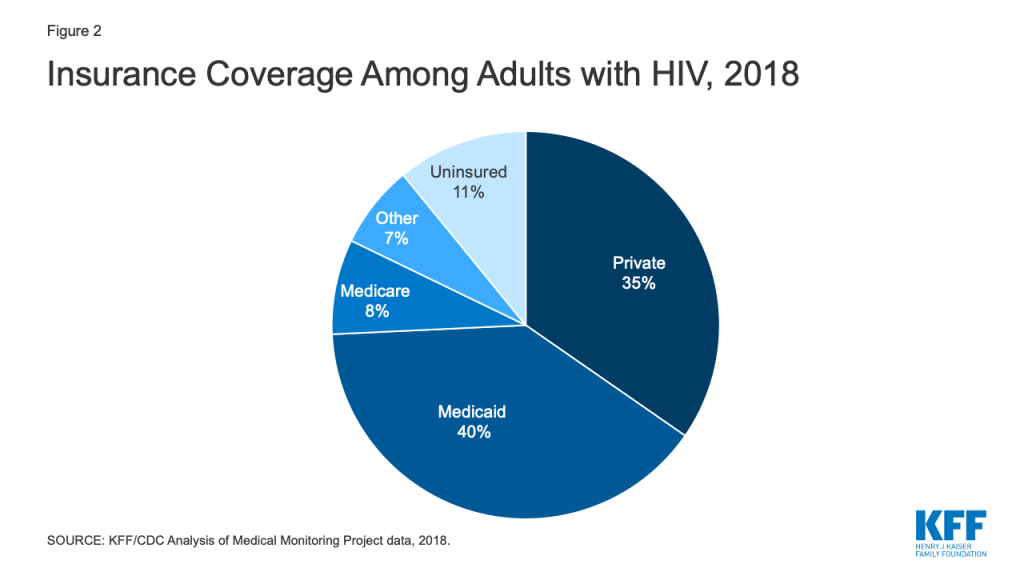
Our earlier research found that prior to the ACA’s major coverage reforms, approximately 18% of people with HIV were uninsured in 2012. While not directly comparable to the current dataset, the share of people with HIV without insurance was just 11% in 2018, suggesting a substantial decline in uninsurance rates among this population. Indeed, implementation of the ACA resulted in a significant increase in coverage and since that time, rates have remained stable (Fig. 1). 1 In 2018, Medicaid was the single largest source of insurance coverage for adults with HIV, covering 4 in 10. Private insurance was the second largest source of coverage, reaching more than one-third of the population (35%) and as noted, just 1 in 10 (11%) were uninsured (Fig. 2), on par with the general population).
Figure 1: Insurance Coverage Among Adults with HIV, 2015-2018Figure 2: Insurance Coverage Among Adults with HIV, 2018
Coverage patterns among adults with HIV differ from those of the general population (Fig. 3). Medicaid plays a much larger role (40% v. 15%) and private insurance a smaller role (35% v 56%) among those with HIV compared to the general population. In addition, people with HIV are less likely to have private coverage through an employer (26% v. 49%) and more likely to have it through the individual market, including the ACA’s marketplaces (7% v. 4%) (not shown). As noted above, uninsurance rates are comparable between the two populations (about 10%).
Figure 3: Insurance Coverage Among Adults with HIV Compared to Adults in the General Population, 2018
Coverage and Medicaid Expansion Status
Our earlier analysis found that Medicaid coverage among adults with HIV grew under the ACA and that this shift was driven by coverage gains in states that expanded their Medicaid programs. In 2018, the outsized role Medicaid plays in expansion states remains; adults with HIV in the expansion states sampled are significantly more likely to be covered by Medicaid compared to those in the sampled states that have not expanded (46% v. 30%). In addition, uninsurance rates in expansion states sampled are nearly three times lower than those in non-expansion states sampled (6% v. 20%). (Fig. 4)
Figure 4: Insurance Coverage Among Adults with HIV by State Medicaid Expansion Status, 2018
Coverage by Key Demographics
We observed coverage differences among adults with HIV by a range of demographic indicators, including, race/ethnicity, gender, income, and, for the first time, place of birth and sexual orientation.
Gender: Male adults with HIV were almost twice as likely to have private coverage (39% v. 23%) and more likely to have Medicare than females (8% v. 6%), while females were more likely to have Medicaid (54% v. 36%). Women’s greater likelihood of Medicaid coverage could reflect eligibility based on lower incomes and categorical eligibility based on being pregnant, parent of a dependent child, higher rates of disability. Rates of uninsurance do not differ significantly by gender. (Fig. 5)
Race/ethnicity: White adults with HIV were more likely than Blacks and Hispanics to have private insurance (45% v. 31% and 28%, respectively) and Medicare (11% v. 7% and 5%, respectively) and less likely than Blacks to have Medicaid (35% v 45%). Notably, Blacks and Hispanics were more than three times as likely as Whites to be uninsured (14% and 15%, respectively vs. 4%). These trends reflect in part, disparities seen in coverage by race/ethnicity nationwide, including that people of color are more likely than White to live in non-expansion states, (Fig. 5)
Figure 5: Insurance Coverage Among Adults with HIV, by Gender and Race/Ethnicity, 2018
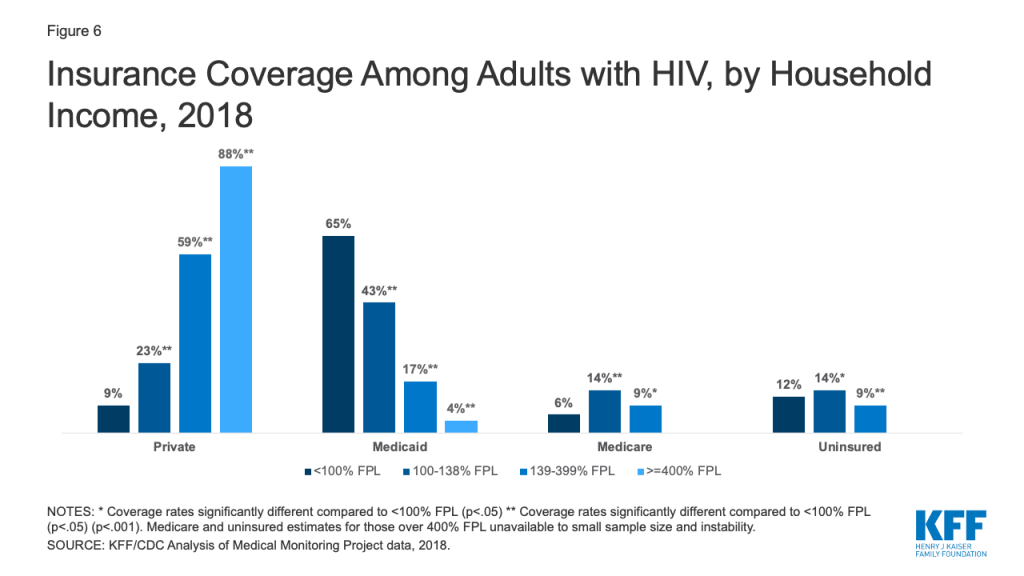
Income. Those with household incomes <100% of the federal poverty level (FPL) ($12,140 for an individual in 2018) were significantly less likely to have private coverage compared to all other income groups and most likely to have Medicaid coverage. This likely reflects the association between income and access to employment benefits and marketplace subsidies. The percentage of people with HIV with private healthcare coverage increased, and Medicaid coverage decreased, with increasing household income. (Fig. 6)
Figure 6: Insurance Coverage Among Adults with HIV, by Household Income, 2018
U.S. Born. Nine in 10 adults (86%) with HIV in the U.S. were born in country whereas 15% were born abroad.2 These individuals were significantly less likely to have the publicly funded health coverage sources, Medicaid and Medicare, than those born in the U.S (28% v. 42% and 4% v. 8%, respectively), potentially reflecting citizenship and residency requirements in public coverage. This group was also three times as likely to be uninsured compared to U.S. born counterparts (24% v. 8%). (Fig. 7)
Figure 7: Insurance Coverage Among Adults with HIV, by Place of Birth, 2018
Sexual Orientation. Overall, 47% of adults with HIV identify as heterosexual and 41% as lesbian or gay. Smaller shares identify as bisexual (9%) or as “something else” (3%). Heterosexual adults with HIV, who are disproportionally Black and Latina women, were less likely than lesbian and gay adults with HIV to have private insurance coverage (25% v. 48%) and more likely to have Medicaid (49% v. 30%). Bisexual adults with HIV were less likely to have Medicaid (40% v. 49%) and more likely to be uninsured than heterosexuals (17% v. 11%). (Fig. 8)
Figure 8: Insurance Coverage Among Adults with HIV, by Sexual Orientation, 2018
Coverage and Ryan White
The federal Ryan White HIV/AIDS Program provides outpatient HIV care, treatment, and support services to people with HIV who are underinsured and uninsured. In 2018, nearly half (46%) of adults with HIV received support from the program. The program provides assistance to those with and without coverage but plays an especially significant role for the uninsured, 82% of whom receive program services. Those who are uninsured may receive direct medical care and prescription drugs through the program, as well as support services. Ryan White also plays a meaningful role for those with insurance coverage, addressing gaps in coverage (e.g. providing support services not included in traditional coverage) and assisting with costs associated with insurance (e.g. insurance premiums and out-of-pocket costs related to HIV medication). Sixty-two percent (62%) of those with Medicare receive Ryan White support. Among those with private insurance, almost 4 in 10 (38%) receive assistance through the program. This share was significantly higher among those with marketplace coverage (56%) compared to employer-based coverage (32%), potentially reflecting the role Ryan White plays in helping clients purchase individual insurance coverage. It could also reflect higher cost-sharing for many in individual insurance (Fig. 9).
Figure 9: Receipt of Ryan White Support Among Adults with HIV, by Insurance Coverage, 2018
Coverage and Viral Suppression
Viral suppression (defined as having an undetectable viral load at the time of last available laboratory data) is a critical health indicator, affording optimal health outcomes at the individual level and, because when an individual is virally suppressed they cannot transmit HIV, significant public health benefit. However, because viral suppression can change over time, especially depending on treatment adherence, it is particularly important to look at sustained viral suppression (defined as having an undetectable viral load over all tests in the preceding 12 months), a stronger indicator of long-term adherence antiretroviral treatment and its associated preventive benefits. In 2018, 68% of people with HIV were virally suppressed at last test and 62% had sustained viral suppression, the same share as in 2015. (Fig. 10)
Certain insurance types were positively associated with sustained viral suppression. The proportion of people with sustained viral suppression was significantly higher among those with private insurance, including those with employer-sponsored and marketplace coverage, and among those with Medicare, compared to the uninsured. Viral suppression rates among those with Medicaid were not significantly different from the uninsured, a finding that could reflect the equalizing role of the Ryan White Program for the uninsured. Lower viral suppression rates among those with Medicaid and the uninsured compared to those with other coverage types, could be accounted for by lower household income, among other, largely related, factors. (Fig. 10)
Figure 10: Sustained Viral Suppression Among Adults with HIV, by Insurance Coverage, 2018
Ryan White support appears to make a significant difference in achieving sustained viral suppression. Overall, those with Ryan White support were significantly more likely to have sustained viral suppression compared to those without (68% v. 58%) and this pattern was observed across all coverage types, and was especially apparent among the uninsured (60% v 26%). (Fig. 11)
Figure 11: Ryan White Support and Sustained Viral Suppression Among Adults with HIV, by Insurance Coverage
Discussion
In 2018, the uninsurance rate among people with HIV was similar to that of the public at large. Medicaid represented the single largest source of coverage for people with HIV, particularly in Medicaid expansion states, followed closely by private insurance. We observed significant differences in coverage by gender, income, and race/ethnicity, with notable disparities related to rates of uninsurance by race/ethnicity. We also provide the first national data on adults with HIV and insurance coverage by place of birth and sexual orientation. The Ryan White Program is a significant source of care, treatment, and support for people with HIV, especially for the uninsured but also for a substantial share of those with coverage. Certain insurance sources and support from Ryan White were associated with greater rates of sustained viral suppression, a crucial indicator of optimizing the individual and public health benefits associated with antiretroviral treatment.
The ACA has made a significant difference in expanding insurance coverage for people with HIV, yet its future continues to be contested terrain. On the one hand, the Trump Administration is seeking to invalidate the law before the Supreme Court, while on the other hand, states, including states with leadership that has opposed the ACA, continue to adopt Medicaid expansion through voter led ballot initiatives; as of September 2020, 39 states (including D.C.) have adopted Medicaid expansion. In addition, health care could be a major issue in the 2020 elections with candidates President Trump and Democratic nominee Joe Biden holding deeply diverging views on the issue. Their different policy perspectives and positions stand to significantly impact coverage, and likely care outcomes, for people with HIV, as well as the success of the administration’s “Ending the HIV Epidemic” initiative.
Acknowledgments
The authors wish to thank Dr. Sharoda Dasgupta, Dr. Linda Beer, and Dr. Yunfeng Tie of the CDC, who were instrumental in this work in providing access to data, guidance, and conducting statistical analysis.
This work was supported in part by the Elton John AIDS Foundation. We value our funders. KFF maintains full editorial control over all of its policy analysis, polling, and journalism activities.
Methods
Data Sources
Coverage Data on General Population
All general population coverage data, except for marketplace coverage, is limited to adults and comes from KFF analysis of the 2018 American Community Survey (ACS).
General population marketplace coverage is an estimate based off the number of nonelderly adults with effectuated marketplace enrollment in 2018. Overall marketplace enrollment in 2018 was 9,895,197. The share estimated to be nonelderly adults was based off data on characteristics of individuals who selected a marketplace plan, whereby 9% of marketplace plan selectors were under 18. We assumed that age characteristics of those with effectuated marketplace enrollment were similar to those who had selected plans and subtracted 9% (890,568) from the effectuated enrollment total to obtain an estimated adult marketplace enrollment of 9,004,629 or 4% of the non-elderly adult ACS population (242,620,816).
Data on People with HIV
Data on people with HIV are based on 2015-2018 data from the Medical Monitoring Project (MMP), a Centers for Disease Control and Prevention (CDC) surveillance system which produces national and state-level representative estimates of behavioral and clinical characteristics of adults with diagnosed HIV in the United States.
Between 2015 and 2018, MMP employed a two-stage, complex sampling design. First, jurisdictions are selected from all U.S. states, the District of Columbia, and Puerto Rico using a probability proportional to size sampling strategy based on AIDS prevalence at the end of 2002, such that areas with higher prevalence had a higher probability of selection. Next, adults (aged 18 years and older) with diagnosed HIV were sampled from selected jurisdictions from the National HIV Surveillance System (NHSS), a census of US persons with diagnosed HIV. During 2015-2018, data come from: California (including the separately funded jurisdictions of Los Angeles County and San Francisco), Delaware, Florida, Georgia, Illinois (including the separately funded jurisdiction of Chicago), Indiana, Michigan, Mississippi, New Jersey, New York (including the separately funded jurisdiction of New York City), North Carolina, Oregon, Pennsylvania (including the separately funded jurisdiction of Philadelphia), Puerto Rico, Texas (including the separately funded jurisdiction of Houston), Virginia, and Washington.
Data used in this analysis were collected via telephone or face-to-face interviews and medical record abstractions during the following periods.
2015 data was collected between June 1, 2015 – May 31, 2016
2016 data was collected between June 1, 2016 – May 31, 2017
2017 data was collected between June 1, 2017- May 31, 2018
2018 data was collected between June 1, 2018 – May 31, 2019
In 2018, the primary year of analysis, of 9,700 sampled persons, 4,050 participated. Adjusted for eligibility, the response rate was 45%. Data were weighted based on known probabilities of selection at state or territory and patient levels. In addition, data were weighted to adjust for non-response using predictors of person-level response, and post-stratified to NHSS population totals by age, race/ethnicity, and sex at birth. Although characteristics associated with nonresponse varied among states and territories, the weighting classes for the national data were informed by sex at birth, age of most recent contact information, and the person’s frequency of receipt of care (as indicated by NHSS records). This analysis includes information on 4,050 participants who represent all adults with diagnosed HIV in the United States and Puerto Rico.
Analysis
For all respondents in MMP, we examined self-reported insurance coverage. Response options included insurance programs (Medicaid, Medicare, private insurance – employer and marketplace -, Ryan White HIV/AIDS Program – Ryan White or the AIDS Drug Assistance Program-, Veteran’s Administration, Tricare or CHAMPUS coverage, other public insurance, and other unspecified insurance). “Other specify” responses were recoded to reflect the most accurate coverage type when possible. It is important to note that respondents may not be aware of all the services they receive that are paid for by the Ryan White HIV/AIDS Program (the program provides funding directly to service organizations in many cases) and therefore, the estimates of the number of individuals who receive Ryan White HIV/AIDS Program services is likely an underestimate.
We estimated weighted percentages of individuals with the following types of health care coverage: no coverage (uninsured), private insurance (with breakouts for employer coverage and marketplace coverage), Medicaid, Medicare, and other. Because respondents in MMP may indicate more than one type of coverage, we relied on a hierarchy to group people into mutually exclusive coverage categories. Specifically, the hierarchy groups people into coverage types in the following order:
Private coverage overall (with breakouts for employer coverage and marketplace coverage)
Medicaid coverage, including those dually eligible for Medicare
Medicare coverage only
Other public coverage, including Tricare/CHAMPUS, Veteran’s Administration, or city/county coverage
In most cases, this hierarchy classified individuals according to the coverage source that served as their primary payer. People who did not report any of the sources of insurance coverage were classified as uninsured. We separately assess weighted percentages of persons receiving assistance through the Ryan White HIV/AIDS Program by health coverage type.
Statistical comparisons were made using Rao-Scott chi-square tests to account for complex survey design.
Limitations
MMP only allows for extrapolation to the national level when using the full sample. Similar extrapolation is not possible when examining coverage changes in and contrasting Medicaid expansion states and non-expansion states. The Medicaid expansion and non-expansion coverage data presented here are representative only of the subset of states sampled that fell into each group. Insurance coverage data is self-reported by respondents and not verified. By relying on a hierarchy to group individuals into coverage categories, it is possible individuals were grouped into a coverage category that was not their dominant payer over the course of a year.
Endnotes
We believe this stability in part reflects the fact that the states with greatest HIV prevalence have not changed their expansion status since 2014 (i.e. CA, NY, FL, GA, and TX). While several states have expanded since then, some did so after 2018 (the end year for the data in this report). Those that did expand between 2015 and 2018, had relatively low high HIV prevalence. In addition, we are limited by the states in the MMP sample. ↩︎
Percentages do not add to 100% due to rounding. ↩︎
With a Supreme Court Challenge Looming, Swing Voters in 3 Key Sun Belt States Give Democratic Nominee Biden a Big Advantage on the ACA’s Future and Pre-Existing Condition Protections
Suburban Voters in the 3 States (Arizona, Florida and North Carolina) are Divided in Who They Trust on Health Care Overall, but Florida Suburban Voters Give Biden the Edge on the ACA and Pre-Existing Condition Protections
The death of Supreme Court Justice Ruth Bader Ginsburg is drawing renewed attention to a pending Supreme Court challenge to the Affordable Care Act (ACA), supported by the Trump administration, that threatens to overturn the entire law, including its protections for people with pre-existing conditions.
To assess how the renewed attention to the case, which will be argued a week after Election Day, could motivate voters ahead of the presidential election, KFF and The Cook Political Report analyzed recent polling from three competitive Sun Belt states (Arizona, Florida, and North Carolina).
Fielded prior to Justice Ginsburg’s death, the polls find that Democratic nominee Joe Biden has a considerable advantage among voters on which presidential candidate they think has the better approach to determining the future of the Affordable Care Act, as well as maintaining protections for people with pre-existing health conditions.
More than half of voters in Arizona, Florida, and North Carolina say Biden has the better approach on the ACA (55% in each state) compared to four in ten voters who say President Trump (41% in AZ and NC, 40% in FL).
This is similar to the share who say Biden has the better approach to maintaining protections for people with pre-existing conditions (AZ: 55%, FL: 54%, NC: 53%) compared to President Trump (AZ: 40%, FL: 41%, NC: 43%).
Swing voters, the crucial group of voters who are either entirely undecided or not firm in their vote choice, and for some there is a chance they may vote for the other candidate, give Biden the advantage on all key health care issues, including the ACA and maintaining pre-existing conditions.
About twice as many swing voters across the three states say Biden has the better approach on the ACA (AZ: 60%, FL: 69%, NC: 61%) than President Trump (AZ: 32%, FL: 24%, NC: 33%). Biden’s advantage also holds among swing voters across the three states on maintaining pre-existing condition protections, with more than half of swing voters saying Biden has the better approach (AZ: 60%, FL: 68%, NC: 59%). In fact, on all key health care issues asked about in the survey, Biden has the advantage among swing voters.
The analysis also examines the views of suburban voters in the three states on health care, and finds overall they are divided in who they trust the most on health care, with similar shares saying Biden (50%) and Trump (48%).
When it comes to the ACA’s future and maintaining pre-existing conditions protections, suburban voters across the three states give Biden a slight advantage. He holds a 10 percentage point advantage over President Trump on determining the future of the ACA (53% v. 43%) and a narrower advantage on maintaining pre-existing condition protections (52% v. 44%).
North Carolina suburban voters are more divided on which candidate has the better approach to handle some health care issues, including the future of the ACA and maintaining protections for people with pre-existing conditions, and give President Trump a clear advantage on lowering overall health care costs (55% v. 42%) and prescription drug costs (55% v. 43%).
MethodologyDesigned and analyzed by public opinion researchers at KFF in collaboration with The Cook Political Report, the poll was conducted between Aug. 29 and Sept. 13, among a representative random sample of 3,479 registered voters in three Sun Belt states (1,298 in Arizona, 1,009 in Florida, and 1,172 in North Carolina). The poll relies on an innovative probability-based methodology designed to address shortcomings with telephone-only surveys based on either voter-registration rolls or random-digit dialing. Voters were contacted via mailing address using registration-based sampling and encouraged to participate in the survey either online or by telephone, and follow-up contacts were made using outbound telephone calls. The margin of sampling error is plus or minus 4 percentage points in Florida and 3 percentage points in Arizona and North Carolina. For results based on subgroups, the margin of sampling error may be higher.
A week after the 2020 elections, the Supreme Court is scheduled to hear arguments on a legal challenge, supported by the Trump administration, that seeks to overturn the Affordable Care Act, an outcome that would have major effects throughout the health care system as the law’s provisions have affected nearly all Americans in some way.
A KFF analysis examines key provisions of the 2010 law that have changed the nation’s health care system, including what’s known about their impact on people’s access to affordable care and coverage, including state-by-state data where available. Key impacts include:
About 12 million Medicaid enrollees in 33 states and D.C. became newly eligible for the program through Medicaid expansion as of June 2019. This includes 3.7 million in California and at least half of a million each in Pennsylvania, Michigan, Illinois, Washington, Ohio and New Jersey.
As of February, 10.7 million people were enrolled in coverage through the health insurance marketplaces created under the ACA, including 9.2 million who received premium tax credits and 5.3 million who got cost-sharing reductions. In Florida, Mississippi, Alabama, Nebraska and Oklahoma, at least 95% of marketplace enrollees receive premium tax credits and/or cost-sharing subsidies.
Insurers can no longer deny coverage for pre-existing conditions, charge higher premiums based on health status or gender, revoke coverage when someone gets sick or impose annual or lifetime limits. About 54 million people have a pre-existing condition that could have resulted in them being denied coverage in the pre-ACA individual market. This includes more than a third of residents in Alabama, Arkansas, Kentucky, Louisiana, Mississippi and West Virginia.
Private insurers now must cover a wide range of preventive services at no out-of-pocket costs to consumers. This includes recommended cancer and chronic condition screenings, immunizations, and other services. Nearly 150 million people are enrolled in employer plans or through individual market insurance that must provide these free preventive services.
The law phased out the Medicare coverage gap, often called the “doughnut hole” by gradually reducing the share of total drug costs paid by Part D enrollees in the coverage gap. About 46 million Medicare beneficiaries are enrolled in Part D drug plans.
About 2.3 million young adults gained coverage due to the ACA’s provision allowing adult children to remain on their parents’ insurance plan up to age 26.
The analysis is part of KFF’s ongoing efforts to provide useful information related to the health policy issues relevant for the 2020 elections, including policy analysis, polling, and journalism. Find more on our Election 2020 resource page.
The Supreme Court will review the constitutionality of the Affordable Care Act (ACA) this November in California v. Texas (known as Texas v. U.S. in the lower courts). Late last year, a federal appeals court panel ruled that the ACA’s individual mandate is unconstitutional, since Congress has set the mandate tax penalty to zero. The case was brought by a number of Republican state officials and two individuals, who argue that the rest of the ACA is not severable from the mandate and should therefore be invalidated. The Trump administration now argues that nearly all of the ACA should be found invalid but that the courts should prohibit it from enforcing only the provisions found to harm the individual plaintiffs. It previously argued that only the ACA’s pre-existing condition protections should be overturned.1 Pending a final decision on the case, the Trump administration has continued to enforce the ACA.
The ACA’s reforms affect nearly every American in some way, and a Supreme Court decision that invalidated the ACA would have complex and far-reaching impacts throughout the health care system. While the ACA’s changes to the individual insurance market – including protections for people with pre-existing conditions and premium subsidies for low and modest income people – have been the focus of much policy debate and media coverage, the law made many other sweeping changes. These include: the expansion of Medicaid eligibility for low-income adults; required coverage of preventive services with no cost-sharing in private insurance, Medicare, and for those enrolled in the Medicaid expansion; new national initiatives to promote public health and quality of care; and a variety of tax increases to finance these changes. The number of uninsured Americans decreased by 20 million from 2010 to 2016 as the ACA went into effect, but has since increased by 2.3 million from 2016 to 2019.
The following table summarizes the major provisions of the ACA, illustrating the breadth of its changes to the health care system, and public attitudes towards those changes. If all or most of the ACA is struck down, many of these provisions could be eliminated.
Due to differences in populations and policies across states, the potential repeal of the ACA would play out differently from state to state. For example, over 50 million people had a declinable health condition in 2018, including over a third of the population in West Virginia, Arkansas and Mississippi. The appendix shows the state-by-state impacts of these key ACA provisions. A link to state-level data is included in the table below when data are available.
Medicaid eligibility is expanded to include adults with income up to 138% FPL; however, the Supreme Court ruling in 2012 essentially made Medicaid expansion optional for states.
The federal government paid 100% of the cost of the expansion initially; this share phased down to 93% in 2019 and 90% in 2020 and beyond
In June 2019, there 14.8 million Medicaid expansion enrollees in the 34 states and DC that had adopted the expansion. Of those enrollees, 12 million were newly eligible due to the ACA’s Medicaid expansion
87% say it is “very important” (57%) or “somewhat important” (29%) that the part of the law that gives states the option of expanding their Medicaid programs to cover more low-income, uninsured adults remains in place if the ACA is ruled unconstitutional (July 2019)
66% of those living in non-expansion states would like to see their state expand Medicaid (May 2020)
Subsidies for Nongroup Health Insurance
Eligible individuals who buy coverage through the Marketplace receive subsidies based on income: premium tax credits for those with income 100-400% FPL; cost-sharing subsidies for those with income 100-250% FPL
States can also elect to run a subsidized Basic Health Plan for people with income between 133%-200% FPL
As of February 2020, 9.2 million Marketplace enrollees received premium tax credits and 5.3 million received cost-sharing reductions
In 2020, there are about 0.9 million people enrolled in the Basic Health Plans in Minnesota (83,200) and New York (796,998)
85% say it is “very important” (57%) or “somewhat important” (28%) that the part of the law that provides financial help to low- and moderate-income Americans who buy their own insurance remains in place if the ACA is ruled unconstitutional (July 2019)
Dependent Coverage to 26
All non-grandfathered private group and non-group health plans must extend dependent coverage to adult children up to the age of 26
About 2.3 million young adults gained coverage as a result of this provision
78% of the public say it is “very important” (51%) or “somewhat important” (27%) that the part of the law that allows young adults to stay on their parents’ insurance plans until age 26 remains in place if the ACA is ruled unconstitutional (July 2019)
Health Insurance Marketplace
Establish new marketplaces where qualified health plans are offered to individuals
Marketplaces certify that qualified health plans meet all ACA requirements, provide subsidies to eligible individuals, operate a website to facilitate application and comparison of health plans, provide a no-wrong-door application process for individuals to determine their eligibility for financial assistance, and provide in-person consumer assistance through navigators
10.7 million individuals had effectuated coverage through the Marketplace as of the first quarter of 2020
67% of Marketplace enrollees will have a choice of three or more insurers in 2020
26 insurers are entering state Marketplaces for 2020
Individual market gross profit margins have been higher, on average, in 2017-2019 than before the ACA was implemented
82% of the public (91% of Dems, 78% of Inds, 71% of Reps) have a favorable view of creating health insurance exchanges where people and small businesses can shop for insurance (Nov 2018)
45% say that the health insurance marketplaces are working well in the nation overall, while 47% say they are not working well (November 2019)
52% say that the health insurance marketplaces in their state are working well, while 39% say they are not working well. Those in states with state-run marketplaces are more likely to say they are working well than those in states using healthcare.gov (58% vs. 48%) (November 2019)
Federal Minimum Standards for Private Health Insurance
Key Provisions
Impact
Public Opinion
Protections for Pre-existing Conditions
All non-grandfathered plans are prohibited from discriminating against individuals based on their health status
Insurers in the non-group, small group, and large group market must guarantee issue coverage
Large group, small group, and non-group health plans are prohibited from applying pre-existing condition exclusions
Insurers in the non-group and small group market may not vary premiums based on health status or gender or any other factor except:
Premiums can vary by age (by a factor of 3:1), geography, family size, and tobacco use
Rescission of coverage is prohibited in the non-group, small group, and large group market
54 million people (27% of the non-elderly population) have a pre-existing condition that would have been deniable in the pre-ACA individual market
45% of non-elderly families have at least one adult member with a pre-existing condition
Majorities say it is “very important” to them that the ACA provisions prohibiting insurance companies from denying coverage (72%) or charging sick people more (64%) remain in place if the ACA is ruled unconstitutional (July 2019)
62% overall (75% of Dems, 63% of Inds, 47% of Reps) do not want to see the Supreme Court overturn the protections for people with pre-existing conditions established by the ACA (November 2019)
57% of Americans say someone in their household has a pre-existing health condition (April 2019)
57% are “somewhat worried” (22%) or “very worried” (35%) that they or a family member will lose coverage if the Supreme Court overturns ACA’s pre-existing condition protections (January 2020)
62% are “very worried” (44%) or “somewhat worried” (18%)” that they or a family member will not be able to afford coverage in the future if the Supreme Court overturns ACA’s pre-existing condition protections (April 2019)
Preventive Services
All non-grandfathered group and non-group plans must cover preventive health services without cost sharing
Covered services include breast, colon, and cervical cancer screening, pregnancy-related services including breastfeeding equipment rental, contraception, well-child visits, adult and pediatric immunizations, and routine HIV screening. In addition, it was recently recommended that pre-exposure prophylaxis (PREP) to prevent HIV infection be included as well and if finalized, would be offered at no cost
87% of covered workers with employer-sponsored insurance (approximately 133 million people) were enrolled plans that must provide free preventive services as of 2019
12.7 million people were enrolled in individual market plans required to provide free preventive services, as of February 2019
14.8 million enrollees in Medicaid expansion states received coverage for preventive services in 2019
Prior to the ACA, 1 in 5 women reported that they postponed or went without preventive care due to cost
The share of reproductive age women with private insurance reporting that their insurance covered the full costs of their prescription contraception rose from 45% in 2013 to 75% in 2017
89% say it is “very important” (62%) or “somewhat important” (27%) that the part of the ACA that requires private health insurance companies to cover the cost for most preventive services with no cost sharing remains in place if the ACA is ruled unconstitutional (July 2019)
Essential Health Benefits
All ACA compliant health plans in the individual and small group market must cover 10 categories of essential health benefits (EHB), including hospitalization, outpatient medical care, maternity care, mental health and substance abuse treatment, prescription drugs, habilitative and rehabilitative services, and pediatric dental and vision services
In 2013, before the ACA EHB requirements took effect, 75% of non-group health plans did not cover maternity care, 45% did not cover substance use disorder treatment, and 38% did not cover mental health services
66% of the public (81% of Dems, 65% of Inds, 52% of Reps) say they want the federal government to continue to require health insurance companies to cover a certain set of benefits (June 2017)
Annual and Lifetime Limits
All group and non-group plans (including grandfathered) are prohibited from placing lifetime limits on the dollar value of coverage for essential health benefits. In addition, all non-grandfathered group and non-group plans are prohibited from placing annual dollar limits on coverage of essential health benefits
Prior to the ACA, in 2009, 59% of covered workers’ employer-sponsored health plans had a lifetime limit
62% of the public say it is “very important” that the part of the ACA that prohibits private health insurance companies from setting a dollar limit on how much they will spend on your coverage during your lifetime remains in place if the law is ruled unconstitutional (July 2019)
51% of the public say it is “very important” that the part of the ACA that prohibits private health insurance companies from setting a dollar limit on how much they will spend on your coverage each year remains in place if the law is ruled unconstitutional (July 2019)
Cap on Out-of-Pocket Cost Sharing
All non-grandfathered private health plans must limit cost sharing for essential health benefits covered in network
The annual maximum for 2020 is $8,150 for an individual; $16,300 for family coverage
Prior to the ACA, in 2009, 19% of covered workers had no limit on out-of-pocket expenses. Among those with out-of-pocket maximums, not all expenses counted toward the limit. For example, in 2009, among workers in PPOs with an out-of-pocket maximum, 85% were in plans that did not count prescription drug spending when determining if an enrollee had reached the out-of-pocket limit
Minimum Medical Loss Ratios
Require all non-grandfathered private plans to pay a minimum share of premium dollars on clinical services and quality
Insurers must provide rebates to consumers for the amount of the premium spent on clinical services and quality that is less than 85% for plans in the large group market and 80% for plans in the individual and small group markets
In total, over $5 billion in medical loss ratio rebates have been issued across the individual, small group, and large group markets, from 2012 to 2019 (based on insurer financial results from the 2011-2018 plan years)
62% of the public (68% of Dems, 64% of Inds, 54% of Reps) say they favor requiring insurance companies that spend too little money on health care services and too much on administrative costs and profits to give their customers a rebate (March 2014)
Consumer Information and Transparency
All non-grandfathered health plans must provide a brief, standardized summary of coverage written in plain language
All non-grandfathered health plans must periodically report transparency data on their operations (e.g., number of claims submitted and denied)
Transparency data collected by CMS for PY 2017 indicate that, on average, healthcare.gov issuers deny 18% of in-network claims, and that consumers rarely appeal denied claims
79% of the public have a favorable view, including 91% of Dems, 78% of Inds, 68% of Reps (August 2012)
Other Provisions Affecting Employers/Group Health Plans
Key Provisions
Impact
Public Opinion
Large Employer Mandate
Requires employers with at least 50 full time workers to provide health benefits or pay a tax penalty
Favored by a majority across parties: 69% overall have a favorable view, including 88% of Dems, 61% of Inds, 56% of Reps (November 2018)
Waiting Periods
Employers that impose waiting periods on eligibility for health benefits (e.g., for new hires) must limit such periods to no more than 90 days
Prior to the ACA, in 2009, 29% of covered workers faced a waiting period of 3 months or more
Consumer Assistance
Key Provisions
Impact
Public Opinion
State Consumer Assistance Programs
Authorize federal grants for state Consumer Assistance Programs (CAPs) to advocate for people with private coverage.
Notice of claims denials by non-grandfathered private plans must include information about state CAPs that will help consumers file appeals
CAPs were established in most states in 2010, though no appropriations for CAPs have since been enacted. Today 36 CAPs are in operation
A report on the first year of CAP operations found the programs helped 22,814 individuals successfully challenge their health plan decisions and obtained more than $18 million on behalf of consumers
Other Medicaid Provisions
Key Provisions
Impact
Public Opinion
Simplification of Enrollment Processes
States are required to simplify Medicaid and CHIP enrollment processes and coordinate enrollment with state health insurance exchanges
Prior to the ACA in 2013, 27 states had an asset test and 6 required face-to-face interviews for parents; only 36 states had an online Medicaid application and 17 states allowed individuals to apply by phone. As of January 2020, individuals can apply for Medicaid online and by telephone in all states for the first time, and all states had eliminated asset tests and face-to-face interviews
Long-term Care Services and Supports
Expands financial eligibility for 1915(i) home and community-based services (HCBS), creating a new eligibility pathway to allow people not otherwise eligible to access full Medicaid benefits, allows states to target services to specific populations, and expands the services covered
Creates a new Medicaid state plan option to cover attendant care services and supports with 6% enhanced FMAP
11 states elected the option to expand eligibility for 1915(i) HCBS services as of 2018. 81,000 individuals received services and over $641 million was spent on these services
As of 2018, 8 states elected the option to cover attendant care services. 392,700 individuals received services and $8.6 billion was spent on these services
Mental health and substance use disorder services must be included in Medicaid Alternative Benefit Packages (ABPs) provided to Medicaid expansion adults and other adults, and the services must be covered at parity with other medical benefits
14.8 million Medicaid expansion enrollees receive services through an ABP
Medicaid Eligibility for Former Foster Care Youth up to Age 26
Requires states to provide Medicaid to young adults ages 21 through 26 who were formerly in foster care.
Medicaid Drug Rebate Percentage
Increase Medicaid drug rebate percentage for most brand name drugs to 23.1% and increase Medicaid rebate for non-innovator multiple source drugs to 13%. Extend drug rebate program to Medicaid MCOs
CBO estimated federal savings of $38 billion over 10 years from the Medicaid prescription drug provisions in the ACA, including increases in the drug rebate percentage
Gradually close the Medicare Part D coverage gap (“doughnut hole”):
Phase down the beneficiary coinsurance rate for brand and generic drugs In the Medicare Part D coverage gap from 100% to 25% by 2020
Require drug manufacturers to provide a 50% discount on the price of brand-name and biologic drugs in the coverage gap
Reduce the growth rate in the catastrophic coverage threshold amount between 2014 and 2019 to provide additional protection to enrollees with high drug costs
46 million people were enrolled in Medicare Part D in 2020
In 2018, nearly 5 million Part D enrollees without low-income subsidies (LIS) had spending in the coverage gap and received manufacturer discounts averaging $1,184 on brand-name drugs
Reinstating the coverage gap would increase costs incurred by Part D enrollees who have relatively high drug spending
81% of the public (79% of seniors) has a favorable view that “the law gradually closes the Medicare prescription drug ‘doughnut hole’ or ‘coverage gap’ so people on Medicare will no longer be required to pay the full cost of their medications when they reach the gap” (Nov 2018)
Preventive Services
Eliminate cost sharing for Medicare covered preventive services. Authorize coverage of annual comprehensive risk assessment for Medicare beneficiaries
60 million people have access to free preventive services; of these, Medicaid pays Medicare cost sharing for about 9 million dual eligibles
Cost Sharing in Medicare Advantage (MA)
Prohibit MA plans from imposing higher cost-sharing requirements than traditional Medicare for chemotherapy, renal dialysis, skilled nursing care, and other services deemed appropriate by the Secretary of HHS. This prohibition was extended to most Medicare-covered services
24 million people enrolled in Medicare Advantage plans in 2020
Reduce federal payments to Medicare Advantage plans to bring payments closer to the average Medicare spending for beneficiaries in traditional Medicare
Provide quality-based bonus payments to Medicare Advantage plans
Require Medicare Advantage plans to maintain a medical loss ratio of at least 85 percent; the administration extended this requirement to all Part D plans
CBO estimated repeal of the ACA Medicare Advantage payment changes would increase Medicare spending by about $350 billion over 10 years (2016-2025)
74 percent of Medicare Advantage enrollees were in plans that were eligible for bonus payments in 2019; Bonus payments summed to $6.3 billion in 2018
Higher Medicare spending would increase Medicare premiums and deductibles for beneficiaries and accelerate the insolvency of the Medicare Hospital Insurance Trust Fund
Other Provider Payments
Reduce the rate at which Medicare payment levels to hospitals, skilled nursing facilities, hospice and home health providers, and other health care providers are updated annually
Reduce Medicare Disproportionate Share Hospital (DSH) payments that help to compensate hospitals for providing care to low-income and uninsured patients
Allow providers organized as Accountable Care Organizations (ACOs) that meet quality thresholds to share in cost savings they achieve for the Medicare Program
CBO estimated repeal of the ACA provider payment reductions would increase Medicare spending by another approximately $350 billion over 10 years (2016-2025)
Eliminating the Medicare Shared Savings Program ACOs could affect around 10 million Medicare beneficiaries who were attributed to a MSSP ACO, as of 2018
Higher Medicare spending would increase Medicare premiums and deductibles for beneficiaries and accelerate the insolvency of the Medicare Hospital Insurance Trust Fund
Freeze threshold for income-related Medicare Part B premiums for 2011 through 2019
Establish new income-related premium for Part D, with the same thresholds as the Part B income-related premium
As originally enacted in the ACA, CBO estimated $35.7 billion in savings from these provisions over 10 years
According to Medicare’s actuaries, 3.6 million people paid an income-related Part B premium and 3.0 million paid an income-related Part D premium in 2018
Beyond coverage-related provisions, the ACA made numerous other changes in federal law to safeguard individual civil rights, authorize new programs and agency activities, and finance new federal costs under the law. The Court ruling finding the ACA unconstitutional could also result in an end to these provisions. They include:
Nondiscrimination
The ACA prohibits discrimination against individuals on the basis of race, color, national origin, sex, age, or disability in certain health programs or activities, under Section 1557, which builds on long-standing and familiar Federal civil rights laws. In addition to enforcement by the Office of Civil Rights at the US Department of HHS, individuals can file a civil lawsuit to challenge a nondiscrimination violation under Section 1557.
Regulations implementing Section 1557 issued by the Obama Administration further defined these protections to include gender identity and pregnancy status. One federal district court has vacated the gender identity and pregnancy protections in the regulations, while other courts have relied on Section 1557 itself to grant relief to individuals alleging discrimination based on gender identity. In June 2020, the Trump Administration finalized changes to the regulations that eliminated protections for gender identity and sex stereotyping; adopted blanket abortion and religious freedom exemptions for health care providers; and eliminated or substantially changed provisions on health insurance benefit design; language access; notices, grievance procedures, and enforcement; and which entities are covered by Section 1557. The Administration also has eliminated explicit nondiscrimination protections related to gender identity and sexual orientation in separate regulations governing Medicaid managed care entities, state Medicaid programs, PACE organizations, group and individual health insurance issuers, marketplaces, qualified health plan issuers, and agents and brokers that assist with marketplace applications and enrollment.
Just after the Administration published the final rule, the Supreme Court ruled that sex discrimination includes sexual orientation and gender identity in the employment context. Based on that decision, two federal courts issued nationwide preliminary injunctions blocking parts of the final rule: NY and DC courts blocked provisions excluding sex stereotyping from the definition of sex discrimination, and the DC court also blocked the religious freedom exemption. The NY court is now considering whether to block other provisions of the rule, and other lawsuits are pending.
FDA Approval of Biosimilars
The ACA authorized the U.S. Food and Drug Administration (FDA) to approve generic version of biologics (biosimilars) and grant biologics manufacturers 12 years of exclusive use before generics can be developed. As of November 2019, the FDA has approved 25 biosimilar products used in the treatment of cancer, rheumatoid arthritis, and other health conditions.
Innovation Center
The law also established an Innovation Center within the Center for Medicare and Medicaid Services (CMS) to test, evaluate and expand different payment structures and methods to save costs while maintaining or improving quality of care. Payment and delivery system models supported by the Innovation Center focus on Medicare, Medicaid, and the Children’s Health Insurance Program (CHIP), for example, include care delivery for children and pregnant women affected by the opioid crisis, and models to reduce prescription drug costs.
Prevention and Public Health Fund
The ACA established the Prevention and Public Health Fund with a permanent annual appropriation to support activities related to prevention, wellness and public health activities. The law appropriated $7 billion annually through 2015 and $2 billion for each fiscal year thereafter, although Congress has since voted several times to redirect a portion of funds from the Prevention and Public Health Fund for other purposes. Fund resources support federal, state, and local programs to fight obesity, curb tobacco use, prevent the onset of chronic conditions such as diabetes and heart disease, promote immunization, detect and respond to infectious diseases and other public health threats, and other initiatives.
Nonprofit Hospitals
The ACA set new requirements for non-profit hospitals in order to retain their tax exempt status. These include a requirement to conduct a community needs assessment every 3 years and adopt a strategy to meet identified needs. Hospitals also must adopt and widely publicize financial assistance policies on the availability of free or discounted care and how to apply. In addition, hospitals must limit charges to patients who qualify for financial assistance to the amount generally billed to insured patients, and must make reasonable attempts to determine eligibility for financial assistance before undertaking extraordinary collection actions.
Breastfeeding breaks & separate rooms
Employers with 50 or more employees must now provide adequate break time for breastfeeding women and a private space that is not a bathroom for nursing and pumping.
Menu labeling
Restaurants and retail food establishments with 20 or more locations and owners of 20 or more vending machines must include nutrition information, including calories, for their standard menu items.
Revenue Provisions
Some of the revenue provisions enacted under the ACA remain in effect but presumably would end if the law were found unconstitutional. For example, the ACA included a tax on pharmaceutical manufacturers and importers (generating annual fees of $2.8 billion in 2019 and thereafter). Financing provisions also included a 10% tax on indoor tanning services, and limits on the deductibility of compensation of insurance company executives (limited to $500,000 per individual per year). Under the ACA, the Medicare payroll tax was increased for high income earners (over $200,000 by individuals, $250,000 for married couples filing jointly), and a new 3.8% tax on net investment income applied for higher income taxpayers. Initially, the ACA imposed a so-called Cadillac tax on high-value employer-sponsored health plans, a tax on health insurers, and a new medical device excise tax of 2.3%, but Congress repealed all three of these taxes in a December 2019 budget deal.
Medicaid Expansion Enrollment includes the total number of individuals who are enrolled in the ACA expansion group. This total includes 12 million individuals who are newly-eligible under the ACA pathways. State decisions about adopting the Medicaid expansion are as of August 17, 2020. More information is available at KFF’s Medicaid Expansion Tracker.
Marketplace Enrollment includes the number of individuals who had an active marketplace policy as of February 2020, and who paid their premium (thus effecutating their coverage) as of March 15, 2020.
Consumers with household incomes 100-400% of the federal poverty level may qualify for an Advance Premium Tax Credit (APTC), which helps make their coverage more affordable throughout the year by lowering their share of monthly premium costs.
CSRs are available to people who have incomes 100-250% of the federal poverty level and who enroll in a silver plan through the Marketplace.
*Coverage under Medicaid expansion became effective January 1, 2020 in Utah. Three states (Missouri, Nebraska and Oklahoma) have adopted Medicaid expansion but not yet implemented it. More details available at KFF’s Medicaid Expansion Tracker.
Sources:
Medicaid Expansion Enrollment: Kaiser Family Foundation analysis of Medicaid enrollment data collected from the Centers for Medicare and Medicaid Services (CMS) Medicaid Budget and Expenditure System (MBES).
States totals may not sum to national total due to rounding.
Employer Sponsored Insurance Enrollment includes those covered through a current or former employer or union, either as a policyholder or as a dependent.
Marketplace Enrollment includes the number of individuals who had an active marketplace policy as of February 2020, and who paid their premium (thus effecutating their coverage) as of March 15, 2020.
Medicaid Expansion Enrollment includes the total number of individuals who are enrolled in the ACA expansion group. This total includes 12 million individuals who are newly-eligible under the ACA pathways. State decisions about adopting the Medicaid expansion are as of August 17, 2020. More information is available at KFF’s Medicaid Expansion Tracker.
Cells labelled ‘Insufficient Data’ in the rebates column indicate that insurers representing more than 10% of state enrollment have not filed MLR data.
*Coverage under Medicaid expansion became effective January 1, 2020 in Utah. Three states (Missouri, Nebraska and Oklahoma) have adopted Medicaid expansion but not yet implemented it. More details available at KFF’s Medicaid Expansion Tracker.
Sources:
Prevalence of Pre-Existing Conditions: Kaiser Family Foundation analysis of data from National Health Interview Survey and the Behavioral Risk Factor Surveillance System.
Marketplace Enrollment: Early 2020 Effectuated Enrollment Snapshot, Centers for Medicaid and Medicare Services (CMS), July 23, 2020.
Medicaid Expansion Enrollment: Kaiser Family Foundation analysis of Medicaid enrollment data collected from the Centers for Medicare and Medicaid Services (CMS) Medicaid Budget and Expenditure System (MBES).
MLR: Kaiser Family Foundation analysis of rebate submissions by insurers to CMS.
Notes:
Medicaid Expansion Enrollment includes the total number of individuals who are enrolled in the ACA expansion group. This total includes 12 million individuals who are newly-eligible under the ACA pathways. State decisions about adopting the Medicaid expansion are as of August 17, 2020. More information is available at KFF’s Medicaid Expansion Tracker.
NR indicates state did not report data. Included in 1115 indicates that state was unable to report state plan services separately from Section 1115 waiver services. Blank cell indicates state does not elect option.
*Coverage under Medicaid expansion became effective January 1, 2020 in Utah. Three states (Missouri, Nebraska and Oklahoma) have adopted Medicaid expansion but not yet implemented it. More details available at KFF’s Medicaid Expansion Tracker.
**Data is from 2016.
Sources:
Medicaid Expansion Enrollment: Kaiser Family Foundation analysis of Medicaid enrollment data collected from the Centers for Medicare and Medicaid Services (CMS) Medicaid Budget and Expenditure System (MBES).
HCBS Enrollment: KFF Medicaid HCBS Program Surveys, FY 2018.
Notes:
U.S. totals exclude territories.
Sources:
Medicare Advantage Enrollment: CMS Enrollment Dashboard Data File 08-19-2020, “Hospital and Med Monthly Counts”, data for March 2020.
Part D Coverage Gap Spending: KFF analysis of 2018 Medicare prescription drug event claims for a 20 percent sample of Medicare beneficiaries from the CMS Chronic Conditions Data Warehouse.ACO Assigned Beneficiaries: KFF analysis of Medicare Shared Savings Program data from CMS, 2018.
Part B Income Related Premiums: CMS Program Statistics, Centers for Medicare & Medicaid Services, Office of Enterprise Data and Analytics, Chronic Conditions Data Warehouse, 2018.
Endnotes
A number of Democratic state AGs are defending the ACA as interveners in the case, arguing in part that Congress intended to keep the ACA in place when it set the individual mandate penalty to zero while leaving the rest of the law intact. ↩︎
Some of the coverage gap provisions were subsequently modified by the Bipartisan Budget Act of 2018. The BBA closes the Part D coverage gap in 2019 instead of 2020 by accelerating a reduction in beneficiary coinsurance from 30 percent to 25 percent in 2019; also increases the discount provided by manufacturers of brand-name drugs in the coverage gap from 50 percent to 70 percent, beginning in 2019. In 2019 and later years, Part D plans will cover the remaining 5 percent of costs in the coverage gap, which is a reduction in their share of costs (down from 25 percent). ↩︎
Some of the Medicare income-related premium provisions have been modified by subsequent laws. The Medicare Access and CHIP Reauthorization Act of 2015 (MACRA) made changes to Medicareu2019s income-related premiums by requiring beneficiaries with incomes above $133,500 ($267,000 for married couples) to pay a larger share of Part B and Part D program costs than under the original MMA and ACA provisions. Under MACRA, beginning in 2018, beneficiaries with incomes above $133,500 and up to $160,000 ($267,000-$320,000 for married couples) were required to pay 65 percent of Part B and Part D program costs, up from 50 percent prior to 2018, while beneficiaries with incomes above $160,000 and up to $214,000 ($320,000-$428,000 for married couples) were required to pay 80 percent of Part B and Part D program costs, up from 65 percent. The most recent change to Medicareu2019s income-related premiums was incorporated in the Bipartisan Budget Act of 2018 (BBA). This change will affect beneficiaries with incomes above $500,000 ($750,000 for married couples) by requiring them to pay 85 percent of program costs beginning in 2019, up from 80 percent prior to 2019. ↩︎
In this article for the American Society of Aging’s Generations Today, KFF Senior Vice President Tricia Neuman examines what President Trump and former Vice President Joe Biden are saying about key issues for Medicare beneficiaries, including drug prices and affordability, as well as what they aren’t saying about Medicare’s financing.
Black, Hispanic, and Asian patients had significantly higher rates of hospitalization and death compared to their White counterparts. Hospitalization rates for Hispanic and Black patients with COVID-19 were more than four and three times higher, respectively, compared to the rate for White patients (30.4 and 24.6 vs. 7.4 per 10,000). Death rates for both groups were over twice as high as the rate for White patients (5.6 and 5.6 vs. 2.3 per 10,000). Asian patients also faced significant disparities in these measures.
Among patients who tested positive for COVID-19, Black, Hispanic, and Asian patients remained at higher risk for hospitalization and death compared to White patients with similar sociodemographic characteristics and underlying health conditions. The higher hospitalization and death rates among patients of color, in part, reflect higher infection rates and higher rates of underlying health conditions as well as social and economic inequities and barriers to care. However, disparities persisted after controlling for COVID-19 infection, certain sociodemographic factors, and underlying health conditions, showing that differences in these underlying factors do not fully explain the disparities in hospitalization and death. This finding suggests that other factors, including racism and discrimination, are negatively affecting their health outcomes through additional avenues.
The analysis is based on Epic Health Research Network (EHRN) and KFF analysis of data for roughly 50 million patients in the Epic health record system who have interacted with the health system in the past two years and have known race and ethnicity. Findings are presented for Black, Hispanic, Asian, and White patients. Due to data limitations, we do not present findings for smaller population groups, including AIAN and NHOPI patients, or people who report multiple races.
This chart highlights KFF’s joint project with Epic Health Research Network.