Medicare and Telehealth: Coverage and Use During the COVID-19 Pandemic and Options for the Future

Authors: Wyatt Koma, Juliette Cubanski, and Tricia Neuman
Published: May 19, 2021

Issue Brief

Introduction

Telehealth, the provision of health care services to patients from providers who are not at the same location, has experienced a rapid escalation in use during the COVID-19 pandemic, among both privately-insured patients and Medicare beneficiaries. Before the pandemic, coverage of telehealth services under traditional Medicare was limited to beneficiaries living in rural areas only, with restrictions on where beneficiaries could receive these services and which providers could be paid to deliver them. Soon after the federal government declared a public health emergency due to COVID-19 in early 2020, Congress and the Centers for Medicare & Medicaid Services (CMS) expanded traditional Medicare’s coverage of telehealth services in order to make it easier for beneficiaries to get medical care and minimize their exposure to coronavirus in health care settings. When the public health emergency ends, however, Medicare’s coverage of telehealth services will revert back to the more limited availability that existed before the pandemic, unless policymakers take action to extend the expanded coverage.

In light of the rapid, but time-limited, expansion of telehealth coverage under traditional Medicare, this brief provides an overview of the changes made during the COVID-19 pandemic to Medicare’s coverage of telehealth. It also presents new analysis of Medicare beneficiaries’ utilization of telehealth between the summer and fall of 2020, and discusses issues and questions related to extending telehealth coverage under traditional Medicare beyond the public health emergency. Our analysis of beneficiaries’ use of telehealth services is based on survey data of Medicare beneficiaries living in the community from the CMS Medicare Current Beneficiary Survey (MCBS) Fall 2020 COVID-19 Supplement. All differences reported in the text are statistically significant, unless otherwise noted. (See Data and Methods for details.)

Key Findings

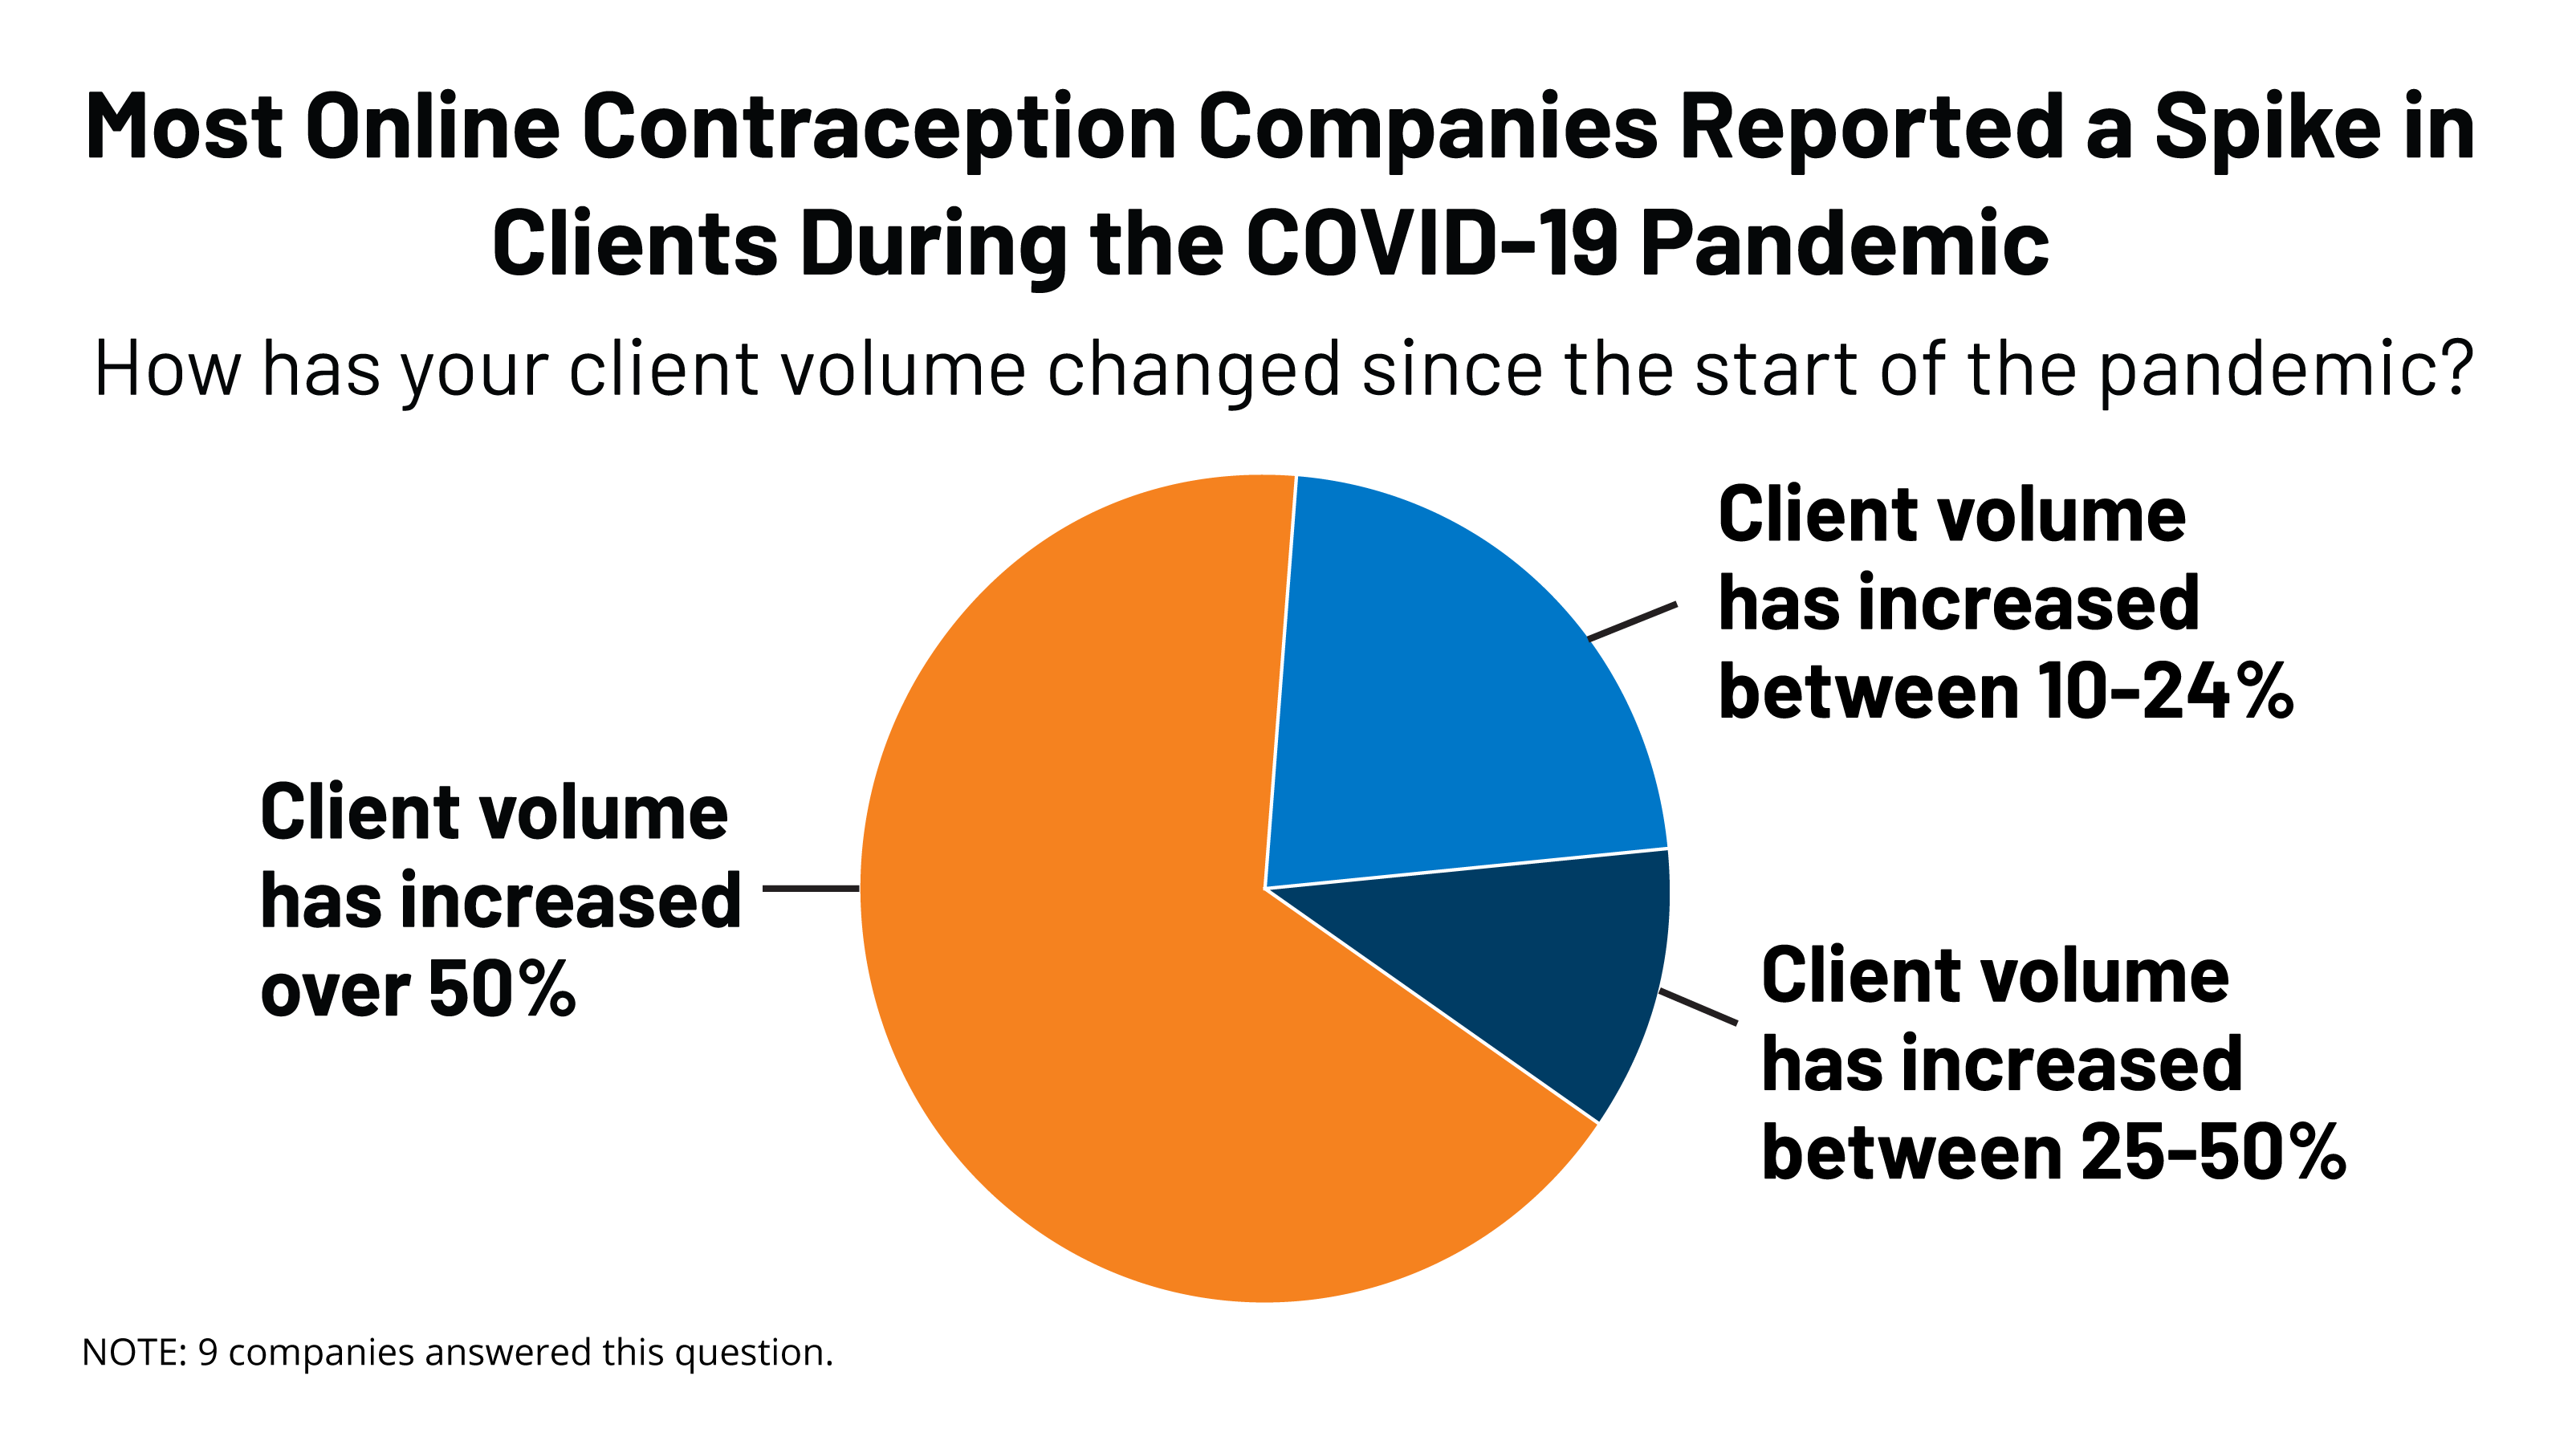
  • Among the vast majority of Medicare beneficiaries with a usual source of care (95%), such as a doctor or other health professional, or a clinic, nearly two-thirds (64% or 33.6 million) say that their provider currently offers telehealth appointments, up from 18% who said their provider offered telehealth before the pandemic. But nearly a quarter of Medicare beneficiaries (23%) say they don’t know if their provider offers telehealth appointments, and this percentage is larger among beneficiaries who live in rural areas (30%).
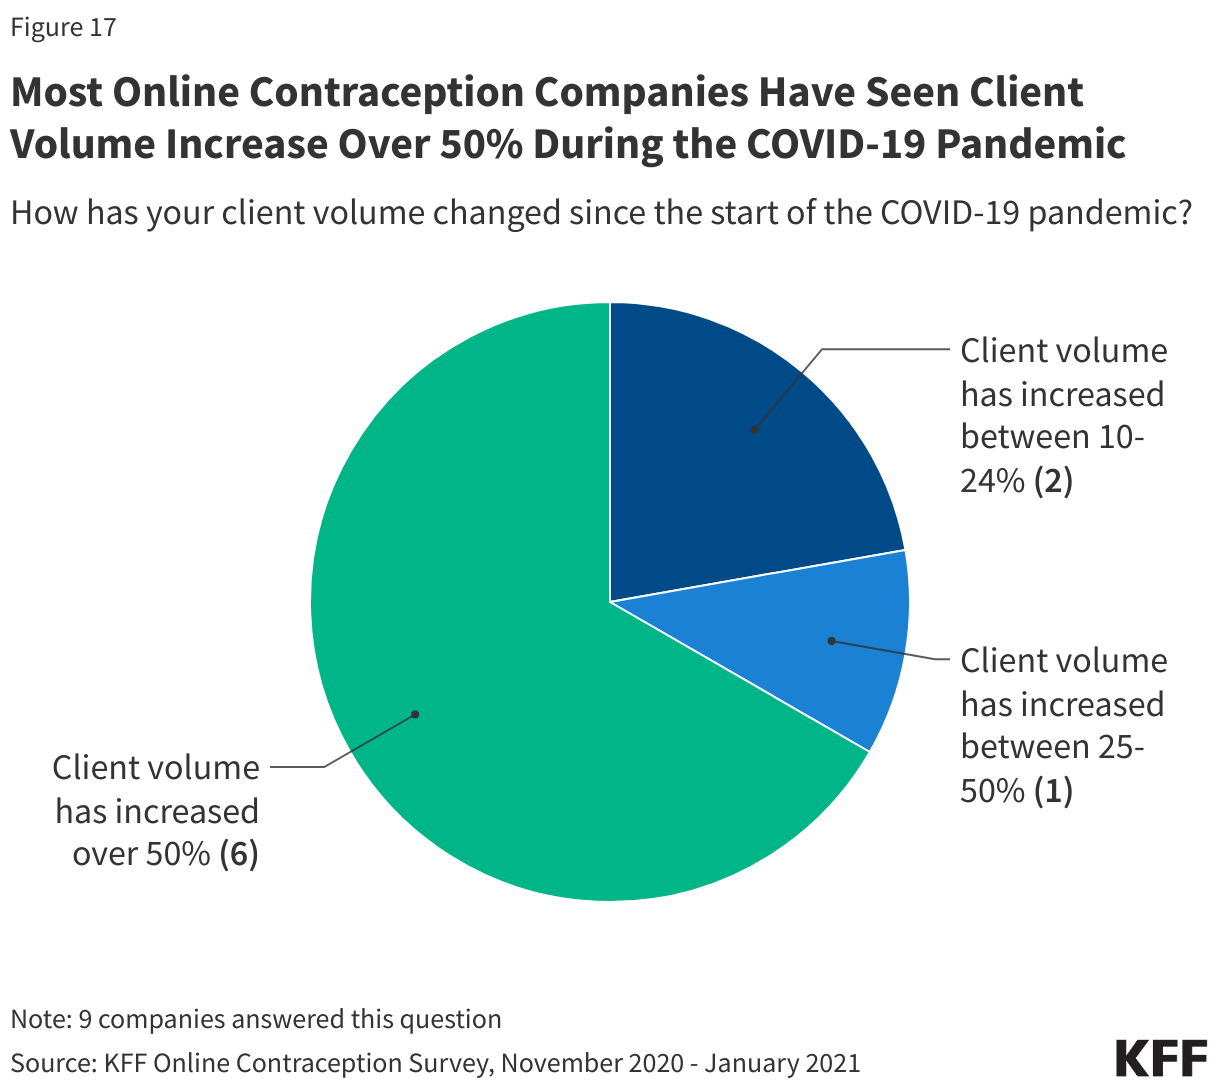
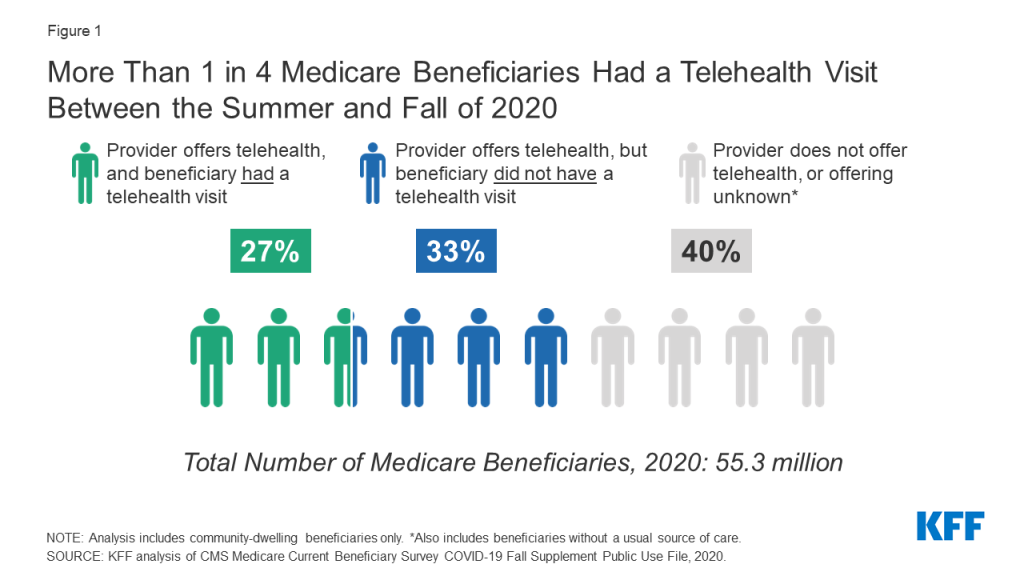
  • Among the 33.6 million Medicare beneficiaries with a usual source of care who reported that their provider currently offers telehealth appointments, nearly half (45%) said they had a telehealth visit with a doctor or other health professional between the summer (July) and fall of 2020. This translates to just over 1 in 4 (27% or 15 million) of all community-dwelling beneficiaries in both traditional Medicare and Medicare Advantage using telehealth during this time period (Figure 1).
Figure 1: More Than 1 in 4 Medicare Beneficiaries Had a Telehealth Visit Between the Summer and Fall of 2020
  • Reported telehealth use among beneficiaries who said their provider offers telehealth was higher among Medicare beneficiaries under the age of 65 who qualify for Medicare due to a long-term disability (53%), beneficiaries enrolled in both Medicare and Medicaid (55%), Black (52%) and Hispanic (52%) beneficiaries, and those with 6 or more chronic conditions (56%). For some groups, including Medicare-Medicaid enrollees and those with multiple chronic conditions, higher rates of telehealth use may be related to higher use of health care overall. There was no difference in reported rates of telehealth use between beneficiaries in traditional Medicare and Medicare Advantage (44% and 45%, respectively).
  • Among Medicare beneficiaries who had a telehealth visit, a majority (56%) report accessing care using a telephone only, while a smaller share had a telehealth visit via video (28%) or both video and telephone (16%). The share of Medicare beneficiaries who had a telehealth visit using telephone only was higher among those age 75 and older (65%), Hispanic beneficiaries (61%), those living in rural areas (65%), and those enrolled in both Medicare and Medicaid (67%).

Background on Medicare Coverage of Telehealth and Changes under the COVID-19 Public Health Emergency

Before the COVID-19 pandemic, coverage of telehealth services under traditional Medicare was limited. Medicare paid for approximately 100 services provided by telehealth, and there were limitations on how these services could be delivered and which beneficiaries could access them. Such limitations do not apply in Medicare Advantage plans, which have flexibility to offer additional telehealth benefits not covered by traditional Medicare outside of the public health emergency (see below for more information). Prior to the pandemic, the utilization of telehealth among traditional Medicare beneficiaries was extremely low, with only 0.3% of traditional Medicare beneficiaries enrolled in Part B using telehealth services in 2016, accounting for only 0.4% of traditional Medicare Part B spending. Similarly, analysis of primary care visits in traditional Medicare found that only 0.1% of these visits were provided via telehealth before the pandemic in February 2020.

To make it easier and safer for beneficiaries to seek medical care during the COVID-19 pandemic, the HHS Secretary waived certain restrictions on Medicare coverage of telehealth services for traditional Medicare beneficiaries during the COVID-19 public health emergency, based on waiver authority included in the Coronavirus Preparedness and Response Supplemental Appropriations Act (and as amended by the CARES Act). The waiver, effective for services starting on March 6, 2020, significantly loosened coverage restrictions for telehealth under traditional Medicare during the public health emergency, as described below. The public health emergency was most recently renewed in April 2021, and, according to the Biden Administration, is expected to remain in place for the duration of 2021.

Which traditional Medicare beneficiaries can receive telehealth services and where?

Before the public health emergency, telehealth services were generally available only to beneficiaries in rural areas originating from a health care setting, such as a clinic or doctor’s office. Beneficiaries in urban areas were ineligible for telehealth services, and beneficiaries could not receive telehealth services in their own homes. During the public health emergency, beneficiaries in any geographic area can receive telehealth services, and can receive these services in their own home, rather than needing to travel to a “distant site” (i.e., a health care setting).

What technologies can traditional Medicare beneficiaries use to access telehealth services?

Under Medicare’s existing telehealth benefit, a telehealth visit must be conducted with two-way audio/video communications and the use of smartphones or audio-only telephones in lieu of video is not permitted. For the duration of the COVID-19 public health emergency, telehealth services can be conducted via an interactive audio-video system, as well as using smartphones with real-time audio/video interactive capabilities without other equipment. Additionally, a limited number of telehealth services can be provided to patients via audio-only telephone or a smartphone without video.

What type of providers can get reimbursed by Medicare for telehealth visits?

Before the public health emergency, only physicians and certain other practitioners (such as physician assistants, clinical social workers, and clinical psychologists) were eligible to receive Medicare payment for telehealth services provided to eligible beneficiaries in traditional Medicare, and they must have treated the beneficiary receiving the services in the last three years. During the public health emergency, any health care professional that is eligible to bill Medicare for professional services can provide and bill for telehealth services, and does not need to have previously treated the beneficiary. Also, federally qualified health centers and rural health clinics are allowed to provide telehealth services to Medicare beneficiaries during the COVID-19 public health emergency; these settings were not authorized as providers of telehealth services for Medicare beneficiaries prior to the pandemic.

What services can traditional Medicare beneficiaries receive through telehealth?

Before the public health emergency, traditional Medicare covered about 100 services that could be administered through telehealth, including office visits, psychotherapy, and preventive health screenings, among other services. During the public health emergency, the list of allowable telehealth services covered under traditional Medicare expanded to include emergency department visits, physical and occupational therapy, and certain other services. Some evaluation and management, behavioral health, and patient education services can be provided to patients via audio-only telephone.

Are there additional services, other than telehealth, that are delivered virtually and covered by traditional Medicare?

Separate from Medicare’s coverage of telehealth services, traditional Medicare covers brief, “virtual check-ins” (also called “brief communication technology-based services”) via telephone or captured video image, and E-visits for all beneficiaries, regardless of whether they live in a rural area. Both of these services, which were not amended during the public health emergency, are more limited in scope than a full telehealth visit. For example, virtual check-ins can only be reported by providers with an established relationship to the patient, cannot be related to a recent medical visit (within the past 7 days), and cannot lead to a medical visit in the next 24 hours (or the soonest available appointment, and payment is intended to cover only 5-10 minutes of medical discussion.

How does Medicare pay providers for telehealth services?

Before the public health emergency, Medicare’s payment for a telehealth service was the same regardless of whether it was provided in a non-facility setting, such as a clinician’s office, or a facility setting, such as a hospital outpatient department, and the payment rate was based on the lower amount paid to facility-based providers for a service delivered in person. (Under Medicare’s physician fee schedule, the payment to facility-based-providers for in-person services is lower than the payment to non-facility providers because Medicare makes a separate payment to facilities to cover practice expenses, such as physical space, medical supplies, medical equipment, and clinical staff time.) The rationale for using the lower facility payment amount for telehealth services was that practice expenses for the delivery of telehealth services should be lower than those for an in-person visit.

During the public health emergency, Medicare pays for telehealth services, including those delivered via audio-only telephone, as if they were administered in person, with the payment rate varying based on the location of the provider, which means that Medicare pays more for a telehealth service provided by a doctor in a non-facility setting than by a doctor in a hospital outpatient department. This also means that during the public health emergency, doctors in non-facility settings are receiving a higher payment for services provided by telehealth than they did before the public health emergency.

What do traditional Medicare beneficiaries pay for telehealth services?

Beneficiary cost sharing for telehealth services has not changed during the public health emergency. Medicare covers telehealth services under Part B, so beneficiaries in traditional Medicare who use these benefits are subject to the Part B deductible of $203 in 2021 and 20% coinsurance. However, the HHS Office of Inspector General has provided flexibility for providers to reduce or waive cost sharing for telehealth visits during the COVID-19 public health emergency, although there is no publicly-available data to indicate the extent to which providers may have done so. Most beneficiaries in traditional Medicare have supplemental insurance that may pay some or all of the cost sharing for covered telehealth services.

How is telehealth covered under Medicare for beneficiaries and providers participating in alternative payment modes?

Separate from the time-limited expanded availability of telehealth services, CMS has granted providers participating in some alternative payments models, including Next Generation accountable care organizations (ACOs) and Medicare Shared Savings Program ACOs, greater flexibility to provide care through telehealth, including billing for telehealth services provided to both urban and rural beneficiaries and to beneficiaries when they are at home. Telehealth flexibilities in the Next Generation ACO demonstration are granted via benefit enhancement waivers administered by CMS. From 2016-2018, few Next Generation ACOs received and implemented telehealth waivers (4 ACOs; 8% of all ACOs in the model).

How does coverage of telehealth services differ in Medicare Advantage?

Medicare Advantage plans have been able to offer additional telehealth benefits not covered by traditional Medicare outside of the public health emergency, including telehealth visits provided to enrollees in their own homes and services provided outside of rural areas. In 2021, virtually all Medicare Advantage plans (98%) offer a telehealth benefit.

Medicare Advantage plans are paid a capitated amount by Medicare to provide basic Medicare benefits covered under Parts A and B; legislative changes implemented in 2020 allow plans to include additional telehealth benefits beyond what traditional Medicare covers in their bids for basic benefits. Therefore, the cost of additional telehealth services offered by Medicare Advantage plans are reflected in the capitated payment that plans receive.

Medicare Advantage plans have flexibility to waive certain requirements with regard to coverage and cost sharing in cases of disaster or emergency, such as the COVID-19 outbreak. In response to the coronavirus pandemic, CMS has advised plans that they may waive or reduce cost sharing for telehealth services, as long as plans do this uniformly for all similarly situated enrollees. Many Medicare Advantage plans have waived or reduced cost sharing for enrollees for some or all services administered via telehealth during the public health emergency.

Who Has Used Telehealth Services During the COVID-19 Public Health Emergency?

Awareness of Telehealth Availability

As of Fall 2020, six months after the expansion of telehealth benefits in traditional Medicare for the COVID-19 pandemic, nearly two-thirds of community-dwelling Medicare beneficiaries who say they have a usual source of care (64%, or 33.6 million beneficiaries), such as a doctor or health professional, or a clinic, reported that their usual provider offers telehealth appointments, up from roughly 1 in 5 (18%, or 6.1 million) beneficiaries who said their usual provider offered telehealth before the pandemic (Figure 2; Table 1). (The majority of community-dwelling Medicare beneficiaries, 95% or 52.7 million, report having a usual source of care). Conversely, 13% of beneficiaries with a usual source of care said their provider does not currently offer telehealth, a substantial decrease compared to the 52% who said their provider did not offer telehealth before the COVID-19 pandemic.

While the reported availability of telehealth has increased during the pandemic, nearly a quarter of Medicare beneficiaries with a usual source of care (23% or 11.9 million beneficiaries) said they do not know if their usual provider currently offers telehealth appointments.

The reported rates of beneficiaries who say their provider currently offers telehealth was similar across most demographic groups (Figure 3). However, a smaller share of Medicare beneficiaries living in rural areas than those living in urban areas said their provider currently offers telehealth (52% vs. 67%, respectively), and a larger share of rural beneficiaries report not knowing if their usual provider offers telehealth appointments than beneficiaries living in urban areas (30% vs 21%, respectively).

A larger share of Black Medicare beneficiaries with a usual source of care (23%) say their usual provider does not currently offer telehealth appointments than White (12%) and Hispanic (15%) beneficiaries with a usual source of care. Additionally, a larger share of Medicare beneficiaries enrolled in both Medicare and Medicaid (19%) say their usual provider does not currently offer telehealth appointments than Medicare beneficiaries who are not enrolled in both Medicare and Medicaid (12%).

Use of Telehealth

Among the two-thirds of Medicare beneficiaries with a usual source of care who reported in the Fall of 2020 that their usual provider offers telehealth during the pandemic (33.6 million beneficiaries), nearly half (45%, or 14.9 million beneficiaries) reported having a telehealth visit since July 2020. Some groups of Medicare beneficiaries were more likely than others to report having a telehealth visit with a doctor or other health professional since July 2020, including Medicare beneficiaries under age 65 with long-term disabilities, Black and Hispanic beneficiaries, Medicare beneficiaries enrolled in both Medicare and Medicaid, and beneficiaries with multiple chronic conditions (Figure 4; Table 2).

Among Medicare beneficiaries who have a usual source of care and whose usual provider offers telehealth:

  • More than half (53%) of beneficiaries under the age of 65 (who qualify for Medicare due to a long-term disability) had a telehealth visit, compared to 42% of those age 65 to 74 and 43% of those age 75 or older.
  • A larger share of Black (52%) and Hispanic (52%) Medicare beneficiaries than White (43%) beneficiaries say they had a telehealth visit.
  • More than half (55%) of beneficiaries enrolled in both Medicare and Medicaid had a telehealth visit, compared to 43% of Medicare beneficiaries not enrolled in Medicaid.
  • A larger share of beneficiaries with 6 or more chronic conditions reported having a telehealth visit than those with zero or 1 chronic condition (56% vs. 33%), and half or more of Medicare beneficiaries with specific chronic conditions had a telehealth visit, including those with diabetes (50%), a heart condition (50%), emphysema, asthma, or COPD (54%), and depression (55%), and those who are immunocompromised (59%).
  • A similar share of Medicare Advantage enrollees and beneficiaries in traditional Medicare had a telehealth visit since July 2020 (45% and 44%, respectively) (Table 2).
  • Medicare beneficiaries who report having a telehealth visit between the summer and fall of 2020 account for 1 out of 4 Medicare beneficiaries overall (27%, or 14.9 million beneficiaries), based on the total population of community-dwelling beneficiaries, which also includes beneficiaries who said they did not have a telehealth visit, beneficiaries who do not know if their provider offers telehealth, and those without a usual source of care who were not asked about their use of telehealth (Figure 4, Table 2).

Notably, among Medicare beneficiaries with a usual source of care and whose usual provider offers telehealth, we found no significant difference between the share of rural and urban Medicare beneficiaries who had a telehealth visit (43% and 45%, respectively). However, based on the overall population in these groups, rural Medicare beneficiaries were less likely than urban beneficiaries to have a telehealth visit with a doctor or other health professional (21% vs. 28%, respectively). This difference is likely driven by the fact that rural Medicare beneficiaries were more likely than urban Medicare beneficiaries to say they do not know if their usual provider offers telehealth (30% vs. 21%, respectively).

Similarly, among Medicare beneficiaries with a usual source of care whose usual provider offers telehealth, we found that a larger share of Black and Hispanic beneficiaries had a telehealth visit compared to White beneficiaries (52%, 52%, and 43%). However, among the total Medicare population, the difference in the share of Black and White beneficiaries who reported having a telehealth visit was not statistically significant (30% vs. 26%), while a larger share of Hispanic beneficiaries than White beneficiaries had a telehealth visit (33% vs. 26%). For Black Medicare beneficiaries, this result is likely related to the fact that nearly a quarter of Black beneficiaries overall (23%) say their usual provider does not offer telehealth appointments, compared to 12% of White beneficiaries and 15% of Hispanic beneficiaries.

How Did Beneficiaries Access Telehealth Services?

Among Medicare beneficiaries with a usual source of care whose provider offers telehealth appointments, the majority of those who had a telehealth visit since July 2020 accessed the service by telephone (56%), compared to 28% who reported having a telehealth visit by video and 16% who used both telephone and video (Figure 5; Table 3). This may be related to the fact that while more than 8 in 10 Medicare beneficiaries report having access to the internet (83%), smaller shares say they own a computer (64%) or a smartphone (70%) (Figure 6, Table 4).

There are notable differences by demographic characteristics in how beneficiaries have accessed telehealth services during the pandemic and the availability of technology that enables access to telehealth, for example:

  • Two thirds (65%) of beneficiaries 75 and older had a telehealth visit that was telephone-only compared to just over half (52%) of those ages 65 to 74, findings that likely reflect the smaller share of Medicare beneficiaries age 75 and older who report having access to the internet compared to those ages 65 to 74 (74% vs. 89%), or owning a computer (56% vs. 74%) or smartphone (53% vs. 80%).
  • Six in 10 (61%) Hispanic Medicare beneficiaries had a telehealth visit that was telephone-only, compared to 54% of White beneficiaries, likely related to the fact that a smaller share of Hispanic Medicare beneficiaries than White beneficiaries report having access to the internet (67% vs. 86%), and a much smaller share of Hispanic beneficiaries than White beneficiaries say they own a computer (34% vs. 71%). Similarly, just 42% of Black Medicare beneficiaries own a computer, compared to 71% of those who are White, but the difference in the share of beneficiaries reporting a telephone-only telehealth visit was not significantly different for Black and White beneficiaries.
  • Beneficiaries who live in rural areas were more likely than those living in urban areas to report having a telehealth visit that was telephone-only (65% vs. 54%), likely reflecting lower rates of internet access for rural beneficiaries than urban beneficiaries (78% vs. 84%) and ownership of computers (58% vs. 66%) or smartphones (60% vs. 72%).

Looking to the Future: Expanding Medicare Coverage of Telehealth Beyond the Pandemic

Our analysis finds that 1 in 4 Medicare beneficiaries have had a telehealth visit during the COVID-19 public health emergency, representing a substantial increase in use since before the pandemic. Our finding that, among beneficiaries whose provider offers telehealth, a greater share of those with disabilities, with low incomes, and in communities of color have used telehealth suggests that the temporary expansion of telehealth coverage may be helping some of Medicare’s more disadvantaged populations continue to access needed care. At the same time, in light of our finding that a quarter of Medicare beneficiaries overall (and an even larger share of those in rural areas) do not know if their doctor currently offers telehealth, efforts to increase awareness of covered telehealth services under Medicare during the public health emergency could help to broaden its reach.

Currently, policymakers are considering a variety of proposals to expand some or all of the existing flexibilities surrounding telehealth services under Medicare beyond the public health emergency, and many have expressed support for doing so. Among the telehealth-related bills that have been introduced in the 117th Congress include proposals to permanently cover some of the telehealth expansions provided during the public health emergency, expand Medicare-covered mental health services and evaluation and management services administered via telehealth, and expand the scope of providers eligible for payment for telehealth services covered by Medicare. Other bills are aimed at assessing the impact of expanded telehealth services on the quality of patient care and program spending.

Under Medicare’s existing telehealth benefit, a telehealth visit must be conducted with two-way audio/video technology, while under the current public health emergency waiver, a limited number of telehealth services can be provided to patients via audio-only telephone. Given that the majority of Medicare beneficiaries in our analysis reported accessing telehealth services by telephone only, an expanded telehealth benefit that requires two-way video communication could be a barrier to care for subgroups of the Medicare population that relied more heavily on telephones than video-capable devices during the pandemic.

MedPAC has recommended that Medicare continue a modified version of expanded telehealth coverage for another year or two after the public health emergency ends, giving Medicare time to assess the effects of telehealth use on total costs, access, and quality of care. During this additional time, MedPAC recommends that Medicare pay for specified telehealth services regardless of where a beneficiary lives; cover some additional telehealth services beyond those covered prior to the public health emergency if there is potential for clinical benefit; and cover audio-only telehealth visits if there is potential for clinical benefit. MedPAC has also recommended that payment for telehealth services after the public health emergency revert to the lower facility-based payment rate in effect before the pandemic, and that providers should not be allowed to waive or reduce beneficiary cost sharing.

Expanded coverage of telehealth beyond the public health emergency could affect the quality of patient care as well as program and beneficiary spending. Broadening telehealth coverage has the potential to improve access to needed care, but there is uncertainty as to whether it would lead to an overall increase or decrease in program spending. Some telehealth services may be substitutes for in-person care, such as a behavioral health care visit, though easier access to telehealth could lead to an overall increase in visits and costs. Other telehealth services may not fully replace the need for (or occurrence of) an in-person visit, such as a visit to evaluate a skin rash or where lab work is determined to be needed. In building evidence on the cost and quality impacts of telehealth use in Medicare, the Administration could also potentially gain insights based on telehealth use by enrollees in Medicare Advantage plans, or by testing different approaches through Center for Medicare and Medicaid Innovation models.

The potential expansion of telehealth coverage brings with it concerns about the potential for fraudulent activity. There have been several large fraud cases involving telehealth companies in recent years, most of which involved the submission of fraudulent claims for items, services, and tests to Medicare and other insurers that were never given or administered to patients. HHS’ Office of the Inspector General (OIG) is conducting several studies to assess the appropriateness of use of telehealth during the public health emergency, including an analysis of provider billing patterns in order to identify providers that could pose a risk for program integrity and an audit of telehealth services under Part B to assure that services are meeting Medicare requirements. MedPAC has recommended that Medicare apply additional scrutiny to outlier clinicians who deliver more telehealth services than others, as well as requiring in-person visits before clinicians can order high-cost equipment or services for beneficiaries.

The temporary expansion of coverage for telehealth services has allowed many people with Medicare to access medical care during the coronavirus pandemic. Given that the temporary waiver of restrictions on coverage of telehealth services under Medicare will come to an end with the expiration of the public health emergency, the question of whether and how to ensure continued access to these services, while balancing concerns about quality of care and spending, looms large.

Data and Methods

This analysis uses survey data for community-dwelling Medicare beneficiaries from the Centers for Medicare & Medicaid Services (CMS) Medicare Current Beneficiary Survey (MCBS) Fall 2020 COVID-19 Community Supplement. The MCBS Fall COVID-19 supplement includes several survey questions designed to assess Medicare beneficiaries’ access to care and use of telehealth services from July 2020 through Fall 2020.

In order to determine the share of Medicare beneficiaries whose provider offers telehealth, beneficiaries who answered affirmatively to the question “Is there a particular doctor or other health professional, or a clinic you usually go to when you are sick or for advice about your health?” (9,216 out of 9,686 respondents) were asked “Does your usual provider offer telephone or video appointments, so that you don’t need to physically visit their office or facility?” (5,644 respondents answered affirmatively).

In order to determine the share of Medicare beneficiaries who had a telehealth visit, beneficiaries with a usual source of care whose usual provider offers telehealth appointments were asked “Since July 1, 2020, have you had an appointment with a doctor or other health professional by telephone or video?” (2,515 respondents answered affirmatively). Similarly, beneficiaries with a usual source of care whose provider offers telehealth were asked “Did your usual provider offer telephone or video appointments before the coronavirus pandemic?” (1,035 respondents answered affirmatively).

To determine how beneficiaries accessed telehealth appointments, beneficiaries who had a telehealth appointment since July 2020 were asked “Was it a telephone appointment, video appointment, or both?” The majority of Medicare beneficiaries who had a telehealth visit since July 2020 had a visit via telephone (n=1,460), while fewer had a telehealth visit via video (n=653) or via both telephone and video (n=393).

Based on the questionnaire skip patterns, beneficiaries were only asked about their use of telehealth if they answered affirmatively that they had a usual source of care and that their usual provider offers telehealth. In order to determine the share of Medicare beneficiaries who had a telehealth visit among Medicare beneficiaries overall, we created a categorical variable that included beneficiaries whose provider did not offer telehealth or it was unknown. The variable had three categories: 1) usual provider offers telehealth and beneficiary had a telehealth visit (n=2,515); 2) usual provider offers telehealth and beneficiary did not have a telehealth visit (n=3,074); 3) usual provider does not offer telehealth or it was unknown (n=4,097).

Results from all statistical tests were reported with p<0.05 considered statistically significant.

Tables

News Release

The Pandemic Has Exacerbated Long-Standing Health Care Challenges Faced By Puerto Rico and Other U.S. Territories as the End of Temporary Federal Medicaid Funding Approaches

Published: May 18, 2021

A new KFF analysis examines how the coronavirus pandemic is affecting U.S. territories as well as issues related to the upcoming expiration of temporary Medicaid funding for the territories at the end of September.

Prior to the pandemic, the U.S territories –– American Samoa, the Commonwealth of the Northern Mariana Islands (CNMI), Guam, Puerto Rico, and the U.S. Virgin Islands (USVI) — faced an array of longstanding fiscal and health challenges that were exacerbated by hurricanes in recent years. These challenges have been further exacerbated by the pandemic. As of May 1, every territory, except Puerto Rico and USVI, has fully vaccinated more than 30 percent of the eligible population. American Samoa is the only U.S. territory to have no cases or deaths to date.

Differences in the structure of Medicaid financing, including a cap that limits federal spending, have contributed to broader fiscal and health systems challenges for the territories. While additional federal funds have been provided over the statutory caps, these funds are set to expire at the end of September 2021. That would result in the loss of over 80 percent of the territories’ Medicaid funding and could result in reductions in coverage, services, and provider rates, even as the territories deal with the long-term health and economic consequences of the pandemic.

For the full analysis, as well as other data and studies about the fiscal and health challenges of the territories, visit kff.org

Challenges in the U.S. Territories: COVID-19 and the Medicaid Financing Cliff

Authors: Lina Stolyar, Kendal Orgera, and Robin Rudowitz
Published: May 18, 2021

Issue Brief

More than a year into the public health emergency, the COVID-19 pandemic continues to impact the lives of Americans including those living in the U.S. territories. Prior to the pandemic, the U.S territories – American Samoa, the Commonwealth of the Northern Mariana Islands (CNMI), Guam, Puerto Rico, and the U.S. Virgin Islands (USVI) – faced an array of longstanding fiscal and health challenges that were exacerbated by recent natural disasters. Differences in Medicaid financing, including a statutory cap and match rate, have contributed to broader fiscal and health systems challenges for the territories. While additional federal funds have been provided over the statutory caps, these funds are set to expire at the end of September 2021. Without additional Congressional action, the territories will lose the vast majority of Medicaid financing which could result in reductions in coverage, services, and provider rates which could negatively impact the territories as they deal with the long-term health and economic consequences of the pandemic. This brief looks at how the pandemic is affecting the territories as well as issues related to the upcoming Medicaid fiscal cliff.

Health Status and Systems in the Territories Pre-Pandemic

Even prior to the pandemic, residents of the U.S territories experienced a range of health disparities compared to the states. For example, Puerto Rico and the U.S. Virgin Islands (USVI) both have higher rates of diabetes1  when compared to the United States overall. American Samoa, the Commonwealth of the Northern Mariana Islands (CNMI), and Guam have higher rates of obesity,2  high blood pressure,3  and smoking (respectively) when compared to the United States overall.

Additionally, the health care systems in U.S. territories have faced longstanding challenges, including deferred repairs to hospital facilities4  and major provider shortage issues. Recruitment and retainment is difficult as salaries for providers in the territories are substantially lower than they are for providers in the U.S. even though providers in most territories must be U.S.-licensed.5  Constraints with providers as well as system capacity sometimes requires that patients get care off-island.6  For example, prior to building its own oncology center on-island, CNMI sent over 300 patients a year to Guam or Hawaii for care.7 

These health care system challenges were greatly exacerbated by recent natural disasters that occurred pre-pandemic. Typhoons, earthquakes, mudslides, and volcanic eruptions throughout the territories have caused extensive damage to hospital facilities, increased rates of provider outmigration, and increased the overall number of patients and the number of patients with more complex mental and physical health needs.

Effect of COVID-19 and Vaccine Roll-Out in the Territories

Early in the pandemic, the U.S. territories struggled with COVID-19 testing limitations and therefore COVID-19 cases and deaths may be underreported. In March 2020, only Guam and Puerto Rico were able to perform COVID-19 testing in their public labs but faced limited capacity due to supplies and staff.8  The other three territories had to send their testing samples to Hawaii or to the mainland – leading to longer turnaround time for results – until they acquired their own testing and analysis equipment.9  While Puerto Rico did have public labs to perform testing, in the spring of 2020, it had the lowest per-capita testing rates10  compared to any state and struggled to obtain the necessary supplies in order to increase its testing capacity.11  Guam, on the other hand, lacked staffing to administer tests.12 

The pandemic exposed pre-pandemic health system issues that remained after the natural disasters. With the surge in COVID-19 cases, most territories reached hospital and ventilator capacity quickly and needed to recruit health care providers, especially nurses, from the mainland United States or neighboring international islands.13 ,14 ,15  For example, in September 2020 in Guam, when fatalities increased and as more providers left the island, island officials looked to recruit 100 nurses from mainland U.S. or nearby Philippines.16  An infusion of funds from the Coronavirus Aid, Relief, and Economic Security Act (CARES Act) helped some hospitals purchase additional hospital equipment and personal protective equipment (PPE).17 ,18 

Puerto Rico saw increases in the average daily number of cases in March and April 2021, while the other territories remained steady. American Samoa is the only U.S. territory to have no cases or deaths to date. Despite increases in March and April in Puerto Rico, recent data show substantial decreases in the average daily number of cases. As of May 12, 2021, Puerto Rico’s average daily cases per million were 90.6, compared to 38.4 per million in Guam and 5.0 per million in CNMI. The average daily cases per million in USVI began increasing in early May, and as of May 12, it is the only current territory to surpass the U.S. rate of 111.9 cases per million (USVI had 139.3 cases per million population.19 

Due to the previous surge in cases, Puerto Rico imposed more rigorous precautions. Early on, Puerto Rico issued overnight curfews and lock-down orders, which were punishable by fine or jail time.20  In June 2020, businesses were fully reopened,21  but variations of the curfew have remained in place. In-person schooling reopened in March but was closed as cases surged in April22  and beginning April 28, travelers must show proof of a negative COVID-19 test or face a $300 fine.23 

Similar to the states, CNMI, Guam, and USVI also imposed lockdowns, including some travel restrictions into the islands, but have slowly reopened businesses with varying degrees of capacity and service.24 ,25  USVI has so far not altered its reopening plans to address the recent surge in cases in early May.26  American Samoa, which has had no reported COVID-19 fatalities, had already implemented social distancing and school closures in December 2019 due to a measles outbreak.27  In March 2020, in response to the pandemic, the government halted all flights in and out of the island, allowing only one weekly cargo flight in to provide medical supplies and food. Any American Samoa residents that left, including those needing medical services off the island during the pandemic, were not allowed to repatriate until early 2021.28 

The share of individuals ages 16 and older that have been fully vaccinated has more than doubled, and in some territories quadrupled, from March 1 to May 1, 2021 (Figure 1). As of May 1, every territory, except Puerto Rico and USVI, has fully vaccinated more than 30% of the eligible population. The territories have received vaccines at rates similar to states in U.S,29  however some territories are administering a smaller share of delivered vaccines when compared to the U.S. overall. As of May 12, 2021, the share of delivered doses that had been administered in the U.S. was 78.5%, while CNMI and Puerto Rico’s shares were considerably lower (with 60.3% and 63.1% of delivered doses that have been administered, respectively). Issues related to administering vaccines could be caused by lack of staffing, challenges in reaching residents in more remote areas, or a lag in reporting.

The U.S. territories followed similar vaccination eligibility protocol to the U.S. with priority given to older populations, health care workers, and other essential workers. Additionally, all U.S. territories opened COVID-19 vaccinations to all adult residents earlier than President Biden’s April 19 deadline. Additionally, the territories utilized vaccination approaches that were tailored to their island’s needs to reach higher shares of their populations. For example, CNMI applied strategic outreach to the elders in the community,30  while American Samoa, which only has one public hospital, used a drive-through vaccination site as an additional means to reach a higher share of their population.31 

Figure 1: The Share of Individuals Ages 16+ That Have Been Fully Vaccinated Has More Than Doubled in the U.S. Territories Since March 2021.

Key Financing Issues for the Territories

Prior to the pandemic, the most of territories experienced fiscal stress that was exacerbated by natural disasters or emergencies. For example, USVI saw its economy declined by over 30% between 2008 and 2016, accompanied by population loss and job loss in certain industries, while Puerto Rico faced years of economic recession and debt, ultimately prompting the creation of the Financial Oversight and Management Board (FOMB). These economic challenges were exacerbated by the natural disasters which accelerated the outmigration of residents and health care providers, destroyed homes, schools, businesses and other infrastructure, and lead to the loss of revenue with reduced tourism and economic activity.

The structure of Medicaid financing for the territories has also contributed to fiscal stress. Unlike in the 50 states and D.C., annual federal funding for Medicaid in the U.S. territories is subject to a statutory cap and fixed matching rate. The territories’ federal matching rate (known as the federal medical assistance percentage, or FMAP) is fixed in statute, unlike the statutory formula for states, which is uncapped and adjusted annually based on a state’s relative per capita income. The U.S. territories’ FMAP rate is set to 55% (though it has been increased in the aftermath of natural disasters and the public health emergency), but if the matching rates were calculated using relative per capita income, all territories would receive a higher FMAP, likely at or close to the maximum allowable 83% matching rate. Notwithstanding temporary relief funds, once a territory exhausts its capped federal funds, it no longer receives federal financial support for its Medicaid program during that fiscal year. This places additional pressure on territory resources if Medicaid spending continues beyond the federal cap – making the effective matching rate lower than what is set in statute.

Over time, Congress has provided increases in federal funds for the territories broadly and in response to specific emergency events. Temporary funding can provide short-term relief, but also create fiscal funding cliffs that require ongoing Congressional action. The allotments for each of the territories for FY 2020 and FY 2021 are around seven to nine times the statutory levels as a result of additional funding added in the FY 2020 appropriation package and the Families First Coronavirus Response Act (FFCRA) (Figure 2). Puerto Rico was eligible for an additional $200 million in FY 2020 and FY 2021 contingent on a provider rate increase equal to at least 70 percent of what Medicare Part B would pay for services. In addition to increased federal funding, the traditional territory of 55 percent was increased to 76 percent for Puerto Rico and 83 percent for the territories through FY 2021 (with an addition increase of 6.2 percentage points as part of Medicaid fiscal relief available for all state and territories if certain maintenance of eligibility requirements are met). As noted in recent Congressional testimony, additional federal funding in Puerto Rico has been used to support increases in coverage, additional benefits (like hepatitis C treatment), and increased reimbursement for hospitals, physicians, and managed care plans.

While capped federal funding is often a constraint for the territories, territories have occasionally experienced difficulty putting up their share of funding that is necessary to draw down the federal funds. Loss of local revenue, especially revenue from tourism, both due to previous natural disasters and COVID-19 may impact the territories’ ability to use their federal funding. Increasing the federal match rate would assists the territories by requiring fewer territory funds to access to additional federal funding.

Unless Congress acts, the U.S. territories will lose over 80% of their funding and there will be a major Medicaid financing cliff in at the end of FY 2021. Without federal action, territories would need to make significant changes to their programs to cut Medicaid provider payments rates, benefits, or eligibility criteria while still managing the effects of the pandemic.

Figure 2: The Expiration of Additional Medicaid Funding for the Territories at the End of September 2021 Will Create Large Funding Gaps.

What to Watch Looking Ahead

New federal funds and efforts to provide vaccines will help address the pandemic. The American Rescue Plan Act provided $4.5 billion in Coronavirus State Fiscal Recovery Fund Payments that can be used to respond to the “negative economic impacts of COVID-19”32  and $700 million for critical capital projects to “directly enable work, education, and health monitoring in response to COVID-19”33  that may help alleviate some economic challenges for the islands.

The expiration of temporary Medicaid funding at the end of September 2021 will result in a major fiscal cliff if Congress does not act. The territories could lose the majority of federal Medicaid financing as the temporary funds make up more than eight in ten federal Medicaid dollars in each of territory. Without federal action, territories would need to make significant changes to their programs to cut Medicaid provider payments rates, benefits, or eligibility criteria while still managing the effects of the pandemic.

Congress may consider increasing the caps or more fundamental Medicaid financing changes such as eliminating the funding cap and revisiting how the FMAP is set. Increasing the funding caps could provide short-term relief. Congress may also consider proposals to eliminate Medicaid funding limits in the territories like, the Insular Area Medicaid Parity Act (HR 265), the Territorial Equity Act of 2021, or proposals that would transition funding from the current structure to achieve parity with other state programs over time (like HR 3371 from the last Congress that would achieve Medicaid financing for Puerto Rico over 10 years). Temporarily increasing the spending caps in the territories could avert the upcoming fiscal cliff; however, such action could also create another fiscal cliff in the future and create uncertainty in the availability of federal funding longer term without more permanent financing changes.

Endnotes

  1. Puerto Rico data are available for 2019. U.S. Virgin Islands data are available for 2016. ↩︎
  2. National Center for Chronic Disease Prevention and Health Promotion (NCCDPHP), How CDC Prevents Chronic Diseases and Promotes Health for US Territories and Affiliated Pacific Islands (Atlanta, GA: Centers for Disease Control, April 2019), https://www.cdc.gov/chronicdisease/resources/publications/factsheets/island-health.htm ↩︎
  3. Ibid. ↩︎
  4. U.S. Army Corps of Engineers, Facilities Condition Assessment Guam Memorial Hospital (Washington, D.C.: U.S. Army Corps of Engineers, April 2020), https://www.doi.gov/sites/doi.gov/files/uploads/oia-guam-memorial-hospital-facility-assessment.pdf ↩︎
  5. U.S. Department of the Interior, Office of the Inspector General, Insular Area Health Care: “At the Crossroads of a Total Breakdown” (Washington D.C.: U.S. Department of the Interior, Office of the Inspector General, September 2008), https://www.doioig.gov/sites/doioig.gov/files/2008-G-0040.pdf ↩︎
  6. U.S. Department of the Interior, Office of the Inspector General, Insular Area Health Care: “At the Crossroads of a Total Breakdown” (Washington D.C.: U.S. Department of the Interior, Office of the Inspector General, September 2008), https://www.doioig.gov/sites/doioig.gov/files/2008-G-0040.pdf ↩︎
  7. Averting A Crisis: Protecting Access To Health Care In The U.S. Territories, 117th Cong. (2021) (testimony of Congressman Gregorio Kilili Camacho Sablan). ↩︎
  8. Peter Georgiev and Adiel Kaplan, “American Samoa’s coronavirus conundrum: No Way to test,” NBC News (May 2020), https://www.nbcnews.com/health/health-care/american-samoa-s-coronavirus-conundrum-no-way-test-n1167776 ↩︎
  9. Ibid. ↩︎
  10. Dánica Coto, “Missteps mar Puerto Rico’s response to coronavirus,” AP News (April 2020), https://apnews.com/article/e5ba6c2639ee52dad5e367d2228ac764 ↩︎
  11. Patricia Mazzei, “Puerto Rico Lags Behind Everywhere Else in U.S. in Virus Testing,” The New York Times (August 2020), https://www.nytimes.com/2020/04/21/us/puerto-rico-coronavirus.html ↩︎
  12. Haidee Eugenio Gilbert, “Lack of nurses could slow community testing as COVID cases rise again,” The Guam Daily Post (August 2020), https://www.postguam.com/news/local/lack-of-nurses-could-slow-community-testing-as-covid-cases-rise-again/article_6a7808b8-d79d-11ea-9cd1-370bce05a80d.html ↩︎
  13. Emily Palmer, “Moored in a Fragile Paradise,” The New York Times (April 2020), https://www.nytimes.com/2020/04/17/travel/coronavirus-stjohn-caribbean.html ↩︎
  14. Michael Walsh and Elsie Lange, “How the tiny Pacific island of Guam became one of America’s coronavirus hotspots,” ABC News Australia (September 2020), https://www.abc.net.au/news/2020-09-11/guam-hospitals-under-pressure-after-coronavirus-outbreak/12637704 ↩︎
  15. Nicole Acevedo, “FEMA acknowledges Puerto Rico lacks rebuilt homes and a hospital to survive COVID-19,” NBC News (July 2020), https://www.nbcnews.com/news/latino/fema-acknowledges-puerto-rico-lacks-rebuilt-homes-hospital-survive-covid-n1234810 ↩︎
  16. Michael Walsh and Elsie Lange, “How the tiny Pacific island of Guam became one of America’s coronavirus hotspots,” ABC News Australia (September 2020), https://www.abc.net.au/news/2020-09-11/guam-hospitals-under-pressure-after-coronavirus-outbreak/12637704 ↩︎
  17. U.S. Department of the Interior, The Trump Administration is Supporting the People of the U.S. Virgin Islands (Washington, D.C.: U.S. Department of the Interior, 2020), https://www.doi.gov/sites/doi.gov/files/uploads/oia-covid19-wh-fact-sheet-usvi.pdf ↩︎
  18. U.S. Department of the Interior, Commonwealth of the Northern Mariana Islands Uses Interior CARES Act Funding to Strengthen COVID-19 Emergency Preparedness and Response Capabilities (Washington, D.C.: U.S. Department of the Interior, July 2020), https://www.doi.gov/oia/press/commonwealth-northern-mariana-islands-uses-interior-cares-act-funding-strengthen-covid-19 ↩︎
  19. Data are a KFF analysis of Johns Hopkins University Centers for Civic Impact for the Coronavirus Resource Center (CRC), https://github.com/govex/COVID-19/tree/master/data_tables/vaccine_data. Average daily number of cases are calculated as the average cases per million as a seven-day rolling average. For this analysis, the daily change in cases per million residents is averaged for the previous seven days. All data were pulled on May 12th, 2021. ↩︎
  20. Edmy Ayala and Patricia Mazzei, “Puerto Rico Orders Coronavirus Lockdown. Violators Could Be Fined,” The New York Times (March 2020), https://www.nytimes.com/2020/03/15/us/coronavirus-puerto-rico.html ↩︎
  21. Yanira Hernández Cabiya, “Dramatic economic reopening after 88-day lockdown,” Caribbean Business (June 2020), https://caribbeanbusiness.com/52221-2/ ↩︎
  22. Associated Press, “Puerto Rico will close schools amid COVID surge,” NBC News (April 2021), https://www.nbcnews.com/news/latino/puerto-rico-will-close-schools-covid-surge-rcna632 ↩︎
  23. Edmy Ayala and Patricia Mazzei, “Puerto Rico Just Had Its ‘Worst Moment’ for Covid-19,” The New York Times (April 2020), https://www.nytimes.com/2021/04/23/us/coronavirus-puerto-rico.html ↩︎
  24. United States Virgin Islands, COVID-19 – Path to a New Normal (United States Virgin Islands, March 2021), https://www.vi.gov/covid/phases/ ↩︎
  25. National Governors Association, Coronavirus State Actions (Washington D.C.: National Governors Association, July 2020), https://www.nga.org/coronavirus-state-actions-all/ ↩︎
  26. Reopening efforts were analyzed on May 12th, 2021. At that time, USVI had not made any changes from its previous “Safer at Home” phase. ↩︎
  27. Simon Romero, “A Place in the U.S. With No Covid-19? Look at American Samoa,” The New York Times (May 2020), https://www.nytimes.com/2020/05/06/us/coronavirus-american-samoa.html ↩︎
  28. Associated Press, “American Samoa Repatriation Program Detects 5 Virus Cases,” U.S. News (January 2021), https://www.usnews.com/news/best-states/hawaii/articles/2021-01-28/american-samoa-repatriation-program-detects-5-virus-cases ↩︎
  29. Rates were compared using “Total Doses Delivered Rate per 100,000” and data were analyzed on March 26th, 2021 and May 4th, 2021. See: Center for Disease Control, COVID Data Tracker (Centers for Disease Control, March 2021), https://covid.cdc.gov/covid-data-tracker/#vaccinations ↩︎
  30. Steve Limtiaco, “CNMI outpaces United States in COVID-19 vaccine rollout,” Pacific Daily News (January 2021), https://www.guampdn.com/story/news/2021/01/06/cnmi-covid-19-vaccine-rollout-best-us-cdc/6574087002/ ↩︎
  31. RNZ (Radio New Zealand), “Close to 24,00 Covid-19 vaccines rolled out in American Samoa,” RNZ (March 2021), https://www.rnz.co.nz/international/pacific-news/437798/close-to-24-000-covid-19-vaccines-rolled-out-in-american-samoa ↩︎
  32. Manatt Health, The American Rescue Plan: An Overview of Medicaid Provisions and State/Local Relief (Manatt Health, March 2020), https://www.shvs.org/wp-content/uploads/2021/03/FINAL-ARP-Medicaid-and-State_Local-Relief-Deck.pdf ↩︎
  33. Ibid. ↩︎

Contraception 2.0: Findings of a National Study of Online Contraception Platforms

Published: May 18, 2021

Introduction

Over the past 15 years, there has been a national shift to making contraception more accessible outside of a clinical setting. New pathways include: allowing pharmacists to prescribe birth control, making contraception available via telehealth and efforts to making contraception available over the counter without a prescription. Many of these options are widely acceptable to women, with the majority of women comfortable with pharmacists prescribing birth control and making contraception available over the counter without a prescription. In recent years, a growing number of companies providing contraception through online platforms (“telecontraception”) have entered the market and are providing a new option for people to conveniently obtain contraceptive supplies that need a prescription without the need for an in-person visit. Some of these companies specialize in contraceptive care and others have expanded services into sexually transmitted infection (STI) testing and treatment, as well as other primary healthcare services. The COVID-19 pandemic has amplified the interest and need for such services and accelerated the evolution of these platforms over the last year as more people have sought ways to obtain care from home.

Research into these online platforms has been limited. One study focused on characteristics of patients seeking services through one telecontraception platform and found that women ages 18-24 and 25-34 make up the majority of telecontraception users and that combined oral contraceptives were the most dispensed contraceptives. Another study found that among clients using a primary care telehealth platform, women seeking contraception were more likely to use coupons and less likely to provide insurance information compared to women seeking other primary care services. Studies have also found these platforms are relatively safe and that for the most the part they adequately screen for birth control contraindications (such as high blood pressure and migraines with auras), but could further improve contraindication screenings.

The share of women nationally that relies on these companies to obtain contraceptives is still relatively small. The 2020 KFF Women’s Health Survey found that 4% of women 18 to 49 had ordered birth control from an online birth control platform. Women 18 to 35 (6%), Hispanic women (5%), and low-income women (6%) were more likely to use these platforms than older women (1%), white women (3%), and higher income women (3%).

Many of these companies are seizing on the opportunities to expand, especially during the pandemic, to more states, accept insurance and Medicaid, and offer additional services. Over the past year, companies have expanded to offer the newest contraceptive methods like Annovera, the one-year ring, and services like acne treatment and anxiety medication. Companies are reporting up to a 100% year-over-year increase during 2020 due to the pandemic.

KFF has been tracking these companies and the sexual health services they offer since the beginning of the COVID-19 pandemic and conducted a study to better understanding the policies and practices of 16 telecontraception companies in November 2020 through January 2021. We received responses from 13 of the 16 companies we reached out to. Of the 13 companies, three provided partial information (28%-48% complete) and 10 companies responded to nearly all of the questions. This report presents the results of that study and discusses the implications of the findings.

Issue Brief

Overview

Customers access telecontraception platforms through web browsers or through phone apps. Clients create an account and fill out a health questionnaire that is meant to screen for birth control contraindications, such as a history of strokes, a recent pregnancy, high blood pressure and smoking status. Customers must also report a recent blood pressure reading. Depending on the state, a healthcare provider reviews these questionnaires once submitted or has a video consultation with the customer to determine whether the client is a good candidate for contraception. Research has found that telecontraception platforms generally screen adequately for these contraindications.

All telecontraception platforms offer oral contraceptives and many also offer the contraceptive patch and contraceptive ring. Platforms offer a variety of brands and generic equivalents, and most offer a $10 to $15 per month oral contraception option. Clients pick their preferred contraceptive method and depending on the company, can use private insurance or Medicaid to cover the prescription or pay out of pocket. Most companies also charge an additional consultation fee that covers the medical consultation and other services and is often not billed to insurance and must be covered out-of-pocket by the client. This can range from a $15 consultation fee to a $99 yearly membership that typically covers the medical evaluation and customer support for the duration of the prescription. Clients can obtain a new prescription for contraception or have an existing prescription mailed directly to their home or a local pharmacy for pickup.

Operations

Telecontraception Services

Telecontraception is marketed as a convenient way for people to quickly access a prescription for birth control without leaving their home. All the companies that responded said they provide asynchronous (e.g., store-and-forward) telehealth (n = 10), which involves a patient sending their information through a questionnaire or form that can be viewed by a medical provider at a later time. Seven of these companies also provide synchronous (e.g., live video-conferencing) telehealth services that involves real-time interaction between the patient and medical provider (Figure 1).

Figure 1: More Telecontraception Companies Use Asynchronous Telehealth, Though Most Use Both Types of Telehealth

Four companies only require an online questionnaire to receive a prescription, one company requires a consultation via video call, and five companies require both an online questionnaire and consultation via video call, phone call, or text message (Figure 2). One of the companies that only requires an online questionnaire specified that they require a photo government ID and one company said they only require consultation with video in states when required, otherwise, they use an online questionnaire.

Figure 2: The Majority of Telecontraception Companies Require an Online Questionnaire and a Consultation Via Video, Phone, or Text to Access Services

Staffing

PROVIDER TYPE AND PAYMENT

The number of providers working for telecontraception companies varied widely by company with a range of 10-154 providers working with each company. Of the eight companies that responded to this question, on average, online contraception companies were more likely to have medical doctors (MDs) on staff compared to other medical professionals, followed by nurse practitioners (NPs) (Figure 3).

On Average, MDs Make up the Majority of Providers at Online  Contraception Companies, Followed by Nurse Practitioners

A range of provider types work at telecontraception companies. Three companies employ only MDs as clinical staff. Three other companies have a much larger share of NPs compared to MDs (95%, 85%, and 80% NPs compared to 1%, 15%, and 10% MDs). One company is split evenly between MDs and Doctors of Osteopathic Medicine (DOs) (50% and 50%). There is another company that had a wide variety of providers, including 50% MDs, 30% NPs, 10% physician assistants (PAs), and 10% Doctors of Pharmacy (PharmDs). This is the only company that responded they were currently employing PharmDs and three companies employ PAs.

There was considerable variation in the arrangements that the companies used to pay their providers. Of the nine companies that responded about how their providers were paid, two companies said all of their providers were salaried employees, three companies said they had salaried providers and providers paid hourly, two companies said their providers were only paid hourly, and two companies said providers were paid per visit. One of these companies specified that their salaried employees were paid by the independent professional medical corporation with which the providers are affiliated.

TRAINING

The number of hours of training providers receive about prescribing birth control varied considerably ranging from one to fifteen hours. The company that responded one hour said training is one hour initially, followed by one hour per year. One company did not provide the number of hours of training their providers receive about prescribing birth control, but said every provider receives minimum required training, including ongoing training.

CONTRACEPTIVE COUNSELING AND REFERRALS

Nine of the ten companies that responded said their providers offer clients contraceptive counseling (Figure 4). Contraceptive counseling includes working with the client interactively to select the most appropriate contraceptive method for them. We asked, on average, how much time per visit providers usually spend doing contraceptive counseling. Two companies did not provide specific time ranges, only saying that it varies and the four companies that provided an amount of time said contraceptive counseling ranged from 2–15 minutes.

Figure 4: The Majority of Telecontraception Companies Provide Contraceptive Counseling to Their Clients

Of the nine companies that responded about referrals, eight companies said they offer referrals to another provider for clients seeking a contraceptive method that their company does not provide, or when a client is not eligible for hormonal methods based on their medical history. However, only one of the companies that responded to the questionnaire is affiliated with a brick-and-mortar health system or provider network to which they can refer clients. With additional follow-up, another company said they refer their patients to all the same places a typical primary care office would refer their patients to and help patients navigate the best place for them (e.g., in-network, geographical proximity, patient reviews). One company said they can direct clients to federally qualified health centers or other community-based organizations. One company said they did not offer referrals at all.

NEW PRESCRIPTIONS VS. ReFILLS

We asked what share of their new contraceptive clients were seeking a refill for their existing contraceptive method or were seeking a prescription for a new contraceptive method or different brand or formulation. Five companies responded and three companies said the majority of their clients were seeking a prescription for a new contraceptive method or different brand or formulation (percentage of clients: 100%, 70%, 70%) and two companies said their new contraceptive clients were split between those seeking a new prescription and those seeking a refill for their existing contraceptive method.

DISTRIBUTION

Telecontraception platforms offer two forms of delivery for contraceptives: at-home delivery via mail service and/or pick-up at a local pharmacy. From our tracker, most companies offer both at-home delivery and local pharmacy pick-up, and very few offer just one option. In our survey, the majority of companies said most clients fill their prescriptions via at-home delivery (n = 8), which makes these platforms convenient options, especially during a pandemic (Figure 5). Companies said it usually takes two to seven days for prescriptions to arrive at the client’s home and all the companies that do at-home delivery said they use the United States Postal Service for delivery, except for one company that uses DHL.

Figure 5: Telecontraception Platforms Deliver Contraceptives Via Two Method: At-Home Mail Delivery and Local Pharmacy Pick-Up

Two companies said that most of their clients fill their prescriptions via local pharmacy pick-up and that prescriptions are available for same-day pick-ups, making this a fast option if a client needs their contraception as soon as possible. Most telecontraception companies’ pharmacy pick-ups are available on the same day of the client consultation (n = 8). Two companies that mostly do at-home delivery said pharmacy pick-ups are not available for same day pick-up.

There is sizable variation in how these platforms work with pharmacies, both mail order and brick and mortar pharmacies. In order to deliver contraception to their clients’ homes, some companies use an in-house pharmacy, but the majority partner with outside pharmacies (Figure 6). At least one of the companies partnered with up to six pharmacies. The two companies that said most of their clients pick-up their contraceptives at local pharmacies partnered with larger pharmacy networks. One of the vendors reported partnering with 90,000 pharmacies and the other explained that they partner with one pharmacy delivery company, but are networked into most every major pharmacy in the U.S.

The Majority of Online Contraception Platforms Partner With Other Pharmacies in Order to Delivery Contraceptives to Clients

The majority of telecontraception companies distribute three months of oral contraceptives at a time (n = 8). However, there was variation. One company said, on average, they usually distribute one month of oral contraceptives at a time and another company said on average they usually distribute twelve months of oral contraceptives at a time. Some companies have providers that write prescriptions for a year of oral contraceptives, but they are only dispensed for one to three months at a time due to state and insurance limitations. Currently, only 19 states require that insurers cover a 12-month supply of oral contraceptives and that requirement is limited to fully insured self-regulated plans, not self-funded employer plans.

Clients Served

Since these telecontraception companies have been in business for differing periods of time (most of the companies started up between 2011 and 2019) and not all companies deliver and/or prescribe in all states, the number of contraceptive clients served by these companies varies widely; two companies were comparatively smaller, serving less than 10,000 contraceptive clients, while three companies reported serving 300,000+ clients (Figure 7).

The Number of Contraceptive Clients Served by Online Contraception Companies Varies Widely

Among all these companies’ clientele, contraceptive service customers account for 10%–100% of their total clientele. All the companies that responded said their contraceptive clients were 100% female. This could be because no prescription contraceptive methods are geared towards men and condoms are available for purchase at low cost over-the-counter. While there are companies that sell condoms online like Lola, the companies that we focused on for this study offered hormonal contraceptives. On average, the largest share of these companies’ clients are between the ages of 18 and 24, but the 25- to 30-year-old age group also accounts for one third of the market. (Figure 8).

The Largest Share of Online Contraception Clients Are Between 18 and 30 Years Old

Many of the companies are looking to diversify and expand their markets. When asked if there was a population their company would like to serve that they do not currently serve, responses included: Spanish  speakers, rural populations, LGBTQIA+ populations, and clients with Medicaid and insurance.

Availability Across State Lines

Many of these companies can be accessed in a number of U.S. states, and of the 13 companies in our study, five companies can prescribe contraception in all 50 states. Seven companies can function as a mail-order pharmacy and deliver contraception in all 50 states for those individuals that already have a prescription from their provider.

State telehealth laws and provider licensing across state lines were the top reasons that companies cited as to why they were not able to prescribe contraception to their clients in all 50 states. Two of the companies said that it was an administrative challenge for staff to bring on new states. One company said they were limited by the fact that their pharmacy partners don’t distribute in all 50 states (Figure 9).

Most Commonly Reported Barriers for Not Prescribing Contraception in All 50 States are Restrictive Telehealth Laws and Not Having Licensed Providers in All States

For the six companies who said they could not deliver contraception by mail in all 50 states there was not a predominant reason. Two companies cited restrictive state telehealth laws. One of these companies also said they were limited by the fact that their pharmacy partners do not distribute in all 50 states and it is an administrative challenge for staff to bring on new states. One company said they do not have providers licensed in all 50 states and another responded that delivering contraception in all 50 states is in their product roadmap for future launch.

Marketing

Most telecontraception companies rely on a range of approaches to advertise and market their products and services. Some use organic searches from search engines like Google or Bing where people can search for their products (n = 11), paid searches or search engine marketing like Google ads (n = 9), or paid social media like Facebook, Twitter, and Instagram ads (n = 8) (Figure 10). One company said their consumers found out about their company through TV, podcasts, and influencers.

Most Online Contraception Companies Use Search Engines and Paid Social Media to Market Their Services

Services and Supplies

While all of the companies we surveyed provided contraception, many provided additional services to their clients, like urinary tract infection (UTI) treatment, STI diagnosis and treatment services, skin care and hair loss treatments, and other primary care services (Figure 11). Mental health services, and erectile dysfunction treatments were offered by four of the platforms and some also offer vitamins, COVID-19 tests and PrEP.

Urinary Tract Infection Treatment and Sexually Transmitted Infection Testing Are Other Common Services Provided by Online Contraception Companies

Oral contraceptives make up the largest share of their contraceptive service product lines by far, ranging from 70-93% with a mean of 87% across companies (Figure 12). A much smaller share of their contraceptive lines is for emergency contraceptive pills, the contraceptive ring and patch. A small fraction of their contraceptive lines includes Depo Sub-Q injections and female condoms.

Oral Contraceptives Followed by Emergency Contraception Make up the Largest Share of Online Contraception Companies' Product Lines

The most popular contraceptive pill brand or generic alternative among customers using insurance and customers paying with cash was the combination pill Sprintec, which is a generic equivalent to Ortho-Cyclen. Apri and Vienva, combination generic pill equivalents to Desogen and Alesse respectively, were also popular among customers using insurance and cash. For customers using cash, companies also responded that Errin, a progestin-only generic equivalent to Ortho Micronor, and norethindrone, as well as Aubra EQ, a combination pill generic equivalent to Alesse were also popular (Figure 13).

Figure 13: Telecontraception Companies’ Most Popular Oral Contraceptive Pill Brands or Generic Alternatives Among Customers Using Insurance and Cash

We asked companies if there was a method of contraception they would like to carry that they do not currently offer and the reason why they did not currently carry it (Figure 14). Three companies said they would like to carry Depo-Sub-Q and one company responded that they currently do not carry it because the average co-pay and the self-pay cost are too high. Another company cited the same reasons for not carrying female condoms, and another wanted to carry male condoms, but said they are not reimbursed enough. One company said they would like to expand their contraceptive offerings to include Annovera, the 1-year vaginal ring, and Plan B or its generic alternative for emergency contraception and two companies would like to carry Phexxi gel, a non-hormonal prescription vaginal gel. Since our study was conducted, one of these companies now carries Phexxi gel. While these companies are primarily focused on short acting hormonal contraceptive methods, one company said they would like to work on patient flows that allow obtaining an IUD for single appointment insertion to streamline IUD adoption.

Figure 14: We asked companies if there was a contraceptive method they would like to carry that they do not currently offer and they said the following:

Payments for Services and Supplies

Since 2012, the Affordable Care Act (ACA) has required most private insurance plans to cover all FDA approved contraceptive methods and services without cost-sharing, although religious employers and employers with religious and moral objections to contraception are exempt from the coverage requirement. Additionally, the ACA also created a new Medicaid eligibility pathway for adults that also requires contraceptive coverage without cost-sharing. While these requirements do not apply to Medicaid pathways available prior to the ACA, KFF research has found that most states cover a broad range of contraceptive methods across all Medicaid pathways available in the state. Not all telecontraception platforms accept both private insurance and Medicaid, but the majority accept at least one form of insurance, and many serve clients willing to pay out-of-pocket for their contraception.

PRIVATE INSURANCE

We asked companies if they accepted private insurance and about the barriers they have encountered while working with private plans, and for those that do not accept private insurance, what were the obstacles that were preventing them from accepting it. Of the ten companies that responded to this question, eight accept private insurance and two companies do not (Figure 15). One company that does not accept private insurance cited multiple obstacles including that they had previously tried to work with private insurance, but experienced barriers; low reimbursement; excessive administrative burdens; the complexity of developing relationships with private insurance companies; and clients’ willingness to pay out-of-pocket. The other company that does not currently accept private insurance said they began with a self-pay model, but they are currently working on expanding to accept Medicaid and private insurance.

The Majority of Online Contraception Platforms Accept Some Form of Insurance

Among the companies that accept private insurance, three report that private insurance companies are unwilling to cover contraceptive mail order deliveries beyond the first few months, likely due to pharmacy contract limitations and competition by the private insurance companies’ internal mail orders. One company explained that Pharmacy Benefit Managers (PBM) place limits on refills from the telecontraception company and require patients to use their insurance company’s PBM’s mail order program. One company also said private insurance companies do not always cover a one-year supply of contraception when they prescribe one year of contraception, even when state law requires insurers in that state to cover a 12-month supply. One company cited prior authorization requirements and two cited copays as barriers they have experienced in trying to work with private plans. Another company also said that refills requested prematurely by clients result in coverage denials that mean patients must wait longer than they would like before getting their next refill. This same company said they are considered out of network (and therefore clients can be charged copayments) and the contraceptives they provide may not be on a private insurance company’s formulary also resulting in charges and lack of coverage.

MEDICAID

Fewer companies accept Medicaid, the state-federal health program for low-income people (6 of 10 that responded to this question). Of the four companies that do not accept Medicaid, half said they have tried to work with Medicaid but have experienced barriers. One of these companies also said that Medicaid’s telehealth policies are too restrictive. Two companies said that accepting Medicaid was too administratively burdensome and another two said the complexity of developing relationships with state Medicaid managed care organizations was a barrier to accepting Medicaid.

A major challenge to working with Medicaid that was cited by companies that currently accept Medicaid was the variation of Medicaid requirements across states, with each state Medicaid program having its own unique regulations and processes to enroll. One company said that in California, they have to contract with each county and the counties require them to be physically located within them, which makes their business model as a mail order company difficult. Another company similarly cited contracting challenges for mail order dispensing. One company also said that Medicaid requirements that the provider be located in a health facility to bill Medicaid also presented a challenge. This same company noted that low reimbursement rates for visits and oral contraceptive pills, restrictions on the number of packs that can be dispensed at one time to a patient, and requirement for a real-time (synchronous) video visit even in states that otherwise permit asynchronous care pose barriers to working with Medicaid.

Eight companies provided the distribution of payment methods that their current contraceptive clients use. One company’s contraceptive clients are 100% paying with cash – this company does not accept private insurance or Medicaid. Two other companies said the majority of their clients pay with cash. Three companies said half of their contraceptive clients use insurance and half use cash to pay for their contraception. Only two companies said the majority of their clients pay with insurance (Figure 16).

Larger Shares of Online Contraception Clients Pay With Cash

Of the nine companies that responded, four companies said they have relationships with manufacturers that offer their company a rebate, discount, or incentive for a particular contraceptive. Three out of the four companies said this allows them to offer these contraceptives at a lower price.

Change in Client Volume Since COVID

The COVID-19 pandemic has expanded interest and use of telecontraception companies, and many noted a sizable bump in business this past year. All of the companies that responded said their client volume has increased since the start of the COVID-19 pandemic. The majority of companies said their client volume had increased over 50% since the start of the COVID-19 pandemic (n = 6) when they responded in the winter of 2019 (Figure 17). One company had seen client volume increase between 25-50% and two companies had experienced client volume increases between 10-24%. Eight of the companies said they have seen the greatest relative increase in demand for oral contraceptives and one company had not seen an increase in demand for any particular method, but their client volume had increased over 50%.

Most Online Contraception Companies Have Seen Client Volume Increase Over 50% During the COVID-19 Pandemic

Looking Forward

The rise of telecontraception platforms has created a new way for women of reproductive age to access contraceptives easily and quickly without having to visit a doctor’s office or leave their homes. This access has been particularly important during the COVID-19 pandemic as telehealth options have expanded. While many of the companies accept some form of insurance, barriers in working with insurance are cited frequently and people can end up paying out-of-pocket when they are entitled to no cost contraceptive services and supplies through their private insurance through the Affordable Care Act’s Contraceptive Coverage requirements. However, many women may be willing to pay out-of-pocket for the ease of a quick consultation and having their contraception sent straight to their home, without having to ever step foot in a clinic or schedule a telehealth appointment. These platforms are also available in all 50 states and could be affordable options for uninsured individuals that do not want or are unable to visit a Title X funded clinic or federally qualified health center to receive their contraceptive care.

While telecontraception may be a valuable option for some individuals, there is still an important role for bricks and mortar clinics that can provide the full range of contraceptive methods without cost-sharing to their patients and connect their patients to other primary care services. It will also be important that individuals who want to use telecontraception have access to quality contraceptive counseling, referrals if desired, and other primary care that may not be offered by all of these platforms. These companies may serve a small share of reproductive aged women right now but could become an important source of contraceptive care in the future, particularly for those individuals who may have difficulty accessing in-person care or prefer not to access care through a clinic. While telecontraception can provide a new pathway to contraception for many women, it does not necessarily ensure that people have access to the contraceptive method of their choice and that the financial and other structural barriers to that care are addressed.

We would like to acknowledge all of the telecontraception companies that participated in this study and provided this valuable information.

News Release

A New Analysis Takes a Closer Look at Online Contraception Platforms Amid the Pandemic

Published: May 18, 2021

Even prior to the COVID-19 pandemic, hormonal contraception became more accessible to many outside of traditional clinical settings through websites or apps that offer contraception via telehealth. To better understand this emerging method of contraceptive access, a new KFF analysis provides a deeper look at telecontraception platforms, offering insights into the practices of 13 different companies based on information collected between November 2020 through January 2021. Key highlights from the report include:

  • All of the companies reported an increase in services and demand since the COVID-19 pandemic, with a majority seeing an increase over 50% since the start of the pandemic. Oral contraceptives, which make up the largest share (87%) of these companies’ product lines, had the greatest increase in demand for most companies.
  • While all of the companies surveyed provide contraception, many also provide services such as urinary tract infection (UTI) treatment, STI diagnosis and treatment services, skin care and hair loss treatments, and other primary care services.
  • The majority of the companies accept private insurance for contraception, but most charge a fee ranging from $15 to $99 annual membership costs for the telehealth services. Fewer companies accept Medicaid citing barriers such as administrative burdens and state variation regarding Medicaid requirements. A sizeable share of clients pay cash for their contraception with most companies offering a $10 to $15 oral contraception per month option.

Medicare-Covered Older Adults Are Satisfied with Their Coverage, Have Similar Access to Care as Privately-Insured Adults Ages 50 to 64, And Fewer Report Cost-Related Problems

Authors: Nancy Ochieng, Jeannie Fuglesten Biniek, Karyn Schwartz, and Tricia Neuman
Published: May 17, 2021

Executive Summary

Executive Summary

High and rapidly growing health care spending in the U.S. is a concern for consumers, employers, tax payers and policy makers. The relatively high prices paid by private insurers is one of the key factors fueling this trend, leading some policy makers to consider whether Medicare rates, or a multiple of Medicare rates, should be used to help control costs and address affordability concerns for people with private insurance. President Biden, for example, proposed during the campaign to establish a “public option” and reduce the eligibility age for Medicare from 65 to 60 to broaden coverage and lower costs. Democratic lawmakers in Congress have proposed similar legislation to provide more affordable health coverage by leveraging Medicare’s lower provider payment rates. However, some question whether a shift toward Medicare provider payment rates might adversely affect access to care and affordability for people who gain or change coverage under these options.

To inform this discussion, this analysis looks at the current experiences of Medicare beneficiaries ages 65 and older with respect to satisfaction and access measures and examines whether privately-insured adults ages 50 to 64 report access or cost problems at higher or lower rates than Medicare beneficiaries 65 and older. We do not attempt to model how shifts in coverage, and associated changes in provider payments, could change provider behavior and potentially impact access to care, the amount of health care services people use, satisfaction among patients, or affordability. This analysis draws on data from the 2018 Medicare Current Beneficiary Survey and the 2019 National Health Interview Survey (See Methods Appendix for additional information. All results reported in the brief are statistically significant).

Our analysis finds:

  • Overall, the vast majority of adults 65 and older with Medicare coverage (94%) report being very satisfied or satisfied with the quality of their medical care and the availability of specialists.
  • Most privately-insured adults ages 50 to 64 and Medicare-covered adults ages 65 and older report having a usual source of care in a setting other than an emergency department (96% for both insurance groups).
  • A somewhat larger share of privately-insured adults ages 50 to 64 (16%) than Medicare-covered adults ages 65 and older (11%) report having cost-related problems, defined as delaying or forgoing medical care due to costs or having problems paying medical bills.
  • The affordability gap is wider among adults in relatively poor health: one-third (33%) of privately-insured adults ages 50 to 64 report cost-related problems compared to one-fifth (20%) of Medicare-covered adults ages 65 and older.

Issue Brief

Introduction

Health care spending accounts for nearly 18% of the U.S. economy and is projected to continue to rise for the foreseeable future. One factor driving this trend is the relatively high prices paid to health care providers for people who have private insurance through either an employer or purchased directly in the non-group market. Private insurers pay hospitals nearly double Medicare rates on average and pay physicians an average of 143% more than Medicare pays. These relatively high payments contribute to overall health care spending growth and higher per enrollee spending growth for people with private insurance. They also impact the premiums and out-of-pocket spending on deductibles and other cost-sharing that people pay.

Policymakers at the federal and state level have supported a range of proposals that aim to broaden coverage and improve affordability, including policies that adopt Medicare rates, or a multiple of Medicare rates. Recent KFF analysis found that health care spending for 60 to 64 year olds in large employer plans was 38% higher than 65 to 69 year olds with Medicare, suggesting that total health spending for these older adults could be lower, if, for example, 60 to 64 year olds in large employer plans were eligible to enroll in Medicare. However, some question whether a shift to Medicare rates for some privately-insured individuals would lead to lower levels of satisfaction and higher rates of access problems, or exacerbate affordability concerns. To inform this discussion, this analysis compares the experiences of privately-insured and Medicare-covered older adults.

Medicare beneficiaries and privately-insured adults with employer-sponsored and non-group coverage contribute to the cost of their health insurance and care through monthly premium payments, deductibles and other cost-sharing requirements at the point of service. People with Medicare pay monthly Medicare Part B premiums and may pay additional premiums for Medicare Part D prescription drug coverage, Medicare Advantage coverage, and supplemental insurance (if in traditional Medicare). In addition, Medicare beneficiaries incur costs for services in the form of deductibles, copayments and co-insurance that vary by type of service and source of coverage. There is no limit on out-of-pocket spending under traditional Medicare for benefits provided under Parts A and B, although most traditional Medicare beneficiaries have supplemental insurance (Medigap, retiree health or Medicaid) that covers much of these costs. In contrast, Medicare Advantage plans include a cap on out-of-pocket spending, but neither traditional Medicare nor Medicare Advantage provides a hard cap on prescription drug expenses. Premiums, cost-sharing requirements, and gaps in benefits (such as dental and long-term services and supports) contribute to relatively high out-of-pocket costs.

Most people with employer-sponsored coverage and private insurance in the non-group market are subject to varying amounts of annual premiums, deductibles, and fixed copayment or coinsurance amounts for services received and generally have coverage that includes a cap on out-of-pocket costs, which is a requirement of the Affordable Care Act. The specific premium and cost-sharing amounts vary, both across and within insurance types. Relatively high fees paid to providers contribute to higher costs per person and higher premiums and other out-of-pocket spending among enrollees. Further, because health needs and health spending rise with age, the financial burden of health care rises with age among non-elderly people with private insurance.

Even though private insurance typically reimburses physicians at a higher rate than Medicare, Medicare beneficiaries have broad access to providers. The vast majority (97%) of all physicians participate in the Medicare program, which means that they agree to accept the established Medicare payment rates, and very few (1%) physicians have formally opted-out of the Medicare program. Employer and non-group private health insurance plans rely more on networks that may restrict access to certain providers, as do Medicare Advantage plans, which cover 39% of beneficiaries.

This brief begins with a look at rates of satisfaction and access indicators among Medicare-covered adults ages 65 and older (including those enrolled in both traditional Medicare and Medicare Advantage). It then examines whether privately-insured adults ages 50 to 64 report better or worse access to care than Medicare beneficiaries ages 65 and older. It also compares cost-related problems for both groups. Access and affordability in private insurance and Medicare are driven by many factors, including provider participation, scope of benefits, and required cost sharing.

In this analysis, we do not attempt to model whether extending Medicare’s payment structure to a subset of people who are currently covered by private insurance, such as those ages 60 to 64, would affect provider participation in the program, the amount of health care services people use, or the ability of the health care system to meet demand for care. However, this brief does provide insight based on the experience of beneficiaries covered under the current Medicare program. A detailed description of our methodology is included in the appendix.

Findings

Our analysis finds the vast majority of Medicare beneficiaries ages 65 and older report high levels of satisfaction with the Medicare program and few access problems. When comparing older (65-plus) adults with Medicare to privately-insured adults ages 50 to 64, we find a larger share of privately-insured adults report cost-related problems, such as delaying getting medical care because of cost, needing medical care but not getting it because of cost, or problems paying or inability to pay any medical bills—a pattern that is particularly pronounced for those in relatively poor health. This may be counter to expectations because Medicare-covered adults ages 65 and older tend to be sicker and use more health services than privately-insured adults ages 50 to 64.

Overall, Medicare-covered adults ages 65 and older are satisfied with their care; few have trouble getting needed care

Most Medicare beneficiaries ages 65 and older report being satisfied with their care. The vast majority of Medicare beneficiaries ages 65 and older (94%) report being very satisfied or satisfied with the quality of their medical care, with no significant differences by race and ethnicity, gender, and metropolitan status, according to data from the 2018 Medicare Current Beneficiary Survey (MCBS). A slightly smaller share of Medicare beneficiaries in self-reported fair or poor health (91%) report being very satisfied or satisfied than those in self-reported excellent, very good, or good health (95%) (Figure 2, Table 1). The MCBS only includes Medicare beneficiaries, and does not include a comparison group of adults with private insurance. While the 2019 NHIS includes a comparison group of privately-insured adults, it does not include measures of satisfaction. A 2020 survey by the Medicare Payment Advisory Commission (MedPAC)  found that larger shares of Medicare beneficiaries ages 65 and older (88%) reported being very or somewhat satisfied with the overall quality of their health care than privately-insured adults ages 50 to 64 (82%).

Nearly 9 in 10 (87%) Medicare beneficiaries ages 65 and older report being very satisfied or satisfied with the availability of care by specialist, with no significant differences by race and ethnicity, gender, or self-reported health status (Figure 2). A slightly larger share of Medicare beneficiaries ages 65 and older in metropolitan areas (88%) report being very satisfied or satisfied with the availability of care by specialists than adults ages 65 and older in rural areas (83%) (Table 1).

Few Medicare beneficiaries ages 65 and older report trouble getting needed health care or forgoing needed medical care. A small share (5%) of all Medicare beneficiaries ages 65 and older report trouble getting needed health care and a similarly small share (5%) report that they had a problem for which they should have seen a doctor but didn’t (Table 1).

A somewhat larger share of Medicare-covered adults ages 65 and older in relatively poor self-assessed health report trouble getting needed health care (10%) or having a problem for which they should have seen a doctor but didn’t (11%) than beneficiaries in better health (4% for each measure). Somewhat larger shares of Black and Hispanic Medicare beneficiaries report trouble getting needed care (7% and 8%, respectively) than White Medicare beneficiaries (4%), though there are no significant differences by race and ethnicity in the shares of Medicare beneficiaries with problems for which they should have seen a doctor but didn’t (Table 1).

The vast majority of privately-insured adults ages 50 to 64 and Medicare-covered adults ages 65 and older have a usual source of care

The vast majority of privately-insured adults ages 50 to 64 and Medicare beneficiaries ages 65 and older report having a usual source of care. Analysis of 2019 data from the National Health Interview Survey (NHIS) finds that 96% of both privately-insured adults ages 50 to 64 and Medicare-covered adults ages 65 and older report having a usual source of care (Table 2).

Among those with a usual source of care, the majority of privately-insured adults ages 50 to 64 (89%) and Medicare-covered adults ages 65 and older (90%) report a usual source of care other than an emergency room or urgent care, such as a doctor’s office or health center. This is generally true without regard to race/ethnicity, gender, self-reported health status, and metropolitan status.

A larger share of privately-insured adults ages 50 to 64 than Medicare-covered adults ages 65 and older report affordability problems

A larger share of privately-insured adults ages 50 to 64 than Medicare-covered beneficiaries ages 65 and older report having cost-related problems (16% versus 11%, respectively) (Figure 3, Table 3). Cost-related problems include delaying getting medical care because of cost, needing medical care but not getting it because of cost, or problems paying or inability to pay any medical bills during the past 12 months.

The affordability gap between privately-insured adults 50 to 64 and Medicare-covered adults ages 65 and older is more pronounced among those in worse health. For example, among adults in fair or poor self-assessed health, one-third (33%) of privately-insured adults ages 50 to 64 report at least one cost-related problem compared to one-fifth (20%) of Medicare beneficiaries ages 65 and older. Additionally, among adults with 5 or more chronic conditions, the share of privately-insured adults ages 50 to 64 with cost-related problems (42%) is more than double the share reported by Medicare-covered older adults (19%).

Consistent with the overall findings, larger shares of 50 to 64-year-old privately-insured women, men, and people in both urban and rural areas report cost-related problems than their counterparts with Medicare. Notably, the shares of privately-insured Black and Hispanic adults ages 50 to 64 with cost-related problems are not significantly different from the share of Black and Hispanic Medicare-covered older adults reporting cost-related problems, although cost-related problems are more common among White privately-insured adults ages 50 to 64 than White Medicare-covered adults ages 65 and older.

However, within both private insurance and Medicare, larger shares of Black and Hispanic adults report cost-related problems compared to White adults with the same type of insurance. Among people ages 50 to 64 with private insurance, 21% of Black enrollees, 18% of Hispanic enrollees, and 15% of White enrollees report cost-related problems. Within Medicare, 23% of older Black beneficiaries, 17% of older Hispanic beneficiaries, and 9% of older White beneficiaries report cost-related problems.

Nearly half of privately-insured adults ages 50 to 64 report worries about the ability to pay medical bills compared to a third of Medicare beneficiaries ages 65 and older. A larger share of privately-insured adults ages 50 to 64 than Medicare-covered adults ages 65 and older report being very or somewhat worried about being able to pay medical bills if they were sick or had an accident (48% versus 33%). Again, the differences were larger for those in worse health or with more chronic conditions. Specifically, 64% of privately-insured adults ages 50 to 64 in self-assessed fair or poor health report being worried about paying medical bills compared to less than half (42%) of Medicare beneficiaries ages 65 and older in self-assessed fair or poor health. Among adults with 5 or more chronic conditions, the share of privately-insured adults ages 50 to 64 with worries about paying medical bills (66%) is larger than the share among Medicare beneficiaries ages 65 and older (39%). This pattern persists even among adults with fewer (3-4) chronic conditions (Figure 4, Table 3).

Larger shares of 50 to 64-year-old privately-insured women, men, and people in urban and rural areas report worries about their ability to pay medical bills than their counterparts ages 65 and older with Medicare. We also observe that among older adults with Medicare, larger shares of Black and Hispanic beneficiaries (43% and 44%, respectively) than White beneficiaries (30%) report worries about being able to pay medical bills. Additionally, among privately insured adults ages 50 to 64, a larger share of Hispanic than White adults report worries about paying medical bills (58% and 47%, respectively); the difference between privately insured Black and White adults ages 50 to 64 is not statistically significant. Across the two insurance groups, larger shares of privately-insured White and Hispanic adults ages 50 to 64 than Medicare-covered White and Hispanic older adults report worries about their ability to pay medical bills; the difference in the share of Black adults with worries about being able to pay medical bills is not statistically significant.

Discussion

Our analysis finds that most adults ages 65 and older with Medicare have relatively good access to care and are satisfied with the quality of the care they receive, consistent with previous analyses. Additionally, adults ages 65 and older with Medicare report comparable access to care as privately-insured adults between 50 and 64. These findings suggest that lower Medicare reimbursement rates relative to private insurance do not generally inhibit the ability of adults ages 65 and older to receive health care services.

These findings are consistent with past research, particularly analyses by the Medicare Payment Advisory Commission (MedPAC), which show that Medicare beneficiaries ages 65 and older had similar or better satisfaction rates and ability to find a new primary care physician or specialist compared to privately insured adults ages 50 to 64. Our analysis contributes to the body of evidence on the experience of Medicare beneficiaries compared to those with private insurance by also analyzing how cost-related problems compare between the two insurance groups. We find that a smaller share of adults 65 and older with Medicare than privately-insured adults ages 50 to 64 face cost-related problems, and these differences are more pronounced for people in worse health. However, a number of other studies have separately documented the financial burden of health care for people on Medicare, when premiums for supplemental insurance and uncovered services are taken into account.

Our primary focus in this analysis was to examine whether adults ages 50 to 64 with private insurance report different access to care or encounter cost-related problems in accessing care at different rates than adults ages 65 and older with Medicare. In comparing measures for certain subgroups, we also observe that Black and Hispanic adults within each insurance group often face higher rates of cost-related problems than White adults. This may be due in part to the fact that White adults tend to have more financial assets and lower utilization of costly-services such as inpatient stays and emergency department visits compared to Black and Hispanic adults. While there is additional help with premium and cost-sharing for Medicare beneficiaries and enrollees in the ACA Marketplaces with the lowest incomes and fewest assets, eligibility for that assistance may not fully account for financial vulnerability.

The higher rates of cost-related problems among privately insured adults ages 50 to 64 may be attributable to differences in benefit design, including deductibles, coinsurance rates and other factors, such as the scope of covered services. In addition, relatively high prices paid by private insurance for health care services contribute to higher out-of-pocket costs for enrollees. This is because the amounts paid by enrollees for health care services (e.g. deductibles and coinsurance) are often determined by price, and premiums are set to cover a set percentage of expected health care spending, compounding differences in cost-related problems that may be due to benefit design.

Any future health proposals that would build on Medicare or public coverage to rein in high health care costs, such as through a public option or by lowering the age of Medicare eligibility to 60, may help to mitigate cost-related problems that people with private insurance experience. These changes may be especially salient for people with greater health needs, including those in self-reported fair or poor health and those with multiple chronic conditions, who may utilize more services and incur higher out-of-pocket expenditures for their health care. While we did not attempt to model the impact of policies on provider behavior or access to care, our analysis shows that Medicare’s current reimbursement levels are not associated with cost or access problems.

This work was supported in part by Arnold Ventures. We value our funders. KFF maintains full editorial control over all of its policy analysis, polling, and journalism activities.

Nancy Ochieng, Jeannie Fuglesten Biniek, and Tricia Neuman are with KFF. Karyn Schwartz was with KFF at the time this brief was written.

Methods

The Centers for Medicare & Medicaid Services (CMS) Medicare Current Beneficiary Survey (MCBS) 2018 Survey File was used to describe Medicare beneficiaries’ satisfaction with the quality of medical care, satisfaction with availability of care by specialists, the shares experiencing trouble getting needed health care, and the shares with health problems that they think a doctor should see but didn’t.

The analysis of MCBS 2018 Survey File includes community-dwelling beneficiaries ages 65 and older who are enrolled in Part A and Part B for most months of the year. The analysis excludes beneficiaries under 65 years and institutionalized beneficiaries because they are disproportionately dual-eligible, disabled, or otherwise in worse health than those of the same age in private insurance. We also exclude beneficiaries with Part A or Part B only and those with Medicare as a Secondary Payer for most months of the year because their responses likely reflect the effect of other insurance coverage.

The 2019 National Health Interview Survey was used to compare different access measures between Medicare beneficiaries ages 65 and older and privately-insured adults ages 50 to 64. The NHIS analysis excludes Medicare beneficiaries with Part A or Part B only. Adults in institutional settings are excluded from the analysis. As part of the redesign of the NHIS questionnaire in 2019, several questions were dropped from the survey, including questions related to satisfaction with health care. Therefore, we were unable to analyze how satisfaction rates compare between Medicare beneficiaries ages 65 and older and privately-insured adults ages 50 to 64.

In this analysis, we define “cost-related problems” based on positive responses to any of the following three questions:

  • During the past 12 months, have you delayed getting medical care because of the cost?
  • During the past 12 months, was there any time when you needed medical care, but did not get it because of the cost? In the past 12 months, did you have any problems paying or were unable to pay any medical bills?

All differences referred to in the text are statistically significant. Additionally, we conducted a multivariate logistic regression to confirm that differences between privately insured adults ages 50 to 64 and Medicare adults ages 65 and older held after adjusting for self-reported health status, chronic conditions, sex, race and ethnicity, and metropolitan status. We found statistically significant differences between the two insurance groups in the share of adults with a usual source of care, adults with cost-related problems, and adults with worries about ability to pay medical bills.

While the collection of race and ethnicity data in survey data has improved over time, sample size limitations affect our ability to display results for certain racial and ethnic groups in our analysis, especially Asian adults, American Indian and Alaska Native adults, Native Hawaiian and Other Pacific Islander adults, and adults who identify as two more races. Throughout this brief, individuals of Hispanic origin may be of any race, but are classified as Hispanic for the analysis; all other groups are non-Hispanic.


Tables

How Employer Actions Could Facilitate Equity in COVID-19 Vaccinations

Authors: Samantha Artiga and Liz Hamel
Published: May 17, 2021

Despite experiencing higher rates of illness and death from COVID-19, Hispanic and Black people have been less likely than their White counterparts to receive COVID-19 vaccinations so far. With racial disparities in COVID-19 vaccinations persisting despite broadened eligibility for the vaccine across states, there are opportunities to close these gaps in vaccination by making it as easy as possible for people to get a vaccine and addressing their specific concerns. KFF COVID-19 Vaccine Monitor findings show that one particular concern among unvaccinated Hispanic and Black adults is having to miss work due to side effects. Providing employees with paid time off to get the vaccine and recover from side effects could help boost vaccination rates among these groups and narrow racial gaps in vaccination, as could other employer actions such as making the vaccines available at work and providing a financial incentive to get vaccinated.

Hispanic and Black adults are more likely than their White counterparts to report concerns about missing work to get or recover from the COVID-19 vaccine. KFF COVID-19 Vaccine Monitor data from April 2021 show that nearly two-thirds (64%) of unvaccinated Hispanic adults and over half of Black adults (55%) are concerned that they might miss work due to side effects from the COVID-19 vaccine, compared to roughly four in ten unvaccinated White adults (41%) (Figure 1). The shares concerned about missing work due to side effects rise to nearly three-quarters among unvaccinated Hispanic adults who are potentially undocumented immigrants (73%) and nonelderly uninsured adults (74%). Further, three in ten (30%) Hispanic adults and about a quarter (23%) of Black adults are concerned that they might need to take time off work to get the COVID vaccine, compared to 16% of White adults. These increased concerns reflect that Hispanic and Black adults are more likely than their White counterparts to be employed in low-wage positions that are less likely to have access to paid leave. As such, they have less flexibility to take time off work and, if they do miss work, they often face lost wages that may leave them in a difficult financial situation due to more limited incomes.

Figure 1: Unvaccinated Hispanic and Black Adults are More Likely than White Adults to Have Concerns About Missing Work to Get or Recover from the COVID-19 Vaccine

Providing paid time off to employees to get and recover from any side effects could help boost vaccination rates. Overall, nearly three in ten (28%) employed adults who are not yet ready to get the vaccine say that they would be more likely to get the COVID-19 vaccine if their employer gave them paid time off to get vaccinated and recover from any side effects. This strategy may be particularly effective for boosting vaccination rates among Hispanic adults, as over half (54%) of employed Hispanic adults who are not yet ready to get vaccinated say their employer providing paid time off would increase their willingness to get a shot, compared to 19% of their White counterparts (Figure 2). Certain other employer actions appear to be particularly effective for increasing willingness to get a vaccine among Hispanic adults. For example, four in ten (38%) employed Hispanic adults who are not yet ready to get vaccinated say they would be more likely to do so if their employer arranged for a medical provider to administer the vaccine at their workplace compared to 14% of their White counterparts. Similarly, 38% of Hispanic adults said that an employer financial incentive would increase their willingness to get vaccinated, higher than the share of White adults (22%). (Data were insufficient to examine these measures for employed Black adults who are unvaccinated and do not want to get the vaccine as soon as possible.)

Figure 2: Providing Paid Leave and Certain Other Employer Actions Increase Willingness to Get a COVID-19 Vaccine

The American Rescue Plan, which has been enacted into law, newly makes tax credits available to employers to cover the costs of providing paid leave to employees to receive and recover from COVID-19 vaccinations. Small and midsize employers and certain governmental employers are eligible to claim refundable tax credits that reimburse them for the cost of providing paid sick and family leave to their employees due to COVID-19, including leave taken by employees to receive or recover from COVID-19 vaccinations. Eligible employers include any business, including tax-exempt organizations, with fewer than 500 employees as well as certain governmental employers. Self-employed individuals are eligible for similar tax credits. The paid leave tax credits are tax credits against the employer’s share of the Medicare tax and are refundable, meaning that the employer is entitled to payment of the full amount of the credits if it exceeds the employer’s share of the Medicare tax. The tax credit for paid sick leave is equal to the sick leave wages paid for up to two weeks, limited to $511 per day and $5,110 in the aggregate, at 100% of the employee’s regular rate of pay. The tax credit for paid family leave is equal to wages paid for up to twelve weeks, limited to $200 per day and $12,000 in the aggregate, at 2/3rds of the employee’s regular rate of pay. Employer may claim these tax credits for wages paid for leave from April 1, 2021, through September 30, 2021.

Looking ahead, the American Families Plan, proposed by President Biden, would increase the availability of paid medical leave for workers, which could help reduce barriers to health care more broadly that disproportionately affect people of color. The concerns about missing work to get the vaccine illustrate how lack of paid leave can create a barrier to accessing health care, particularly for people of color. The American Families Plan would phase in 12 weeks of paid parental, family, and personal illness/safe leave for workers over ten years. Providing this leave could help reduce racial disparities in access to paid leave, which could facilitate individuals’ ability to access health care, including preventive care, as well as enable individuals take time off when they are sick or to care for a sick family member.

Poll Finding

KFF COVID-19 Vaccine Monitor: COVID-19 Vaccine Access, Information, and Experiences Among Hispanic Adults in the U.S.

Authors: Liz Hamel, Samantha Artiga, Alauna Safarpour, Mellisha Stokes, and Mollyann Brodie
Published: May 13, 2021

Findings

The KFF COVID-19 Vaccine Monitor is an ongoing research project tracking the public’s attitudes and experiences with COVID-19 vaccinations. Using a combination of surveys and qualitative research, this project tracks the dynamic nature of public opinion as vaccine development and distribution unfold, including vaccine confidence and acceptance, information needs, trusted messengers and messages, as well as the public’s experiences with vaccination.

Key Findings

  • The latest KFF COVID-19 Vaccine Monitor report highlights the disproportionate toll the pandemic has taken on Hispanic adults in the United States. Hispanic adults, particularly those who mainly speak Spanish, were born outside the U.S., or who have lower incomes, are more likely than White adults to say someone close to them has gotten sick from COVID-19 or that they worry about someone in their family getting sick and more likely to say the pandemic has negatively affected their financial situation. At a time when many are facing growing financial needs, one in ten (11%) Hispanic adults, rising to one-quarter (26%) of those who are potentially undocumented, say there was a time in the past 3 years when they or a family member decided not to apply for or stopped participating in a government assistance program that helps with food, housing, or health care because they were afraid it might negatively affect their or a family member’s immigration status.
  • Among those who have not yet been vaccinated, Hispanic adults are about twice as likely as White adults to say they want to get a COVID-19 vaccine as soon as possible, indicating an opportunity for more focused outreach and information efforts. While nearly half (47%) of Hispanic adults report having received at least one dose of a COVID-19 vaccine, one-third of unvaccinated Hispanic adults say they want a vaccine as soon as possible, about twice the share as among unvaccinated Black and White adults. By contrast, unvaccinated Hispanic adults are half as likely as unvaccinated White adults to say they will “definitely not” get the vaccine (17% vs. 34%).
  • Large shares of Hispanic adults – particularly those with lower incomes, the uninsured, and those who are potentially undocumented – express concerns that reflect access-related barriers to vaccination. Compared to White adults, larger shares of unvaccinated Hispanic adults say they are concerned about missing work due to vaccine side effects, that they might have to pay out of pocket for the vaccine (despite it being free), not being able to get the vaccine from a trusted place, or having difficulty traveling to a vaccination site. Among Hispanic adults, the shares expressing many of these concerns are even greater among those with lower incomes, the uninsured, and those who are potentially undocumented.
  • Requests for documentation may pose a barrier to vaccination for some Hispanic adults, particularly those who live in immigrant families. Over half of Hispanic adults (56%) who have been vaccinated say they were asked to provide a government-issued identification when they received their vaccine and 15% say they were asked to provide a Social Security number. While eligibility to receive a COVID-19 vaccine in the U.S. is not linked to immigration status, requests for these types of information or documents may be a deterrent for some Hispanic adults, particularly those in immigrant families. In fact, about four in ten unvaccinated Hispanic adults (rising to 58% of those who are potentially undocumented) say they are concerned that they may be required to provide a government-issued identification or Social Security number to get vaccinated, and about one third (rising to 63% of the potentially undocumented) are concerned that getting the vaccine may negatively affect their own or a family member’s immigration status.
  • There are gaps in information about who is eligible for the vaccine and how to get it among the Hispanic population. Large shares of unvaccinated Hispanic adults, particularly those who are potentially undocumented, are unsure if they are eligible to get a vaccine or say they don’t have enough information about when or where to get one. At least half are unaware that the vaccines are free for all U.S. residents and that all adults are eligible regardless of immigration status.
  • Making COVID-19 vaccines available in more convenient locations, providing paid time off to recover from side efforts, or requiring vaccination for travel may be more effective at encouraging vaccine uptake among Hispanic adults compared to others. Almost half of unvaccinated Hispanic adults who are not yet ready to get the vaccine right away say they’d be more likely to get vaccinated if the vaccine was offered at a place they normally go for care, and four in ten of those with jobs say they’d be more likely to get it if their employer arranged for it to be delivered at their workplace, both higher than the shares of White adults who say the same. Over half of employed, unvaccinated Hispanic adults who are not yet ready to get the vaccine say they’d be more inclined to get it if their employer gave them paid time off to get vaccinated and recover from side effects. Requiring the vaccine for airline or international travel may be particularly effective at encouraging foreign-born Hispanics the vaccine, with about six in ten saying such requirements would make them more likely to get vaccinated.

Introduction

The COVID-19 pandemic has taken a stark disproportionate toll on people of color, including the Hispanic population. Hispanic people have faced increased risk of exposure to the virus as many are employed in essential jobs that cannot be done from home and live in larger, multigenerational households. Reflecting these increased risks, Hispanic people have suffered higher rates of COVID-19 infection, hospitalization, and death compared to their White counterparts. Despite being harder hit by the pandemic, Hispanic people have been less likely than White people to receive a COVID-19 vaccine so far. These disparate impacts of the COVID-19 pandemic have exposed and exacerbated longstanding underlying disparities in health and health care facing Hispanic people. Prior to the pandemic, these disparities had already been compounded by immigration policies implemented during the Trump administration that increased fears among immigrant families and made some more reluctant to access programs and services, including health coverage and health care. Although the Biden administration has since reversed many of these policies, they may continue to have lingering effects among families.

This report from the KFF COVID-19 Vaccine Monitor is based on interviews with 778 Hispanic adults in the U.S., including 334 conducted in Spanish and 408 with adults born outside the U.S., including 185 who indicated that they do not have lawful permanent resident status (referred to in this report as “potentially undocumented”).1  It provides insights into how Hispanic adults have been affected by the COVID-19 pandemic and their access, information, and experiences with COVID-19 vaccinations. Moreover, it illustrates the varied experiences within the Hispanic population, including describing the experiences of Hispanic immigrants, for whom data remain limited. Throughout this report, Hispanic adults include people of any race, other groups (i.e., White and Black adults) are non-Hispanic.

COVID-19 Impacts on Hispanic Adults in the U.S.

The survey findings reveal that Hispanic adults have substantial fears about getting sick from coronavirus, and that many have close connections to people who have gotten sick or died from COVID-19. They also highlight the widespread negative financial impacts of the pandemic for Hispanic adults. In addition, they provide insight into how immigration-related fears may be affecting Hispanic adults’ willingness to participate in assistance programs for food, housing, and health care, at a time when many have growing needs due to the financial impacts of the pandemic.

About two-thirds of Hispanic adults say they are worried that they or someone in their family will get sick from coronavirus, including 41% who say they are very worried. The share saying they are very worried is higher among Hispanic adults than among Black adults (30%) and is four times the rate among White adults (10%). Worries about getting sick from coronavirus are even more prevalent among Hispanic immigrants, particularly those without permanent resident status. Seven in ten (69%) of potentially undocumented Hispanic adults say they are very worried about themselves or a family member getting sick from COVID-19 as are over half (57%) of foreign-born Hispanic adults with permanent resident status. Among U.S.-born Hispanic adults (who are much younger on average than their foreign-born counterparts), one quarter (24%) express this level of worry. There also are stark differences in levels of concern among Hispanic adults by language spoken and household income, with nearly three in four (73%) of Hispanic adults who completed the survey in Spanish and over half (53%) of those in lower income households reporting being very worried about getting sick.

Two-Thirds Of Hispanic Adults Are Worried About Themselves Or A Family Member Getting Sick From COVID-19, With Higher Levels Of Worry Among Those Born Outside The U.S.

This higher level of worry is not unfounded, as Hispanic adults are more likely than White adults to report close connections to someone who has gotten sick or died from coronavirus. Nearly three in ten (28%) of Hispanic adults say they or someone in their household has tested positive for coronavirus, higher than the shares of Black (21%) and White adults (18%). This share rises among Hispanic adults born outside the United States, including 40% of the potentially undocumented. About four in ten (38%) Hispanic adults say a close friend or family member has died from coronavirus, similar to the 34% among Black adults and higher than the 18% among White adults. There were no major differences in the likelihood of having a close friend or family member die by immigration status.

Hispanic Adults Are More Likely Than White Adults To Report Close Connections To People Who Have Tested Positive Or Died From COVID-19

The pandemic has also taken a disproportionate financial toll on Hispanic families in the United States. About half (48%) of Hispanic adults say the pandemic has had a negative effect on their personal financial situation, higher than the share of White adults who say the same (36%). Among those with lower household incomes (under $40,000 per year), 56% of Hispanic adults say their financial status has been negatively affected by the pandemic, higher than the shares among lower-income Black or White adults (42% each). There were no major differences in the likelihood of reporting negative financial effects by immigration status. However, a 55% majority of Hispanic adults who completed the survey in Spanish say their financial situation has been negatively impacted by the pandemic, higher than the four in ten (43%) of English-speaking Hispanic adults who report being negatively affected.

About Half Of Hispanic Adults Say The COVID-19 Pandemic Has Had A Negative Effect On Their Financial Situation

Some Hispanic adults, particularly those who are potentially undocumented, report that they have avoided seeking assistance for food, housing, and/or health care due to immigration-related fears. The Trump administration implemented a range of immigration policy changes, including changes to public charge policy, that increased fears among immigrant families and made some more reluctant to access programs and services, including health coverage and care. While the Biden administration has since reversed many of these policies, they may continue to have lingering effects among families at a time when many are facing growing needs due to the pandemic.

Overall, one in ten Hispanic adults (11%), say there was a time in the past 3 years when they or a family member decided not to apply for or stopped participating in a government assistance program because they were afraid it might negatively affect their or a family member’s immigration status. Across Hispanic adults overall, 6 percent say they did not apply for or stopped participating a program to help with food, 4 percent say assistance for housing, and 3 percent say a health care program.

The share saying they or a family member did not apply for or stopped participating in a program in the past 3 years due to immigration-related fears increased rises to 26% among potentially undocumented Hispanic adults. Among potentially undocumented Hispanic adults, 21% say they did not apply for or stopped participating a program to help their family with food, 12 percent say assistance for housing, and 11 percent say a health care program. While undocumented immigrants generally are not eligible for any federally-funded assistance, many live in mixed immigration status families, including other family members such as U.S.-born citizen children, who may qualify for assistance.

One Quarter Of Potentially Undocumented Hispanic Adults Say They Or A Family Member Did Not Participate In An Assistance Program Due To Immigration Fears

COVID-19 Vaccination Intentions Among Hispanic Adults

Nearly half (47%) of Hispanic adults say they have already received at least one dose of a COVID-19 vaccine and another 17% say they intend to get one as soon as they can. The share of Hispanic adults who say they’ve received at least one dose of the vaccine is lower than the share among White adults (60%), while a larger share of Hispanic adults compared to White adults say they will “wait and see” how the vaccine is working for other people before getting vaccinated themselves (18% vs. 13%). Nearly one in five (17%) Hispanic adults report that they have not yet been vaccinated but want to get one as soon as possible, higher than the shares among White adults (6%) and Black adults (9%).

Almost Half Of Hispanic Adults Report Receiving A COVID-19 Vaccine, One In Six Want To As Soon As Possible

Among those who have not yet been vaccinated, Hispanic adults are twice as likely as White adults to say they want to get a COVID-19 vaccine as soon as they can, making them a key target for outreach and information. Looking just at those adults who have not yet received a COVID-19 vaccine, one-third of Hispanic adults say they want to get one as soon as they can compared to 16% of White adults and 17% of Black adults. By contrast, larger shares of unvaccinated White and Black adults compared to Hispanic adults say they will definitely not get a COVID-19 vaccine (34%, 26%, and 17%, respectively).

Among Those Who Have Not Been Vaccinated For COVID-19, A Larger Share Of Hispanic Adults Says They Want The Vaccine As Soon As Possible, Fewer Say "Definitely Not"

Some groups of Hispanic adults are more likely to say they have not yet gotten the vaccine but want to get one as soon as possible, suggesting they are particularly likely to face access barriers to getting the vaccine. For example, three in ten (31%) of potentially undocumented Hispanic adults report having gotten a COVID-19 vaccine, and nearly four in ten (37%) want one as soon as possible but haven’t yet gotten one. This finding is similar for uninsured nonelderly Hispanic adults, with about three in ten (29%) of this group reporting receiving the vaccine and another 30% wanting one as soon as possible. Adults who completed the survey in Spanish are also more likely than English speaking adults to say they want a vaccine as soon as possible, but this largely reflects a higher share of English-speaking Hispanic adults saying that they do not plan to get the vaccine.

Large Shares Of Potentially Undocumented, Spanish-Speaking, And Uninsured Hispanic Adults Say They Want A COVID-19 Vaccine But Haven't Gotten One Yet

Among Hispanic adults, divides in COVID-19 vaccination intention by age, education, and partisanship mirror those seen in the general population. Large majorities of Hispanic adults ages 50 and over say they’ve already gotten at least one dose of the vaccine or will do so as soon as possible (85% of those ages 50-64 and 88% of those ages 65 and over). By contrast, larger shares of younger Hispanic adults say they want to wait and see how the vaccine is working (20% of those ages 30-49 and 31% of those ages 18-29). Similarly, Hispanic adults who identify as Democrats or lean that way are much more likely than those who identify or lean Republican to say they have either gotten a vaccine or will do so as soon as they can, while Republicans are more likely to say they will definitely not get vaccinated. Hispanic adults with a college degree are more likely than those with lower levels of education to say they’ve already gotten a COVID-19 vaccine (61% vs. 45%), while those who are not college graduates are more likely to say they have not been vaccinated but want to do so as soon as possible (18% vs. 10%), suggesting possible access barriers for this less-educated group, similar to the groups mentioned above.

Younger, Less Educated, And Republican Hispanic Adults Least Enthusiastic About Getting Vaccinated

Hispanic Adults’ Experiences Getting a COVID-19 Vaccine

Among those who report receiving a COVID-19 vaccine, Hispanic adults are more likely than White and Black adults to report getting their vaccine through a community health clinic. The most common place people report receiving a COVID-19 vaccine across race and ethnicity groups is a large vaccination site. At least one-third of those who have received at least one dose of a vaccine reporting receiving it there (35% of vaccinated Hispanic adults, 37% of Black adults, and 35% of White adults). Consistent with other analysis showing community health centers are vaccinating larger shares of people of color, particularly Hispanic people, over one in five (22%) vaccinated Hispanic adults reported getting their vaccine at a community health clinic, twice the share of White (11%) and Black (10%) vaccinated adults who report the same. Among Hispanic adults, 30% of those who completed the interview in Spanish say they got vaccinated at a community health clinic compared to 17% of those who completed the interview in English. There were no significant differences in the share of Hispanic adults getting vaccinated at a community health clinic by immigration status or income.

Hispanic Adults More Likely Than White And Black Adults to Report Getting Vaccinated At A Community Health Clinic

Hispanic adults are less likely than White adults to report signing up for a vaccine appointment online. Among those who have gotten a vaccine or have tried to get an appointment, about half of Hispanic adults (48%) either signed up or tried to do so online compared to nearly six in ten White adults (58%). A quarter (25%) of Hispanic adults say they signed up or tried to sign up by phone, and another 16% scheduled or sought to schedule an appointment in person.

Many Hispanic adults report being asked for certain types of information or documentation when they signed up for or received a vaccine that may pose barriers to getting the vaccine for some. The COVID-19 vaccines are available for free regardless of insurance status. Some vaccine providers request health insurance information from people receiving the vaccine in order to bill for the cost of administering the vaccine, which may lead some people to be confused about whether uninsured people can get the vaccine or if they have to pay to receive one. The federal government has also clarified that vaccines are available to individuals regardless of immigration status. Despite this, requests for information and/or documentation to provide proof of identity or residency may vary across states, localities, and vaccination providers. For example, in some cases, individuals are being requested to provide government-issued identification or a Social Security number, while others provide a range of options to prove identity or residency, including self-attestation, and specify that a Social Security number is not required.

Among all Hispanic adults who made or attempted to make an appointment to receive a vaccine, about a third (32%) report being asked to provide health insurance information when making an appointment. Four in ten (42%) say they were asked to provide a government-issued identification and 14% say they were asked to provide a Social Security number. Among those who have been vaccinated for COVID-19, over half (56%) say they were asked for their ID at the vaccination site, 23% were asked for insurance information and 15% report being asked to provide a Social Security number.

Many Hispanic Adults Report Being Asked For Documentation When Signing Up Or Receiving A COVID-19 Vaccine

Potential Barriers To COVID-19 Vaccination Among Hispanic Adults

Hispanic adults who have not yet been vaccinated for COVID-19 are more likely than White adults to express concerns that reflect access-related barriers to vaccination. Although potential side effects and vaccine safety are the top-ranked concerns among Hispanic adults who have not yet been vaccinated for COVID-19, many also report concerns related to potential challenges getting the vaccine. Among unvaccinated Hispanic adults, nearly two-thirds (64%) are concerned about missing work due to side effects, over half (52%) are worried they might have to pay out of pocket for the vaccine, and nearly half are concerned they won’t be able to get the vaccine from a place they trust (49%), shares that are significantly larger than their White counterparts.

Notably, among Hispanic adults who say they have not yet been vaccinated but want to do so right away, six in ten are concerned that they won’t be able to get the vaccine from a place they trust (61%) or that they might have to pay an out-of-pocket cost to get the vaccine (59%) and half (52%) are concerned about missing work due to vaccine side effects, highlighting that access remains a barrier even for those in the most eager group.

Because the Hispanic population includes higher shares of noncitizens compared to other groups, immigration-related concerns may also particularly affect this population. Four in ten unvaccinated Hispanic adults (39%) are concerned they might be required to provide a Social Security number or government-issued identification in order to get vaccinated, and just over a third (35%) are concerned that by getting the COVID-19 vaccine they might negatively affect their own or a family member’s immigration status.

 Many Hispanic Adults Report Barriers To Accessing The COVID-19 Vaccine, Side Effects and Safety Remain Top Concerns

Among unvaccinated Hispanic adults, those who are potentially undocumented, those without health insurance, and those with lower household incomes are more likely to express potential access-related barriers or immigration-related concerns to vaccination. The top access-related concern across these groups is that they might have to miss work due to side effects. Not surprisingly, potentially undocumented Hispanic adults are particularly concerned they may need to provide a Social Security number or government issued ID to get the vaccine (58%), and nearly two thirds (63%) are concerned getting the vaccine might negatively affect their or a family member’s immigration status.

In addition, unvaccinated Hispanic adults who are uninsured are more likely than those who have health insurance to say they are concerned about not being able to get the vaccine from a place they trust, being required to provide a Social Security number or government-issued ID, or negatively impacting their own or a family member’s immigration status.

Compared to their higher-income counterparts, unvaccinated Hispanic adults with incomes under $40,000 a year are more likely to say they are concerned about missing work due to COVID-19 vaccine side effects, having to pay an out-of-pocket cost to get vaccinated, negatively affecting someone’s immigration status, and having difficulty traveling to a vaccination site.

COVID-19 Vaccine Access Concerns Among Hispanic Adults Vary By Immigration Status, Insurance Status, And Income

Strategies that address access-related concerns may be particularly effective for increasing enthusiasm to get the COVID-19 vaccine among Hispanic adults. For example, nearly half of Hispanic adults who have not gotten the vaccine and are not ready to get it right away (46%, rising to 64% among those born outside the U.S.) say they’d be more likely to get a COVID-19 vaccine if it was offered to them at a place they normally go to health care, compared to 23% of White adults. Four in ten Hispanic adults in this group (39%, rising to 49% of foreign-born) would be more likely to get vaccinated if they only needed to get one dose compared to a quarter (25%) of White adults. Over half (54%) of employed Hispanic adults who are not yet ready to get the vaccine say they would be more likely to get it if their employer gave them paid time off to recover from side effects compared to 19% of employed White adults. In addition, four in ten (38%) employed Hispanic adults in this group say they would be more likely to get vaccinated if their employer arranged for a medical provider to administer the vaccine at their workplace, compared to 14% of their White counterparts.

Certain financial and travel-related incentives may also be particularly effective in increasing vaccine enthusiasm among Hispanic adults, especially those born outside the United States. Over four in ten (41%) of Hispanic adults (including 63% of those born outside the US) who are not yet ready to get the vaccine say they’d be more likely to get vaccinated if it was required for international travel compared to 17% of White adults. There are also differences in responses to employer incentives to get vaccinated. Nearly four in ten (38%) of employed Hispanic adults who are not yet ready to get the vaccine said they would be more likely to get it if their employer offered them a $200 incentive to get vaccinated, versus 22% of their White counterparts.

Strategies That Address Access-Barriers, Certain Incentives And Requirements May Increase COVID-19 Vaccine Enthusiasm Among Hispanic Adults

COVID-19 Vaccine Information Gaps and Needs

Increased outreach and education about how, where, and when to the vaccine may also facilitate increased vaccinations among the Hispanic population. Increasing awareness that the vaccine is free regardless of insurance status and available to all individuals regardless of immigration status may also encourage vaccination among those concerned about costs or potential negative immigration-related consequences.

Larger shares of Hispanic adults compared to White adults report lacking information about when and how to the get the vaccine, with particularly large information gaps among those who are foreign-born, who are Spanish-speakers, and who have lower incomes. Despite broadened eligibility for vaccines across states, 42% of unvaccinated Hispanic adults (compared to 26% of unvaccinated White adults) say they are unsure if they are eligible to receive the vaccine in their state, with this share rising to 57% among the potentially undocumented, 49% among Spanish speakers, and 47% with household incomes below $40,000. Similarly, 29% of Hispanic adults overall say they don’t have enough information about where to get a vaccine, including higher shares of potentially undocumented (43%) and Spanish-speaking (38%) Hispanic adults. Nearly half of all unvaccinated Hispanic adults (45%) say they lack information about when they can get a vaccine, and this share rises to more than half among those who are potentially undocumented (58%), those who completed the interview in Spanish (56%), and those with household incomes under $40,000 a year (54%).

COVID-19 Vaccine Information Gaps Are Higher Among Hispanic Adults, Particularly Those Who Speak Spanish, Are Potentially Undocumented, Or Have Lower Incomes

Most Hispanic adults who completed the survey interview in Spanish (68%) say it is either “very easy” or “somewhat easy” to find COVID-19 vaccine information in Spanish, but 27% say it is at least “somewhat difficult.” Similarly, most Spanish speakers say they were able to access information or communicate in their preferred language when making their vaccine appointment (68%) and when getting their vaccine (77%), but some say they were not able to communicate in their preferred language when making an appointment (26%) or getting the vaccine (22%).

About One-Quarter Of Spanish-Speaking Hispanic Adults Report Difficulty Finding Information About COVID-19 Vaccines Or Not Being Able To Communicate In Spanish When Signing Up Or Getting Vaccinated

There are gaps in knowledge that the vaccine is available for free among unvaccinated Hispanic adults. Roughly half (46%) of unvaccinated Hispanic adults know that the vaccine is available for free even for those without health insurance while 9% believe this is not the case and four in ten (43%) are not sure. More than half (54%) of unvaccinated Hispanic women know that vaccines are available for free while four in ten (39%) of Hispanic men are also aware of this. Knowledge that the vaccine is available for free is higher among unvaccinated Hispanics who completed the survey in Spanish (60%) versus those who completed it in English (37%). Among Hispanic adults ages 18-64 who have not yet gotten vaccinated, similar shares of those with and without health insurance are aware that the vaccine is available regardless of health insurance status (47% and 44%, respectively).

Over Half Of Hispanic Adults Are Not Aware COVID-19 Vaccine Is Available For Free, Including Higher Shares Of Men And English Speakers

There also are gaps in knowledge about the vaccine being available to all people regardless of immigration status among unvaccinated Hispanic adults. The federal government has clarified that all people are eligible to receive the COVID-19 vaccine regardless of immigration status. Four in ten unvaccinated Hispanic adults (42%) are aware that all adults living in the U.S. are eligible to receive a vaccine regardless of their immigration status, larger than the share of unvaccinated Black adults (15%) and White adults (27%) who know this is true. Yet, 9% of Hispanic adults believe it is not the case that all adults are eligible to get the vaccine regardless of immigration status and nearly half (48%) are not sure. Among unvaccinated Hispanic adults, a larger share of those who completed the survey in Spanish know that the vaccine is available regardless of immigration status compared to those who completed the survey in English (55% vs. 33%). Hispanic adults who are potentially undocumented are somewhat more likely than those born in the U.S. to incorrectly say it is not true that U.S. residents are eligible to get the vaccine regardless of immigration status (14% vs. 5%), while those born in the U.S. are more likely to say they’re not sure (56% vs. 35%).

Half Of Unvaccinated Hispanic Adults Unsure Whether Immigrants Are Eligible To Get COVID-19 Vaccine

Implications

Together these findings suggest that addressing access barriers and providing information through outreach and education efforts will be key for closing ongoing racial disparities in COVID-19 vaccinations for Hispanic adults. They indicate that increasing access to paid time off to get and recover from any side effects from the vaccine and making vaccines easily accessible through trusted sites of care and workplaces may facilitate uptake of vaccinations among Hispanic adults. Moreover, they highlight continued needs for outreach and education efforts within the Hispanic community to communicate how and where to get the vaccine and to clarify that the vaccines are free regardless of insurance status, that they are available to all people regardless of immigration status, and that receiving a vaccine will not negatively affect an individual’s current or future immigration status. The findings also reinforce why prioritizing equity in COVID-19 vaccinations is key, given the disproportionate health and economic impacts of the pandemic for Hispanic families and other people of color.

Methods

This KFF COVID-19 Vaccine Monitor was designed and analyzed by public opinion researchers at the Kaiser Family Foundation (KFF). The survey was conducted April 15-29, 2021, among a nationally representative random digit dial telephone sample of 2,097 adults ages 18 and older (including interviews from 778 Hispanic adults and 507 non-Hispanic Black adults), living in the United States, including Alaska and Hawaii (note: persons without a telephone could not be included in the random selection process). Phone numbers used for this study were randomly generated from cell phone and landline sampling frames, with an overlapping frame design, and disproportionate stratification aimed at reaching Hispanic and non-Hispanic Black respondents. Stratification was based on incidence of the race/ethnicity subgroups within each frame. Specifically, the cell phone frame was stratified as: (1) High Hispanic: Cell phone numbers associated with rate centers from counties where at least 35% of the population is Hispanic; (2) High Black: Cell phone numbers associated with remaining rate centers from counties where at least 35% of the population is non-Hispanic Black; (3) Else: numbers from all remaining rate centers. The landline frame was stratified as: (1) High Black: landline exchanges associated with Census block groups where at least 35% of the population is Black; (2) Else: all -remaining landline exchanges. The sample also included 163 respondents reached by calling back respondents that had previously completed an interview on the KFF Tracking poll at least nine months ago. Another 358 interviews were completed with respondents who had previously completed an interview on the SSRS Omnibus poll (and other RDD polls) and identified as Hispanic (n = 221; including 67 in Spanish and 40 who screened as potentially undocumented) or non-Hispanic Black (n=137). An oversample of potentially undocumented Hispanic (n=32) respondents was reached by dialing prepaid cell phone number in the High Hispanic stratum and screening for potential residency status. Computer-assisted telephone interviews conducted by landline (298) and cell phone (1,799, including 1,411 who had no landline telephone) were carried out in English and Spanish by SSRS of Glen Mills, PA. To efficiently obtain a sample of lower-income and non-White respondents, the sample also included an oversample of prepaid (pay-as-you-go) telephone numbers (25% of the cell phone sample consisted of prepaid numbers) Both the random digit dial landline and cell phone samples were provided by Marketing Systems Group (MSG). For the landline sample, respondents were selected by asking for the youngest adult male or female currently at home based on a random rotation. If no one of that gender was available, interviewers asked to speak with the youngest adult of the opposite gender. For the cell phone sample, interviews were conducted with the adult who answered the phone. KFF paid for all costs associated with the survey.

The combined landline and cell phone sample was weighted to balance the sample demographics to match estimates for the national population using data from the Census Bureau’s 2019 U.S. American Community Survey (ACS), on sex, age, education, race, Hispanic origin, and region, within race-groups, along with data from the 2010 Census on population density. The sample was also weighted to match current patterns of telephone use using data from the January- June 2020 National Health Interview Survey The weight takes into account the fact that respondents with both a landline and cell phone have a higher probability of selection in the combined sample and also adjusts for the household size for the landline sample, and design modifications, namely, the oversampling of potentially undocumented respondents and of prepaid cell phone numbers, as well as the likelihood of non-response for the re-contacted sample. All statistical tests of significance account for the effect of weighting.

The margin of sampling error including the design effect for the full sample is plus or minus 3 percentage points. Numbers of respondents and margins of sampling error for key subgroups are shown in the table below. For results based on other subgroups, the margin of sampling error may be higher. Sample sizes and margins of sampling error for other subgroups are available by request. Note that sampling error is only one of many potential sources of error in this or any other public opinion poll. Kaiser Family Foundation public opinion and survey research is a charter member of the Transparency Initiative of the American Association for Public Opinion Research.

This work was supported in part by grants from the Chan Zuckerberg Initiative DAF (an advised fund of Silicon Valley Community Foundation), the Ford Foundation, and the Molina Family Foundation. We value our funders. KFF maintains full editorial control over all of its policy analysis, polling, and journalism activities.

GroupN (unweighted)M.O.S.E.
Total2,097± 3 percentage points
Race/Ethnicity
Hispanic778± 4 percentage points
Black, non-Hispanic507± 6 percentage points
White, non-Hispanic717± 4 percentage points
Hispanic Interview Language
Spanish334± 7 percentage points
English444± 6 percentage points
Hispanic Income
Less than $40k426± 6 percentage points
$40k+984± 5 percentage points
Hispanic Immigration Status
U.S born363± 6 percentage points
Permanent resident207± 9 percentage points
Potentially undocumented185± 9 percentage points
Hispanic Insurance Status
Insured (ages 18-64)399± 6 percentage points
Uninsured (ages 18-64)203± 9 percentage points

Endnotes

  1. The survey used questions to determine the likely immigration status of respondents by asking those who were born outside the U.S. whether they were a permanent resident (i.e. had a green card) when they came to the U.S. or if their status had been changed to permanent resident since arriving. In the current survey, 18 percent of Hispanic adults said they have not been granted permanent resident status, indicating that they are likely to be undocumented immigrants, although this group may also include a small number of temporary lawful residents. ↩︎
News Release

Vaccine Monitor: Unvaccinated Hispanic Adults are Twice as Likely as White Adults to Want a COVID-19 Vaccine ASAP, Highlighting a Key Outreach Opportunity for Vaccination Efforts

Published: May 13, 2021

Fears About Costs and Documentation Requirements Pose Potential Barriers for Some Hispanic Adults

Nearly Two-Thirds of Unvaccinated Hispanic Adults Worry about Missing Work due to Vaccine Side Effects

A third (33%) of unvaccinated Hispanic adults say they want to get a COVID-19 vaccine as soon as possible – twice the share as among unvaccinated White (16%) or Black (17%) adults, presenting an opportunity for targeted outreach to boost overall vaccination rates, according to a new KFF COVID-19 Vaccine Monitor report focused on the vaccine views and experiences of Hispanic adults.

The higher share of Hispanic adults who want to get vaccinated quickly but have not yet reflects some significant access barriers and information gaps identified by the Monitor, including concerns about potential costs, lost wages, and immigration-related issues.

“With so many unvaccinated Hispanic adults eager to get a shot, there’s an opportunity to further close the gap in vaccination rates by addressing worries about costs and practical concerns such as time off work,” said Liz Hamel, a KFF vice president and director of KFF’s public opinion and survey research.


Overall, nearly half (47%) of all Hispanic adults say they’ve already gotten at least one dose of a COVID-19 vaccine, lagging behind the rate for White adults (60%) but similar to the rate for Black adults (51%).

Among all unvaccinated Hispanic adults, nearly two thirds (64%) are concerned about missing work due to side effects, and half (52%) worry they may have to pay out-of-pocket for the vaccine – even though all adults nationally cannot be charged to get the vaccine.

Though the federal government has made clear that vaccines should be available to people regardless of their immigration status, 4 in 10 unvaccinated Hispanic adults (39%) say they are concerned that they might be required to provide a Social Security number or government-issued identification to get vaccinated, and about a third (35%) are concerned that getting a vaccine might negatively affect their own or a family member’s immigration status.

Those fears reflect how vaccines are being administrated in some locations. Even though the vaccine is available to all adults in the U.S, regardless of their immigration or insurance status, more than half (56%) of Hispanic adults who have been vaccinated say they were required to show a government-issued identification when they received the vaccine, and 15% say they were asked to provide a Social Security number. Nearly a quarter (23%) say they were asked for health insurance information.

Unvaccinated Hispanic adults who are uninsured or potentially undocumented in general are more concerned than other Hispanic adults about both immigration- and cost-related issues.

Information gaps also may be contributing to these concerns. Less than half of Hispanic adults know that the vaccines are free for all U.S. residents (46%) and that all adults are eligible regardless of immigration status (42%).

With all adults now eligible to get vaccinated nationwide, a much larger share of unvaccinated Hispanic adults (42%) than unvaccinated White adults (26%) are unsure if they are eligible to receive the vaccine in their state. Among Hispanic adults who are potentially undocumented, more than half (57%) are unsure about their eligibility.

Opportunities for Expanding Vaccination Rates Among Less Eager Hispanic Adults

The Monitor also examines several potential strategies that could affect the willingness of Hispanic adults to get vaccinated among those who have not already done so and aren’t hoping to do so as soon as possible.

Nearly half (46%) of this less-eager group say they would be more likely to get vaccinated if it were offered to them where they normally go for health care. That is twice the share as among White adults (23%).

Among those in this group who are employed, more than half (54%) say they would be more likely to get it if their employer gave them paid time off to recover from side effects, nearly three times the share among White workers (19%). In addition, 38% of less-eager Hispanic workers say they would be more likely to get vaccinated if their employer arranged for a medical provider to administer the vaccine at their workplace, compared to 14% of similar White workers.

Employer financial incentives to get vaccinated also could encourage vaccination among less-eager Hispanic workers. Nearly 4 in 10 (38%) of this group say they would be more likely to get a vaccine if their employer offered them a $200 incentive to do so.

International travel requirements also could motivate significant shares of less-eager Hispanic adults to get vaccinated: 41% say they would be more likely to get vaccinated if it were required to travel abroad, including nearly two-thirds (63%) of those born outside the United States.

Other key results include:

  • Among those who have been vaccinated, Hispanic adults are twice as likely (22%) as White (11%) or Black (10%) adults to say they got their vaccine at a community health center. The share is even higher (30%) among those who primarily speak Spanish.
  • About half of Hispanic adults who have been vaccinated or tried to make an appointment did so online (48%), fewer than among White adults (58%). A quarter (25%) of Hispanic adults say they signed up or tried to sign up by phone, and another 16% say they did so in person.
  • Most Hispanic adults who predominantly speak Spanish (68%) say it is easy to find COVID-19 vaccine information in Spanish, but 27% say it is difficult.

Hispanic Adults Are More Likely than White Adults to Say the Pandemic Negatively Affected Their Family’s Health and Finances

The report also examines some of the disproportionate impacts that the pandemic has had on Hispanic families:

  • Hispanic adults are more likely than White adults to say someone in their family has tested positive for COVID-19 (28% vs.18%) or that a family member or close friend has died from it (38% vs.18%).
  • Similarly, two-thirds (67%) of Hispanic adults say they are worried that they or someone in their family will get sick from coronavirus, including 41% who say they are very worried. The share who says they are very worried is four times higher among Hispanic adults than among White adults (10%).
  • Hispanic adults are also more likely than White adults to say that the pandemic has negatively affected their personal financial situation (48% v. 36%). The shares are higher among Hispanic adults who predominantly speak Spanish (55%) and with household incomes less than $40,000 annually (56%).

“While the vaccines are available to all adults regardless of their insurance or immigration status, many Hispanic adults who have been vaccinated say they were asked for their health insurance information or a government-issued ID,” said Samantha Artiga, a KFF vice president and director of the racial equity and health policy program. “That can pose barriers for many, particularly those who are uninsured or are potentially undocumented immigrants.”


Designed and analyzed by public opinion researchers at KFF, the KFF Vaccine Monitor survey was conducted from April 15-29 among a nationally representative random digit dial telephone sample of 2,097 adults, including oversamples of adults who are Black (507) or Hispanic (778). Interviews were conducted in English and Spanish by landline (298) and cell phone (1,799). The margin of sampling error is plus or minus 4 percentage points for results based on Hispanic adults. For results based on subgroups, the margin of sampling error may be higher.


The KFF COVID-19 Vaccine Monitor is an ongoing research project tracking the public’s attitudes and experiences with COVID-19 vaccinations. Using a combination of surveys and qualitative research, this project tracks the dynamic nature of public opinion as vaccine development and distribution unfold, including vaccine confidence and acceptance, information needs, trusted messengers and messages, as well as the public’s experiences with vaccination.

Vaccination Rates Are Relatively High for Older Adults, But Lag in Counties in the South, in Counties with Higher Poverty Rates and in Counties that Voted for Trump

Published: May 13, 2021

Older adults in the US have been disproportionately affected by the coronavirus pandemic, comprising the majority of COVID-19 hospitalizations and deaths. Since the authorization of COVID-19 vaccines beginning in December 2020, there has been significant progress vaccinating older adults, who were among the first groups prioritized for vaccines after health care workers and residents and staff in long-term care facilities. As of May 12, the Centers for Disease Control and Prevention (CDC) reported 84.0% of adults 65 and older have gotten at least their first dose and 71.9% have been fully vaccinated.

While there is evidence that vaccinations are already having a major impact on death rates and hospitalization rates for older adults, particularly for the long-term care population, vaccination equity issues still remain a problem and there are challenges reaching certain populations for vaccinations. Rates of fully vaccinated older adults vary across states, from 57.6% in Utah to 87.0% in Vermont (as of May 12, based on national CDC data), but these state-level metrics may mask even greater variation at the county level. County level analysis provides a more granular look at characteristics associated with variations in vaccination rates among older adults across the country.

This analysis examines variations in vaccination rates for older adults by county characteristics, based on data from the CDC as of May 11, 2021 that includes 77% of all counties (2,415) in the US. (See Data and Methods for additional details).

Key Takeaways

The average county COVID-19 vaccination rate weighted by population is 68.9% for adults ages 65 and older, but varies widely and is lower than average in counties:

  • With a higher share of seniors living in poverty (58.8%)
  • Ranking higher on the Social Vulnerability Index (60.1%)
  • Located in the South (60.7%)
  • With a higher share of adults who voted for Trump (63.3%) (Figure 1)

Findings

The average vaccination rate for adults 65 and older is 68.9% among counties reporting data, weighted by the population ages 65 and older (Figure 2).

Vaccination rates vary considerably across the 2,415 counties reporting data. At the high end (the top 10% of counties reporting data), at least 79.4% of adults 65 and older are fully vaccinated, and at the low end (the bottom 10% of counties), no more than 48.6% of older adults are fully vaccinated. However, rates are likely higher across all counties, including those in the top and bottom deciles, since vaccination rates continue to change rapidly.

Counties in the South have lower vaccination rates among older adults than counties in other regions, similar to findings from other KFF analysis that show vaccination rates overall are lower in Southern states (Figure 1; Table 1) The average vaccination rate for older adults in counties located in the South is 60.7%, lower than the average vaccination rate among older adults in counties in the Northeast (70.1%), Midwest (66.6%), and West (64.4%). Counties in the South represent a disproportionate share of counties with below-average vaccination rates: Southern counties comprise 34.0% of counties reporting data, but 42.9% of all counties with a vaccination rate below the weighted average of 68.9%. In contrast, Northeastern counties represent 8.4% of the overall counties reporting data, while only 5.4% of counties in this region have vaccination rates below the weighted average for older adults.

Vaccination rates among adults ages 65 and older are lower in counties where a relatively high share of adults 65 and older live in poverty compared to counties where a lower share of older adults live in poverty. Vaccination rates among adults 65 and older are more than 10 percentage points lower in counties where a higher share of people 65 and older live in poverty (58.8%) than in counties where a lower share of older adults live in poverty (69.0%).

Counties that rank high on the Social Vulnerability Index (SVI) show similar trends to counties with high shares of older adults living in poverty. This finding is not surprising given poverty is one of the 15 demographic measures used to calculate SVI, with other measures including race/ethnicity, disability, and lack of vehicle access. (SVI metrics are for the overall population of a county and are not just limited to adults 65 and older). Counties that rank high on the index (i.e., those with higher vulnerability) have a lower average vaccination rate for adults 65 and older than counties that rank lower on this index (60.1% vs 67.7%).

Consistent with the “wait and see” approach to vaccinations more common among Republican than Democratic voters, without regard to age, vaccination rates for older adults are lower in counties where a majority of voters voted for Donald Trump than in counties where a majority voted for Joe Biden in the 2020 election. In counties where Trump won the majority of votes, the average vaccination rate for adults 65 and older is more than 7 percentage points lower than in counties that voted for Biden (63.3% vs. 70.8%).

Discussion

While significant progress has been made in the last four months vaccinating older adults in the US against COVID-19, drilling down to the county level shows wide variation in the vaccination rate. These findings suggest there is more work to be done to increase vaccination rates for certain segments of the population, including older adults in Southern counties, in higher poverty areas, and in counties that voted for Trump. The fact that Southern counties lag in vaccinating older adults is consistent with higher poverty rates for older adults in the South than in other regions in the country. These results may also indicate that some older adults may face barriers that make it more difficult to access vaccinations, such as lack of transportation, lack of internet access, and health conditions that make traveling to vaccination sites difficult, among others. With 71.9% of older adults across all states in the US now fully vaccinated, this analysis nonetheless suggests that the push to vaccinate older adults is not yet over. Boosting vaccination rates among older adults – particularly among those living in high poverty areas and the South – may require additional and more targeted efforts to further remove barriers.

Data and Methods

This analysis draws on data from multiple sources. Our main outcome of interest, vaccination rates by county, was collected from the Centers for Disease Control and Prevention’s (CDC) COVID-19 Integrated County View. The CDC data reports completed vaccination rates for total population and population over age 65. Data are not reported for Hawaii, New Mexico, Texas, and the smallest counties in Alaska and California. In addition, we exclude data for counties where less than 80% of vaccination records include county of residence, which eliminated data for Colorado, Georgia, Vermont, Virginia, and West Virginia. The analysis includes data for 2,415 counties, 77% of total counties (3,142) in the US.

The average population-weighted county vaccination rate for the total population is slightly lower than national estimates due to missing data from several states and counties as noted above.

We categorized states by region using the 2010 U.S. Census Bureau Region and Divisions classifications.

Data to categorize counties by demographic characteristics of residents is pulled from the Census Bureau’s 2019 American Community Survey 5-Year Estimates by county. We use ACS data to categorize counties by residents’ poverty. Specifically, we calculate the share of the county population that is age 65 and over in a family with income below poverty.

County Social Vulnerability Index (SVI) is from the CDC’s Agency for Toxic Substances and Disease Registry. SVI indicates a community’s vulnerability based on certain social conditions (i.e. socioeconomic status, household composition, language, etc.) that may affect the community in the event of a disaster.

The 2020 Presidential Election results were pulled from a GitHub repository that compiled data from media sources including The Guardian, townhall.com, Fox News, Politico, and the New York Times. Alaska is excluded from this component of the analysis as the only data available is at the district-level and cannot be cross-walked onto counties.

To classify counties, we translate continuous measures into categorical outcomes, using the group definitions below:

  • For continuous measures of poverty rate, SVI, and high-risk medical conditions, we classified counties below the 25th percentile of overall distribution of counties for each measure as “low,” counties above the 75th percentile as “high,” and all other counties as “medium.” For specific breaks for each variable, see Table 1.

Given ongoing concerns related to equitable access to the COVID-19 vaccine, assessing differences in vaccination rates by race/ethnicity at the county level would add to existing national and state level data. However, the results of our analysis do not have face validity when compared to data analyzed at the individual level showing that people with Hispanic ethnicity are vaccinated at lower rates than White people, leading us to conclude that there are confounding factors driving the results based on county-level racial and ethnic composition. Therefore, we do not include comparisons of vaccination rates based on county racial and ethnic composition.