Climate-Related Health Risks Among Workers: Who is at Increased Risk?
Introduction
Over the past few years, a plethora of research has linked climate change to adverse health outcomes around the world. People may be exposed to climate-related health risks through a variety of pathways, including through their work. The Centers for Disease Control and Prevention (CDC) and Environmental Protection Agency (EPA) note that disproportionate exposure to adverse climate change-related conditions can exacerbate existing health and safety issues among certain workers and could potentially cause new and unanticipated harms. Risk of climate-related health impacts varies across occupations, with many of the same underlying drivers of disparities in climate vulnerability overall reflected in the occupational sector.
This analysis identifies occupations that are at increased risk of climate-related health impacts, examines the characteristics of workers in these jobs, and discusses the implications of these findings. It is based on KFF analysis of the 2022 Current Population Survey Annual Social and Economic Supplement (CPS ASEC) for nonelderly adult workers ages 19-64. Differences in demographic and socioeconomic characteristics described in the text are statistically significant at p<0.05. In sum, this analysis finds:
- We estimate there are over 65 million nonelderly adult workers in occupations at increased risk for climate-related health risks, accounting for over four in ten of nonelderly workers. These include jobs with increased exposure to heat, decreased air quality, extreme weather, vector-borne and infectious diseases, and environmental contaminants. Some examples of at-risk jobs include agricultural and construction workers and emergency responders.
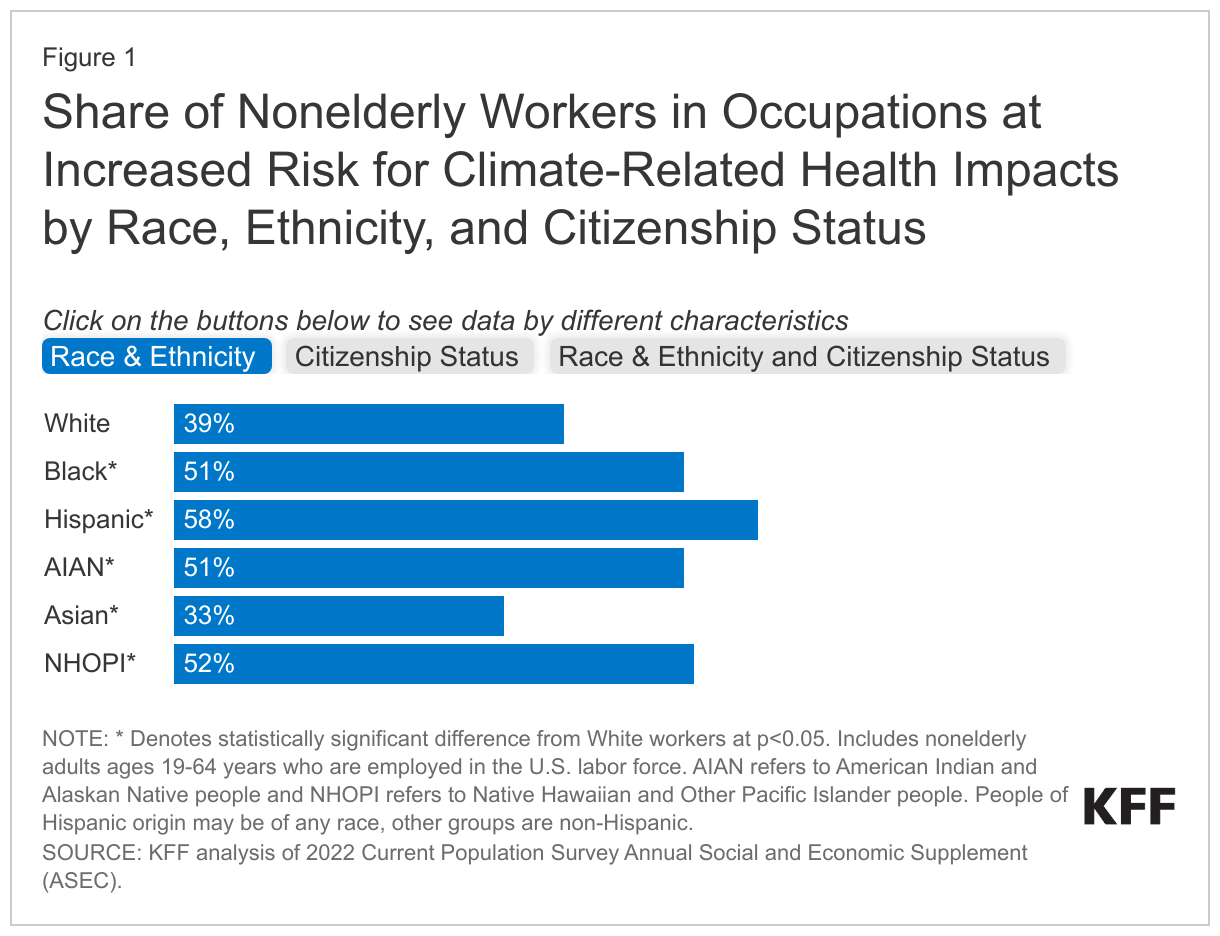
- Among nonelderly adult workers, many people of color, noncitizen immigrants, and workers with lower educational attainment and income levels are disproportionately likely to be employed in jobs with increased climate-related risks. Nonelderly Hispanic (58%), Black (51%), and Native Hawaiian or Pacific Islander (NHOPI) (52%) workers are more likely than White workers (39%) to work in at-risk occupations. Similarly, around six in ten nonelderly noncitizen immigrant workers who work in at-risk occupations compared to about four in ten U.S.-born citizens. Nonelderly workers with lower educational attainment and incomes are more likely to work in at-risk occupations compared to their counterparts with higher educational attainment and incomes.
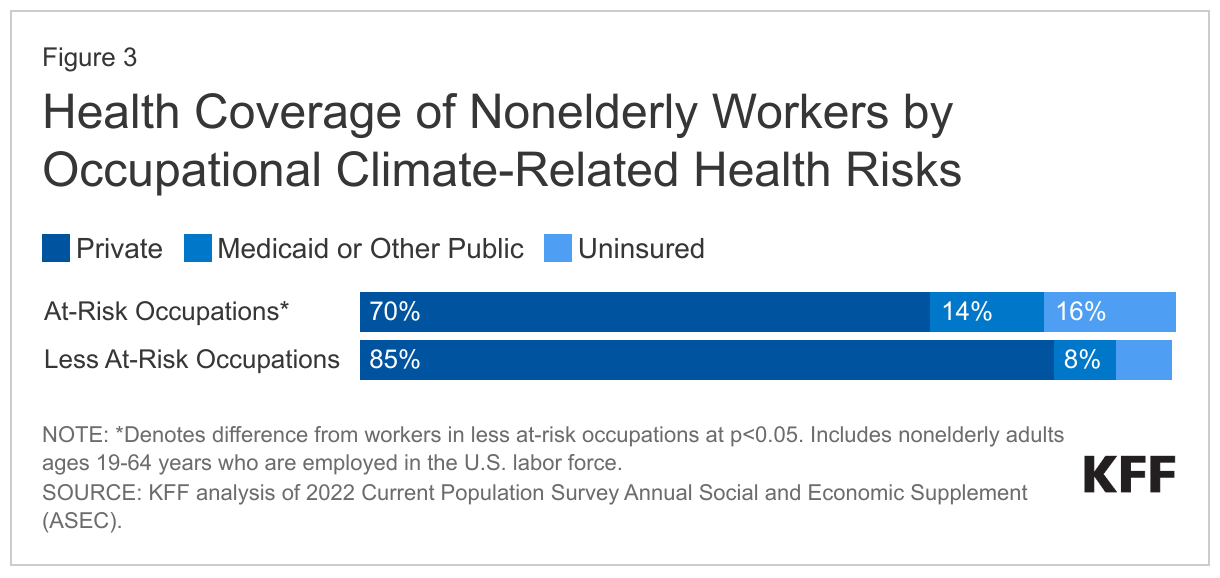
- Nonelderly workers in at-risk occupations are about twice as likely as their counterparts in less at-risk occupations to lack health insurance (16% vs. 7%), These higher uninsured rates reflect lower rates of private coverage among these workers (70% vs. 85%), which is likely the result of more limited availability of employer-sponsored insurance in these types of jobs. Medicaid helps fill some of this gap in private coverage for workers in at-risk occupations, covering 14% of workers in at-risk jobs vs. 8% of those in less at-risk jobs, but does not fully offset the gap in private coverage.
These findings show that job-related climate-related health risks compound challenges and disparities faced by many historically marginalized and underserved groups. Adults of color, noncitizens, and adults with lower educational attainment and incomes are disproportionately employed in occupations with increased climate-related health risks. Moreover, workers in occupations with increased climate-related health risks are more likely to be uninsured, contributing to challenges accessing health care. Many of these same groups face other job-based challenges, including higher risk of injury and differential treatment, particularly migrant or immigrant workers, who often lack labor protections. These groups also are at increased risk for other climate related health risks and broader disparities in health and health care due to underlying structural inequities. Without mitigation strategies, health risks are expected to increase due to climate change. These data highlight the importance of addressing underlying social and economic inequities that drive disparate occupational exposures to climate-related health risks and to protect workers from these increasing risks.
Which Occupations Have Increased Climate-Related Health Risks?
Climate can negatively impact worker health through multiple pathways including extreme heat, decreased air quality, extreme weather, vector-borne and infectious diseases, and environmental contaminants. The Centers for Disease Control and Prevention (CDC) notes that the disproportionate exposure to adverse climate change-related conditions can exacerbate existing health and safety issues among certain workers and could potentially cause new and unanticipated harms. These exposures could lead to heat stress and other heat-related illnesses, occupational injuries and deaths, infections and disease, and health conditions caused by exposure to biological hazards as well as negatively impact mental health. They also may limit worker productivity and contribute to added costs associated with worker illness or injury.
Some occupations pose more climate-related health risks for workers than others. For example, outdoor workers and indoor workers who engage in heavy physical labor and are exposed to high temperatures are disproportionately likely to suffer from heat-related illnesses and deaths. Some research studies have found that agriculture, forestry, fishing, hunting, and construction workers experience the highest rates of heat-related mortality. In responding to the growing number of wildfires associated with climate change, firefighters, health care workers, and other emergency responders are disproportionately exposed to air pollutants, which are connected to allergies, respiratory illnesses, heart diseases, and other chronic and acute illnesses. Extreme weather events pose health and safety risks to rescue and recovery workers and may increase exposure to environmental contaminants and water-borne and food-borne diseases. People who work outdoors, in water and sanitation-related occupations, agriculture, with animals, or in the natural environment are particularly susceptible to the infection, transmission of, and spread of vector-borne diseases, such as Lyme disease. Agricultural workers are particularly susceptible to exposure and absorption of toxic chemicals, including pesticides, which have been associated with adverse health outcomes, including death.
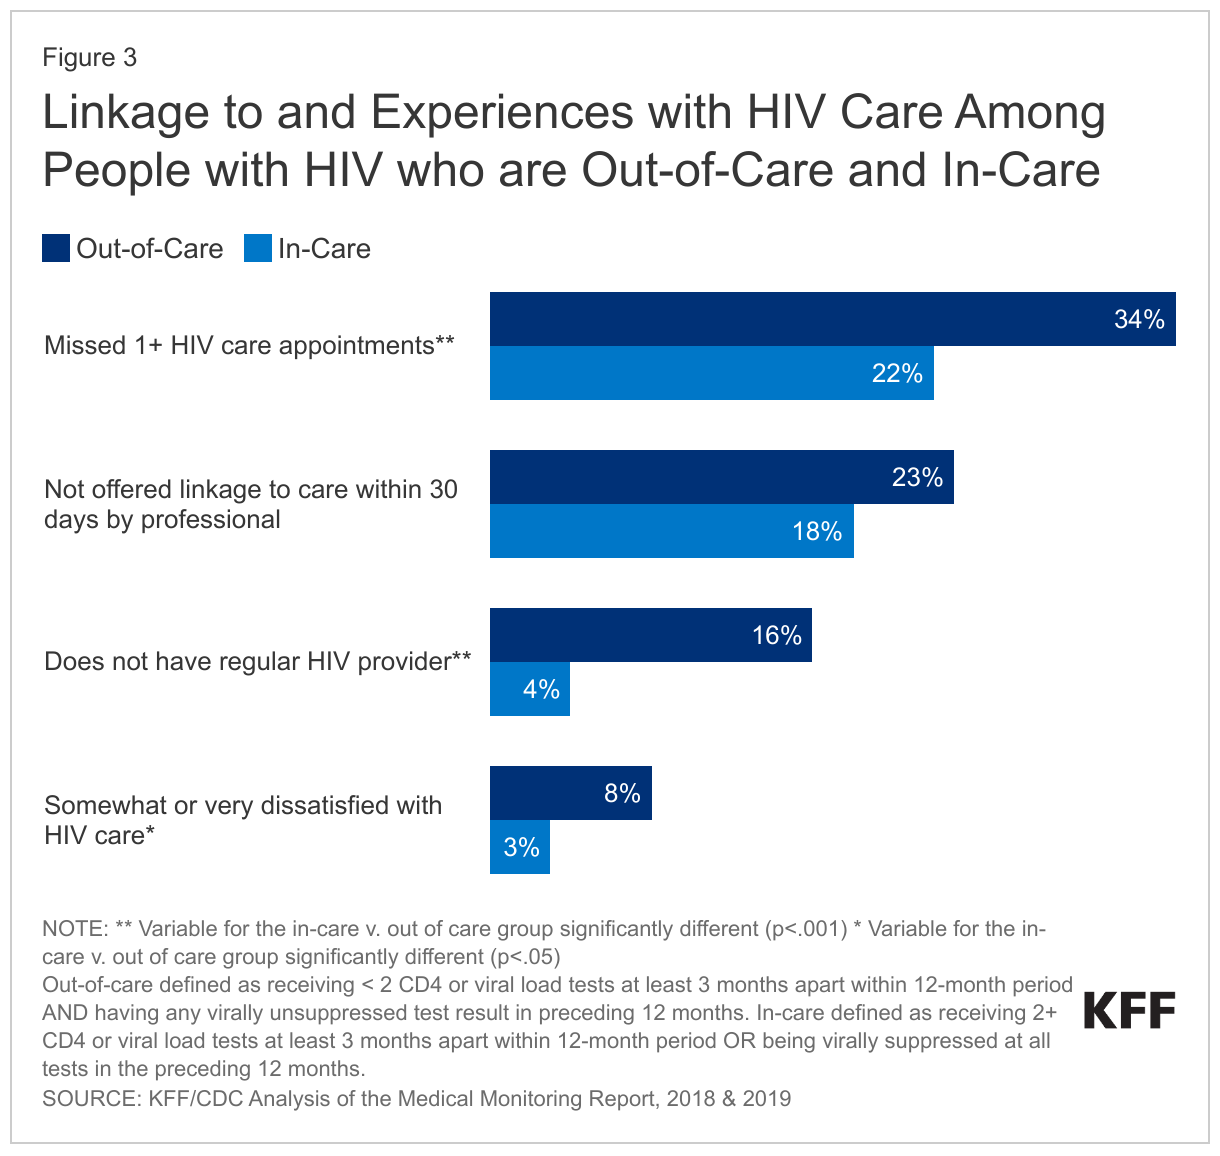
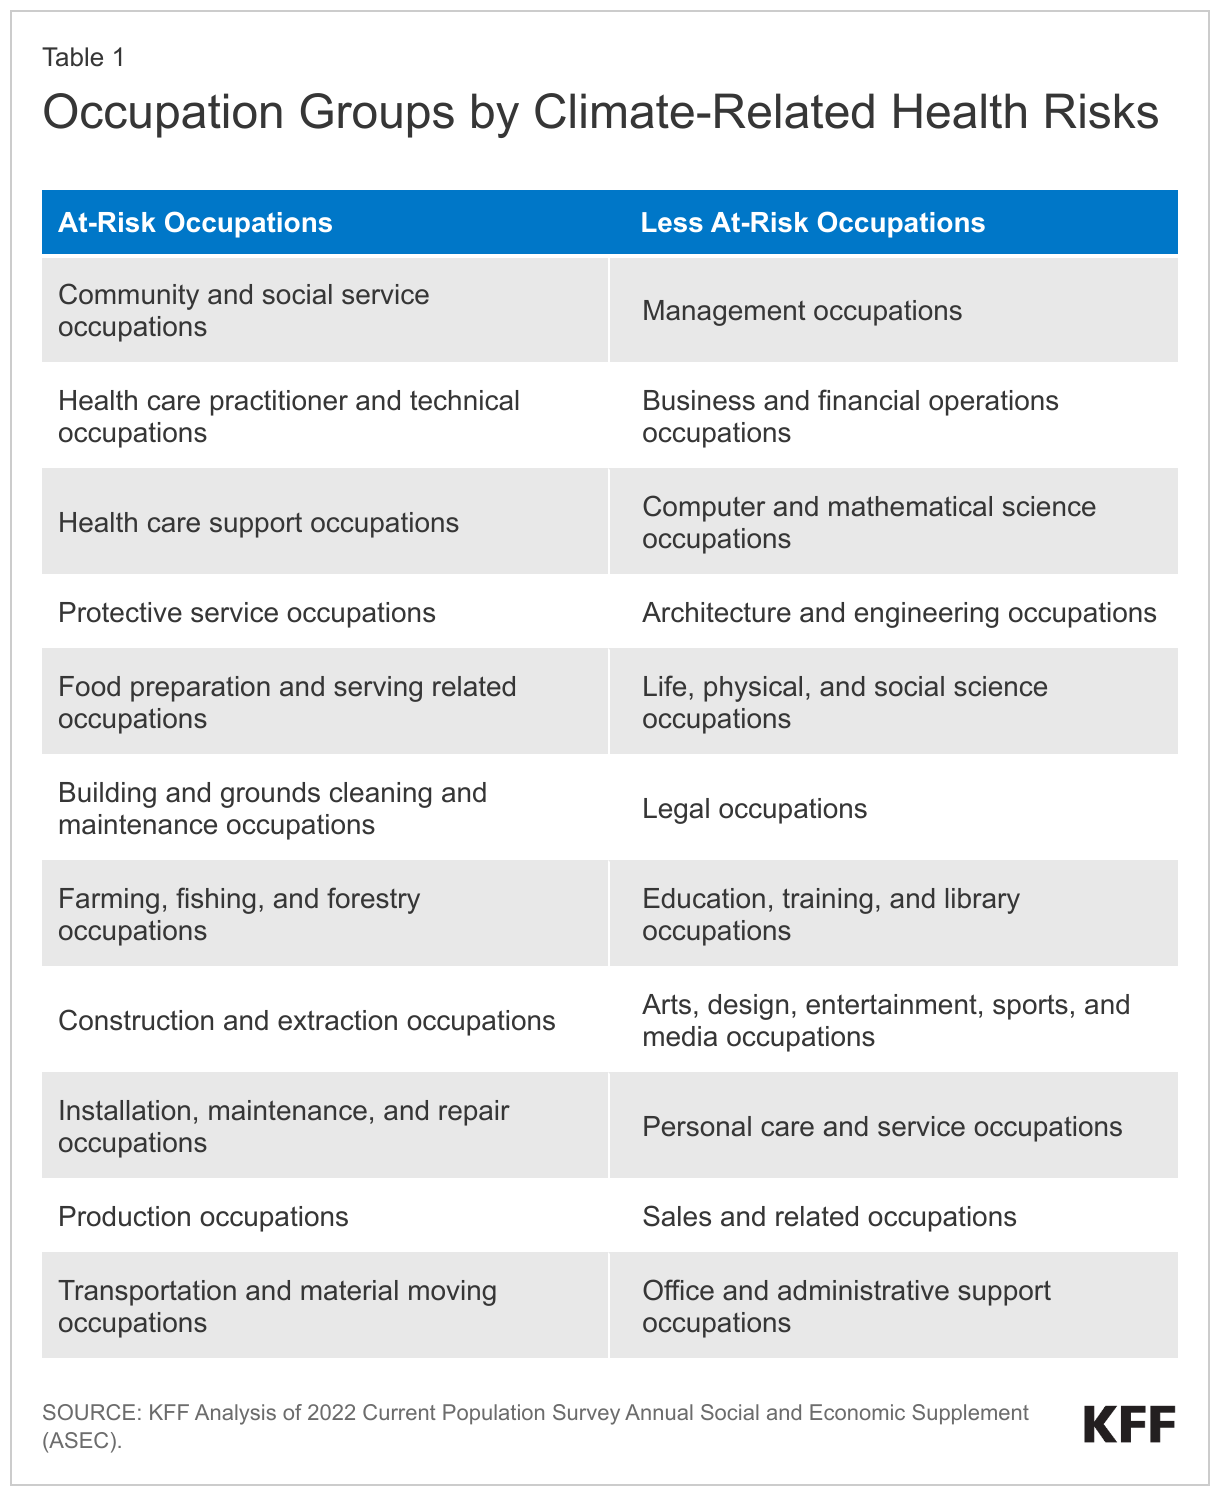
To better understand who is at increased risk of climate-related health impacts through their job, we identified workers in occupation groups at increased risk and as less at-risk using data from the 2022 Current Population Survey Annual Social and Economic Supplement (CPS-ASEC). We identified occupations with increased climate-related risks based on a range of resources, including CDC’s Occupational Safety and Health and Climate Resource, EPA’s Climate Change and Health of Occupational Groups report, and George Washington University’s Hazard Zone: The Impact of Climate Change on Occupational Health (Figure 1). The classifications used in this analysis are subject to some limitations due to the breadth of occupation categories in CPS-ASEC. Each of the occupation categories in CPS includes many jobs, which may vary in terms of at-risk or less at-risk classifications and by geographic location. For this analysis, we classified an occupation category as at- or less at-risk if the majority of jobs included in it aligned with the CDC’s and other organizations’ definitions of climate vulnerable occupations.
Who are Workers in Occupations with Increased Climate Related Health Risks?
Based on the classification of occupation groups above, we find a total of 65.7 million nonelderly adult workers in occupations that are at increased risk for climate related health risks, accounting for 44% of nonelderly workers. The remaining 56% or 84.7 million nonelderly adult workers are in occupations identified as less at-risk for climate-related health risks.
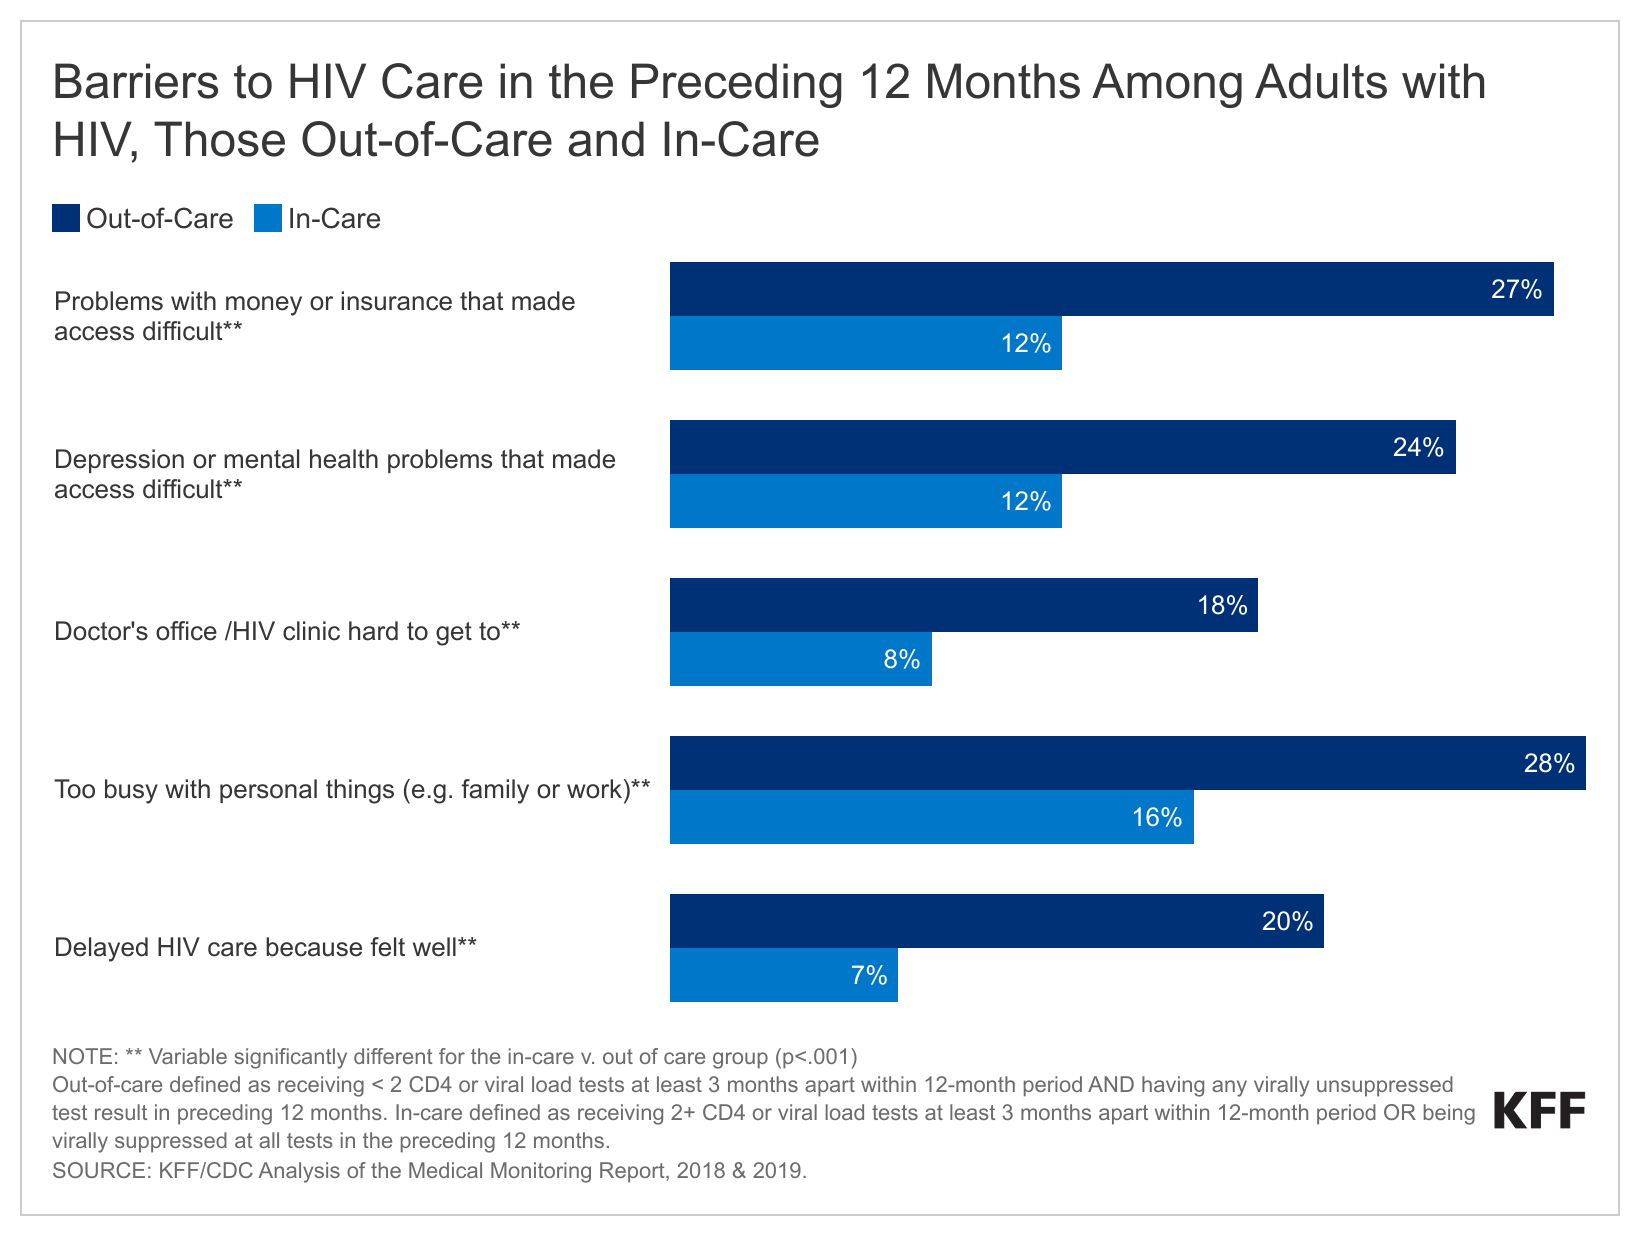
Overall, among nonelderly adult workers, many people of color and noncitizen immigrants are more likely than their White and citizen counterparts to be in jobs with increased climate-related health risks (Figure 1). Over half of Hispanic (58%), Black (51%), and Native Hawaiian or Pacific Islander (NHOPI) (52%) nonelderly workers are in occupations at increased risk for climate-related health risks compared with 39% of White workers. Asian nonelderly workers (33%) are less likely than their White counterparts (39%) to be in occupations that are at increased risk. Moreover, around six in ten of noncitizen immigrant workers, including 62% of those who have been in the U.S. for five or more years and 59% of those who have been in the U.S. for less than five years, are employed in at-risk occupations compared with 41% of U.S.-born citizen workers. Naturalized citizen workers are (47%) also more likely than U.S.-born citizen workers to work in at-risk occupations, although the difference is smaller. Noncitizen Black, Hispanic, and NHOPI workers had particularly high rates of employment in at-risk occupations, with nearly eight in ten (77%) Hispanic noncitizen workers, two-thirds of Black noncitizen workers, and 80% of NHOPI noncitizen workers employed in at-risk professions.
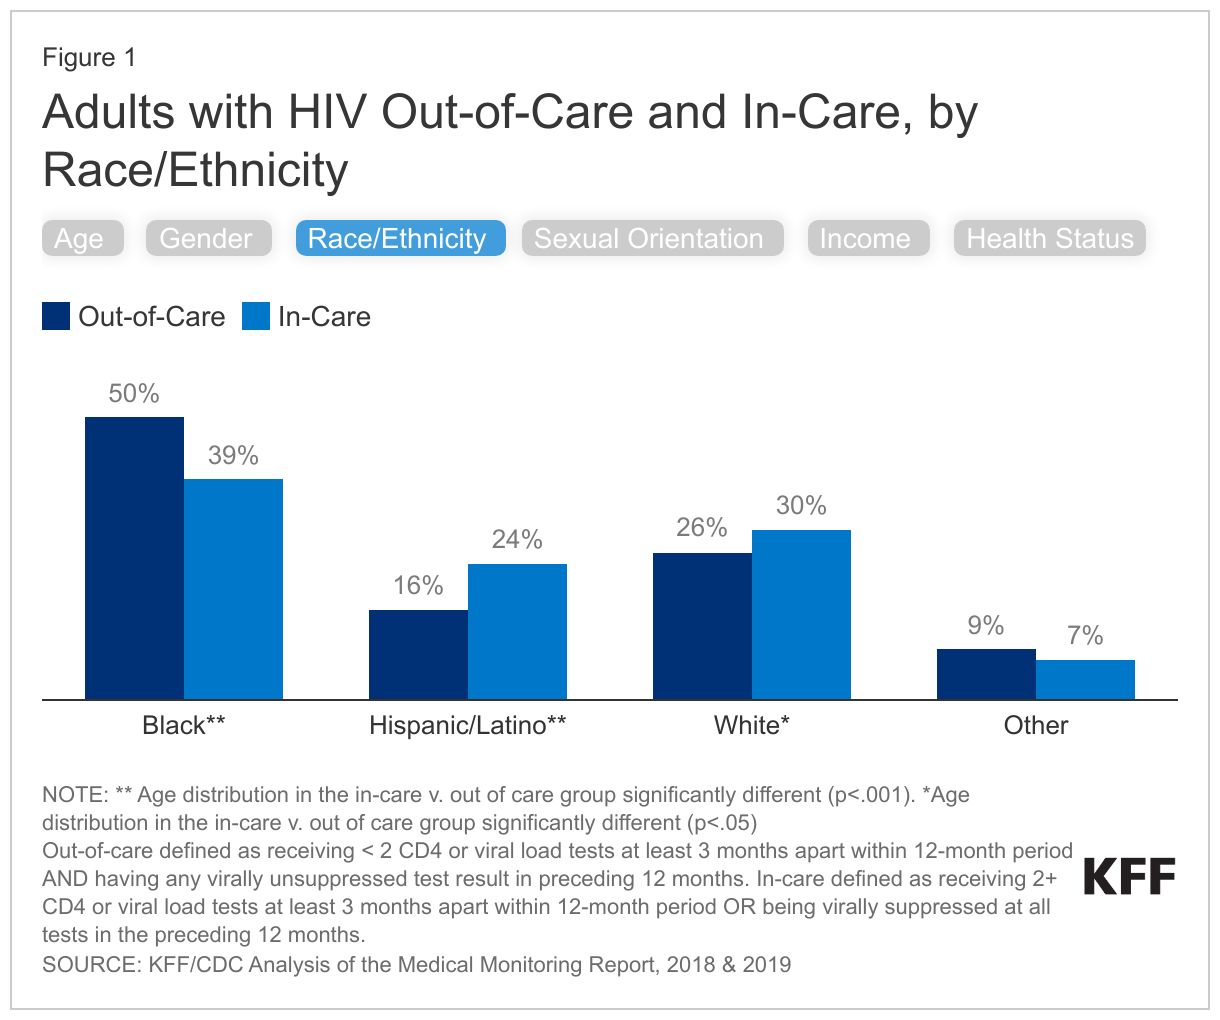
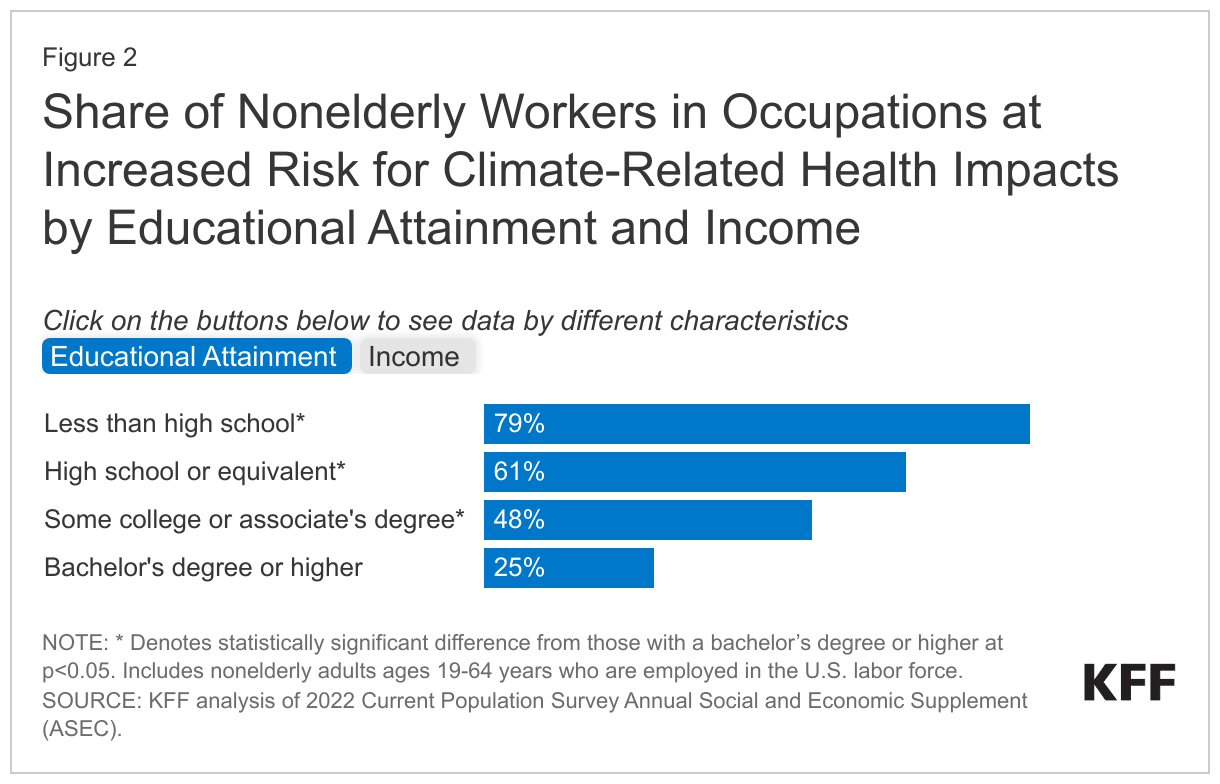
Nonelderly workers with lower educational attainment and income levels are more likely than workers with higher levels of education and income to work in at-risk occupations (Figure 2). Nearly eight in ten (79%) nonelderly workers with less than a high school education and six in ten (61%) nonelderly workers with a high school degree work in at-risk occupations compared with less than half (48%) of nonelderly workers with some college education and just one in four (25%) of nonelderly workers with a bachelor’s degree or higher. Similar patterns are seen by income. Over six in ten low-income nonelderly workers (with incomes below 200% of the federal poverty level (FPL)) are employed in at-risk occupations, nearly twice the share of higher income workers (income at 400% FPL or higher) employed in these jobs (34%).
How Does Health Coverage Vary Among Workers by Risk for Climate-Related Health Impacts?
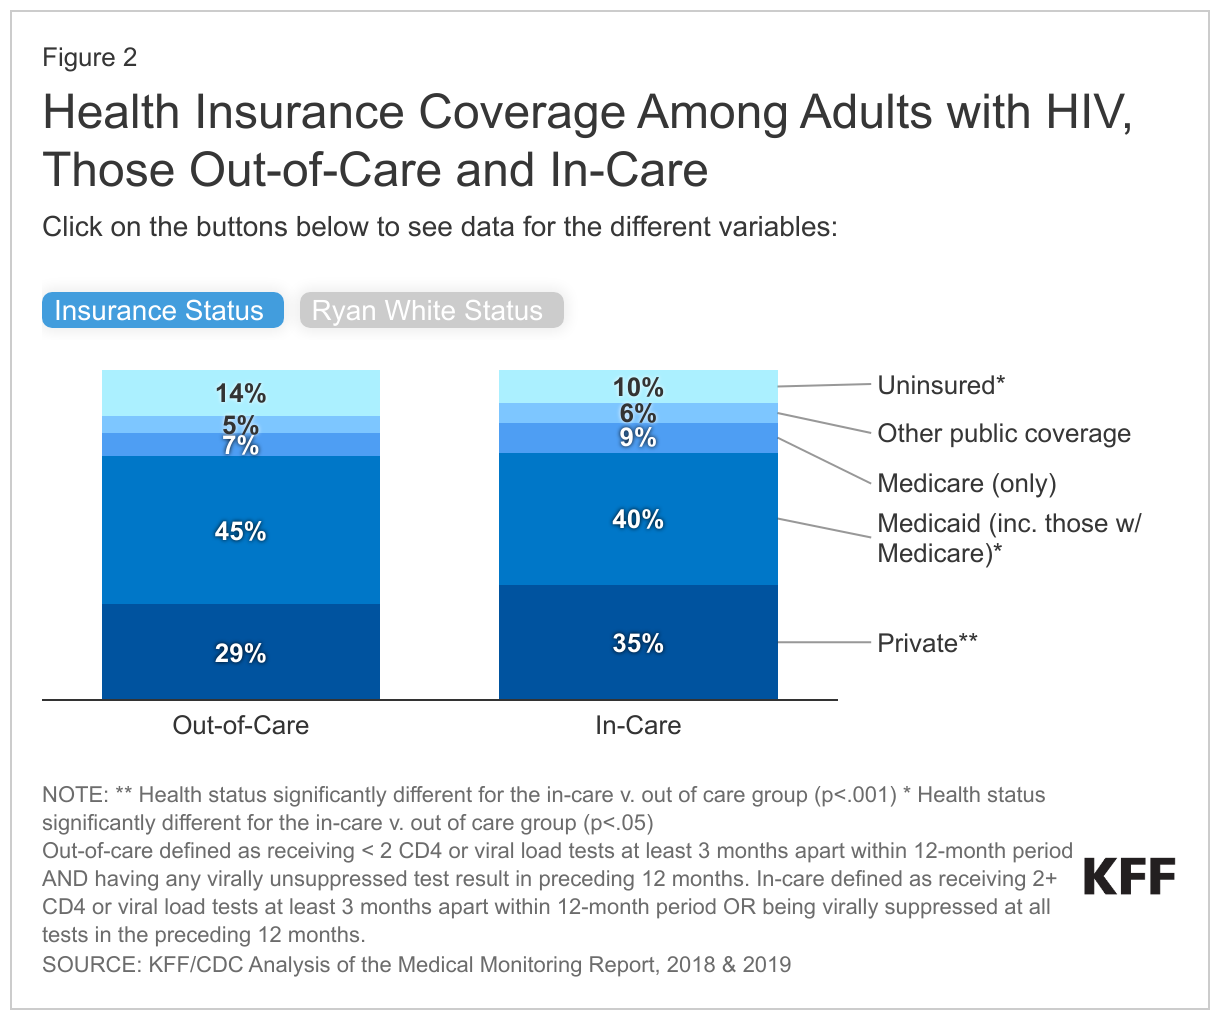
Nonelderly workers in at-risk occupations are about twice as likely as their counterparts in less at-risk occupations to be uninsured (Figure 3). Among nonelderly workers, 16% of those in occupations with increased climate related health risks are uninsured, nearly twice the rate of workers in less at-risk occupations (7%). These higher uninsured rates reflect lower rates of private coverage among these workers (70% vs. 85%). Medicaid helps fill some of this gap in private coverage, covering 14% of workers in at-risk jobs vs. 8% of those in less at-risk jobs, but does not fully offset the gap in private coverage. These differences in health insurance coverage likely reflect that many of the occupations with increased risk offer lower wages and are in industries that are less likely to offer employer-sponsored coverage. Additionally, workers in at-risk occupations are significantly more likely to be noncitizen immigrants, who are subject to eligibility restrictions for federally-funded coverage, including prohibitions on undocumented immigrants enrolling in Medicaid or purchasing coverage through the Affordable Care Act (ACA) Marketplace.
Implications
Job-related climate-related health risks compound challenges and disparities faced by many historically marginalized and underserved groups. This analysis shows that adults of color, noncitizens, and adults with lower educational attainment and incomes are disproportionately employed in occupations with increased climate-related health risks. Moreover, workers in occupations with increased climate-related health risks are more likely to be uninsured, contributing to challenges accessing health care. Many of these same groups may face other job-based challenges, including higher risk of injury and differential treatment. Of particular note are migrant or immigrant workers who are disproportionately exposed to environmental hazards and have a greater risk of developing adverse outcomes due to their potential lack of job training, labor protections, and worker authorization/contracts, as well as their inability to access government-sponsored support. Moreover, these groups also are at increased risk for other climate related health risks and broader disparities in health and health care due to underlying structural inequities, including residential segregation and other social and economic challenges.
Occupational climate-related health risks are expected to increase due to climate change. Without any mitigation strategies, the threats associated with exposure to extreme heat, air pollutants, extreme weather, vector borne diseases, and toxic environmental chemicals and other contaminants are expected to increase due to climate change. As such, climate change will likely contribute to increases in negative health impacts among workers, including heat related illnesses and occupational injuries and illnesses. If unchecked, researchers estimate a nearly fourfold increase in extreme heat-related occupational injuries. Research has shown that, if unaddressed, the impact of climate change on workers’ health will increase loss of productivity hours and may cost the U.S. economy, in the long run. As climate change continues and the number of new vector-borne diseases is expected to increase, researchers expect that many carriers of these diseases could expand their geographical range putting more people, including outdoor workers, at risk of disease infection and transmission. Recent analysis has also found that, if unaddressed, climate change associated damages, including lost labor productivity due to heat stress, increased morbidity and mortality, and agricultural loss could cost the U.S. economy approximately $14.5 trillion over the next fifty years.
In recent years, there has been increased recognition of climate change and its impacts on health equity, including among workers, but continued action will be important for mitigating risks. The federal government has taken some steps to prioritize efforts to address climate change and its health risks for workers. In addition to Executive Orders that emphasize the need for a government-wide approach to addressing climate change and advancing environmental justice, in 2022, the Occupational Safety and Health Administration (OSHA) launched the National Emphasis Program for Outdoor and Indoor Heat-Related Hazards, an enforcement program that seeks to identify and eliminate or reduce worker exposures to occupational heat-related illnesses and injuries. This program is an expansion of the agency’s heat-related illness prevention initiative. The EPA revoked the use of certain dangerous chemicals, including the use of chlorpyrifos as a pesticide for food, reducing risks for farmworkers and their children in 2022. Some states have also taken steps to protect workers from extreme heat. Minnesota, Washington, Oregon, California, and Colorado have implemented heat standards that seek to prevent heat-related illnesses and deaths among workers. Going forward continued actions to mitigate climate-related health risks for workers as well as to address underlying social and economic inequities that drive disparate occupational exposures to climate-related health risks will be of growing importance as these risks are expected to grow due to climate change.