Hospital Charity Care: How It Works and Why It Matters

Published: Nov 3, 2022

About four in ten adults (41%) in the United States—and about six in ten (57%) of those with household incomes below $40,000—have some level of medical debt, owing an estimated $195 billion or more in total.  Many adults who report medical debt cite costs associated with emergency care (50%) and hospitalizations (35%) as sources of unpaid bills.  Affording this care may be especially challenging for the large number of adults who are uninsured or underinsured. The financial impact of unpaid bills from hospitals and other providers on patients and their families can be substantial and long lasting. Recent reporting indicates that hospitals are earning healthy margins in some regions where a large share of residents are burdened with medical debt. In response to concerns about medical debt and the affordability of care more generally, policymakers have explored options to strengthen the regulation of hospital charity care programs, which provide free or discounted services to eligible patients who are unable to afford their care.

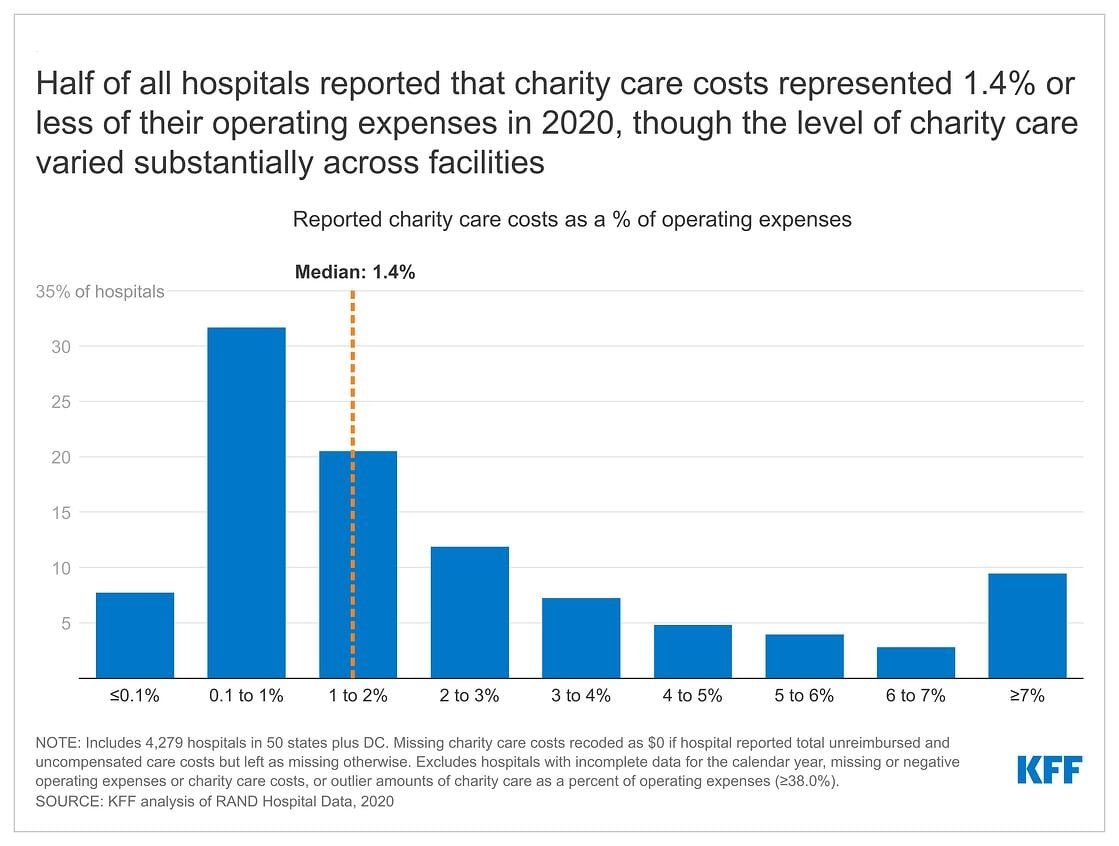
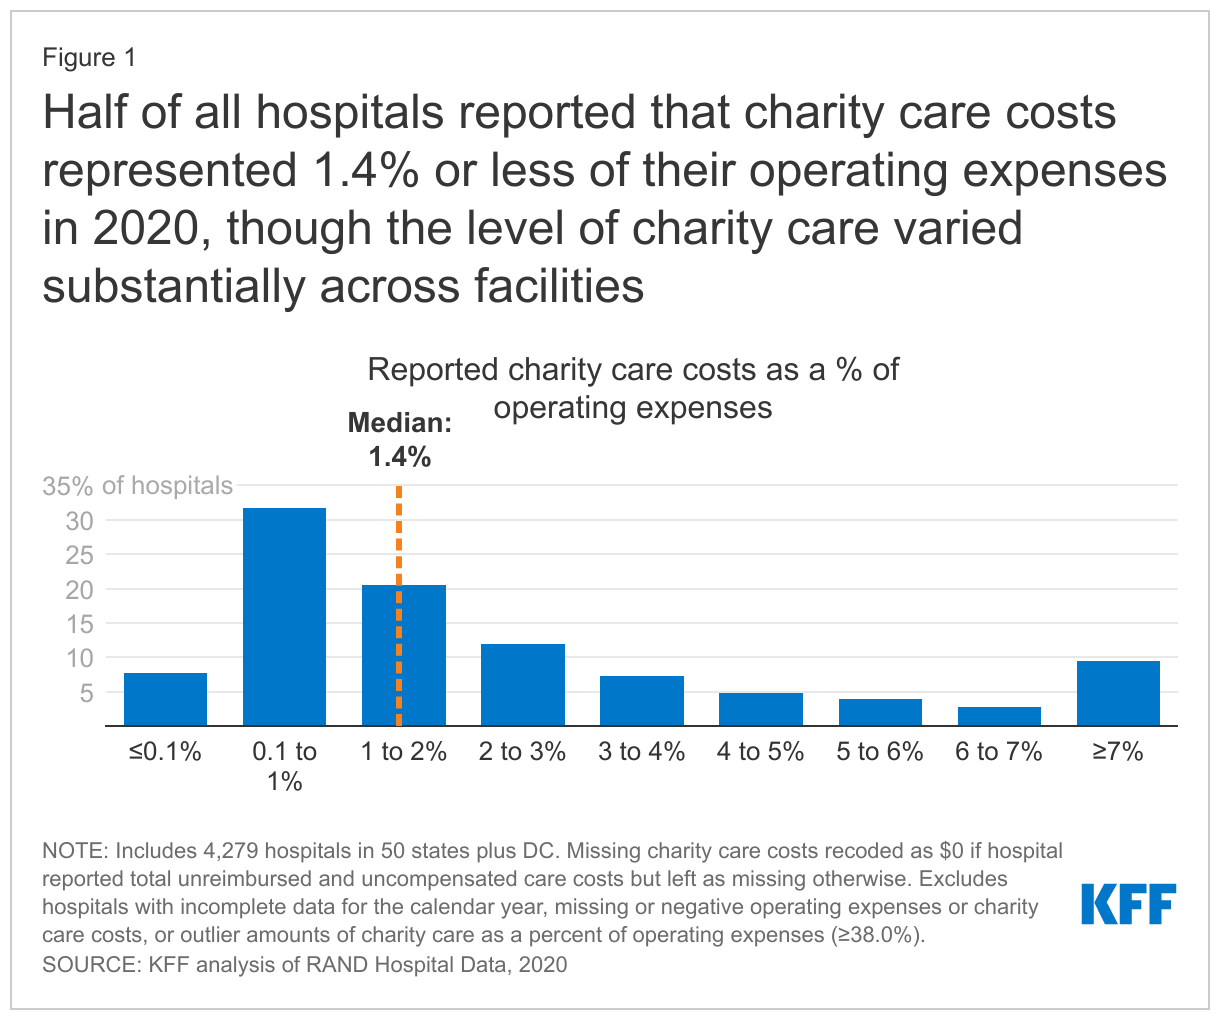
This issue brief addresses key questions about hospital charity care programs.  According to our analysis of hospital cost reports, charity care costs represented 1.4 percent or less of operating expenses at half of all hospitals in 2020, though the level of charity care varied substantially across facilities (Figure 1) (see Methods for details about our calculations). For example, while charity care costs represented 0.1 percent of operating expenses or less on the lower end of the spectrum (for 8% of hospitals), they represented 7.0 percent of operating expenses or more among a similar share of hospitals (9%). The variation in charity care costs as a percent of operating expenses likely reflects differences in hospitals’ missions and business practices; the need for charity care among patients; and federal, state, and local policy and regulation. Federal, state, and local governments provide funding in a variety of ways—including through tax benefits for nonprofit hospitals—to support hospital charity care, which may in part motivate efforts to increase the regulation of these programs. Although charity care programs are an important source of relief for uninsured and underinsured patients, many Americans continue to have difficulty affording hospital care. In 2022, about one in seven adults (14%) reported delaying hospital services in the past year due to cost.

Half of all hospitals reported that charity care costs represented 1.4% or less of their operating expenses in 2020, though the level of charity care varied substantially across facilities

What is hospital charity care?

The Internal Revenue Service (IRS) defines “charity care”, also known as “financial assistance”, as “free or discounted health services provided to persons who meet the organization’s eligibility criteria for financial assistance and are unable to pay for all or a portion of the services.”1  Depending on their eligibility criteria, hospitals may provide charity care to both uninsured and insured patients. Among other government regulations, federal law requires that nonprofit hospitals—which account for nearly three-fifths (58%) of community hospitals—provide some level of charity care as a condition of receiving tax-exempt status, and many state governments require all or a subset of hospitals to extend eligibility for charity care to certain groups of patients.  Within the broad parameters set by government regulation, hospitals establish their own charity care policies, which vary in terms of eligibility criteria, application procedures, and the levels of charity care provided. While hospitals bear the direct costs of providing charity care, support from donors and federal, state, and local governments may cover some or all of these expenses. Estimates from one recent study suggest that the value of the tax exemption alone covered about half (50%) of the cost of charity care and other community benefits provided by nonprofit hospitals from 2011 to 2018.2 

The sum of charity care and bad debt is sometimes referred to as “uncompensated care”. “Bad debt” refers to instances where a hospital bills a patient but, after pursuing collection, determines that it is unlikely to collect payment. This stands in contrast to charity care, for which hospitals do not seek reimbursement. Hospitals accumulate bad debt when patients are unable or unwilling to pay for their care. Some of these patients may be eligible for charity care under the hospital’s charity care policy but do not know to apply, have difficulty doing so, have their application improperly denied, or choose not to apply.

Who is eligible for hospital charity care?

Hospitals have broad flexibility to establish their own eligibility criteria for charity care, and as a result, eligibility criteria vary across hospitals. For example, one analysis of a large sample of nonprofit hospitals that used the federal poverty level (FPL) to determine eligibility for free care in 2018 found that about one in three (32%) of the hospitals required patients to have incomes at or below 200 percent of the FPL ($50,200 for a family of four in that year) or imposed more restrictive eligibility criteria, while the remaining hospitals (68%) relied on higher income caps.  For discounted care, about three-fifths (62%) of nonprofit hospitals in the study limited eligibility to patients with incomes at or below 400 percent of the FPL or used lower income levels, with the remaining nonprofit hospitals (38%) relying on higher income caps.

Hospitals may condition free or discounted care on other eligibility criteria in addition to or in lieu of income thresholds based on the FPL, such as by requiring that patients have limited assets or reside in the hospital service area or by extending eligibility to patients who are unable to afford large medical bills despite exceeding income or asset thresholds under standard eligibility pathways.  For example, one analysis of charity care policies at 170 large nonprofit and government hospitals found that most policies (76%) identified a streamlined application process for some groups that are likely eligible for charity care, such as patients experiencing homelessness.

It is unclear what share of low-income patients are eligible for hospital charity care, let alone what share of eligible patients end up benefiting from these programs, or what share of their costs are covered. Eligible patients may not receive charity care because they are unaware that charity care is available, do not know that they are eligible, have difficulty completing an application, are improperly denied charity care by the hospital, or choose not to apply. Some evidence suggests that many eligible patients may not be benefiting from charity care. For example, nonprofit hospitals have estimated that, of the bad debt that they reported in 2019 (reflecting expenses in 2017 or an earlier year), about $2.7 billion came from patients who were likely eligible for charity care but did not receive it. This amount is a rough estimate, as it comes from unaudited hospital reports, is restricted to nonprofit facilities, and does not account for instances where eligible patients paid bills that would have been reduced under a given hospital’s charity care program.

How much charity care do hospitals provide?

According to the Medicaid and CHIP Payment and Access Commission (MACPAC), hospitals reported $28 billion in charity care costs in fiscal year (FY) 2019, the majority of which ($22 billion) was for uninsured individuals. Based on our analysis of hospital cost reports, charity care costs represented 1.4 percent or less of operating expenses at half of all hospitals in 2020, though the level of charity care varied substantially across facilities (Figure 1) (see Methods for details about our calculations). For example, while charity care costs represented 0.1 percent of operating expenses or less on the lower end of the spectrum (for 8% of hospitals), they represented 7.0 percent of operating expenses or more among a similar share of hospitals (9%). Charity care costs as a percent of operating expenses were 2.6% in 2020 on average, which is greater than the median given that a relatively small share of hospitals reported relatively large amounts of charity care. Variation in charity care levels across hospitals likely reflects differences in their missions and business practices; the need for charity care among patients; and federal, state, and local policies and regulations. The Medicare Payment Advisory Commission (MedPAC) has noted that the current method for calculating charity costs favors hospitals with higher markups, and it has recommended revisions that would put hospitals on more equal footing and reduce reported charity care costs on average.

Recent research has found that for-profit hospitals devote a similar share of their operating expenses to charity care as government hospitals on average and a larger or similar share as nonprofit hospitals. This may seem counterintuitive because, unlike for-profit hospitals, nonprofit hospitals receive large tax-breaks which are, in part, intended to subsidize the charity care that they provide. Among potential explanations for this result, for-profit hospitals may have a greater willingness to provide charity care in some scenarios because they can take a tax deduction for these expenses, and it is possible that some nonprofit hospitals may not expect significant oversight of their charity care practices from government regulators.

What role does charity care play for undocumented and lawfully present immigrants?

Hospital charity care may play an important role in protecting undocumented and lawfully present immigrants from high medical costs given that they are more likely than citizens to have low incomes and lack health insurance. In 2020, about four in ten undocumented and lawfully present nonelderly immigrants (44% and 39%, respectively) had incomes below 200 percent of the FPL compared to about a quarter (26%) of nonelderly citizens. Additionally, about four in ten (42%) nonelderly undocumented immigrants and a quarter (26%) of nonelderly lawfully present immigrants were uninsured compared to less than one in ten (8%) nonelderly citizens. This disparity reflects more limited access to private coverage and eligibility restrictions based on immigration status in health insurance programs funded with public dollars. Even though charity care programs provide financial assistance for some immigrants, overall, research suggests that immigrants use less health care, including hospital care, than U.S.-born citizens, and it remains unclear to what extent they benefit from charity care programs and how their use of these programs compares to that of citizens.

What charity care rules must nonprofit hospitals comply with in exchange for receiving federal tax-exempt status?

Federal regulations require that nonprofit hospitals provide some level of charity care and other community benefits as a condition of receiving tax-exempt status. The IRS has defined different types of community benefits, including patient benefits (such as charity care), system benefits (such as unreimbursed medical education), and community building activities (such as addressing environmental hazards). According to one study, in 2017, unreimbursed Medicaid expenses accounted for the plurality (44%) of nonprofit hospitals’ community benefit expenses, followed by charity care (17%), unreimbursed health professions education (15%), subsidized health services that are not mean-tested (10%), community health improvement services and operations (4%), unfunded research (4%), cash and in-kind contributions for community benefit (3%), unreimbursed costs for means-tested programs aside from Medicaid (2%) and building activities (e.g., related to housing) (1%). “Unreimbursed expenses” for Medicaid—the nation’s public health insurance program for people with low incomes—and other means-tested programs refers to the extent to which costs related to patients enrolled in these programs exceed corresponding revenues for hospitals. Any unreimbursed expenses from other payers are generally not counted in hospital community benefit calculations.

To retain tax-exempt status, nonprofit hospitals must:

  • Establish a financial assistance policy (FAP). The FAP must describe who is eligible for charity care, the level of assistance provided, and how patients can apply. A hospital must make its FAP easily accessible to patients and ensure that the FAP is translated into the languages commonly spoken in the community served by the hospital.
  • Cap charges to patients eligible for charity care based on amounts generally billed to other payers. Federal regulation defines approaches for calculating the amount generally billed based on fee-for-service Medicare rates, Medicaid rates, and/or commercial plan payment rates.
  • Conduct a community health needs assessment (CHNA) every three years and adopt an implementation strategy to address those needs. The CHNA must define the community that the hospital serves and evaluate the health needs of that community, integrating input from local stakeholders. Community health needs could include, for example, lowering financial barriers to health care or improving social determinants of health.
  • Make reasonable efforts to determine if a patient is eligible for charity care before engaging in certain debt collection practices, including selling the patient’s debt to third parties, reporting the debt to credit agencies, and taking legal action to control a patient’s financial assets. A “reasonable effort” could entail, for example, notifying the patient of the FAP and giving them at least four months to apply following their first bill after being discharged from the hospital.

However, gaps in federal regulation and weak oversight and enforcement may allow hospitals to provide low levels of charity care in some instances. Federal regulations do not currently define or set minimum standards for hospitals to determine who is eligible for charity care or the level of assistance to be provided. A 2020 Government Accountability Office (GAO) report also raised questions about whether requirements to provide sufficient community benefits, including charity care, are being adequately enforced.  According to the report, the IRS had not revoked a hospital’s nonprofit status on the basis of providing inadequate community benefits over the prior ten years.

Do states impose additional charity care requirements for hospitals?

Slightly over half of all states (26 states and DC) require all or a subset of hospitals to extend eligibility for charity care to certain groups of patients, according to a 2021 report from the National Consumer Law Center.  Among those that do so, 11 states (CA, CO, CT, IL, MD, ME, NJ, NV, NY, RI, and WA) broadly extend minimum standards to for-profit, nonprofit, and government hospitals alike. The 16 remaining state laws extend to narrower groups of hospitals, including nonprofit or government hospitals (3 states: LA, OR, and TX), hospitals that receive certain types of government funding to offset the cost of care for low-income patients (9 states: GA, KS, KY, MO, NM, OH, OK, PA, and TN), and hospitals seeking approval to expand or build new health care facilities (DC and 3 states: DE, NC, and VA). These state regulations also vary in terms of eligibility criteria and the level of assistance that must be provided. For example, Nevada requires a subset of hospitals to provide free care to uninsured patients with especially low incomes (38% or 39% of the FPL in 2022 depending on household size), while Maryland requires every acute and chronic care hospital to provide free care to both insured and uninsured patients at or below 200% of the FPL and to provide discounted care to patients with higher incomes.

In addition to setting minimum standards in terms of eligibility, several states have implemented regulations intended to increase the uptake of charity care among eligible patients and to protect potentially eligible patients from certain debt collection practices. For example, one analysis found that 13 states require hospitals to screen patients for eligibility, 16 states require hospitals to notify patients prior to collecting payment and/or in every notification about collections, and 8 states regulate procedures for patients to appeal denials of charity care.

There is little information about the effectiveness of these regulations or the extent to which they are enforced. One recent example of a state enforcement activity occurred in California, where the Attorney General sent letters to hospitals alleging that they were not providing descriptions of their charity care policies to patients in the patients’ spoken languages.  Another recent example occurred in Washington, where the Attorney General filed a lawsuit against 14 hospitals for violating state charity care requirements, including by sending many patients’ bills to collections when the hospitals knew the patients were eligible for charity care.

What role do Medicaid, Medicare, and other government programs play in helping hospitals afford charity care expenses?

Medicaid provides health coverage for low-income patients and subsequently plays a significant role in reducing uncompensated care, including by lowering the demand for hospital charity care. This was especially evident in 2014, when many states adopted the Medicaid expansion under the Affordable Care Act (ACA) (and when enrollment in the ACA Marketplaces also began in all states). Among hospitals in states that expanded Medicaid, total uncompensated care costs decreased from $16.7 billion in 2013 to $11.0 billion in 2014 (a 34% decrease); in contrast, uncompensated care costs decreased by a much smaller amount (from $18.1 billion in 2013 to $17.9 billion in 2014, a 1% decrease) among hospitals in states that did expand Medicaid.

Medicaid and Medicare both provide supplemental payments to hospitals that are intended, at least in part, to offset the costs of charity care and other uncompensated care:

  • Medicare disproportionate share hospital (DSH) payments. Medicare provides additional payments to hospitals that care for a disproportionate share of low-income patients, which are known as “DSH hospitals”. The magnitude of Medicare DSH payments is based on hospitals’ Medicaid and Supplemental Security Income (SSI) populations and the amount of uncompensated care that they provide, among other factors. The Centers for Medicare and Medicaid Services (CMS) estimates that additional Medicare payments to DSH hospitals will total $14.0 billion in FY 2023.
  • Medicaid DSH payments. State Medicaid programs also provide additional payments to DSH hospitals. Federal regulations provide states with a substantial level of discretion in terms of which facilities to designate as DSH hospitals and how to distribute funding. Medicaid DSH payments totaled $19.5 billion in FY 2020.
  • Medicaid uncompensated care pool payments. In FY 2020, eight state Medicaid programs paid hospitals a total of $8.2 billion to help offset the costs of uncompensated care.

Other state and federal programs may provide additional support to hospitals, which in turn can reduce the amount of charity care hospitals have to absorb. For instance, some state and local governments operate programs beyond Medicaid that provide coverage to low-income patients or that offset uncompensated care costs. As another example, the 340B Drug Pricing Program provides substantial financial support primarily to hospitals that serve a large number of low-income patients. Under this program, the federal government requires drug manufacturers to offer discounts on outpatient drugs to certain hospitals as a condition of having their drugs covered by Medicaid. Sales of 340B drugs totaled an estimated $44 billion in 2021 and DSH hospitals account for the large majority (78%) of sales. These additional revenues help facilities cover their operating expenses, including costs related to the provision of charity care.

How has the provision of charity care changed during the pandemic?

Although the COVID-19 pandemic has led to significant and ongoing disruptions in hospital operations, hospital admissions bounced back after sharp initial declines, and large amounts of government relief have helped stabilized hospital finances and charity care spending.  Most prominently, the federal Provider Relief Fund (PRF) program has distributed $134 billion to hospitals and other providers as of early October 2022 to cover health care expenses or lost revenues due to the pandemic. Although the PRF program initially distributed funds on the basis of total patient revenue, which favored hospitals that received a large share of their revenues from private insurance, it later included $16 billion that was earmarked for safety-net hospitals. Among other relief programs, the government also reimbursed providers, including hospitals, for treating uninsured patients for COVID-19, with payments totaling $5.8 billion by the time the program stopped reimbursing claims in March 2022 due to lack of funding.

One study found that average hospital operating margins decreased from -1.0% in 2019 to -7.4% in 2020 when excluding COVID-19 relief funds, but that total margins—which take relief funds into account—were relatively constant over time and were 6.7% in 2020. Similarly, average charity care costs as a percent of operating expenses remained relatively constant at 2.7% in 2019 and 2.6% in 2020 based on our analysis of hospital cost reports (see Methods for details about our calculations). One analysis of 151 large nonprofit and government hospitals found that about three in ten (31%) expanded their charity care policies from 2019 to 2021, while less than one in ten (8%) moved towards more restrictive policies; the remaining hospitals made minimal, indeterminate, or no change to their charity care policies.

Some reports suggest that the financial outlook for hospitals has deteriorated in recent months, which may make it harder for hospitals to maintain current levels of charity care.  Further monitoring is needed to assess the extent to which hospitals are experiencing financial stress in response to ongoing effects of the pandemic such as labor shortages, decreases in government relief, rising drug costs, and broader economic trends that have led to rising prices and investment losses.

Looking ahead

In the context of ongoing concerns about the affordability of hospital care and the growing burden of medical debt, several policy ideas have been floated at the federal and state level to strengthen hospital charity care programs. These include changes that would strengthen the requirements for nonprofit hospitals to qualify for tax-exempt status, as well as broader reforms that would apply to all hospitals. Specific proposals include creating or expanding requirements that hospitals provide charity care to patients below a specified income threshold, mandating that nonprofit hospitals provide a minimum amount of community benefits, establishing a floor-and-trade system where hospitals would be required to either provide a minimum amount of charity care or subsidize other hospitals that do so, introducing policies to increase the uptake of charity care, expanding oversight and enforcement of community benefit requirements, and restructuring the tax exemption for nonprofit hospitals to more closely tie government subsidies to the value of charity care and other community benefits provided by a given facility. A related set of proposals are intended to better align community benefits with local or regional needs and may therefore also affect the provision of charity care.

Recent policy changes have been concentrated at the state level. For example, since 2021, California and Washington state have expanded their charity care mandates to cover more patients through higher income eligibility thresholds. Colorado has introduced a private right of action to enforce hospital compliance with charity care requirements, and Illinois has implemented new reporting requirements for charity care programs. State and federal policymakers have also considered several other options to reduce medical debt or increase affordability more generally, such as by expanding Medicaid in states that have not already done so, reducing health care prices through direct regulation or other means, and increasing consumer protections against medical debt.

Efforts to expand hospital charity care will inevitably involve tradeoffs, including the potential cost to hospitals from protecting patients who cannot afford their hospital bills.

Methods

Our analysis of reported charity care costs as a percent of operating expenses is based on 2019-2020 RAND Hospital Data, which is a cleaned and processed version of annual cost report data submitted by hospitals to the Healthcare Cost Report Information System (HCRIS). Every Medicare-certified hospital must submit a cost report, meaning that HCRIS data encompass all US hospitals except federal hospitals and some children’s hospitals. HCRIS instructions indicate that hospitals should report amounts related to both their charity care and uninsured discounts as part of their charity care costs. The Medicare Payment Advisory Commission (MedPAC) has noted that current HCRIS calculations favor hospitals with higher markups, and it has recommended revisions that would put hospitals on more equal footing and reduce reported charity care costs on average.

Our analysis relied on a calendar year version of the RAND Hospital Data, which apportions data from different cost reports for hospitals that do not use a calendar year reporting period. We focused on short-term general hospitals in all 50 states plus DC. We recoded missing charity care costs as $0 if the hospital reported total unreimbursed and uncompensated care costs (affecting about 3% of hospitals) but left as missing otherwise. There were no other instances of $0 charity care costs in our sample. We excluded hospitals with incomplete data for the calendar year, missing or negative operating expenses or charity care costs, or outlier amounts of charity care as a percent of operating expenses (greater than or equal to 38.0%, i.e., the top 0.1% of hospitals). Our final sample for 2020 included 4,279 of the 4,546 short-term general hospitals in the 2020 RAND Hospital Data. When comparing charity care costs in 2019 and 2020, we restricted the sample to the 4,236 hospitals that were in sample in both years.

We evaluated two adjustments to our analysis and found that neither substantially affected our primary findings. First, we found that dropping all hospitals with missing charity care costs, rather than recoding a subset as $0, would result in a similar median value for charity care costs as a percent of operating expenses (1.5% versus 1.4%) and the same mean value (2.6%), with somewhat less variation across hospitals than in our analysis. For example, under this alternative approach, charity care costs would represent 0.2 percent of operating expenses or less among eleven percent of hospitals and 7.0 percent of operating costs or more among nine percent of hospitals. Second, as with our analysis comparing 2019 and 2020, when further restricting the sample to the 1,628 hospitals that used a calendar year reporting period in both years, average charity care costs as a percent of operating expenses remained relatively constant over time (at 2.3% in 2019 and 2.2% in 2020).

This work was supported in part by Arnold Ventures. KFF maintains full editorial control over all of its policy analysis, polling, and journalism activities.

  1. The IRS definition also indicates that charity care excludes “bad debt or uncollectible charges that the organization recorded as revenue but wrote off due to a patient’s failure to pay, or the cost of providing such care to such patients; the difference between the cost of care provided under Medicaid or other means-tested government programs or under Medicare and the revenue derived therefrom; self-pay or prompt pay discounts; or contractual adjustments with any third-party payors”. ↩︎
  2. We derived this estimate from the study by dividing the estimated average value of tax exemption (4.26%) by the estimated average value of community benefits (8.47%). ↩︎
News Release

Half of All Hospitals Have Charity Care Costs That Represent 1.4% or Less of Their Operating Expenses

New Report Explains How Hospital Charity Care Works and the Laws Governing It

Published: Nov 3, 2022

Half of hospitals reported that the cost of providing charity care to patients represented 1.4% or less of their operating expenses in 2020, though the rates vary widely from hospital to hospital, a new KFF analysis finds.

Based on a review of hospital cost report data, the analysis finds some hospitals provide little or no charity care (0.1% or less of operating expenses at 8% of hospitals), while others provide far more charity care (at least 7% of operating expenses at 9% of hospitals).

The variation in charity care rates may reflect differences in individual hospitals’ mission and business practices; the need for charity care among their patients; and federal, state, and local policies and regulations.

The analysis is part of a new brief that examines the role of hospital charity care programs in helping patients who cannot afford their care. The brief answers frequently asked questions, including:

  • How much charity care do hospitals provide?
  • Which patients are eligible for charity care?
  • What are the requirements related to charity care for nonprofit hospitals to receive federal tax-exempt status, and what additional requirements do states impose on hospitals?
  • How do Medicaid and Medicare help hospitals afford charity care expenses?
  • How did the COVID-19 pandemic affect charity care?

The brief also discusses policy proposals related to hospital charity care programs, such as creating or expanding requirements that hospitals provide charity care to patients below a specified income threshold, introducing requirements to increase the uptake of charity care, and strengthening oversight and enforcement of existing regulation. It is part of KFF’s expanding work examining the business practices of hospitals and other providers and their impact on costs and affordability.

Interest in Using Over-the-Counter Oral Contraceptive Pills: Findings from the 2022 KFF Women’s Health Survey

Published: Nov 3, 2022

Issue Brief

Introduction

In July 2022, Perrigo’s HRA Pharma submitted an application to the Food and Drug Administration (FDA) to make its progestin-only oral contraceptive (Opill) available over the counter (OTC). The typical review period is 10 months. If approved, it would be the first daily oral contraceptive pill approved for OTC use available in the U.S. Although it is farther behind in the process, another pharmaceutical company, Cadence, is working toward FDA approval of an OTC version of its combined oral contraceptive pill (Zena).

Oral contraceptives are the most commonly used method of reversible contraception in the U.S., and studies suggest that OTC access would increase use of contraception and facilitate continuity of use in addition to saving time spent on travel, at a doctor’s office, and off work. The American Medical Association and the American College of Obstetricians and Gynecologists support efforts to make an oral contraceptive pill available OTC, without age restrictions.

This brief presents data from the 2022 KFF Women’s Health Survey (WHS) about reproductive age (18-49) females’ preferences for an OTC contraceptive pill (N = 4,088). The KFF WHS is a nationally representative survey that includes 5,201 females1 , conducted primarily online from May 10, 2022, to June 7, 2022. The survey covers several topics related to reproductive health and well-being. See the Methodology section for details.

Findings

More than three-quarters (77%) of reproductive age females favor making birth control pills available over the counter without a prescription if research showed they are safe and effective (Figure 1). Fifty-six percent strongly favor this policy and 21% somewhat favor it, even if they would not use this option themselves. Twelve percent of females either somewhat or strongly oppose this policy and 11% did not know whether they favor or oppose it.

Larger shares of recent oral contraceptive users (60%) strongly favor making birth control pills available OTC compared to those who have not used contraception in the past 12 months (52%).

About six in ten (59%) White and Hispanic reproductive age females strongly favor making a birth control pill available OTC if research showed it is safe and effective compared to less than half of Black (44%) and Asian/Pacific Islander females (47%). Higher-income (>= 200% FPL) females (62%) are more likely than low-income (< 200% FPL) females (49%) to say that they strongly favor making birth control pills available OTC.2 

Large majorities of reproductive age females across demographic groups favor making birth control pills available over the counter without a prescription

Two in five (39%) reproductive age females would be likely to use OTC birth control pills that do not require a prescription if approved by the FDA (Figure 2). One in five would be very likely (19%) or somewhat likely (20%) to use them. Almost half (46%) say they would be somewhat or very unlikely to use them and 14% do not know.

Interest is significantly higher among females who currently use oral contraceptives. Sixty percent of reproductive age females who have used birth control pills in the past 12 months said they would be likely or very likely to use OTC birth control pills compared to 40% of other contraceptive users and 29% of contraceptive non-users.

A higher share of reproductive age Hispanic females (25%) say they would be very likely to use OTC birth control pills if approved by the FDA than their White counterparts (17%). The share of low-income females who would be very likely to use OTC birth control pills is similar to the share of higher-income females (20% and 19%, respectively). One in four (24%) uninsured reproductive age females would be very likely to use them compared to about one in five (18%) of those with private health insurance. A higher share of females living in urban/suburban (20%) are very likely to use OTC birth control pills than rural females (13%).

Two in five reproductive age females would be likely to use over-the-counter birth control pills,  with higher likelihood among the uninsured

Convenience is the leading reason that reproductive age females say they would be somewhat or very likely to use OTC birth control pills (59%) (Figure 3). Fifteen percent believe it would be faster; 8% do not want to have to have a physical or pelvic exam; 7% say it would be more confidential; 6% think it would save money; and 3% do not want to use their health insurance to buy birth control pills.

Convenience is the main reason why females would be likely to use over-the-counter birth control pills

While convenience is the leading reason for wanting to use an OTC birth control pill across demographic groups, there are some differences within groups. Nearly two-thirds (64%) of higher-income (>= 200% FPL) reproductive age females who say they would be likely to use OTC birth control pills cite convenience as their main reason (Table 1). One in ten Black females (10%) and those ages 18 to 25 (9%) say their main reason is confidentiality, compared to 5% of White females and 4% of females ages 36-49. Sixteen percent of uninsured females say they would be likely to use OTC birth control pills mainly because they think it would save money, compared to 5% of those with private health insurance. Among reproductive age females likely to use OTC birth control pills, one in five (20%) with Medicaid say that it would be faster, compared to 13% of those with private insurance.

Reasons for wanting to us to use an OTC birth control pill can vary between demographic groups

Among reproductive age females who say they would be somewhat or very unlikely to use OTC birth control pills without a prescription, or who are not sure, the majority (53%) say that the main reason is because they do not currently use birth control pills or do not plan to use them in the future (Figure 4). Sixteen percent say that they would prefer to talk to a health care provider before starting or refilling birth control pills; 12% cited safety concerns as the main reason they would be unlikely to use them; 3% said they would be concerned about the cost; and 3% would be concerned about whether their health insurance would cover them.

Thirteen percent of reproductive age females who are unlikely to or not sure if they would use OTC birth control pills without a prescription report that they are unlikely to use them for some other reason; common reasons include that they or their partner have had a sterilization procedure or that they prefer another method.

These estimates change, however, when looking at reproductive age females who have used oral contraceptives in the past 12 months and those who have used other methods of contraception. Among oral contraceptive users who say that they would be unlikely to use an OTC oral contraceptive or are not sure, the main reason is that they prefer to talk to a provider before starting or refilling birth control pills (46%), followed by safety concerns (20%). Among users of other contraceptive methods who say that they would be unlikely to use an OTC oral contraceptive or are not sure, the main reason is that they do not use or plan to use birth control pills (55%), followed by a preference for talking to a provider before starting or refilling birth control pills (15%).

Reasons for being unlikely to or unsure about using OTC oral contraception vary by contraceptive use status

Among reproductive age females who say they would be unlikely to use OTC birth control pills without a prescription, or who are not sure, 17% of those ages 18-25 cite safety concerns as the main reason compared to 9% of those ages 36-49 (Table 2). A larger share of those ages 18 to 25 (25%) cites a preference to talk to a health care provider before starting or refilling birth control than those ages 36-49 (14%). Seventeen percent of Black and Asian/Pacific Islander females say that they have safety concerns, higher than the share of White females (10%) who have the same concern.

Not using or planning to use birth control pills is the main reason why females would not be likely to use over-the-counter birth control pills

Among reproductive age females who report being likely to use OTC birth control pills, two in five (39%) would be willing and able to pay $1-$10 per month for them (Table 3). One-third (34%) would be willing and able to pay $11-$20 per month and 16% would pay more than $20. One in ten (11%) say they are unwilling or unable to pay anything for OTC birth control pills. Currently, most private insurance plans and Medicaid are required to cover the full cost of prescribed contraceptives.

Among those who say they are likely to use OTC birth control pills, 17% of oral contraceptive users say they would be unwilling or unable to pay anything for them, compared to 7% of contraceptive non-users. Nearly one in five (21%) uninsured females would pay more than $20 per month. Notably, there are no statistically significant differences by income level.

Majority of those likely to use over-the-counter oral contraception  would be willing/able to pay up to $20/month; one in ten unwilling/unable to pay anything

Looking Forward

There is broad support among females for an OTC oral contraceptive pill, and many are likely to use it. However, likely users are cost-sensitive, with only one in six willing and able to pay more than $20 per month for it and one in ten not willing or able to pay anything for it.

At the federal level, the Affordable Care Act requires most private health insurance plans to cover FDA-approved contraception for women; however, it must be prescribed in order for it to be covered. The most recent guidance about ACA implementation, issued by the Departments of Labor and Health and Human Services, and the Treasury in July 2022, states that plans and issuers are encouraged to cover OTC emergency contraceptive products with no cost sharing when they are purchased without a prescription, but the guidance does not currently require it.

At the state level, nine states currently require health plans regulated by the state, including fully-insured employer plans and individual plans, to cover OTC contraceptive medications without cost sharing, and without a prescription from a health care provider (three of those state laws apply to emergency contraception only). While no-cost coverage of prescription contraceptives has been required under Medicaid for decades, only six states and DC report covering OTC emergency contraception without a prescription in their Medicaid programs.

The pharmaceutical company that submitted an FDA application to switch from prescription-to-OTC status has not yet made price information publicly available. In addition to the retail cost, which will be an important consideration for those not using insurance, should a daily oral contraceptive pill become available OTC, accessibility and uptake will also depend on whether private health insurance and Medicaid cover it without a prescription.

Aside from the cost issues, many reproductive age women say they would still prefer to talk to a health care provider before starting or refilling birth control and others say they would still have safety concerns. These findings indicate that outreach and education will also play an important role in helping women understand their options in using an OTC oral contraceptive pill should the FDA approve the change in status.

This work was supported in part by Arnold Ventures. KFF maintains full editorial control over all of its policy analysis, polling, and journalism activities.

Methodology

Overview

The 2022 KFF Women’s Health Survey is a nationally representative survey of 6,442 people ages 18 to 64, including 5,201 females (self-reported sex at birth) and 1,241 males, conducted from May 10, 2022, to June 7, 2022. The objective of the survey is to help better understand respondents’ experiences with contraception, potential barriers to health care access, and other issues related to reproductive health. The survey was designed and analyzed by researchers at KFF (Kaiser Family Foundation) and fielded online and by telephone by SSRS using its Opinion Panel, supplemented with sample from IPSOS’s KnowledgePanel.

This work was supported in part by Arnold Ventures. KFF maintains full editorial control over all of its policy analysis, polling, and journalism activities.

Questionnaire design

KFF developed the survey instrument with SSRS feedback regarding question wording, order, clarity, and other issues pertaining to questionnaire quality. The survey was conducted in English and Spanish. The survey instrument is available upon request.

Sample design

The majority of respondents completed the survey using the SSRS Opinion Panel (n=5,202), a nationally representative probability-based panel where panel members are recruited in one of two ways: (1) through invitations mailed to respondents randomly sampled from an Address-Based Sample (ABS) provided by Marketing Systems Group through the U.S. Postal Service’s Computerized Delivery Sequence. (2) from a dual-framed random digit dial (RDD) sample provided by Marketing Systems Group.

In order to have large enough sample sizes for certain subgroups (females ages 18 to 35, particularly females in the following subgroups: lesbian/gay/bisexual; Asian; Black; Hispanic; Medicaid enrollees; low-income; and rural), an additional 1,240 surveys were conducted using the IPSOS KnowledgePanel, a nationally representative probability-based panel recruited using a stratified ABS design.

Data collection

Web Administration Procedures

The majority of surveys completed using the SSRS Opinion Panel (n=5,056) and all of the surveys completed using the KnowledgePanel (n=1,240) were self-administered web surveys. Panelists were emailed an invitation, which included a unique passcode-embedded link, to complete the survey online. In appreciation for their participation, panelists received a modest incentive in the form of a $5 or $10 electronic gift card. All respondents who did not respond to their first invitation received up to five reminder emails and panelists who had opted into receiving text messages from the SSRS Opinion Panel received text message reminders.

Overall, the median length of the web surveys was 13 minutes.

Phone Administration Procedures

In addition to the self-administered web survey, n=146 surveys were completed by telephone with SSRS Opinion Panelists who are web reluctant. Overall, the median length of the phone surveys was 28 minutes.

Data processing and integration

SSRS implemented several quality assurance procedures in data file preparation and processing. Prior to launching data collection, extensive testing of the survey was completed to ensure it was working as anticipated. After the soft launch, survey data were carefully checked for accuracy, completeness, and non-response to specific questions so that any issues could be identified and resolved prior to the full launch.

The data file programmer implemented a “data cleaning” procedure in which web survey skip patterns were created in order to ensure that all questions had the appropriate numbers of cases. This procedure involved a check of raw data by a program that consisted of instructions derived from the skip patterns designated on the questionnaire. The program confirmed that data were consistent with the definitions of codes and ranges and matched the appropriate bases of all questions. The SSRS team also reviewed preliminary SPSS files and conducted an independent check of all created variables to ensure that all variables were accurately constructed.

As a standard practice, quality checks were incorporated into the survey. Quality control checks for this study included a review of “speeders,” reviewing the internal response rate (number of questions answered divided by the number of questions asked) and open-ended questions. Among all respondents, the vast majority (97%) answered 96% or more of the survey questions they received, with no one completing less than 91% of the administered survey (respondents were informed at the start of the survey that they could skip any question).

Weighting

The data were weighted to represent U.S. adults ages 18 to 64. The data include oversamples of females ages 18 to 35 and females ages 36 to 64. Due to this oversampling, the data were classified into three subgroups: females 18 to 35, females 36 to 64, and males 18 to 64. The weighting consisted of two stages: 1) application of base weights and 2) calibration to population parameters. Each subgroup was calibrated separately, then the groups were put into their proper proportions relative to their size in the population.

Calibration to Population Benchmarks

The sample was balanced to match estimates of each of the three subgroups (females ages 18 to 35, females ages 36 to 64, and males ages 18 to 64) along the following dimensions: age; education (less than a high school graduate, high school graduate, some college, four-year college or more); region (Northeast, Midwest, South, West); and race/ethnicity (White non-Hispanic, Black non-Hispanic, Hispanic-born in U.S., Hispanic-born Outside the U.S., Asian non-Hispanic, Other non-Hispanic). The sample was weighted within race (White, non-Hispanic; Black, non-Hispanic; Hispanic; and Asian) to match population estimates. Benchmark distributions were derived from 2021 Current Population Survey (CPS) data.

Weighting summaries for females ages 18 to 35, females ages 36 to 64, and males ages 18 to 64 are available upon request.

Finally, the three weights were combined, and a final adjustment was made to match the groups to their proper proportions relative to their size in the population (Table 1).

Combined Weights, Sex by Age

Margin of Sampling Error

The margin of sampling error, including the design effect for subgroups, is presented in Table 2 below. It is important to remember that the sampling fluctuations captured in the margin of error are only one possible source of error in a survey estimate and there may be other unmeasured error in this or any other survey.

Design Effects and Margins of Error by Demographic Group

KFF Analysis

Researchers at KFF conducted further data analysis using the R survey package, including creating constructed variables, running additional testing for statistical significance, and coding responses to open-ended questions. The survey instrument is available upon request.

Rounding and sample sizes

Some figures in the report do not sum to totals due to rounding. Although overall totals are statistically valid, some breakdowns may not be available due to limited sample sizes or cell sizes. Where the unweighted sample size is less than 100 or where observations are less than 10, figures include the notation “NSD” (Not Sufficient Data).

Statistical significance

All statistical tests are performed at the .05 confidence level. Statistical tests for a given subgroup are tested against the reference group (Ref.) unless otherwise indicated. For example, White is the standard reference for race/ethnicity comparisons and private insurance is the standard reference for types of insurance coverage. Some breakouts by subsets have a large standard error, meaning that sometimes even large differences between estimates are not statistically different.

A note about sex and gender language

Our survey asked respondents which sex they were assigned at birth, on their original birth certificate (male or female). They were then asked what their current gender is (man, woman, transgender, non-binary, or other). Those who identified as transgender men are coded as men and transgender women are coded as women. While we attempted to be as inclusive as possible and recognize the importance of better understanding the health of non-cisgendered people, as is common in many nationally representative surveys, we did not have a sufficient sample size (n >= 100) to report gender breakouts other than men and women with confidence that they reflect the larger non-cisgender population as a whole. The data in our reproductive health reports use the respondent’s sex assigned at birth (inclusive of all genders) to account for reproductive health needs/capacity (e.g., ever been pregnant) while the data in our other survey reports use the respondent’s gender.

Endnotes

  1. Respondents were asked their sex assigned at birth as well as their gender identity. This brief presents data on respondents who said they were assigned female at birth and includes all gender identities, including transgender, non-binary, and others. ↩︎
  2. The federal poverty level (FPL) in 2022 for an individual is $13,590. ↩︎
News Release

Most Women are in Favor of Making Birth Control Pills Available Over the Counter without a Prescription if Research Shows they are Safe and Effective

A Substantial Share of Women with Private Insurance are Paying for Some or All of the Cost of their Contraceptives Indicating Plans May Not Be Complying with the Affordable Care Act

Published: Nov 3, 2022

A new KFF survey finds that more than three-quarters (77%) of females ages 18-49 favor making birth control pills available without a doctor’s prescription if research shows they are safe and effective. Among those who favor making birth control pills available over the counter and who currently use prescription oral contraception, 60% say they would be likely to use over-the-counter birth control pills. Most say the main reason is convenience (59%).

Many females who would be unlikely to use over-the-counter birth control pills (46%) or are unsure (14%) say the main reason is they don’t currently use birth control pills nor plan to use them in the future (53%). Among those who use oral contraception, the main reason is they would prefer to talk to a provider before starting or refilling their birth control. Other reasons include concerns about safety, cost, and health insurance coverage.

While the Affordable Care Act (ACA) has required most insurance plans to cover prescription contraceptives at no cost to patients for over a decade, 41% of females ages 18-49 are unaware of this requirement. One-quarter of these females with private insurance say they paid at least part of the cost of their contraceptive care out-of-pocket. A growing number of reports note that some insurance plans are failing to comply with the ACA’s contraceptive coverage requirement, which has been scaled back through regulations and court decisions.

These survey findings come as the U.S. Food and Drug Administration decides whether to approve a progestin-only oral contraceptive pill (Opill) for over-the-counter status, making it as accessible as pain relievers and allergy medications.

Periodically conducted since 2001, the 2022 KFF Women’s Health Survey includes a nationally representative sample of 5,201 people who say they were assigned female at birth (including those who identify as women or other genders). Our analyses present the state of contraceptive access and preferences, including differences in contraceptive use and experiences by income, race and ethnicity, and insurance status.

Additional findings include:

  • The vast majority of females ages 18-64 (90%) have used contraceptives at some point in their reproductive years, and most have used more than one contraceptive method throughout their lifetime (76%).
  • Most females get their birth control care at a doctor’s office (77%) and prefer to get their care there, even as more services have become available online. Clinics and health centers remain an essential source of contraceptive care, particularly for those who have low incomes (18%) or are uninsured (23%).
  • One in five uninsured females say they had to stop using a birth control method because they couldn’t afford it.
  • One-quarter of females aren’t using their preferred method of contraception, with many raising concerns about side effects and affordability. Only 30% of females say they received all the information they needed before choosing their birth control method.
  • One in four females either don’t know emergency birth control pills are available over the counter or have never heard of them. Among those who have heard of emergency birth control pills and could become pregnant, three in ten (31%) say they don’t know where they could get them.

Learn more about the 2022 Women’s Health Survey findings in the report “Contraception in the United States: A Closer Look at Experiences, Preferences, and Coverage” and the brief “Interest in Using Over-the-Counter Oral Contraceptive Pills.”

Contraception in the United States: A Closer Look at Experiences, Preferences, and Coverage

Published: Nov 3, 2022

Executive Summary

Contraceptive care is an important component of overall health care for many people. Federal and state policies shape access to and the availability of contraceptive care, but factors such as provider characteristics, as well as individual preferences and experiences also impact contraceptive choices and use. This report provides a close examination of reproductive age (18-49) females’ (including those who identify as women and other genders) experiences with contraception, insurance coverage, contraceptive preferences, and interactions with the health care system based on an analysis of the 2022 KFF Women’s Health Survey, a nationally representative survey of females ages 18 to 64 in the U.S.

Use of Contraceptives

The majority of females 18 to 64 (90%) have used contraception at some point in their reproductive years and many have used more than one contraceptive method throughout their lifetime (76%). People’s needs and preferences for different types of methods can change and speaks to the importance of having a broad range of contraceptive options available. Not surprisingly, most people use contraception to prevent pregnancy (85%), but four in ten also say that they use contraception for another reason such as managing a medical condition or preventing a sexually transmitted infection (STI).

Not all people who want to prevent pregnancy use contraceptives. One in six (17%) sexually active females who say they are not trying to get pregnant are not using contraception. There are many reasons why people may not use contraceptives, ranging from concerns about side effects, lack of desire to use a method, to those who aren’t trying but would not mind if they got pregnant or have religious reasons.

Contraceptive Coverage

Although the ACA has required contraceptive coverage for over a decade, many still do not know about the policy and some privately insured females are still paying for their contraceptives. Four in ten (41%) females of reproductive age do not know that most insurance plans are required to pay the full cost of birth control for women.

While most females (70%) with private insurance say their insurance covered the full cost of their most recent birth control method, a quarter say they paid at least part of the cost out-of-pocket. Of those who paid out of pocket, 16% say it was because they wanted a certain brand of contraception that was not covered by their plan (even though their plan should cover it if their provider recommends it for them). Others say it is because their prescribing provider (10%) or pharmacy (5%) was out of network. Half did not know why they had to pay.

Cost can be a barrier to contraceptive use for some. One in five uninsured females of reproductive age say they had to stop using a contraceptive method because they couldn’t afford it. A smaller share of those on Medicaid (6%) or with private coverage (3%) cited cost as a barrier to continued use. For low-income women, 17% said cost was the leading reason they weren’t using their preferred method. 

Contraceptive Preferences and Side Effects

Overall, one quarter of females who are using contraception are not using their preferred method. The leading reason for this is concern about side effects, a theme that comes up in many aspects of contraceptive care. Almost one-third of contraceptive users (31%) say they are experiencing side effects from their current method, and just over half (52%) say the side effects are more severe than they expected.

Just 30% of females say they received all the information they needed before choosing their birth control method. This is even lower among Asian/Pacific Islander females, just 12% of whom say they had all the information they needed before choosing a method, compared to more than a quarter of Hispanic (26%) and Black (28%) females and one-third of White females (34%). Person-centered contraceptive counseling is a key element to assuring people can select the contraceptive method that suits them. However, only 40% of those receiving contraceptive care rate their most recent contraceptive counseling as “excellent.”

Accessing Contraception

The majority of reproductive age females get their birth control care at a doctor’s office (77%) and prefer to get their care there, even as more services have become available online with growing numbers of online contraception platforms. Many also rely on clinics and health centers for their care, particularly those who are low-income, uninsured, Black or Hispanic. Far fewer (7%) have received a prescription or obtained a health care service from an online company in the prior 12 months. Convenience is the main reason those who would prefer to get their birth control care from an online company cite for their preference.

Emergency contraceptive pills (EC) are an effective form of back up birth control, but a sizable minority of people who might benefit from them don’t know where to get them or that they’re available over the counter. Emergency contraceptive pills, which can be taken to prevent pregnancy after a contraceptive failure or unprotected sex, have been available over the counter for more than 15 years. One in four reproductive age females (27%) either don’t know EC pills are available over the counter or have never heard of them. Among those who have heard of EC pills and could become pregnant, three in ten (31%) don’t know where they could get it.

Not only was there a lack of awareness about where to get emergency contraceptive pills, but even before the Supreme Court overturned Roe v. Wade, few knew where they could get an abortion if they needed one. Prior to the ruling in Dobbs, just one-quarter (26%) of females ages 18-49 said they knew what clinic or health care provider they could go to for an abortion if they wanted or needed one. Smaller shares of females living in rural areas, where services are more limited, knew where they could go to get an abortion compared to females living in more urban areas (16% vs. 28%).

Access to abortion and contraception continues to remain at the center of policy debates across the nation. Not only has abortion access been banned in many states, but access to effective methods to prevent pregnancy, like emergency contraceptive pills and long-acting reversible contraception (such as IUDs), may also become restricted. Doctors and health care providers are trusted sources of information for many people, which means they could play an important role in filling information gaps and addressing misinformation. While the ACA preventive services coverage requirement has markedly improved the affordability of contraceptives, the policy is being challenged yet again in the courts by those who object to preventive services such as contraception on religious or moral grounds. The outcomes of these debates, along with state, federal and private sector actions will continue to shape the availability and use of contraceptive care for millions in the years to come.

This work was supported in part by Arnold Ventures. KFF maintains full editorial control over all of its policy analysis, polling, and journalism activities.

Findings

Introduction

Contraceptive care is an important component of overall health care for many people. Federal and state policies shape access to and the availability of contraceptive care, but factors such as provider characteristics, as well as individual preferences and experiences also impact contraceptive choices and use. For most people, private coverage and Medicaid greatly reduce or eliminate financial barriers to contraceptive care, but access to contraceptive services is still limited in many parts of the U.S. with more than 19 million women living in contraceptive deserts where they may not have access to a health center offering the full range of contraceptive methods. The federal Title X family planning program aims to provide quality contraceptive care to low-income and uninsured females across the country, but not all are reached.

The public programs that subsidize contraceptive services and coverage expansions for contraception under private insurance and Medicaid aim to expand access to contraception. In addition, there have been more efforts to broaden contraceptive availability outside of traditional clinical settings, including through commercial apps, state efforts to allow pharmacists to prescribe birth control, and growing momentum toward gaining FDA approval for over-the-counter (OTC) oral contraception without a prescription.

The recent Supreme Court decision in Dobbs v. Jackson Women’s Health Organization, eliminating the federal standard for abortion access brings new salience to and reinforces the importance of access to effective and affordable contraception, particularly for those who live in states that seek to ban abortion.

This brief provides new information about the state of contraceptive access for females in the US, with the goal of better understanding the factors that influence use and experiences with contraceptive care. From May 10 to June 7, 2022, prior to the Dobbs decision, KFF partnered with SSRS to field the 2022 KFF Sexual and Reproductive Health Survey. The survey, developed and analyzed by KFF staff, is a nationally representative survey of 5,201 females (self-reported sex at birth) and 1,241 males ages 18 to 64. SSRS conducted the field work for the survey, with most respondents answering online and a small share by telephone. The sample was drawn from two nationally representative, probability-based survey panels – the SSRS Opinion Panel and IPSOS’s KnowledgePanel. The sample was constructed to ensure sufficient sample sizes for analysis of key groups of interest, including females who are Black, Hispanic, Asian/Pacific Islander, low-income, covered by Medicaid, lesbian, gay, or bisexual, and living in rural areas. The data were weighted to represent U.S. adults ages 18 to 64, based on benchmarks from the U.S. Census Bureau’s Current Population Survey. See the methodology section for more information.

Individuals were asked about their sex at birth as well as their gender identity. To be as inclusive as possible to all those who use contraceptive methods regardless of their gender identity, this brief presents data on individuals who responded their sex at birth was female, including those who identify as cisgender women and those who identify as a different gender such as transmen and other gender nonbinary individuals. The survey covers several aspects of reproductive health and well-being, including access, coverage, and utilization of health care outside of sexual and reproductive health. This brief presents survey findings on females’ experiences using contraception, including access, payment, as well as their preferences and concerns regarding different methods and care.

(Back to Top)

Use of Contraceptives

Most sexually active females ages 18-49 are using some form of contraception. When looking at the profile of sexually active reproductive age females, 15% report that either they or their most recent sexual partner have a medical condition that makes it impossible for them to ever get pregnant (15%), while 9% are pregnant or trying to get pregnant. Two-thirds of females ages 18-49 say they are using some form of contraception (65%) and 12% report not using contraception (Figure 1).

The Majority of Sexually Active Reproductive Age Females Use Contraception

Among females who are using contraception, six in ten (61%) say they use contraception only to prevent pregnancy, but almost one-quarter (24%) say they use contraception both to prevent pregnancy and some other reason (Figure 2). One in seven (15%) use contraception solely for a reason not related to preventing pregnancy such as managing a medical condition or preventing a sexually transmitted infection (STI).

Among Females Who Use Contraception, Most Use It to Prevent Pregnancy but Many Also Use Contraception for Other Reasons

Most reproductive age females who are not actively trying to get pregnant say it is important to them to prevent pregnancy. However, one in five say avoiding pregnancy is not a priority.It is often assumed that pregnancy prevention is a priority for women who are not actively trying to get pregnant, but that is not always the case. Among females ages 18-49 who are not currently trying to get pregnant, the majority say it is very important (63%) or somewhat important (11%) for them to avoid becoming pregnant in the next month, but one in five (22%) females say it is not very important or not important at all (Figure 3). (Note that this survey was conducted before Roe v. Wade was overturned and this share could have changed now that abortion is no longer available in many states.)

Conversely, among females who are who are capable of becoming pregnant, not trying to get pregnant, and not using contraception, over half (57%) say that it is very important or somewhat important for them to avoid pregnancy. These data speak to the fact that some females may not have found a method that meets their needs or that they can access. In addition, there are others who are not necessarily trying to get pregnant but may be open to having a pregnancy and may not want to use contraception for reasons ranging from prior personal experiences, lack of acceptable contraceptive options, or religious beliefs.

Avoiding Pregnancy Is Very Important for the Majority of Reproductive Age Females

More than eight in ten sexually active females who are not currently pregnant and capable of becoming pregnant use contraception, but one in six do not. The majority (83%) of sexually active reproductive age females who are able to conceive, not currently pregnant nor trying to become pregnant report using at least one method of contraception in the past 12 months (Figure 4). However, one in six (17%) report that they do not use contraception and are not trying to conceive. More than a quarter (27%) of Black females in this group report that they are not using contraception compared to one in five (21%) Hispanic females, 17% of Asian/Pacific Islander females, and 13% of White females. Nearly one in four (23%) uninsured females and those with Medicaid coverage (22%) report not using contraception compared to 14% of females with private insurance (employer-sponsored and individual). Similarly, 23% of females with low incomes report not using contraception compared to 14% of individuals with higher incomes.

The Majority of Reproductive Age Females Capable of Becoming Pregnant Use Contraception, But One in Six Do Not

Among reproductive age females who are able to conceive and are not pregnant or trying to become pregnant who are not using contraception, four in ten they say it is because they did not want to use birth control (42%). One in three females who are not currently using contraception report concern about side effects (32%), and one in five (22%) say they don’t really mind if they become pregnant (Table 1). Fourteen percent say that they do not think they could get pregnant and about one in ten couldn’t find a method they were satisfied with (11%) or don’t know which birth control they want to use (9%). Four percent say “some other reason”, and responses include having medical conditions that made it difficult to take birth control or using withdrawal.

Table 1: There Are Many Reasons Why Some Reproductive-Age Females Do Not Use Birth Control

Among those that currently use contraception, condoms, oral contraception, and IUDs are the most commonly used methods. When looking at current contraceptive use (in the prior 12 months), one-third of reproductive age females report using oral contraceptives (33%) and condoms (32%) (Table 2). One in five report using IUDs (19%). Larger shares of younger female contraceptive users ages 18-25 report using all contraceptive method types compared to older female contraceptive users ages 36-49, except for IUDs where the largest share of users are females ages 26-35. For all age groups, oral contraceptives and condoms are the most frequently used methods. One in seven females (15%) across all age groups reports using fertility-awareness based methods to avoid pregnancy in the past 12 months.

Table 2: The Types of Reversible Contraception That Females Use Change Over the Course of Their Reproductive Years

Fewer than half of people say they used contraception including condoms the last time they had sex.Four in ten (42%) reproductive age females and males (41%) say they used contraception, including condoms, the last time they had sex. Use of a contraceptive method at last sex is lower among females (38%) and males (38%) who are married or living with a partner, compared to just over half (52%) of females and nearly half (47%) of males who are not married or living with a partner (Figure 5).

A Majority of People Discussed Birth Control or Condom Use With Their Partners: Many Used Birth Control the Last Time They Had Sex, but Fewer Used Condoms

Overall, 17% of females say their partner used a condom the last time they had sex, and 22% of males report using a condom. This differs significantly by whether someone is married or living with a partner compared to not. In addition to preventing pregnancy, condoms are also effective in reducing the risk of transmission of STIs. Males who are married or living with a partner are almost twice as likely to use a condom than males who are widowed, divorced, separated, or never married (32% vs. 18%). Thirteen percent of females who are married or living with a partner say their partner used a condom the last time they had sex compared to 27% of females who are widowed, divorced, separated, or never married.

When asked if they had discussed birth control or condom use with their most recent sexual partner, the majority of males (69%) and females (72%), regardless of partner status, say they discussed with their partner.

Nine in ten females (90%) report using contraception at some point in their lifetime and most (76%) use more than one type of contraception across their lifespan.Contraceptive preferences often change throughout one’s reproductive years. On average, females use 2.7 different contraceptive methods throughout their lifetime. Seven in ten females (71%) ages 18-64 say they have used oral contraceptives, including a larger share of females ages 36-64 (Table 3). Male condoms are the second most frequently used contraceptive among females ages 18-64 (65%). Among younger females ages 18-35, higher shares have used implants and emergency contraception compared to females overall. Switching to different contraceptive methods is common, reinforcing the importance of access to the full range of contraceptive methods without financial barriers. Also, because contraceptive needs can change over one’s reproductive lifespan; what works in one’s twenties may not be what is best for them in their thirties or forties.

Table 3: The Majority of Females Ages 18-64 Have Used Oral Contraceptives and Male Condoms in Their Lifetime

The types of contraceptive methods females use also can differ by race/ethnicity groups (Table 4). Smaller shares of Asian/Pacific Islander females (8%) report being sterilized compared to White females (24%). However, similar shares of both White (18%) and Asian/Pacific Islander (15%) females report relying on a partner’s vasectomy for contraception. One in four (25%) Black females report using injectable contraception in their lifetime compared to only 15% of White females. There are not significant differences in intrauterine device (IUD) lifetime use, but larger shares of Black (11%) and Hispanic (11%) females report using contraceptive implants compared to White females (7%). Black and Hispanic females are also less likely to say they have used condoms and more likely to say they have used fertility-awareness based methods compared to White females.

The Contraceptive Methods Used by Females Differ Widely by Race/Ethnicity

(Back to Top)

Accessing Contraception

The majority of reproductive age females get their birth control care at a doctor’s office, but distribution of site of care differs by race/ethnicity, insurance coverage, and income. Overall, more than three in four females using contraception (77%) had their most recent birth control care visit at a doctor’s office (Figure 6). One in ten (11%) went to a clinic like Planned Parenthood, another family planning clinic or a community health care, or a walk-in clinic, such as an urgent care center or clinic inside a store. Less than one in ten females (8%) got their birth control care at a pharmacy or drug store or some other place and just 3% had their most recent visit through an online birth control website or app like Nurx, The Pill Club, or Hims or Hers.

Among Females Who Used Contraception in the Past 12 Months, Most Got Their Birth Control Care at a Doctor’s Office, but Nearly One in Five Black, Hispanic, and Low-Income Women Went to a Clinic

Larger shares of Black (17%) and Hispanic (18%) females got their most recent birth control care at a clinic compared to White females (7%). Similarly, larger shares of uninsured females (23%) and females with Medicaid coverage (18%) went to clinics compared to those with private insurance (8%).

When asked where they would prefer to get their birth control care, most females say a doctor’s office, but this varies by income and insurance. Two-thirds (67%) of reproductive age females say that if they could go anywhere for birth control care, they would choose a doctor’s office (Figure 7). About one in ten would choose a clinic (12%), online (9%), or another location, such as a pharmacy or drug store (12%). While majorities across all groups would choose a doctor’s office, about one in five females who are Black (19%), Hispanic (18%), low-income (17%), uninsured (21%), and covered by Medicaid (19%) would choose a clinic as their preferred site of contraceptive care. Preferences may be influenced by where people usually seek care or where they can get affordable care.

Most Females Would Prefer to Get Their Birth Control Care at a Doctor’s Office, but This Varies by Race/Ethnicity, Income, and Insurance Type

Females have several options for where to receive their birth control care, however, there is not always alignment between the site they prefer and the site they end up using. Six in ten females (59%) who used contraception in the past 12 months get their birth control care at their preferred location. Among females who prefer to receive their birth control care at a doctor’s office, 90% received their most recent care at a doctor’s office (Figure 8). However, only 49% of females who prefer to receive their birth control care at a clinic received their care there. Just over a third (36%) of females who prefer to receive their birth control at a pharmacy or drug store received their care there, and just about one-quarter (24%) of females who prefer to receive their birth control care through an online birth control website or app actually receive their most recent care through one (Figure X).

Females also report different reasons for preferring one setting over another for contraceptive care. Most people who prefer doctor’s offices say they choose it because that’s where they usually go (36%) or they trust the providers there (37%). Similarly, people who prefer clinics say they choose it because they trust the providers (28%), convenience (24%), and it’s where they usually go (22%). A large majority who prefer a pharmacy or drug store (71%) or online birth control app (88%) as their site of care say convenience is the reason.

(Back to Top)

Online Provision of Contraception

In recent years, there has been growth in companies, such as Nurx, The Pill Club, Roman, or hims/hers, which are online prescribing platforms or apps that operate outside of the traditional medical care system to provide a variety of primary care services, including contraception. While there have been reports of an influx of customers to these apps in recent years, particularly during the pandemic, they still serve only a small fraction of contraceptive users.

Overall, 7% of females ages 18-49 say they have received a prescription or obtained a health care service from one of these companies in the prior 12 months. Among this group, the majority have received birth control (condoms or prescription birth control) (52%). A smaller share of users obtained other services or products, including anxiety medications (12%), acne medications (7%), and mental health care/therapy (6%) (Figure 9). Common reasons for accessing health care services through an online prescribing platform include management of a chronic condition, including medications, as well as treatment for infections.

Among females who most recently obtained contraception from an online platform or app, 80% are under the age of 36, half (50%) are White, and more than one-third have low incomes (35%) (Figure 10).

Most online contraception platforms accept some form of insurance for some services and products, although not all companies accept both private insurance and Medicaid. Over half of reproductive age females who have received contraception through an online platform say their insurance, Medicaid, or some other public program covered the full cost of the service they received through the online prescribing platform or app (52%). Theoretically, they would be eligible for no cost coverage of their contraceptive visits and method if they went to an in-network provider. However, over half report paying out-of-pocket for at least some of the service (54%). This includes 13% whose insurance covered part of the cost and they paid the rest; 8% who had insurance, but it did not cover the product and they ended up paying out-of-pocket; and 8% who had coverage for the product, but the online platform didn’t accept it and they paid for it themselves. Fifteen percent said they didn’t have any insurance and paid the full amount of the service and product.

(Back to Top)

Contraceptive Supply

One-third (33%) of hormonal contraceptive users say they have missed taking their birth control because they were not able to get their next supply on time. This share is higher among Black females (39%) compared to White females (31%) and those with low incomes (38%) compared to those with higher incomes (30%). This was a problem for nearly half (46%) of uninsured females and four in ten (41%) females with Medicaid (Figure 11). Studies have documented the importance of ensuring people have adequate contraceptive supply in adherence to their contraceptive method.

One Third of Hormonal Contraceptive Users Have Missed Taking Their Birth Control Because They Weren’t Able to Get Their Next Supply

There has been a growing interest in making an extended supply of contraceptive pills and other hormonal methods available to those who use them. However, many females are still only getting one to two months' supply at time. Overall, about one third of females who used oral contraceptives got a one- or two-month supply. This share was higher among Black females, as well as those with low incomes, and those with Medicaid coverage (Figure 12).

The Vast Majority of Oral Contraceptive Users Receive Fewer Than 6 Packs at a Time

Research has shown that best practice is to offer oral contraceptive users an extended supply, and some states now require their state-regulated plans to cover a 12-month supply of contraceptives. However, few females get a 12-month supply. Furthermore, only 14% of females who have used birth control pills in the past 12 months say their health care provider or pharmacist talked to them about receiving a 12-months or 12-pack supply of pills at one time. Larger shares of Hispanic (24%), Black (26%), uninsured (33%), females with Medicaid (19%), and females with low incomes (23%) say their health care provider or pharmacist talked to them about receiving a 12-month or 12-pack supply of pills at one time than their counterparts (Figure 13).

Only One in Seven Oral Contraceptive Users Say Their Health Care Provider Talked to Them About Receiving a 12-month Supply of Pills

(Back to Top)

Contraceptive Coverage

The ACA requires that most private plans cover contraceptive services for females without cost-sharing – this includes patient education and counseling and FDA approved methods of contraception with a prescription. This provision has dramatically reduced cost-sharing for contraception among females with employer or individual insurance market plans.

Among those using contraception in the past 12 months, seven in ten females with private insurance report that their insurance covered the full cost of their contraceptive method (70%), but 25% say they paid at least part of the cost out-of-pocket (Figure 14). There are a number of reasons that someone might have to pay part of the cost for contraceptives even though they have private coverage. For example, someone could be using a brand-name contraceptive that is not in the plan’s formulary or they are unaware of or not offered a generic alternative. Some people paying out-of-pocket could also be receiving care out-of-network or still be enrolled in a grandfathered health insurance plan, which is exempt from the requirement. However, half (50%) of this group do not know why they had to pay part of the cost out-of-pocket. Sixteen percent say they had to pay part of the cost themselves because they wanted a certain brand of contraception that was not covered by their plan (even though their plan should cover it if their provider recommends it for them). Some say it is because their prescribing provider (10%) or pharmacy (5%) was out of network, and one in five say it is for some other reason. Just one in five females who paid part of the cost out-of-pocket say that a health care provider or pharmacist offered them a no-cost alternative. Among those who had partial coverage for contraception and paid the rest out-of-pocket, almost one-third (32%) paid less than $15, almost one in five (19%) paid between $15 and $24, and one-third (37%) paid $25 or more (Figure 14).

Many people do not know that insurance plans are required to cover contraceptives for females. Although the ACA’s requirement for most private insurance plans to cover the cost of contraceptives for women took effect over ten years ago, many people are still not aware of it of this requirement. Four in ten reproductive age females (41%) do not know that plans are required to contraceptives for women.  Conversely, while there is no federal requirement for coverage of vasectomies, three in ten males incorrectly believe there is (Figure 15).

While Most People Know Contraceptive Coverage Requirements, a Substantial Share Do Not Know the Policy

No cost contraceptive coverage has helped alleviate cost barriers to contraceptives for many people, yet some still experience problems with getting their plan to cover their method in full. Six percent of reproductive age females with some form of coverage who used contraception in the past year report that they encountered problems getting their plan to cover or pay the full cost of their prescription birth control. Notably, a higher share of Black females, 11%, say they had problems getting their plan to cover or pay the full cost of their prescription birth control compared to 5% of White females.  Of those who had problems, just 29% appealed the decision to their insurance company, even though federal rules require insurance companies to have a process for their enrollees to appeal contraceptive coverage denials.

The cost of contraceptives remains a barrier for some, even limiting their ability to continue their method. For those who are uninsured, costs can pose an even greater barrier. One in five uninsured females of reproductive age say they had to stop using a contraceptive method because they couldn’t afford it (Figure 16). This was also the case for nearly one in ten females who are Hispanic (9%) or make less than 200% of the federal poverty level (9%). Without coverage or access to free or low-cost services, uninsured females are faced with having have to pay out of pocket for contraceptives, use a method they do not prefer, or go without contraception altogether. Among females who say they had to stop using a method due to affordability problems, many (60%) did let their health care provider know, but nearly four in ten (38%) did not.

One in Five Uninsured Females Had to Stop Using A Birth Control Method Because They Couldn’t Afford It

(Back to Top)

Quality of Care/Contraceptive Counseling

Just three in ten (30%) reproductive age contraceptive users say they had all the information they needed to choose a contraceptive method. Side effects from contraception are a major concern for females. When asked what information they would have liked to have had before starting on their current method, nearly four in ten (38%) contraceptive users say impact on menstruation and bleeding, 30% say impact on sex, and over half (52%) say other side effects associated with the method (Table 5). Other top informational needs are how long you can use the method (31%) and effectiveness (28%). In addition, a higher share of younger females than older females say they would have liked information on how easy it is to stop using a contraceptive and how soon you can get pregnant after stopping it.

Table 5: Many Contraceptive Users Would Like Information About Side Effects Before Choosing Their Method

While 35% of females ages 36-49 say that they did not need any additional information, this was the case for only 24% of females ages 18-25. A higher share of females ages 18-25 than females ages 36-49 would have liked information on how easy it is to stop using a contraceptive and how soon you can get pregnant after stopping it.

Across race/ethnicity groups, side effects associated with the method is the leading informational need. About half of White (51%), Black (50%), and Hispanic (48%) females would have liked to know about side effects before choosing a contraceptive method, while two-thirds of Asian/Pacific Islander females (67%) say they wished they had that information. Just 12% of Asian/Pacific Islander females say they had all the information they needed before choosing a method, compared to more than a quarter of Hispanic (26%) and Black (28%) females and one-third of White females (34%).

Health care providers are the main source of information about possible side effects from birth control for over half (57%) of reproductive-age females who use contraception (Figure 17). Fewer rely on written materials (17%) or a website (17%). When asked their preferred source for information about birth control side effects, three in four (74%) say doctors and health care providers. Although many (52%) say they would have wanted additional information about side effects, most females who have had a recent provider visit and use contraception (62%) say that their provider had talked to them about possible side effects before they started their current method. Providers often have limited time to counsel patients, which can leave patients without the information they want to make an informed decision about contraception.

Most Reproductive-Age Females Want to Get Information About Contraceptive Side Effects From Health Care Providers

Almost one-third of contraceptive users (31%) say they are experiencing side effects from their current method, and just over half (52%) say the side effects are more severe than they expected. Among those experiencing side effects, more than four in ten report mood changes (48%), weight gain (47%), and changes in periods (44%) (Figure 18). Eight in ten (80%) say they experienced more than one of these side effects. Just over half (54%) say they have talked to their health care provider about these side effects.

Among Females Experiencing Side Effects from Contraception, Almost Half Report Mood Changes and Weight Gain

Only four in ten females report receiving person-centered counseling that is rated excellent on all dimensions.

Interactions with providers play an important role in the quality of contraceptive care, as providers are the main source of information that people have when making a decision about their birth control and understand potential side effects. While there has been considerable emphasis on prioritizing access to the most effective methods, there is also growing recognition of the importance of ensuring that patient-provider relationships are patient-centered and support patient decision making in the context of contraceptive counseling. Approximately 40% of female contraceptive users rate their most recent contraceptive care provider as “excellent” on all four items of person-centered contraceptive counseling (Figure 19): respecting them as a person, letting them say what mattered to them about their birth control method, taking their preferences about their birth control seriously, and giving them enough information to make the best decision about their birth control. Uninsured females and females receiving contraceptive counseling at clinics compared to private doctor’s offices are less likely to rate their care as excellent.

Uninsured Females and Females Visiting Clinics Compared to Private Doctor’s Offices Are Less Likely to Say They Received Excellent Care Across a 4-Item Measure of Person-Centered Contraceptive Counseling

While most people are using their preferred method of contraception, a sizable minority -- one in four contraceptive users -- are not. Another important component of high-quality contraceptive counseling is taking seriously patients’ preferences and letting them say what matters to them about their birth control method. When asked if they would use a different method than the one they are using, three in four contraceptive users say “no”, but one in four (24%) say “yes.” Higher shares of Hispanic females (30%) and females with lower incomes (29%) are not using their preferred method, compared to their counterparts (Figure 20).

One Quarter of Females Aren’t Using Their Preferred Contraceptive

Among females who are not using their preferred contraceptive method, one in four say the primary reason is concern about side effects (25%). About one in ten say they can’t afford their preferred method (12%), their preferred method was not available (11%), their partner does not want them to use their preferred method (10%), or their provider recommended a different method (9%). However, there are some differences by age, race/ethnicity and income level (Table 6). One in three younger females ages 18-25 (33%) cites side effects as the primary reason they aren’t using their preferred method, compared to one in five females ages 36-49 (19%). About one in ten say they can’t afford their preferred method (12%), their preferred method was not available (11%), their partner does not want them to use their preferred method (10%), or their provider recommended a different method (9%). Notably, 17% percent of females with lower incomes say that they aren’t using their preferred method because they can’t afford it compared to 7% of females with higher incomes, and 15% of females with higher incomes say they aren’t using their preferred method because their partner objects to it compared to 3% of females with lower incomes.

Table 6: Concern About Side Effects Is the Leading Reason That Females Are Not Using Their Preferred Contraceptive Method

Most sexually active, reproductive age females are not familiar with contraceptive methods that have recently come to the market. In recent years, the FDA has approved some new contraceptive options, some of which are designed to have fewer side effects. However, awareness of these newer methods is low. Just over one in five (22%) sexually active females has heard some or a lot about Annovera, a vaginal ring that is effective for up to one year approved by the FDA in 2018 (Figure 21). Phexxi is a novel contraceptive vaginal gel that received FDA approval in 2020, but just over one in ten (13%) females has ever heard anything about it. A higher share of females (45%) has heard a lot or some about Natural Cycles, an app that can be used to track the menstrual cycle and identify fertile periods and was cleared by the FDA as a medical device in 2018. A higher share of younger females ages 18-35 than those ages 36-49 report having heard at least something about Annovera (24%, 20% respectively) and the Natural Cycles app (51%, 38% respectively) (data not shown).

Most Sexually Active Females Have Not Heard About Some of the Newer Contraceptive Methods

Nearly one-third of reproductive age females (31%) don’t know where to get emergency contraceptive pills (EC), a backup for missed birth control or contraceptive failure. EC pills, also called the morning after pill or Plan B, are a form of backup birth control that can be used within three to five days of unprotected sex or contraceptive failure to prevent pregnancy. Progestin only pills such as Plan B and its generic equivalents have been available over the counter (OTC) for many years, while another EC pill with a different chemical formulation, ella, (ulipristal acetate) requires a prescription and has a longer window of time that it is effective after unprotected sex. EC pills are not the same as medication abortion pills (mifepristone and misoprostol) and do not end a pregnancy nor cause an abortion.

Over one in four females ages 18-35 (27%) and 37% of those ages 36-49 do not know where they could obtain EC pills if they wanted it in the near future (Figure 22). Lack of knowledge about where to get EC pills is higher among females living in rural areas (40%) compared to those who live in urban/suburban areas (30%). While Plan B is an OTC drug, studies have found that access in pharmacies can be limited, particularly in rural communities.

Nearly One-third of Reproductive-age Females Do Not Know Where to Get Emergency Contraception Pills if They Wanted or Needed It

More than one in four reproductive age females are not aware that some EC pills are available over the counter without a prescription. Since EC must be taken soon after sex, over the counter availability can help people obtain it more quickly. Seven in ten (73%) reproductive age females know that some EC pills are available over the counter without a doctor’s prescription, but 19% do not know that and 8% have not heard of EC (Figure 23). This could affect their ability to obtain EC in a timely manner.

More Than One in Four Reproductive Age Females Are Not Aware That Some Emergency Contraceptive Pills Are Available Over the Counter Without a Prescription

Among those who have used EC recently, most obtained it without a prescription and had to pay for it out of pocket. Among reproductive age females who have used EC in the prior 12 months, more than eight in ten (81%) obtained it without a prescription (Figure 24). Most also reported that they had to pay for it out of pocket (82%). On average, Plan B pills can range from $10-$50 when purchased over the counter, which may be unaffordable for many young people.

The Majority of Females Who Obtained Emergency Contraception Did So Without a Prescription and Paid Out-of-Pocket

(Back to Top)

Abortion Knowledge Prior to the Dobbs Decision

Access to contraception intersects with abortion policy, especially now in the aftermath of the Supreme Court decision in Dobbs v. Jackson Women’s Health Organization, which eliminated the federal right to an abortion. The decision whether to ban or permit abortion is now largely up to state policymakers and there is increasing evidence that some states may also move to limit access to contraceptives like IUDs and emergency contraception.

This survey finds that approximately one in four (27%) females ages 18-64 say they have had an abortion during their lifetime, similar to findings in other studies. Abortions can be conducted by medical procedures or by medication. Medication abortion, which are pills that can be taken at home, is approved by the FDA for use up to 10 weeks gestation, and now accounts for more than half of abortions nationally.

In this survey, which was conducted shortly before the ruling in Dobbs, six in ten reproductive age females (61%) had heard of medication abortion, while 39% had not. Awareness was lower among some groups (Figure 25), including Hispanic females, females with low incomes, those living in rural communities and in the South, where abortion availability is more limited than in other parts of the country.

Prior to the Ruling in  Dobbs, Six in Ten Reproductive Age Females Had Heard of Medication Abortion

Prior to the ruling in Dobbs, just one-quarter (26%) of females ages 18-49 said they knew what clinic or health care provider they could go to for an abortion if they wanted or needed one. A relatively small share of reproductive age females knew where they could obtain abortion if they needed one, and while half (51%) said they did not know a specific place where they could get an abortion but knew where they could get the information, that has likely become more difficult since the Dobbs ruling. Abortion is now outlawed in many states and in some states, there is ongoing litigation. Ongoing court rules have created a confusing and shifting patchwork of policies in many states across the country. Just prior to the Dobbs decision, nearly one in four (23%) females did not know where they could go and did not know where to find that information (Figure 26).

Before the Decision in Dobbs , Just One Quarter of Reproductive Age Females Knew Where They Could Obtain an Abortion if They Wanted or Needed One

Knowledge about abortion was higher among some groups. Compared to their White counterparts (25%), Black females (36%) were more likely to know what clinic or health care provider they could go to for an abortion if they wanted or needed one before the Dobbs ruling. The abortion rate in the U.S. is highest among Black women. A smaller share of females who live in rural areas (16%) compared to those living in urban/suburban areas (28%) knew where they could obtain an abortion. Rural areas have fewer abortion clinics than more populated areas.

(Back to Top)

Conclusion

Contraceptive care is a key component of one’s overall reproductive and sexual health care. Several factors go into ensuring people can obtain quality contraceptive care that is aligned with their personal preferences, including timeliness, efficiency, accessibility, affordability, equity, and patient-centeredness. The Affordable Care Act and Medicaid expansion, as well as state policies to ensure people have adequate contraceptive supply, have increased access to affordable and high-quality contraceptive care for many. New avenues for expanding contraceptive access and choices continue to grow through online platforms, as well as new methods and formulations that give people more contraceptive options.

Despite these efforts to improve accessibility and coverage, many of those we surveyed continue to report problems affording and accessing contraceptive care, and a sizeable minority of females are not using the method they prefer. Side effects, problems with insurance, inadequate supply, and other factors still affect whether people are obtaining the contraceptive care that they desire and seek. Health care providers are the most trusted source for information on contraception, and while there has been greater emphasis on patient centered care, many people still report that the quality of care falls short and that they do not have enough information to make an informed decision about their birth control method.

Sexual and reproductive health continues to remain at the center of many polarized policy debates at the state and federal levels. The coverage requirement for contraception and other preventive sexual health services is being challenged yet again in the courts by those who object to these services on religious or moral grounds. Furthermore, the loss of the federal standard protecting the right to abortion and action by many states to ban abortion could lead to limits on access to other sexual and reproductive health services, like effective methods of contraception, particularly emergency contraception and IUDs. The outcomes of these debates, along with state, federal and private sector actions will undoubtedly shape the availability and use of contraceptive care for millions in the years to come.

This work was supported in part by Arnold Ventures. KFF maintains full editorial control over all of its policy analysis, polling, and journalism activities.

Methodology

Overview

The 2022 KFF Women’s Health Survey is a nationally representative survey of 6,442 people ages 18 to 64, including 5,201 females (self-reported sex at birth) and 1,241 males, conducted from May 10, 2022, to June 7, 2022. The objective of the survey is to help better understand respondents’ experiences with contraception, potential barriers to health care access, and other issues related to reproductive health. The survey was designed and analyzed by researchers at KFF (Kaiser Family Foundation) and fielded online and by telephone by SSRS using its Opinion Panel, supplemented with sample from IPSOS’s KnowledgePanel.

This work was supported in part by Arnold Ventures. KFF maintains full editorial control over all of its policy analysis, polling, and journalism activities.

Questionnaire design

KFF developed the survey instrument with SSRS feedback regarding question wording, order, clarity, and other issues pertaining to questionnaire quality. The survey was conducted in English and Spanish. The survey instrument is available upon request.

Sample design

The majority of respondents completed the survey using the SSRS Opinion Panel (n=5,202), a nationally representative probability-based panel where panel members are recruited in one of two ways: (1) through invitations mailed to respondents randomly sampled from an Address-Based Sample (ABS) provided by Marketing Systems Group through the U.S. Postal Service’s Computerized Delivery Sequence. (2) from a dual-framed random digit dial (RDD) sample provided by Marketing Systems Group.

In order to have large enough sample sizes for certain subgroups (females ages 18 to 35, particularly females in the following subgroups: lesbian/gay/bisexual; Asian; Black; Hispanic; Medicaid enrollees; low-income; and rural), an additional 1,240 surveys were conducted using the IPSOS KnowledgePanel, a nationally representative probability-based panel recruited using a stratified ABS design.

Data collection

Web Administration Procedures

The majority of surveys completed using the SSRS Opinion Panel (n=5,056) and all of the surveys completed using the KnowledgePanel (n=1,240) were self-administered web surveys. Panelists were emailed an invitation, which included a unique passcode-embedded link, to complete the survey online. In appreciation for their participation, panelists received a modest incentive in the form of a $5 or $10 electronic gift card. All respondents who did not respond to their first invitation received up to five reminder emails and panelists who had opted into receiving text messages from the SSRS Opinion Panel received text message reminders.

Overall, the median length of the web surveys was 13 minutes.

Phone Administration Procedures

In addition to the self-administered web survey, n=146 surveys were completed by telephone with SSRS Opinion Panelists who are web reluctant. Overall, the median length of the phone surveys was 28 minutes.

Data processing and integration

SSRS implemented several quality assurance procedures in data file preparation and processing. Prior to launching data collection, extensive testing of the survey was completed to ensure it was working as anticipated. After the soft launch, survey data were carefully checked for accuracy, completeness, and non-response to specific questions so that any issues could be identified and resolved prior to the full launch.

The data file programmer implemented a “data cleaning” procedure in which web survey skip patterns were created in order to ensure that all questions had the appropriate numbers of cases. This procedure involved a check of raw data by a program that consisted of instructions derived from the skip patterns designated on the questionnaire. The program confirmed that data were consistent with the definitions of codes and ranges and matched the appropriate bases of all questions. The SSRS team also reviewed preliminary SPSS files and conducted an independent check of all created variables to ensure that all variables were accurately constructed.

As a standard practice, quality checks were incorporated into the survey. Quality control checks for this study included a review of “speeders,” reviewing the internal response rate (number of questions answered divided by the number of questions asked) and open-ended questions. Among all respondents, the vast majority (97%) answered 96% or more of the survey questions they received, with no one completing less than 91% of the administered survey (respondents were informed at the start of the survey that they could skip any question).

Weighting

The data were weighted to represent U.S. adults ages 18 to 64. The data include oversamples of females ages 18 to 35 and females ages 36 to 64. Due to this oversampling, the data were classified into three subgroups: females 18 to 35, females 36 to 64, and males 18 to 64. The weighting consisted of two stages: 1) application of base weights and 2) calibration to population parameters. Each subgroup was calibrated separately, then the groups were put into their proper proportions relative to their size in the population.

Calibration to Population Benchmarks

The sample was balanced to match estimates of each of the three subgroups (females ages 18 to 35, females ages 36 to 64, and males ages 18 to 64) along the following dimensions: age; education (less than a high school graduate, high school graduate, some college, four-year college or more); region (Northeast, Midwest, South, West); and race/ethnicity (White non-Hispanic, Black non-Hispanic, Hispanic-born in U.S., Hispanic-born Outside the U.S., Asian non-Hispanic, Other non-Hispanic). The sample was weighted within race (White, non-Hispanic; Black, non-Hispanic; Hispanic; and Asian) to match population estimates. Benchmark distributions were derived from 2021 Current Population Survey (CPS) data.

Weighting summaries for females ages 18 to 35, females ages 36 to 64, and males ages 18 to 64 are available upon request.

Finally, the three weights were combined, and a final adjustment was made to match the groups to their proper proportions relative to their size in the population (Table 1).

Combined Weights, Sex by Age

Margin of Sampling Error

The margin of sampling error, including the design effect for subgroups, is presented in Table 2 below. It is important to remember that the sampling fluctuations captured in the margin of error are only one possible source of error in a survey estimate and there may be other unmeasured error in this or any other survey.

Design Effects and Margins of Error by Demographic Group

KFF Analysis

Researchers at KFF conducted further data analysis using the R survey package, including creating constructed variables, running additional testing for statistical significance, and coding responses to open-ended questions. The survey instrument is available upon request.

Rounding

Some figures in the report do not sum to totals due to rounding. Although overall totals are statistically valid, some breakdowns may not be available due to limited sample sizes or cell sizes. Where the unweighted sample size is less than 100 or where observations are less than 10, figures include the notation “NSD” (Not Sufficient Data).

Statistical significance

All statistical tests are performed at the .05 confidence level. Statistical tests for a given subgroup are tested against the reference group (Ref.) unless otherwise indicated. For example, White is the standard reference for race/ethnicity comparisons and private insurance is the standard reference for types of insurance coverage. Some breakouts by subsets have a large standard error, meaning that sometimes even large differences between estimates are not statistically different.

A note about sex and gender language

Our survey asked respondents which sex they were assigned at birth, on their original birth certificate (male or female). They were then asked what their current gender is (man, woman, transgender, non-binary, or other). Those who identified as transgender men are coded as men and transgender women are coded as women. While we attempted to be as inclusive as possible and recognize the importance of better understanding the health of non-cisgendered people, as is common in many nationally representative surveys, we did not have a sufficient sample size (n >= 100) to report gender breakouts other than men and women with confidence that they reflect the larger non-cisgender population as a whole. The data in our reproductive health reports use the respondent’s sex assigned at birth (inclusive of all genders) to account for reproductive health needs/capacity (e.g., ever been pregnant) while the data in our other survey reports use the respondent’s gender.

News Release

Updated Brief on Racial Disparities in Maternal and Infant Health

Published: Nov 1, 2022

An updated KFF issue brief on racial disparities in maternal and infant health includes new and updated analysis of data on pregnancy-related mortality, birth risks and infant mortality. The brief reviews the underlying factors contributing to maternal and infant health racial disparities, ranging from historical and ongoing racism to differences in access to health care and coverage and other social and economic factors that drive health.

With recent attention to this issue by federal and state policymakers, there are ongoing efforts to address the problem. The American Rescue Plan expanded access to and helped stabilize Medicaid coverage during the postpartum period, which many states have adopted. Other approaches include better data collection, better utilization of evidenced-based practices and diversifying the health workforce.

Looking forward, the overturning of Roe v. Wade is leading to increased barriers to abortion. This policy change may contribute to an increase in racial disparities in maternal and infant health and should be monitored.

News Release

Two New KFF Analyses Show That a Relatively Small Share of Medicare Beneficiaries Compared Plan Options Or Switched Plans During a Recent Open Enrollment Period

Published: Nov 1, 2022

As Medicare’s annual open enrollment period gets underway, two new analyses from KFF suggest that a relatively small share of the nation’s 65 million Medicare beneficiaries will shop around among the many coverage options for 2023 or switch plans. That decision could have a significant impact on enrollees’ coverage and costs.

Results from one new KFF analysis show that only 3 in 10 beneficiaries (29%) compared their current plan with other Medicare plans offered during the open enrollment period for 2020.

The share of beneficiaries reviewing their coverage options was even lower among certain subgroups, including beneficiaries with lower incomes (15%); enrolled in both Medicare and Medicaid (16%); age 85 or older (18%); Hispanic (19%); or under age 65 with disabilities (22%).

A second KFF analysis finds that few beneficiaries choose to switch plans during open enrollment, regardless of whether they are enrolled in Medicare Advantage or traditional Medicare. For instance, among people in Medicare Advantage plans with prescription drug coverage, only 1 in 10 beneficiaries enrolled in such plans voluntarily switched plans for 2020. Among beneficiaries in in traditional Medicare with a stand-alone drug plan, only 2 in 10 opted for a different plan during open enrollment.

(This analysis excluded beneficiaries who receive low-income subsidies for Part D coverage because they have a more limited set of choices and because some are auto-assigned to new plans every year by the government.)

Coverage and costs vary widely among both Medicare Advantage plans and Part D prescription drug plans. From one year to the next, plans can change their premiums, cost-sharing requirements, and scope of covered drugs and supplemental benefits, as well as provider networks or prior authorization requirements. These changes could lead to unexpected and avoidable costs, and disruptions in care for beneficiaries who stay put and do not at least review their options annually, as the Centers for Medicare & Medicaid Services (CMS) recommended.

Despite year-to-year changes in Medicare Advantage plans, about half (54%) of all Medicare Advantage enrollees reviewed their current plan for potential changes in premiums or other out-of-pocket costs for coverage in 2020, while the other half did not, according to the study. The same share (54%) reported they reviewed their current plan for potential changes in the kinds of treatments, drugs, and services that would be covered in the following year.

The analysis also finds Medicare’s official information resources are not widely used, especially the 1-800-MEDICARE helpline. Just under half of beneficiaries (49%) reported that they had read all or part of the Medicare & You handbook, and 44 percent said that they (or someone on their behalf) had visited the Medicare.gov website. Only 29 percent said they had called the helpline.

The two new KFF analyses are based on Medicare beneficiary survey and claims data from the Centers for Medicare & Medicaid Services.

For these and other Medicare-related data and analyses, including our Medicare Open Enrollment FAQs and our updated Overview of the Medicare Part D Prescription Drug Benefit, visit kff.org. The Medicare open enrollment period runs from October 15 through December 7.

Medicare Beneficiaries Rarely Change Their Coverage During Open Enrollment

Published: Nov 1, 2022

During the annual open enrollment period that runs from October 15 through December 7, the 65 million Medicare beneficiaries in traditional Medicare and Medicare Advantage are encouraged to compare their current coverage to other options in their area to see if they could save money or get better coverage for their needs by switching. The coverage offered by Medicare Advantage drug plans and stand-alone drug plans for beneficiaries in traditional Medicare varies across plans and from year to year. Plans can make changes that impact enrollees’ premiums, out-of-pocket costs, access to medications, and provider and pharmacy networks. The rate of plan switching could signal that beneficiaries are taking advantage of the annual opportunity to improve their coverage or lower their costs.

This analysis examines the share of Medicare beneficiaries who switched their coverage during the open enrollment period for 2020, as well as trends in the rate of switching going back to 2008. Specifically, we look at enrollees in Medicare Advantage prescription drug plans (MA-PDs) and traditional Medicare beneficiaries enrolled in stand-alone Part D prescription drug plans (PDPs), excluding enrollees who receive Medicare Part D low-income subsidies (LIS). We exclude LIS enrollees because they have a more limited set of premium-free PDP choices and because some are auto assigned to new plans every year by CMS (see methods box for more information).

Most Medicare Beneficiaries with Medicare Advantage or Stand-Alone Prescription Drug Coverage Did Not Switch Between 2019 and 2020

Among the 11.3 million Medicare Advantage enrollees in 2019, 10 percent (1.2 million) voluntarily switched plans during the open enrollment period for 2020. Among the relatively small share of MA-PD enrollees who switched plans, most enrolled in another MA-PD (1.1 million or 10% of all MA-PD enrollees), while a very small share switched to traditional Medicare and enrolled in a PDP (54,155 or less than 1% of MA-PD enrollees).

A larger share of traditional Medicare beneficiaries enrolled in PDPs than enrollees in MA-PDs voluntarily switched plans during the open enrollment period for coverage in 2020 (21% vs 10%). Among the 13.1 million PDP enrollees, 18 percent (2.3 million) switched to another PDP and 3 percent (438,000) switched to a MA-PD for coverage in 2020 (Figure 1). The larger share of PDP enrollees than MA-PD enrollees voluntarily switching plans during the open enrollment period is likely due to changes to the lineup of Humana PDPs between 2019 and 2020, which would have required many enrollees to pay substantially higher premiums in 2020 unless they switched plans.

Most Medicare Advantage and Part D Prescription Drug Plan Enrollees Did Not Switch Plans Between 2019 and 2020

Between 2008 and 2020, A Small Share of Medicare Advantage and Prescription Drug Plan Enrollees Switched Plans During the Annual Open Enrollment Period

Across the 13 annual open enrollment periods we examined for coverage in 2008 through 2020, a small, and relatively constant share of MA-PD enrollees voluntarily switched plans, ranging from 6 percent to 12 percent. Between 2008 and 2020, the share of traditional Medicare beneficiaries enrolled in a PDP that voluntarily switched plans was slightly higher, but also relatively constant, ranging from 10 percent to 13 percent, with a large spike (to 21%) in the open enrollment period for 2020 (Figure 2). As explained above, this one-year increase is likely due to changes to Humana’s PDP offerings for that year.

A Small Share of Enrollees in Medicare Advantage and Prescription Drug Plans Voluntarily Switched Coverage During Each of the Annual Open Enrollment Periods For Coverage in 2008 through 2020

The Share of Medicare Beneficiaries Who Switch Medicare Advantage or Prescription Drug Plans Generally Declines with Age

Among Medicare beneficiaries enrolled in a Medicare Advantage or stand-alone prescription drug plan, those in their mid to late sixties were more likely to voluntarily switch plans during the annual open enrollment period than older beneficiaries. Among the MA-PD enrollees, 11 percent of those ages 65 to 69 switched plans in 2020, compared to 7 percent of those age 85 and older. The age differences were even larger for the PDP enrollees in 2020. One-quarter (25%) of PDP enrollees ages 65 to 69 switched plans in 2020 compared to 11 percent of those ages 85 and older (Figure 3). (The age difference was considerably smaller the year before but followed the same pattern, with 15% of PDP enrollees ages 65 to 69 switching plans compared to 8% of those ages 85 and older.)

Among Seniors, A Smaller Share of Older Medicare Enrollees in Medicare Advantage and Prescription Drug Plans Voluntarily Switched Coverage During the 2019 Open Enrollment Period

Discussion

During the Medicare open enrollment period for 2020, Medicare beneficiaries had an average of 24 Medicare Advantage prescription drug plans and 28 stand-alone Part D prescription drug plans to choose from for their coverage. Despite having so many Medicare options, relatively few Medicare private plan enrollees opted to switch their coverage. The decision to keep their current plan could indicate that most Medicare private plan enrollees were satisfied with their coverage and costs. It could also indicate that enrollees were unaware of potentially substantial differences across plans, or changes to their current plan, that could impact their coverage, out-of-pocket costs, access to medications, and access to providers and/or pharmacies. The low rates of voluntary switching may also suggest that enrollees in Medicare Advantage and stand-alone prescription drug plans find it too difficult or confusing to compare plans, consistent with KFF analysis finding that most Medicare beneficiaries do not review their coverage during the open enrollment period.

The relatively low rate of switching is consistent with “stickiness”, or the tendency for people to stay enrolled in the same health insurance or prescription drug plan year after year, even when other, and potentially better options, are available. The even lower rates of switching among older beneficiaries may suggest that people are less able or willing to compare plans and switch coverage as they age, even though the potential benefits of switching plans may be greater for enrollees as they grow older given that health care needs and costs tend to increase with age. By staying put, older beneficiaries may be more likely than younger beneficiaries to face higher costs or forego improved coverage that could better meet their needs.

One goal of offering some or all Medicare benefits through private plans is that competition between plans allows beneficiaries to choose the combination of cost and coverage that best fit their needs and preferences. And in the current annual open enrollment period for coverage in 2023, most Medicare beneficiaries continue to face a plethora of options. However, a truly competitive market can only be achieved if beneficiaries are willing and able to compare plans on an annual basis to see if there is a better option and then switch plans. The somewhat higher rate of switching among PDP enrollees during the open enrollment period for 2020, which was likely driven by changes to the premiums for one of the largest stand-alone drug plans, suggests that enrollees are responsive to price changes of a large magnitude. But the relatively low rate of overall plan switching that we observe over several years calls into question the premise of competition and choice that, in theory, underlies the Medicare private plan marketplace.

Jeannie Fuglesten Biniek, Juliette Cubanski, and Tricia Neuman are with KFF. Anthony Damico is an independent consultant.

Methods

This analysis uses the Centers for Medicare & Medicaid (CMS) Master Beneficiary Summary File, five percent sample of beneficiaries for 2007 to 2016 and twenty percent sample for 2017 to 2020. We examine plan enrollment in December of year 1 (for example, 2019) and January of year 2 (for example, 2020), to identify beneficiaries who switched plans during the annual open enrollment period. An enrollee whose plan exits the market and is not crosswalked into a plan but who has to sign up for a different plan is considered an involuntary switcher. An enrollee whose plan exits the market and is crosswalked into a plan is counted in the “did not switch” category since this beneficiary did not take voluntary action to switch plans.

This analysis focuses only on enrollees who switch plans during the annual Medicare open enrollment period for the coming plan year. Certain Medicare beneficiaries have other opportunities outside of the annual open enrollment period to change their plan or coverage. Examining switching rates during the open enrollment period produces somewhat lower estimates of the rate of switching than looking over the entire calendar year.

The analysis of switching rates excludes: (1) people with end-stage renal disease (ESRD) because they were generally not allowed to enroll in Medicare Advantage plans during the years we analyzed; (2) people in plans sponsored by unions or former employers because they typically cannot switch plans and maintain their retiree health benefits; (3) people who died in the year of the open enrollment period; (4) beneficiaries who switched into traditional Medicare without Part D or a Medicare Advantage plan that does not offer the Part D drug benefit (MA-only plans); (5) beneficiaries not enrolled in both Medicare Parts A and B as of November in the year of open enrollment; and (6) low-income subsidy enrollees, who face different enrollment decisions than non-LIS enrollees due to having a more limited set of PDP choices (i.e., premium-free “benchmark” plans) in order to avoid paying a premium, and because many in PDPs are auto-assigned to new plans every year by CMS; they were excluded from the analysis of Medicare Advantage plan switching to conform with the PDP analysis. As with other Medicare Advantage analyses, we also exclude people enrolled in cost plans, HCPPs, PACE plans, and MMPs.

What is at Stake for Medicaid in Supreme Court Case Health & Hospital Corp v. Talevski?

Published: Oct 28, 2022

On November 8th, the U.S. Supreme Court is scheduled to hear oral arguments in Health & Hospital Corporation of Marion County (HHC) v. Talevski. The case raises the issue of whether Medicaid beneficiaries can seek relief in federal court when they believe their rights are being violated by state officials, or whether enforcement of state compliance with federal Medicaid rules should be left solely to the federal Centers for Medicare and Medicaid Services (CMS). While the case is about Medicaid, there could be implications for other federal programs beyond Medicaid where states play a role in administering or implementing them. This policy watch explains the case and what is at stake with the Supreme Court decision.

What is the Talevski Case?

Gorgi Talevski’s family filed a lawsuit against the Health and Hospital Corp of Marion County, Indiana (HHC) (a municipal corporation and political subdivision of the state that operates nursing facilities) alleging that his nursing facility’s use of psychotropic drugs as chemical restraints, involuntary transfers and attempted involuntary discharge to a dementia facility violated the Federal Nursing Home Reform Act (FNHRA). FNHRA establishes the minimum standards of care to which nursing-home facilities must follow to participate in the Medicaid program. The Talevski family sued using a federal law known as Section 1983, which parties have used for decades to enforce certain federal rights.

The family argues that “FNHRA’s rights against chemical restraint and involuntary discharge and transfer are enforceable under Section 1983 and that an adverse ruling would be disastrous for federal safety-net programs”. A federal district court dismissed the case, ruling that Medicaid enrollees cannot enforce the FNHRA. The Talevski family appealed, and the Seventh Circuit Court of Appeals reversed the district court, allowing the Talevski case to continue. HHC petitioned to have the case heard by the Supreme Court. On May 2, 2022 the Supreme Court granted the petition for certiorari and the Supreme Court will hear oral arguments on November 8, 2022.

The Court will consider two questions. The first is broadly whether the Court should reexamine its longstanding position that individuals have a right to sue in federal court to protect rights for legislation created under the Spending Clause of the constitution (e.g., federal laws including Medicaid, the Children’s Health Program, and the Supplemental Nutrition Assistance Program (SNAP)). The second, more narrow question, is assuming that individuals do have enforceable rights, are the rights guaranteed under FNHRA enforceable.

How Does Enforcement of Medicaid Requirements Work Now?

Under current law, states administer Medicaid within broad federal guidelines. There are generally two ways in which state compliance with federal requirements is enforced – through oversight from the Centers for Medicare and Medicaid Services (CMS) and through litigation in federal courts.

If CMS finds that a state is out of compliance with federal rules, the agency can work with the state to come into compliance. If states fail to come into compliance, CMS can provide notice of opportunity for a hearing and then move to withhold some or all federal matching funds until the state comes into compliance. However, the authority to withhold federal funds is rarely used because it is a very broad and blunt tool that could impede a states’ ability to come into compliance. One recent example of CMS working with a state: In July 2022, CMS used a mitigation plan to help address application processing times and backlogs of pending applications in Missouri. By September, officials responded that the state was in compliance with federal requirements for processing times. However, federal enforcement is generally not quick and the federal agency has discretion about when it steps in, unlike courts where a decision can result in immediate action.

While there is no private right of action in the Medicaid statute, a civil rights statute, Section 1983, has long provided a mechanism for individuals to enforce the rights provided to them under federal programs. There is a long history of litigation related to private enforcement of the Medicaid Act. While courts have affirmed the authority for individuals to use Section 1983 to protect Medicaid rights, the Supreme Court has issued decisions that have narrowed this authority. Currently there is a three pronged (pursuant to the cases Blessing v Freestone (1997)) and (Gonzaga University v. Doe (2002)) that courts use to evaluate whether a federal law establishes an enforceable right. The three factors that determine whether a statutory provision creates a privately enforceable right are: (1) whether the plaintiff is an intended beneficiary of the statute; (2) whether the plaintiff’s asserted interests are specific enough to be enforced; and (3) whether the statute imposes a binding obligation on the State.

Federal circuit courts have generally upheld private enforcement of rights for Medicaid enrollees (particularly in cases where the state has denied Early and Periodic Screening, Diagnostic and Treatment (EPSDT) benefits, enrollment, or care in the least restrictive setting). On the other hand, courts have also ruled that providers and enrollees do not have enforceable rights to sue for inadequate payment rates. The Courts of Appeal have issued conflicting rulings in cases brought by patients challenging a state’s decision to exclude Planned Parenthood from their Medicaid Program. The Court has previously refused to review multiple cases in which Planned Parenthood patients were found to have an enforceable right, but there is a petition currently pending.

In 2019 there were four circuit court opinions that all ruled in favor of beneficiaries right to enforce Medicaid provisions. However, during 2020, three of four circuit court decisions did not rule in favor of Medicaid enrollees, including in Planned Parenthood of Greater Texas v. Smith (2020), where the full 5th Circuit overruled a previous panel decision in Gee v. Planned Parenthood of Gulf Coast Inc. (2017) and concluded that that Medicaid patients do not have the right to challenge Texas’s decision to exclude Planned Parenthood from the state Medicaid program.

What is at Stake?

Numerous amicus briefs have been submitted in support of both parties. Indiana filed a brief joined by a number of other states, supporting Marion County and noting that that private rights of action can upset the dynamics of the state and federal administration of grant programs. The American Health Care Association and Indiana Health Care Association also filed an amicus brief supporting the county, arguing that Congress did not intend to create a private right action against public actors under Section 1983. The brief suggests it would create disparate treatment since private entities are not subject to damages under laws governing nursing facility participation in Medicare and Medicaid programs.

At the end of September, 25 amicus briefs were filed supporting Talevski. Briefs were filed by the National Health Law Program (NHeLP), other advocacy organizations, professors and scholars; population groups (including the AARP, American Cancer Society and Bazelon Center), provider groups (including public hospitals and community health centers), and federal officials (former HHS officials and former / current members of Congress). Both NHeLP and George Washington University compiled summaries of these briefs. Key points raised in these briefs include the following:

  • The case could overturn over five decades of judicial precedent and undermine Congressional intent that individuals are able to use federal courts to enforce rights under federal programs.
  • If enforcement is left to HHS, millions of Americans could be at risk because federal enforcement is not adequate due to limited capacity and funding.
  • A decision to limit the ability of individuals to sue in federal court could deprive millions of Medicaid enrollees access to care, including children who are entitled to comprehensive coverage under EPSDT benefit and those with chronic conditions, serious life-threatening diseases and people with disabilities.
  • The Court’s decision could affect the rights of millions of low-income Americans who rely on other Spending Clause programs, not just Medicaid.

What is Next?

The federal Solicitor General and the state of Indiana were granted approval to participate in oral arguments. The Supreme Court is currently scheduled to hear oral arguments for this case on November 8th and is expected to issue a ruling by the end of the term in June 2023. Separately, the Indiana Public Access Counselor issued an advisory opinion that HHC’s decision to petition the Supreme Court violated the state’s the Open Door law because HHC did not seek public input. Morgan Daly, the public policy director for the Indiana Statewide Independent Living Council, filed the open door complaint with the hope that the HHC board will hold a vote and potentially withdraw the petition. It is unclear how this will affect the case, which could have implications far beyond Marion County and Indiana.

Nine Changes to Watch in ACA Open Enrollment 2023

Authors: Cynthia Cox, Karen Pollitz, Krutika Amin, and Jared Ortaliza
Published: Oct 27, 2022

Note: For up-to-date information on what to watch for in the 2024 ACA Open Enrollment period, visit KFF’s new explainer.

The 2023 Affordable Care Act (ACA) Open Enrollment period marks the tenth year of Health Insurance Marketplaces opening their doors to new enrollees. This year’s open enrollment season will last from November 1, 2022 to January 15, 2023 in most states, longer in some state-based marketplaces. Even after a decade of operation, there continue to be changes in these markets. Keep an eye on:

1. Unsubsidized premiums will increase more than in past years

Heading into 2023, we estimate that ACA Marketplace benchmark premiums are increasing an average of 4% across all 50 states and DC (which is similar to government estimates of premium changes in just the states that use Healthcare.gov). State average benchmark premium changes range from a drop of -18% in Virginia to an increase of +15% in New Mexico.

The vast majority of Marketplace enrollees receive a subsidy and therefore are largely shielded from these increases, though, as we discuss more below, they may need to switch plans to take full advantage of the subsidies.

In our earlier analysis of 2023 insurer rate filings, we found that insurers cited rising prices and rebounding utilization as driving the bulk of these premium increases. Additionally, in our analysis of insurers’ financial performance last year, we found individual market insurer margins fell in 2021 after years of relatively flat margins; some insurers may have raised premiums to regain margins of prior years.

Although premium changes vary quite a bit from state to state, 2023 will mark the first time in several years when benchmark premiums are increasing on average nationwide. Back in 2018, insurers responded to the loss of cost-sharing subsidy payments and concerns over enforcement of the individual mandate or repeal of the ACA by raising premiums sharply. In retrospect, insurers may have over-corrected, as many ended up owing large rebates to consumers and a number of insurers lowered premiums in the subsequent years. The average unsubsidized silver benchmark premium for a 40-year-old was $481 in 2018, falling to $438 by 2022. We estimate the average 40-year-old would pay $456 for a silver benchmark premium in 2023 before accounting for the subsidy (a 4% increase from $438 in 2022). Bronze plan premiums are similarly increasing by about 4% and gold plan premiums are mostly steady at 2%.

2. Enhanced Marketplace subsidies continue and will reduce net premiums for most consumers

Expanded and enhanced marketplace premium subsidies, enacted under the American Rescue Plan Act (ARPA), took effect in 2021 and remain in effect for 2022. The recently passed Inflation Reduction Act (IRA) ensures that the ARPA’s subsidies continue without interruption for an additional three years, through 2025.

Just like the ARPA, the enhanced subsidies in the Inflation Reduction Act reduce costs across the board by further lowering payments for people who were already eligible for subsidies under the original ACA subsidy structure and by extending subsidy eligibility to middle-income people by removing the upper income limit on subsidies.

The subsidy now fully covers the cost of enrolling in the benchmark silver plan for consumers with income up to 150% of the federal poverty level (FPL). With the original ACA subsidy structure, consumers at 150% FPL ($20,385 for a single person in 2023, or $41,625 for a family of 4) had to pay about 4% of household income for the benchmark plan. By reducing premium contributions to $0 (or near $0), the Inflation Reduction Act essentially guarantees access to silver plans with generous cost sharing reductions that substantially reduce deductibles and copays.

The Inflation Reduction Act, like the ARPA before it, extends eligibility for premium tax credits to reach people with incomes over 400% FPL ($54,360 for a single person in 2023, or $111,000 for family of 4). Now these consumers must contribute no more than 8.5% of their income toward the benchmark silver plan. This change is especially beneficial to older marketplace consumers (50 and older) whose premiums are age-adjusted in most states and can be up to 3 times that of young adult premiums for the same policy. The average unsubsidized silver plan premium for a 60-year-old couple in 2023 is more than $1,900 per month in 2023. Under the original ACA subsidy structure, subsidies were unavailable to people with incomes above 400% FPL, meaning premiums for older enrollees could easily cost more than 20% of their household income. But now, premium payments are capped at no more than 8.5% of household income.

The KFF subsidy calculator helps people estimate the amount of financial assistance based on their age, income, family size, and zip code.

3. There may be more Marketplace enrollees renewing coverage than ever before

Marketplace enrollment reached a record high of 13.8 million people in 2022, with 12.5 million receiving a subsidy. Affordability gains due to expanded subsidies, as well as an extended enrollment period, and increased outreach and enrollment assistance all likely contributed to this result.

Individual market enrollment overall (including on and off exchange) also remains higher than before the ACA was implemented. It is likely ACA-compliant enrollment (both on- and off-Marketplace) is currently at a record high and that non-compliant enrollment is at a record low.

This means the 2023 open enrollment period may be the busiest yet, with more people renewing coverage than ever before.

Even so, millions of uninsured people are eligible for but not enrolled in subsidized marketplace plans. These uninsured individuals, including those eligible for zero-premium plans, disproportionately have a high school education or less, are Hispanic, young adults, live in rural areas, or lack internet access at home.

4. The infamous “family glitch” is fixed

Until this year, an estimated 5.1 million people were ineligible for marketplace subsidies because of the family glitch. Generally, people are ineligible for marketplace subsidies if they have an offer of “affordable” job-based coverage – including through a family member’s job. However, until 2023, the affordability of job-based coverage for a worker’s spouse and dependents only measured the premium contribution required for the worker’s self-only coverage. As a result, if an employer coverage offer met the affordability threshold (9.12% of income in 2023) for self-only coverage but not for family coverage, those family members were nonetheless considered to have an offer of “affordable” job-based health coverage and locked out of ACA marketplace subsidies. New rules will take effect for the 2023 coverage year, measuring the affordability of family coverage based on the worker’s premium contribution for family coverage. If that amount is more than 9.12% of household income in 2023, family members will have the option of buying health coverage through the Marketplace and will be eligible for premium tax credits based on their income.

5. Other Marketplace eligibility rules have been relaxed on HealthCare.gov

During the Trump Administration, insurance companies offering policies on HealthCare.gov were permitted to refuse to renew coverage for people who had fallen behind on premium payments. For 2023, that will no longer be the case.  People who fell behind on premium payments in 2022 (or even lapsed coverage due to nonpayment) will still be able to enroll in a 2023 policy offered by that insurer; and the binder payment (the January 2023 monthly premium payment) required to effectuate coverage cannot be applied to past-due premiums.

In addition, once Open Enrollment ends, people will continue to be able to sign up for Marketplace coverage mid-year if they have a qualifying life event (such as loss of other coverage, marriage or divorce, or a permanent move) using a 60-day special enrollment period (SEP). In HealthCare.gov states, people had been required to first complete a pre-enrollment verification process by providing documentation of their qualifying event that made them eligible for an SEP.  People who could not provide such documentation within 30 days often were denied the SEP.  Starting in 2023, HealthCare.gov will only require pre-enrollment verification for SEPs due to loss of other prior coverage. For other qualifying events (marriage, divorce, permanent move, etc.) people will be able to self-attest to their eligibility and proceed to enroll in coverage during their SEP.

6. New Insurers are entering the market and others are leaving

On average, consumers in HealthCare.gov states will have a choice of 6 to 7 qualified health plan issuers in 2023, which is similar to the number in 2022. In 2023, 92% of enrollees will have a choice of 3 or more qualified health plan issuers, up from 89% in 2022.

While insurers continue to enter, re-enter, or expand their footprints in 2023, others have scaled back. Bright Health is exiting the market, where it had been a low-cost insurer in several states.

In most states, if enrollees have not updated their application and plan selection for 2023, the marketplace may auto-re-enroll them in their current plan or a similar plan for the coming year. In recent Open Enrollment periods, about 4 in 10 returning marketplace participants were auto-re-enrolled.

However, passively renewing can sometimes put consumers at a disadvantage. If the enrollee’s benchmark plan changes from one year to the next, as is likely in 2023, the dollar value of the subsidy, which is tied to the cost of the benchmark plan, can also change. A person who was enrolled in the benchmark plan last year may no longer be enrolled in the 2023 benchmark plan and therefore may have to pay the difference in cost between their plan and the new benchmark plan. To take full advantage of their subsidy, Marketplace enrollees should actively shop each year to make sure they are in the best plan available to them.

The enhanced subsidies of the Inflation Reduction Act make active renewal particularly important for low-income enrollees who are eligible for $0 silver plans with low deductibles. Because of the way the subsidies are calculated, only the benchmark (second-lowest cost silver plan) and the lowest cost silver plan are $0. Enrollees of the third, fourth, and other higher-cost silver plans must pay the difference in cost between their plan and the benchmark plan. An enrollee who picked a $0 premium plan last year may find that their plan is no longer the lowest or second-lowest cost silver plan and therefore may find that they owe a premium payment in January.

Additionally, in the past, some consumers applied their premium tax credit to bronze plans in order to achieve a $0 premium bronze plan, but in so doing, they may not be taking full advantage of the new subsidies and may have given up access to cost sharing subsidies that are only available through silver plans. The maximum allowable out-of-pocket limit will increase from $8,700 in 2022 to $9,100 in 2023. Consumers will want to actively shop for plans to evaluate out-of-pocket cost changes in their plan.

8. More enrollment help will be available than in some past years

In HealthCare.gov states, funding for Navigators has been restored following years of substantial funding cuts averaging 84%. Navigators are trained enrollment experts, certified by the marketplace, who provide free help to individuals shopping for marketplace coverage and subsidies, or help signing up for Medicaid and CHIP. Fifty-nine] programs will be available in 2023, with more resources to serve consumers, including extended hours, remote assistance, and language translation services. The “Find Local Help” link on HealthCare.gov provides contact information and hours of operation for the nearest programs.

9. Low-income individuals will be able to sign up for Marketplace coverage year-round

Again this year, people with annual income up to 150% of FPL ($20,385 for a single person and $34,545 for a family of 3 in 2023) will be able to enroll in marketplace plans year-round. The new low-income SEP, first offered in 2022, will continue to be available this year. Everyone is strongly encouraged to sign up for 2023 coverage during Open Enrollment, if possible, to ensure coverage throughout the year. However, low-income people who miss this deadline will still be able to sign up. People who elect the low-income SEP will have new coverage start on the first day of the month after they sign up.

* * *

For more information about these and other changes, see the KFF Health Insurance Marketplace and ACA FAQs  (more than 200 are available in Spanish)