News Release

Analysis Reveals How Abortion Boosted Democratic Candidates in Tuesday’s Midterm Election

The Supreme Court Decision Overturning Roe v. Wade Disproportionately Motivated Democratic Voters, First-Time and Younger Voters, and Women under Age 50, Both Nationally and in Key States

Published: Nov 11, 2022

While inflation was clearly at the top of voters’ minds in this year’s midterm elections, the Supreme Court decision overturning Roe v. Wade played a significant role in motivating key voting blocs that likely contributed to the Democratic party’s stronger-than-expected performance, a new analysis of KFF’s supplemental questions on the Associated Press VoteCast survey of midterm voters.

About four in ten (38%) voters overall said that the Supreme Court decision ending the constitutional right to an abortion had a major impact on their decision about whether to vote in this year’s election. The share citing the decision as a major motivator was highest among Black women under age 50 (61%), Hispanic women under age 50 (58%), those who voted for Democratic Congressional candidates (56%), first-time voters (54%), voters under age 30 (53%), and those who said they were angry about the Supreme Court’s abortion decision (55%).

While the election results reflect voters’ views about individual candidates and other factors, in terms of issues, the analysis suggest that abortion worked as a counterweight to voters’ broader concerns about inflation, which favored Republican candidates.

Nationally, nearly half (47%) of all voters say the Court’s decision had a major impact on which candidates they supported in this election, including almost two-thirds (64%) of those who voted for Democratic House candidates.

The analysis shows similar patterns playing out in states with competitive Senate races and where voters faced abortion-related ballot initiatives.

In addition, the analysis suggests that abortion contributed to some Republicans voting for Democratic Senate candidates in key states. While relatively few Republicans identified the abortion decision as the single most important factor in their vote (about one in ten Republican voters), about a fifth of those that did in both Pennsylvania (21%) and Arizona (19%) voted for the Democratic Senate candidate. Though small as a share of total voters, these kinds of crossover votes may have mattered in these close races.

In those two states, as well as Georgia, Nevada and Wisconsin, which had competitive Senate and gubernatorial races, at least four in ten voters overall said the decision had a major impact on who they voted for.

In addition, in each of the four states with abortion-related ballot initiatives (California, Michigan, Kentucky and Vermont), about four in ten voters said the Supreme Court’s abortion decision played a major role in their decision to turn out to vote.

Among women voters under age 50, at least half say the decision played a major role in their decision to vote in the three states that passed ballot measures to amend the state’s constitution to establish an explicit right to abortion (55% in CA, 55% in MI, and 51% in VT). In Kentucky, where voters rejected an amendment declaring there was no right to an abortion, nearly half (45%) of women voters under age 50 say the decision played a major role in motivating them to vote.

The analysis draws on supplemental questions to the AP VoteCast survey that KFF added to provide a deeper look at the role of abortion in motivating both turnout and vote choice. The AP VoteCast is a national survey and 48 state surveys of 2022 midterm voters conducted by NORC at the University of Chicago for the AP and FoxNews beginning on Oct. 31 and concluding as polls close on Nov. 8, 2022, in English and Spanish.

Poll Finding

How The Supreme Court’s Dobbs Decision Played In 2022 Midterm Election: KFF/AP VoteCast Analysis

Published: Nov 11, 2022

Findings

Key Findings

While some competitive races and control of the U.S. Senate are still to be determined, voting in the 2022 midterm elections is over. Voters weighed a variety of different factors including former President Trump’s endorsement of candidates, the candidates’ characteristics, as well as the issues facing the country. While inflation was clearly at the top of voters’ minds as they cast their ballots in this midterm election, the issue of abortion played a role in many ways. Four states had ballot initiatives that all went in the direction of supporting abortion rights, and many voters, including in key voting blocs and in some highly competitive races, said they were motivated to turn out by the recent Supreme Court decision overturning Roe v. Wade. This analysis focuses on the KFF/AP supplemental questions on AP VoteCast of midterm voters to further examine the role that the Supreme Court decision overturning Roe v. Wade played in the 2022 midterm election.

  • In a midterm election where issues largely centered on inflation and rising prices, about a quarter of voters said the Court’s decision was the single most important factor in their midterm vote. This share increases to more than three in ten among some groups that tend to be pro-choice, including Democratic voters, younger women voters, first time voters, and those who say they are angry about the Court’s decision. These groups are more likely to say the Court’s decision had a “major impact” on their voting decisions – both to turn out and which candidates to support. Majorities of Black and Hispanic women also report the Supreme Court decision impacted their voting behavior, and older women of color were more likely than older White women to report this.
  • Voters who said the Supreme Court overturning Roe was the single most important factor in their vote went more than 2:1 for Democratic candidates. Democratic candidates also had advantage of voters who were angry in the wake of the Dobbs Among the one-third of voters who said they were angry about the Supreme Court’s decision to overturn Roe, eight in ten cast ballots for Democratic House candidates.
  • There were several states with competitive races where the Supreme Court’s decision to overturn Roe may have played a role in motivating voters both to turn out and to vote for candidates who share their opinion on abortion access. For example, in Pennsylvania, the Supreme Court decision to overturn Roe was the most important factor in the vote of about one in ten Republican voters, and 21% of these Republican voters cast ballots for the Senate Democratic candidate. A small share overall, but it was an election where small margins mattered. A majority of key voting groups in the state, including younger voters, women voters 18-49, and voters who supported the Democratic candidates, also said the Court’s decision had a “major impact” on their decision to vote and who they supported.
  • In all four states where voters were asked to vote directly on state initiatives regarding abortion access, about four in ten say the Supreme Court decision overturning Roe had a “major impact” on their decision to turn out to vote. The Court’s decision was an even stronger turnout motivation for women 18-49 years old, the group most directly impacted by the state ballot initiatives. Large shares women voters under 50 in each of the four states said the Supreme Court overturning Roe had a “major impact” on whether they voted in the 2022 midterm election including more than half of women voters under the age of 50 in California (55%), Michigan (55%), Vermont (51%) and nearly half (45%) of Kentucky women voters under 50.

Democrats More Motivated By Supreme Court Decision

The 2022 midterm election was widely expected to hinge on economic issues, and results of AP VoteCast bear that out: half of voters said inflation increasing prices for gas, groceries, and other goods was the “single most important factor” when thinking about voting in the 2022 midterm election. However, in an election where Democrats outperformed expectations, survey findings also indicate that the Supreme Court decision overturning Roe v. Wade was a motivating factor for many voters. Seven in ten said the Court’s decision was an important factor in their vote, including one quarter who said it was the single most important factor. Voters chose other factors, too, including 44% who said the future of democracy was the single most important factor in their vote and 25% who said the same about rising violent crime rates.

Half Of Voters Say Inflation Was The Single Most Important Factor In Their Vote, While A Quarter Say Overturn Of Roe Was Most Important

The overturning of Roe ranked even higher as a voting issue among some key voting blocs. Almost four in ten first-time voters (38%) and voters who identify as Democrats (37%), as well about a third of all voters under age 30 (34%) and women voters under age 50 (34%) said the Court’s decision was the “single most important factor” in their vote choice. These groups, voters who largely disapproved of the Dobbs decision that ultimately overturned the precedent set by the Court’s decision on Roe, may have contributed to a stronger showing among Democratic candidates, especially in places where the contests were decided by marginal shifts in turnout. Early estimates suggest that overall youth voter turnout was among the highest in three decades.

To provide a deeper look at the role of abortion in motivating both turnout and vote choice, KFF added supplemental questions to AP VoteCast. Four in ten voters overall say the Supreme Court overturning Roe had a “major impact” on their decision about whether to vote in this election, rising to more than half of those who voted for a Democratic candidate for Congress (56%). The share of voters who say the Court’s decision was a major factor in their turnout was also higher among first time voters (54%), voters under age 30 (52%), women voters under age 50 (51%), and those who said they were angry about the Supreme Court decision (63%).

Half of all voters say the Court’s decision had a “major impact” on which candidates they supported in this election, including nearly two-thirds (64%) of those who voted for Democratic House candidates.

At Least Half Of Democratic Voters, First Time Voters, Younger Women Voters Say The Supreme Court Decision Had Major Impact On Their Vote Choice And Turnout

More than half of Black and Hispanic women ages 50 and older said the Supreme Court decision had a “major impact” on their decision to vote and which candidates to support, compared to smaller shares of older white women voters. Among women voters under 50, the racial differences are smaller but Black and Hispanic women are still slightly more likely to say the Dobbs decision had a “major impact” on their voting decisions.

Older Black And Hispanic Women Report More Impact On 2022 Vote By Roe Decision Than Older White Women

Democratic candidates overwhelmingly supported by Voters For Whom Abortion Was Most Important Voting Factor

Democratic candidates garnered large support among the quarter of voters who said the Court’s decision on abortion was the single most important factor in their vote with seven in ten of these voters casting ballots for the Democratic candidates for the U.S. House, compared to a quarter who voted for the Republican candidates. On the other hand, Republican candidates fared better – but to a lesser degree – among voters who said inflation was their single most important issue.

Democratic Candidates Garnered Strong Support Among Voters Who Said Supreme Court Decision Was Single Most Important Factor In Their Vote

Democratic candidates also had the advantage among voters who were angry in the wake of the Dobbs decision. Among the one-third of voters who said they were “angry” about the Supreme Court’s decision to overturn Roe, eight in ten cast ballots for Democratic House candidates. Neither party’s candidates had an advantage among the quarter of voters who said they were “dissatisfied by the Court’s decision but not angry,” while Republican candidates garnerd more support among voters who said they were either happy about the Court’s decision or “satisfied, but not happy.”

Republican U.S House Candidates Garnered Large Support Among Voters Who Were Happy  Roe Was Overturned, Democratic Candidates Won Among Voters Who Were Angry About Court Decision

The Role of Supreme Court Decision in Competitive States

There were several states with competitive races where the Supreme Court’s decision to overturn Roe may have played a role in motivating voters to both turnout and to vote for candidates who share their opinion on abortion access. Nationally, 13% of Republicans and Republican-leaning independents said the Supreme Court decision was the most important factor in their vote, and relatively few of this group (9%) ended up casting ballots for Democratic candidates. But in certain states with competitive races, like Pennsylvania and Arizona, one in five of these Roe-focused Republican voters voted for the Democratic Senate candidate. Though small as a share of total voters, these kinds of crossover votes may have mattered in these close races.

In PA And AZ, One In Five Republican Voters Who Said Roe Overturn Was Most Important Factor This Election Voted For Democratic Senate Candidates

In addition to motivating some Republican voters to vote for Democratic candidates, the Supreme Court Dobbs decision may have influenced turnout. In key competitive states including Georgia, Pennsylvania, Arizona, Nevada, and Wisconsin, more than one-third of voters said the Supreme Court overturning Roe had a “major impact” on their decision about whether to vote in this election and at least four in ten said it had a “major impact” on which candidates they supported.

For Many Voters In Competitive Races, The SCOTUS Decision On Roe Had A Major Impact On Their Vote Choice And Turnout

While many competitive races have yet to be called, the Democratic candidates have garnered enough votes to win the Senate and gubernatorial election in Pennsylvania. While the gubernatorial election was deemed less competitive, the Senate race between Fetterman and Oz was one of the most closely watched races during this election cycle. In addition to the role of President Trump’s endorsement of Oz and the health of Fetterman, the candidates held very different views on abortion rights in the state and the issue was a major part of the campaign rhetoric. Overall, about four in ten Pennsylvania voters said the Supreme Court decision to overturn Roe had a “major impact” on their decision to turnout and half said it had a “major impact” on which candidates they supported. These shares are larger among those who voted for Fetterman, younger voters, women voters under 50, and voters who were angry about Roe being overturned.

Majorities Of Pennsylvania Democrats, Young Voters, And Younger Women Voters Say Roe Overturn Had Major Impact On Voting And Candidate Choice

Abortion Ballot Measures

Voters in four states voted on ballot initiatives related to state constitutional rights to abortion in the 2022 midterm elections. Three states (California, Michigan, and Vermont) voted on ballot initiatives to amend those states’ Constitutions to establish an explicit right to abortion. All three of these ballot initiatives passed. On the other hand, Kentucky voters rejected a ballot initiative that would have amended its state Constitution to declare that there is no right to abortion. In all four states, about four in ten voters say the Supreme Court decision overturning Roe had a “major impact” on their decision to turn out to vote.

The Supreme Court decision was also a strong motivator for women, 18-49 years old, the group most directly impacted by the state ballot initiatives. Large shares of women voters under 50 in each of the four states said the Supreme Court overturning Roe had a “major impact” on whether they voted in the 2022 midterm election including more than half of women voters under the age of 50 in California (55%), Michigan (55%), Vermont (51%) and nearly half (46%) of Kentucky women voters under 50.

About Four In Ten Voters Across States With Abortion On Their Ballot Say Overturning Roe Had A Major Impact On their Decision To Turn Out To Vote

aBORTION ON THE BALLOT IN MICHIGAN

In addition to a gubernatorial election and district races, Michigan voters also voted on a ballot measure to amend the state Constitution to establish a broad individual right to reproductive freedom that includes abortion. Three-fourths of Michigan voters said the outcome of the gubernatorial election was “very important” to them, while six in ten said the same about the outcome of the ballot measure, which passed. Among key groups, there was a smaller difference in the share of voters who said each, the gubernatorial election and the ballot measure, was important to them. For example, similar shares of Democratic voters, women voters under 50, and voters who were angry about the Supreme Court decision, said both outcomes were “very important” to them.

Majorities Of Michigan Voters Say Both Outcome Of Abortion Ballot Initiative And Governor Race Was Very Important

Methodology

The AP VoteCast is a national survey and 48 state surveys of 2022 midterm voters conducted by NORC at the University of Chicago for the AP and FoxNews beginning on Oct. 31 and concluding as polls close on Nov. 8, 2022, in English and Spanish. The national survey was conducted using the NORC’s probability-based AmeriSpeak panel, while the individual state surveys were conducted from a random sample of state voter files and from self-identified registered voters selected from non-probability online panels. Find more details at AP VoteCast’s methodology at https://www.ap.org/content/politics/elections/ap-votecast/about.

Health and Health Care for Indigenous People

Published: Nov 10, 2022

November marks National Native American Heritage Month, during which the U.S. recognizes the culture, heritage, and contributions of Indigenous people including those from American Indian, Alaskan Native, Native Hawaiian, and Pacific Island communities. As the country celebrates Indigenous knowledge and cultures, it is key to recognize that Indigenous people face many socioeconomic and health disparities that limit their overall health and well-being.

In the U.S., there are over 8.6 million people who identify as American Indian and Alaskan Native (AIAN) alone or in combination with another race/ethnicity and close to 700,000 people who identify as Native Hawaiian and other Pacific Islander (NHOPI) alone or in combination with another group. Within these groups 1.7 million people identify solely as AIAN and 550,000 people identify as NHOPI alone. The combined population of AIAN and NHOPI people has grown 45% over the last decade, from 6.4 million in 2010 to almost 9.3 million in 2021.

The U.S. has a responsibility to provide certain rights, protections, and services to AIAN people, including health care. However, the Indian Health Service has historically been underfunded to meet the health care needs of AIAN people and they face other social and economic challenges that contribute to poor health outcomes. NHOPI people also face systemic challenges to health. Nonelderly AIAN and NHOPI people are more likely to be uninsured than their White counterparts and nonelderly AIAN and NHOPI adults are also more likely than their White counterparts to postpone or forego seeking health care due to cost being a barrier. In addition, AIAN and NHOPI households are less likely to have a full-time worker and more likely to be poor compared with White households.

Reflecting these and other challenges, AIAN people fare worse than their White counterparts across a range of health measures, including being more likely to report fair or poor health (24% AIAN vs. 12% NHOPI vs. 12% White) and having chronic conditions like asthma and diabetes. NHOPI people do not fare worse than their White counterparts across some of these measures, but this may mask differences among this diverse community and/or more limited access to providers to diagnose chronic conditions. It may also reflect limitations in the ability to reliably capture their experiences in survey data due to their small population size. AIAN people also face challenges with mental health, including high rates of death by suicide and drug overdose deaths, which rose over the past few years amid the pandemic. Separate data for NHOPI people was not available for these measures. Moreover, COVID-19 has taken a disparate toll on AIAN and NHOPI people, with them experiencing higher age-adjusted rates of cases and deaths compared to White people.

Addressing the health and social challenges faced by Indigenous people will be important for fulfilling the nation’s duties and responsibilities, improving the health and well-being of this diverse and growing population, and supporting overall improved health and prosperity in the U.S. As part of these efforts, it will be important to resolve persistent gaps and limitations available in data to understand their health and health care experiences. The Biden Administration recently made large investments to address the COVID-19 pandemic and improve infrastructure in Native communities. A continued focus on addressing their health and health care needs will be important going forward.

Source

KFF analysis of 2021 American Community Survey, 1-yr Estimates; 2021 Behavioral Risk Factors Surveillance System Data; Centers for Disease Control and Prevention, COVID-19 Response, COVID-19 Case Surveillance Public Use Data, released on October 6, 2022; and National Center for Health Statistics, Provisional COVID-19 Deaths by HHS Region, Race, and Age, as of October 26, 2022.

News Release

The Average Medicare Beneficiary Has a Choice of 43 Medicare Advantage Plans and 24 Part D Stand-Alone Plans for Coverage in 2023

Published: Nov 10, 2022

For 2023, the typical beneficiary has a choice of 43 Medicare Advantage plans as an alternative to traditional Medicare, a new KFF analysis finds. That’s an increase of 5 plans on average from 2022, adding even more choices to the Medicare Advantage marketplace, which is poised to become the dominant way Medicare beneficiaries get their health coverage and care.

In addition, the typical beneficiary has a choice of 24 Medicare Part D stand-alone prescription drug plans for 2023, a second KFF analysis finds, one more than in 2022.

These findings are featured in two briefs released by KFF today that provide an overview of the Medicare Advantage and Medicare Part D marketplace for 2023, including the latest data and key trends. Medicare’s open enrollment period began Oct. 15 and runs through Dec. 7.Medicare Advantage

More than 28 million Medicare beneficiaries – 48 percent of all eligible beneficiaries – are enrolled in Medicare Advantage plans, which are mostly HMOs and PPOs offered by private insurers. Enrollment is projected to cross the 50 percent threshold as soon as next year.

For 2023, a typical beneficiary has 43 Medicare Advantage plans to choose from in their local market, including 35 plans that offer Part D drug coverage. In total, 3,998 Medicare Advantage plans will be available across the country.

The average Medicare beneficiary can choose from plans offered by nine firms in 2023, the same number as in 2022. Even so, Medicare Advantage enrollment is concentrated in plans operated by UnitedHealthcare and Humana, which together account for 46 percent of Medicare Advantage enrollment in 2022.

Two thirds (66%) of Medicare Advantage plans do not charge an additional premium beyond Medicare’s standard Part B premium, up from 59 percent in 2022. In 2023, nearly all plans (97% or more) offer some vision, fitness, telehealth, hearing, or dental benefits, though the scope of coverage for these services varies.

Part D

The average Medicare beneficiary has a choice of 24 stand-alone Part D drug plans for 2023, one more than in 2022. The total number of Medicare Part D stand-alone prescription drug plans that will be offered in 2023 is rising by 5 percent to 801 plans. Fifteen firms offer the plans, the lowest number in any year since Part D started.

The estimated average monthly premium for Medicare Part D stand-alone drug plans is projected to be $43 in 2023, based on current enrollment, a 10 percent increase from $39 in 2022. This rate of increase outpaces both inflation and the Social Security cost-of-living adjustment for 2023. In the stand-alone drug plan market, more than 8 out of 10 enrollees next year are projected to be in stand-alone plans operated by just four firms: CVS Health, Centene, UnitedHealth, and Humana.

Average monthly premiums for the 16 national stand-alone drug plans available in 2023 are projected to range from $6 to $111. Premiums are rising for 12 of the 16 plans, including four plans with increases exceeding $10.

Inflation Reduction Act

Beginning in 2023, under a provision in the Inflation Reduction Act (IRA), Part D enrollees will pay no more than $35 per month for covered insulin products in all Part D plans, and will pay no cost sharing for adult vaccines covered under Part D. Also, beginning in 2023, drug manufacturers will be required to pay rebates for drug prices that rise faster than the rate of inflation, which could help to dampen cost increases for Part D enrollees.

The new law also caps enrollees’ out-of-pocket drug spending under Part D, as of 2024, and requires Medicare to negotiate prices for some drugs, with negotiated prices first available for some Part D drugs in 2026. A recent KFF explainer summarizes these and other prescription drug provisions in the Inflation Reduction Act.

In addition to these two new Medicare Advantage and Part D analyses, KFF has updated its collection of frequently asked questions about Medicare Open Enrollment to help beneficiaries understand their options during the annual open enrollment period. Our updated overview of Part D has more information about Medicare’s prescription drug benefit in 2023 and the IRA changes over time. Recent KFF analyses show that a relatively small share of Medicare beneficiaries compared plan options or switched plans during a recent open enrollment period.

Medicare Advantage 2023 Spotlight: First Look

Authors: Meredith Freed, Jeannie Fuglesten Biniek, Anthony Damico, and Tricia Neuman
Published: Nov 10, 2022

Data Note

Over the last decade, Medicare Advantage, the private plan alternative to traditional Medicare, has taken on a more prominent role in the Medicare program. In 2022, more than 28 million Medicare beneficiaries are enrolled in a Medicare Advantage plan, nearly half of the total Medicare population. This brief provides an overview of the Medicare Advantage plans that are available for 2023 and key trends over time. (A separate overview of the 2023 Medicare Part D marketplace is also available.)

Plan Offerings in 2023

Number of Plans

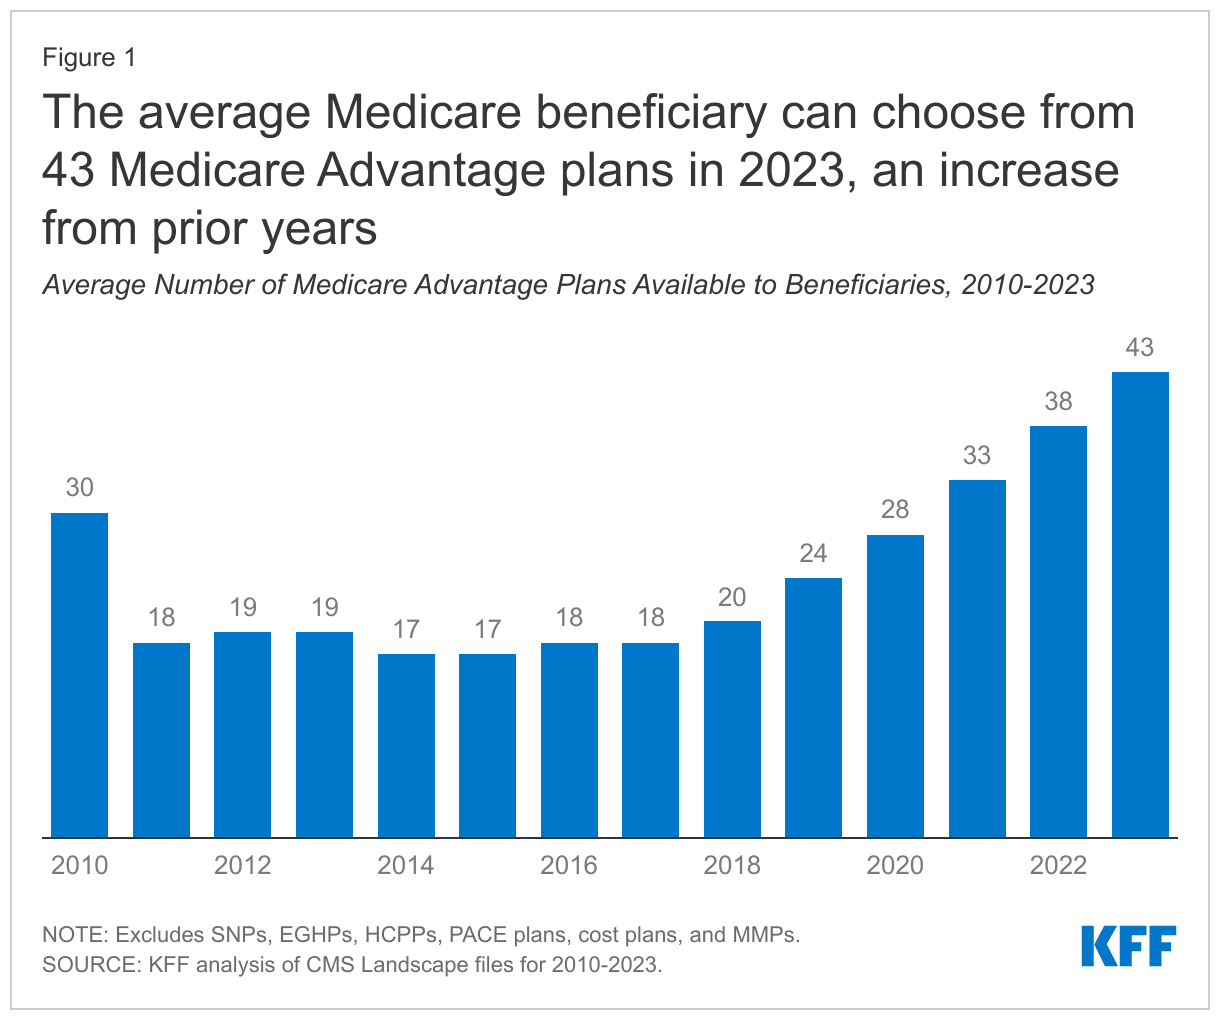
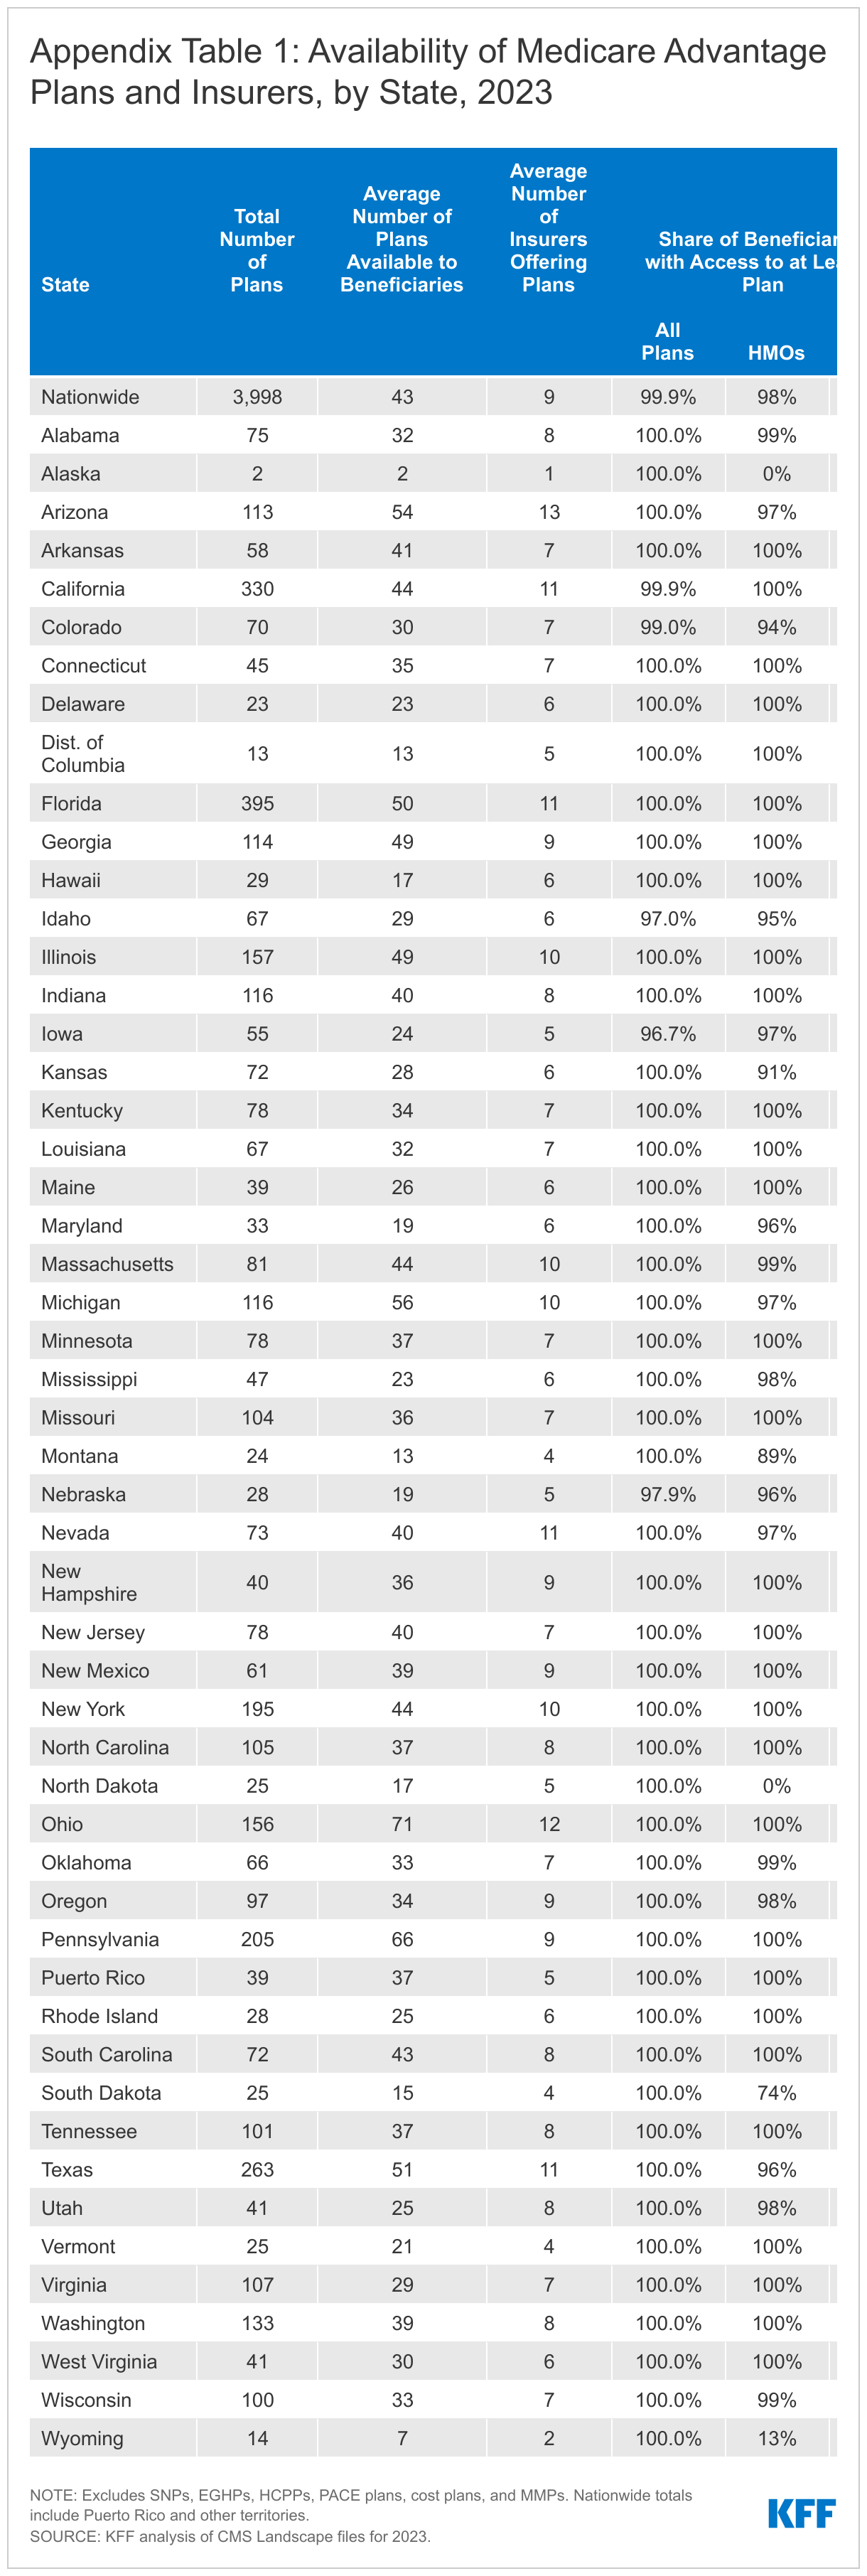
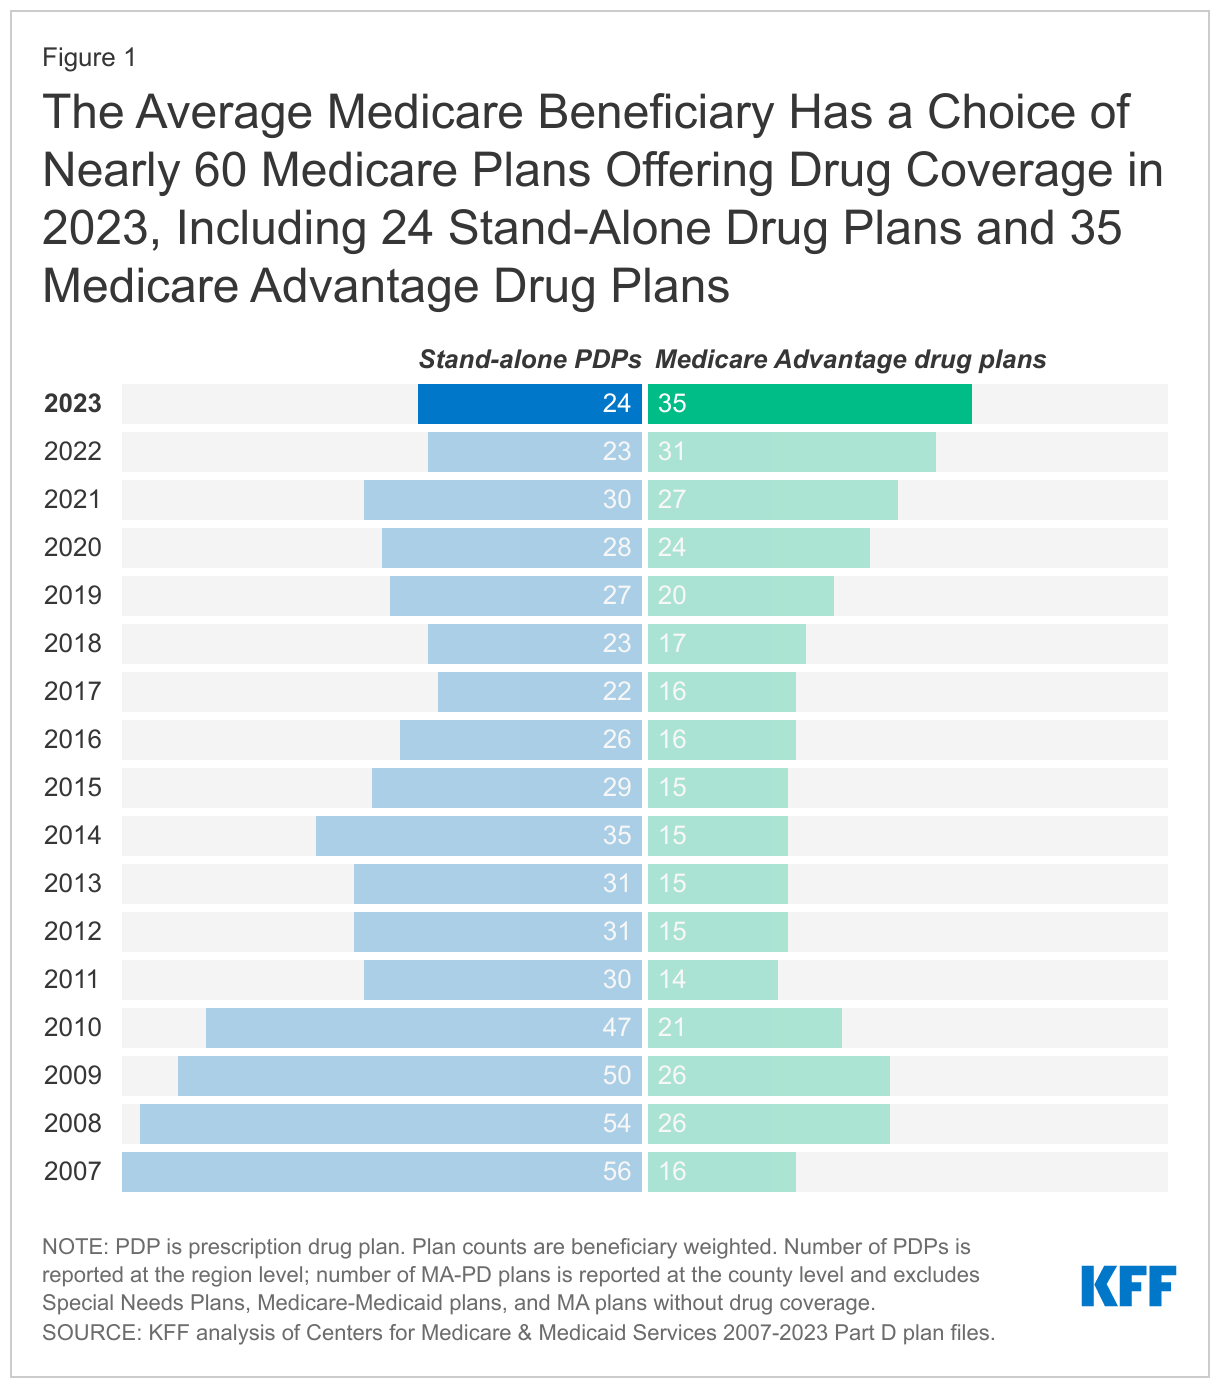
Number of Plans Available to Beneficiaries. For 2023, the average Medicare beneficiary can choose from 43 Medicare Advantage plans, more than double the average number available in 2018, and the largest number of options available over the period we examined, which goes back to 2010 (Figure 1). These numbers exclude employer or union-sponsored group plans, Special Needs Plans (SNPs), PACE plans, cost plans, and Medicare-Medicaid plans (MMPs) that are only available to select populations.

The average Medicare beneficiary has access to 43 Medicare Advantage plans in 2023, an increase from prior years

Of the 43 Medicare Advantage plans available for individual enrollment to the average Medicare beneficiary in 2023, 35 of the plans include prescription drug coverage (MA-PDs).

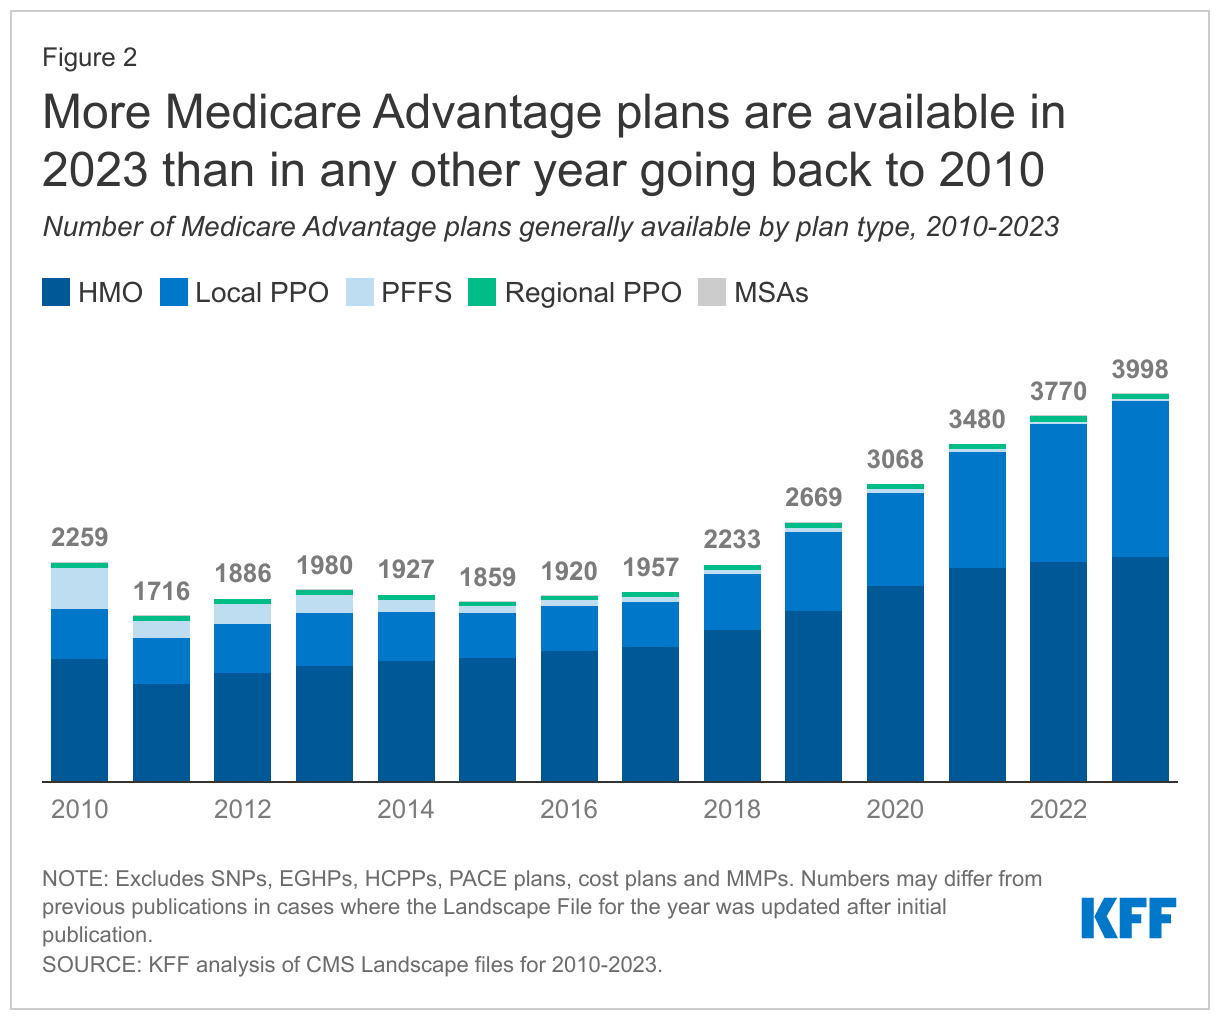
Total Number of Plans. In total, 3,998 Medicare Advantage plans are available nationwide for individual enrollment in 2023 – a 6 percent increase in the number of plans (228 more plans) offered in 2022 and the largest number of plans available over the period we examined, which goes back to 2010 (Figure 2; Appendix Table 1). The vast majority (89 percent) of all Medicare Advantage plans offered include prescription drug coverage in 2023.

More Medicare Advantage plans are available in 2023 than in any other year going back to 2010

HMOs account for about six in ten plans (58%) offered in 2023, a slight decline from 2019 and 2020 where they accounted for about two-thirds of all plans offered. The availability of local PPOs has increased rapidly over recent years. In 2023, 40% of all Medicare Advantage plans offered are local PPOs, compared to 30% in 2019. The number of regional PPOs and private fee-for-service plans (PFFS) have respectively slowly declined from around 2% of plans offered in 2019 to 1% in 2023.

The growth in number of plans varies across states and counties, with the preponderance of the growth occurring in Texas (42 more plans), Florida (26 more plans), and Pennsylvania (21 more plans) (data not shown). In contrast, Washington has 7 fewer plans available for 2023 than in 2022, while Kansas and Maine have 3 fewer plans; Montana, New Hampshire, Oregon, South Carolina, Utah, Vermont, and the District of Columbia have one fewer plan available in 2023 than in 2022. In the remaining states, the number of plans either stayed the same or the growth in plans was 13 or less.

While many employers and unions also offer Medicare Advantage plans to their retirees, no information about these 2023 plan offerings is made available by CMS to the public during the Medicare open enrollment period because these plans are not available to the general Medicare population.

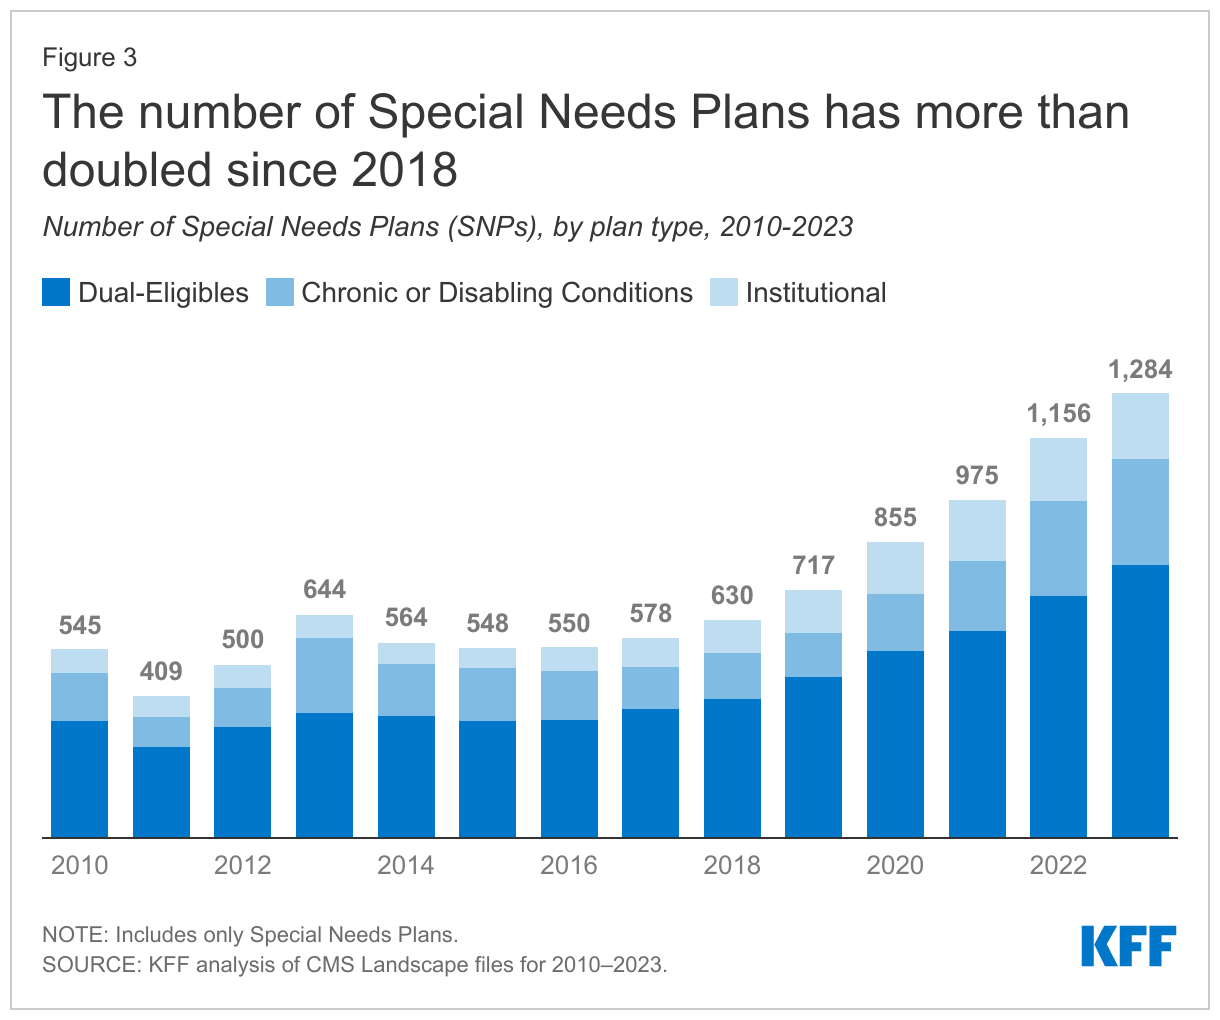
Special Needs Plans (SNPs). In 2023, 1,284 SNPs will be offered nationwide, an 11 percent increase between 2022 and 2023 (Figure 3).

The number of Special Needs Plans has more than doubled since 2018

The rise in SNPs for people who require an institutional-level of care (I-SNPs) has been particularly notable, nearly doubling from 97 plans in 2018 to 189 plans in 2023 (an increase of 5 plans since 2022). I-SNPs may be attractive to insurers because they tend to have much lower marketing costs than other plan types since they are often the only available option for people who require an institutional level-of-care, such as those who have been in nursing homes for an extended period of time.

The majority of SNPs (61%) are plans designed for people dually eligible for Medicare and Medicaid (D-SNPs). The number of D-SNPs has increased sharply over the past five years, nearly doubling from 401 dual SNPs in 2018 to 789 dual SNPs in 2023, suggesting insurers continue to be drawn to this high-need population.

The number of SNPs offered for people with chronic conditions (C-SNPs) is also increasing in 2023 (306 plans), more than doubling from 2018 (132 plans), most of which focus on people with diabetes, heart disease, or lung conditions, as has been the case since the inception of C-SNPs. For 2023, two firms are offering C-SNPs for people with dementia (compared to three firms in 2022), two firms are offering C-SNPs for people with mental health conditions (compared to four firms in 2022), and one firm is offering a C-SNP for people with HIV/AIDS (compared to three firms in 2022).

In 2021, people with end-stage renal disease (ESRD) became eligible to enroll in Medicare Advantage plans. Prior to this change, people with ESRD were not able to enroll in most Medicare Advantage plans, subject to limited exceptions, such as C-SNPs for people with ESRD. Seven firms are offering C-SNPs for people with end-stage renal disease (up three from 2022).

Availability of Insulin Demonstration Plans. In 2023, under a provision in the Inflation Reduction Act, Part D enrollees will pay no more than $35 per month for covered insulin products in all Part D plans. This new requirement builds on the Part D Senior Savings Model established by the Center for Medicare and Medicaid Innovations (CMMI) in 2021 in which participating enhanced Part D drug plans cover insulin products at a monthly copayment of $35 in the deductible, initial coverage, and coverage gap phases of the Part D benefit. In 2023, a total of 2,881 Part D plans will participate in this model (a 33% increase over 2022), including 324 PDPs and 2,557 MA-PDs (including segmented plans). While this model will continue in 2023, beneficiaries do not need to enroll in one of the model-participating plans to benefit from the $35 monthly copay cap for covered insulin products. Under the new Inflation Reduction Act requirement, all Part D plans do not have to cover all available insulin products at the $35 monthly copayment amount, only those insulin products that are covered on a plan’s formulary.

Variation in the Number of Plans, by Geographic Area. Medicare beneficiaries living in metropolitan areas can choose from 46 Medicare Advantage plans in 2023, on average, substantially more than the average number of plans available to beneficiaries in non-metropolitan areas (29 plans).

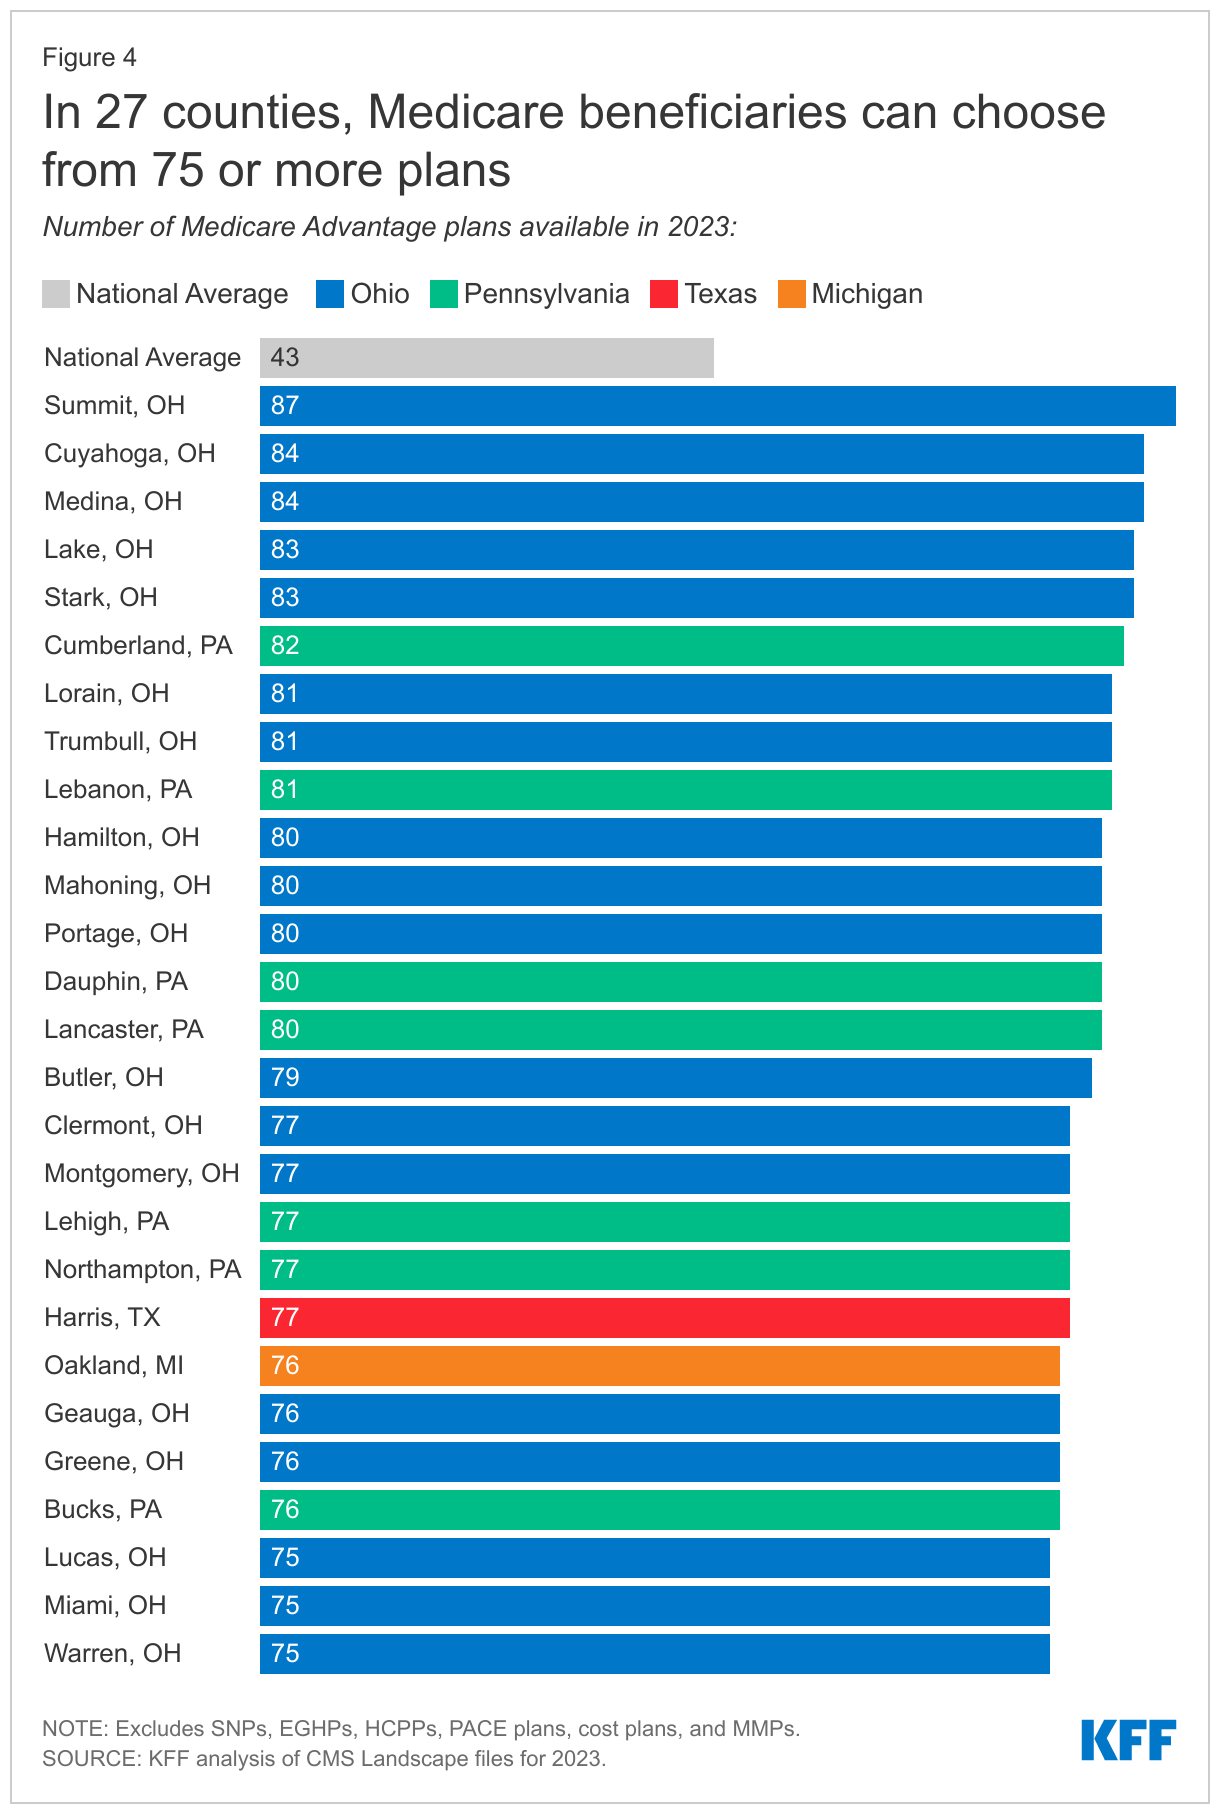
Beneficiaries can choose from 75 or more Medicare plans in 27 counties. Similar to last year, the counties with the most plan options are predominantly in Ohio and Pennsylvania. In Ohio, for example, beneficiaries can choose from 80 or more Medicare Advantage plans in 10 counties, including Hamilton County (Cincinnati) and Cuyahoga County (Cleveland). Beneficiaries in Summit County Ohio (Akron) can choose from 87 Medicare Advantage plans – the most offerings of any county in the US. Beneficiaries living in four counties in Pennsylvania can also choose from 80 or more plans. In Texas, beneficiaries in Harris County (Houston) can choose from 77 plans and in Michigan, beneficiaries in Oakland County (Detroit) can choose from 76 plans (Figure 4).

In 27 counties, Medicare beneficiaries can choose from 75 or more plans

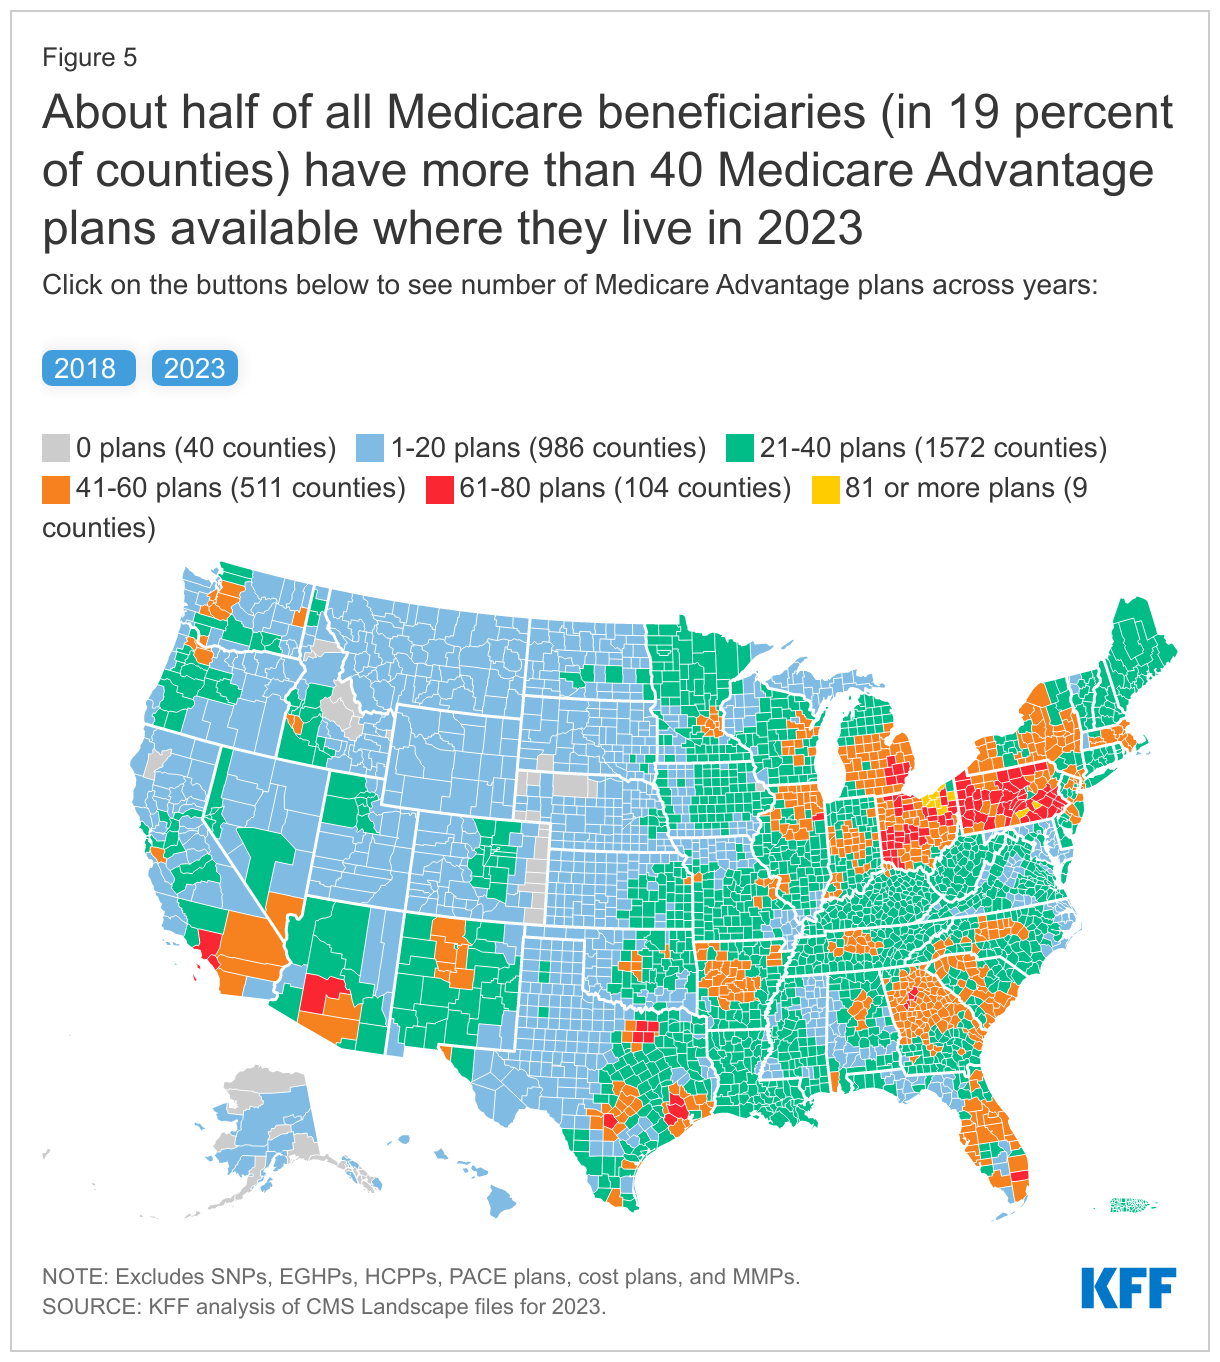
In 2023, about half of all Medicare beneficiaries (53%) (in 19 percent of counties), can choose from more than 40 Medicare Advantage plans where they live (Figure 5).

About half of all Medicare beneficiaries (in 19 percent of counties) have more than 40 Medicare Advantage plans available where they live in 2023

This is in contrast to just 5 years ago, in 2018, when fewer than one in ten Medicare beneficiaries (7%) (in less than 1 percent of counties) could choose from more than 40 Medicare Advantage plans where they live.

In 2023, in 4 percent of counties (accounting for 1 percent of beneficiaries), beneficiaries can choose from three or fewer Medicare Advantage plans. The number of counties with no Medicare Advantage plans for 2023 is 40, a slight decrease compared to 2022 (65). Similar to 2022, two Medicare Advantage plans are being offered in 15 counties in Alaska. Additionally, no Medicare Advantage plans are available in territories other than Puerto Rico. In Puerto Rico, beneficiaries can choose from an average of 37 plans for individual enrollment and an average of 22 D-SNPs.

Access to Medicare Advantage Plans, by Plan Type. As in recent years, virtually all Medicare beneficiaries (99.7%) have access to a Medicare Advantage plan as an alternative to traditional Medicare, including almost all beneficiaries in metropolitan areas (99.99%) and the vast majority of beneficiaries in non-metropolitan areas (98.4%). In non-metropolitan counties, a smaller share of beneficiaries have access to HMOs (91% in non-metropolitan versus 99% in metropolitan counties) or local PPOs (93% in non-metropolitan versus 98% in metropolitan counties), and a slightly larger share of beneficiaries have access to regional PPOs (77% in non-metropolitan counties versus 72% in metropolitan counties).

Number of Firms

The average Medicare beneficiary is able to choose from plans offered by 9 firms in 2023, the same number as in 2022 (Figure 6). Despite most beneficiaries having access to plans operated by several different firms, enrollment is concentrated in plans operated by UnitedHealthcare and Humana, and together UnitedHealthcare and Humana account for 46 percent of MA enrollment in 2022.

Four in ten (40%) beneficiaries can choose among Medicare Advantage plans offered by 10 or more firms

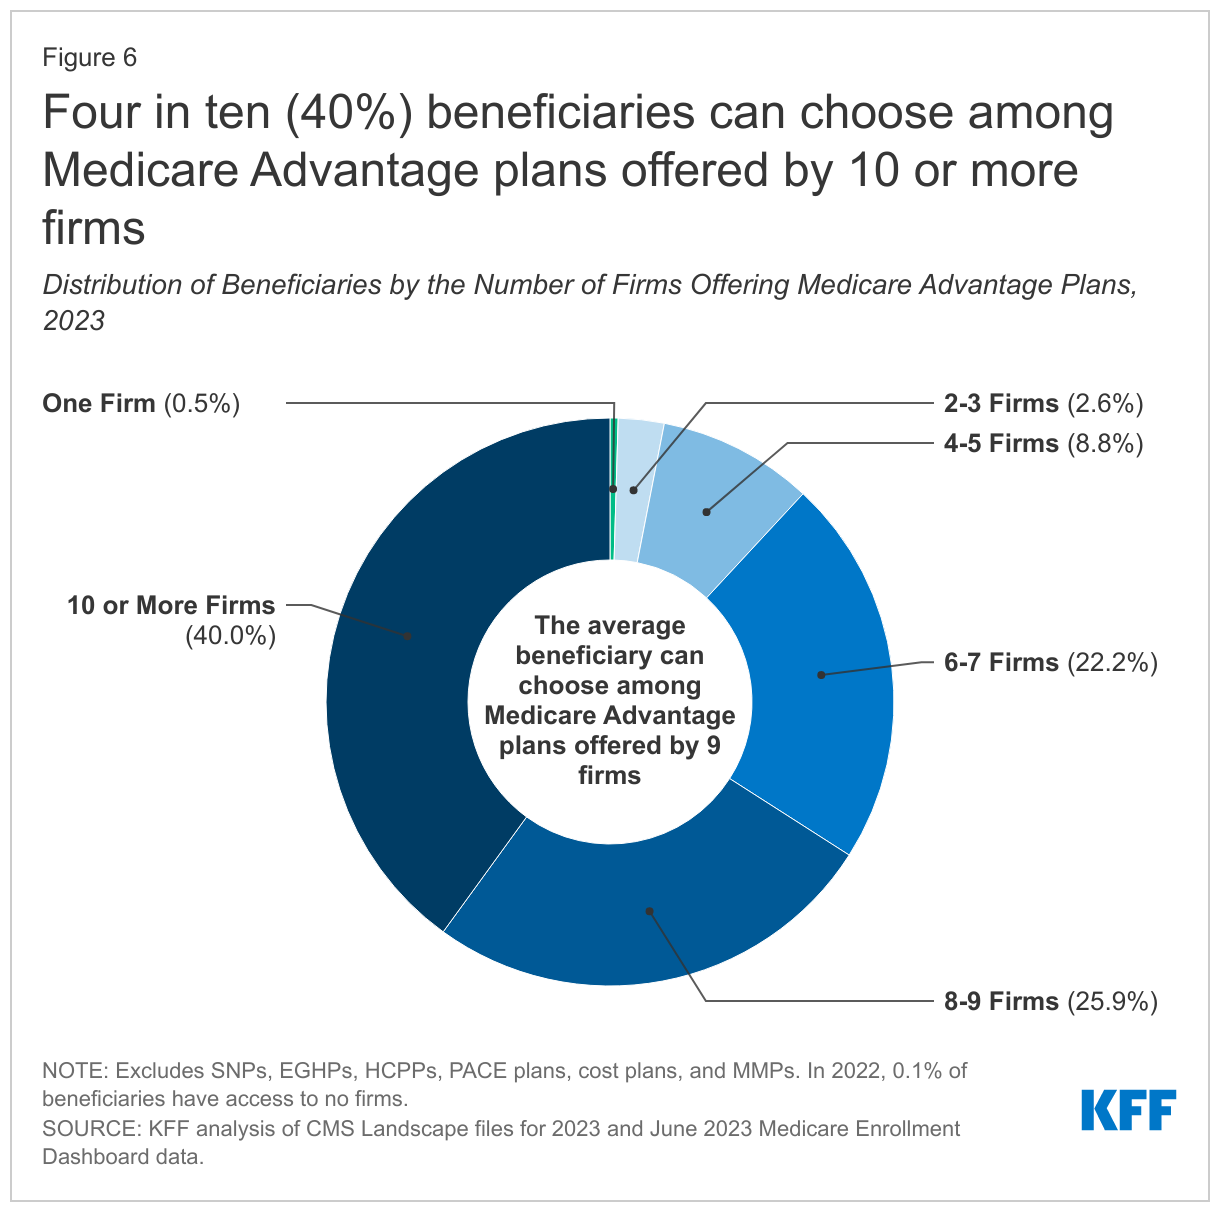
Four in ten beneficiaries (40%), in 300 counties, are able to choose from plans offered by 10 or more firms or other sponsors. Sixteen firms are offering Medicare Advantage plans in Maricopa, Arizona, and 15 firms are offering Medicare Advantage plans in four counties: Pinal and Pima counties in Arizona, and Miami-Dade and Broward counties in Florida. In contrast, 3% of beneficiaries live in a county where three or fewer firms offer Medicare Advantage plans (475 counties). Further, in 85 counties, most of which are rural counties with relatively few Medicare beneficiaries (less than 1% of total), only one firm will offer Medicare Advantage plans in 2023.

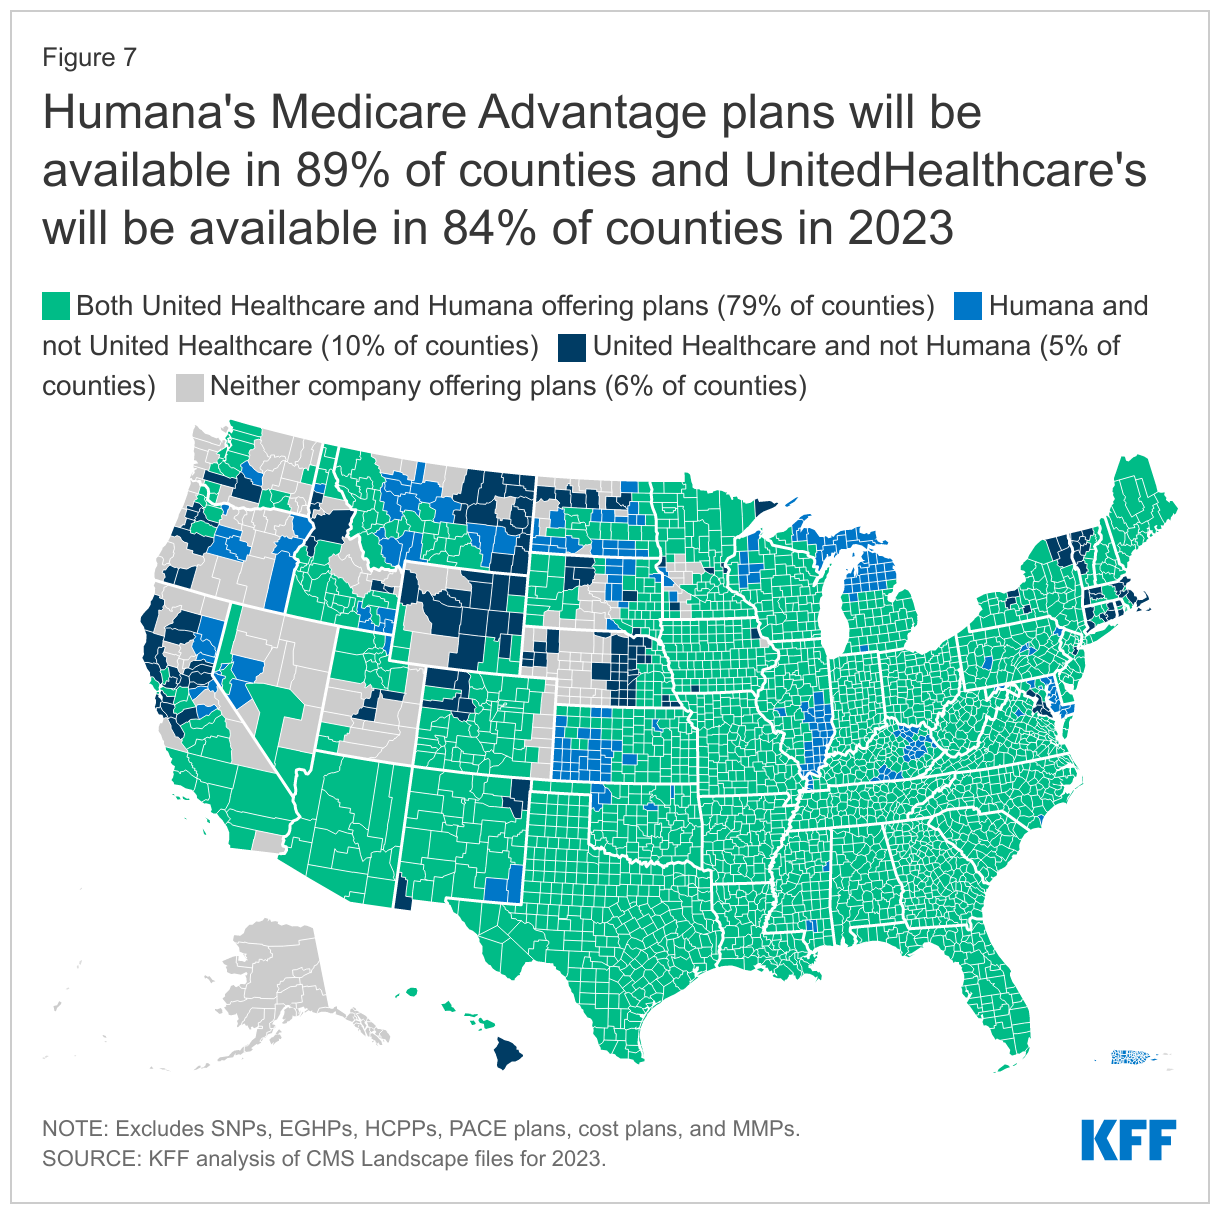
Availability of Plans by Firm and County. UnitedHealthcare and Humana, the two firms with the most Medicare Advantage enrollees in 2022, have large footprints across the country, offering plans in most counties. Humana is offering plans in 89 percent of counties and UnitedHealthcare is offering plans in 84 percent of counties in 2023, roughly the same as in 2022 (Figure 7). About 9 in 10 (92%) Medicare beneficiaries have access to at least one Humana plan and 95 percent have access to at least one UnitedHealthcare plan.

Humana's Medicare Advantage plans will be available in 89% of counties and UnitedHealthcare's will be available in 84% of counties in 2023

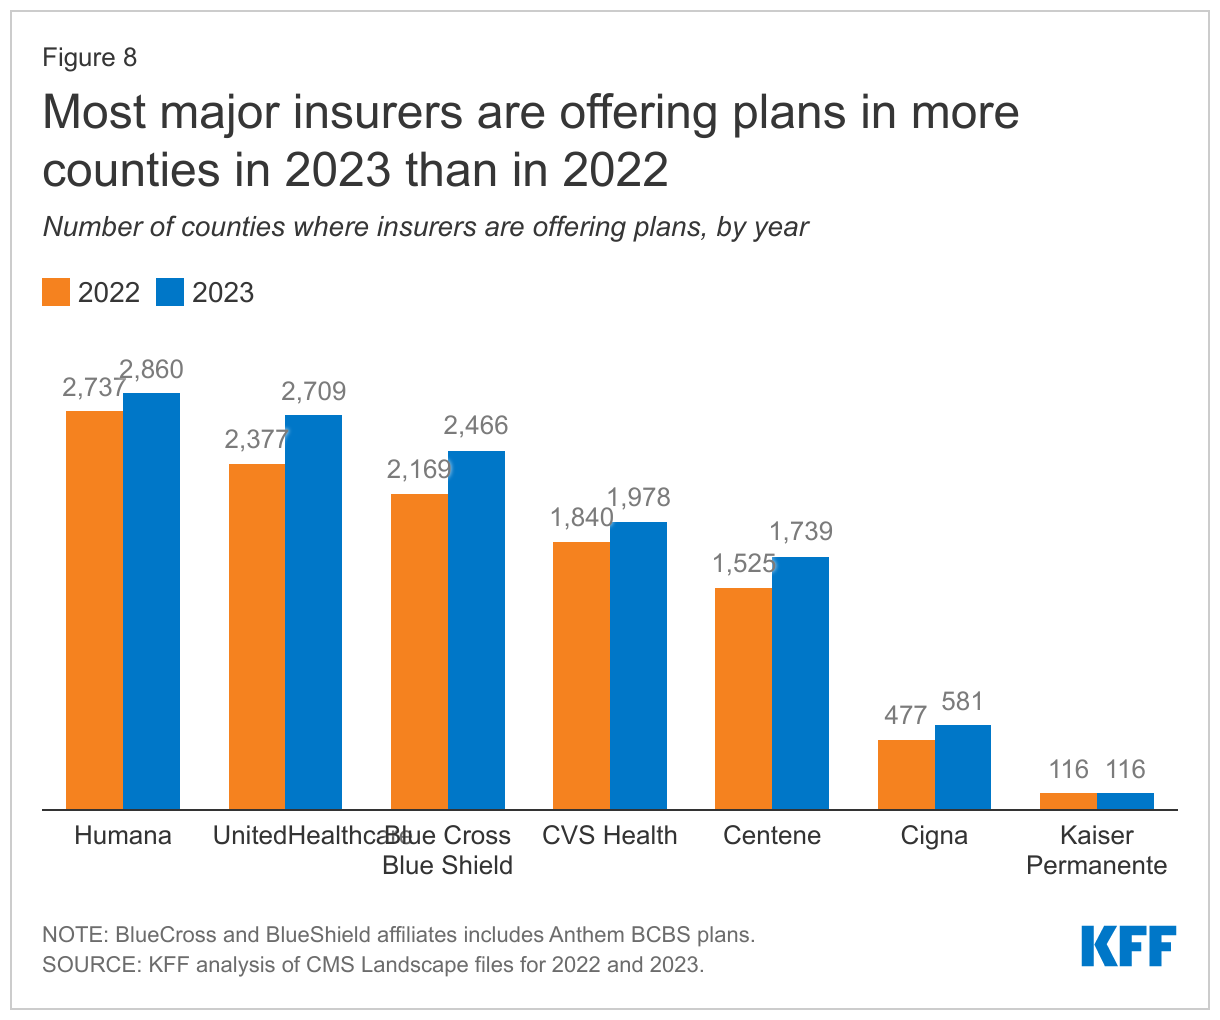
Most major Medicare Advantage firms have also expanded the number of counties where they are offering plans (Figure 8).

Most major insurers are offering plans in more counties in 2023 than in 2022

Humana is offering plans in 2,860 counties in 2023, an increase of 123 counties from 2022, while UnitedHealthcare is offering plans in 2,709 counties in 2023, an increase of 332 from 2022. Blue Cross Blue Shield Affiliates are offering plans in 2,466 counties in 2023, an increase of 297 plans from 2022. CVS Health is offering plans in 1,978 counties, an increase of 138 counties since 2022; Centene is offering plans in 1,739 counties, an increase of 214 counties; and Cigna is offering plans in 581 counties, an increase of 104 counties. Kaiser Permanente is offering plans in 116 counties, the same as in 2022.

Multiple Plan Offerings by Firms in the Same County. Many Medicare Advantage firms are also offering more than one plan option in each county. In 1,136 counties (accounting for 50% of beneficiaries), at least one firm is offering 10 or more plans for individual enrollment. For example, in Bucks and Delaware counties in Pennsylvania, four firms are offering 10 or more plans (Humana, UnitedHealthcare, Blue Cross Blue Shield Affiliates, and CVS Health). In 137 counties, two firms are offering 10 or more plans, and in 63 counties, three firms are offering 10 or more plans.

Blue Cross Blue Shield Affiliates are offering the most plan options in a county, with 18 different plan options in seven counties. Humana is offering the next highest number of plan choices with 16 Medicare Advantage plans available in six counties, followed by CVS, which is offering 13 plan options in nine counties. Centene is offering 12 plans options in seven counties and United Healthcare is offering 11 plan options in three counties.

New Market Entrants and Exits

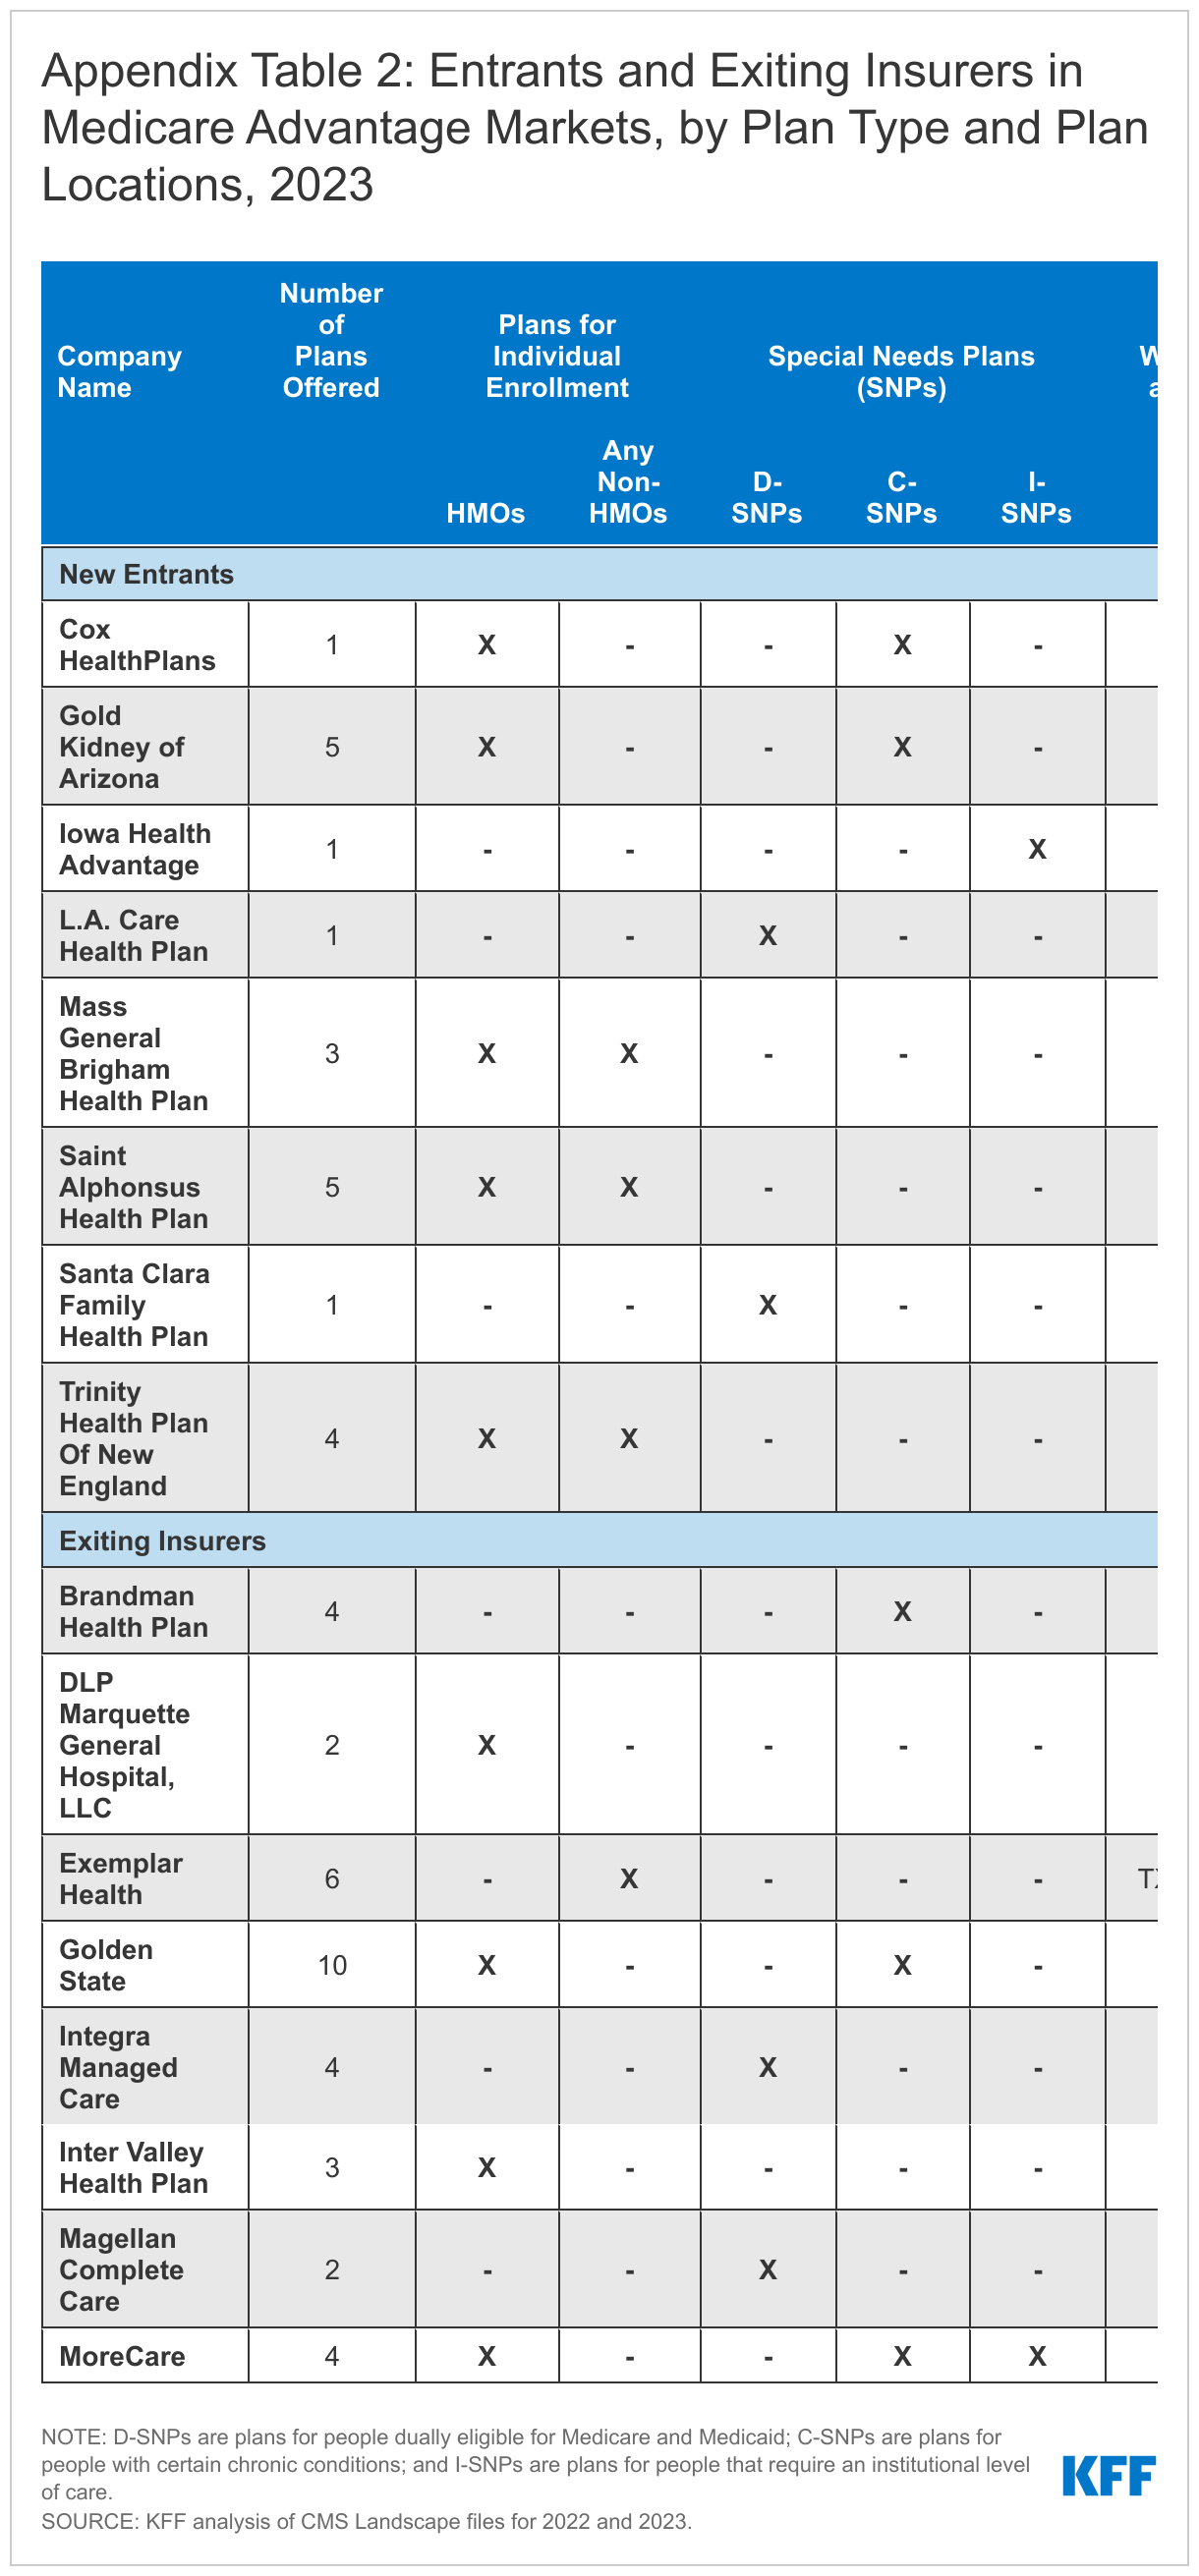
In 2023, 8 firms entered the market for the first time in 2023, collectively accounting for about 6 percent of the growth in the number of plans available for general enrollment and about 5 percent of the growth in SNPs (Appendix Table 2). Five new entrants are offering HMOs available for individual enrollment. Five of the new entrants are offering SNPs; two firms are offering D-SNPs for people dually eligible for Medicare and Medicaid, two firms are offering a C-SNP for people with select chronic conditions, and one firm is offering an I-SNP.

Two of the new firm entrants are offering plans in California, and the remainder are offering plans in Arizona, Connecticut, Iowa, Idaho, Massachusetts, and Missouri.

Eight firms that previously participated in the Medicare Advantage market are not offering plans in 2023. Two of the firms had very low enrollment in 2022, while six firms had no enrollment in 2022, including one that was sanctioned in April 2021 and had to immediately suspend enrollment. Three of the eight exiting firms offered plans in California.

Premiums

The vast majority of Medicare Advantage plans for individual enrollment (89%) will include prescription drug coverage (MA-PDs), and the share of MA-PDs that charge no premium (other than the Part B premium) has increased from 59% in 2022 to 66% in 2023. In addition, 17% of Medicare Advantage plans will offer some reduction in the Part B premium in 2023. Nearly all beneficiaries (99%) have access to a MA-PD with no monthly premium in 2023, similar to 2022 (98%). However, in Alaska, beneficiaries do not have access to a zero-premium MA-PD.

In 2022, 69 percent of enrollees in MA-PD plans pay no premium other than the Medicare Part B premium of $170.10 per month. Based on enrollment in March 2022, 13% of enrollees pay at least $50 a month, including 4 percent who pay $100 or more. CMS announced that the average monthly plan premium among all Medicare Advantage enrollees in 2023, including those who pay no premium for their Medicare Advantage plan, is expected to be $18 a month.

Extra Benefits

Medicare Advantage plans may provide extra benefits that are not available in traditional Medicare, are considered “primarily health related,” and can use rebate dollars (including bonus payments) to help cover the cost of these extra benefits. Beginning in 2019, CMS expanded the definition of “primarily health related” to allow Medicare Advantage plans to offer additional supplemental benefits. Medicare Advantage plans may also restrict the availability of these extra benefits to certain subgroups of beneficiaries, such as those with diabetes or congestive heart failure, making different benefits available to different enrollees.

Availability of Extra Benefits in Plans for General Enrollment. In 2023, 97% or more individual plans offer some vision, fitness, telehealth, hearing or dental benefits. Though these benefits are widely available, the scope of coverage for these services varies. For example, a dental benefit may include cleanings and preventive care or more comprehensive coverage, and often is subject to an annual dollar cap on the amount covered by the plan. (Figure 9). Plans are not required to report data about utilization of these benefits or associated costs, so it is not clear the extent to which supplemental benefits are used by enrollees.

97% or more of individual Medicare Advantage plans offer vision, fitness, telehealth, hearing, or dental benefits

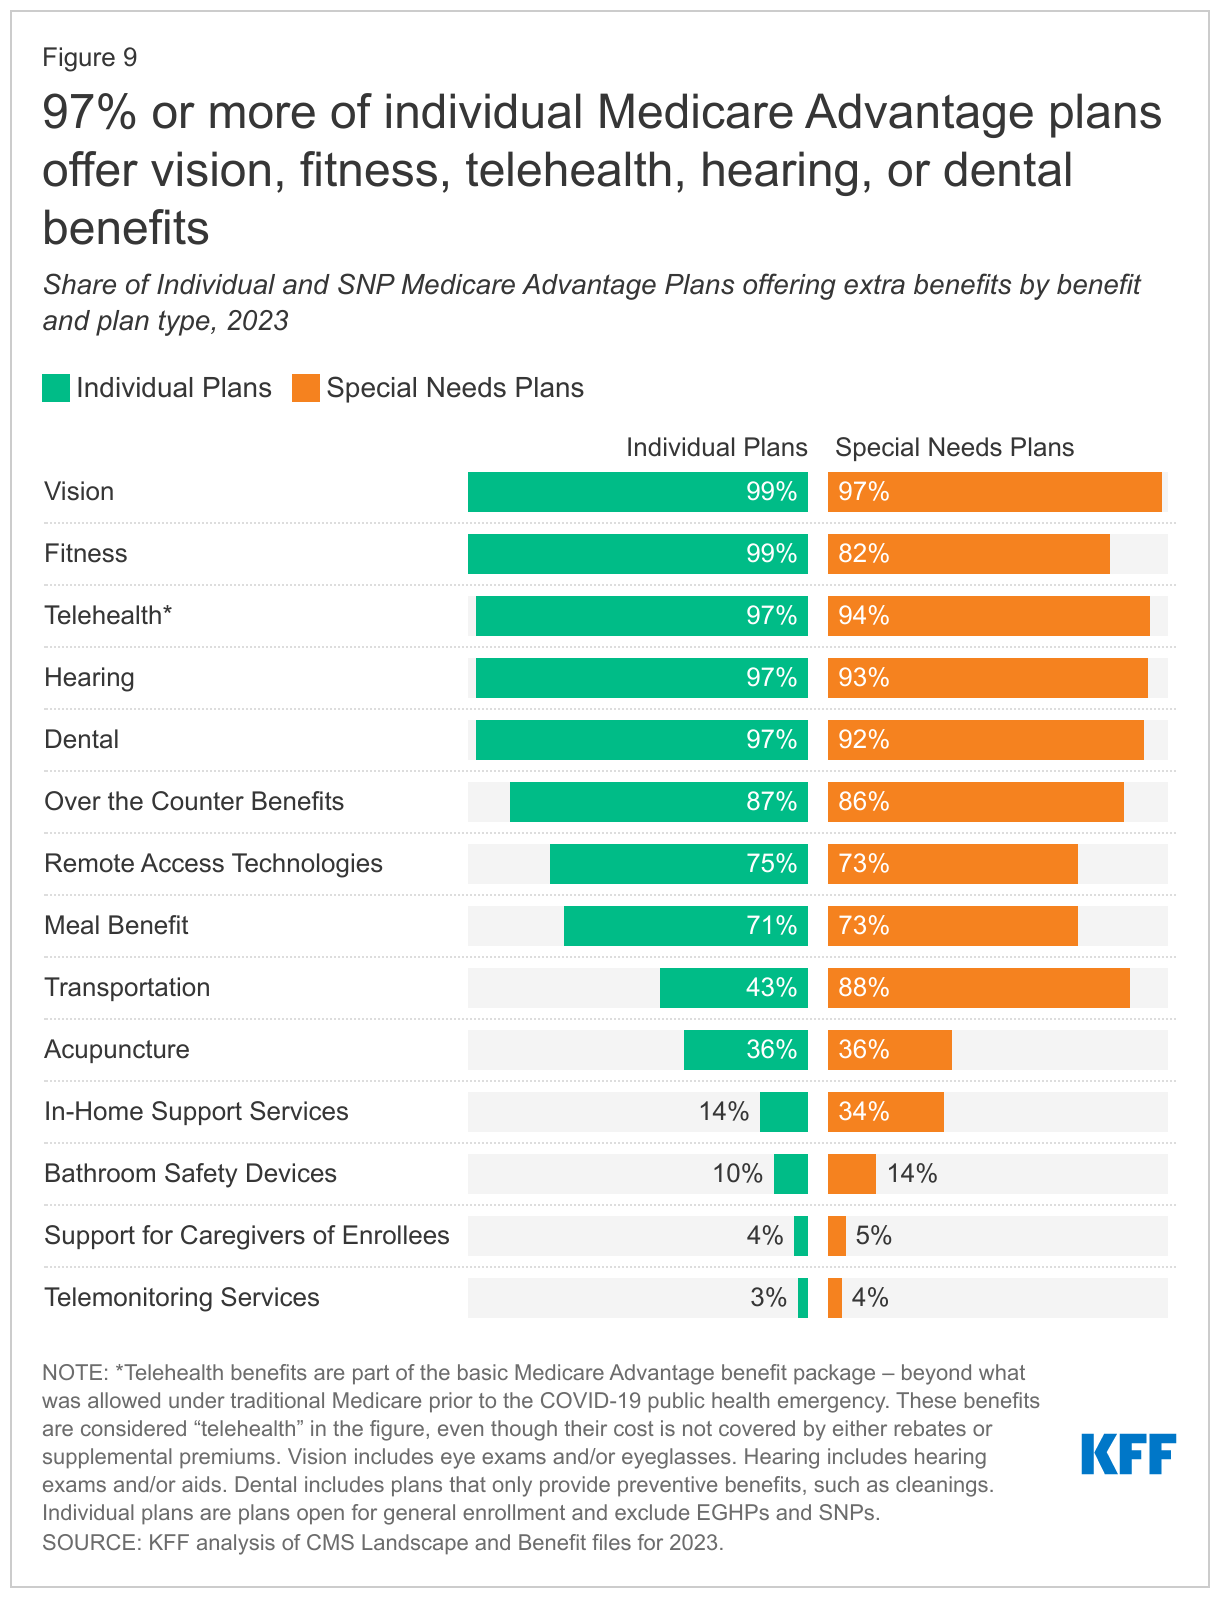
As of 2020, Medicare Advantage plans have been allowed to include telehealth benefits as part of the basic benefit package – beyond what was allowed under traditional Medicare prior to the COVID-19 public health emergency. These benefits are shown in the figure above, even though their costs are built into the bid, and are not covered by either rebates or supplemental premiums. Additionally, Medicare Advantage plans may offer supplemental telehealth benefits via remote access technologies and/or telemonitoring services, which can be used for those services that do not meet the requirements for coverage under traditional Medicare or the requirements for the telehealth benefits as part of the basic benefit package (such as the requirement of being covered by Medicare Part B when provided in-person). The vast majority (97%) of Medicare Advantage plans are offering telehealth in 2023.

Other extra benefits that are frequently offered for 2023 include over the counter items, such as adhesive or elastic bandages (87%), meal benefits, such as meal delivery (71%), and transportation benefits (43%). Ten percent of plans offer access to bathroom safety devices (10%), while 4 percent offer support for caregivers of enrollees or telemonitoring services (3%). This is not an exhaustive list of extra benefits that plans offer, and plans may provide other services such as home-based palliative care, therapeutic massage, and adult day health services, among others.

Availability of Medicare Advantage Plans with Extra Benefits. Virtually all Medicare beneficiaries live in a county where at least one Medicare Advantage plan available for general enrollment has some extra benefits not covered by traditional Medicare, with over 99% having access to at least one or more plans with dental, fitness, vision, and hearing benefits for 2023. The vast majority of beneficiaries also have access to one or more plans that offer telehealth benefits (over 99%), over the counter items (99%), a meal benefit (99%), transportation assistance (98%) but fewer have access to one or more plans that offer in-home support services (87%), bathroom safety devices (70%), or caregiver support (42%).

Availability of Extra Benefits in Special Needs Plans. SNPs are designed to serve a disproportionately high-need population, and a somewhat larger percentage of SNPs than plans for other Medicare beneficiaries provide their enrollees transportation benefits (88%) and in-home support services (34%). Similar to plans available for general enrollment, a relatively small share of SNPs offer support for caregivers (5%) or telemonitoring services (4%).

Availability of Special Supplemental Benefits for the Chronically Ill (SSBCI). Beginning in 2020, Medicare Advantage plans have also been able to offer extra benefits that are not primarily health related for chronically ill beneficiaries, known as Special Supplemental Benefits for the Chronically Ill (SSBCI). Information on the availability of SSBCI for 2023 has not yet been published by CMS, but data on enrollment in 2022 can be found here.

Discussion

More Medicare Advantage plans are being offered for 2023 than in any other year since 2010, confirming the attractiveness of this market for insurers across the country. The average Medicare beneficiary has a choice of 43 plans in 2023, offered by an average of 9 insurers, an increase in the number of plans over prior years. Medicare Advantage plans can be attractive to beneficiaries because they typically offer extra benefits, such as dental, vision and hearing, often for no additional premium, with the trade-off of more restrictive provider networks and greater use of cost management tools, such as prior authorization. The sheer number of plans presents both opportunities (to shop for better coverage) and challenges (to decipher potentially important differences across plans) although a minority of Medicare Advantage enrollees compare plans during the open enrollment period. Insurers are drawn to the Medicare Advantage market because it is profitable relative to other health insurance markets, and this comes at a cost to Medicare, in that Medicare currently pays Medicare Advantage 104% of traditional Medicare costs, on average, according to MedPAC. As the market continues to grow, and enrollment continues to climb, it will be increasingly important to assess how well Medicare Advantage is serving beneficiaires in terms of costs, quality, benefits and patient outcomes, as well as how well Medicare’s current payment methodology for Medicare Advantage is working to hold down beneficiary costs and Medicare spending.

Meredith Freed, Jeannie Fuglesten Biniek, and Tricia Neuman are with KFF.Anthony Damico is an independent consultant.

Methods

This analysis focuses on the Medicare Advantage marketplace in 2023 and trends over time. The analysis includes more than 28 million enrollees in Medicare Advantage plans in 2022.

Data on Medicare Advantage plan availability, enrollment, and premiums were collected from a set of data files released by the Centers for Medicare & Medicaid Services (CMS):

  • Medicare Advantage plan landscape files, released each fall prior to the annual enrollment period
  • Medicare Advantage plan and premium files, released each fall
  • Medicare Advantage plan crosswalk files, released each fall
  • Medicare Advantage contract/plan/state/county level enrollment files, released on a monthly basis
  • Medicare Advantage plan benefit package files, released quarterly
  • Medicare Enrollment Dashboard files, released on a monthly basis

In previous years, KFF had calculated the share of Medicare beneficiaries enrolled in Medicare Advantage by including Medicare beneficiaries with either Part A and/or B coverage. We have modified our approach this year to estimate the share enrolled among beneficiaries eligible for Medicare Advantage who have both Medicare Part A and Medicare B. These changes are reflected in both the 2023 data and in data displayed trending back to 2010.

Additionally, in previous years, KFF had used the term Medicare Advantage to refer to Medicare Advantage plans as well as other types of private plans, including cost plans, PACE plans, and HCPPs. However, cost plans, PACE plans, HCPPs are excluded from this analysis in addition to MMPs. These exclusions are reflected in both the 2023 data and in data displayed trending back to 2010.

KFF’s plan counts may be lower than those reported by CMS and others because KFF uses overall plan counts and not plan segments. Segments generally permit a Medicare Advantage organization to offer the “same” local plan, but may vary supplemental benefits, premium and cost sharing in different service areas (generally non-overlapping counties).


Appendix

Appendix Table 1: Availability of Medicare Advantage Plans and Insurers, by State, 2023
Appendix Table 2: Entrants and Exiting Insurers in Medicare Advantage Markets, by Plan Type and Plan Locations, 2023

Medicare Part D: A First Look at Medicare Drug Plans in 2023

Authors: Juliette Cubanski and Anthony Damico
Published: Nov 10, 2022

Issue Brief

During the Medicare open enrollment period from October 15 to December 7 each year, beneficiaries can enroll in a plan that provides Part D prescription drug coverage, either a stand-alone prescription drug plan (PDP) for people in traditional Medicare, or a Medicare Advantage plan that covers all Medicare benefits, including prescription drugs (MA-PD). In 2022, 49 million of the 65 million people covered by Medicare are enrolled in Part D plans, with more than half (53%) enrolled in MA-PDs and 47% in PDPs. This issue brief provides an overview of the Medicare Part D marketplace in 2023 and key trends over time, focusing primarily on PDPs. (A separate overview of the 2023 Medicare Advantage market is also available.) The brief also describes the provisions in the Inflation Reduction Act of 2022 that affect the Medicare Part D marketplace beginning in 2023. Unless otherwise noted, weighted estimates are based on June 2022 enrollment (see Methods box for additional details).

Highlights for 2023

  • The average Medicare beneficiary has a choice of nearly 60 Medicare plans with Part D drug coverage in 2023, including 24 Medicare stand-alone drug plans and 35 Medicare Advantage drug plans.
  • A total of 801 PDPs will be offered in 2023 nationwide, a modest increase from 2022. Of this total, 191 PDPs will be premium-free for enrollees receiving the Low-Income Subsidy (LIS) (benchmark plans).
  • The estimated average monthly premium for Medicare Part D stand-alone drug plans is projected to be $43 in 2023, based on current enrollment, a 10% increase from $39 in 2022 – a rate of increase that outpaces both the current annual inflation rate and the Social Security cost-of-living adjustment for 2023.
  • Average monthly premiums for the 16 national PDPs are projected to range from $6 to $111 in 2023. Among the national PDPs, average monthly premiums are increasing for 12 PDPs, including 4 PDPs with increases exceeding $10.
  • Most PDP enrollees will face much higher cost sharing for brands than for generic drugs, including coinsurance for non-preferred drugs between 40% and 50% (the maximum coinsurance rate allowed for the non-preferred drug tier) in 12 of the 16 national PDPs, similar to recent years. Close to half of all PDP enrollees will also face coinsurance, rather than copays, for preferred brands, ranging from 15% to 25%; coinsurance can mean less predictable out-of-pocket costs than copayments. Most Part D PDP enrollees who remain in their current plan for 2023 will be in a plan with the standard (maximum) $505 deductible.
  • Beginning in 2023, under a provision in the Inflation Reduction Act, Part D enrollees will pay no more than $35 per month for covered insulin products in all Part D plans, and will pay no cost sharing for adult vaccines covered under Part D. Also beginning in 2023, drug manufacturers will be required to pay rebates for drug prices that rise faster than the rate of inflation, which could impact costs for Part D enrollees. The law also adds a hard cap on out-of-pocket drug spending under Part D by eliminating the 5% coinsurance requirement for catastrophic coverage in 2024 and capping out-of-pocket drug spending at $2,000 in 2025, and authorizes the federal government to negotiate drug prices under Medicare, with negotiated prices for 10 Part D drugs first available in 2026. 

Part D Plan Availability

The Average Medicare Beneficiary Has a Choice of Nearly 60 Medicare Plans with Part D Drug Coverage in 2023

The average Medicare beneficiary will have a choice of 24 PDPs in 2023, 1 more PDP option than in 2022 (Figure 1). Although the number of PDP options for 2023 is far lower than the peak in 2007 (when there were 56 PDP options, on average), Medicare beneficiaries continue to have numerous drug plan options.

The Average Medicare Beneficiary Has a Choice of Nearly 60 Medicare Plans Offering Drug Coverage in 2023, Including 24 Stand-Alone Drug Plans and 35 Medicare Advantage Drug Plans

In 2023, beneficiaries will also have access to 35 MA-PDs, on average, a 13% increase in MA-PD options since 2022. This average excludes Medicare Advantage plans that do not offer the drug benefit and plans not available to all beneficiaries, such as Special Needs Plans and group plans. Including Medicare Advantage plans that do not provide the Part D benefit, an average of 43 will be available to beneficiaries in 2023.

A Total of 801 Medicare Part D Stand-Alone Prescription Drug Plans Will Be Offered in 2023

In 2023, a total of 801 PDPs will be offered by 15 firms in the 34 PDP regions (plus another 10 PDPs in the territories), an increase of 35 PDPs (5%) from 2022 (Figure 2). The number of firms sponsoring stand-alone drug plans has declined steadily over time, from more than 30 firms in 2011 and earlier years, dropping below 25 firms beginning in 2015, and at 15 firms in 2023, is the lowest number in any year since Part D started.

A Total of 801 Medicare Part D Stand-Alone Prescription Drug Plans Will Be Offered in 2023, a 5% Increase From 2022 - But Fewer Firms Offering PDPs Than in Any Other Year

PDP enrollment is expected to be concentrated in a small number of firms in 2023, as it has been every year. Based on June 2022 enrollment, more than 8 out of 10 PDP enrollees (82%) in 2023 are projected to be in PDPs operated by just four firms: CVS Health, Centene, UnitedHealth, and Humana. All four firms offer PDPs in all 34 PDP regions in 2023.

Beneficiaries in each state will have a choice of multiple PDPs, ranging from 19 PDPs in New York to 28 PDPs in Arizona, plus multiple MA-PDs offered at the local level (Figure 3, Table 1).

The Number of Medicare Part D Stand-Alone Prescription Drug Plans at the State Level in 2023 Ranges from 19 in New York to 28 in Arizona
Availability of Insulin For $35 Per Month

In 2023, under a provision in the Inflation Reduction Act, Part D enrollees will pay no more than $35 per month for covered insulin products in all Part D plans. This new requirement builds on a current Innovation Center model, the Part D Senior Savings Model, in which only participating enhanced Part D drug plans cover insulin products at a monthly copayment of $35 in the deductible, initial coverage, and coverage gap phases of the Part D benefit. In 2023, a total of 2,881 Part D plans will participate in this model (a 33% increase over 2022), including 324 PDPs and 2,557 MA-PDs (including segmented plans). While this model will continue in 2023, beneficiaries do not need to enroll in one of the model-participating plans to benefit from the $35 monthly copay cap for insulin. Under the new Inflation Reduction Act requirement, Part D plans are not required to cover all available insulin products at the $35 monthly copayment amount, only those insulin products that are covered on a plan’s formulary.

Part D Premiums

Average Monthly Premiums for the 16 National PDPs Are Projected to Range from $6 to $111 in 2023

The estimated national average monthly PDP premium for 2023 is projected to be $43, a 10% increase from $39 in 2022, weighted by June 2022 enrollment (Table 2) – a rate of increase that outpaces both the current annual inflation rate and the Social Security cost-of-living adjustment for 2023. It is likely that the actual average weighted premium for 2023, after accounting for enrollment choices by new enrollees and plan changes by current enrollees, will be lower than this estimated average. CMS reported that the average premium for basic Part D coverage offered by both PDPs and MA-PDs will be an estimated $31.50 in 2023. Our premium estimate is higher because it is based on PDPs only (excluding MA-PDs, which have substantially lower premiums than PDPs) and includes PDPs offering both basic and enhanced coverage (enhanced plans, which account for 60% of all PDPs in 2022, have higher premiums than basic plans, on average).

PDP premiums will vary widely across plans in 2023, as in previous years. Among the 16 national PDPs, there is a difference of more than $1,200 in annual premiums between the highest-premium PDP and the lowest-premium PDP. At the high end, the monthly premium for AARP MedicareRx Preferred will be $111, totaling more than $1,300 annually. At the low end, the monthly premium for SilverScript SmartSaver will be $6, or $67 annually (Figure 4, Table 2).

Average Monthly Premiums for the 16 National Part D Stand-alone Drug Plans in 2023 Are Projected to Range from a High of $111 Down to $6

Changes to premiums from 2022 to 2023, averaged across regions and weighted by 2022 enrollment, also vary widely across PDPs, as do the absolute amounts of monthly premiums for 2023. Among the 16 national PDPs, average monthly premiums are increasing for 12 PDPs, including 4 PDPs with increases exceeding $10: Cigna Extra Rx (+$13, a 26% increase), Elixir RxSecure (+$12, a 35% increase), AARP MedicareRx Preferred (+$12, a 12% increase), and Humana Walmart Value Rx Plan (+$11, a 46% increase).

Monthly premiums are increasing in 2 of the top 3 PDPs ranked by total PDP enrollment:

  • For the largest PDP, CVS Health’s SilverScript Choice, which has a total of 3.0 million enrollees in 2022, including 1.4 million non-LIS enrollees, the average monthly premium will increase by $2 (+8%), from $31 in 2022 to $33 in 2023.
  • For the second largest PDP, Wellcare Value Script, with a total of 2.3 million enrollees in 2022, including 2.2 million non-LIS enrollees, the average monthly premium will decrease by $2 (-19%), from $12 in 2022 to $10 in 2023.
  • For the third largest PDP, AARP MedicareRx Preferred, with a total of 1.6 million enrollees, including 1.5 million non-LIS enrollees, the average monthly premium will increase by $12 (+12%) between 2022 and 2023, from $99 to $111. This is the highest average monthly premium among the national PDPs in 2023. Part D enrollees who have been enrolled in AARP MedicareRx Preferred since 2016 and stay enrolled in 2023 will be paying nearly $50 more per month in premiums – or roughly $600 more annually – than in 2016, when the average monthly premium for this PDP was $61.

Average Monthly Premiums Are Higher for PDPs Offering Enhanced Benefits and Lower or No Deductibles

Most Part D stand-alone drug plans in 2023 (62% of PDPs) will offer enhanced benefits for a higher average monthly premium, and most non-LIS PDP enrollees (75%) are enrolled in enhanced plans, based on June 2022 enrollment. Enhanced benefits can include a lower (or no) deductible, reduced cost sharing, or a higher initial coverage limit than under the basic benefit design. The average premium in 2023 for enhanced benefit PDPs is $48, which is $10 (28%) more than the monthly premium for PDPs offering the basic benefit ($37) (Figure 5).

Average Monthly Premiums Are Higher for PDPs Offering Enhanced Benefits and Lower or No Deductibles

In 2023, most PDPs (84%) will charge a deductible, including 7 in 10 PDPs (70%) charging the standard (maximum) amount of $505 in 2023. This is on top of the $1,600 Part A deductible and $226 Part B deductible for 2023. Across all PDPs, the average deductible in 2023 will be $408. The average monthly premium in 2023 for PDPs that charge no deductible is $99, more than three times the monthly premium for PDPs that charge the standard deductible ($30) and 66% higher than the monthly premium for PDPs charging a partial deductible ($60).

More than 6 in 10 Part D Stand-alone Drug Plan Enrollees Without Low-income Subsidies Will Pay Higher Premiums in 2023 If They Stay in Their Current Plan

More than 6 in 10 Part D stand-alone plan enrollees (62%) – 8.2 million of the 13.2 million Part D PDP enrollees who are responsible for paying the entire premium (which excludes Low-Income Subsidy (LIS) recipients) – will see their monthly premium increase in 2023 if they stay in their current plan, while 5.0 million (38%) will see a premium reduction if they stay in their current plan (Figure 6).

More than 6 in 10 Part D Stand-alone Drug Plan Enrollees Without Low-income Subsidies Will Pay Higher Premiums in 2023 If They Stay in Their Current Plan

While the average weighted monthly PDP premium is increasing by $4 between 2022 and 2023 (from $39 to $43), 2.1 million non-LIS enrollees (16%) will see a premium increase of $10 or more per month – or at least $120 more annually if they remain in their current plan. Substantially fewer non-LIS enrollees (0.1 million, or 1%) will see a premium reduction of the same magnitude. Nearly one-third (32%) of non-LIS enrollees (4.2 million) are projected to pay monthly premiums of at least $60 if they stay in their current plans, or more than $700 annually, including 1.6 million (12% of non-LIS enrollees) projected to pay monthly premiums of at least $100, or at least $1,200 annually. This group includes enrollees in the AARP MedicareRx Preferred PDP, along with enrollees in several Blue Cross/Blue Shield PDPs and other PDPs that are offered in selected regions but not nationwide.

Part D Cost Sharing

Part D Enrollees Pay Much Higher Cost Sharing for Brands and Non-preferred Drugs Than for Generic-Tier Drugs, and a Mix of Copays and Coinsurance for Different Formulary Tiers

In 2023, as in prior years, Part D enrollees will face much higher cost-sharing amounts for brands and non-preferred drugs (which can include both brands and generics) than for drugs on a generic tier, and a mix of copayments and coinsurance for different formulary tiers. The typical five-tier formulary design in Part D includes tiers for preferred generics, generics, preferred brands, non-preferred drugs, and specialty drugs.

Among all PDPs, median standard cost sharing in 2023 is $1 for preferred generics and $5 for generics, $44 for preferred brands (an increase from $42 in 2022), 45% coinsurance for non-preferred drugs (an increase from 40% in 2022; the maximum allowed is 50%), and 25% coinsurance for specialty drugs (the same as in 2022; the maximum allowed is 33%) (Figure 7, Table 3).

Figure 7: In 2023, Part D Enrollees Will Pay Much Higher Cost Sharing for Brands and Non-Preferred Drugs than for Drugs on a Generic Tier, and a Mix of Copays and Coinsurance for Different Formulary Tiers

Plans are implementing a mix of cost-sharing changes for 2023, with both increases and decreases in cost-sharing amounts on various formulary tiers. Among the notable changes:

  • For preferred generics, 2 fewer national PDPs will be charging $0 monthly copays in 2023 (5 PDPs) than in 2022 (7 PDPs).
  • For non-preferred drugs, cost sharing amounts are increasing in 7 of the 16 national PDPs (while decreasing in only 1 of the 16). In 12 of the 16 national PDPs, coinsurance amounts for non-preferred drugs will range from 40% to 50% (the maximum allowed for this tier) in 2023.
  • Close to half of all PDP enrollees in 2023 (44%, up from 34% in 2022) will face coinsurance ranging from 15% to 25% for preferred brands, rather than flat copays. Paying coinsurance rather than flat copayments makes it more difficult to know in advance what actual out-of-pocket costs will be, since that depends on the underlying list price of the drug.

Low-Income Subsidy Plan Availability

In 2023, a Smaller Number of Part D Stand-Alone Drug Plans Will Be Premium-Free to Enrollees Receiving the Low-Income Subsidy (Benchmark Plans) Than in Any Year Since Part D Started

Through the Part D LIS program, enrollees with low incomes and modest assets are eligible for assistance with Part D plan premiums and cost sharing. Nearly 13 million Part D enrollees are receiving LIS, including 7.3 million (57%) in MA-PDs and 5.5 million (43%) in PDPs.

In 2023, a smaller number of PDPs will be premium-free benchmark plans – that is, PDPs available for no monthly premium to Medicare Part D enrollees receiving the Low-Income Subsidy (LIS) – than in any year since Part D started in 2006, with 191 premium-free benchmark plans, or roughly a quarter of all PDPs in 2023 (Figure 8). The number of benchmark plans available in 2023 will vary by region, from three to eight (Table 1). In 2023, 89% of the 5.5 million LIS PDP enrollees are projected to be in PDPs operated by five firms: CVS Health, Centene, Humana, Cigna, and UnitedHealth (based on June 2022 enrollment).

In 2023, 191 Part D Stand-Alone Drug Plans Will Be Available Without a Premium to Enrollees Receiving the Low-Income Subsidy (“Benchmark” Plans), a 4% Reduction from 2022; the Average Beneficiary Will Have 5 Benchmark PDP Options in 2023

On average (weighted by Medicare enrollment), LIS beneficiaries have five benchmark plans available to them for 2023, which is about one-fifth the average number of PDP choices available overall and the lowest average number of benchmark plan options in any year since Part D started. All LIS enrollees can select any plan offered in their area, but if they enroll in a non-benchmark plan, they must pay some portion of their chosen plan’s monthly premium. In 2023, nearly one-fourth (24%) of all LIS PDP enrollees who are eligible for premium-free Part D coverage (1.0 million LIS enrollees) will pay Part D premiums averaging $25 per month unless they switch or are reassigned by CMS to premium-free plans.

Discussion

Our analysis of the Medicare Part D stand-alone drug plan landscape for 2023 shows that millions of Part D enrollees without low-income subsidies will face premium and other cost increases in 2023 if they stay in their current stand-alone drug plan. There are dozens of drug plan choices available to beneficiaries in each area during this year’s open enrollment period, including both PDPs (24 plans, on average) and Medicare Advantage drug plans (35 MA-PD plans, on average). There are also somewhat fewer benchmark plan options for Part D enrollees receiving Low-Income Subsidies. A narrower set of benchmark plan options could make it more difficult for some LIS enrollees to find a premium-free plan that covers all their prescription medications.

Some Part D stand-alone drug plan enrollees who choose to stay in their current plans may see lower premiums and other costs for their drug coverage, but nearly three-fourths of non-LIS PDP enrollees will face higher premiums if they remain in their current plan, and many will also face higher deductibles and cost sharing for covered drugs. Most Part D PDP enrollees who remain in their current plan for 2023 will be in a plan with the standard (maximum) $505 deductible and will face much higher cost sharing for brands than for generic drugs, including as much as 50% coinsurance for non-preferred drugs. Some beneficiaries could see overall cost savings, including the monthly premium, deductible, and cost sharing, if they switched to a lower-premium plan, while for other beneficiaries, a higher-premium plan might better meet their needs at a lower overall total cost.

Despite these year-to-year changes in plan coverage and costs, as well as changes in beneficiaries’ health needs, other KFF analysis finds that most Medicare beneficiaries did not compare plans during a recent open enrollment period, and most Part D enrollees did not compare the coverage offered by their drug plan to other drug plans. Comparing and choosing among the wide array of Part D plans can be difficult, given that plans differ from each other in multiple ways beyond premiums, including cost sharing, deductibles, covered drugs, and pharmacy networks. Comparing Medicare Advantage drug plans may be made more difficult by the fact that not only drug coverage varies but also other features, including cost sharing for medical benefits, provider networks, and coverage and costs for supplemental benefits. Because Part D plans differ in several ways that can have a significant effect on an enrollee’s access to medications and out-of-pocket drug spending, all Part D enrollees could benefit from the opportunity to compare plans during open enrollment.

Juliette Cubanski is with KFF. Anthony Damico is an independent consultant.

Methods

This analysis focuses on the Medicare Part D stand-alone prescription drug plan marketplace in 2023 and trends over time. The analysis focuses on the 18.7 million enrollees in stand-alone PDPs, as of March 2022. The analysis excludes 23.5 million MA-PD enrollees (non-employer), and another 4.3 million enrollees in employer-group only PDPs and 3.1 million in employer-group only MA-PDs for whom plan premium and benefits data are unavailable.

Data on Part D plan availability, enrollment, and premiums were collected from a set of data files released by the Centers for Medicare & Medicaid Services (CMS):

- Part D plan landscape files, released each fall prior to the annual enrollment period

- Part D plan and premium files, released each fall

- Part D plan crosswalk files, released each fall

- Part D contract/plan/state/county level enrollment files, released monthly

- Part D Low-Income Subsidy enrollment files, released each spring

- Medicare plan benefit package files, released periodically each year

In this analysis, premium and deductible estimates are weighted by June 2022 enrollment unless otherwise noted. Percentage and dollar differences are calculated based on non-rounded estimates and in some cases differ from percentages and dollar differences calculated based on rounded estimates presented in the text. 

Tables

Medicare Part D Stand-alone Prescription Drug Plans, Benchmark Plans, and Monthly Premiums, 2022 and 2023
National Medicare Part D Stand-alone Prescription Drug Plans in 2023
Median Standard Cost-Sharing Amounts in National Medicare Part D Stand-alone Prescription Drug Plans, 2022 and 2023

COVID-19 leading cause of death ranking

Authors: Jared Ortaliza, Krutika Amin, and Cynthia Cox
Published: Nov 10, 2022

COVID-19 is on track to be the third leading cause of death in the United States for the third year in a row. The virus claimed more than 340,000 lives in 2020, 475,000 lives in 2021, and so far, has taken 230,000 lives in 2022 through September. This updated issue brief examines COVID-19’s effect on mortality rates.

The updated analysis finds that nearly as many people died of COVID-19 in January and February of 2022 as typically die from heart disease. The virus was the No. 1 cause of death for people over age 45 in January. COVID-19 deaths have since declined, but the virus remains a leading cause of death in the U.S..

The analysis can be found on the Peterson-KFF Health System Tracker, an information hub dedicated to monitoring and assessing the performance of the U.S. health system.

News Release

National and State Analysis of the Role of Health Care and Abortion in the Midterm Available through KFF Online Dashboard

Published: Nov 9, 2022

Supplemental KFF Questions Added to AP VoteCast Survey Provide Deeper Insight About the Impact of Abortion and Health Care Issues

Health Care Costs Were Among Economic Concerns for Voters Motivated by Inflation, and Abortion Was a Motivating Factor for Many Democratic Voters and Women

Inflation was widely expected to be the driving issue for voters on Election Day, and poll results bear this out. However, beyond inflation, seven in ten voters said the Supreme Court’s decision to overturn Roe was important to their vote, with one-quarter calling it the single most important factor, half as many as said the same about inflation.

More than half of Democratic voters and women voters under age 50 said the Supreme Court overturning Roe had a “major impact” on which candidates they voted for in this election as well as their decision about whether to turn out to vote.

KFF, in partnership with the Associated Press (AP), examined the role that health care played in the 2022 midterm election by adding supplemental questions to the AP VoteCast survey of midterm voters. These questions and KFF’s analysis examine the role health care costs play in voters’ concerns around inflation as well as the impact that the Supreme Court decision overturning Roe had on their decision to vote and who to vote for.

Despite the clamor about gas prices, the high cost of food was by far the top inflation-related concern that voters said was a factor in their vote. Health and prescription drug prices were also in the mix, just trailing gas prices and about the same as utilities and housing costs, underscoring that voters see health as a pocketbook issue.

Available through an online interactive dashboard, KFF provides data and analysis of the overall AP VoteCast survey and these supplemental questions at both the national and state level. The dashboard includes:

  • An interactive map for a closer look at states with health-related ballot measures and those with competitive Senate and governor races to examine the role of abortion in motivating voters in those states.
  • A block of charts looking at the motivations of voters and the impact of the Supreme Court decision on Roe in states which had abortion ballot initiatives on the ballot.
  • A curated set of charts providing key analysis among subgroups of voters on topics like abortion ballot measures, issues in competitive races, and voters’ views of the most important issues facing the U.S., including where health care ranks compared to other issues.

The AP VoteCast is a national survey and 48 state surveys of 2022 midterm voters conducted by NORC at the University of Chicago for the AP and Fox News beginning on Oct. 31 and concluding as polls closed on Nov. 8, 2022, in English and Spanish. The national survey was conducted using the NORC’s probability-based AmeriSpeak panel, while the individual state surveys were conducted from a random sample of state voter files and from self-identified registered voters selected from non-probability online panels. More details are available about AP VoteCast’s methodology.

Update on Children’s COVID-19 and Routine Vaccination Trends Heading into Winter and as Respiratory Viruses Surge

Published: Nov 9, 2022

For updated data on child vaccination trends, including MMR vaccination coverage and vaccine exemption rates, read our latest analysis: Headed Back to School in 2024: An Update on Children’s Routine Vaccination Trends

In recent weeks, cases of respiratory syncytial virus (RSV) in younger children have surged, and the Centers for Disease Control and Prevention (CDC) has reported seeing early increases in seasonal flu cases. The CDC notes that the past two years have seen low flu activity, likely meaning reduced population immunity headed into this years’ flu season, especially among young children who have never been exposed to or vaccinated against the flu. Winter could also bring an increase in COVID-19 cases, as the weather gets colder and activities move indoors. While children’s cases of COVID-19 are usually mild, this is not always the case, and children are particularly vulnerable to flu and RSV. The combination of all three could have more serious ramifications for children and also has the potential to overwhelm hospitals. Vaccination against COVID-19 and flu can provide protection; however, COVID-19 vaccination rates have stalled and remain low for younger children and other routine vaccination rates may have been impacted by the pandemic. This policy watch describes recent trends in children’s COVID-19 and routine vaccinations and explores strategies to increase vaccination rates among children as we head into the winter season.

COVID-19 vaccine uptake among children has stalled and vaccination rates remain low for young children. As of November 2, 2022, 3.2% of children under age five and 31.8% of children ages 5-11 had completed their primary series, which is the initial doses of a COVID-19 vaccine, most commonly two shots of a mRNA vaccine but can vary by age, immune status, and vaccine product (Figure 1). Uptake is higher among those ages 12-17, at 61.1%. Some of this variation in uptake reflects the amount of time since COVID-19 vaccines were authorized by the FDA for different age groups. The vaccine was first authorized for 16 and 17 year-olds in December 2020 and for 12-15 year-olds in May 2021. It was authorized for 5-11 year-olds in November of 2021 and finally, for children under age five in June of 2022. However, some of it reflects parental views and concerns. KFF’s COVID-19 Vaccine Monitor from September 2022 reported that over half (53%) of parents of children under five and over a third (35%) of parents of children ages 5-11 said they will “definitely not” get their child vaccinated.  KFF surveys from July 2022 found parents of young children were concerned about the newness of the vaccine and not enough testing or research, side effects, and worries over the overall safety of the vaccines.

Percent of Children With Completed COVID-19 Primary Series, by Age Group

Bivalent boosters were recently authorized for children ages five and older, but it is unclear how many children will get the new booster. Children’s vaccination rates for the first booster (no longer authorized) were low. As of November 2nd, 5.3% of children ages 5-11 and 18.2% of children ages 12-17 had received their first booster dose. Completion of the primary series at least two months earlier is required to receive the new bivalent booster; thus, low primary series rates, especially among children ages 5-11, means fewer children are eligible for the new booster. As of November 2nd, 0.5% of children ages 5-11 and 2.6% of children ages 12-17 have received an updated (bivalent) booster dose. While children usually have more mild COVID-19 cases, some children do develop severe illness and some have shown symptoms of long COVID following diagnosis. Boosters combat waning immunity and can help reduce the risk of infection and onward transmission.

The pandemic has also led to declines in children’s flu vaccinations, though the impact of the pandemic on other routine vaccinations remains uncertain. While children’s flu vaccination rates from last year’s flu season (2021-2022) were similar to the previous year (2020-2021), they were almost 6 percentage points lower than in 2019-2020, right before the pandemic began. Flu vaccination rates among children vary widely by state and appear to be correlated with COVID-19 vaccination, meaning states with higher uptake of flu vaccination last season also have higher uptake of COVID-19 vaccination, and vice versa (Figure 2). Some public health leaders have expressed concern that COVID-19 vaccine hesitancy may be spilling over to routine child immunizations, and one study found factors impacting COVID-19 vaccine uptake could be impacting flu vaccine uptake. In addition, vaccination rates for other routine childhood vaccines also declined early in the pandemic, and the CDC reports vaccination coverage of all state-required vaccines for children in kindergarten (MMR, DTaP, and varicella) declined slightly by 1% in the 2020-2021 school year (the first full-pandemic school year) compared to the previous school year. Some states and local areas have more recently reported seeing reduced childhood immunization rates. However, CDC data for the most recent two school years are not yet available, and the overall impact on childhood routine vaccination rates remains unclear at this time.

Relationship Between Children's COVID-19 Primary Series Vaccination Rates and Children's Flu Vaccination Rates Last Flu Season

There are specific policy considerations for vaccinating young children, and some states have developed successful strategies for increasing vaccination rates among children. States with the highest COVID-19 vaccination rates among children ages 5-11 used incentives, school-based vaccination clinics, parent-friendly websites, and the media to encourage parents to vaccinate their young child. School vaccine mandates can also be used as a tool to increase COVID-19 vaccine uptake among children, but at this time, only a few states have COVID-19 vaccine mandates for school staff or students. Preventive care appointments are also an important component when addressing routine vaccination rates, as some parents may not encounter an offer of a vaccine until they go in for a routine visit to a pediatrician and pediatricians are considered highly trusted sources of information by parents. Recently, the CDC’s Advisory Committee on Immunization Practices (ACIP) voted to add the COVID-19 vaccines to the recommended pediatric immunization schedule that includes the other routine vaccines for children depending on age. This is part of a regular, annual process in which ACIP meets to vote on adding newly recommended vaccines to the child and adult immunization schedules.

Because Medicaid covers four in ten children in the U.S., the program can play an important role in facilitating access to COVID-19 and other routine vaccines for children, especially those who are low-income. To increase COVID-19 vaccine uptake, state Medicaid programs and Medicaid managed care plans have undertaken various initiatives, including financial incentives for managed care plans that meet vaccination targets. Other recent federal actions can help increase routine vaccination rates more broadly. Data for children enrolled in Medicaid and CHIP showed a 9% decline in all routine vaccinations when comparing the COVID-19 public health emergency (PHE) period (March 2020 – April 2022) to a pre-PHE period (January 2018 – February 2020), with the largest declines for HPV, hepatitis A, and flu vaccines. Provisions included in recent legislation to bolster Medicaid’s Early and Periodic Screening, Diagnostic and Treatment (EPSDT) benefit can help more Medicaid-covered children receive all recommended screenings and services, which includes routine vaccinations. Further, the Child Core Set measures, designed to improve the quality of care for children in Medicaid and CHIP, will become mandatory to report in 2024 and track state-level immunization rates for children and adolescents.

Children will still be able to access needed COVID-19 vaccines for free following the end of the COVID-19 PHE and even when federal supplies of vaccines run out. While the end of the PHE as well as the depletion of federally-purchased supply could curtail access to some COVID-19 countermeasures like tests and treatments, COVID-19 vaccines, including boosters, will continue to be available for free to all children even when there is no longer any federally-purchased supply remaining or PHE protections in place. Once the supply of government-purchased vaccines runs out, the Vaccines for Children program (VFC) will provide access to COVID-19 vaccines for children who have Medicaid, who are uninsured or underinsured, or identify as American Indian or Alaska Native. While vaccines are free through the VFC program, participating health care providers can charge an administrative fee. Children who are uninsured may be eligible for free or reduced cost off vaccine administration through a community health center.

As we head into the winter season, RSV and other respiratory viral infections are surging in young children, flu infections are higher than usual for the time of year, and COVID-19 cases are also expected to rise. At same time, children’s COVID-19 vaccination rates have stalled and remain low, and other routine children’s vaccinations may have also declined since the pandemic began. While most children have mild COVID-19 cases, vaccines can offer protection for children and families as travelling and gatherings ramp up for the holiday season. Various tools, including incentives, outreach, and the media, can be used to increase children’s COVID-19 vaccination rates as well as routine vaccinations more broadly.

Poll Finding

KFF/AP VoteCast: Health Care In The 2022 Midterm Election

Published: Nov 9, 2022
This interactive dashboard provides insights from AP VoteCast election polling of the 2022 midterm elections, taking a closer look at the role that health care issues may have played in voters’ decisions. Updated: 5pm ET on 11/14/2022.
Interactive DataWrapper Embed

  • Half Of Voters Say Inflation Was The Single Most Important Factor In Their Vote, While A Quarter Say Overturn Of Roe Was Most Important

    Half Of Voters Say Inflation Was The Single Most Important Factor In Their Vote, While A Quarter Say Overturn Of Roe Was Most Important
  • Inflation Is The Top Issue For Most Voters, While A Third Of Women Under 50 Say The Supreme Court Overturning Roe Is Single Most Important Factor In Their Vote

    Inflation Is The Top Issue For Most Voters, While A Third Of Women Under 50 Say The Supreme Court Overturning Roe Is Single Most Important Factor In Their Vote

  • More Than Half Of Democratic Voters And Younger Women Voters Say Supreme Court Decision Had Major Impact On Their Voting Decision

    More Than Half Of Democratic Voters And Younger Women Voters Say Supreme Court Decision Had Major Impact On Their Voting Decision
  • Voters Who Say Abortion Should Be Legal, Voted For Democratic House Candidates More Likely To Say Supreme Court Decision Mattered In Their Vote

    Voters Who Say Abortion Should Be Legal, Voted For Democratic House Candidates More Likely To Say Supreme Court Decision Mattered In Their Vote

  • About Four In Ten Voters Across States With Abortion On Their Ballot Say Overturning Roe Had A Major Impact On their Decision To Turn Out To Vote

    About Four In Ten Voters Across States With Abortion On Their Ballot Say Overturning Roe Had A Major Impact On their Decision To Turn Out To Vote
  • Four In Ten Kentucky Voters Say Supreme Court Decision Had Major Impact On Whether They Turned Out To Vote, Including Six In Ten Democratic Voters

    Four In Ten Kentucky Voters Say Supreme Court Decision Had Major Impact On Whether They Turned Out To Vote, Including Six In Ten Democratic Voters

  • Majorities Of Michigan Voters Say Both Outcome Of Abortion Ballot Initiative And Governor Race Was Very Important

    Majorities Of Michigan Voters Say Both Outcome Of Abortion Ballot Initiative And Governor Race Was Very Important
  • Large Shares Of Democratic Women Voters In Michigan Say The Supreme Court Overturning Roe Had A Major Impact On Their Vote

    Large Shares Of Democratic Women Voters In Michigan Say The Supreme Court Overturning Roe Had A Major Impact On Their Vote

  • About One-Fourth Of Vermont Voters Say Supreme Court Overturning Roe Was Most Important Factor In Vote

    About One-Fourth Of Vermont Voters Say Supreme Court Overturning  Roe  Was Most Important Factor In Vote
  • Nearly Three In Ten California Voters Say Supreme Court Overturning Roe Was Most Important Factor In Their Vote, More Than Half Of Democratic Voters In State Say It Had Major Impact

    Nearly Three In Ten California Voters Say Supreme Court Overturning Roe Was Most Important Factor In Their Vote, More Than Half Of Democratic Voters In State Say It Had Major Impact

  • In Pennsylvania, Large Shares Of Voters Of The Democratic Candidates Say Their Decisions Were Majorly Impacted By The Supreme Court Decision On Roe v. Wade

    In Pennsylvania, Large Shares Of Voters Of The Democratic Candidates Say Their Decisions Were Majorly Impacted By The Supreme Court Decision On Roe v. Wade
  • Nearly Half Of Arizona Voters Say Supreme Court Decision Had A Major Impact On Their Candidate Choice In This Election, Including Two-Thirds Who Voted For Democratic Candidates

    Nearly Half Of Arizona Voters Say Supreme Court Decision Had A Major Impact On Their Candidate Choice In This Election, Including Two-Thirds Who Voted For Democratic Candidates

  • Two-Thirds Of Voters For Stacey Abrams (D) and Raphael Warnock (D) Say The Supreme Court Overturning Roe Was A Major Factor In Their Candidate Choice

    Two-Thirds Of Voters For Stacey Abrams (D) and Raphael Warnock (D) Say The Supreme Court Overturning Roe Was A Major Factor In Their Candidate Choice
  • At Least Three Times As Many Voters For Democratic Candidates In The Nevada Midterms Say Roe Had A Major Impact On Their Decision To Turnout And Candidate Choice

    At Least Three Times As Many Voters For Democratic Candidates In The Nevada Midterms Say Roe Had A Major Impact On Their Decision To Turnout And Candidate Choice

  • Large Shares Of Democratic Voters In The Wisconsin Midterms Say Overturning Roe Had A Major Impact On Their Decision To Vote, Who To Vote For

    Large Shares Of Democratic Voters In The Wisconsin Midterms Say Overturning Roe Had A Major Impact On Their Decision To Vote, Who To Vote For
  • For Many Voters In Competitive Races, The SCOTUS Decision On Roe Had A Major Impact On Their Vote Choice And Turnout

    For Many Voters In Competitive Races, The SCOTUS Decision On Roe Had A Major Impact On Their Vote Choice And Turnout

  • Half Of Voters Say The Economy Is Most Important Issue Facing The Country

    Half Of Voters Say The Economy Is Most Important Issue Facing The Country
  • Voters, Regardless Of Partisanship, Identify Economy As Most Important Issue Facing The Country

    Voters, Regardless Of Partisanship, Identify Economy As Most Important Issue Facing The Country

  • The Cost Of Groceries Top Economic Concerns, Health Care Costs Ranks Alongside Other Expenses

    The Cost Of Groceries Top Economic Concerns, Health Care Costs Ranks Alongside Other Expenses
  • The Cost Of Groceries Is Top Economic Concern Across Partisans, Health Care Costs Rank Higher Among Democratic Voters

    The Cost Of Groceries Is Top Economic Concern Across Partisans, Health Care Costs Rank Higher Among Democratic Voters

  • The Cost Of Groceries Is Top Economic Concern Among White, Black, And Hispanic Voters; One In Five Black Voters Say Housing Is Top Concern

    The Cost Of Groceries Is Top Economic Concern Among White, Black, And Hispanic Voters; One In Five Black Voters Say Housing Is Top Concern
  • Democratic Candidates Had Advantage Among Voters Who Said Cost Of Health Care, Housing, And Child Care Were Most Important Economic Concern; Republicans Won Over Voters Concerned About Gas, Utilities, Groceries

    Democratic Candidates Had Advantage Among Voters Who Said Cost Of Health Care, Housing, And Child Care Were Most Important Economic Concern; Republicans Won Over Voters Concerned About Gas, Utilities, Groceries