Implications of Continuous Eligibility Policies for Children’s Medicaid Enrollment Churn
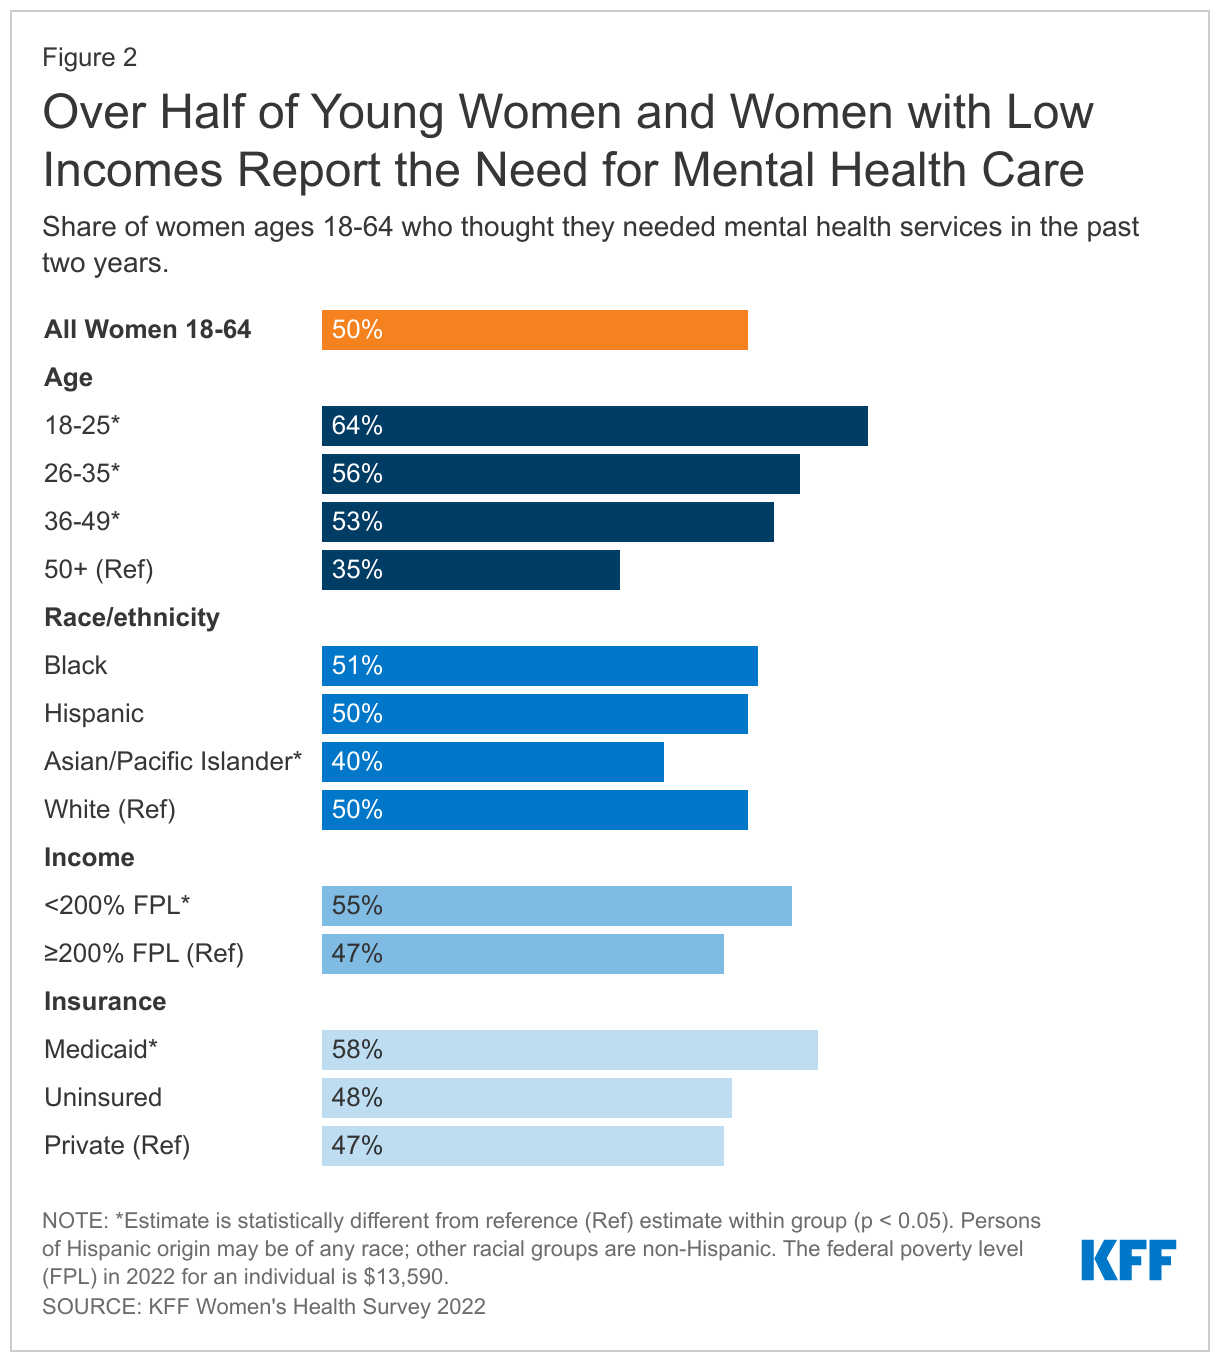
Summary and Key Takeaways
Provisions in an omnibus spending bill currently under consideration in Congress would require all states to adopt continuous eligibility for children in both Medicaid and the Children’s Health Insurance Program (CHIP) and would decouple the Medicaid continuous enrollment requirement from the public health emergency (PHE). States currently have the option to provide 12 months of continuous coverage for children in Medicaid and/or separate CHIP, and about half of states do so for all children in Medicaid. Although states may only renew coverage for children once per year, children may lose coverage before the renewal period on account of changes in circumstances or administrative procedures such as data checks. Current continuous eligibility policies for children in Medicaid allow a child to remain enrolled for a specific period of time unless the child ages out of coverage, moves out of state, voluntarily withdraws, or, in some cases, does not make premium payments. KFF analysis of the Centers for Medicare and Medicaid Services (CMS) Performance Indicator Project Data finds 37.8 million children were enrolled in Medicaid (including Medicaid expansion CHIP) as of August 2022, with about half of those children in states with 12-month continuous eligibility and about half in states without the policy.
This analysis uses Medicaid claims data to follow a cohort of children newly enrolled in Medicaid in July 2017 in states with and without 12-month continuous eligibility to examine how children’s enrollment in Medicaid changes over time and understand the effect of continuous eligibility policies. Key findings include the following:
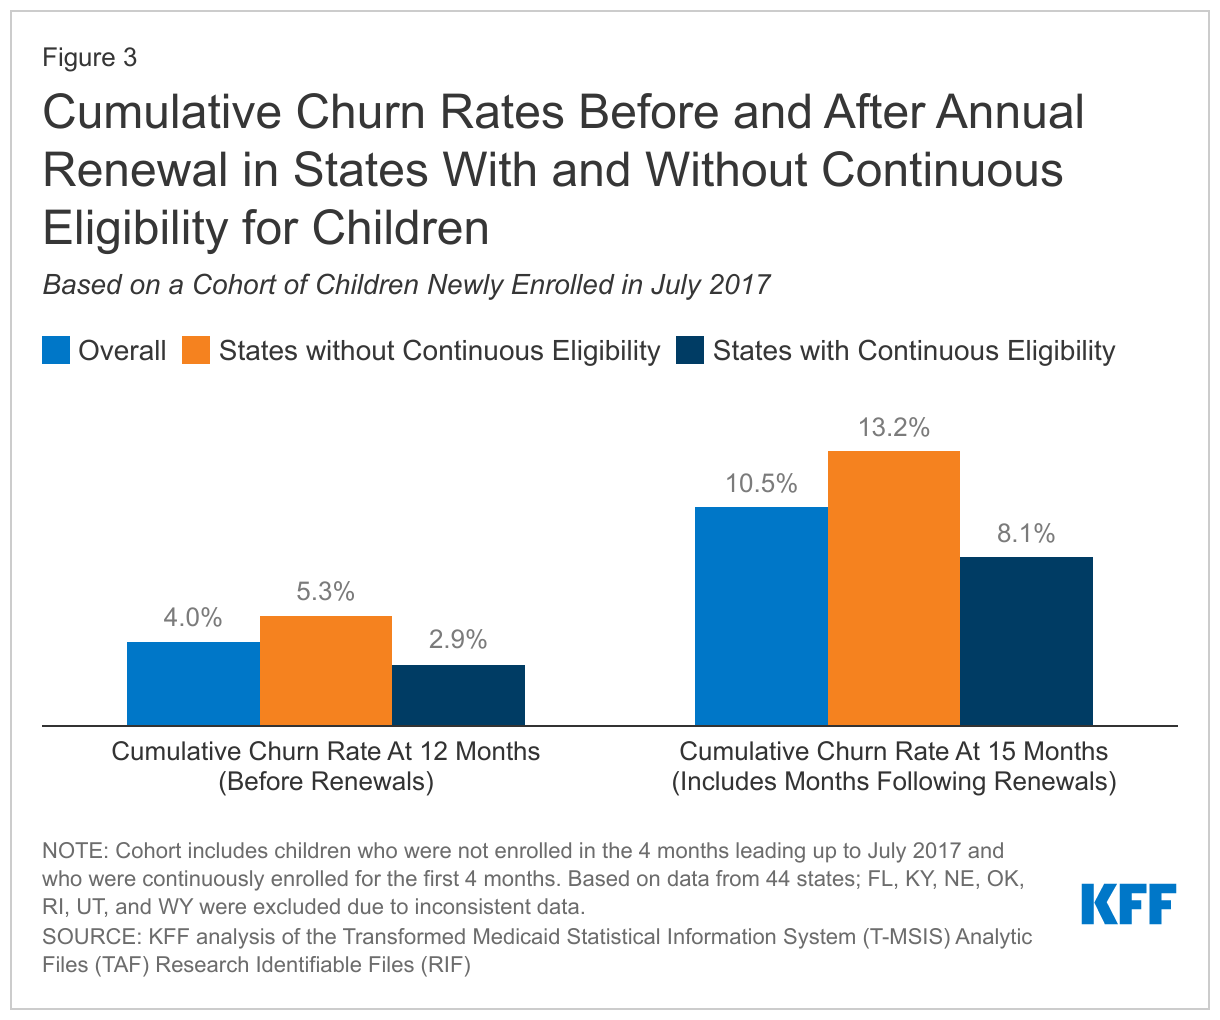
- The disenrollment rate was lower for children in states with 12-month continuous eligibility policies in the period before annual renewals. The percentage of children who disenrolled and then re-enrolled within the year (or “churned” in and out of Medicaid) was also lower in states with 12-month continuous eligibility (2.9%) compared to states without the policy (5.3%).
- Following annual renewals, the cumulative disenrollment more than doubled – some of which is to be expected, with family income changes – but cumulative churn also more than doubled from 4.0% in month 12 to 10.5% in month 15, signaling many eligible children are losing coverage at their annual renewal. Churn and disenrollment rates increased sharply in states with and without 12-month continuous eligibility following annual renewal, though increases were larger in states without 12-month continuous eligibility.
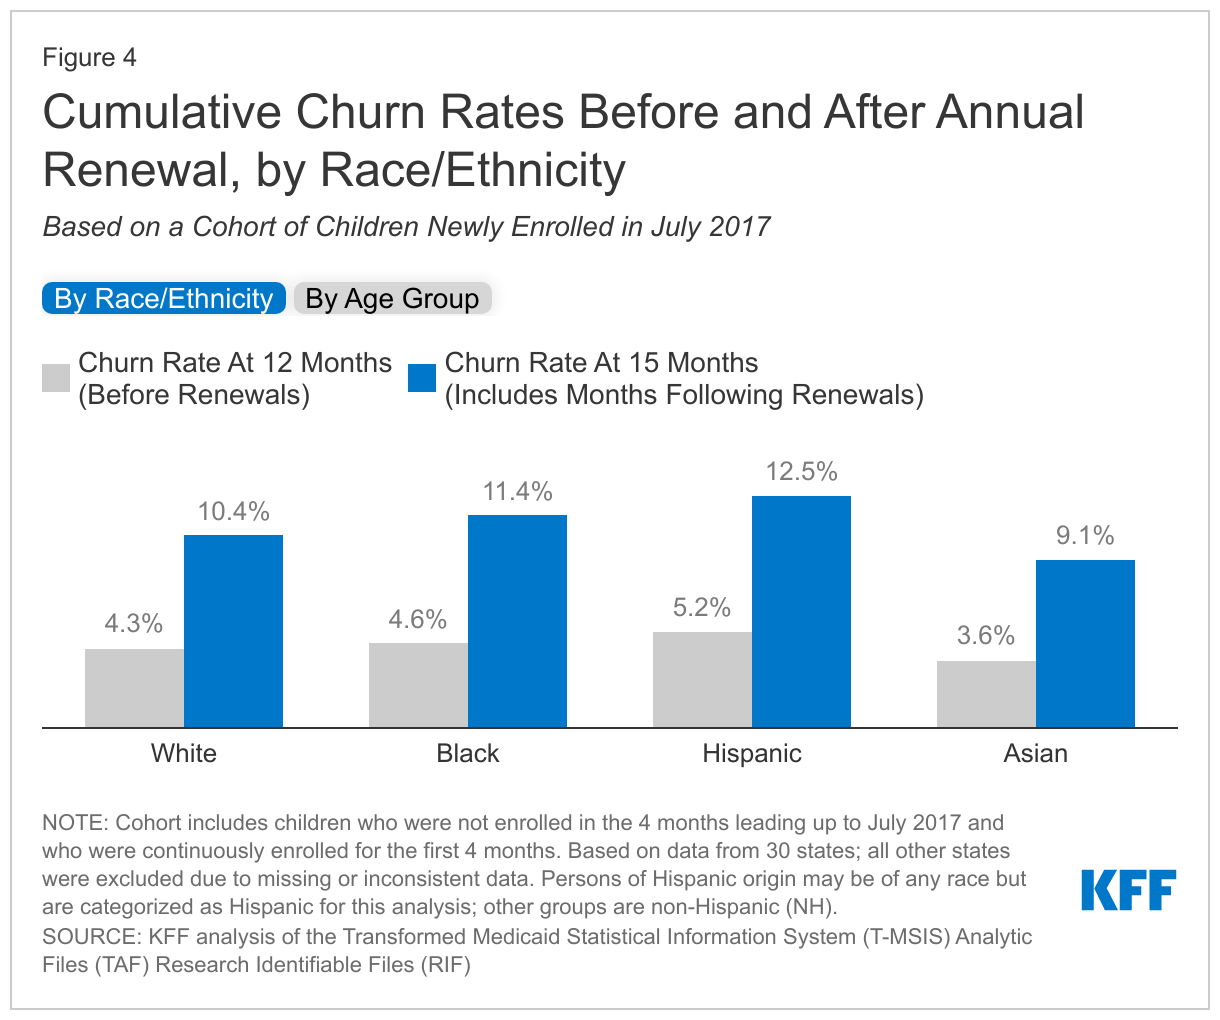
- While churn rates increased among all racial/ethnic groups following annual renewal, the increase was largest for Hispanic children, growing from 5.2% in month 12 to 12.5% in month 15.
Our findings indicate that 12-month continuous eligibility policies are effective tools to reduce Medicaid disenrollment and churn rates within the year. However, some children may still lose coverage at annual renewal regardless of state adoption of 12-month continuous eligibility, and multi-year continuous eligibility policies could help children maintain coverage beyond one year and keep children from losing coverage during the renewal process. These findings are particularly relevant to the current policy landscape with provisions in the omnibus spending bill. In addition, following approval in Oregon, other states are seeking waivers to provide Medicaid continuous eligibility for multiple years, especially for young children. Lastly, all states will be required to conduct renewals for all individuals on Medicaid when the Medicaid continuous enrollment requirement ends, and an estimated 5.3 million children could lose Medicaid/CHIP coverage during the unwinding period.
What is continuous eligibility?
Under current law states are required to renew coverage for most children in Medicaid and CHIP no more than once every 12 months, but children may lose coverage before the renewal period under certain circumstances. Even with an annual renewal process, states can redetermine eligibility due to a change in circumstance (such as an increase in family income) at any point during the year, and some states conduct data matches on a periodic basis to identify changes in circumstances between annual renewal periods. Children may be disenrolled at annual renewal for a variety of reasons, including because they are no longer eligible for the program or they experience barriers navigating the redetermination process despite remaining eligible. Children can also voluntarily withdraw at any point (often when they have another source of coverage).
Under current law, states have the option to provide 12-months of continuous coverage for children in Medicaid and/or separate CHIP. Continuous eligibility policies for children in Medicaid allow a child to remain enrolled for a specific period of time even if there are fluctuations in income. Continuous eligibility would not apply if a child ages out of coverage, moves out of state, voluntarily withdraws, or, in some cases, does not make premium payments, and children in states with 12-month continuous eligibility are still subjected to annual renewals. As of January 2022, 24 states provided 12-month continuous eligibility for all children in Medicaid, and KFF analysis of CMS Performance Indicator Project Data finds, among all children in Medicaid (including Medicaid expansion CHIP) as of August 2022, 19.3 million (or 51% of) children were in states with 12-month continuously eligibility and 18.5 million (or 49% of) children were in states without the policy.1
The Families First Coronavirus Response Act (FFCRA) requires states to provide continuous Medicaid enrollment in exchange for enhanced federal matching funds during the pandemic. Under FFCRA, the continuous enrollment requirement is in effect through the end of the month in which the PHE ends. During this time, states have not been able to disenroll people from Medicaid; however, when the continuous enrollment requirement ends, all Medicaid enrollees will undergo the renewal process, and millions of people, including children, could lose coverage if they are no longer eligible or face administrative barriers during the process despite remaining eligible. The current PHE is in effect until January 11, 2023, and the Biden administration has said it will give states a 60-day notice before ending the PHE. Since that notice was not issued in November 2022, it is expected the PHE will be extended again.
Provisions in an omnibus spending bill currently under consideration in Congress would require all states to adopt continuous eligibility for children in both Medicaid and CHIP and would decouple the Medicaid continuous enrollment requirement from the PHE. Under this legislation, all states would be required to implement 12-months continuous eligibility for children beginning on January 1, 2024. In addition, the bill would terminate the Medicaid continuous enrollment requirement on March 31, 2023, and permit states to resume disenrollments beginning in April 2023. Enhanced federal funding would continue to be available to states that comply with requirements for redeterminations during the transition period, though the enhanced funding would phase down through December 2023.
Continuous eligibility policies have been shown to lower rates of churn. Churn occurs when individuals temporarily lose Medicaid coverage and disenroll and then re-enroll within a short period of time. Churn in Medicaid suggests that some children are disenrolled due to short-term changes in income or circumstances that made them temporarily ineligible or are disenrolled for procedural reasons because they were unable to complete the redetermination process. When individuals churn on and off coverage, they experience gaps in coverage that could limit access to care and lead to delays in getting needed care. Gaps in coverage can be especially problematic for young children who are recommended to receive frequent screenings and check-ups.
Oregon was the first state to receive waiver approval to implement continuous coverage for children beyond 12-months. To extend continuous eligibility for children for multiple years or for adults for 12 months or longer, states must use the Section 1115 waiver process. Oregon received approval of a Section 1115 waiver application in September 2022 to provide continuous eligibility for children in Medicaid from birth until age six as well as two years of continuous eligibility for all enrollees age six and older. Other states have proposals in development or pending CMS approval.
What is the effect of 12-month continuous eligibility?
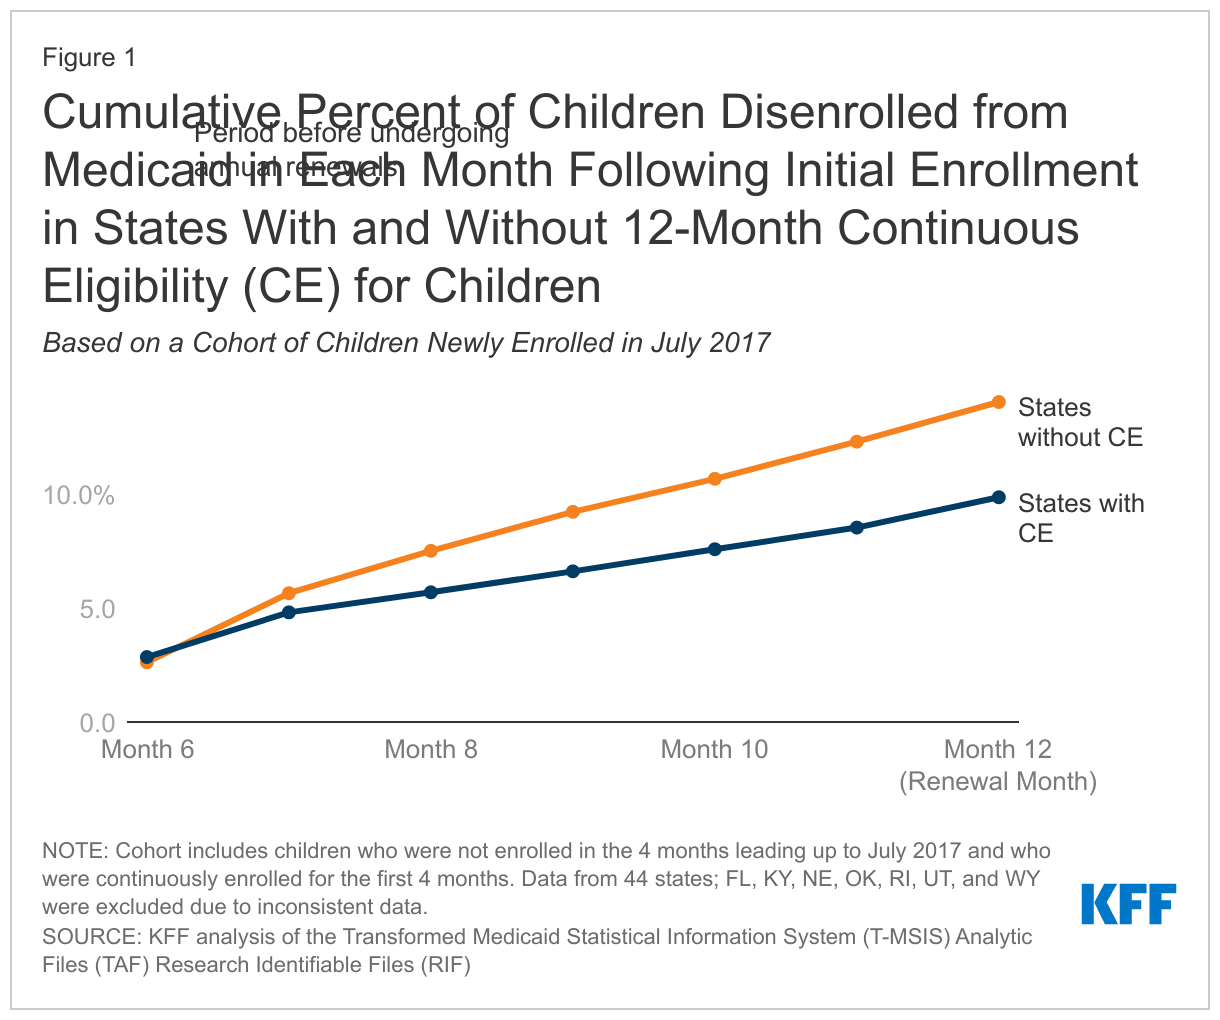
Disenrollment rates were lower for children in states with 12-month continuous eligibility policies. In the months leading up to annual renewal, the percentage of children who were disenrolled was lower in states with 12-month continuous eligibility compared to states without. By month 12, the cumulative disenrollment rate was 9.9% in states with 12-month continuous eligibility compared to 14.0% in states without the policy (Figure 1). The percentage of children who disenrolled and then re-enrolled in Medicaid within a short time period (or “churned” in and out of Medicaid) was also lower in states with 12-month continuous eligibility policies. Among all children, in states with continuous eligibility, 2.9% churned compared with 5.3% in states without continuous eligibility (Figure 3). There may be other policy differences between states with and without continuous eligibility that also contribute to the variation in disenrollment and churns rates, but these are outside the scope of this analysis.
What happens to disenrollment and churn after 12-month renewals?
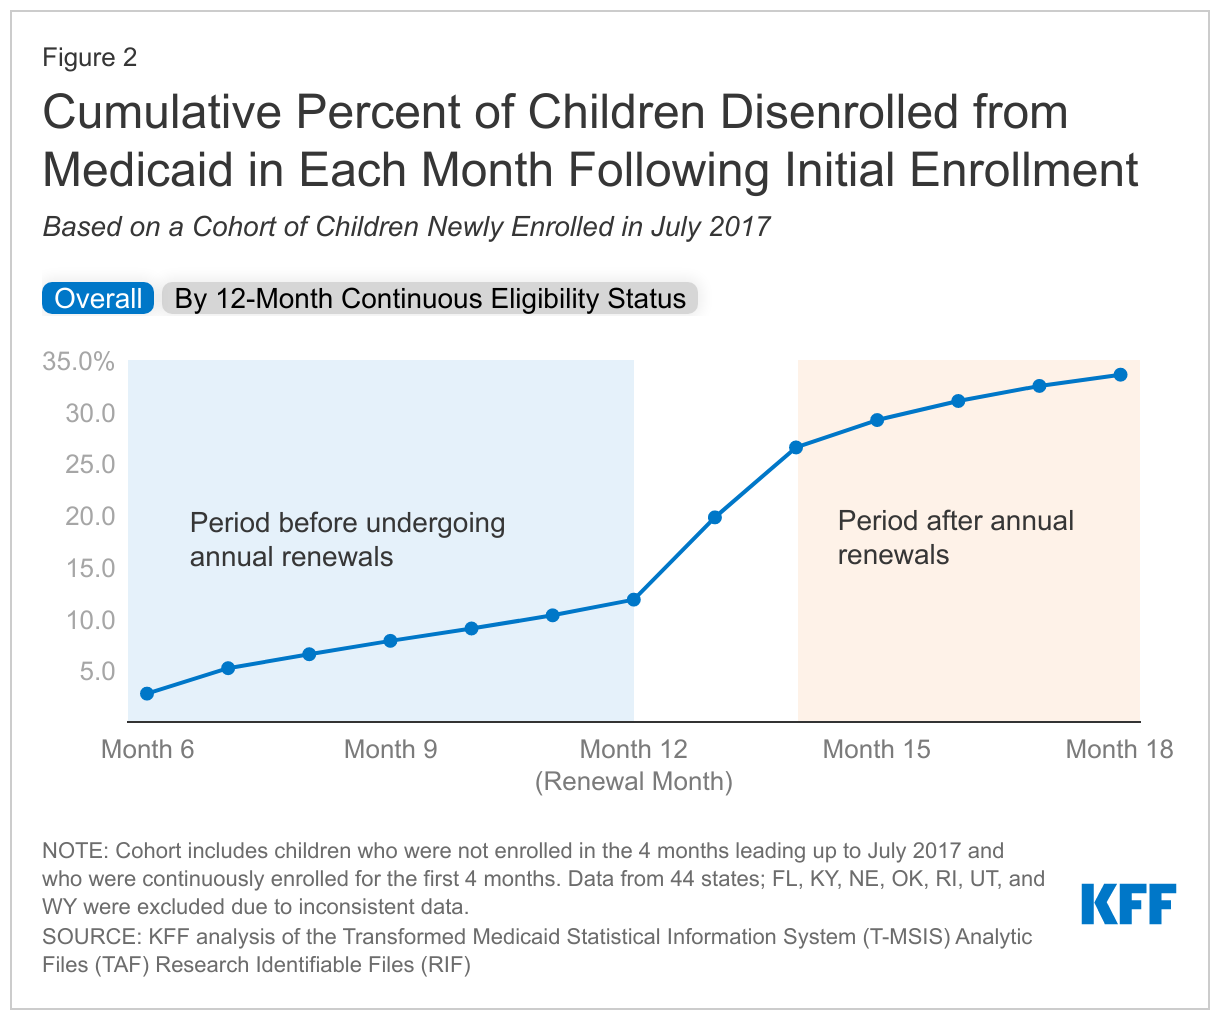
Among all states, the disenrollment rate more than doubled following annual renewal. The cumulative disenrollment rate increased from 11.8% in month 12 (prior to completion of the annual redetermination) to 29.2% in month 15 (after the annual redetermination was completed), a 17.4 percentage point increase (Figure 2). Children can be disenrolled at annual renewal for a number of reasons, including because they are no longer eligible for the program or they experience barriers navigating the redetermination process despite remaining eligible. While disenrollment rates increased in both states with and without 12-month continuous eligibility after month 12, disenrollment rates remained lower in states with 12-month continuous eligibility. This could be due to another period of 12-month continuous eligibility beginning as well as other differences in enrollment practices between states with and without continuous eligibility.
The churn rate also more than doubled following annual renewal, suggesting many children may be disenrolled due to administrative barriers at their annual renewal. The cumulative churn rate increased from 4.0% in month 12 to 10.5% in month 15 (Figure 3). Churn rates sharply increased after month 12 for states with 12-month continuous eligibility and states without; however, the increase was smaller for states with 12-month continuous eligibility (5.2 percentage points) compared to those without (7.9 percentage points). High rates of churn indicate that children are losing coverage for procedural reasons or because of temporary fluctuations in income.
While churn rates increased among all racial/ethnic groups following annual renewal, the increase was largest for Hispanic children. This suggests Hispanic children may be more likely to experience income volatility or be disenrolled for procedural reasons at annual renewal compared to children of other races (Figure 4). Even before annual renewals at month 12, Hispanic children had slightly higher cumulative churn (5.2%) compared to other groups, but the gap widened following annual renewal.
Excluding infants, churn rates were similar across age groups before renewal at month 12, and all age groups experienced a similar increase in churn following annual renewal. Infants had the lowest cumulative churn rate at month 12 (2.2%), but experienced a sharp increase following annual renewal, reaching 9.8% by month 15, which is similar to the cumulative churn rates for the other age groups (Figure 4).
Looking Ahead
12-month continuous eligibility policies are effective tools to reduce Medicaid disenrollment and churn rates within the year. This analysis confirms what other analyses have found and demonstrates state adoption of 12-month continuous eligibility can decrease churn within the year, reducing the impact of income volatility on families and limiting the share of eligible children disenrolled due to procedural issues. National churn rates could be reduced further if legislation currently being considered in Congress passes (as it is expected to) and the policy is required for all states. While this analysis cannot determine whether children no longer enrolled in Medicaid had another source of insurance coverage, it is likely that 12-month continuous eligibility would reduce the number of children who are uninsured. That would come with higher federal and state Medicaid spending.
Multi-year continuous eligibility policies could help children maintain coverage beyond one year and keep children from losing coverage during the renewal process. This analysis finds churn increases during annual renewal periods, indicating children may be losing coverage at that point for procedural reasons regardless of state 12-month continuous eligibility policy status. Recently, some states have taken action to extend continuous eligibility for children in Medicaid for multiple years. While Oregon was the first state to submit and receive approval to extend continuous eligibility for children in Medicaid from birth until age six, Washington has also submitted a waiver renewal application, which is still pending CMS approval. In addition, New Mexico recently closed their public comment period on a similar waiver renewal application, and California is expected to follow.
A multi-year continuous eligibility policy could also be a tool to reduce disparities in churn rates and promote health equity. This analysis found Hispanic children experienced the largest increase in churn following annual renewals. A multi-year continuous eligibility policy, like the one included in Oregon’s recent waiver approval, would keep children from birth to age six continuously enrolled and reduce the number of children disenrolled for procedural reasons or temporary income fluctuations at annual renewal. States are especially targeting infancy and early childhood for continuous eligibility policies because the first years of life are an important developmental period for children when they are recommended to receive frequent screenings and check-ups.
Our findings indicate disenrollment and churn rates for children increase substantially following annual renewal, which could have implications for the end of the PHE. A report from the Assistant Secretary for Planning and Evaluation (ASPE) estimated 5.3 million children would lose Medicaid/CHIP coverage when the PHE ends; of those expected to lose coverage, an estimated 72% are likely still eligible for Medicaid/CHIP. Further, some groups may be more at risk of losing coverage at the end of the PHE. Our findings indicate Hispanic children may be more likely to lose coverage at renewal for procedural reasons, and a previous KFF analysis found individuals with limited English proficiency were more likely to experience administrative barriers when completing Medicaid renewal processes. Efforts to conduct outreach and provide enrollment assistance can help ensure that those who remain eligible for Medicaid are able to retain coverage and those who are no longer eligible can transition to other sources of coverage.
Methods
Data Source & State Exclusion Criteria
KFF used the Transformed Medicaid Statistical Information System (T-MSIS) 2017-2019 Demographic Eligibility Base File and Dates Files (Release 1). We used BENE_ID to link files when available and, when BENE_ID was missing, we used MSIS_ID to link files (see the TMSIS User Guide for information on linking variables). We used the longitudinal files to track enrollment outcomes among children from July 2017 through December 2019.
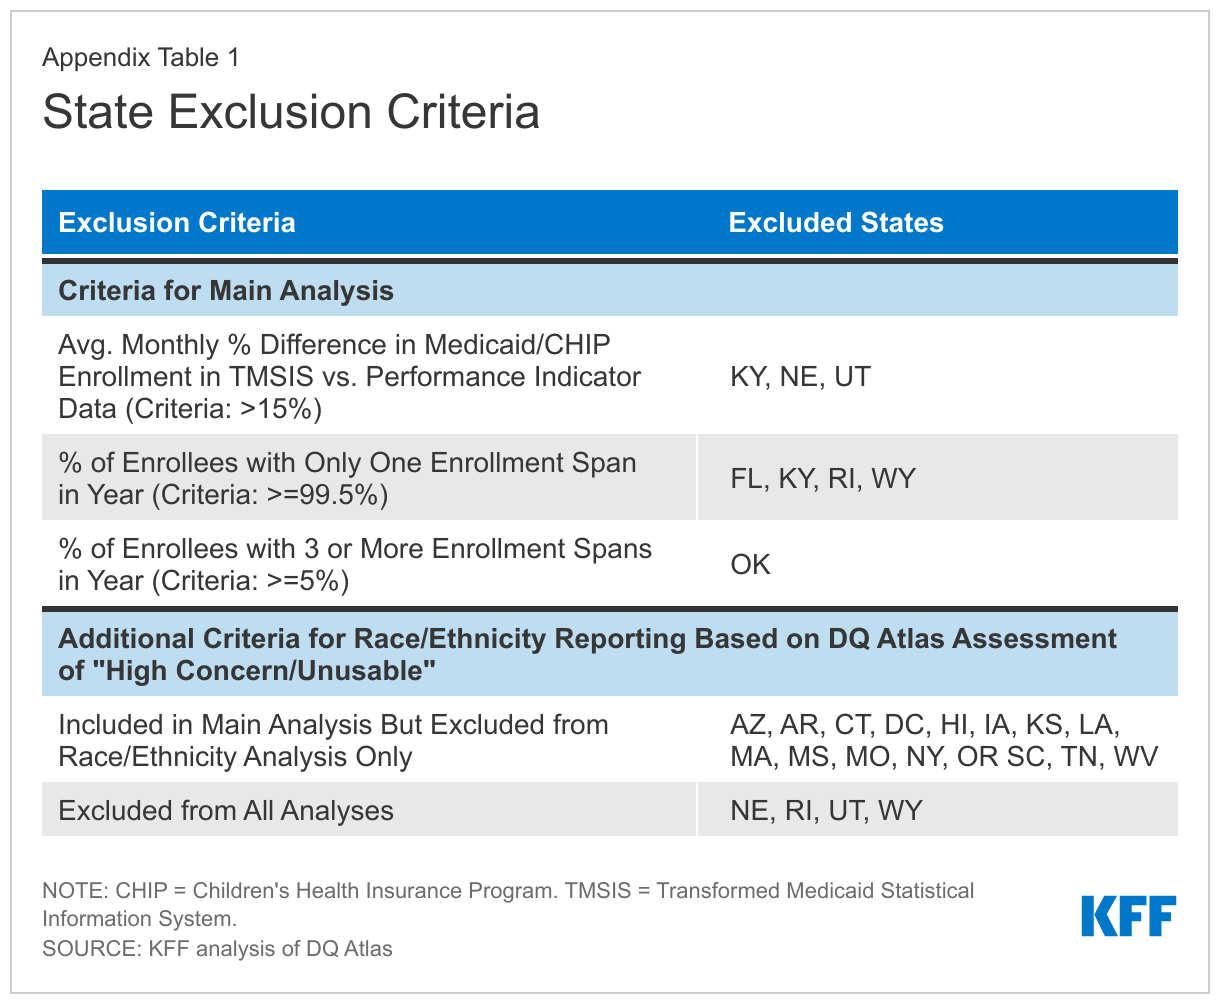
We use 44 states in our main analysis and 30 states for analyses using race/ethnicity. We excluded states due to missing or inconsistent data based on state-level information available from the DQ Atlas (Appendix Table 1).
Enrollee Sample Selection
Our sample is comprised of a cohort of children who “newly enrolled” in Medicaid or Medicaid Expansion Children’s Health Programs (MCHIP) in July 2017 with full benefits for that month. We defined newly enrolled as those who were not enrolled in Medicaid for the four months prior to July 2017 and were continuously enrolled for the first four months, through October 31, 2017. The four-month minimum enrollment period excludes children who were enrolled under presumptive eligibility provisions, but never completed an application or were determined to be ineligible. We excluded children enrolled in separate CHIP programs (SCHIP) because some states provide continuous eligibility for Medicaid but not for SCHIP. We excluded children born before January 1, 2001 because they would have turned 19 during the study period and children’s continuous eligibility provisions generally extend through age 18. We also excluded children eligible through a medically needy pathway in July 2017 because continuous eligibility provisions generally would not apply to this group. Finally, we excluded children who died during the study period. Our final sample includes 419,888 Medicaid enrollees in our main analysis (of 44 states) and 267,382 enrollees in our race/ethnicity analysis (30 states).
Calculating Enrollment, Disenrollment, and Churn
To calculate enrollment patterns, we used the DE Dates file’s start and end dates on enrollment spans. Short enrollment gaps of 28 days or less can represent data reporting errors, so we merged the spans on either side of the gap into a single, continuous enrollment span. Nearly all enrollment spans in the TMSIS data begin on the first day of the month and end on the last day of the month, but there are some rare cases in which disenrollments fall in between the first and last day of the month. For people in those situations, we considered them enrolled for the month if they had at least 15 days of coverage. We calculated disenrollment rates as the percentage of children from the initial cohort who had disenrolled in a given month. We defined churn as people who disenrolled and re-enrolled within 365 days. The renewal process varies by state and can take up to 60 days to process; this analysis compares churn rates at month 12 (prior to completion of the annual redetermination) to month 15 (after the annual redetermination was completed) to capture the effect of annual renewals. When calculating disenrollment and churn, we did not account for changes in eligibility group or benefit levels (i.e., from full benefits to restricted benefits) during the study period.
- The Centers for Medicare and Medicaid Services (CMS) Performance Indicator Project Data reports total child enrollment in Medicaid and CHIP (Note: Arizona does not report children or adults separately and is not included in totals). To estimate Medicaid (including Medicaid expansion CHIP) enrollment only, we estimate the share of children in S-CHIP alone in each state using the CY 2019 Transformed Medicaid Statistical Information System (T-MSIS) Analytic Files (TAF) Research Identifiable Files (RIF). We calculate and subtract the number of children in S-CHIP from the PI data total child enrollment in August 2022. Then, we sum the Medicaid enrollment for all states with 12-month continuous eligibility in Medicaid and states without the policy. ↩︎