KFF designs, conducts and analyzes original public opinion and survey research on Americans’ attitudes, knowledge, and experiences with the health care system to help amplify the public’s voice in major national debates.
Medicaid is the nation’s single largest health insurance program, and Medicaid enrollment has grown since the start of the COVID-19 pandemic. Early in the pandemic marked what many described as one the most severe economic downturns in United States (US) history. The pandemic-induced recession looked different from historical recessions in a number of ways and was the first downturn with the Affordable Care Act’s (ACA) coverage expansions in place. Of the newly unemployed, many were projected to enroll in Medicaid or take up exchange-based health insurance coverage (though many also were temporarily furloughed and had their employer-sponsored health benefits continued). While the job market has recovered substantially, there have been large layoffs recently at high-profile companies and there are fears that another recession could be on the horizon. This brief reviews what we know about Medicaid enrollment changes during economic downturns, examines unemployment-linked Medicaid enrollments early on in the COVID-19 pandemic, and considers the implications for the unwinding of the national public health emergency (PHE).
How does Medicaid enrollment change during economic downturns?
Medicaid enrollment typically increases during economic downturns. Medicaid is a counter-cyclical program, meaning that more people become eligible and enroll during economic downturns; at the same time, states may face declines in revenues that make it difficult to fund the state share of funding for the program. Historically, increases in the national unemployment rate have been associated with increases in Medicaid enrollment. Medicaid enrollment increased sharply following both the 2001-2002 recession and the Great Recession, and enrollment growth has been a primary driver of total Medicaid spending over the past decade. In the 2007-2009 Great Recession, before the passage of the ACA and expanded Medicaid eligibility for low-income adults, Medicaid enrollment increased by 21% (2.6 million), from 6.8% in 2007 to 8.1% in 2009 among working aged (19-64) adults. Further, rising unemployment during the Great Recession was associated with declining private coverage and increased Medicaid enrollment among persons with private coverage in the previous year.
During the Great Recession, Medicaid enrollment was concentrated in states with more expansive eligibility guidelines based on an analysis that created an index and relied on state upper income limits and categorical eligibility rules. States with more expansive guidelines also experienced smaller increases in cost-related barriers to care associated with rising unemployment in the Great Recession because a larger share of people losing private coverage due to job loss were able to transition to Medicaid. Prior to the implementation of the ACA Medicaid expansion, Medicaid eligibility levels for parents were low (national median eligibility level for parents was 64% of the federal poverty level (FPL) in 2013) and only a small group of states had coverage for childless adults through Section 1115 waivers. Unlike the recent pandemic-induced recession, the MOE requirements tied to the fiscal relief during the Great Recession did not include a continuous enrollment requirement, though states could not make eligibility or enrollment processes more restrictive. The Great Recession also predated the passage of the ACA, which expanded Medicaid eligibility and established tax credits for people buying individual insurance through the ACA marketplace.
How did the ACA and expanding Medicaid make it easier for the unemployed to enroll in Medicaid?
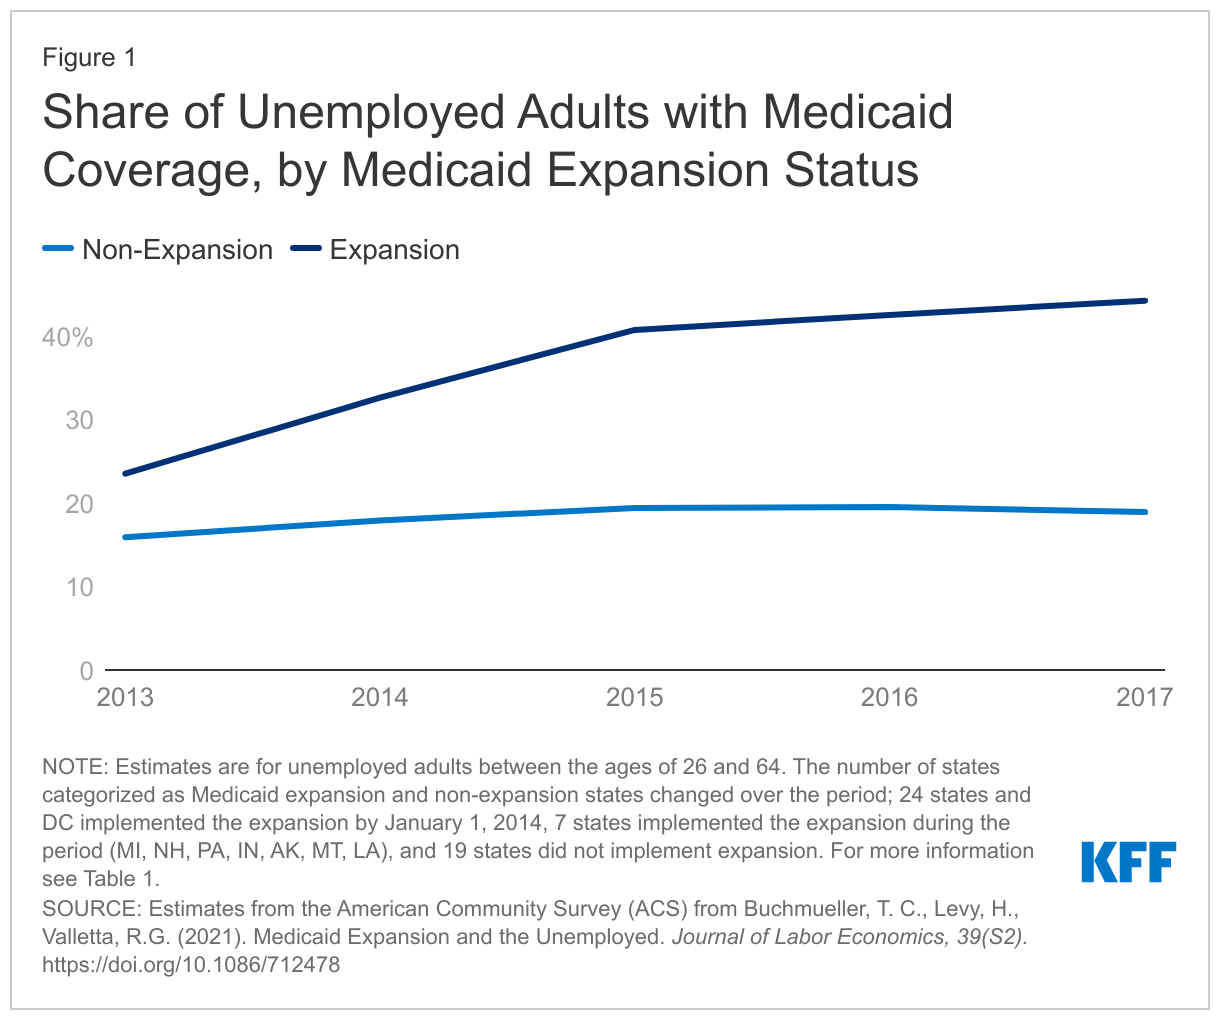
The ACA created new coverage pathways in Medicaid and streamlined Medicaid enrollment processes, making it easier for the unemployed to enroll in Medicaid.State adoption of the ACA’s Medicaid expansion expanded Medicaid eligibility for nearly all adults up to 138% FPL ($23,030 for a family of three in 2022). The expanded eligibility guidelines made it easier for more people who lost their jobs to qualify for Medicaid because categorical requirements such as parental status were no longer a part of eligibility determination. Following the ACA’s Medicaid expansion, Medicaid enrollment among the unemployed in states that adopted Medicaid expansion increased from 23.5% in 2013 to 44.2% in 2017 (Figure 1). After states expanded Medicaid, becoming unemployed was less of a risk factor for becoming uninsured. According to the Bureau of Labor Statistics, an individual is classified as unemployed if they are currently jobless but are available to work and have actively looked for work in the past 4 weeks.
How did Medicaid enrollment change early in the COVID-19 pandemic?
Medicaid enrollment has increased to record highs during the current COVID-19 PHE. To provide broad fiscal relief to states while preventing coverage losses during the pandemic, Congress passed the Families First Coronavirus Response Act (FFCRA) early in the pandemic to provide a 6.2 percentage point increase in the federal Medicaid match rate (“FMAP”) for states that meet certain “maintenance of eligibility” (MOE) requirements, including a continuous enrollment requirement. The COVID-19 recession had different implications for Medicaid enrollment compared to the Great Recession due to its unique health implications, the MOE continuous enrollment requirement, and the passage of the ACA. While Medicaid enrollment is higher in states that have expanded Medicaid under the ACA, the continuous enrollment requirement during the PHE has resulted in substantial enrollment increases in all states.
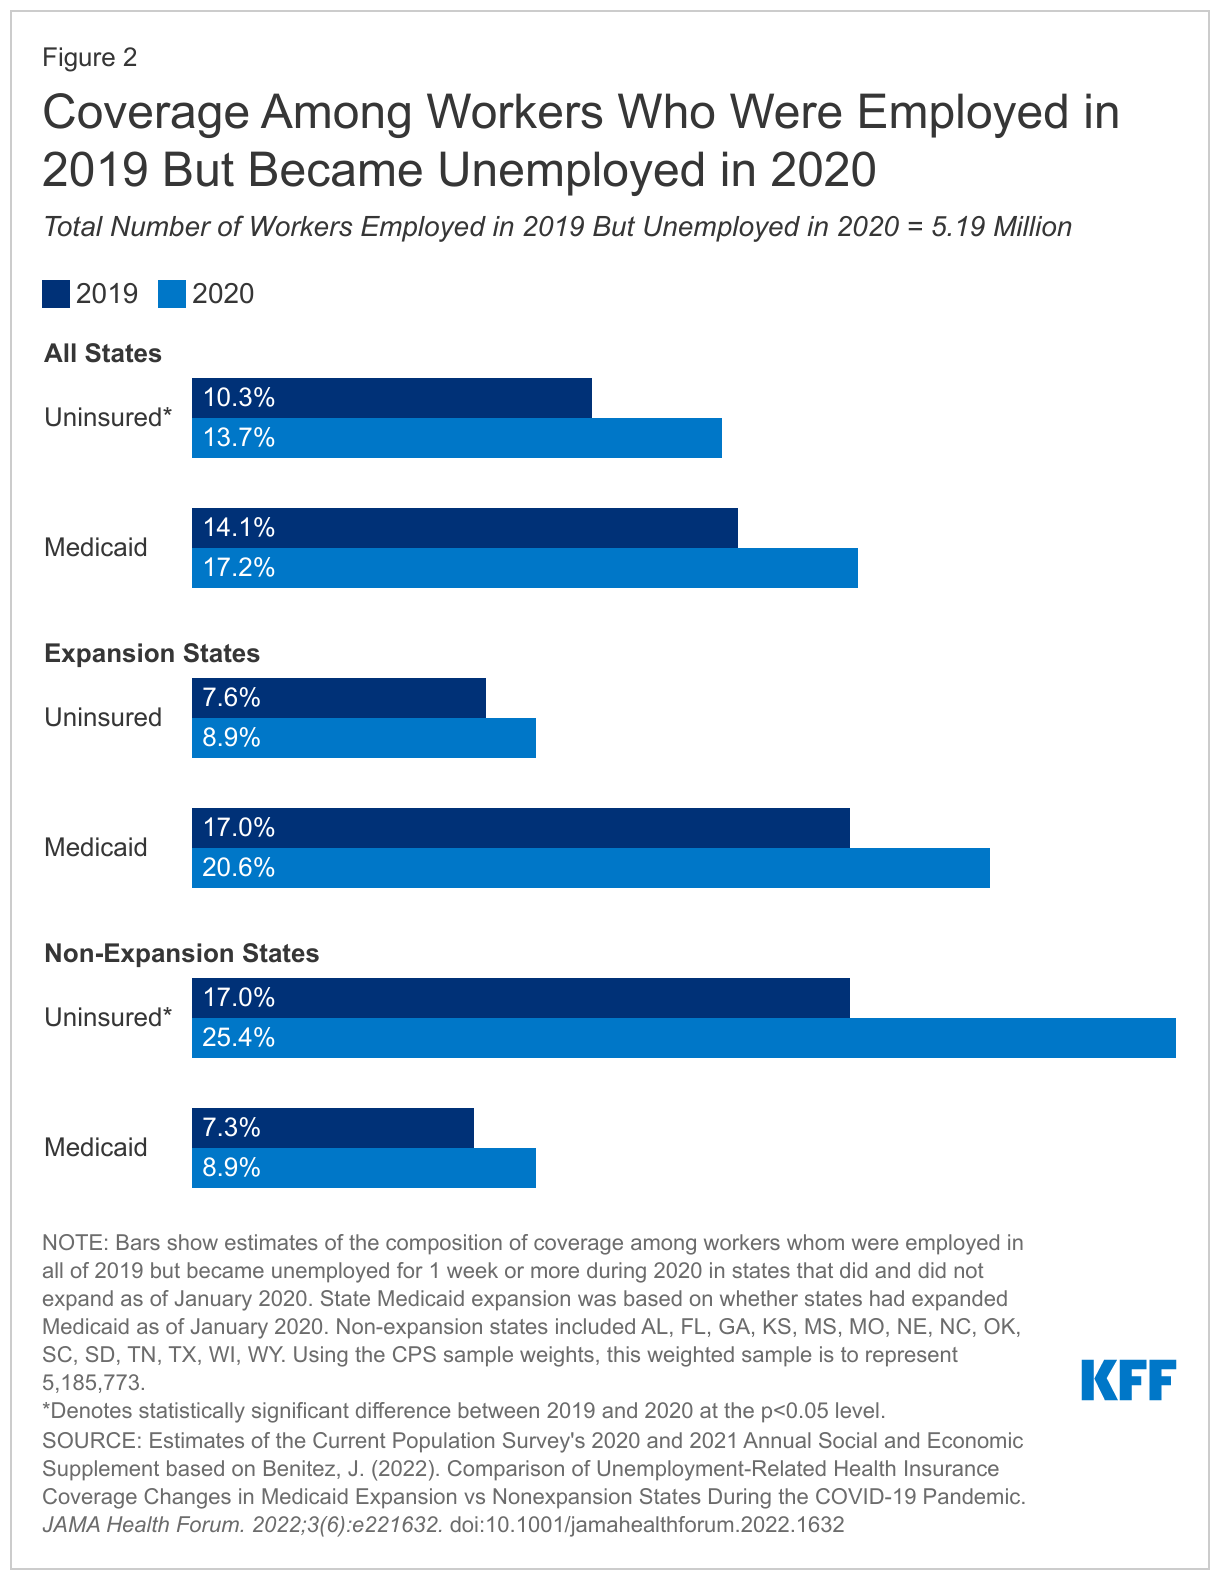
Medicaid enrollment increases were concentrated in states with expanded eligibility guidelines in place at the start of the pandemic. An analysis of the Current Population Survey’s Annual Social and Economic Supplement (CPS ASEC) examined coverage trends among adult workers that were employed in 2019 and became newly unemployed in 2020, the first year of the pandemic, compared to workers who were employed in 2019 and remained employed in 2020. Among newly unemployed workers, Medicaid enrollment increased 3.1 percentage points overall, with a larger increase in expansion states (from 17.0% in 2019 to 20.6% in 2020) compared to non-expansion states (from 7.3% in 2019 to 8.9% in 2020) (Figure 2). In addition, uninsurance increased by 1.3 percentage points (from 7.6% in 2019 to 8.9% in 2020) in Medicaid expansion states but increased by 8.4 percentage points (from 17.0% in 2019 to 25.4% in 2020) in non-expansion states among newly unemployed workers. Workers that became unemployed—including temporary layoffs and furloughs—in Medicaid expansion states during the pandemic year were 70% less likely to become uninsured compared to workers that became unemployed in states that did not expand Medicaid.
What to watch looking ahead?
While the PHE end date remains uncertain, it is expected to have significant implications for Medicaid enrollment. Following the end of the PHE and continuous enrollment requirement, Medicaid redeterminations will resume, and individuals may lose Medicaid coverage if they are no longer eligible or are unable to navigate administrative barriers despite remaining eligible. Some individuals who gained Medicaid when they became unemployed may have gained new employment and now have income too high to qualify for Medicaid. They may have access to employer-based health insurance (or already be enrolled in such coverage), or now be eligible for ACA Marketplace coverage with premium assistance. Other individuals may have regained employment but may still qualify for Medicaid if they are employed in a low-wage job. Some individuals may also no longer be in the laborforce because of the longer-run effects of COVID-19 infections like long-COVID as well as additional caretaking or childcare responsibilities. To avoid becoming uninsured, individuals will need to transition to other available coverage if they are no longer eligible for Medicaid or renew Medicaid coverage.
While state fiscal conditions have vastly improved since the pandemic began, recent economic developments have raised concerns and heightened uncertainty. States’ longer-term fiscal outlooks remain uncertain due to recent economic turmoil, including rising inflation, the Russian invasion of Ukraine, supply chain issues, along with tapering federal fiscal relief. There have also been warning signs signaling the US could be headed for another recession. The findings described here suggest, in the event of future employment losses, Medicaid can serve as an important safety net to prevent coverage loss following unemployment, and that the safety net is stronger in those states that have expanded Medicaid under the ACA.
Joseph Benitez (@j_a_benitez) is currently a non-residential visiting scholar working with KFF’s Program on Medicaid and the Uninsured.
A new KFF analysis finds that the President’s Emergency Plan for AIDS Relief (PEPFAR), the U.S. global HIV/AIDS response and the largest commitment by any nation to address a single disease in history, is associated with improvements in key economic and educational outcomes in countries that received PEPFAR support. Specifically, the program may have helped to grow per capita GDP and reduce the shares of girls and boys who are out of school.
PEPFAR may have a direct economic stimulus effect. The aid program was associated with a 2.1 percentage point increase in the GDP per capita growth rate over the study period, compared to what would have been expected in the absence of the program. The program was also associated with a 9.2 percentage point decline in primary school-age girls not in school. The share of boys of primary school age who were out of school also declined by 8 percentage points in PEPFAR countries.
These findings contribute to existing evidence that PEPFAR, which was not designed as an economic or educational program, has a positive impact on non-health outcomes. The findings also suggest that investments in vertical health programs—those focused on one issue or disease—can have knock-on effects that support broader economic development goals and improvements, which is vital in an era of constrained aid budgets.
For the analysis, researchers studied a data set of 157 low- and middle- income countries. The group included 90 countries that had received PEPFAR support and 67 counties that had received minimal or no PEPFAR support, between 2004 and 2018.
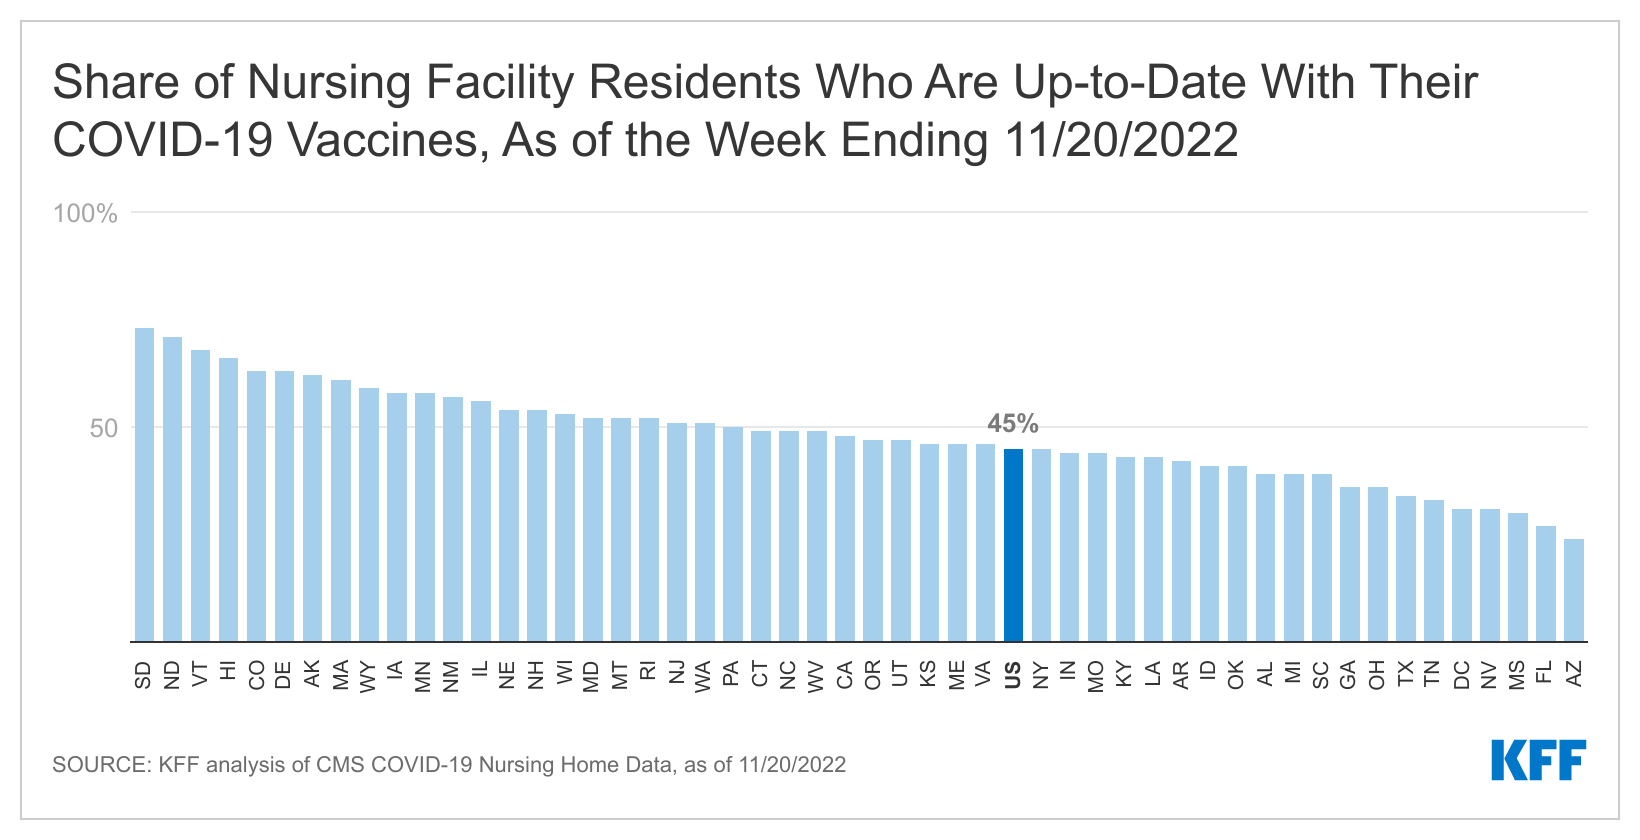
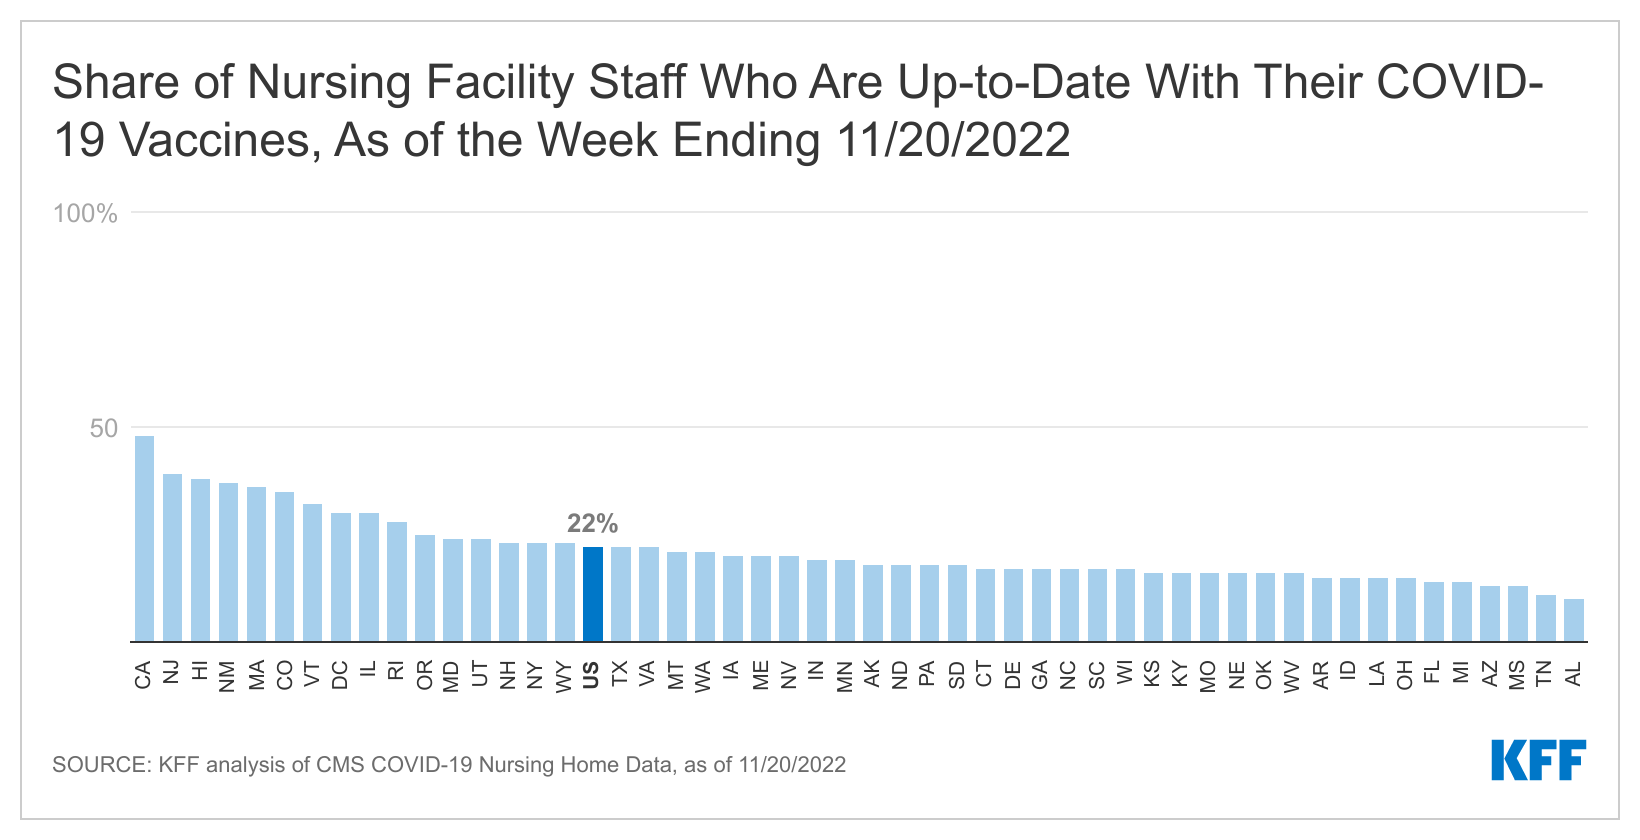
As winter approaches, a new KFF analysis finds that less than half (45%) of all nursing facility residents and less than a quarter of staff (22%) are up to date with their COVID-19 vaccinations. That is a sharp drop from the 87 percent of nursing facility residents and staff who completed their primary vaccination series.
The U.S. Centers for Disease Control and Prevention (CDC) now defines being up to date as “having received a bivalent booster or having received a final shot of the original vaccines less than two months ago.”
Federal vaccine clinics and health care worker vaccine mandates contributed to high initial vaccination rates among nursing facility residents and staff. But without ongoing federal initiatives, fewer people may stay up to date with their vaccines.
The share of residents who are up to date ranged from 73 percent in South Dakota to 24 percent in Arizona. Among nursing home staff, the share ranged from 48 percent in California to 10 percent in Alabama.
PEPFAR, the U.S. global HIV program, is the largest commitment by any nation to address a single disease in history. In addition to impacts on HIV, studies have shown that PEPFAR has had broader health impacts, including in the area of maternal and child health. Whether it has also had impacts beyond health, such as in broader economic and educational gains, is less known but could have important implications for the future of the program. If found to support these other areas, it suggests that investments in a vertical health program can have knock-on effects that support broader economic development goals and improvements, a finding that has particular relevance in an era of constrained aid budgets. Here, we examine PEPFAR’s association with five non-health outcomes: the GDP growth rate per capita; the share of girls and share of boys, respectively, who are out of school; and female and male employment rates. We find that:
PEPFAR was associated with significant, positive improvement in three of the five measures assessed over the 2004-2018 period, while findings for the other two outcomes were inconclusive.
PEPFAR countries experienced an increase in the GDP per capita growth rate that was greater than what would otherwise be expected in PEPFAR’s absence. Specifically, the growth rate was 2.1 percentage points higher over the period. This effect was greater in countries with “Country Operational Plans,” which engage in more intensive planning and generally have greater financial investment from PEPFAR.
In addition, the share of girls of primary school age who were not in school declined significantly over the period, falling by more than 9 percentage points, an effect that was greater in COP and high investment countries. This result was also found for boys – the share out of school fell by 8 percentage points.
The was no significant effect detected on labor force participation for either females or males over the period.
Overall, these findings further contribute to the evidence base that PEPFAR’s investments have been correlated with positive, non-health outcomes.
Introduction
PEPFAR is the largest commitment by any nation to address a single disease. Since its launch in 2003, the U.S. government has provided close to $90 billion in bilateral assistance to address HIV in low and middle income countries (LMICs), and PEPFAR has been credited with saving millions of lives and helping to change the trajectory of the global HIV epidemic. In a prior analysis, we found that PEPFAR has contributed to large, significant reductions in all-cause mortality, suggesting a mortality effect beyond HIV.1 More recently, we found that PEPFAR has had significant, positive, health spillover effects in the area of maternal and child health, including reductions in maternal and child mortality and increases in childhood immunization rates.2
Whether PEPFAR has also had any spillover effects beyond health, however, has been less studied, and, while such an impact is plausible, it is not a given. On the one hand, PEPFAR, as a vertical, disease-specific initiative, was not designed to be an economic or educational program, and its goals are HIV-focused and targeted. On the other, the program has recognized that providing economic and educational support, such as in its DREAMS program focused on adolescent girls and young women, is important for addressing the drivers of the HIV epidemic (although its direct support for such interventions is limited and only began after 2014).3,4 In addition, external aid may also act as a direct economic stimulus in countries, impacting their GDP.5 More broadly, studies have found that health investments are correlated with educational attainment and economic growth, including, for example, by enabling children to stay in school longer and by supporting adults to join and/or remain in the labor force.6In this analysis, we seek to assess whether PEPFAR has had impacts beyond health by examining changes in five economic and educational outcomes in PEPFAR countries: the GDP growth rate; the share of girls and share of boys, respectively, who are out of school; and female and male employment rates (see Box). If PEPFAR is found to support these other areas, it suggests that investments in a vertical health program can have knock-on effects that support broader economic and development goals and improvements, a finding that has particular relevance in an era of constrained aid budgets.
Box: Outcome Measures
1. GDP per capita growth (annual % change)
2. Share of girls out of school
3. Share of boys out of school
4. Female employment rate
5. Male employment rate
The existing literature on PEPFAR’s impact in these areas is limited though there is evidence of such an effect. In a study of 21 countries in sub-Saharan Africa, including 10 PEPFAR focus countries and 11 control countries, Wagner, Barofsky, and Sood found that PEPFAR was associated with a significant increase in male employment, though not with female employment, between 2004 and 2010.7 Kim and Whang, in a study of 15 PEPFAR focus and 121 control countries, found that PEPFAR was associated with increases in the GDP growth rate in focus countries between 2003 and 2009.8 Finally, an analysis by the Bipartisan Policy Center found that GDP per capita and average output per worker were higher in countries with greater PEPFAR investment compared to countries with low or no investment between 2004 and 2016.9 Other studies have looked more generally at the relationship between HIV interventions, particularly antiretroviral therapy, and economic outcomes, though not at PEPFAR’s role specifically, and also found positive correlations.10 No studies were identified that have examined the relationship between PEPFAR and educational attainment, although several have more generally assessed the impact of HIV on the education of children, demonstrating the epidemic’s deleterious effects.11
For the current analysis, we look at a larger set of countries and over a longer period of time than the prior analyses identified. We use a difference-in-difference quasi-experimental design to analyze the change in each of these outcomes in 90 PEPFAR countries between 2004, the first year in which PEPFAR funding began, and 2018, compared to a comparison group of 67 low- and middle- income countries (See methodology for more detail). We tested several different model specifications. Our final model controls for numerous baseline variables that may also be expected to influence these outcomes and which help to make the PEPFAR and non-PEPFAR country groups more comparable. Despite the strengths of the difference-in-difference model design, however, it is still possible that there may be other, unobservable ways in which comparison countries differed from PEPFAR countries which could account for our results. In addition, we are unable to determine causality, which could operate in either direction (e.g., better health results in greater economic growth or greater economic growth improves health), as has been noted in the broader health economics literature.12
Findings
We find that PEPFAR was positively associated with three of the five economic and educational outcomes examined, while its association with the remaining two is inconclusive:
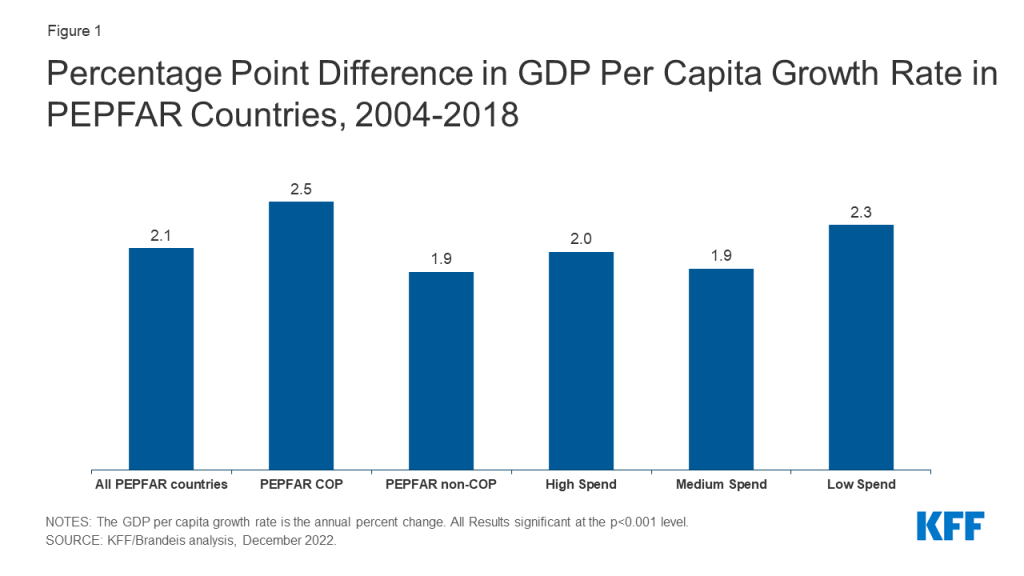
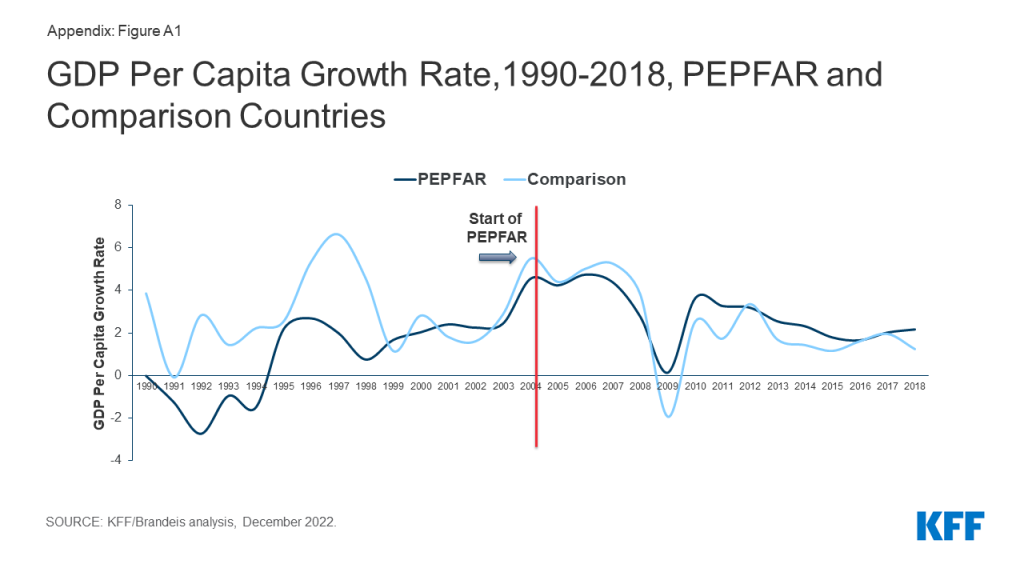
Between 2004 and 2018, PEPFAR was associated with a 2.1 percentage point increase in the GDP growth rate per capita over the period, compared to what would have been expected in the absence of the program. This percentage point change translates into a 45.7% increase in the GDP per capita growth rate. Looking at the broader trend, prior to PEPFAR’s initiation, the GDP per capita growth rate in comparison countries was generally higher than the rate in PEPFAR countries. This pattern began to change just a few years after PEPFAR’s initiation, near the time of the 2008 global financial crisis, when the growth rate in comparison countries fell below that of PEPFAR countries. While it is possible that the financial crisis affected PEPFAR and comparison countries differently, our model is designed to control for this possibility. We also examined the period before 1999, given the volatility in the GDP growth rate in both PEPFAR and comparison countries, which appears to be influenced by a subset of outlier countries; after removing these countries from our analysis, the results remain significant (See Figure 1, Tables 5-6, and Appendix).
Figure 1: Percentage Point Difference in GDP Per Capita Growth Rate in PEPFAR Countries, 2004-2018
PEPFAR’s estimated effect on the GDP growth rate per capita over the period was even greater in “COP” countries. The increase in the GDP growth rate per capita was 2.5 percentage points in COP countries, or a 61.5% increase over the period. These countries engage in more intensive planning and programming by preparing an annual PEPFAR Country Operational Plan (COP), compared to other PEPFAR countries, and generally receive greater funding; indeed, countries with more intensive spending saw greater change than their comparisons (See Figure 1 and Tables 5-6).
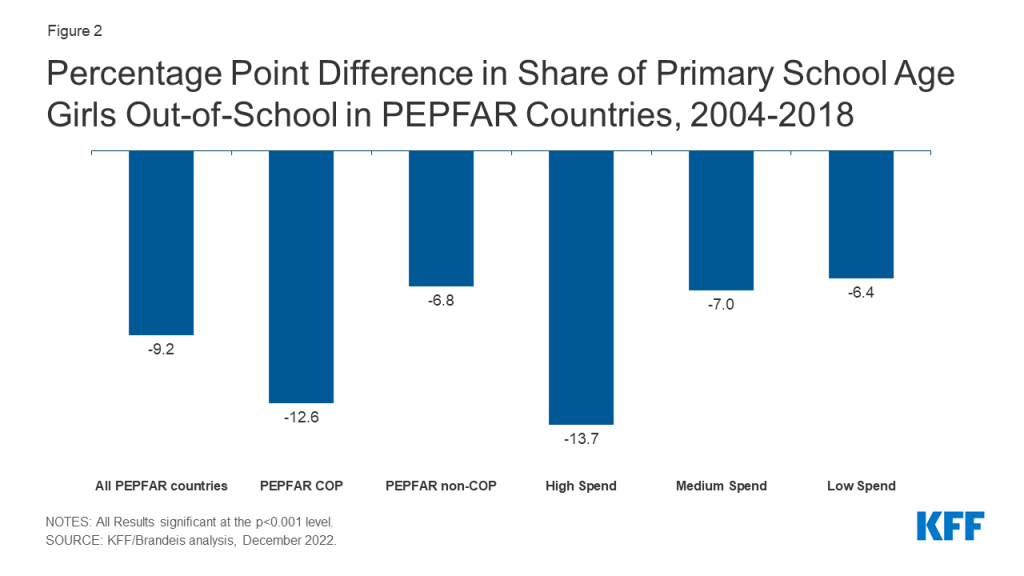
PEPFAR was also associated with a decline of 9.2 percentage points in the out-of-school rate for girls of primary school over the period. This represents a decline in the share of girls not in school of 42.4%. This effect was strongest in COP countries and in countries with greater PEPFAR investment. The large time trend shows that, prior to PEPFAR, the share of girls out of school was much higher in PEPFAR countries, relative to comparison countries. Following the introduction of the program, these rates began to converge (see Figure 2, Tables 5-6, and Appendix).
Figure 2: Percentage Point Difference in Share of Primary School Age Girls Out-of-School in PEPFAR Countries, 2004-2018
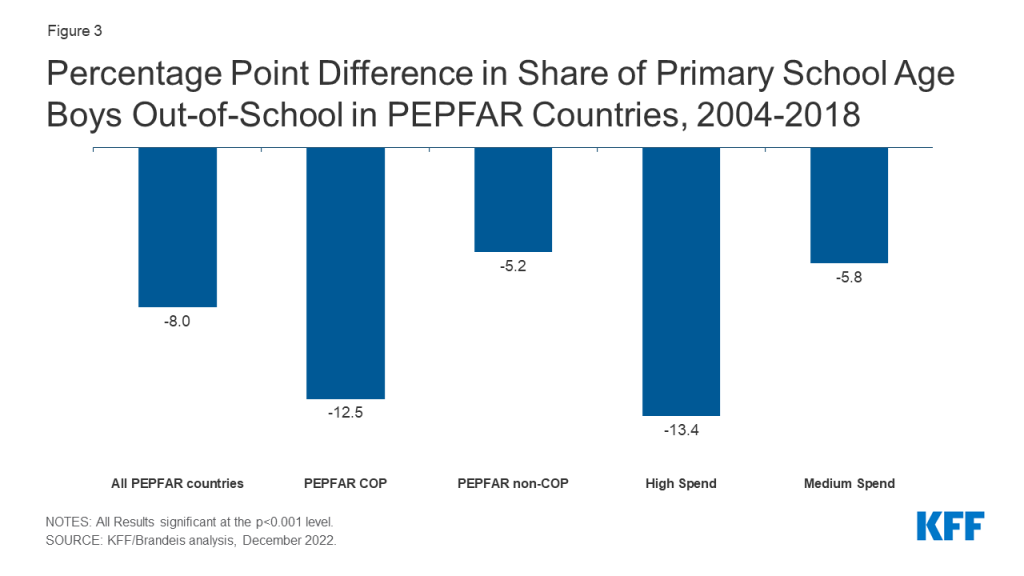
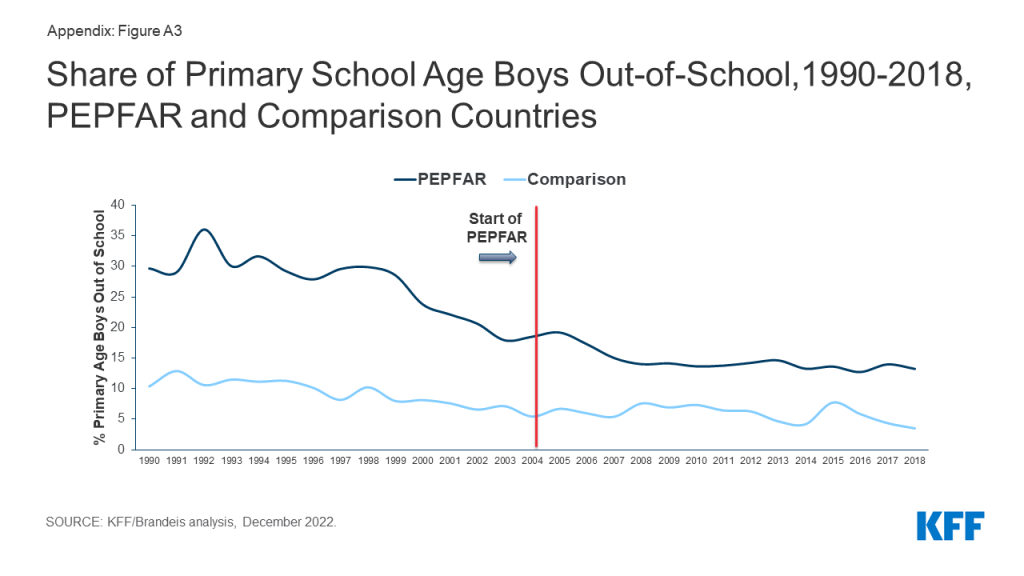
Similarly, the share of boys of primary school age who were out-of-school also declined in PEPFAR countries, by 8 percentage points relative to what would be expected. This represents a decline of 43.1%. As with girls, the effect was stronger in COP countries and in countries with greater PEPFAR investment and the broader trend was similar to that of girls (see Figure 3, Tables 5-6, and Appendix).
Figure 3: Percentage Point Difference in Share of Primary School Age Boys Out-of-School in PEPFAR Countries, 2004-2018
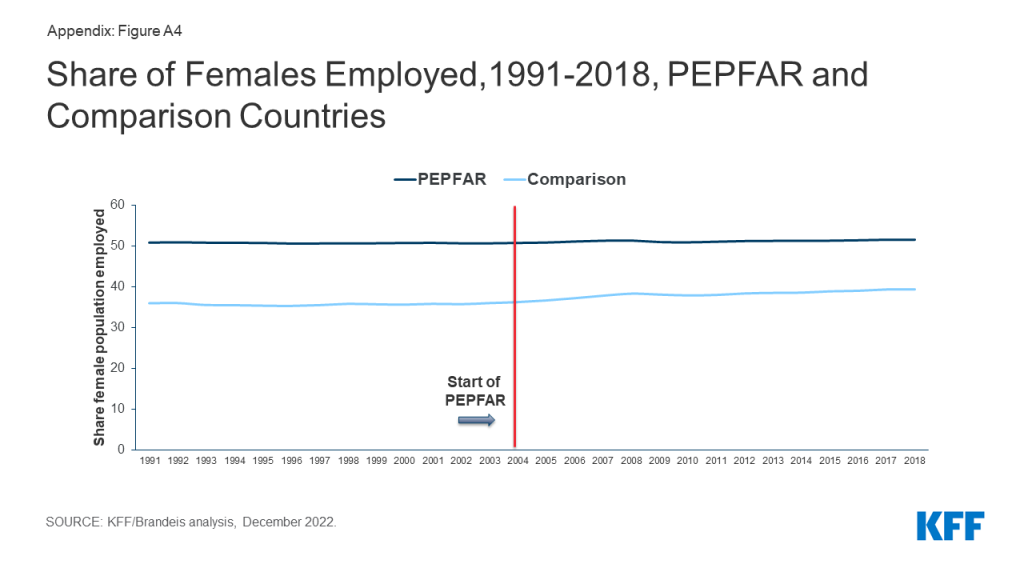
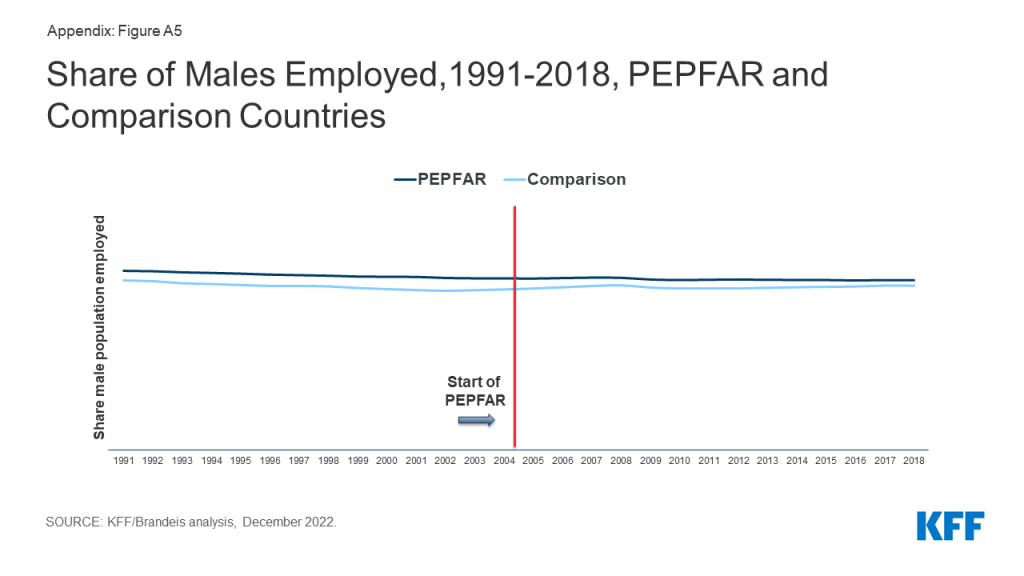
By contrast, PEPFAR’s effect on employment rates for both females and males is inconclusive. Our findings for employment rates for females and males, respectively, were not statistically significant (we only report final results significant at the p < 0.001 level). More generally, the rates of employment for both females and males were essentially flat over the entire 1990-2018 period for PEPFAR and comparison countries (and higher for female employment in PEPFAR countries even before PEPFAR’s initiation). (see Tables 5-6 and Appendix).
Implications
Our findings confirm the prior literature demonstrating a relationship between PEPFAR and economic growth.13 We show that these impacts are most pronounced in COP countries, which also receive the highest levels of PEPFAR investment. These effects could be due to the direct economic stimulus of PEPFAR assistance on low and middle income economies; in general, PEPFAR funding as a share of GDP in COP countries was under one percent in most years, though in some, it ranged between 1-2%.14 We also demonstrate the impacts of PEPFAR on two measures not previously reported in the literature – a decrease in the share of girls and of boys, of primary school age, who were out-of-school. Again, PEPFAR impacts were greatest in COP countries. We do not, however, find evidence of a relationship between PEPFAR and rates of employment for females and males (our findings were not significant). While increases in both GDP growth rates and educational engagement may be expected to result in increased labor participation, such impacts may take many years before they become evident or may be influenced by other factors. Still, this area warrants further exploration.
While our findings regarding GDP growth rates per capita and educational engagement are strong, and despite the strengths of the difference-in-difference model design, it is possible that there may be other, unobservable ways in which comparison countries differed from PEPFAR countries, which could account for our results. As mentioned above, for example, it is possible that the financial crisis affected PEPFAR and comparison countries differently, although our model design attempts to control for this possibility. In addition, it is possible that patterns within a subset of countries could be driving the overall trend. Future analysis could seek to explore other factors that may contribute to these findings as well as the country-level effects for these measures. It could also further explore the different pathways that may help to explain the relationships between PEPFAR support and improved economic and educational outcomes.
Overall, these findings further contribute to the evidence base that PEPFAR’s investments have also been correlated with positive, non-health outcomes. Given tight budgets and ongoing questions about the future trajectories of global health efforts more broadly and PEPFAR specifically, such findings indicate that a large, vertical health program which has been shown to have significant health impacts, may also contribute to broader economic and development goals.
Methods
We used a difference-in-difference15 , quasi-experimental design to estimate a “treatment effect” (PEPFAR), compared to a group without the intervention (the counterfactual). The difference-in-difference design compares the before and after change in outcomes for the treatment group to the before and after change in outcomes for the comparison group. We constructed a panel data set for 157 low- and middle- income countries between 1990 and 2018. Our PEPFAR group included 90 countries that had received PEPFAR support (between 2004 and 2018). Our comparison group included 67 low- and middle-income countries that had not received any PEPFAR support or had received minimal PEPFAR support (<$1M over the period or <$.05 per capita) between 2004 and 2018. The pre-intervention period was 1990 to 2003 and post intervention period was 2004 to 2018. Data on PEPFAR spending by country were obtained from the U.S. government’s https://foreignassistance.gov/ database and represent U.S. fiscal year disbursements; data for other measures were obtained from the World Bank’s World Development Indicator database and the Institute for Health Metrics and Evaluation (IHME) database, unless otherwise noted. Our outcomes of interest, their definitions, and sources are listed in Table 1. Baseline variables (for 2004) and sources are listed in Table 2 and model specifications examined in Table 3. Table 4 provides baseline means for all outcome variables. Final results are presented in Tables 5-6.
Table 1: Outcome Variables
Variable
Definition
1. GDP per capita growth (annual %)
Annual percentage growth rate of GDP per capita based on constant local currency. GDP per capita is gross domestic product divided by midyear population.
2. Children out of school, female (% of female primary school age)
Percentage of female primary-school-age children who are not enrolled in primary or secondary school.
3. Children out of school, male (% of male primary school age)
Percentage of male primary-school-age children who are not enrolled in primary or secondary school.
4. Employment to population ratio, 15+, female (%)
Proportion of a country’s female population that is employed, defined as persons of working age who, during a short reference period, were engaged in any activity to produce goods or provide services for pay or profit, whether at work during the reference period (i.e. who worked in a job for at least one hour) or not at work due to temporary absence from a job, or to working-time arrangements.
5. Employment to population ratio, 15+, male (%)
Proportion of a country’s male population that is employed, defined as persons of working age who, during a short reference period, were engaged in any activity to produce goods or provide services for pay or profit, whether at work during the reference period (i.e. who worked in a job for at least one hour) or not at work due to temporary absence from a job, or to working-time arrangements.
United Nations, Department of Economic and Social Affairs, Population Division (2019). World Population Prospects 2019, Online Edition. Rev, https://population.un.org/wpp/
We explored several difference-in-difference model specifications, compared to an unadjusted model (see Table 3). Each specification controlled for numerous baseline variables that may be expected to influence the outcome of interest to help make the non-PEPFAR group more comparable to the PEPFAR group. Baseline means for outcome variables are provided in Table 4. Final results are presented in Tables 5-6 and are from model specification #3, and significance is only reported in the analysis for results at the p<0.001 level. The appendix provides trend data for each outcome variable in PEPFAR and comparison countries over the full study period.–
Table 3: Model Specifications
Model
Difference-in Difference Specification
1
Unadjusted model
2
Includes baseline variables 1-9
3
Includes baseline variables 1-11
4
Includes baseline variables 1-9 and yearly per capita donor spending on health (non-PEPFAR) by all donors
Despite the strengths of the difference-in-difference design, there are limitations to this approach. While we adjusted for numerous baseline factors that could be correlated with our outcomes of interest, there may be other, unobservable factors that are not captured here. Similarly, while our baseline factors are also intended to adjust for selection bias, there may be other ways in which comparison countries differed from PEPFAR countries (and factors which influenced which countries received PEPFAR support), which could bias the estimates.–
Table 4: Baseline Means, PEPFAR Countries, 2004
Outcome Measure
All PEPFAR countries
COP countries
Non-COP countries
High spending
Medium spending
Low spending
GDP Per Capita growth (% change)
4.5
4.1
4.8
3.3
5.6
4.7
Primary Age Females Out of School (%)
21.7
21.3
21.9
26.0
15.5
26.0
Primary Age Males Out of School (%)
18.5
19.1
18.1
23.7
12.5
20.9
Female Employment (%)
50.7
56.2
47.7
55.0
50.8
46.1
Male Employment (%)
69.8
70.9
69.2
70.2
68.1
71.1
Table 5: Estimates of PEPFAR’s Impact by Measure, 2004-2018
(Percentage point difference-in-difference from means; standard errors in parentheses)
Outcome Measure
All PEPFAR countries
COP countries
Non-COP countries
High spending
Medium spending
Low spending
GDP per capita growth (% change)
2.072***
2.504***
1.853***
2.037***
1.882***
2.288***
(0.434)
(0.615)
(0.499)
(0.582)
(0.569)
(0.569)
Primary Age Females Out of School (%)
-9.185***
-12.580***
-6.781***
-13.663***
-6.969***
-6.352***
(1.143)
(1.304)
(1.134)
(1.439)
(1.437)
(1.479)
Primary Age Males Out of School (%)
-7.962***
-12.508***
-5.196***
-13.374***
-5.766***
-4.336**
(1.031)
(1.171)
(1.029)
(1.302)
(1.301)
(1.338)
Female Employment (%)
-2.416*
-3.313**
-1.952
-1.763
-3.601**
-1.777
(0.991)
(1.102)
(1.013)
(1.298)
(1.258)
(1.284)
Male Employment (%)
-1.657**
-1.650*
-1.660*
-1.180
-2.582**
-1.125
(0.625)
(0.644)
(0.694)
(0.814)
(0.788)
(0.805)
***p < 0.001 **p < 0.01 *p < 0.05
Table 6: Estimates of PEPFAR’s Impact by Measure, 2004-2018(Percent change from Mean)
Outcome Measure
All PEPFAR countries
COP countries
Non-COP countries
High spending
Medium spending
Low spending
GDP Per Capita (% change)
45.7%***
61.5%***
38.7%***
62.1%***
33.4%***
49.1%***
Primary Age Females Out of School (%)
-42.4%***
-59.2%***
-31.0%***
-52.5%***
-44.9%***
-24.5%***
Primary Age Males Out of School (%)
-43.1%***
-65.3%***
-28.7%***
-56.3%***
-46.1%***
-20.8%**
Female Employment (%)
-4.8%*
-5.9%**
-4.1%
-3.2%
-7.1%**
-3.9%
Male Employment (%)
-2.4%**
-2.3%*
-2.4%*
-1.7%
-3.8%**
-1.6%
***p < 0.001 **p < 0.01 *p < 0.05
Jen Kates is with KFF. William Crown, Allyala Nandakumar, Gary Gaumer and Dhwani Hariharan are with Brandeis University.
Appendix
Figure A1: GDP Per Capita Growth Rate,1990-2018, PEPFAR and Comparison CountriesFigure A2: Share of Primary School Age Girls Out-of-School,1990-2018, PEPFAR and Comparison CountriesFigure A3: Share of Primary School Age Boys Out-of-School,1990-2018, PEPFAR and Comparison CountriesFigure A4: Share of Females Employed,1991-2018, PEPFAR and Comparison CountriesFigure A5: Share of Males Employed,1991-2018, PEPFAR and Comparison Countries
Wagner Z, Barofsky J, Sood N, “PEPFAR funding associated with an increase in employment among males in ten sub-Saharan African countries,” Health Affairs, 2015 Jun, 34(6): 946-953. ↩︎
See, for example: Remes J, Wilson M, Ramdorai A, How investing in health has a significant economic payoff for developing economies, Brookings, July 2020, available at: https://www.brookings.edu/blog/future-development/2020/07/21/how-investing-in-health-has-a-significant-economic-payoff-for-developing-economies/; World Bank, Human Capital Project, available at: https://www.worldbank.org/en/publication/human-capital; Piabuo S, Tieguhong J, “Health expenditure and economic growth – a review of the literature and an analysis between the economic community for central African states (CEMAC) and selected African countries,” Health Econ Rev, 2017 Dec, 7(23); Vogl T, Education and health in developing economies, Working Papers 1453, Princeton University, Woodrow Wilson School of Public and International Affairs; Bloom D, Khoury A, Kufenko V, Prettner K, “Spurring economic growth through human development: research results and guidance for policymakers,” Population and Development Review, 2021 Jun, 47(2): 377-409; Bloom D, Kuhn M, Prettner K, Health and economic growth, 2018, IZA DP No. 11939, available at: https://www.iza.org/publications/dp/11939/health-and-economic-growth; Collin M, Weil D, The effect of increasing human capital investment on economic growth and poverty: a simulation exercise, World Bank, WPS8590, 2018, available at: https://openknowledge.worldbank.org/handle/10986/30463. ↩︎
Wagner Z, Barofsky J, Sood N, “PEPFAR funding associated with an increase in employment among males in ten sub-Saharan African countries.” Health Affairs, 2015 Jun, 34(6): 946-953. ↩︎
Kim Y, Whang T, “The effects of the President’s Emergency Plan for AIDS Relief on the economies and domestic politics of focus countries”, Global Economic Review, 2017 Aug, 46(4), 441-463. ↩︎
See, for example: Bor J, Tanser F, Newell M, Barnighausen T, “In a study of a population cohort in South Africa, HIV patients on antiretrovirals had nearly full recovery of employment”, Health Affairs, 2012 July, 31(7),1459-1469; Resch S, Korenromp E, Stover J, Blakley M, Krubiner C, Thorien K, Hecht R, Atun R, “Economic returns to investment in AIDS treatment in low and middle income countries,” PLoS ONE 2011 Oct, 6(10): e25310; Thirumurthy H, Galárraga O, Larson B, Rosen S, “HIV treatment produces economic returns through increased work and education, and warrants continued US support,” Health Affairs, 2012 Jul, 31(7):1470-7; McLaren Z, Bor J, Tanser F, Barnighausen T, Economic stimulus from public health programs: externalities from mass AIDS treatment provision in South Africa, September 2019, available at: https://mdsoar.org/handle/11603/23512. ↩︎
See, for example, Zivin JG, Thirumurthy H, Goldstein M, “AIDS treatment and intrahousehold resource allocation: children’s nutrition and schooling in Kenya,” J Public Econ, 2009 Aug, 93(7-8):1008-1015; Guo Y, Li X, Sherr L, “The impact of HIV/AIDS on children’s educational outcome: a critical review of global literature,” AIDS Care, 2012 April,24(8):993-1012. ↩︎
See discussions in: Bloom D, Khoury A, Kufenko V, Prettner K, “Spurring economic growth through human development: research results and guidance for policymakers,” Population and Development Review, 2021 Jun, 47(2): 377-409; Bloom D, Kuhn M, Prettner K, Health and economic growth, 2018, IZA DP No. 11939, available at: https://www.iza.org/publications/dp/11939/health-and-economic-growth; Weil D, “Health and economic growth”, ch. 03, p. 623-682 in, Handbook of Economic Growth, 2014, vol. 2: 623-682. ↩︎
Gertler P, Martinez S, Premand P, Rawlings L, Vermeersch C. Impact evaluation in practice, second edition. 2016, Washington, DC: Inter-American Development Bank and World Bank. Available at: https://openknowledge.worldbank.org/handle/10986/25030. ↩︎
An updated Peterson-KFF Health System Tracker analysis shows the United States experienced a second year of decline in life expectancy in 2021 while other comparably large, wealthy countries saw a rebound in life expectancy since the onset of the COVID-19 pandemic in 2019. Over recent decades, life expectancy has improved by much more in peer nations than it has in the U.S. The COVID-19 pandemic has increased mortality and premature death rates in the U.S. by more than it did in most peer countries, widening a gap that already existed before the pandemic. While the U.S. has the lowest life expectancy among comparable countries, it far outspends its peers on health care. In 2021, the U.S. spent over $4,000 more per capita on health care than the next highest spending country.
If the federal government runs out of money to purchase COVID-19 vaccines, the per-dose price likely would skyrocket and could increase spending on vaccines by billions of dollars a year, a new KFF analysis finds.
To date, the federal government has spent more than $30 billion on COVID-19 vaccines to encourage their development, guarantee a market, and ensure that the public can access them at no charge. The Biden administration has said it can no longer afford to purchase additional doses if Congress does not provide more funds, shifting the burden to the commercial market.
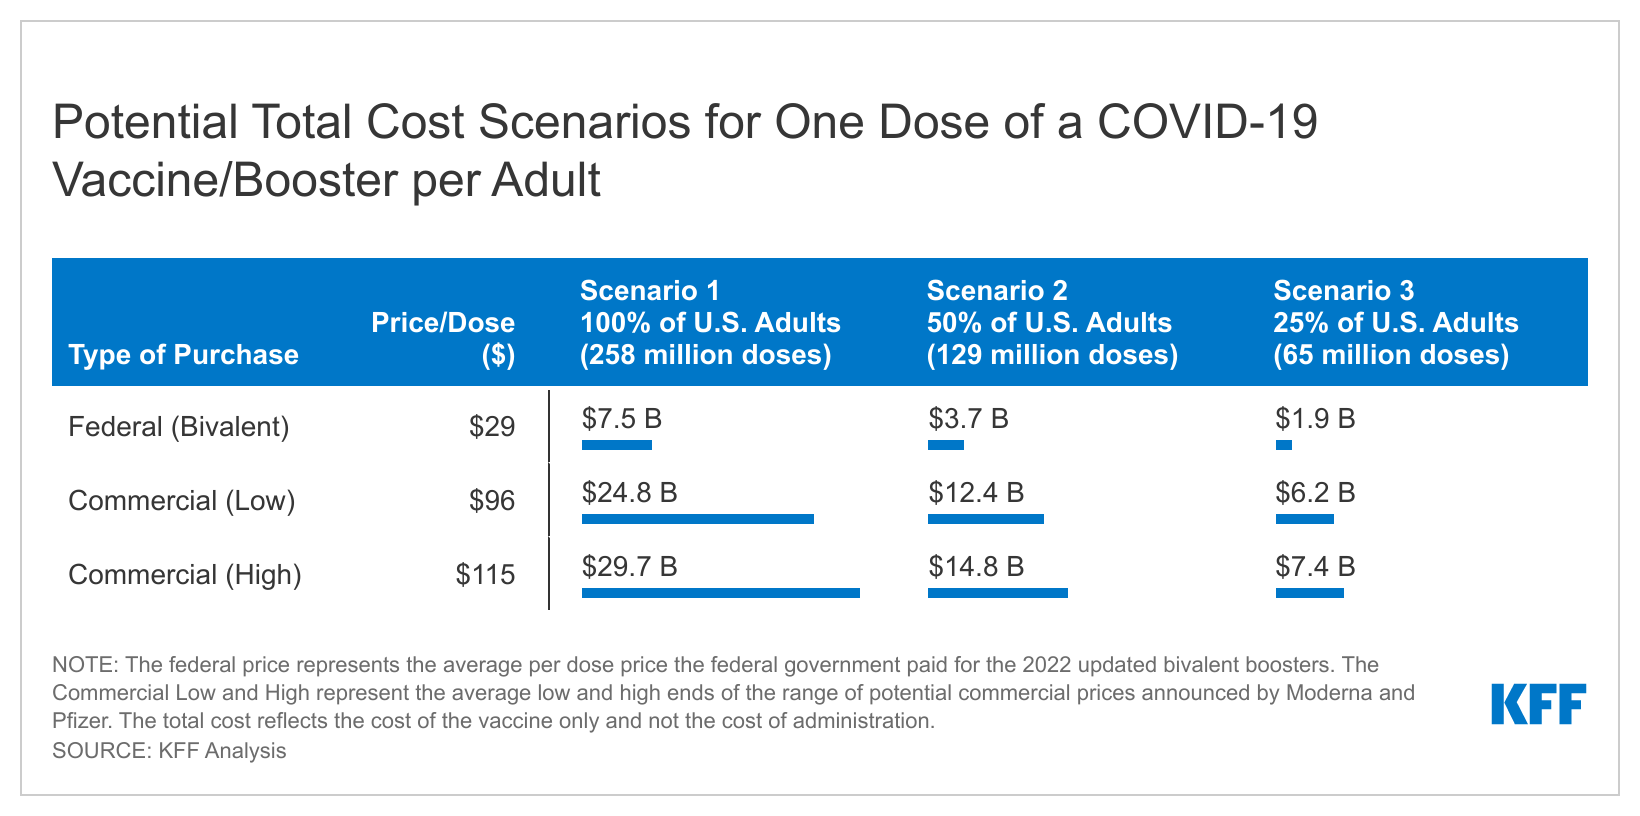
Vaccine makers Pfizer and Moderna have announced that the anticipated commercial price per dose of their vaccines would likely be between $82 and $130 per dose – roughly three to four times what the federal government has paid, according to the KFF analysis.
If payers end up paying those prices for one dose per adult, the analysis estimates that the total cost of purchasing booster shots commercially would run between $6.2 billion and $29.7 billion a year, depending on price and how many people nationally get the vaccine or booster.
Put another way, the federal government could purchase enough bivalent booster shots to serve all adults nationally at its current per-dose price for $7.5 billion, about what it would cost to purchase doses for just a quarter of adults at the higher commercial per-dose price.
While it is possible insurers and other payers could negotiate discounts from the prices suggested by the manufacturers, they will have limited leverage because they will generally be required to cover all recommended vaccines and boosters.
Even after vaccines are purchased commercially, most people with health insurance should still be able to access COVID-19 vaccines without any cost-sharing, and the higher per-dose price would be borne by public and private insurers, including Medicare and Medicaid. For private insurers and their enrollees, these costs could push premiums upward.
People who are uninsured would lose guaranteed access to free COVID-19 vaccines, and the high cost of getting one at the commercial price could discourage some from getting them.
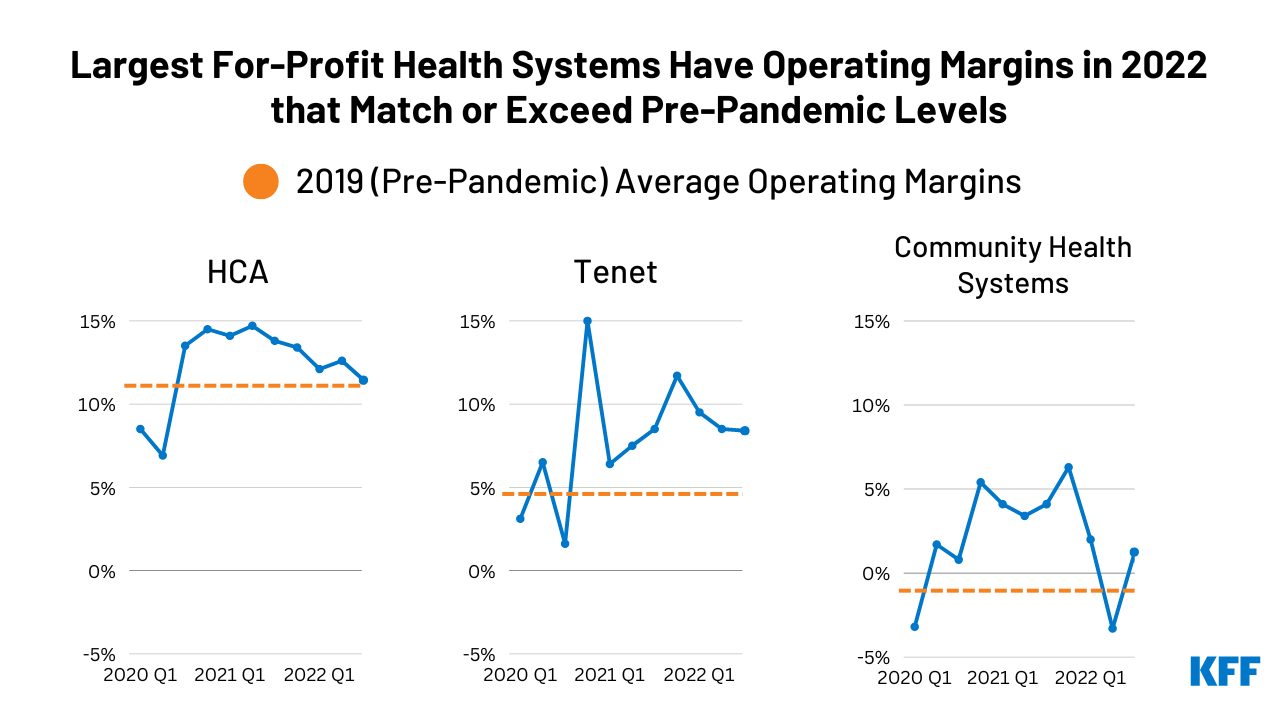
Despite higher inflation and dwindling COVID-19 relief funding from the federal government, the nation’s largest for-profit health systems so far this year have operating margins that meet or exceed levels in 2019 prior to the pandemic, a new KFF analysis finds.
The analysis examines the financial performance of the three largest for-profit systems in the country, HCA Healthcare, Tenet Healthcare Corporation, and Community Health Systems, which collectively account for about 8 percent of all community hospital beds nationally.
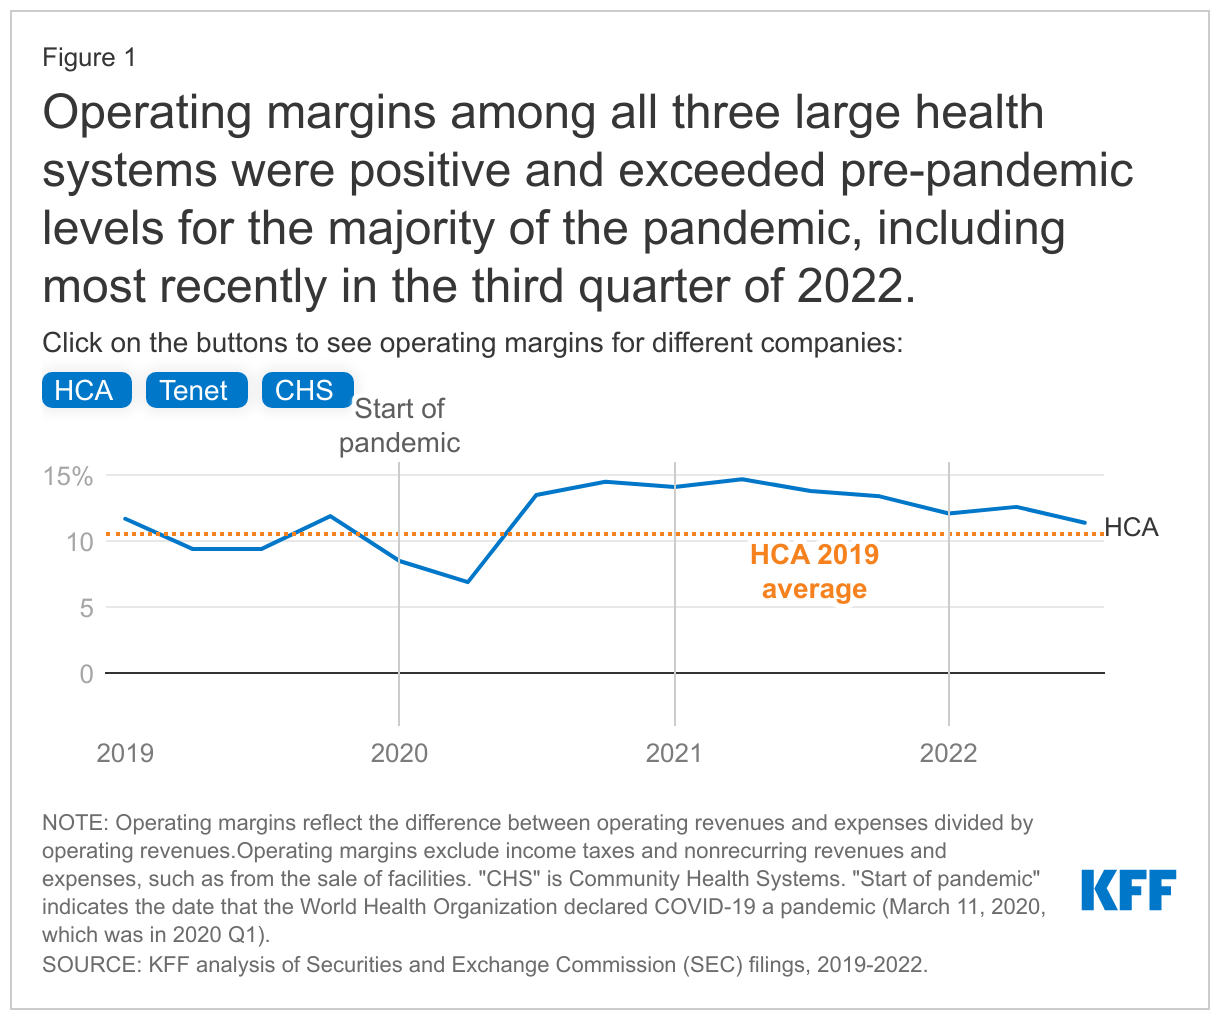
All three systems had positive operating margins that exceeded pre-pandemic levels for the majority of the pandemic, including most recently in the third quarter of 2022. For most of the pandemic, HCA has had operating margins of at least 10 percent and Tenet has had operating margins of at least 5 percent. Community Health Systems’ operating margins have been lower, but the health system also had lower margins before the pandemic.
The analysis is part of KFF’s expanding work examining the business practices of hospitals and other providers and their impact on costs and affordability.
Recent reports have raised concerns about the financial stability of hospitals amidst disruptions caused by the COVID-19 pandemic and the looming prospect of an economic recession. Large amounts of government relief helped prop up hospital margins in 2020 and 2021. However, industry reports suggest that the outlook for hospitals and health systems has deteriorated in 2022 due to the ongoing effects of the pandemic (such as labor shortages), decreases in government relief, and broader economic trends that have led to rising prices and investment losses. According to at least one account, 2022 may be the worst financial year for hospitals in decades. These challenges could force hospitals to take steps to increase efficiency but may also result in price increases or cost-cutting measures that impair patient access or care quality. Against this backdrop, industrystakeholders have asked Congress to provide additional fiscal relief to hospitals and to stop scheduled Medicare payment reductions.
To provide context for these policy discussions, we evaluated the financial performance of the three largest for-profit health systems in the country—HCA Healthcare (“HCA”), Tenet Healthcare Corporation (“Tenet”), and Community Health Systems (CHS)—which collectively accounted for about 8 percent of community hospital beds in the US in 2020.1 These three systems are publicly traded, meaning that we were able to acquire timely financial data about these systems through their reports to the Securities and Exchange Commission (SEC), as well as data on their stock prices (see Methods for additional details).
Results
Operating margins among all three large health systems were positive and exceeded pre-pandemic levels for the majority of the pandemic, including most recently in the third quarter of 2022. Operating margins reflect the profit margins earned on patient care and other operations of a given health system—such as from gift shops, parking, and cafeterias—and incorporate government COVID-19 relief funds.2 Our definition of operating margins excludes income taxes and nonrecurring revenues and expenses, such as from the sale of facilities. HCA and Tenet had positive operating margins throughout the pandemic, and CHS had positive operating margins in all but two quarters of the pandemic (with one of those quarters being at the very beginning of the pandemic). HCA has had operating margins of at least 10 percent during the majority of the pandemic (9 out of 11 quarters). In other words, HCA’s revenue from patient care and other operations exceeded operating expenses by at least 10 percent for most of the pandemic. Tenet has had operating margins of at least 5 percent for the majority of the pandemic (9 out of 11 quarters), while CHS’s operating margins have been lower (less than 5% for 9 out of 11 quarters). CHS had lower margins than the other systems before the pandemic as well.
For all three systems, operating margins have exceeded pre-pandemic (2019) levels for most of the pandemic (9 out of 11 quarters), including the last quarter of our analysis (the third quarter of 2022), despite recent decreases in operating margins. HCA and Tenet dipped below their 2019 operating margins during two quarters of 2020, and CHS fell below their 2019 operating margins during the first quarter of 2020 and the second quarter of 2022 before increasing again. As of the third quarter of 2022, operating margins were 11.4 percent for HCA, 8.4 percent for Tenet, and 1.2 percent for CHS.
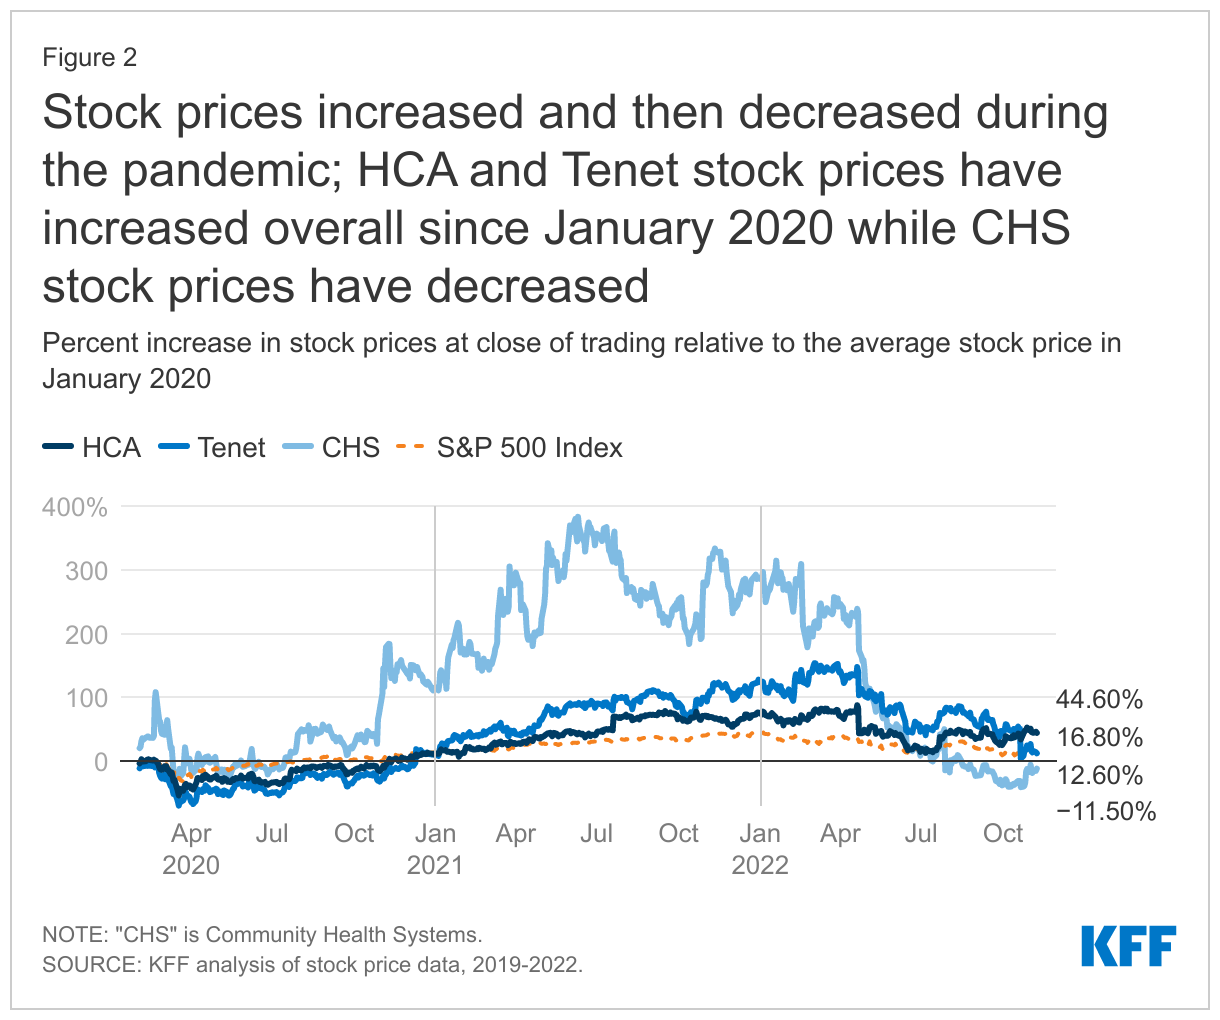
Stock prices increased and then decreased during the pandemic; HCA and Tenet stock prices have increased overall since January 2020 while CHS stock prices have decreased. Stock prices generally reflect investors’ evaluation of the future earnings potential of a given company. Stock prices increased dramatically during the first 1.5 to 2 years of the pandemic. At their heights, HCA stock prices had increased by 87.9 percent, Tenet stock prices had increased by 153.8 percent, and CHS stock prices had increased by 383.1 percent relative to January 2020.
Stock prices have also decreased substantially in 2022—in line with broader economic trends—and especially so among Tenet and CHS. As of November 8, 2022, HCA and Tenet stock prices have increased overall relative to January 2020 (by 44.6% and 12.6%, respectively).3 CHS stock prices have decreased by 11.5% since January 2020, though CHS has also experienced longstanding financial challenges thatpredate the pandemic. For purposes of comparison, HCA stock prices increased by a much greater amount than the S&P 500 during this period (44.6% versus 16.8%), while the S&P 500 slightly outperformed Tenet stock (16.8% versus 12.6%) and significantly outperformed CHS stock (16.8% versus -11.5%).
As of December 2, 2022, the majority of market analysts followed by MarketWatch were bullish on HCA and Tenet stock (with 18 buy, 3 overweight, and 5 hold recommendations for HCA stock and 14 buy, 2 overweight, and 4 hold recommendations for Tenet stock) and neutral about CHS stock (with 8 hold and 4 buy recommendations); none of the analysts rated these stocks as “sell” or “underweight.”
Discussion
Industry reports have suggested that hospitals had high margins in 2020 and 2021 but have faced significant financial challenges in 2022. Our analysis adds nuance to this discussion. So far this year, operating margins among the three largest for-profit health systems in the country have met or exceeded pre-pandemic levels. HCA and Tenet in particular have had high operating margins. CHS had negative operating margins in the second quarter of 2022, and its stock prices decreased overall from January 2020 to November 2022, but its financial challenges precede the pandemic. While some hospitals are struggling in the current environment—with high inflation and the ongoing burdens posed by COVID-19, flu, and respiratory syncytial virus (RSV)—our results indicate that the largest for-profit systems have had operating margins that exceed pre-pandemic levels.
Methods
We obtained financial data from each health system’s filings with the Securities and Exchange Commission (SEC). We relied on unaudited quarterly 10-Q filings for the first three quarters of a given calendar year. For the fourth quarter of a given calendar year, we subtracted the sum of the first three quarters from the annual value reported in audited 10-K filings. Health systems tend to provide conservative estimates of their financial performance in unaudited quarterly filings, meaning that our data on operating margins may be biased downwards for the first three quarters of a given year and upwards for the fourth quarter (which we obtain by subtracting unaudited quarterly values from audited annual values). Operating margins reflect the difference between operating revenues and expenses (also known as “net operating income”) divided by operating revenues. Our definition of operating margins excludes income taxes and nonrecurring revenues and expenses, such as from the sale of facilities. Our definition includes, among other things, equity in the earnings of affiliated businesses, such as ambulatory surgical centers, in which the system has a large but noncontrolling stake. It also incorporates government COVID-19 relief funds. The receipt and repayment of loans—such as through the Medicare Accelerated and Advance Payment Programs—do not factor into the determination of operating margins.
Each health system in our study used a unique approach for reporting revenues and expenses, which therefore required adding and subtracting different lines when calculating operating margins. Additional details are available upon request.
This work was supported in part by Arnold Ventures. KFF maintains full editorial control over all of its policy analysis, polling, and journalism activities.
Nancy Kane, an independent consultant, reviewed the methodology for this analysis.
KFF analysis of the 2020 American Hospital Association (AHA) Annual Survey flat files. ↩︎
In October 2020, HCA returned money that it had received through the Provider Relief Fund program. These dollars are excluded from our HCA calculations for all quarters. ↩︎
A Wall Street Journal article presented a similar figure with much higher returns for HCA and Tenet than depicted here. The main reason for this difference is that the Wall Street Journal calculated returns relative to March 11, 2020; HCA and Tenet stock had fallen substantially in the two weeks leading up to March 11, 2020, likely reflecting the anticipated effects of the pandemic.
↩︎
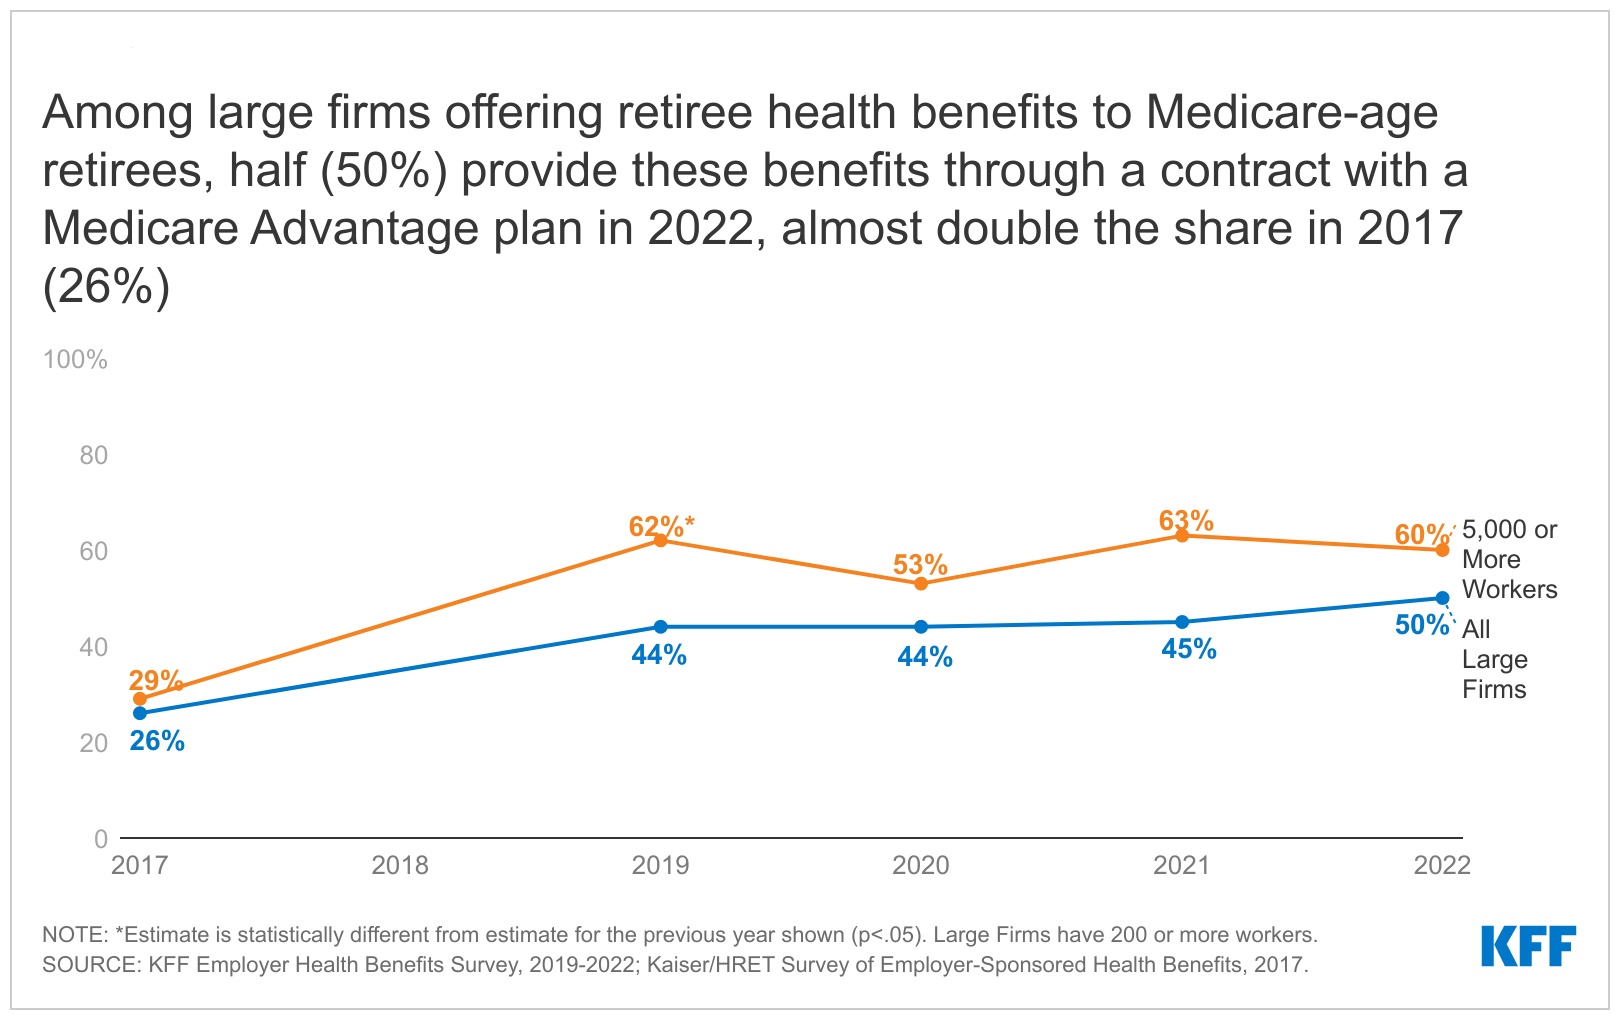
Few employers offer retiree health benefits, and those that do increasingly are turning to Medicare Advantage plans to provide that coverage – a shift that has implications both for retirees and for federal spending, finds a new KFF analysis.
Among the relatively small share of large firms (200 or more workers) that offer retiree health benefits to Medicare-age retirees, half (50%) provide these benefits through a Medicare Advantage plan in 2022, according to the analysis of data from the 2022 KFF Employer Health Benefits Survey. That’s up from 26 percent in 2017.
Under this approach, employers contract with a Medicare Advantage private insurer that provides all Medicare-covered benefits in addition to supplemental benefits, rather than other approaches, such as providing supplemental coverage that wraps around traditional Medicare.
Just 13 percent of large employers offer retiree health benefits to Medicare-age retirees in 2022, the analysis finds. It also finds that:
Among larger employers with 1,000 or more workers that offer retiree health benefits through a Medicare Advantage plan, the most common reason the employer elected this option was the lower cost.
About 44 percent of large employers offering Medicare Advantage coverage to their retirees give them no choice but to receive their benefits through a Medicare Advantage plan, rather than give them a choice between Medicare Advantage and non-Medicare Advantage options.
The shift to Medicare Advantage has implications for retirees. On the one hand, this approach may help retirees if it enables employers to maintain or even broaden retiree health benefits rather than scale back or even terminate coverage. On the other hand, it has the potential to restrict retirees’ access to doctors and hospitals for Medicare-covered services, depending on the plan’s provider network, and subject retirees to utilization management tools, such as prior authorization, that may limit access to Medicare-covered services.
The rising number of large employers choosing Medicare Advantage for their Medicare-eligible retirees also has implications for federal spending because Medicare spends more per person for enrollees in Medicare Advantage plans (including in group plans) than for beneficiaries covered by traditional Medicare.
The share of COVID-19 deaths among those who are vaccinated has risen. In fall 2021, about 3 in 10 adults dying of COVID-19 were vaccinated or boosted. But by January 2022, as we showed in an analysis posted on the Peterson-KFF Health System Tracker, about 4 in 10 deaths were vaccinated or boosted. By April 2022, the United States Centers for Disease Control and Prevention (CDC) data show that about 6 in 10 adults dying of COVID-19 were vaccinated or boosted, and that’s remained true through at least August 2022 (the most recent month of data). (more…)
Why Do Vaccinated People Represent Most COVID-19 Deaths Right Now?
NOTE: This analysis examines COVID-19 deaths in the United States through August 2022.
The share of COVID-19 deaths among those who are vaccinated has risen. In fall 2021, about 3 in 10 adults dying of COVID-19 were vaccinated or boosted. But by January 2022, as we showed in an analysis posted on the Peterson-KFF Health System Tracker, about 4 in 10 deaths were vaccinated or boosted. By April 2022, the United States Centers for Disease Control and Prevention (CDC) data show that about 6 in 10 adults dying of COVID-19 were vaccinated or boosted, and that’s remained true through at least August 2022 (the most recent month of data). (more…)