News Release

Poll: Nearly Half of Adults Would Be Interested in Prescription Weight-Loss Drugs, But Enthusiasm Fades Based on Lack of Coverage and Risk of Regaining Weight 

Most Adults, Including Most Seniors, are Unaware of Provisions Aimed at Lowering Medicare Drug Costs in Last Year’s Politically Contentious Inflation Reduction Act

Published: Aug 4, 2023

Nearly half (45%) of the public are at least somewhat interested in taking a prescription weight-loss drug, including many who say they only want to lose a little weight, though many people lose interest when presented with potential financial and medical drawbacks, the latest KFF Health Tracking Poll reveals.The poll gauges the public’s interest in using prescription drugs to lose weight as a relatively new class of drugs, initially approved to treat diabetes, is garnering attention for their potential to aid weight loss. Among those trying to lose weight, six in 10 (59%) say they would be interested in a safe and effective weight-loss drug, including half (51%) of those who say they are trying to lose less than 10 pounds.People’s interest in trying such drugs drops significantly when asked about potential obstacles and drawbacks. For instance, about one in six say they would remain interested if it were not covered by their insurance (16%) or if the U.S. Food and Drug Administration had not approved the drug for weight loss but for a different condition (16%). A similar share (14%) say they would still be interested if they might gain back the weight they lost if they stopped taking the drug. 

A large majority (80%) of the public says insurers should cover the cost of weight-loss drugs for adults who have been diagnosed as overweight or obese while half of adults (53%) says insurers should cover the cost of these drugs for anyone who wants to lose weight. Half (50%) say that insurers should cover the drugs’ cost even if it could increase monthly insurance premiums for everyone. Few Aware of Medicare Drug-Price Provisions Included in Last Year’s Inflation Reduction ActNearly a year after President Biden signed the Inflation Reduction Act into law, relatively few people are aware of its provisions aimed at lowering prescription drug costs in Medicare.For example, a quarter of the public are aware that there’s a law requiring the federal government to negotiate some drug prices for people with Medicare (25%); capping insulin costs for people with Medicare (25%); and placing an annual limit on Medicare enrollees’ out-of-pocket drug costs (24%). Fewer know that there’s a law penalizing drug companies that raise Medicare drug prices faster than the rate of inflation (10%).People ages 65 and older, who are largely covered by Medicare, are more likely than younger adults to be aware of most of these provisions, but still the shares are modest. For instance, among people who are at least 65 years old, 44% know about the insulin price caps and 34% know about the annual limit on out-of-pocket drug spending.The poll also gauges the public’s views about drug manufacturers and drug prices.

Key findings include:

  • About three in 10 (28%) adults, including 40% of those with annual household incomes under $40,000, say it’s difficult for them to afford prescription drugs. A similar share of adults (31%) say that they did not take their medicine as prescribed in the past year due to their costs.
  • About eight in 10 (83%) adults say drug companies’ profits are a major factor contributing to the price of prescription drugs, including large majorities of Republicans (89%), Democrats (84%), and independents (78%). Fewer adults say that research and development costs (54%) or marketing and advertising (45%) are major factors affecting drug prices.
  • Nearly three-quarters (73%) of the public say there is not enough regulation of prescription drug prices, up from 63% in May 2021. This includes two thirds of Republicans (68%), up from 57% in May 2021.

Designed and analyzed by public opinion researchers at KFF, the survey was conducted from July 11-19, 2023, online and by telephone among a nationally representative sample of 1,327 U.S. adults. Interviews were conducted in English and in Spanish. The margin of sampling error is plus or minus 3 percentage points for the full sample. For results based on other subgroups, the margin of sampling error may be higher.

How Do Dual-Eligible Individuals Get Their Medicare Coverage?

Authors: Maria T. Peña, Maiss Mohamed, Jeannie Fuglesten Biniek, Juliette Cubanski, and Tricia Neuman
Published: Jul 31, 2023

Issue Brief

Medicare and Medicaid provide health coverage to 12.5 million individuals who are enrolled in both programs, known as “dual-eligible individuals.” Medicare is their primary source of health insurance coverage, and Medicaid, jointly funded by federal and state governments, provides supplemental coverage. Under the broad umbrella of Medicare coverage, dual-eligible individuals can be covered under a variety of different arrangements, including traditional Medicare, Medicare Advantage plans that are available to all Medicare beneficiaries, and plans that are designed specifically for this population (referred to here as “dual-eligible plans”).

Together, Medicare and Medicaid cover a range of services and financial supports to help meet the diverse needs of the dual-eligible population, which is more racially and ethnically diverse, and more likely to be in poor health than Medicare beneficiaries without Medicaid. At the same time, there are ongoing concerns about a lack of integration of services across the two programs that may contribute to fragmentation of care, poor outcomes, and high costs. In response to these concerns, federal and state lawmakers have been working to develop, test and implement a variety of coverage and financing options to improve coordination of care for this population.

To inform consideration of these coverage and financing options, including what they might mean for how dual-eligible individuals get their Medicare and Medicaid benefits, and who would be most affected, this brief presents national and state-level sources of Medicare coverage for dual-eligible individuals, by demographic characteristics, based on the 2020 Medicare Beneficiary Summary File (See Methods for details and Appendix Table 1).

Key takeaways:

  • Just over half (51%) of dual-eligible individuals received their Medicare benefits through traditional Medicare in 2020, while the remaining 49% were enrolled in Medicare Advantage plans (Figure 1).
  • Three in 10 (30%) dual-eligible individuals were enrolled in a dual-eligible plan, most of whom (24%) were in coordination-only dual eligible special needs plans (D-SNPs). Coordination-only D-SNPs are designed for dual-eligible individuals and are required to coordinate with state Medicaid programs, with some variation in the specific requirements across states.
  • Enrollment of dual-eligible individuals in traditional Medicare ranged from less than 30% in Hawaii and Puerto Rico to 70% or over in 11 states (Alaska, Delaware, Maryland, Montana, North Dakota, New Hampshire, Oklahoma, South Dakota, Vermont, West Virginia, and Wyoming).
  • Among dual-eligible individuals, Medicare Advantage enrollment rates were higher among beneficiaries who were age 65 and older than those under age 65 (53% vs 41%) and among beneficiaries who were Black (54%), Hispanic (65%), and Asian/Pacific Islander (48%) than non-Hispanic White beneficiaries (41%).
Figure 1: Just Over Half (51%) of Dual-Eligible Individuals Received Their Medicare Coverage Through Traditional Medicare in 2020

Overview of Medicare Coverage Options for Dual-Eligible Individuals

Like all Medicare beneficiaries, dual-eligible individuals may choose to receive their Medicare benefits through traditional Medicare or a Medicare Advantage plan. This decision may have implications for how dual-eligible individuals receive their Medicaid benefits and the degree to which that coverage is coordinated with Medicare. State Medicaid programs cover benefits that Medicare does not cover, such as long-term services and supports and non-emergency transportation, as well as a broader set of behavioral health services through Medicaid fee-for-service or Medicaid managed care. Most (73%) dual-eligible individuals are eligible for the full range of Medicaid benefits not otherwise covered by Medicare and are referred to as “full-benefit” dual-eligible individuals. Medicaid also provides most full-benefit dual-eligible individuals premium and in many cases, cost-sharing assistance through the Medicare Savings Program. “Partial-benefit” dual-eligible individuals are not eligible for full Medicaid benefits but are eligible for assistance with Medicare premiums and, in many cases, cost sharing, also through the Medicare Savings Programs.

The various Medicare coverage options for dual-eligible individuals are summarized below and in Appendix Table 1.

Traditional Medicare

In traditional Medicare, beneficiaries can obtain care from any provider that participates in Medicare. The payment and delivery of care in traditional Medicare has evolved over the last several decades, with payment including a mix of fee-for-service, bundled, and prospective payments, as well as value-based payment models, such as Accountable Care Organizations (ACOs). ACOs are a group of doctors, hospitals and providers that form partnerships to be collectively responsible for the care coordination of their patients.

Medicare Advantage

Medicare Advantage plans receive a payment from the federal government to deliver Medicare Part A and Part B benefits, and, typically, Part D drug coverage. Medicare Advantage plans often provide some coverage of supplemental benefits, such as vision and dental. These plans are permitted to limit provider networks and may require prior authorization for certain services or referrals for certain types of providers. In this brief, all private plans are referred to as Medicare Advantage plans, including cost contract plans, health care prepayment plans, Program of All-Inclusive Care for the Elderly, and Medicare-Medicaid plans. Medicare Advantage plans have been categorized into dual-eligible plans and non-dual-eligible plans (described below).

Dual-eligible plans

In this brief, dual-eligible plans are defined as private plans or programs that are designed for people who are dually enrolled in Medicare and Medicaid and, to varying degrees, coordinate benefits across the two programs. Dual-eligible individuals are not required to enroll in a dual-eligible plan, although in some states, Medicare-Medicaid plans (MMPs) and fully integrated dual-eligible (FIDE) SNPs have the option to passively enroll dual-eligible individuals, which means individuals would need to opt-out if they prefer a different Medicare coverage arrangement. Financing of dual-eligible plans also varies across plan types, and often within plan types depending on the degree of coordination in coverage and benefits.

In this analysis, dual-eligible plans include:

  • Dual eligible special needs plans (D-SNPs) are a type of Medicare Advantage plan that provide Medicare coverage and may coordinate or cover Medicaid benefits depending on the type of D-SNP. D-SNPs have contracts with the federal government to provide coverage to Medicare beneficiaries and receive a capitated payment to cover the cost of all Medicare-covered services and supplemental benefits included in the plan. When supplemental benefits duplicate Medicaid-covered benefits, the Medicare payment covers these costs. D-SNPs are required by Medicare to have contracts with Medicaid programs in the states in which they operate and must meet minimum requirements, including those related to coordinating the delivery of benefits with the Medicaid program. States have the option to limit enrollment in these plans to full-benefit dual-eligible individuals. There are three types of D-SNPs:
    • Coordination-only D-SNPs must meet the minimum federal requirements but provide varying levels of coordination, depending on state requirements. These D-SNPs provide Medicare-covered services and in most cases supplemental benefits, and the state Medicaid agency or a Medicaid managed care plan provides Medicaid-covered services. Most D-SNPs fall into this category.
    • Fully Integrated Dual-Eligible (FIDE) SNPs provide Medicare- and included Medicaid-covered services through a single managed care organization. The same organization that offers the FIDE SNP must also offer a Medicaid managed care plan for any Medicaid benefits not included in the FIDE SNP. In some cases, certain Medicaid benefits may be provided by the state or by a different health plan. FIDE SNPs are paid by Medicare for Medicare-covered services and included supplemental benefits, and by Medicaid for Medicaid-covered services. It is possible for people to enroll in a FIDE SNP but not the companion Medicaid plan or vice versa. Starting in 2025, FIDE SNPs may only enroll full-benefit dual-eligible individuals if they are enrolled in both the FIDE SNP and the Medicaid plan sponsored by the same organization.
    • Highly Integrated Dual-Eligible (HIDE) SNPs must meet the requirements of coordination-only D-SNPs and must also have a Medicaid plan operating in the same counties as the D-SNP. The parent organization provides both Medicare and Medicaid services, but there is no requirement that the same people enroll in both plans. HIDE SNPs were not available until 2021 and are not included in this analysis.
  • Medicare-Medicaid Plans (MMPs) were established as a demonstration under the Financial Alignment Initiative where a single health plan provides all Medicare- and Medicaid-covered benefits. Enrollment in MMPs is limited to full-benefit dual-eligible individuals. Recent regulations require that all states end their demonstration programs of the MMP model by the end of 2025 and transition remaining plans to HIDE or FIDE SNPs.
  • Program of All-Inclusive Care for the Elderly (PACE) provides comprehensive medical and social services to individuals who: (1) are 55 years of age or older, (2) need a nursing home level of care but can live safely in the community, and (3) live in a PACE organization service area. Most people in PACE are dual-eligible individuals. PACE was made a permanent part of the Medicare and Medicaid programs by the Balanced Budget Act of 1997.

Non-dual-eligible plans

Non-dual-eligible plans are other Medicare Advantage and private plans that may enroll dual-eligible individuals but do not coordinate Medicare and Medicaid benefits. These include individual Medicare Advantage plans that are generally available for enrollment to all people with Medicare, group plans sponsored by employers and unions, and other SNPs for Medicare beneficiaries with specialized health needs, including institutional special needs plans (I-SNPs) and chronic condition special needs plans (C-SNPs).

What share of dual-eligible individuals were enrolled in traditional Medicare and Medicare Advantage plans?

Just over half (51%) of all dual-eligible individuals were in traditional Medicare and 49% were enrolled in Medicare Advantage plans in 2020.

A smaller share of dual-eligible individuals were enrolled in traditional Medicare than the share of Medicare beneficiaries without Medicaid coverage in traditional Medicare (51% vs. 57%, respectively) (Figure 2 and Appendix Table 2).

Of the 10.9 million dual-eligible individuals enrolled in Medicare Part A and B in 2020, 5.6 million were in traditional Medicare and 5.3 million were enrolled in Medicare Advantage plans. However, among 5.3 million dual-eligible individuals enrolled in a Medicare Advantage plan, the majority (61%) were enrolled in a dual-eligible plan, and the remaining 39% were in a non-dual-eligible plan (data not shown).

Among all dual-eligible individuals, 3 in 10 (30%) were enrolled in dual-eligible plans (Figure 2). Enrollment in dual-eligible plans consisted primarily of enrollment in coordination-only D-SNPs (24%), followed by MMPs (3%), FIDE SNPs (3%), and PACE (0.4%). Higher enrollment in coordination-only D-SNPs than other dual-eligible plan types is likely driven by higher plan availability, since the other types of plans were only available in a limited number of states, and often in a subset of counties in 2020 (e.g., FIDE SNPs, 11 states; MMPs, 9 states; and PACE, 31 states).

About 1 in 5 (19%) dual-eligible individuals were enrolled in a Medicare Advantage plan that was not designed for people with both Medicare and Medicaid, primarily individual Medicare Advantage plans available to all Medicare beneficiaries (17% of all dual-eligible individuals). Another 2% were in an I-SNP or C-SNP. In 2020, most people enrolled in I-SNPs (91%) were dual-eligible individuals, while just over one-quarter (26%) of enrollees in C-SNPs were dual-eligible individuals.

3 in 10 Dual-Eligible Individuals were Enrolled in a Dual-Eligible Plan

In 37 states and the District of Columbia, at least 50% of dual-eligible individuals received their Medicare coverage through traditional Medicare in 2020, including 11 states where 70% or more of dual-eligible individuals were in traditional Medicare (Figure 3). The share of dual-eligible individuals in traditional Medicare ranged from a high of 99% in Alaska to a low of 0.3% in Puerto Rico. The share of dual-eligible individuals in traditional Medicare across states was generally similar to the share of Medicare beneficiaries without Medicaid in traditional Medicare, except in 6 states (Arizona, Florida, Hawaii, Rhode Island, South Carolina, and Tennessee) and Puerto Rico (Appendix Table 2). For example, in Arizona, 30% of dual-eligible individuals were in traditional Medicare versus 59% of Medicare beneficiaries without Medicaid.

In five states (Arizona, Florida, Hawaii, Rhode Island, and Tennessee) and Puerto Rico, more than 40% of dual-eligible individuals were enrolled in a dual-eligible plan – higher than the national share of dual-eligible individuals in a dual-eligible plan (30%). In four of these states, the relatively high enrollment in dual-eligible plans was driven by enrollment in coordination-only D-SNPs, including Arizona (39%), Florida (43%), Hawaii (57%) and Tennessee (42%), while in Rhode Island, the enrollment in dual-eligible plans was highest in MMPs (33%). In contrast, in 4 states (Maryland, Montana, North Dakota and Oklahoma), less than 10% of dual-eligible individuals were enrolled in a dual-eligible plan (Figure 3, Appendix Table 3).

In 37 States and the District of Columbia, At Least 50% of Dual-Eligible Individuals were in Traditional Medicare

Box 1: Medicare and Medicaid in Puerto Rico

Puerto Rico is included in this analysis of dual-eligible individuals in Medicare. Notably, Puerto Rico’s Medicare and Medicaid programs differ from the 50 states and the District of Columbia. In Puerto Rico, nearly all Medicare beneficiaries are enrolled in a Medicare Advantage plan. Medicare Advantage penetration is higher across Puerto Rico than in the 50 states and District of Columbia. In 2023 at least 90% of eligible Medicare beneficiaries are enrolled in a Medicare Advantage plan across virtually all Puerto Rican counties. In particular, enrollment in D-SNPs accounts for a much larger share of Medicare Advantage enrollment than in any of the 50 states or the District of Columbia.

Puerto Rico’s Medicaid program eligibility rules, benefits, delivery system and financing differ in some ways from those in the 50 states and the District of Columbia. For example, Puerto Rico does not cover most of the benefits that full-benefit dual-eligible individuals use such as long-term services and supports, and in Puerto Rico, cost-sharing assistance is provided to full-benefit dual-eligible individuals, but not to partial-benefit dual-eligible individuals, because Medicare Savings Programs are not available in Puerto Rico.

The share of dual-eligible individuals in traditional Medicare and Medicare Advantage plans differed across subgroups of beneficiaries by race, age, and area of residence.

A larger share of Black (54%), Hispanic (65%) and Asian/Pacific Islander (48%) dual-eligible individuals were enrolled in Medicare Advantage plans than non-Hispanic White (41%) and American Indian/Alaska Native (25%) dual-eligible individuals. Lower enrollment in coordination-only D-SNPs among non-Hispanic White individuals (16%) compared to Black (28%), Hispanic (37%) or Asian/Pacific Islander (24%) beneficiaries explains lower overall enrollment in Medicare Advantage plans among non-Hispanic White dual-eligible individuals.

A larger share of dual-eligible individuals under age 65 received their Medicare coverage through traditional Medicare than dual-eligible individuals age 65 or older (59% vs 47%) (Figure 5). Higher enrollment in Medicare Advantage plans among dual-eligible beneficiaries age 65 or older compared to those under 65 (53% vs. 41%) is almost entirely accounted for by higher enrollment in individual Medicare Advantage plans (20% vs 13%).

Two-thirds (67%) of dual-eligible individuals living in rural areas received their Medicare coverage through traditional Medicare compared to less than half (48%) of dual-eligible individuals living in metropolitan areas. Traditional Medicare was also the more common source of Medicare coverage for dual-eligible individuals living in a micropolitan area, where 62% were in traditional Medicare. In addition, a larger share of dual-eligible individuals in metropolitan areas were enrolled in coordination-only D-SNPs (25%), FIDE SNPs (3%) and MMPs (4%) than dual-eligible individuals in micropolitan areas (18%, 1% and 1%, respectively) and rural areas (14%, 1% and 0.4%, respectively) (Figure 4).

A Majority of Black and Hispanic Dual-Eligible Individuals were Enrolled in Medicare Advantage Plans

A larger share of full-benefit dual-eligible individuals were in traditional Medicare than partial-benefit dual-eligible individuals.

Among dual-eligible individuals who received full benefits in 2020, nearly 6 in 10 (55%) were enrolled in traditional Medicare, while 45% were enrolled in Medicare Advantage plans. For dual-eligible individuals receiving partial benefits, the pattern was reversed, with 58% enrolled in Medicare Advantage plans and 42% in traditional Medicare (Figure 5).

Three in 10 (33%) full-benefit dual-eligible individuals were enrolled in dual-eligible plans, compared to approximately 2 in 10 (23%) partial-benefit dual-eligible individuals. Among full-benefit dual-eligible individuals, enrollment in dual-eligible plans was largely comprised of enrollment in coordination-only D-SNPs (24% of full-benefit dual-eligible individuals), followed by MMPs (5%), FIDE SNPs (4%), and PACE (1%). All partial-benefit dual-eligible individuals in dual-eligible plans were in coordination-only D-SNPs, largely due to enrollment restrictions in other dual-eligible plan types.

A smaller share of full-benefit dual-eligible individuals were enrolled in non-dual-eligible Medicare Advantage plans than partial-benefit dual-eligible individuals (12% vs 35%). Among dual-eligible individuals receiving full benefits, 10% were in individual Medicare Advantage plans, while among those receiving partial benefits, 34% were in individual Medicare Advantage plans.

33% of Full-Benefit Dual-Eligible Individuals were Enrolled in Dual-Eligible Plans, Compared to 23% of Partial-Benefit Dual-Eligible Individuals

Consistent with the overall enrollment patterns for full-benefit dual-eligible individuals, in most states (39) and the District of Columbia, more than half of full-benefit dual-eligible individuals were in traditional Medicare. In contrast, in half of states (26), more than half of partial-benefit dual-eligible individuals were enrolled in Medicare Advantage plans (Appendix Table 4).

Discussion

In 2020, one third (30%) of dual-eligible individuals were enrolled in a Medicare Advantage plan designed for people with both Medicare and Medicaid, 19% were in another Medicare Advantage plan, and just over half (51%) received their Medicare coverage through traditional Medicare. The source of Medicare coverage for dual-eligible individuals varied by state and by beneficiary characteristics.

Dual-eligible individuals have lower incomes, are more racially and ethnically diverse, and often face greater mental and physical health challenges than the general Medicare population, which can make navigating the health care system and health care coverage challenging for this population. Separate eligibility requirements, benefits, and rules for Medicare and Medicaid may further contribute to what has been described as a “fragmented and disjointed system of care for dual eligibles.”

To address concerns about fragmented care and high costs, some policymakers have proposed to expand the role of Medicare Advantage plans that are designed for dual-eligible individuals (or a subset of these plans). Existing Medicare coverage arrangements for dual-eligible individuals vary in the degree of care coordination and integration of financing between Medicare and Medicaid. Some coverage options may offer a greater degree of coordination and financing (such as FIDE D-SNPs) than others. Plans with generally higher degrees of integration tend to have relatively low enrollment nationwide compared with the more common coverage options, in part because they are not widely available.

Proposals that would require dual-eligible individuals to be covered under a Medicare Advantage plan designed for this population would mean a transition from one source of Medicare coverage to another, potentially disrupting care arrangements between patients and providers depending on network restrictions, for the large share of dual-eligible individuals who are covered under traditional Medicare – a group that is disproportionately non-Hispanic White, under the age of 65 with permanent disabilities, living in rural areas, and living in states where enrollment in dual-eligible plans is currently relatively low.

Higher enrollment among dual-eligible individuals in Medicare Advantage plans designed for this population could potentially address fragmentation challenges between Medicare and Medicaid, though based on current evidence, it is not clear these plans always improve the coordination of care. In addition, it is not clear how such changes would affect expenditures under both programs. Assessing the potential effects of various coverage arrangements on the experiences of dual-eligible individuals, and on Medicare and Medicaid spending is beyond the scope of this analysis but would inform consideration of policy proposals that aim to improve coverage and care for this high-need population.

This work was supported in part by Arnold Ventures. KFF maintains full editorial control over all of its policy analysis, polling, and journalism activities.

Appendix Tables

Medicare Coverage Options for Dual-Eligible Individuals
State-level Shares of Medicare Beneficiaries in Traditional Medicare by Dual Status, 2020
State-level Shares of Dual-Eligible Individuals by Medicare Coverage Option, 2020
State-level Shares of Full and Partial Benefit Dual-Eligible Individuals in Traditional Medicare, 2020

Methods

Methods

Data: Medicare enrollment is based on analysis of the Centers for Medicare & Medicaid Services Chronic Conditions Data Warehouse 2020 research-identifiable Master Beneficiary Summary File (MBSF) Base. The estimates are based on a 20% sample of Medicare beneficiaries.

Sample Definition: Medicare beneficiaries were required to have both Part A and Part B in March 2020 to be included in this analysis. Dual-eligible individuals were identified based on their dual status in March 2020. This analysis includes people in the 50 States, Puerto Rico, and Washington, D.C. Individuals without a valid state and county code were excluded. This approach is consistent with other KFF analysis of Medicare Advantage enrollment in some ways, but differs from previous analyses of dual-eligible individuals in four main ways: first, in previous analyses individuals with Medicare Part A or Part B were included. Second, in previous analyses dual eligibility included individuals who were dually eligible for Medicare and Medicaid at any point during the year, whereas in this study dual eligibility was defined in the month of March. Third, previous analyses included only people living in the 50 states and the District of Columbia, in contrast this analysis includes people living in Puerto Rico as well. Finally, previous analyses did not require a valid county code to identify where individuals lived. As a result, this analysis includes a lower number of dual-eligible individuals (10.6 million) than KFF reports elsewhere (12.5 million).

Traditional Medicare enrollment: Beneficiaries without a valid Medicare Advantage contract ID in March 2020 were defined as enrolled in traditional Medicare. This analysis does not identify beneficiaries who are aligned to an Accountable Care Organization or who receive their Medicare benefits through a Financial Alignment Initiative managed FFS program. Additionally, this analysis is unable to identify traditional Medicare beneficiaries who have employer-sponsored or self-purchased supplemental insurance coverage because this information is not included in the MBSF data.

Medicare Advantage enrollment: This includes enrollment in all private plans including Medicare Advantage plans. Beneficiaries with a valid contract ID in March 2020 were identified as enrolled in Medicare Advantage. To determine the type of plan in which the beneficiary was enrolled, the contract ID and plan ID were matched to the March 2020 Monthly Enrollment by Plan or the Special Needs Plan Report data published by CMS.

Medicare Advantage plans include SNPs (D-SNPs, I-SNPs and C-SNPs), individual plans and employer plans and other types of private plans include: Program for All-Inclusive Care (PACE) plans, Medicare-Medicaid Plans, section 1876 cost contract plans, and section 1833 health care prepayment plans (HCPP plans). In this analysis non-Medicare Advantage plans are included in the Medicare Advantage enrollment totals, in contrast to other KFF analyses, which have excluded these types of plans. When those plans are excluded, the share of Medicare beneficiaries with both Part A and Part B that are in a Medicare Advantage plan is slightly lower.

Identifying Dual-Eligible Individuals: Dual eligibility was identified based on the dual-eligible status code in March 2020. Those who had a dual eligibility code of 02, 04, or 08 were assigned full-benefit dual eligibility status and those with a code of 01, 03, 05, or 06 were assigned partial-benefit dual eligibility status. In Puerto Rico, individuals were also flagged as dual-eligible individuals if they were enrolled in a coordination-only D-SNP in March 2020. All other Medicare beneficiaries were identified as Medicare beneficiaries without Medicaid.

Race/Ethnicity. Race/ethnicity was identified using the variable RTI race code in the MBSF which was developed by the Research Triangle Institute using an algorithm.

Geographical identifiers. A metropolitan statistical area consists of the county or counties (or equivalent entities) associated with at least one urbanized area of at least 50,000 population, plus adjacent counties having a high degree of social and economic integration with the core as measured through commuting ties. A micropolitan statistical area consists of, “the county or counties (or equivalent entities) associated with at least one urban cluster of at least 10,000 but less than 50,000 population, plus adjacent counties having a high degree of social and economic integration with the core as measured through commuting ties. Rural statistical areas are all other non-metropolitan and non-micropolitan areas.

Headed Back To School in 2023: A Look at Children’s Routine Vaccination Trends

Authors: Elizabeth Williams, Robin Rudowitz, and Sophia Moreno
Published: Jul 31, 2023

For updated data on child vaccination trends, including MMR vaccination coverage and vaccine exemption rates, read our latest analysis: Headed Back to School in 2024: An Update on Children’s Routine Vaccination Trends

This week the U.S. Food and Drug Administration (FDA) approved the first monoclonal antibody shot to protect young children against respiratory syncytial virus (RSV). While rates have now fallen, the three respiratory viruses (RSV, influenza, and COVID-19) surged among children last winter. Routine vaccinations, including the COVID-19 and flu shot, and the new RSV injection can provide important protection for children as they head back to school and into the winter season this year. This issue brief examines the most recent trends in children’s routine vaccinations, including COVID-19, and explores what to watch as children head back to school this year.

Since the beginning of the COVID-19 pandemic, the share of kindergarten children up to date on their vaccinations has ticked down. The CDC recommends children receive immunizations against 14 diseases by the age of two (or 24 months), with additional doses and immunizations through age 18. Data collected and aggregated annually by the CDC from state and local immunization programs, found that for the second year in a row, the national measles, mumps, and rubella (MMR) vaccination rate among kindergarten students fell below the Healthy People 2030 target of 95%, which is the level needed to prevent community transmission of measles. Specifically, the share of kindergarteners with all state-required vaccines, including MMR, DTaP (diphtheria, tetanus, and acellular pertussis), and varicella, has declined for the two school years following the onset of the pandemic, from approximately 95% in 2019-2020 to 94% in 2020-2021 and then declining again to 93% in 2021-2022. While this is a small decline, this is the lowest MMR rate reported in almost a decade and leaves approximately 250,000 school children unvaccinated and unprotected against measles, one of the world’s most contagious viruses.

While vaccination rates vary by state, the majority of states experienced declines in the share of kindergarteners up to date on their vaccines. There is substantial variation in vaccination coverage by state, with the latest available data for kindergarteners during the 2021-2022 school year showing MMR vaccine coverage rates ranged from 78% in Alaska to 98.6% in Mississippi (Figure 1). There is similar state variation in coverage for other state-required vaccines including DTaP, varicella, and polio. In addition, vaccine coverage rates for all vaccines among kindergarteners declined in a majority of states when comparing the 2021-2022 school year to the previous school year. Looking specifically at MMR coverage, 32 states saw declines, with the largest decline (over 5 percentage points) in Georgia.

Share of Kindergartener's Fully Vaccinated Against MMR for the 2021-2022 School Year by State

There is evidence of declines in vaccination coverage rates for kindergarteners, but early data for children in other age groups is more mixed. A CDC survey (National Immunization Survey (NIS) – Child) of younger children found no decline in vaccination coverage overall for children aged 24 months associated with the pandemic. Another CDC survey of teens (NIS-Teen) ages 13-17 reported human papillomavirus (HPV) vaccine coverage remained stable but found potential decreases in meningococcal conjugate (MenACWY) and tetanus, diphtheria, and pertussis (Tdap) coverage associated with the pandemic. However, researchers noted they are unable to assess the full impact of the pandemic on adolescent routine vaccinations until more children age into the teen survey sample.

There is also evidence that disparities in vaccine coverage rates that pre-dated COVID, persisted during the pandemic and may have worsened for some groups. While the CDC survey of children aged 24 months mentioned above found no decline in vaccination coverage overall for children aged 24 months associated with the pandemic, it did find declines among specific groups of children, including low-income children and children living in rural areas. Even before the pandemic, the percent of children aged 24 months immunized was lower for children with Medicaid or uninsured children (compared with privately insured children), Black and Hispanic children (compared with White children), low-income children (compared with children in families with incomes greater than 133% of the federal poverty level), and children in rural areas (compared with children in more densely populated areas) (Figure 2). Research has shown that distrust, safety concerns, and experiences with discrimination and other factors can contribute to racial disparities in vaccination rates. Structural barriers such as distance to vaccine provider and other logistical challenges can also contribute to these differences across groups. KFF COVID-19 Vaccine Monitor data have shown Hispanic and Black parents are more likely than White parents and to cite concerns that reflect access barriers to vaccination, including not being able to get the vaccine from a trusted place, believing they may have to pay an out-of-pocket cost, having difficulty traveling to a vaccination site, or needing to take time off work to get their child vaccinated. Parents of children with household incomes under $50,000 were more likely than those with higher incomes to report similar concerns.

Pre-Pandemic Vaccination Coverage Among Children Age 24 Months

COVID-19 vaccination uptake has stalled, and vaccination rates remain low for young children. Last year, the CDC’s Advisory Committee on Immunization Practices (ACIP) voted to add COVID-19 vaccines to the recommended pediatric immunization schedule that includes the other routine vaccines for children discussed above. As of May 2023, 5.5% of children under age five, 32.9% of children ages 5-11, and 61.8% of children ages 12-17 had completed their COVID-19 primary series. Some of this variation in uptake may reflect parental views and concerns. KFF’s COVID-19 Vaccine Monitor from December 2022 reported that 45% of parents of children under five said they will “definitely not” get their child vaccinated, which is has increased from earlier surveys, when the vaccines were not yet available.

Percent of Children With Completed COVID-19 Primary Series, by Age Group

What to watch looking ahead?

It will take some time before we can understand the full impact of the pandemic on children’s routine vaccination rates and what is driving the recent changes. There is evidence of declines in vaccination coverage rates for kindergarteners, but early data for younger children (0-24 months) and adolescents (13-17) is more mixed. Even so, there have been recent reports that the CDC is expected to decrease federal funding for state vaccination programs due to budget cuts by Congress, a move that could impact data collection used to track vaccinations and prevent outbreaks. Some children missed or delayed preventive care early in the pandemic, and it is unclear the extent to which they will catch up and the magnitude of gaps that will remain. One study found weekly routine vaccination administration rates declined early in the pandemic, but then rebounded back to pre-pandemic levels by fall 2020. Despite the rebound in vaccine administration, the share of children up to date with all their vaccinations declined, likely due to some children still needing to make up for missed vaccinations early in the pandemic. Preliminary data for Medicaid/CHIP children through July 2022 show a similar trend.

There have been some recent shifts in public opinion as well as state vaccination policies that will be important to watch as they could have implications for children’s vaccination rates going forward. The KFF Vaccine Monitor in December 2022 found that about seven in ten adults (71%) say healthy children should be required to get vaccinated for MMR in order to attend public schools. This remains high but is down from 82% who said the same in an October 2019 Pew Research Center poll. Almost three in ten (28%) now say that parents should be able to decide not to vaccinate their school-age children, even if this creates health risks for others, up from 16% in 2019. All states allow a medical exemption from required vaccinations, and 46 states (including D.C.) allow for a religious or personal belief exemption (or both). The most recent CDC data showed the percentage of children claiming a vaccine exemption remained low at 2.6% for the 2021-2022 school year, but the percentage did increase in 38 states and D.C compared to the previous school year. While one state (D.C.) currently requires the COVID-19 vaccine for school children, 21 states have banned student COVID-19 vaccine mandates. Vaccine misinformation and disinformation may be contributing to vaccine hesitancy and the recent uptick in exemptions and slight declines in vaccination coverage.

With gains in enrollment during the pandemic, Medicaid now covers almost half of children in the U.S.; however, some children may lose coverage during the unwinding of the continuous enrollment provision which could impact vaccination rates. It is estimated that between 2 and 7 million children could lose Medicaid coverage during the unwinding of the Medicaid continuous enrollment provision that was in place during most of the pandemic, though the share of individuals disenrolled across states will vary due to differences in how states prioritize renewals. Significant declines in Medicaid enrollment are likely to increase the number of uninsured, which may have implications for children’s vaccination rates, as uninsured children typically have the lowest vaccination rates (Figure 3). Still, even with the COVID-19 public health emergency (PHE) having ended in May, all ACIP recommend vaccines (including the COVID-19 vaccine) are available with no cost sharing for all children, either through an insurer or the Vaccines for Children program (VFC). Various tools, including discussions with providers, incentives, outreach, and the media, can be used to increase children’s vaccination rates.

Senate Appropriations Committee Approves FY 2024 Labor, Health and Human Services, Education, and Related Agencies (Labor HHS) Appropriations Bill

Published: Jul 28, 2023

The Senate Committee on Appropriations approved the FY 2024 Labor, Health and Human Services, Education, and Related Agencies (Labor HHS) appropriations bill and accompanying report on July 27, 2023. The Labor HHS appropriations bill includes funding for U.S. global health programs provided to the Centers for Disease Control and Prevention (CDC) and funding for global health research activities provided to the National Institutes of Health (NIH). Total global health funding at CDC and NIH through the Labor HHS bill is not yet known, as funding for some programs at NIH is determined at the agency level rather than specified by Congress in annual appropriations bills. Funding for global health programs at CDC totals $693 million, flat compared to the FY 2023 enacted level, $72 million (9%) below the President’s FY24 request ($765 million), and $322 million (87%) above the House level ($371 million). See the table below (downloadable table here) for additional detail on global health funding. See other budget summaries and the KFF budget tracker for details on historical annual appropriations for global health programs.

Table 1: KFF Analysis of Global Health Funding in the FY24 Senate Appropriations Bill
Department / Agency / AreaFY23Omnibus(millions)FY24 Request (millions)FY24 House i(millions)FY24 Senate(millions)Difference: FY24 Senate – FY23 OmnibusDifference: FY24 Senate – FY24 RequestDifference: FY24 Senate – FY24 House
Labor Health & Human Services (Labor HHS)
Centers for Disease Control & Prevention (CDC) – Total Global Health$692.8$765.0$370.8$692.8$0 (0%)$-72.2 (-9.4%)$322.1 (86.9%)
Global HIV/AIDS$128.9$128.9Not specified$128.9$0(0%)$0(0%) –
Global Tuberculosis$11.7$11.7Not specified$11.7$0(0%)$0(0%)
Global Immunization$230.0$240.0Not specified$230.0$0(0%)$-10(-4.2%) –
Polio$180.0$180.0Not specified$180.0$0(0%)$0(0%) –
Other Global Vaccines/Measles$50.0$60.0Not specified$50.0$0(0%)$-10(-16.7%) –
Parasitic Diseases$29.0$31.0Not specified$29.0$0(0%)$-2(-6.5%) –
Global Public Health Protection$293.2$353.2$100.0$293.2$0(0%)$-60(-17%)$193.2(193.2%)
Global Disease Detection and Emergency ResponseNot specifiedNot specifiedNot specifiedNot specified – – –
of which Global Health Security (GHS)Not specifiedNot specifiedNot specifiedNot specified – – –
Global Public Health Capacity DevelopmentNot specifiedNot specifiedNot specifiedNot specified – – –
National Institutes of Health (NIH) – Total Global Health – – – – – –
HIV/AIDSNot specifiedNot specifiedNot specifiedNot specified – – –
Malariaii $225.0$225.0Not specifiedNot specified – – –
Fogarty International Center (FIC)$95.2$95.0$95.2$95.2$0(0%)$0.2(0.2%)$0(0%)
Labor HHS Total – – – – –
Notes:
i – As of July 28, 2023, the House Committee on Appropriations has only released the LHHS bill text with limited information on funding totals; this table will be updated as more information becomes available.
ii – The NIH FY23 and FY24 malaria amounts are estimates from the NIH Research, Condition, and Disease Categorization (RCDC) system.

New OIG Report Examines Prior Authorization Denials in Medicaid MCOs

Published: Jul 27, 2023

Medicaid managed care organizations (MCOs) deliver care to more than two-thirds of all Medicaid enrollees nationally. Managed care plans often require patients to obtain approval of certain health care services or medications before the care is provided—an insurance practice commonly referred to as “prior authorization” (or PA). This allows the health plan to evaluate whether care is covered and medically necessary. If the health plan determines the requested service (or medication) isn’t appropriate or medically necessary, they may deny the request (fully or partially). While Medicaid MCOs may limit services based on medical necessity or utilization management tools (e.g., prior authorization), federal rules specify services must be no less (in amount, duration, and scope) than offered under fee-for-service and MCOs cannot arbitrarily deny or reduce a required service based solely on an enrollee’s illness or condition.

A recent KFF survey of consumer experiences with health insurance found that about one in five Medicaid enrollees say they’ve had issues with prior authorization—higher than for most other types of insurance–and close to a quarter said that their health got worse because of this or another insurance problem. Doctors have indicated that prior authorization can delay care and can result in negative clinical outcomes. To better understand the implications of prior authorization policies, Congress asked the U.S. Department of Health and Human Services (HHS) Office of Inspector General (OIG) to investigate whether Medicaid MCOs are providing medically necessary health care services to their enrollees. OIG gathered data about prior authorization denials for 2019 from the 7 biggest “parent” MCO companies (representing 115 comprehensive Medicaid MCO plans in 37 states and about 29 million enrollees (or 57% of MCO enrollees in these states)). OIG also surveyed state Medicaid officials about oversight of prior authorization denials and appeals.

What are rates of Medicaid managed care prior authorization denials?

OIG found that Medicaid MCOs had an overall prior authorization denial rate of 12.5%–more than 2 times higher than the Medicare Advantage rate (Figure 1). In 2019, the Medicaid MCOs included in the OIG review requested over 17 million prior authorizations. Medicaid MCOs denied (fully or partially) over 2.2 million of these requests, meaning they rejected (full or partially) about 1 in 8 or 12.5% of the prior authorization requests. The overall prior authorization denial rate is more than two times higher than the Medicare Advantage denial rate—at 5.7%.

Medicaid MCO Prior Authorization Denial Rate Compared to Medicare Advantage, 2019

Prior authorization denial rates ranged widely across and within parent firms and states. For example, the parent firm, Molina, had individual MCOs with denial rates that ranged from 7% to 41%. Parent firms included in the OIG review operated from 3 (CareSource) to 33 (Centene) individual MCOs.

Variation in Medicaid MCO Prior Authorization Denial Rates Across Firms and States

What happens after a Medicaid prior authorization denial?

After a prior authorization request is denied, Medicaid enrollees can appeal, but it’s not always straightforward and many appeals don’t change the initial decision. Enrollees or providers who disagree with the MCO’s prior authorization decision have a right to appeal to the MCO for reconsideration. If an MCO upholds its initial denial, enrollees have a right to request a state fair hearing. However, the OIG review found most (89%) Medicaid enrollees do not appeal to the MCO for reconsideration, perhaps because they don’t know that they can, which aligns with findings from KFF’s survey of consumer experiences with health insurance. Of the few who do appeal, only about one-third get the initial denial overturned—far less than for Medicare Advantage appeals (Figure 3). Further, the OIG review found that of the prior authorization denials that MCOs upheld, only 2% were appealed to a state fair hearing—perhaps due to lack of awareness and/or complicated process.

Success Rates for First-Level Appeals to MCO After Prior Authorization Denials: Medicaid MCO vs. Medicare Advantage in 2019

Unlike in Medicare Advantage, if a Medicaid MCO upholds its original denial, there is no automatic, independent external medical review. In both Medicaid and Medicare Advantage, the first step for enrollees who receive a prior authorization denial (and wish to pursue it further) is to appeal to the managed care plan for reconsideration. In Medicare Advantage, if the managed care plan upholds the original denial, the case is automatically sent to an independent review entity. In Medicaid, states may offer an external review option, but most don’t. (Even in the states that offer external medical reviews, OIG found limited use of these reviews.) OIG suggests that this automatic independent review process might help explain why Medicare Advantage’s appeal overturn rate is 82%–far higher than Medicaid MCOs.

OIG found that state Medicaid agency oversight of prior authorization denials is limited. States are not federally required to conduct oversight of MCO denials (e.g., monitoring denial rates or reasons for denial, monitoring outcomes of appeals, or auditing denials to assess whether they are clinically appropriate). OIG found that most states either don’t regularly check denial decisions for clinical appropriateness (i.e., to see if denials follow state’s coverage and medical necessity rules) or only check when they feel it is necessary (“ad hoc”) (e.g., in response to specific disputes, provider complaints etc.) (Figure 4). OIG also reported that while 22 states collect MCO denials data to keep an eye on MCO prior authorization decisions,15 states don’t collect denials data for oversight (data not shown).

Share of State Medicaid Programs with Clinical Appropriateness Reviews for MCO Prior Authorization Denials

What are key issues to watch?

The OIG report underscores concerns about prior authorization and access in Medicaid managed care, keeping this issue at the forefront of ongoing policy discussions. While prior authorizations can help manage health care utilization, denials can create barriers to receiving care, cause delays, affect patient health, and may exacerbate health disparities. OIG suggests that the wide variation in denial rates might be due to varying policies or how they’re carried out. They recommend adding denials and appeals processes that are similar to Medicare Advantage, including stronger state monitoring of denials and a requirement for automatic external medical reviews following MCO appeal denials. In addition to proposed rules to improve access to care in Medicaid managed care, CMS has separately proposed rules around prior authorizations, but these rules mostly focus on streamlining process, reducing approval wait times, and improving transparency.

Key Facts About Medicare Part D Enrollment and Costs in 2023

Authors: Juliette Cubanski and Anthony Damico
Published: Jul 26, 2023

The Medicare Part D program provides an outpatient prescription drug benefit to older adults and people with long-term disabilities in Medicare who enroll in private plans, including stand-alone prescription drug plans (PDPs) to supplement traditional Medicare and Medicare Advantage prescription drug plans (MA-PDs) that include drug coverage and other Medicare-covered benefits. This brief analyzes Medicare Part D enrollment and costs in 2023 and trends over time, based on data from the Centers for Medicare & Medicaid Services (CMS).

This analysis highlights the substantial growth of Medicare Advantage drug plans in the marketplace for Part D drug coverage, where enrollment overall is concentrated in a handful of large plan sponsors. Average premiums and deductibles for drug coverage are much lower in MA-PDs than in stand-alone PDPs. Cost-sharing requirements for covered drugs in MA-PDs and PDPs are different, making comparisons of out-of-pocket drug costs difficult. While lower premiums can make MA-PDs attractive to enrollees, coverage in a Medicare Advantage plan also comes with limits on provider networks and utilization management restrictions that do not apply in traditional Medicare.

More than half of all Medicare Part D enrollees are in Medicare Advantage drug plans

A total of 50.5 million people with Medicare are currently enrolled in plans that provide the Medicare Part D drug benefit, including plans open to everyone with Medicare (stand-alone PDPs and MA-PDs), and plans for specific populations (retirees of a former employer or union and Medicare Advantage Special Needs Plans, or SNPs).

In 2023, more than half of all Medicare Part D enrollees (56%, or 28.3 million) are enrolled in MA-PDs and 44% (22.2 million) are enrolled in stand-alone PDPs, continuing a trend of declining enrollment in PDPs and increasing enrollment in MA-PDs, reflecting enrollment growth in Medicare Advantage plans overall (Figure 1, Table 1). Between 2019 and 2023, the number of MA-PD enrollees increased by 47% (9 million more MA-PD enrollees), while enrollment in PDPs decreased by 12% (3 million fewer PDP enrollees). In 2023, there are 6.1 million more Medicare beneficiaries with drug coverage under MA-PDs than PDPs.

More Medicare Part D Enrollees Are in Medicare Advantage Drug Plans Than in Stand-alone Prescription Drug Plans

Part D enrollment is concentrated in 3 national firms – UnitedHealth, CVS, and Humana – with a combined 57% of all Part D enrollees

The top three firms – UnitedHealth, CVS Health, and Humana – cover close to 6 in 10 of all Medicare beneficiaries enrolled in Part D in 2023 (57%), the same share as in 2022 (Figure 2).

The Top 3 Firms - UnitedHealth, CVS Health, and Humana - Cover Close to 6 in 10 Medicare Part D Enrollees in 2023

Apart from Kaiser Permanente, which does not offer stand-alone PDPs, the top Part D plan sponsors offer both PDPs and MA-PDs. For most firms, Part D enrollment is more concentrated in one market than the other; for example, CVS Health, Centene, and Cigna have greater enrollment in PDPs than MA-PDs, while UnitedHealth and Humana have more MA-PD enrollees than PDP enrollees (Figure 3).

Most of the Major Firms Sponsoring Medicare Part D Plans  Offer Both Medicare Advantage and Stand-alone Drug Plans

Six in 10 beneficiaries receiving the Part D Low-Income Subsidy are enrolled in Medicare Advantage drug plans

In 2023, 13.4 million Part D enrollees (27% of all Part D enrollees) receive premium and cost-sharing assistance through the Part D Low-Income Subsidy (LIS) program. These additional financial subsidies, also called “Extra Help,” pay Part D premiums for eligible beneficiaries (as long as they enroll in stand-alone PDPs designated as premium-free “benchmark” plans) and reduce cost sharing. The Inflation Reduction Act expands eligibility for full Part D LIS benefits beginning in 2024.

Consistent with overall Part D enrollment trends, LIS enrollment in PDPs has declined over time while increasing in MA-PDs; MA-PDs now enroll 62% of all LIS enrollees (8.3 million) (Figure 4, Table 1). As LIS enrollment in MA-PDs has increased, enrollment in Special Needs Plans (SNPs), a type of Medicare Advantage plan, has also increased. Nearly 4 in 10 LIS enrollees (39%, or 5.2 million) are enrolled in SNPs in 2023, up from 4% in 2006. SNPs limit enrollment to beneficiaries with certain characteristics, including those who are dually enrolled in Medicare and Medicaid (D-SNPs), which account for most SNP enrollees; those with certain chronic conditions (C-SNPs); and those who require an institutional level of care (I-SNPs).

Six in 10 Beneficiaries Receiving the Part D Low-Income Subsidy Are Enrolled in Medicare Advantage Drug Plans

The average monthly premium for Part D drug coverage is 4 times more in PDPs than in MA-PDs

The enrollment-weighted average monthly premium for PDPs is $40 in 2023 and has remained within a few dollars of this amount for several years (Figure 5, Table 2). The average monthly PDP premium is substantially higher than the enrollment-weighted average monthly portion of the premium for drug coverage in MA-PDs ($10 in 2023). (The total average premium for MA-PDs, including all Medicare-covered benefits, is $15 per month in 2023.) MA-PD sponsors can use rebate dollars from Medicare payments to lower or eliminate their Part D premiums, so the average premium for drug coverage in MA-PDs is heavily weighted by zero-premium plans. Rebates to Medicare Advantage plans are at historically high levels, having more than doubled between 2018 and 2023. In 2023, 73% of MA-PD enrollees are in plans that do not charge a monthly premium (up from 54% in 2018), while all stand-alone PDPs charge a monthly premium. The average enrollment-weighted premium for Part D coverage for the 27% of MA-PD enrollees in plans that charge a monthly premium is $38 in 2023, similar to the average monthly premium for PDPs.

The Average Monthly Premium for Part D Coverage in Stand-alone Drug Plans Is 4 Times More Than in Medicare Advantage Drug Plans in 2023

The weighted average annual Part D deductible is 7 times larger in PDPs than in MA-PDs

In 2023, a large majority of PDP enrollees (86%) are in plans that charge a deductible, with three-fourths of PDP enrollees in plans that charge the standard amount of $505 in 2023. Conversely, just over 1 in 5 MA-PD enrollees (22%) are in plans that charge the standard Part D deductible, while 60% are in plans that charge no drug deductible. These enrollment patterns explain the wide divergence between PDPs and MA-PDs in the enrollment-weighted average Part D deductible amount. For PDPs, the average Part D deductible in 2023 is $411, seven times larger than the average drug deductible in MA-PDs ($58) (Figure 6). Just as MA-PDs can use rebate dollars to lower the Part D portion of the plan premium, they can also use rebate dollars to reduce Part D cost-sharing amounts, including deductibles.

The Average Annual Part D Deductible is 7 Times Larger in Stand-alone Drug Plans than in Medicare Advantage Drug Plans in 2023

Part D enrollees typically face no or low monthly copays for generic drugs but substantially higher copays or coinsurance for other drugs

The typical five-tier formulary design in Part D includes tiers for preferred generics, generics, preferred brands, non-preferred drugs (which can include both brands and generics), and specialty drugs. Both stand-alone PDP and MA-PD enrollees face much higher cost-sharing amounts for brands and non-preferred drugs than for drugs on a generic tier (Figure 7). PDP enrollees are more likely to face a mix of copayments and coinsurance for different formulary tiers, while MA-PD enrollees typically face copayments for all tiers except the specialty tier. (This analysis does not compare which specific drugs are covered on each tier in PDPs and MA-PDs, which, in addition to the cost-sharing amounts that plans charge, would also influence enrollees’ out-of-pocket costs.)

  • A larger share of MA-PD enrollees than PDP enrollees pay $0 for generics, whether on a preferred tier or on the standard generic tier.
  • For preferred brands, 65% of MA-PD enrollees and 21% of PDP enrollees face copayments for preferred brands of $45 to $47 (the maximum copayment amount permitted by CMS), while 40% of PDP enrollees are in plans that charge coinsurance of 25% or less, compared to less than 1% of MA-PD enrollees.
  • For non-preferred drugs, most MA-PD enrollees (91%) are in plans that charge copayments while virtually all PDP enrollees are in plans that charge coinsurance. Over half (53%) of all MA-PD enrollees are in plans that charge $100 for non-preferred drugs, the maximum copayment amount allowed by CMS. Half of PDP enrollees are in plans than charge 40% to less than 50% for non-preferred drugs and 24% are in plans that charge a 50% coinsurance rate, the maximum coinsurance allowed.
  • A larger share of MA-PD enrollees than PDP enrollees are in plans that charge the maximum 33% coinsurance rate for specialty tier drugs. For specialty tier drugs, defined by CMS as those that cost at least $830 per month in 2023, a much larger share of enrollees in MA-PDs (76%) than PDPs (14%) are in a plan that charges the maximum 33% coinsurance, while a much larger share of enrollees in PDPs (76%) than MA-PDs (3%) are in a plan that charges the minimum 25% coinsurance. Plans that waive some or all of the standard deductible – which is the case for most MA-PDs – are permitted to set the specialty tier coinsurance rate above 25%.

Given the different cost-sharing structures adopted by MA-PDs and PDPs, particularly for non-preferred drugs, it can be difficult to compare the actual out-of-pocket costs that beneficiaries would face for different types of drugs across plan types. It can also be difficult to know how a coinsurance rate will translate into actual out-of-pocket costs without knowing the underlying list price of a drug.

Medicare Part D Enrollees Typically Face No or Low Monthly Copays for Generic Drugs but Substantially Higher Copays or Coinsurance for Other Drugs

Juliette Cubanski is with KFF. Anthony Damico is an independent consultant.

Medicare Part D and Part D Low-Income Subsidy Program Enrollment, by Plan Type, 2006-2023

Weighted Average Medicare Part D Monthly Premiums and Annual Deductibles, by Plan Type, 2006-2023

The U.S. Government and Global Health Security

Published: Jul 25, 2023

This analysis does not reflect recent changes that have been implemented by the Trump administration, including a foreign aid review and restructuring. For more information, see KFF’s Overview of President Trump’s Executive Actions on Global Health.

Key Facts

  • Attention to and support for global health security efforts (activities to help countries prepare for and develop capacities to address epidemic and pandemic diseases) – also referred to as pandemic prevention, preparedness, and response – have grown over the past few decades, driven by emerging infectious diseases such as HIV, SARS, influenza, Ebola, Zika, and COVID-19.
  • The U.S. government (U.S.) has supported global health security work for more than two decades and is the single largest government donor to such efforts, providing financial support and technical assistance to help build countries’ capacity to prevent, detect, and respond to infectious disease threats. The U.S. also was instrumental in launching the international “Global Health Security Agenda” (GHSA) initiative in 2014 and “The Pandemic Fund” financing mechanism in 2022.
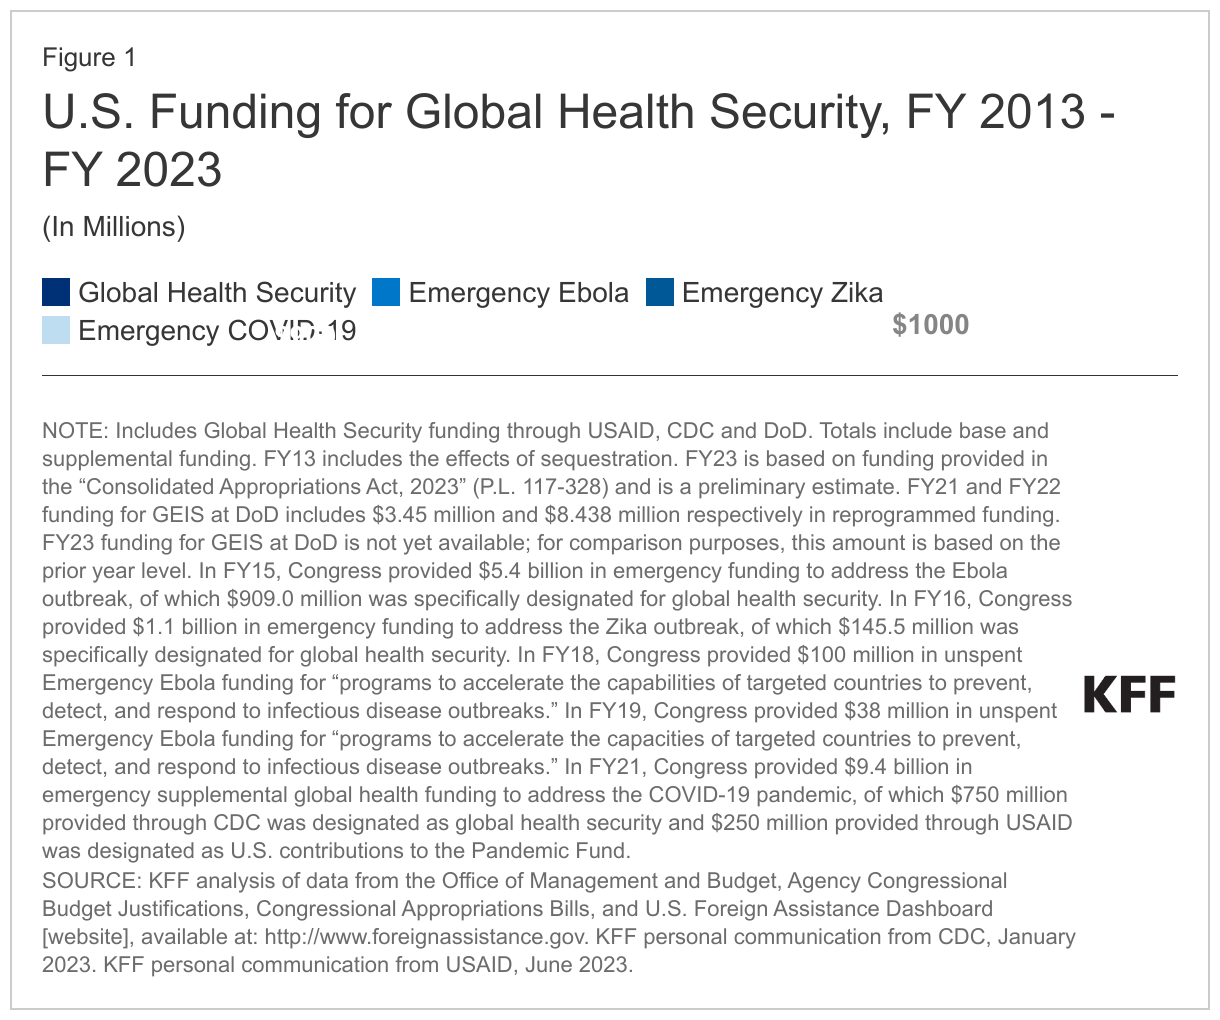
  • Historically, U.S. funding for global health security has waxed and waned over time, with spikes in funding driven almost entirely by specific disease events, often through emergency spending measures. For example, while funding for global health security in the years prior to COVID-19 typically ranged between $400 million and $500 million per year, it spiked to $1.34 billion in FY 2015 after the West Africa Ebola outbreak and again to $1.67 billion in FY 2021 after COVID-19, and it remains at higher than historical levels, with FY 2023 funding at $1.49 billion. The President requested $1.9 billion for global health security in FY 2024.
  • COVID-19, in particular, increased attention to global health security among U.S. policymakers, with several bills introduced in Congress including one outlining a new U.S. global health security framework that became law in 2022. In addition, the Biden administration has taken several steps to bolster U.S. global health security efforts including reinstating the National Security Council’s Global Health Security and Biodefense Directorate, reversing the prior administration’s decision to withdraw the U.S. from membership in the World Health Organization (WHO), expanding country and regional partnerships, and supporting The Pandemic Fund.
  • On September 20, 2023, the United Nations General Assembly, with WHO, will convene a high-level meeting on pandemic prevention, preparedness, and response that will include discussion of a new pandemic accord, which is currently being drafted and negotiated, and proposed amendments to the International Health Regulations, leading up to the World Health Assembly in May 2024.

Background

Global recognition of the threat of epidemic and pandemic diseases has grown over time, and concerns about such outbreaks has fueled efforts to improve local, national, and international capabilities to address emerging diseases. These efforts have been referred to as “global health security” and, more recently, “pandemic prevention, preparedness, and response” activities (see Box 1).

Box 1: Defining Key Terms: Global Health Security & Pandemic Preparedness and Response

Global Health Security (GHS) can be defined as activities supporting epidemic and pandemic preparedness and capabilities at the country and global levels, in order to minimize vulnerability to acute public health events that can endanger the health of populations across geographical regions and international boundaries. This includes efforts to improve countries’ capacity to prevent, detect, and respond to infectious disease threats.1  Over the past few years, the terms Pandemic Prevention, Preparedness and Response (PPPR) and Pandemic Preparedness and Response (PPR) have also been used frequently to refer to these types of activities as well.

This brief uses the term GHS to refer to activities, often supported by donors such as the U.S., that have the goal of building country-, regional-, and global-level capacities for infectious disease prevention, preparedness and response, but does not include research and development for countermeasures (such as diagnostics, drugs, and vaccines), nor support for acute epidemic response in other countries (such as funding for vaccine procurement and distribution during the COVID-19 pandemic or direct support to a country’s response to an Ebola outbreak).

While not every emerging infectious disease has major public health implications, some result in significant epidemics or global pandemics, such as HIV which emerged in the 1980s and marked a major turning point. Since then, multiple other new human infectious diseases have been identified (e.g., SARS, MERS, SARS-CoV-2 (COVID-19)), while other diseases have “re-emerged,” causing greater numbers of cases than before and/or affecting different populations and regions (e.g., dengue fever and Ebola). Still others have developed resistance to available treatment (e.g., multi-drug resistant tuberculosis) or been newly linked to adverse health outcomes (e.g., Zika).

Beyond their toll on health, these diseases can lead to severe societal and economic disruptions, even from smaller scale outbreaks. For example, the original SARS outbreak resulted in an estimated $30 billion in economic losses (over $3 million per case) in 2003, primarily from reduced commerce, travel and trade, while the 2014-2015 West Africa Ebola epidemic in Guinea, Liberia, and Sierra Leone resulted in an estimated $53 billion in economic losses. During a pandemic these effects are amplified even more, as was demonstrated during COVID-19, which the International Monetary Fund has recently called “the largest global economic crisis in more than a century” as national GDP levels fell by a median of 3.9% from 2019 to 2020 across all countries. In the U.S. alone, one estimate from late 2020 put the cost of the pandemic at $16 trillion – a number four times as large as the lost economic output from the ‘Great Recession’ of 2008.

At times, countries have worked together on international efforts and agreements to strengthen global health security and pandemic preparedness and response capacities. For example, in 2005, WHO member states agreed to revise the International Health Regulations (IHR), a long-standing international agreement that outlines roles and responsibilities for countries and international organizations in global health security. The revised IHR, among other things, requires countries to develop minimum capacities to detect, report, assess, and respond to outbreaks and other public health emergencies. In 2014, noting that progress on meeting the IHR requirements had been slow and unequal across regions, a group of governments – with the U.S. playing an instrumental role – and other stakeholders launched the Global Health Security Agenda (GHSA), a multilateral initiative to speed country progress in identifying and addressing gaps in basic global health security capacities (see Box 2). In addition, growing recognition of the importance of global health security to broader economic and social development has been reflected in the inclusion of a global health security objective under the U.N. Sustainable Development Goals (adopted in 2015) as well as by multiple recent endorsements of global health security by the leaders of the G7 and G20.

Despite such efforts, countries remained largely unprepared for outbreaks. According to a WHO review, in 2018 most countries still had “low to moderate” levels of national preparedness for emerging diseases and did not meet IHR core capacity requirements. An independent review of global health security in 2019 found “no country is fully prepared for epidemics or pandemics.” The world’s experience with COVID-19 has put the lack of preparedness and response capacity into stark relief, shining a spotlight on major gaps in financing for strong public health systems, social protection programs, international cooperation, and other aspects of global health security. It also, according to the Independent Panel for Pandemic Preparedness and Response, showed that existing measures of preparedness “failed to account sufficiently for the impact on responses of political leadership, trust in government institutions and country ability to mount fast and adaptable responses.”

Efforts are underway to identify not only the weaknesses exposed by the COVID-19 pandemic but also the steps that could be taken to address them. One proposal has already become a reality with the establishment of a new global funding mechanism known as The Pandemic Fund2  in September 2022, backed by strong U.S. support (see the KFF brief). A number of other proposals have also been put forward in light of COVID-19, including calls for a new “pandemic accord” (with drafting and negotiating underway) and more empowered leadership at national and international levels. Furthermore, discussions have begun on proposed amendments to the IHR. The ultimate impact COVID-19 will have made on re-shaping global health security efforts going forward remains to be determined, as debates and negotiations on these and other topics are likely to continue to play out for months and years to come.

U.S. Government Efforts

The U.S. has supported global health security efforts for over two decades.3  Specific policy guidance for federal agencies dates back to a 1996 Presidential Decision Directive on emerging diseases (PDD/NSTC-7), and each subsequent administration has updated or released new policy and strategic guidance. For example, the importance of U.S. support for global infectious disease surveillance and response capacities was emphasized in the Obama administration’s 2009 National Strategy for Countering Biological Threats and the Trump administration’s 2018 National Biodefense Strategy. The first U.S. Global Health Security Strategy (GHS Strategy), mandated by Congress, was released by the Trump administration in 2019. However, in parallel, the Trump administration made moves to pull back from some global health security engagement, including disbanding the National Security Council (NSC) Directorate on Global Health Security and Biodefense (first established during the Obama administration) and, in mid-2020, initiating the process of withdrawing the U.S. from WHO membership and halting U.S. contributions to WHO.

Starting in January 2021, the Biden administration took immediate steps to reorient and increase U.S. support for the global COVID-19 response and to reinvigorate and revamp U.S. global health security efforts. On his first day in office, President Biden issued an executive order that, among other things, restored the NSC Directorate on Global Health Security and Biodefense and also directed that the NSC Principals Committee coordinate the government’s efforts to address biological threats and pandemics and advise the president on global response to and recovery from COVID-19, including matters related to global health security and WHO. At that time, President Biden issued a national security memorandum on U.S. leadership regarding the global COVID-19 response and global health security, which states that the current administration “will treat epidemic and pandemic preparedness, health security, and global health as top national security priorities” and reversed the Trump administration’s earlier decision to begin withdrawing the U.S. from WHO membership. The administration also released the National Strategy for the COVID-19 Response and Pandemic Preparedness, which states that it is a U.S. goal to “restore U.S. leadership globally, advance health security, and build better preparedness for future threats;” it also affirmed that the U.S. would restore its funding to WHO, which the prior administration had halted, and work to strengthen and reform the agency, including through its role as a member of the WHO Executive Board (see the KFF fact sheet on the U.S. government and WHO and KFF brief on the Biden administration’s global health agenda for more information).

More recently, in October 2022, the administration issued another national security memorandum, directing the National Security Advisor and relevant agencies to recommend, within a year, updated goals and objectives for inclusion in the GHS strategy incorporating lessons from the COVID-19 pandemic, and outlining U.S. support for the global health security architecture internationally. The 2019 GHS strategy – the first national strategy focused specifically on U.S. global health security efforts and developed at the direction of Congress – guided U.S. government activities aimed at “accelerating capacities of targeted countries to prevent, detect, and respond to infectious disease outbreaks protect populations at home and abroad.” Such a strategy is also a requirement of a global health security bill that became law late last year; it also outlined a new framework for these efforts, requires periodic reporting, and allows U.S. contributions to The Pandemic Fund.

Approach

The U.S. approach centers on bilateral financial and technical support for capacity-building programs in certain partner countries as well as multilateral support and cooperation. In FY 2021, the U.S. focused its bilateral efforts in 19 GHSA “partner countries” and supported additional efforts in other countries, reaching more than 40 countries overall and, in some cases, regional efforts.4   U.S. multilateral efforts include playing leading roles in the negotiations for the 2005 revision of the IHR, the development and launch of the GHSA (see Box 2) in 2014, and the launch of The Pandemic Fund in 2022. The U.S. also participates in and supports international responses to outbreaks. For example, it was the largest donor to and supporter of the response to the 2014-2015 West Africa Ebola epidemic, the largest Ebola outbreak in history. It also provided support to the Global Fund to Fight AIDS, Tuberculosis and Malaria and Gavi, the Vaccine Alliance to address COVID-19. As mentioned earlier, in 2021, under the Biden administration the U.S. re-engaged with and restored funding to WHO and stated that it would take steps to strengthen U.S. leadership in the global COVID-19 response and elevate U.S. efforts in support of GHSA.5 

Box 2: The Global Health Security Agenda (GHSA)

The U.S. played the leading role in developing the Global Health Security Agenda (GHSA), a multilateral initiative that aims to serve as “a catalyst for progress toward the vision of attaining a world safe and secure from global health threats posed by infectious diseases.” Launched in 2014 for an initial 5-year period (2014-2019), it has been extended for a second five-year period through 2024. Among the strategic objectives of the GHSA are to:

  • promote international initiatives, instruments, and frameworks relevant for health security; and
  • increase domestic and international partner financial support for strengthening and maintaining capacities to prevent, detect and respond to infectious disease outbreaks, including health system strengthening.

There are 70 member countries of the GHSA, including the U.S. The initiative incorporates several multilateral institutions as partners, such as WHO, the United Nations Food and Agriculture Organization (FAO), the World Organization for Animal Health (OIE), the World Bank, and World Trade Organization (WTO). Private sector and non-governmental partners also engage the initiative through forums such as the Private Sector Roundtable on Global Health Security and GHSA Consortium.

GHSA members have agreed to coordinate efforts and mutually work toward goals in defined areas of global health security, known as “action packages.” To assist in this process, the GHSA helped develop a tool for independent evaluation of countries’ preparedness levels, known as the Joint External Evaluation (JEE); these scores are used as benchmarks for country and global progress in global health security. Over 100 countries, including the U.S., have undergone such an evaluation since 2014.

GHSA and the IHR are meant to be complementary, with GHSA action packages designed to support countries’ progress toward meeting IHR core capacity requirements. While the GHSA and the IHR facilitate cooperative efforts among countries, ultimately country governments are responsible for ensuring capacity to prevent, identify, and respond to emerging diseases within their own borders.

Organization

Multiple U.S. agencies are engaged in global health security efforts. The National Security Council (NSC) is responsible for overall coordination and review of U.S. strategy and activities in global health security, including its international response; its Global Health Security and Biodefense Directorate, which was first established during the Obama administration but disbanded during the Trump administration, has been restored under the Biden administration. The U.S. Agency for International Development (USAID), the Centers for Disease Control and Prevention (CDC), and the Department of Defense (DoD) are the primary agencies involved in implementing global health security programs in partner countries. The Department of State (State), the Department of Health and Human Services (HHS), and the U.S. Department of Agriculture (USDA) also support global health security-related activities.

USAID

The USAID Global Health Bureau’s global health security program helps countries build capacity to identify and respond to dangerous pathogens in animals and humans and to be prepared for outbreaks, including pandemics. Other USAID global health programs support health systems strengthening, including building surveillance and laboratory capacities that have applications for global health security. In addition, the Office of Foreign Disaster Assistance (OFDA) has often been involved when the U.S. engages in large-scale international outbreak responses.

CDC

The CDC Center for Global Health’s Division of Global Health Protection provides capacity-building, training, and educational support to other countries through its Global Disease Detection Operations Center (GDD), Emergency Response and Recovery Branch (ERRB), and Field Epidemiology Training Program (FETP). Other CDC global health programs help build surveillance, laboratory, and other capacities relevant to global health security. CDC has also created a cross-agency rapid response team for international deployment, and CDC staff are often involved in international outbreak response efforts.

DOD

The Department of Defense (DoD) Defense Threat Reduction Agency’s Biological Threat Reduction Program (BTRP), previously known as the Cooperative Biological Engagement Program (CBEP), funds capacity-building efforts to strengthen partner countries’ biosecurity, surveillance, and response capabilities and is a component of the DoD’s broader Cooperative Threat Reduction (CTR) program. The DoD’s Global Emerging Infections Surveillance System (GEIS) provides technical and funding support for DoD and partner organizations’ surveillance, research and development, outbreak response, and local capacity-building and helps support Army and Navy laboratories that are located in multiple foreign countries.

STATE

The Department of State engages in diplomacy and coordination in support of global health security and is home to the Biological Engagement Program (BEP), a biological security assistance and capacity building effort. The Coordinator for Global COVID-19 Response and Health Security, a role created within the department during the Biden administration, is charged with leading the U.S. response to the pandemic overseas and ensuring that U.S. global health security efforts adequately equip partner countries for future global health threats.6  In late 2022, the Secretary of State announced plans to consolidate the department’s efforts in this area under a new Bureau of Global Health Security and Diplomacy, expected to launch in July 2023; it will bring together the functions of several Coordinators and offices, including that of the COVID-19 Response Coordinator as well as PEPFAR’s Office of the U.S. Global AIDS Coordinator and Global Health Diplomacy.

HHS

HHS is the official U.S. point of contact with WHO for IHR purposes and often represents the U.S. at multilateral meetings on emerging disease topics and helps coordinate U.S. global health security efforts. HHS also supports research and development for emerging disease countermeasures (e.g., drugs and vaccines) through the National Institutes of Health (NIH) and the Biodefense Advanced Research and Development Authority (BARDA), while the Food and Drug Administration (FDA) is responsible for regulatory review and approval.

In addition, the USDA, particularly through its Animal and Plant Health Inspection Service (APHIS), supports global capacity building for food safety and animal health surveillance, as well as research on animal diseases overseas.

Funding7 

U.S. funding for its main global health security programs has waxed and waned over time, with occasional spikes driven by supplemental funding connected to specific disease events. For example, while funding generally ranged between $400 million and $500 million in the years just prior to the COVID-19 pandemic, it spiked to $1.34 billion in FY 2015, due to an influx of emergency funding provided to address the Ebola outbreak in West Africa and support future preparedness efforts. In the wake of the COVID-19 pandemic, it reached $1.67 billion in FY 2021 (($674 million through regular appropriations and $1 billion through emergency supplemental funding), $1.24 billion in FY 2022, and $1.49 billion in FY 2023 due to increased funding levels (see Figure 1).8  The administration’s FY 2024 budget request includes approximately $1.9 billion: $1.26 billion via USAID/the Department of State, an increase of $360 million compared to FY 2023; $353 million via CDC, an increase of $60 million compared to FY 2023; and an estimated $290 million via DoD, essentially level to FY 2023.9 

U.S. Funding for Global Health Security, FY 2013 - FY 2023

U.S. funding for global health security is provided primarily through accounts at USAID, CDC, and DoD (also see the KFF budget fact sheet):

  • USAID: USAID funding for global health security activities has generally risen each year over the past 10 years, from $55.2 million in FY 2013 to $900 million in FY 2023, with occasional spikes in connection with outbreak events or reprogrammed funding from such events. For example, the agency received $385 million in FY 2015, including $72.5 million through regular appropriations and $312 million through emergency funding in connection with Ebola; $218 million in FY 2016, including $72.5 million through regular appropriations and $145.5 million through emergency funding in connection with Zika; and some reprogrammed unspent FY 2015 Ebola funding in FY 2018 and FY 2019.10 ,11  More recently it has seen a large increase in base and overall funding in the wake of COVID-19, rising from about $441 million in FY 2021 (including about $191 million through regular appropriations and $250 million through emergency funding in connection with COVID-19) to $700 million in FY 2022 to a peak of $900 million in FY 2023. (Also see discussion of U.S. contributions to The Pandemic Fund below).
  • CDC: CDC funding for global health security activities has also generally risen over the past 10 years, from $54 million in FY 2013 to $293 million in FY 2023, with occasional spikes. For example, the agency received $652 million ($55 million through regular appropriations and $597 million through emergency funding in connection with Ebola) in FY 2015, which was made available for use through FY 2019. Partly in response to the anticipated decline in program funding upon expiration of this emergency funding, base funding at CDC rose in FY 2020 (from $108 million in FY 2019 to $183 million in FY 2020). Additionally, $750 million in FY 2021 emergency funding for the COVID-19 response was ultimately designated for global health security at CDC, and base funding rose from $203 million in FY 2021 to $293 million in FY 2023.12 ,13 
  • DoD: BTRP received $235 million in FY 2023, down from a peak of $320 million in FY 2014 – after which it decreased for several years before beginning to increase steadily since FY 2019. GEIS received between about $43 to $60 million each year from FY 2013 through FY 2023.14 

In addition to these key accounts, other funds may be used for global health security activities, though public information about them is often limited. For example, DoD provides some funding to support Army and Navy overseas labs, and the Department of State, USDA, and other agencies’ budgets support additional global health security activities.

U.S. Funding for Global Health Security, FY 2013 – FY 2024 Request(in $ millions)
Agency/Program201320142015201620172018201920202021202220232024 Req
TOTAL366.2498.51,341.6552.1364.1512.3503.5537.81674.51241.01486.91900.3
USAID Global Health Security^55.272.6384.5218.072.5172.6138.0100.0440.8700.0900.0760.3
Global Health Programs55.272.572.572.572.572.6100.0100.0190.8700.0900.0745.0
   Of which, Pandemic Fund         Of which, 200.0Of which, 250.0# 
Economic Support Fund0.113.3
AEECA0.82.0
Emergency Ebola312.0100.038.0
Emergency Zika145.5
Emergency COVID-19250.0
   Of which, Pandemic Fund           Of which, 250.0   
State Global Health Security500.0
Global Health Programs500.0
   Of which, Pandemic Fund           Of which, 500.0
CDC Global Health Protection^54.362.6652.155.258.2108.2108.2183.2953.2253.2293.2353.2
Global Public Health Protection54.362.655.155.258.2108.2108.2183.2203.2253.2293.2353.2
Emergency Ebola597.0
Emergency COVID-19750.0
DoD256.6363.4305.0278.9233.4231.5257.3254.6280.5287.8293.7286.8
BTRP211.0320.0256.8222.0175.7172.8197.6203.6225.4229.0235.0228.0
GEIS45.643.448.256.957.758.759.850.955.258.758.7*58.7*
NOTES: Totals include base and supplemental funding. — means $0/not applicable. Totals may not sum due to rounding. FY13 includes the effects of sequestration. BTRP is the Biological Threat Reduction Program, formerly known as the Cooperative Biological Engagement Program (CBEP). GEIS is the Global Emerging Infections Surveillance system.^ In FY15, Congress provided $5.4 billion in emergency funding to address the Ebola outbreak, of which $909.0 million was specifically designated for global health security at USAID and CDC. In FY16, Congress provided $1.1 billion in emergency funding to address the Zika outbreak, of which $145.5 million was specifically designated for global health security at USAID. In FY18, Congress provided $100 million in unspent Emergency Ebola response funding for “programs to accelerate the capabilities of targeted countries to prevent, detect, and respond to infectious disease outbreaks” at USAID. In FY19, Congress provided $38 million in unspent Emergency Ebola response funding for “programs to accelerate the capacities of targeted countries to prevent, detect, and respond to infectious disease outbreaks” at USAID. In FY20 and FY 21, Congress provided emergency COVID-19 funding to address the COVID-19 pandemic globally.# For FY23, $250 million is planned, pending congressional approval, for such a contribution. * GEIS funding for FY23 and FY24 request assumes level funding based on FY22 level.SOURCES: KFF analysis of data from the Office of Management and Budget, Agency Congressional Budget Justifications, Congressional Appropriations Bills, U.S. Foreign Assistance Dashboard [website], available at: http://www.foreignassistance.gov, GEIS and AFHSC/AFHSB annual reports, and personal communication with DoD and CDC. See also KFF, Global Funding Across U.S. COVID-19 Supplemental Funding Bills.

U.S. Contributions to The Pandemic Fund

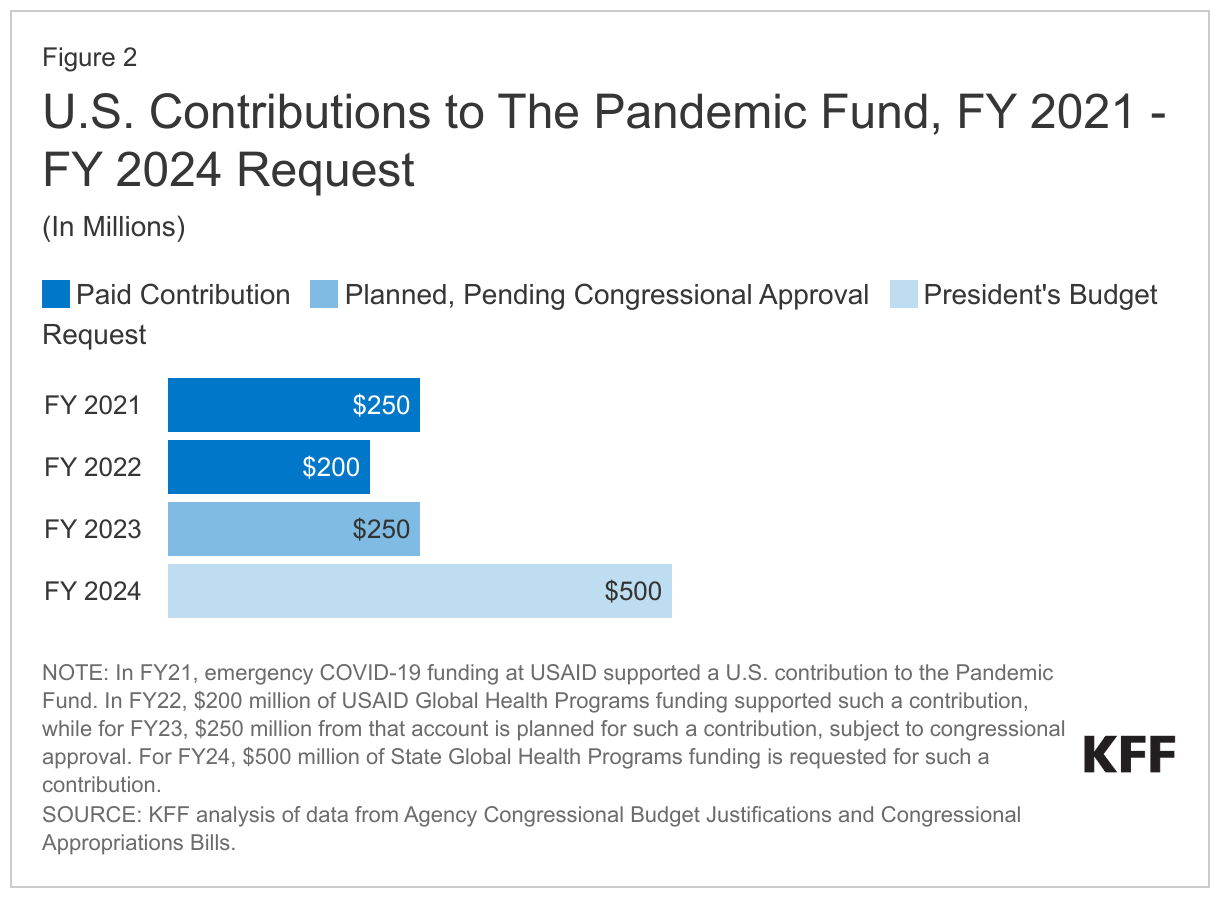
U.S. global health security funding also includes U.S. contributions to the recently created “The Pandemic Fund” as follows: $250 million in FY 2021 from COVID-19 emergency funding at USAID, $200 million for FY 2022 from the global health programs (GHP) account at USAID, $250 million (planned, subject to congressional approval) for FY 2023 from GHP at USAID, and $500 million requested for FY 2024 from the Department of State. See Figure 2.

Interactive Datawrapper Embed

Key Issues for the U.S.

While the U.S. has supported global health security activities for decades and remains the single largest contributor to international capacity building, U.S. attention to and funding for global health security have waxed and waned over time. In addition, despite efforts by the U.S. and others, global preparedness for epidemics and pandemics remains weak, as evidenced by the degree to which countries, including the U.S., and global response systems exhibited significant vulnerabilities to COVID-19 over the past several years. This has led to an intensified U.S. and global focus on the importance of global health security and new efforts to bolster preparedness, though the extent to which these will have lasting impact remains to be seen. Among key issues to watch include:

  • the funding levels the Biden administration proposes for global health security efforts (including an additional $500 million requested for FY 2024 for U.S. support to The Pandemic Fund) and the amounts ultimately appropriated for these efforts by Congress and whether more consistent and sustained funding is made available instead of the episodic funding patterns of the past;
  • the implementation of the new global health security law as well as congressional oversight of this process and how the adoption of the law’s requirements affects the organization, coordination, leadership, strategy, and reporting of U.S. efforts;
  • the impact of other changes in the U.S. approach to and organization of its global health security efforts including the launch of the new Bureau of Global Health Security and Diplomacy at the Department of State;
  • the extent of U.S. engagement with partners and multilateral organizations, including WHO, on global health security through various avenues, such as GHSA, the World Health Assembly and the WHO Executive Board and specifically related to negotiations on a new pandemic accord and proposed amendments to the IHR; and
  • the implications of a greater focus on U.S. global health security for the “unfinished business” of global health, including core U.S. programs such as PEPFAR and PMI, and whether U.S. global health security efforts are able to effectively coordinate with other program areas to better leverage their efforts to collectively strengthen health system resilience to future shocks such as pandemics.
  1. Definition drawn from WHO’s World Health Report 2007 – A Safer Future: Global Public Health Security in the 21st Century, 2007 (http://www.who.int/whr/2007/overview/en/); WHO’s Global Health Security web page (https://www.who.int/health-topics/health-security/#tab=tab_1), The terms “global health security” and “health security” do not have a universally agreed-upon definitions, and opinions can differ as to what is and is not included within each. See: C. McInnes, ‘The many meanings of health security’, in S. Rushton and J. Youde (eds), Routledge Handbook of Global Health Security, 2014, pp. 7-17; and W. Aldis, “Health security as a public health concept: a critical analysis,” Health Policy & Planning, 2008, 23(6):369–375. ↩︎
  2. Formally known as the Financial Intermediary Fund (FIF) for Pandemic Prevention, Preparedness, and Response, and hosted by the World Bank. ↩︎
  3. As mentioned in Box 1, research and development activities for countermeasures to emerging diseases (such as diagnostics, treatments and vaccines), while recognized as being important for global health security, are not included within the scope of this analysis. ↩︎
  4. KFF personal communication with CDC, March 2020. ↩︎
  5. White House, “Letter to His Excellency António Guterres,” correspondence from President Biden, Jan. 20, 2021, https://www.whitehouse.gov/briefing-room/statements-releases/2021/01/20/letter-his-excellency-antonio-guterres/; White House, “Readout of Vice President Harris’s Call with World Health Organization Director-General Dr. Tedros Adhanom Ghebreyesus,” Jan. 21, 2021, https://www.whitehouse.gov/briefing-room/statements-releases/2021/01/21/readout-of-vice-president-harriss-call-with-world-health-organization-director-general-dr-tedros-adhanom-ghebreyesus/; White House, National Security Memorandum on United States Global Leadership to Strengthen the International COVID-19 Response and to Advance Global Health Security and Biological Preparedness, NSD-1, Jan. 21, 2021, https://www.whitehouse.gov/briefing-room/statements-releases/2021/01/21/national-security-directive-united-states-global-leadership-to-strengthen-the-international-covid-19-response-and-to-advance-global-health-security-and-biological-preparedness/; HHS, “Dr. Anthony S. Fauci Remarks at the World Health Organization Executive Board Meeting,” Jan. 21, 2021, https://www.hhs.gov/about/news/2021/01/21/dr-anthony-s-fauci-remarks-world-health-organization-executive-board-meeting.html; White House, National Strategy for the COVID-19 Response and Pandemic Preparedness, 2021, https://www.whitehouse.gov/wp-content/uploads/2021/01/National-Strategy-for-the-COVID-19-Response-and-Pandemic-Preparedness.pdf. ↩︎
  6. Department of State, “Secretary Antony J. Blinken Remarks to the Press on the COVID Response,” April 5, 2021, https://www.state.gov/secretary-antony-j-blinken-remarks-to-the-press-on-the-covid-response/. ↩︎
  7. KFF analysis of data from the Office of Management and Budget, Agency Congressional Budget Justifications, Congressional Appropriations Bills, U.S. Foreign Assistance Dashboard [website], available at: http://www.foreignassistance.gov, personal communication with DoD. See also KFF, Global Funding Across U.S. COVID-19 Supplemental Funding Bills. ↩︎
  8. KFF analysis of the Coronavirus Preparedness and Response Supplemental Appropriations Act, 2020 (P.L. 116-123), the Coronavirus Aid, Relief, and Economic Security (CARES) Act (P.L. 116-136), CDC, “CDC COVID-19 Global Response,” fact sheet, Sept. 10, 2020, https://www.cdc.gov/budget/documents/covid-19/COVID-19-Global-Response-fact-sheet.pdf, and personal communication with appropriations and CDC staff, March 2021; KFF, Global Funding Across U.S. COVID-19 Supplemental Funding Bills; KFF personal communication with CDC staff, January 2023. Additionally, though not counted as part of global health security, note that Congress also provided $4 billion via USAID for a U.S. contribution to Gavi, the Vaccine Alliance, for vaccine procurement and delivery as part of emergency funding in the FY 2021 appropriations. ↩︎
  9. FY 2023 is an estimate since FY 2023 GEIS funding is not yet known and is an estimate based on prior year funding. ↩︎
  10. The $385 million provided to USAID by Congress in FY 2015 included $312 million in emergency Ebola funding made available with no end date, and the $218 million provided in FY 2016 included $145.5 million in emergency Zika funding to be expended in that fiscal year. $100 million in reprogrammed FY 2015 emergency Ebola funding in FY 2018 and $38 million in reprogrammed FY 2015 emergency Ebola funding in FY 2019 was directed to USAID global health security activities. See table. ↩︎
  11. The U.S. has also shifted to having some standing funds for emergency response to outbreaks rather than relying only on emergency supplemental appropriations, which can lead to delays in response. Although this funding is not counted as part of global health security efforts, this is a form of preparedness for response, though the funds themselves count toward emergency response when used. Specifically, Congress provided funding for an “emergency reserve fund” in FY 2017, to be made available to support future responses to any “emerging health threat that poses severe threats to human health;” it also reprogrammed some unspent FY 2015 emergency Ebola response funding to provide additional funding to this fund in FY 2018 and FY 2019, as well as provided funding through regular appropriations and COVID-19 emergency funding in more recent years. KFF analysis of congressional appropriations bills.  In addition, unspent funding provide through Ebola and Zika has been set aside for these purposes as well. ↩︎
  12. KFF analysis of American Rescue Plan Act of 2021, P.L. 117-2, and personal communication with CDC, March 2021 and January 2023. ↩︎
  13. The U.S. has also shifted to having some standing funds for emergency response to outbreaks rather than relying only on emergency supplemental appropriations, which can lead to delays in response. Although this funding is not counted as part of global health security efforts, this is a form of preparedness for response, though the funds themselves count toward emergency response when used. Specifically, Congress established an Infectious Diseases Rapid Response Reserve Fund in FY 2019, which allows use of the funds by CDC and certain parts of HHS to prevent, prepare for, or respond to “an infectious disease emergency” in the U.S. or abroad, and has since provided additional funding in more recent years as well. KFF analysis of congressional appropriations bills. ↩︎
  14. FY 2023 is an estimate since FY 2023 GEIS funding is not yet known and is an estimate based on prior year funding. ↩︎

U.S. International COVID-19 Vaccine Donations Tracker

Published: Jul 24, 2023

The U.S. International COVID-19 Vaccine Donations Tracker includes data as of July 24, 2023. We will not be updating in the future. For more information, please visit the U.S. State Department.

The U.S. has pledged to donate at least 1.1 billion doses of COVID-19 vaccine doses for global use before 2023. This tracker provides data on U.S. COVID-19 vaccine donations. It provides a breakdown of donated doses delivered1  by the U.S. and will be updated regularly as new data are released. Click below to navigate by topic. Additionally, click here to access the full data table.

Overall

U.S. COVID-19 Vaccine Dose Donations Pledged that Have Been Shipped and Delivered

back to top

Recipient Country

Recipients of U.S. COVID-19 Vaccine Donation Deliveries by Total Doses Received
Top Recipients of U.S. COVID-19 Vaccine Donation Deliveries by Total Doses Received

back to top

Income-Level

U.S. COVID-19 Vaccine Donation Deliveries by Income

back to top

Region

U.S. COVID-19 Vaccine Donation Deliveries by Region

back to top

Vaccine Product

U.S. COVID-19 Vaccine Donation Doses Delivered by Vaccine Product
U.S. COVID-19 Vaccine Donation Doses Delivered by Income and Vaccine Product

back to top

Delivery Mechanism

U.S. COVID-19 Vaccine Donation Doses Delivered by Delivery Mechanism

back to top

Delivery Month

U.S. COVID-19 Vaccine Donation Deliveries by Delivery Month

back to top

Table

Table 1: U.S. COVID-19 Vaccine Donation Deliveries by Recipient Country

back to top

  1. Since the U.S. State Department website reports total number of doses shipped, our totals differ as data included in this tracker only include doses that have actually been delivered and received by recipient countries. ↩︎

What are the Implications of New Anti-Obesity Drugs for Racial Disparities?

Published: Jul 24, 2023

Recently medications have emerged that offer new opportunities for obesity treatment. The surge of interest in these drugs also raises questions about who can access them and the potential impacts on racial health disparities. These drugs, including Novo Nordisk’s Ozempic and Wegovy (semaglutide) and Eli Lilly’s Mounjaro (tirzepatide) were initially approved to treat type 2 diabetes, but have also been proven effective in helping people lose weight. Reductions in obesity could help reduce risks for chronic diseases associated with obesity, such as heart disease, type 2 diabetes, and types of cancer, as well as health care costs. However, these medications may not be appropriate for all patients, there are side effects associated with the medications, and studies suggest that most people regain weight if they stop taking them. Moreover, access to these medications varies and they remain unaffordable for many individuals given that they currently are excluded from Medicare coverage, coverage through Medicaid and private plans remains limited, and out-of-pocket costs without coverage can be in excess of $1,300 per month.

As of 2021, roughly 71 million people or one third of the total US adult population were classified as obese, that is having a body mass index (BMI) of over 30 according to self-reported survey data. (Other data based on physical examinations suggest higher prevalence of obesity, although recent data from this source are not available due to pandemic collection issues.) The majority of people with obesity are White (62%), while another 18% are Hispanic, 15% are Black, 2% are Asian, 1% are American Indian or Alaska Native (AIAN), and less than 1% are Native Hawaiian or Other Pacific Islander (NHOPI) (Figure 1).

Distribution of Adult Obesity by Race/Ethnicity, 2021

Although most people with obesity are White, many people of color are at increased risk for obesity. As of 2021, Black (43%), NHOPI (43%), AIAN (39%), and Hispanic (37%) adults all had higher obesity rates than White adults (32%), while Asian adults had a lower obesity rate at 12% (Figure 2). These disparities in obesity reflect a variety of factors, including more limited access to health care as well as social and economic factors, including higher rates of food insecurity, more limited access to healthy food options, more limited time and access to opportunities for physical activity and recreation.

Obesity Rate Among Adults by Race/Ethnicity, 2021

Given higher rates of obesity among people of color, they could particularly benefit from new treatment options. However, they also are more likely than their White counterparts to face barriers to affording and accessing the new medications. AIAN, Hispanic, NHOPI, and Black nonelderly people are more likely to be uninsured and have lower incomes than their White counterparts. Moreover, growing shortages of the medications may further limit access to people with resources and time to navigate systems to identify availability.

Going forward, the new weight loss medications provide an additional tool for obesity prevention and treatment but may remain unaffordable for some patients. Expanded coverage of these medications may help to address some disparities in access. There is interest in expanding coverage under Medicare, including the Treat and Reduce Obesity Act reintroduced to the Senate and House in July 2023, and many private insurance plans and employers are actively considering how to approach coverage of these drugs. Some states also are examining approaches to cover obesity treatment including prescription drugs under Medicaid, which covers a disproportionate share of people of color relative to other payers. Expanded coverage would likely improve access but also increase costs to public payers and private plans, although there is a possibility of a downward effect on health care costs if use of the medications lowers the risk of chronic illnesses associated with obesity. However, even with expanded coverage of these medications, people of color would still face disparities in access given their higher uninsured rates. Moreover, the medications may not be an appropriate treatment option for all patients. Consideration of actions to provide equitable access to these medications, other prevention and treatment strategies, as well as other medical advancements will be important given the ongoing racial disparities in obesity and other health outcomes.

Senate Appropriations Committee Approves FY 2024 State, Foreign Operations, and Related Programs (SFOPs) Appropriations Bill

Published: Jul 21, 2023

The Senate Committee on Appropriations approved the FY 2024 State, Foreign Operations, and Related Programs (SFOPs) appropriations bill, accompanying report, and amendments on July 20, 2023. The SFOPs bill includes funding for U.S. global health programs at the State Department and the U.S. Agency for International Development (USAID). Funding for these programs, through the Global Health Programs (GHP) account, which represents the bulk of global health assistance, totaled $10.3 billion, a decrease of $239 million (-3%) below the FY 2023 enacted level. All of the decrease is due to reduced funding in the bill for the Global Fund to Fight AIDS, Tuberculosis and Malaria (Global Fund), though the accompanying report notes that the decline is “a result of the statutory cap on U.S. contributions related to other donor funds” and that “should sufficient matching contributions be available, the Committee intends to honor the $6,000,000,000 U.S. pledge for the seventh replenishment.” Funding for maternal and child health, Gavi the Vaccine Alliance, family planning and reproductive health (FP/RH), and the Health Reserve Fund increased compared to FY 2023 enacted levels; all other global health areas remained flat. See the table below (downloadable version here) for additional detail on FY 2024 Senate levels compared to the FY 2023 Omnibus as well as the FY 2024 President’s Request and FY 2024 House levels. See other budget summaries and the KFF budget tracker for details on historical annual appropriations for global health programs.

Table 1: KFF Analysis of Global Health Funding in the FY24 Senate Appropriations Bill
Department / Agency / AreaFY23Omnibus(millions)FY24 Request (millions)FY24 House i(millions)FY24 Senate(millions)Difference: FY24 Senate – FY23 OmnibusDifference: FY24 Senate – FY24 RequestDifference: FY24 Senate – FY24 House
State, Foreign Operations, and Related Programs (SFOPs) – Global Health ii
HIV/AIDS iii, iv –$4,700.0 – – – – –
Global Health Programs (GHP) account$4,725.0$4,700.0$4,725.0$4,725.0$0(0%)$25(0.5%)$0(0%)
State Department$4,395.0$4,370.0$4,395.0$4,395.0$0(0%)$25(0.6%)$0(0%)
USAID$330.0$330.0$330.0$330.0$0(0%)$0(0%)$0(0%)
of which Microbicides$45.0$45.0Not specified$45.0$0(0%)$0(0%) –
ESF AccountNot specified$0.0Not specifiedNot specified – – –
Global Fund v$2,000.0$2,000.0$2,000.0$1,650.0$-350(-17.5%)$-350(-17.5%)$-350(-17.5%)
Tuberculosis iii –$358.5 – – – – –
Global Health Programs (GHP) account$394.5$358.5$394.5$394.5$0(0%)$36(10%)$0(0%)
Economic Support Fund (ESF) accountNot specified$0.0Not specifiedNot specified – – –
Malaria$795.0$780.0$800.0$795.0$0(0%)$15(1.9%)$-5(-0.6%)
Maternal & Child Health (MCH)iii –$1,082.5 – – – – –
GHP account$910.0$910.0$910.0$920.0$10(1.1%)$10(1.1%)$10(1.1%)
of which Gavi$290.0$300.0$300.0$300.0$10(3.4%)$0(0%)$0(0%)
of which Polio$85.0$85.0$85.0$85.0$0(0%)$0(0%)$0(0%)
UNICEF iii$142.0$145.0Not specified$145.0$3(2.1%)$0(0%) –
ESF accountNot specified$27.0Not specifiedNot specified – – –
of which PolioNot specified$0.0Not specifiedNot specified – – –
Assistance for Europe, Eurasia, and Central Asia (AEECA) accountNot specified$0.5Not specifiedNot specified – – –
Nutrition iii –$164.8 – – – – –
GHP account$160.0$160.0$172.5$160.0$0(0%)$0(0%)$-12.5(-7.2%)
ESF accountNot specified$4.0Not specifiedNot specified – – –
AEECA accountNot specified$0.8Not specifiedNot specified – – –
Family Planning & Reproductive Health (FP/RH)iii, vi, vii$607.5$677.2$461.0$635.1$27.6 (4.5%)$-42.1 (-6.2%)$174.1 (37.8%)
Bilateral FP/RH vi, vii$575.0$619.7$461.0$600.0$25(4.3%)$-19.7(-3.2%)$139(30.2%)
GHP account vi$524.0$600.0Not specified$549.0$25(4.8%)$-51.1(-8.5%) –
ESF account vi$51.1$19.3Not specified$51.1$0(0%)$31.8(164.5%) –
Assistance for Europe, Eurasia, and Central Asia (AEECA) account viiiNot specified$0.4Not specifiedNot specified – – –
UNFPA ix$32.5$57.5$0.0$35.1$2.6(8%)$-22.4(-38.9%)$35.1(NA)
Vulnerable Children$30.0$30.0$32.5$30.0$0 (0%)$0 (0%)$-2.5 (-7.7%)
Neglected Tropical Diseases (NTDs)$114.5$114.5$114.5$114.5$0 (0%)$0 (0%)$0 (0%)
Global Health Security iii, vii –$1,260.3 – – – – –
GHP account$900.0$1,245.0Not specifiedNot specified – – –
State Department vii $500.0Not specifiedNot specified – – –
of which Pandemic Fund xi$500.0Not specifiedNot specified – – –
USAID$900.0$745.0Not specified$900.0$0(0%)$155(20.8%) –
of which bilateralNot specified$435.0Not specifiedNot specified – – –
of which multilateralNot specified$220.0Not specifiedNot specified – – –
of which the Coalition for Epidemic Preparedness Innovations (CEPI)xii$100.0Not specified$100.0$100.0$0(0%) –$0(0%)
of which Emergency Reserve Fundxiii$90.0xiiixiii – – –
ESF accountNot specified$13.3Not specifiedNot specified – – –
AEECA accountNot specified$2.0Not specifiedNot specified – – –
Emergency Reserve Fundxiiixiiixiiixiii – – –
Health Reserve Fund xiv$8.0$10.0Not specified$10.0$2 (25%)$0 (0%) –
Global Health Worker InitiativeNot specified$20.0Not specified$20.0 –$0 (0%) –
SFOPs Total (GHP account only)$10,561.0$10,928.0$10,018.7$10,268.0$-293 (-2.8%)$-660 (-6%)$249.2 (2.5%)
Notes:
i – The FY24 House and Senate bill texts state that up to $200 million of the funds appropriated by this Act through various accounts “may be made available to combat such infectious disease of public health emergency.”
ii – Unless otherwise specified, funding amounts listed under the “State, Foreign Operations, and Related Programs (SFOPs) – Global Health” heading are provided through the Global Health Programs (GHP) account.
iii – Some HIV, tuberculosis, MCH, nutrition, family planning and reproductive health, and global health security funding is provided under the ESF and AEECA accounts, which is not earmarked by Congress in the annual appropriations bills and is determined at the agency level.
iv – The FY24 Senate report accompanying the SFOPs bill “recommends not less than $30,000,000 under the GHP heading for a pilot project in up to three current PEPFAR countries to enhance antenatal and maternity services.”
v – The FY24 Senate report states that the reduction in funding for the Global Fund compared to the prior fiscal year is “a result of the statutory cap on U.S. contributions related to other donor funds” and that “should sufficient matching contributions be available, the Committee intends to honor the $6,000,000,000 U.S. pledge for the seventh replenishment.”
vi – The FY23 Omnibus bills states that “not less than $575,000,000 should be made available for family planning/reproductive health.” The FY24 House bill states that “of the funds appropriated by this Act, not more than $461,000,000 may be made available for family planning/reproductive health.” The FY24 Senate bill states that “not less than $600,000,000 should be made available for family planning/reproductive health.”
vii – The explanatory statement accompanying the House FY24 SFOPs appropriations bill does not provide specific funding amounts for FPRH or GHS under the GHP account. After the funding amounts specified for all other areas (e.g., HIV, TB, MCH, etc.) are removed, $869.71 million remains under the GHP account at USAID, which is funding that could be used for FPRH and GHS (or other areas as determined by the Administration). Since the House FY24 bill text states that “of the funds appropriated by this Act, not more than $461,000,000 may be made available for family planning/reproductive health” without specifying an account, it is possible the Administration could fund all or a portion of this amount through the GHP account with the remainder directed to GHS (or other areas as determined by the Administration).
viii – It is possible additional funding for FPRH might be provided through the AEECA account, but these amounts, if any, will not be available until late in the fiscal year.
ix – The FY23 Omnibus and FY24 Senate bills state that if this funding is not provided to UNFPA it “shall be transferred to the ‘Global Health Programs’ account and shall be made available for family planning, maternal, and reproductive health activities.”
x – The FY24 Request states that this amount is for the Pandemic Fund to “strengthen global health security and pandemic preparedness and help make the world safer from infectious disease threats.”
xi – The FY24 Senate bill states that “funds appropriated by this Act under the heading ‘Global Health Programs‘ may be made available for contributions to the Financial Intermediary Fund for Pandemic Prevention, Preparedness and Response.”
xii – The explanatory statement accompanying the House FY24 SFOPs appropriations bill directs that $50 million in unobligated balances from previous fiscal years should be made available to CEPI in addition to the $100m provided through the bill matching the FY23 enacted level. The explanatory statement accompanying the Senate FY24 SFOPs appropriations bill recommends “not less than $100,000,000 for a U.S. contribution to the Coalition for Epidemic Preparedness Innovations.”
xiii – The FY23 Omnibus and FY24 Senate bills state that “up to $90,000,000 of the funds made available under the heading ‘Global Health Programs’ may be made available for the Emergency Reserve Fund.” The FY24 Request includes funding for the Emergency Reserve Fund under Global Health Security. The FY24 House bill states that “up to $50,000,000 of the funds appropriated by this Act under the heading ‘Global Health Programs’ may be made available for the Emergency Reserve Fund.”
xiv – The explanatory statement accompanying the FY23 Omnibus states that these funds are “to support cross-cutting health activities, including health service delivery, the health workforce, health information systems, access to essential medicines, health systems financing, and governance, in challenging environments and countries in crisis.” The FY24 Request states that these funds are to “support cross-cutting global health activities in challenging environments or countries emerging from crisis. It will provide flexible, no year funding to ensure basic health services are accessible to those most in need and to build more resilient health services and systems. Activities will focus on six key areas: support for health service delivery, the global health workforce, health information systems, access to essential medicines, health systems financing, and governance.”