KFF Tracking Poll July 2023: Substance Use Crisis And Accessing Treatment
Findings
Key Findings
- With U.S. overdose deaths hitting a new high in 2022, a majority of adults say they have felt the impact of the substance use crisis facing the country. Two-thirds say either they or a family member have been addicted to alcohol or drugs, experienced homelessness due to addiction, or experienced a drug overdose leading to an emergency room visit, hospitalization, or death.
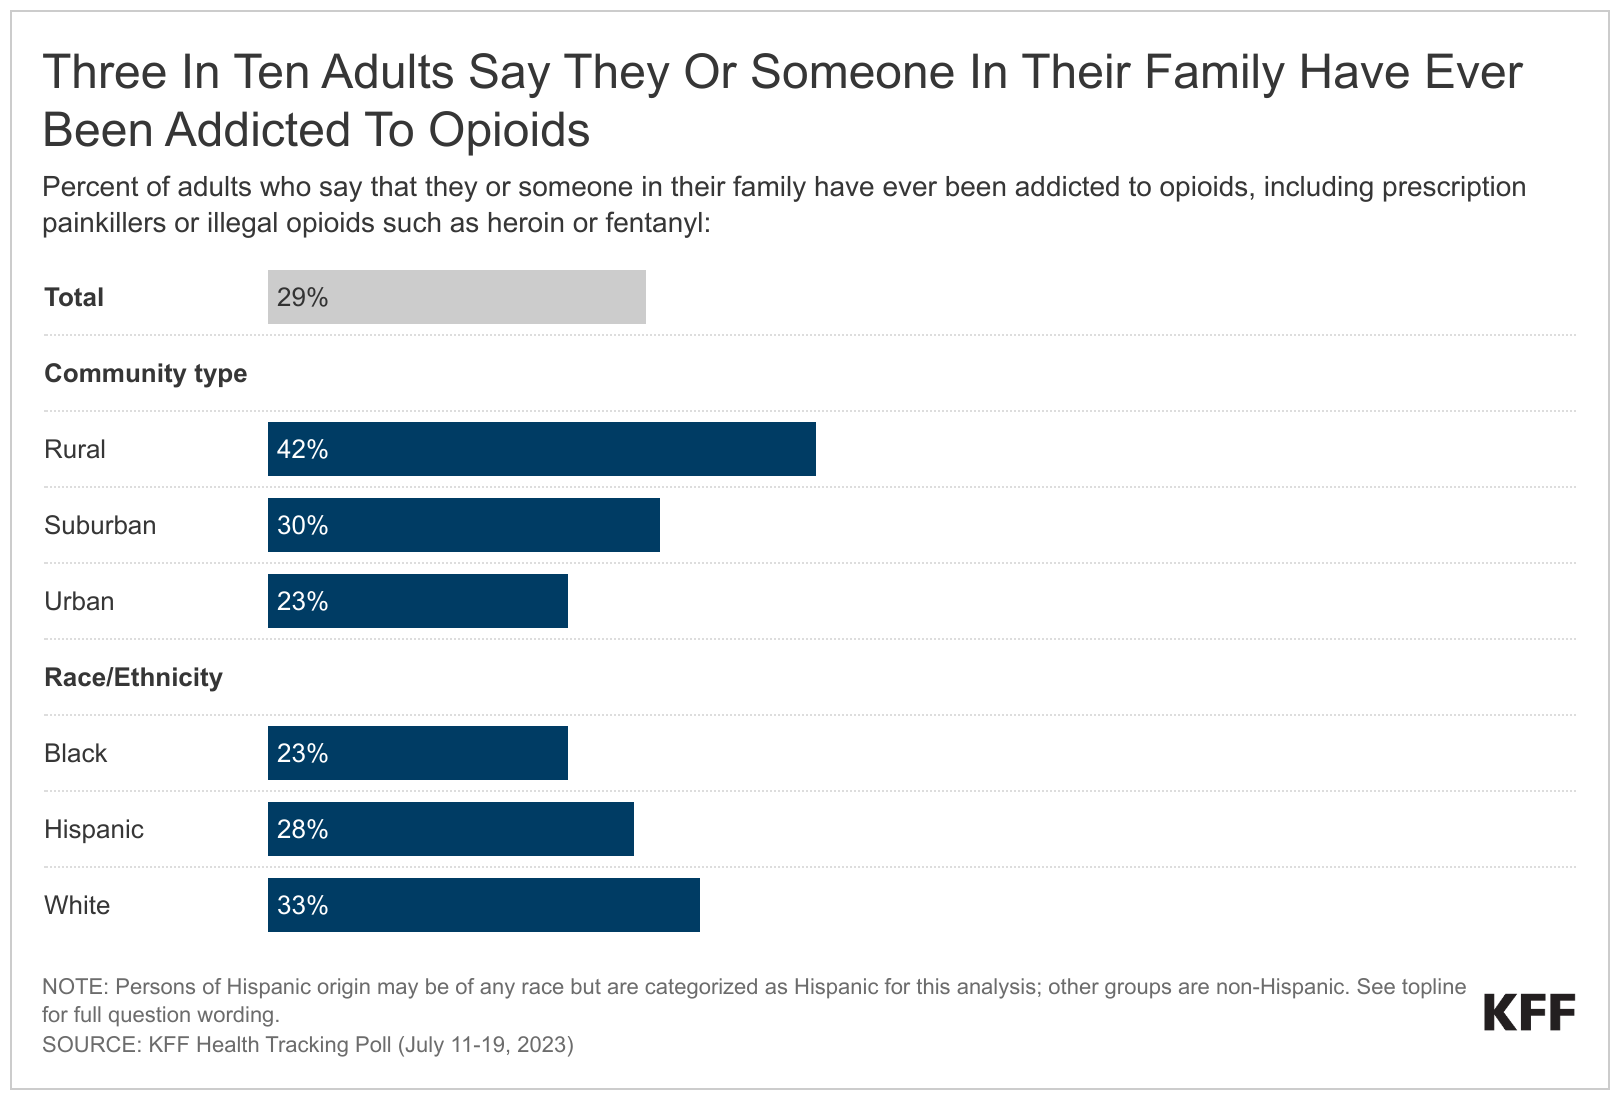
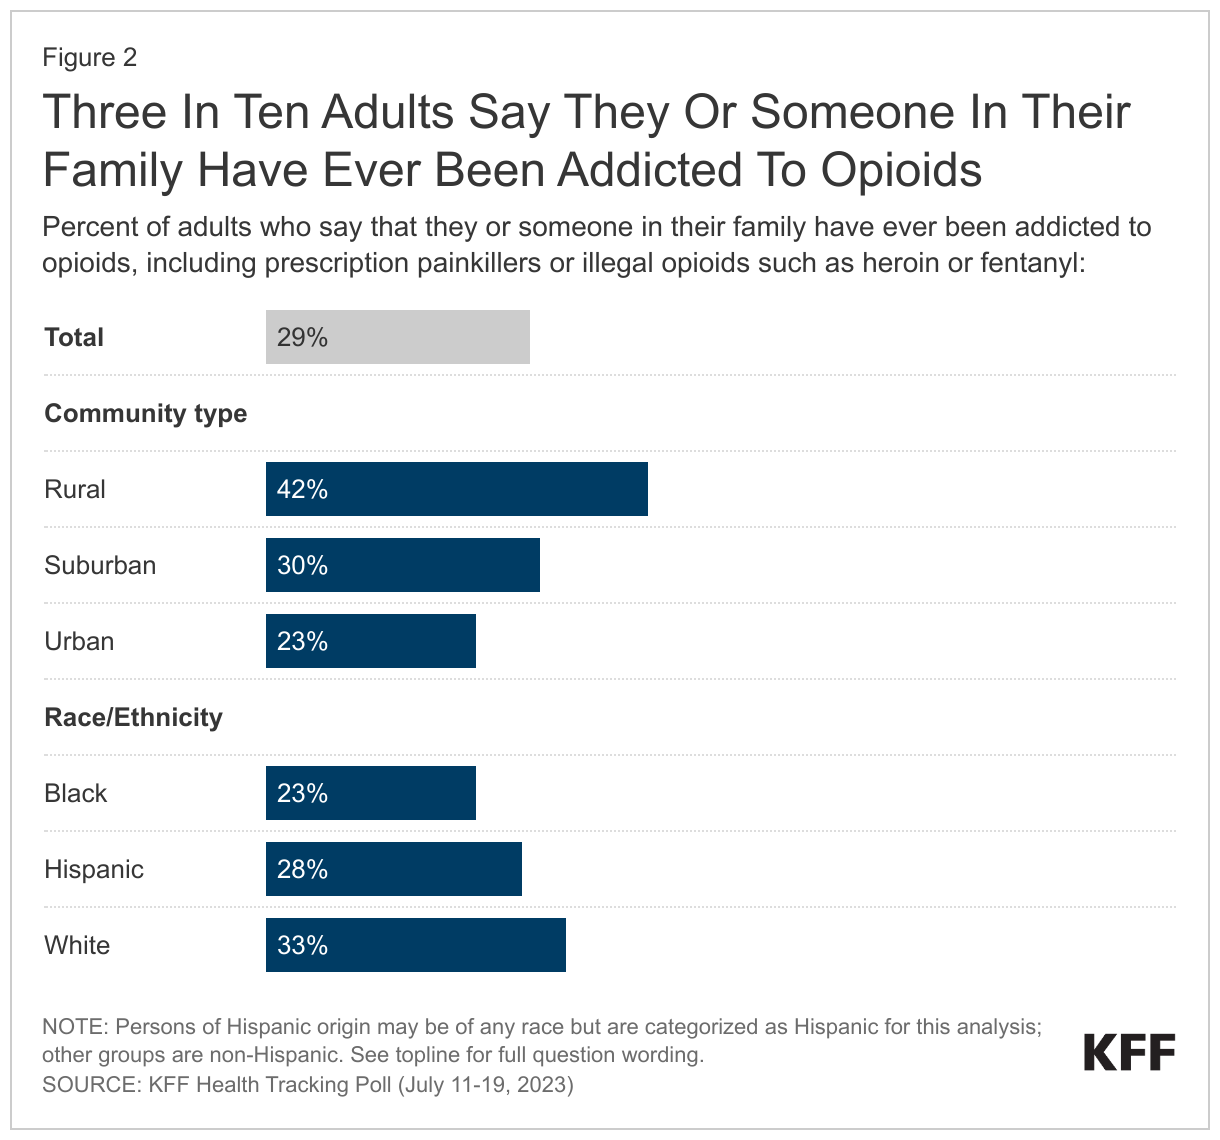
- Three in ten U.S. adults (29%) say they or someone in their family have ever been addicted to opioids, including prescription painkillers and illegal opioids like heroin. Opioid addiction impacts substantial shares across demographic groups like income and gender but is more commonly reported among rural residents and White adults. Four in ten of those living in rural areas (42%) report they or a family member have experienced opioid addiction compared to smaller shares of those living in suburban (30%) or urban (23%) areas. In addition, a larger share of White adults (33%) compared to Black adults (23%) report personal or familial experience with opioid addiction. About three in ten (28%) Hispanic adults also report they or a family member have experienced opioid addiction.
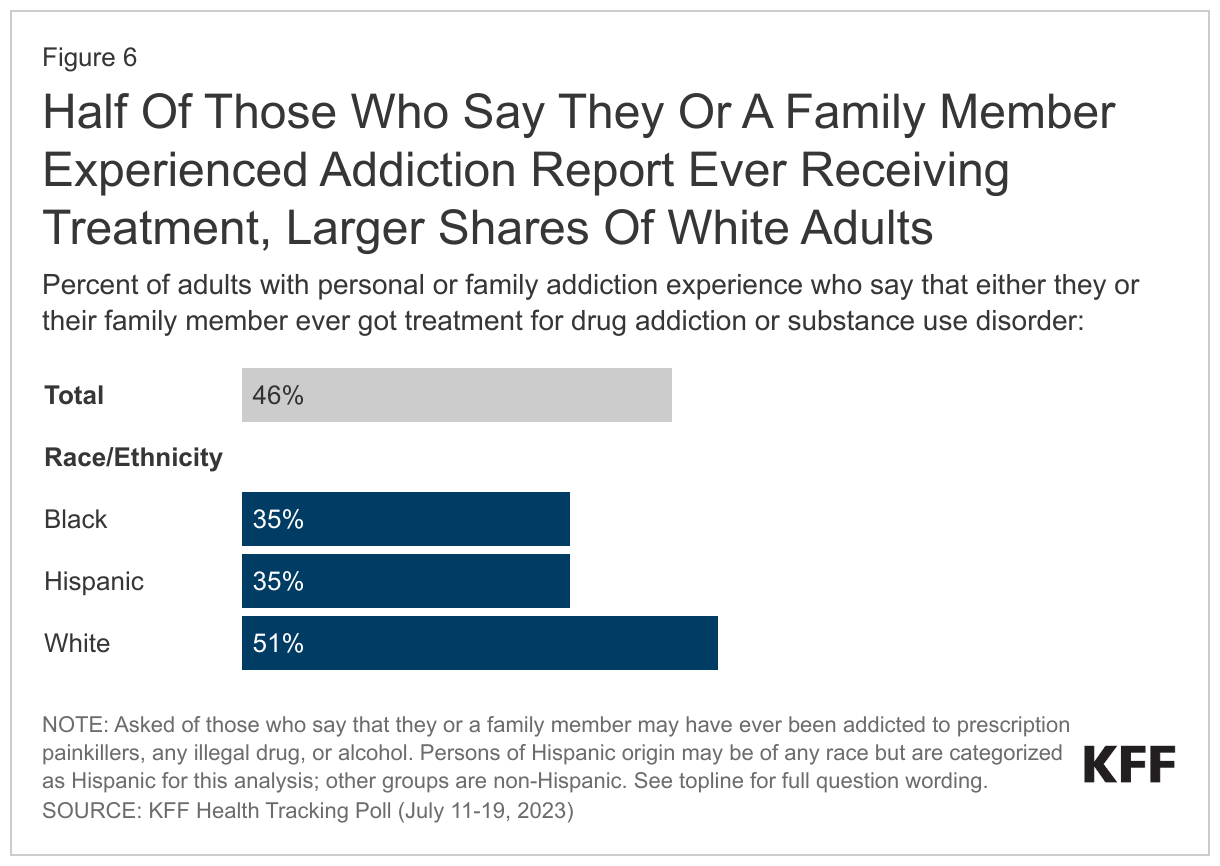
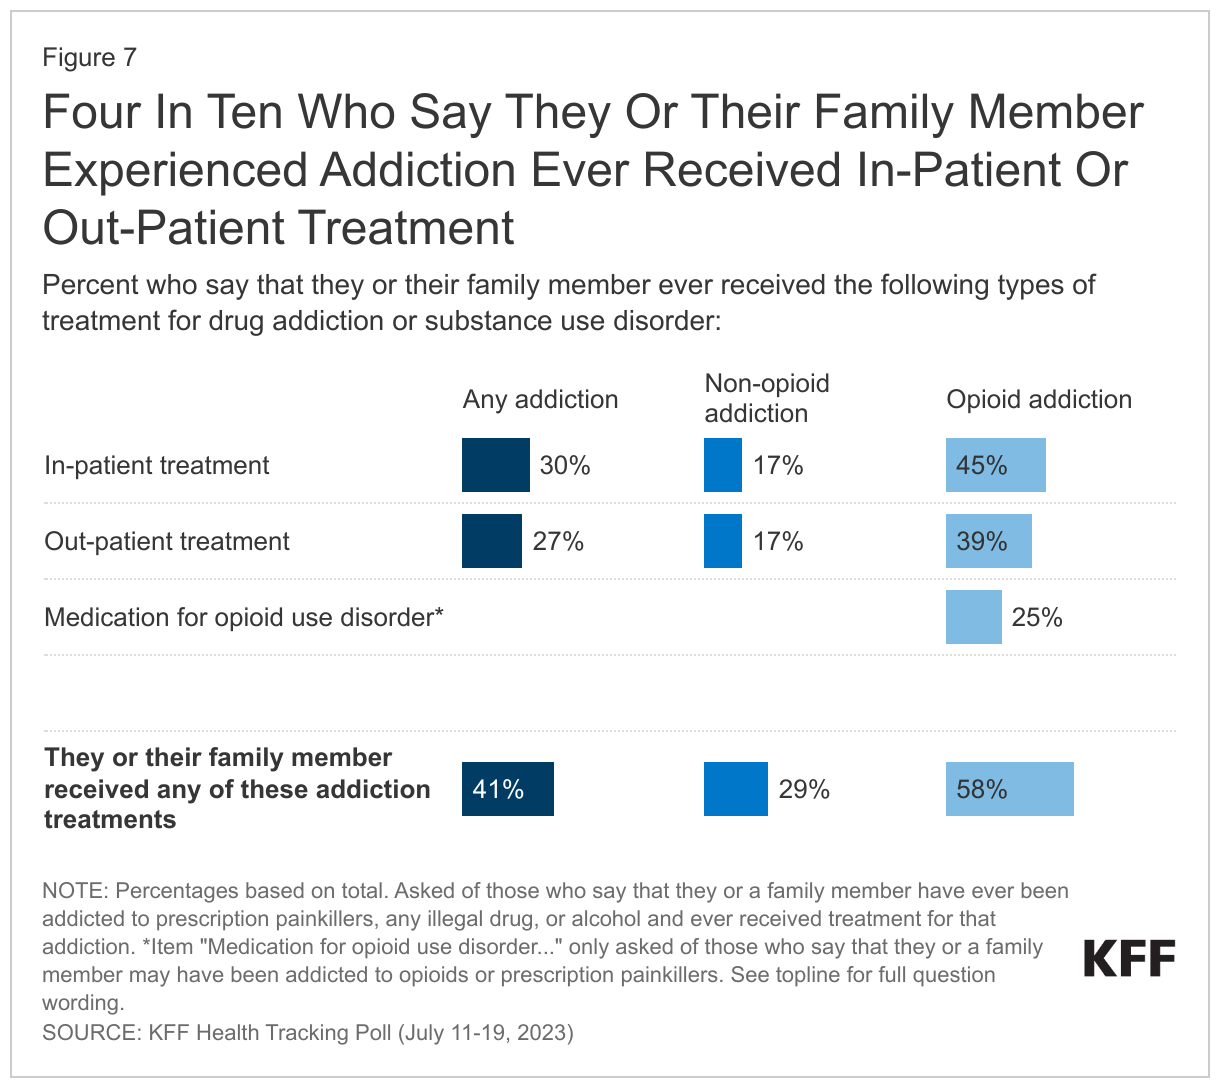
- Among those who say they or a family member experienced addiction to prescription painkillers, alcohol, or any illegal drug, less than half (46%) report they or their family member got treatment for the addiction. The share is larger among White adults (51%), compared to Black adults (35%) and Hispanic adults (35%). Three in ten (29%) of those who report a personal or family issue with addiction report receiving in-patient treatment, and a quarter (26%) say they received out-patient treatment. A quarter (25%) of those who say they or a family member experienced opioid addiction, or 7% of all adults, say they or their family member were treated using medication for opioid use disorder such as buprenorphine or methadone.
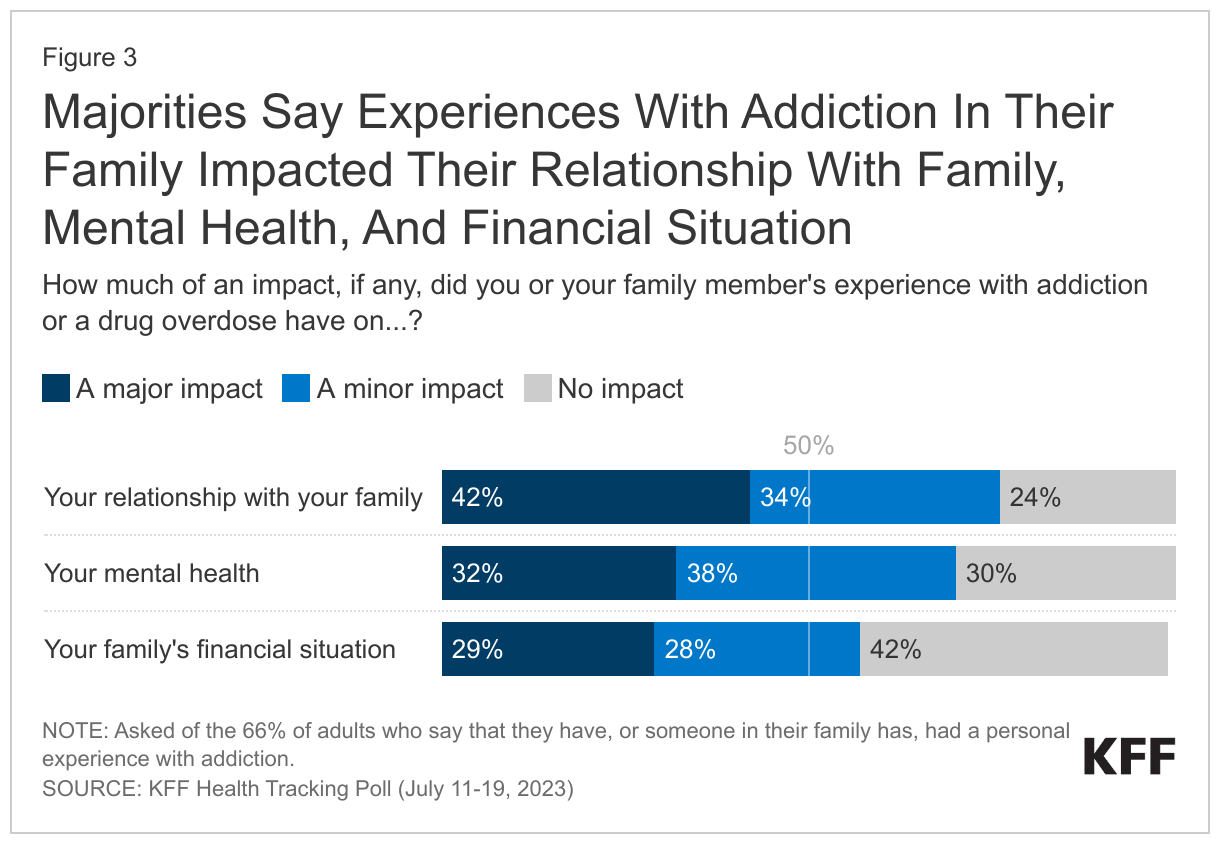
- Among the two-thirds who say they or a family member experienced addiction, three-quarters (76%), or 50% of all adults, say it had at least a minor impact on their relationship with their family. Most also say it impacted their mental health or their family’s financial situation. Substantial shares say these were “major” impacts, with about three in ten adults who say so when asked about their mental health (32%) and their family’s financial situation (29%) and about four in ten (42%) when asked about familial relationships.
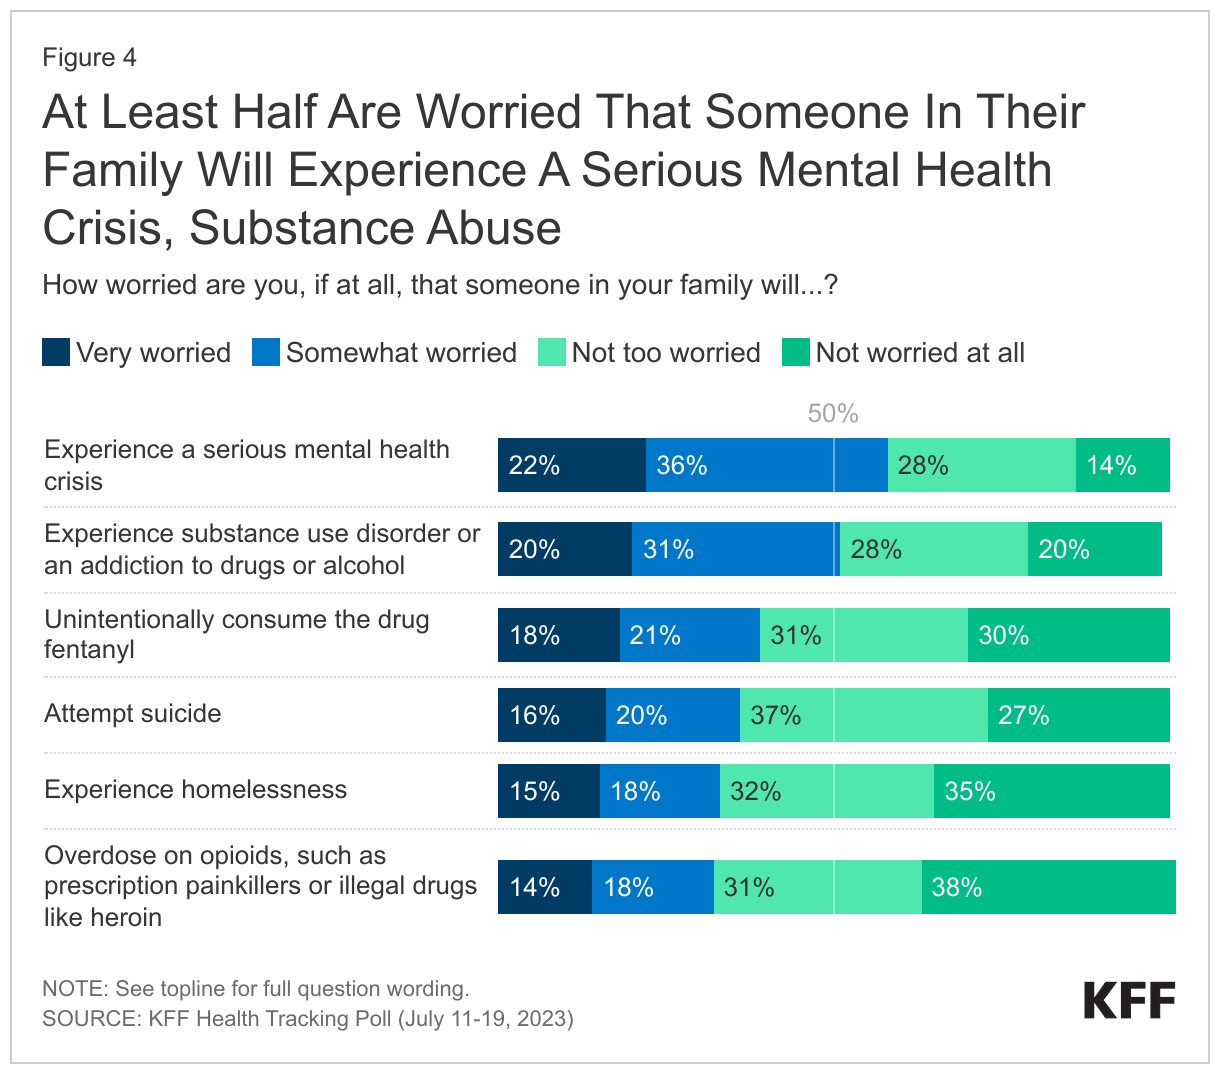
- Beyond direct experience with addiction, the poll finds many adults in the U.S. are worried about substance use. For example, half (51%) of adults are worried that someone in their family will experience substance use disorder or an addiction to drugs or alcohol and one-third (32%) are worried that someone in their family will overdose on opioids, such as prescription painkillers or illegal drugs like heroin. About four in ten adults are worried that someone in their family will unintentionally consume the drug fentanyl (39%), and these concerns loom large in rural areas. About half (48%) of those who live in rural areas compared to around four in ten of those in urban (39%) or suburban (37%) areas say they are worried that someone in their family will unintentionally consume the drug.
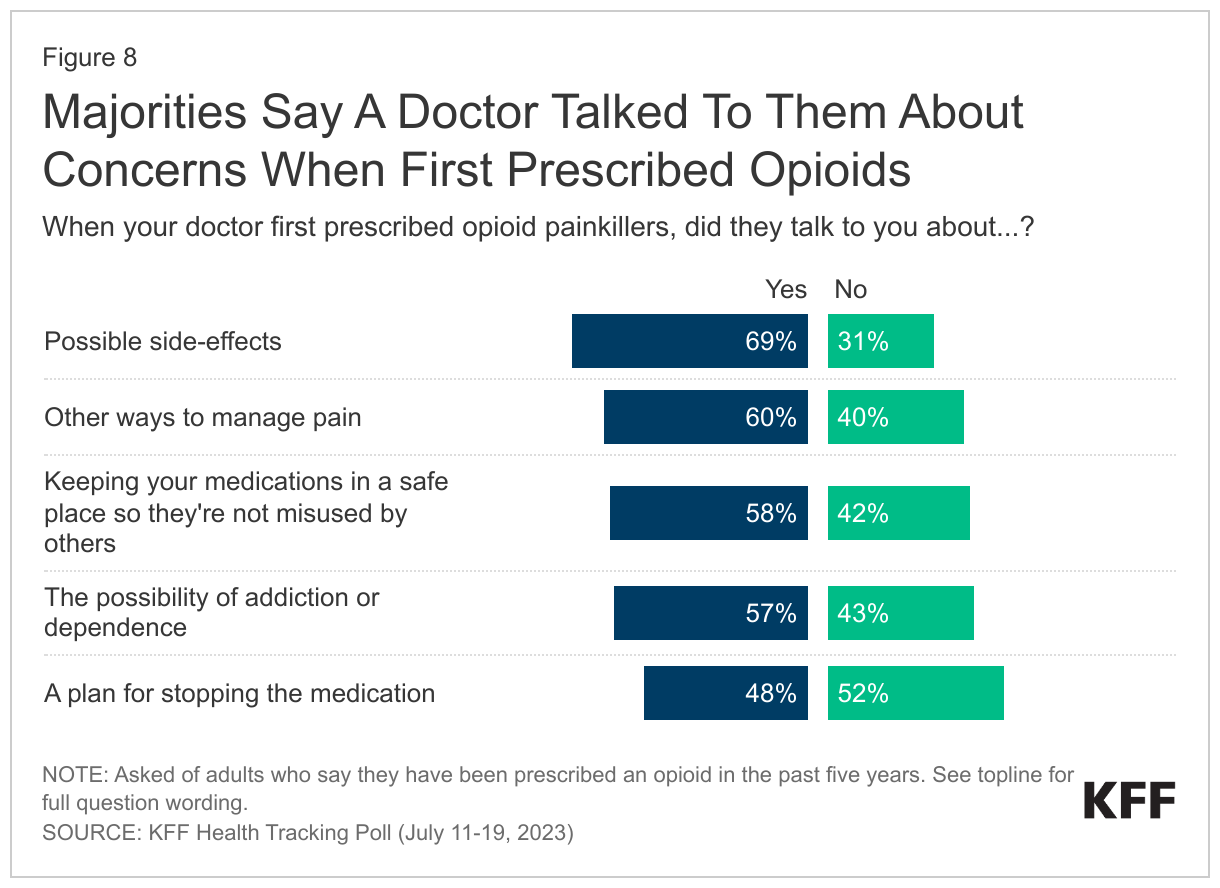
- Recent years have brought an increase in awareness of the dangers of opioid addiction and most of those who have been prescribed an opioid painkiller in the past five years (29% of all adults) say their doctor has spoken to them about the various dangers and considerations when taking this class of drugs. This includes their doctor talking to them about possible side-effects (69%), other ways to manage their pain (60%), keeping their medications in a safe place (58%), or the possibility of dependence (57%).
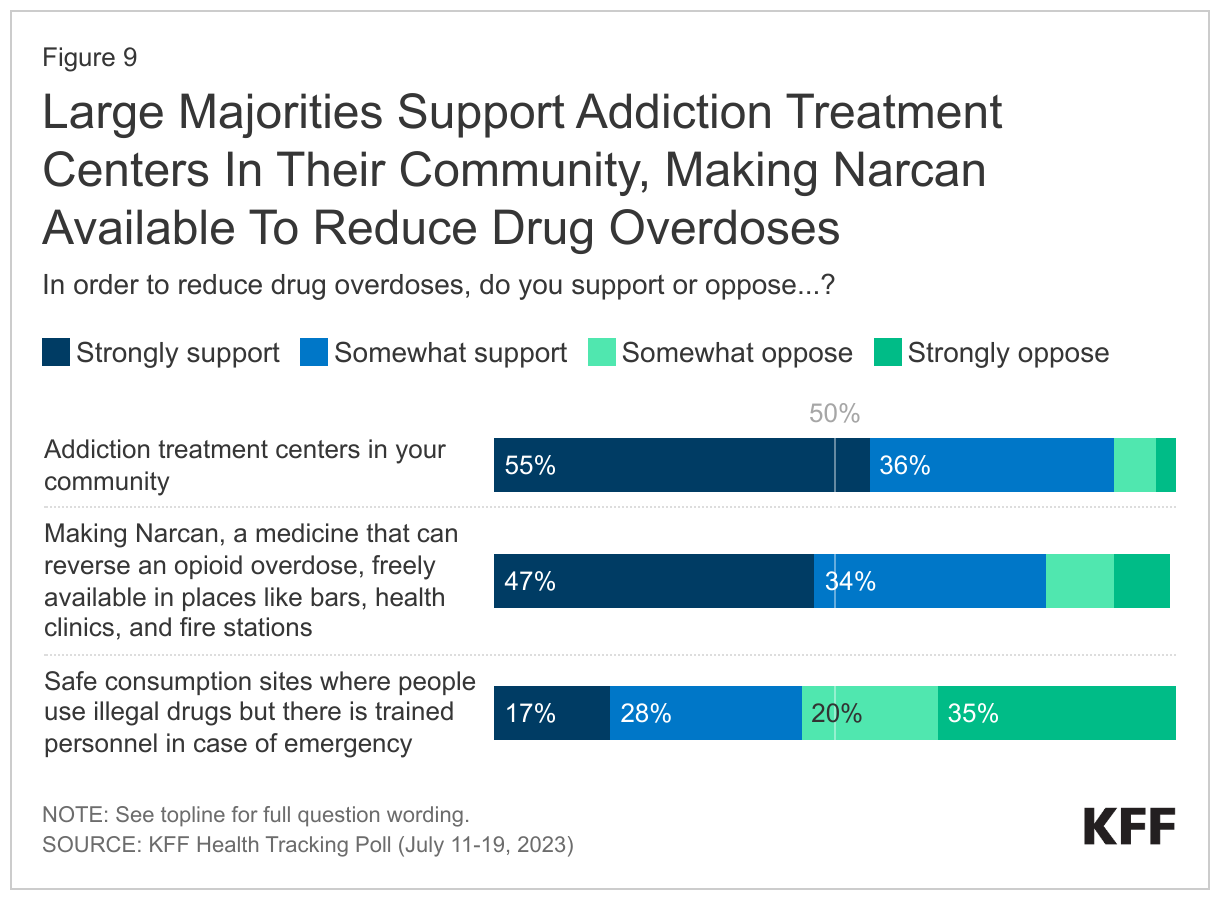
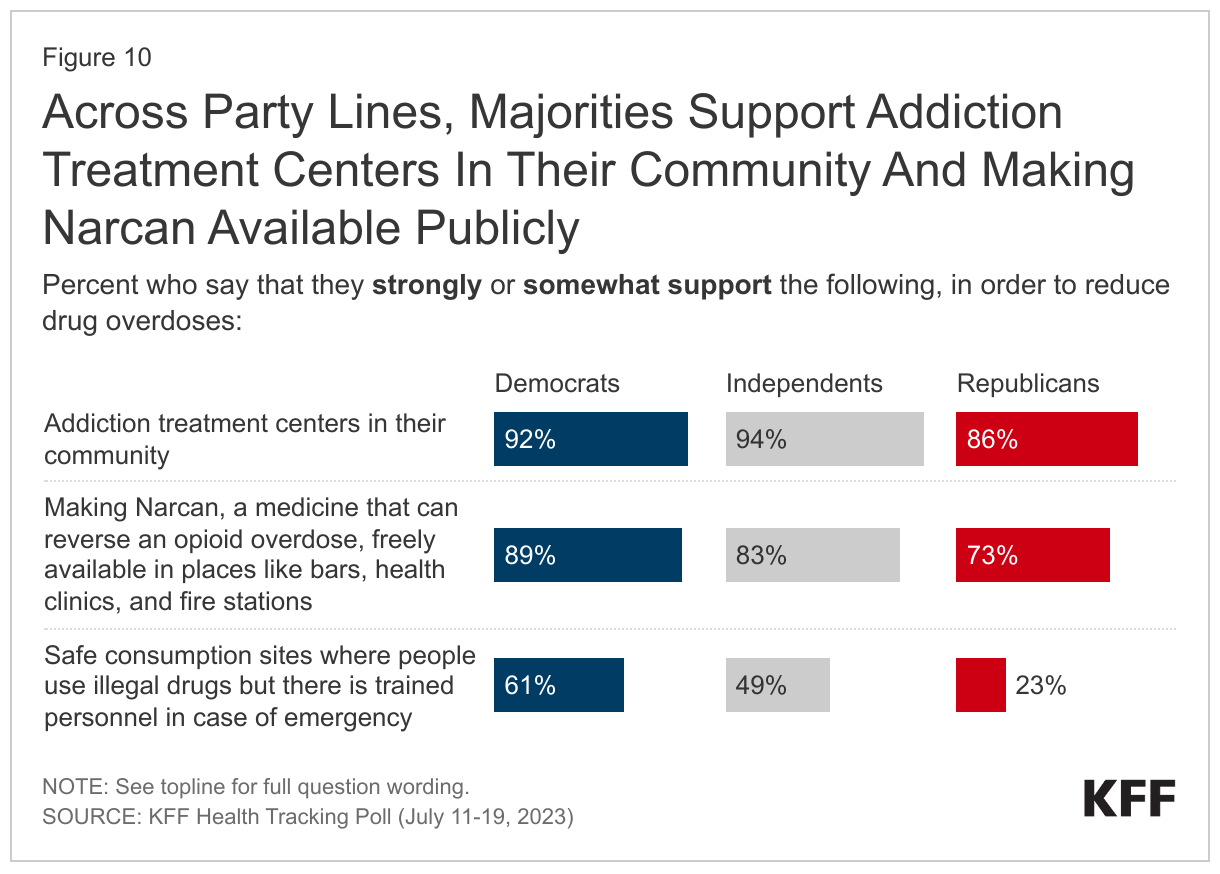
- When asked about several policies aimed at reducing drug overdoses, a majority support addiction treatment centers in their community (90%) or making Narcan, a medicine that can reverse an opioid overdose, freely available in places likes bars, health clinics, and fire stations (82%) – including about half who “strongly support” either policy. Fewer, but still nearly half (45%), support safe consumption sites, places where people can use illegal drugs with trained personnel in case of emergency. Majorities across partisan identification support addiction centers in their community and making Narcan publicly available, with at least three-quarters of Democrats, Republicans, and independents who support the policies. However, Republicans are less likely to support safe consumption sites, with a quarter of Republicans who say so compared to six in ten (61%) Democrats and half (49%) of independents.
The Substance Use Crisis In The U.S.
Substance use disorder and addiction issues surged during the COVID-19 pandemic, coming after more than a decade of increased use of alcohol and an opioid crisis that has been labeled by public health officials as “an epidemic.” The latest KFF Health Tracking Poll explores the public’s concern and experiences with alcohol and drug addiction and its consequences, as well as access to treatment and ways to prevent opioid use disorder (OUD) and overdoses.
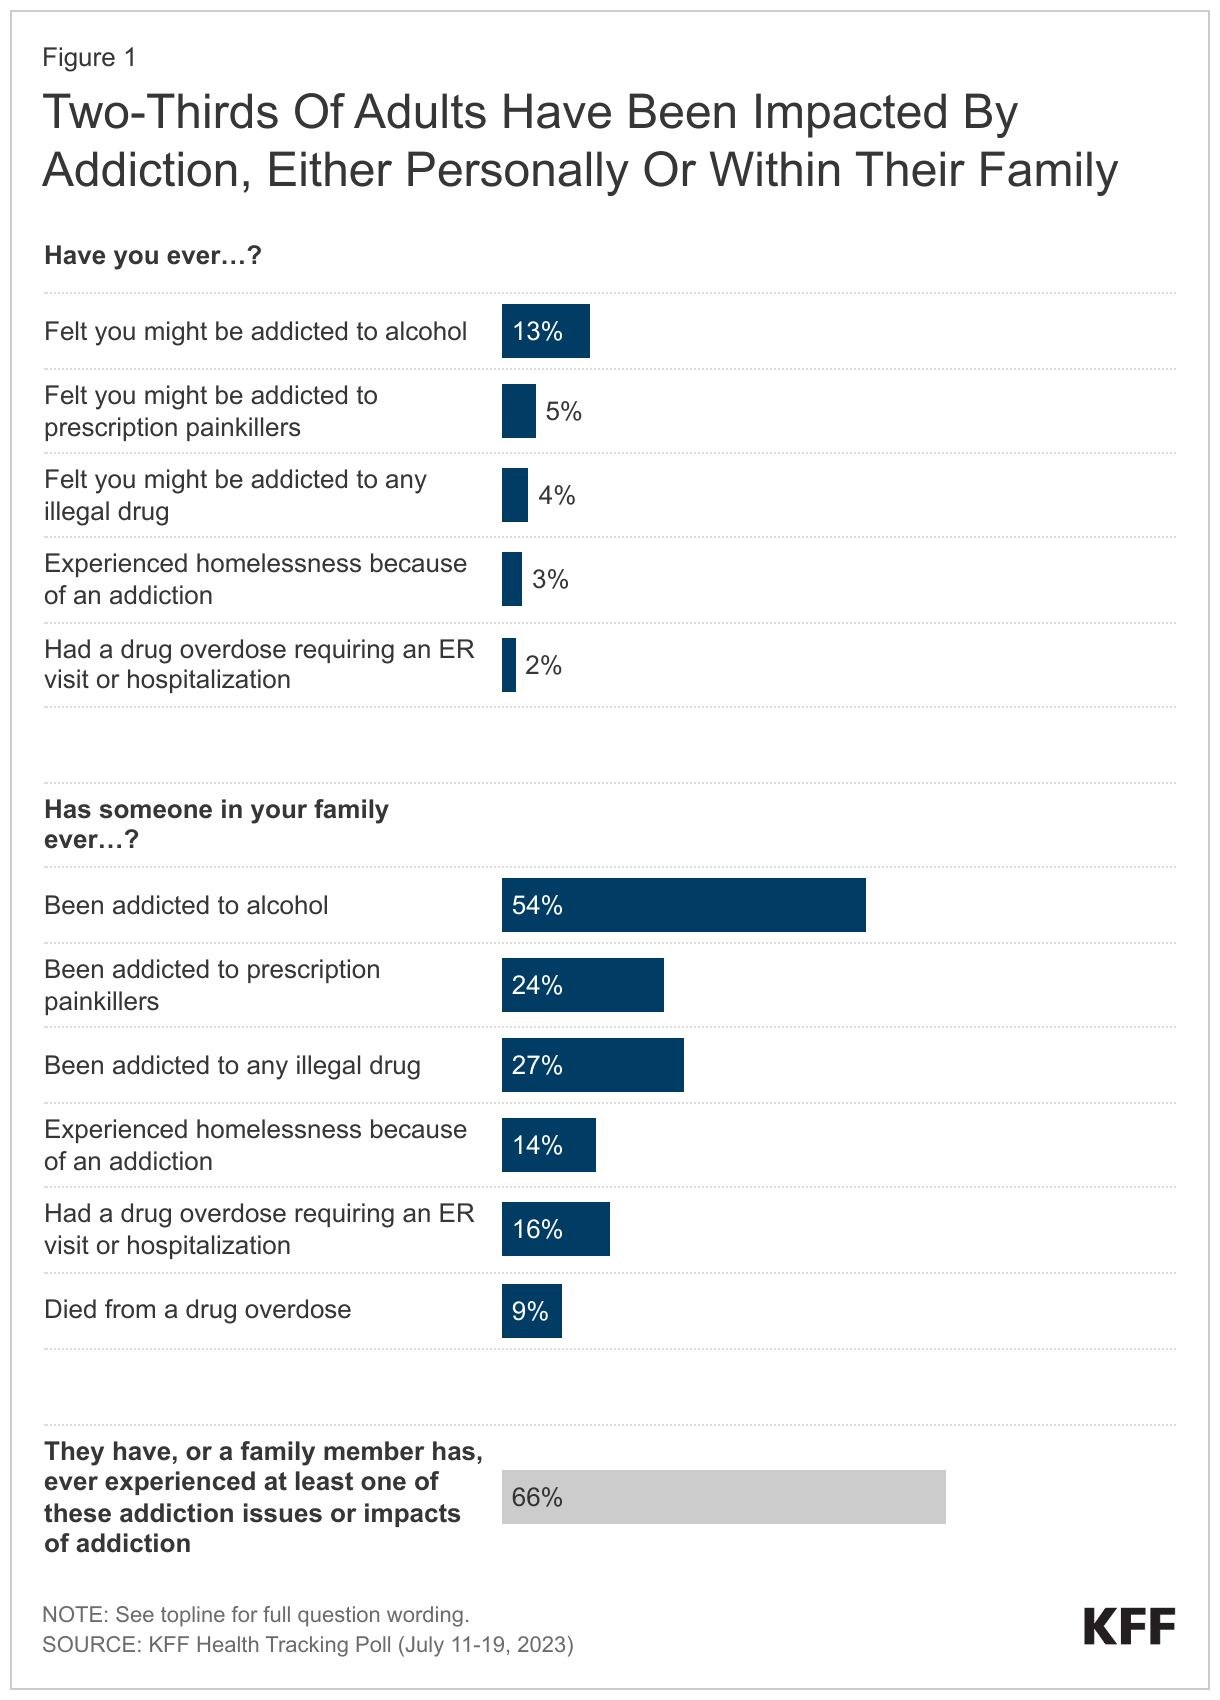
Most adults in the U.S. report being affected by the addiction crisis facing the country. Two-thirds of adults say they have either personally felt they were addicted or had a family member who was addicted to alcohol or drugs. This includes being addicted to prescription painkillers, illegal drugs, or alcohol, having an overdose that required hospitalization, experiencing homelessness due to addiction, or having a family member who died from a drug overdose.
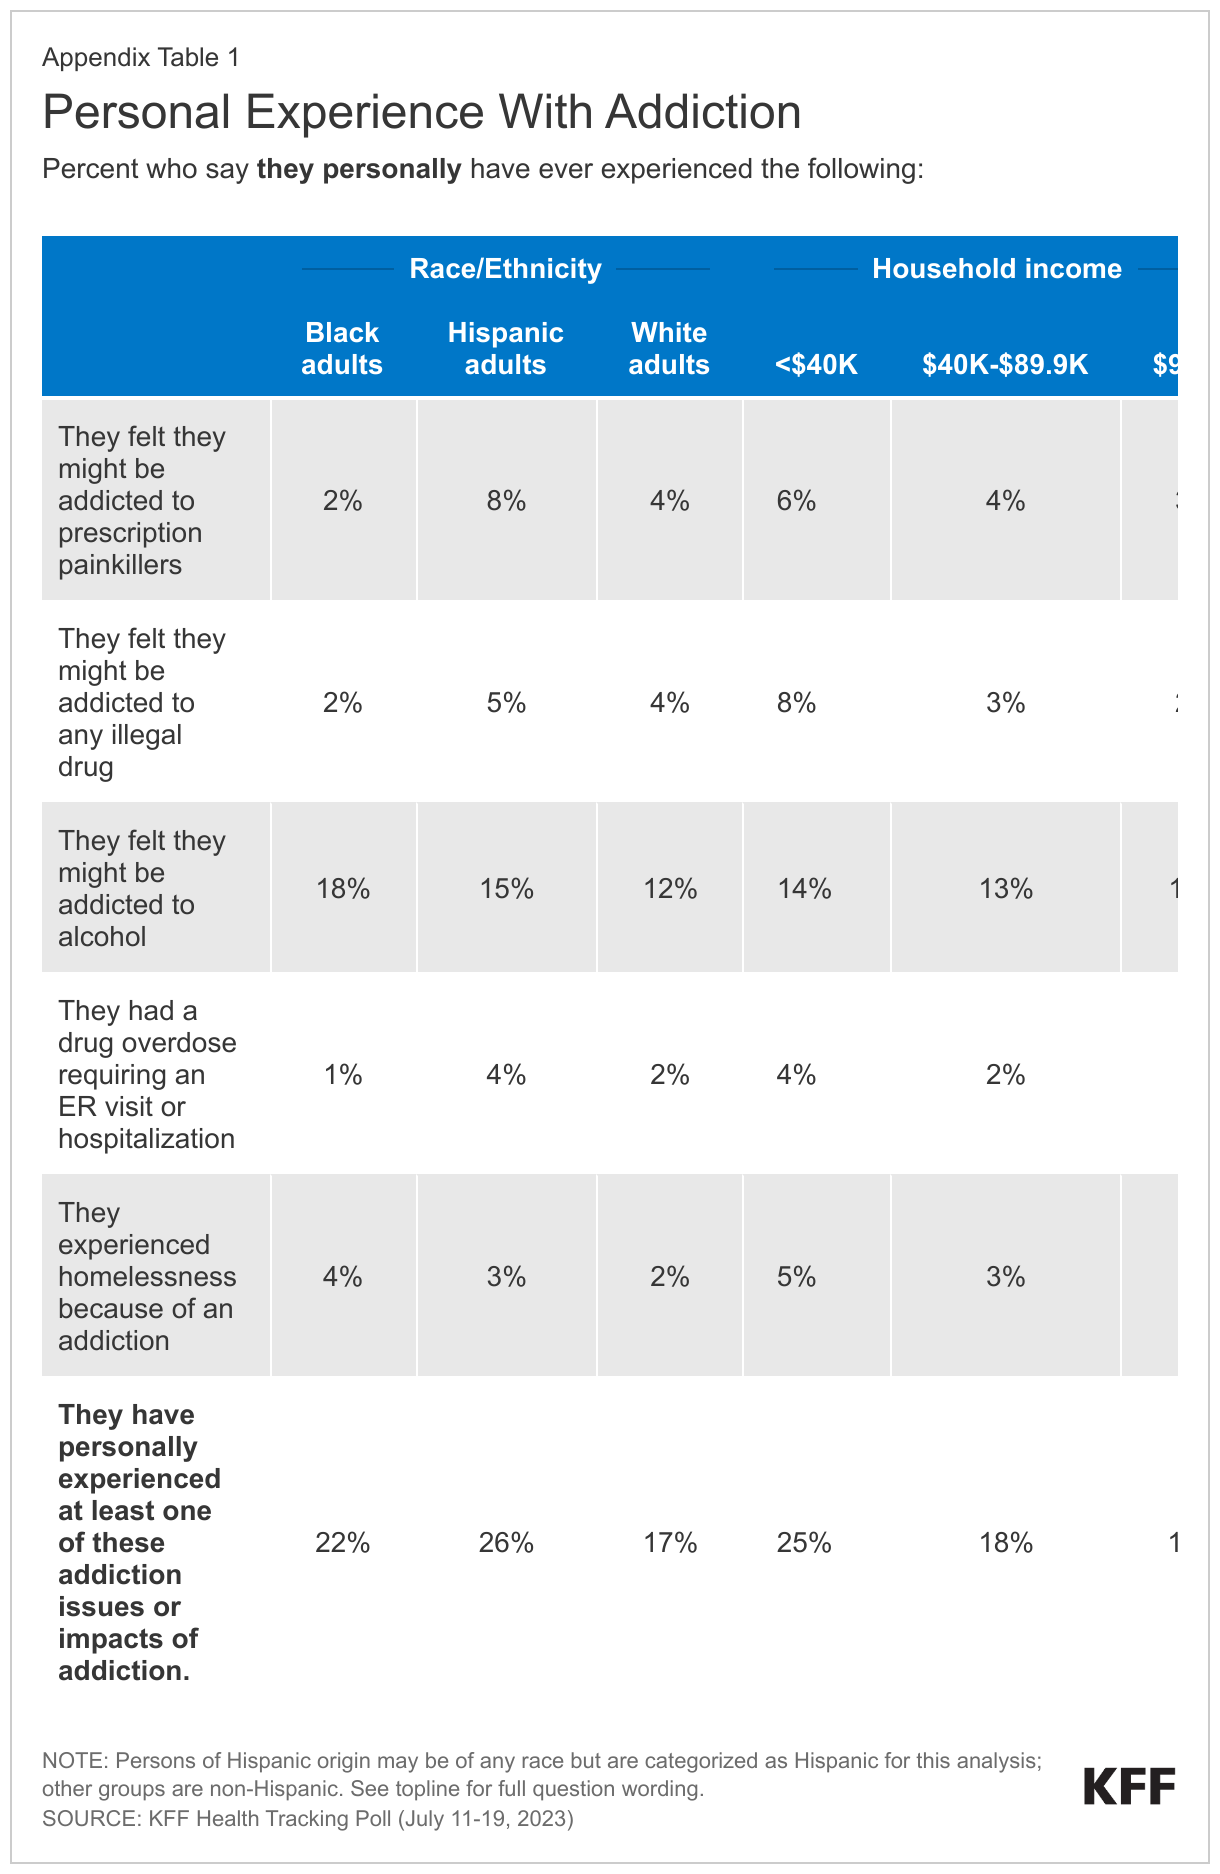
About one in eight (13%) say they have ever felt they might have been addicted to alcohol, while smaller shares say they felt they might have been addicted to prescription painkillers (5%), or illegal drugs, such as heroin, fentanyl, methamphetamine, or cocaine (4%). Small but notable shares say they have experienced homelessness because of an addiction (3%) or had a drug overdose that required an emergency room visit or hospitalization (2%).
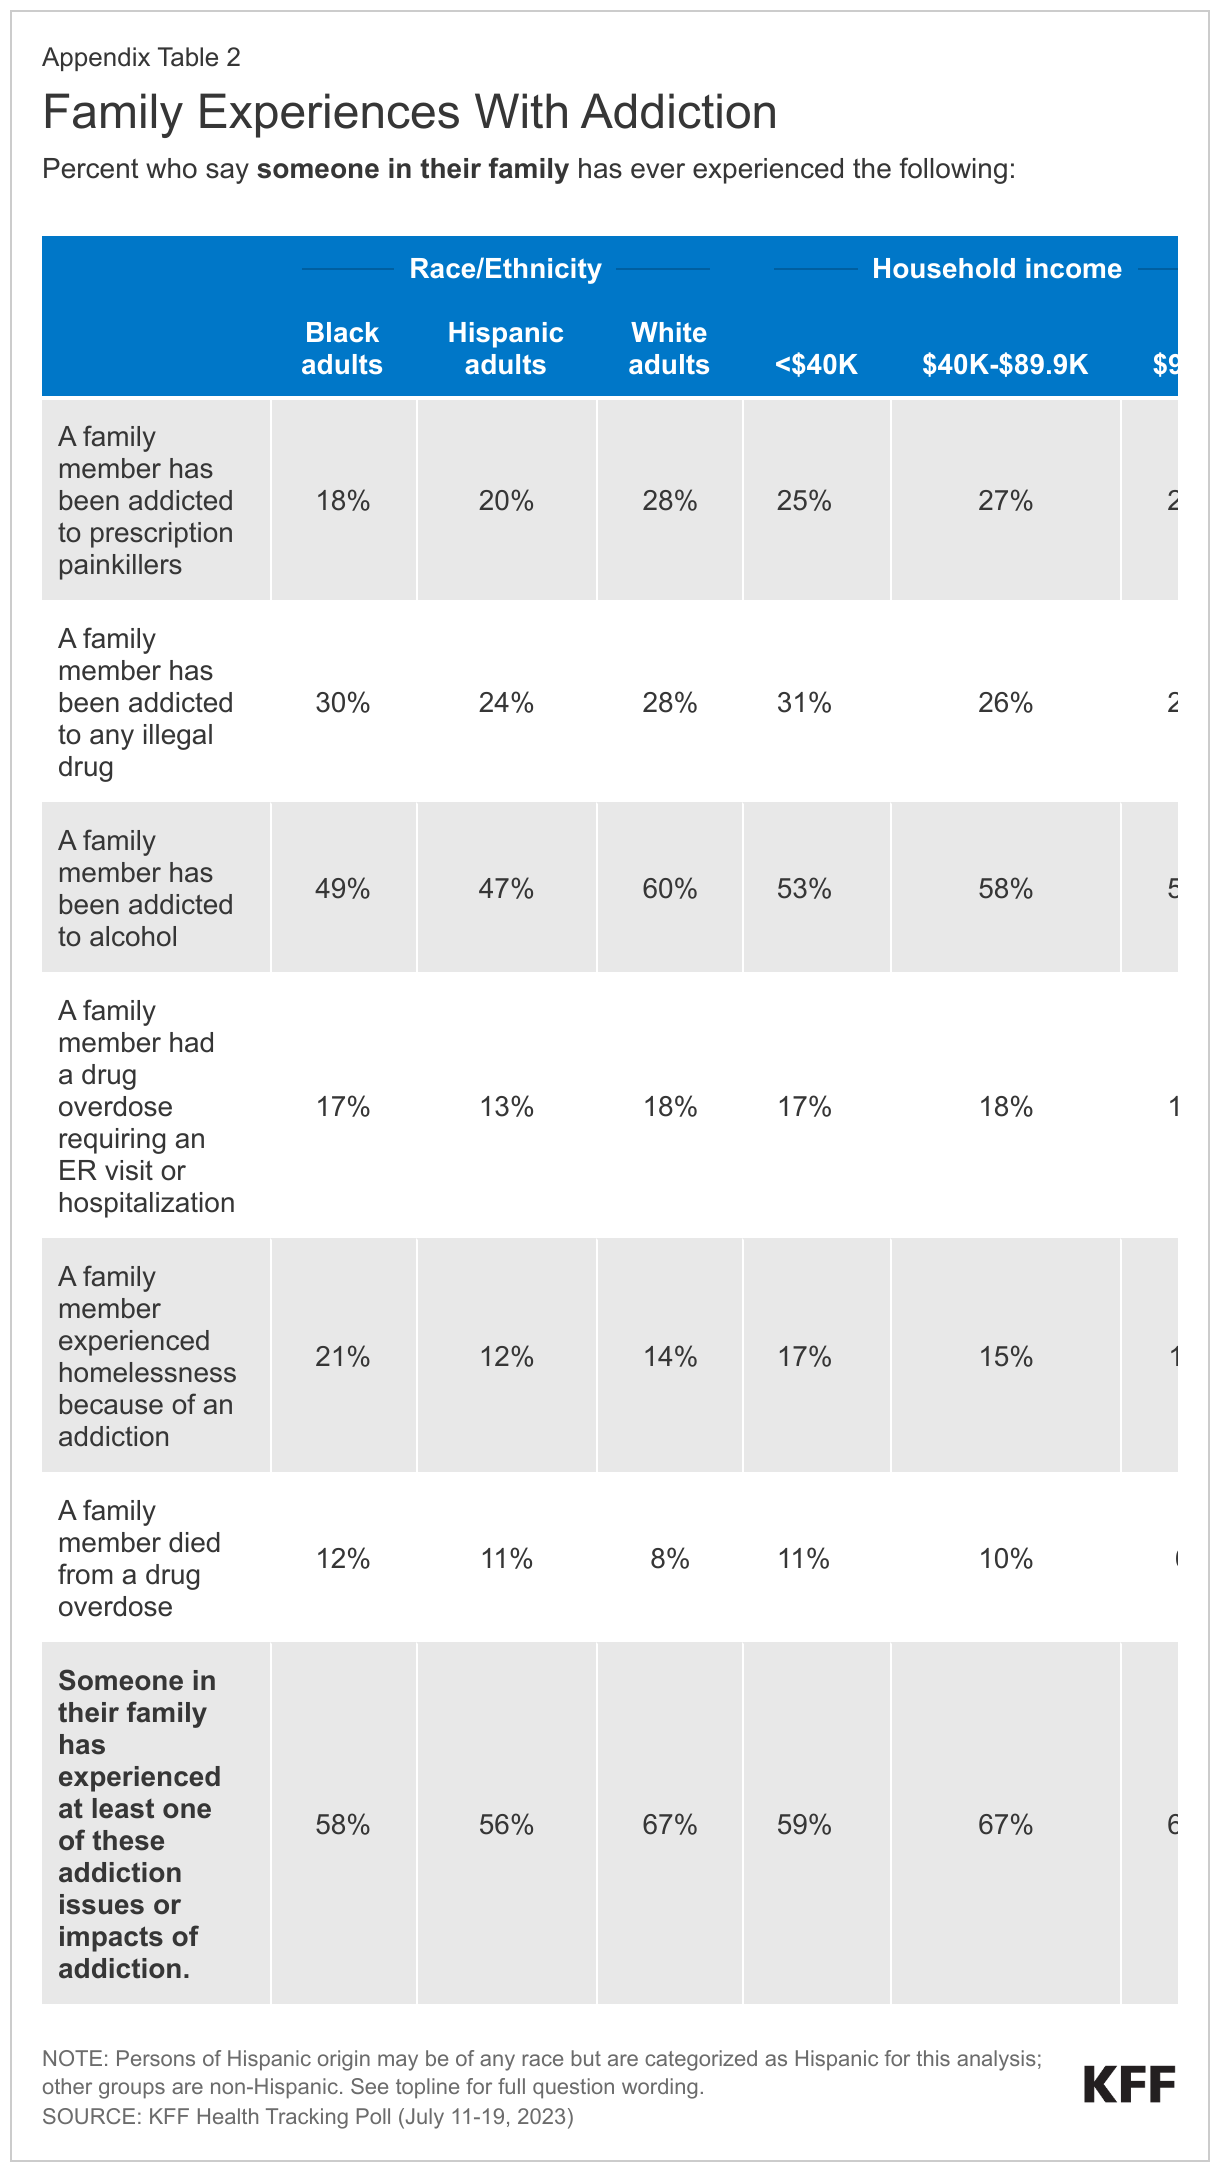
When asked about their family members, more than half of adults (54%) say someone in their family has ever been addicted to alcohol, while about a quarter say someone in their family has been addicted to any illegal drug (27%) or has been addicted to prescription painkillers (24%). One in six say someone in their family has had a drug overdose requiring an ER visit or hospitalization (16%), and one in seven say a family member has experienced homelessness because of an addiction (14%). About one in ten (9%) adults report that someone in their family has died from a drug overdose.
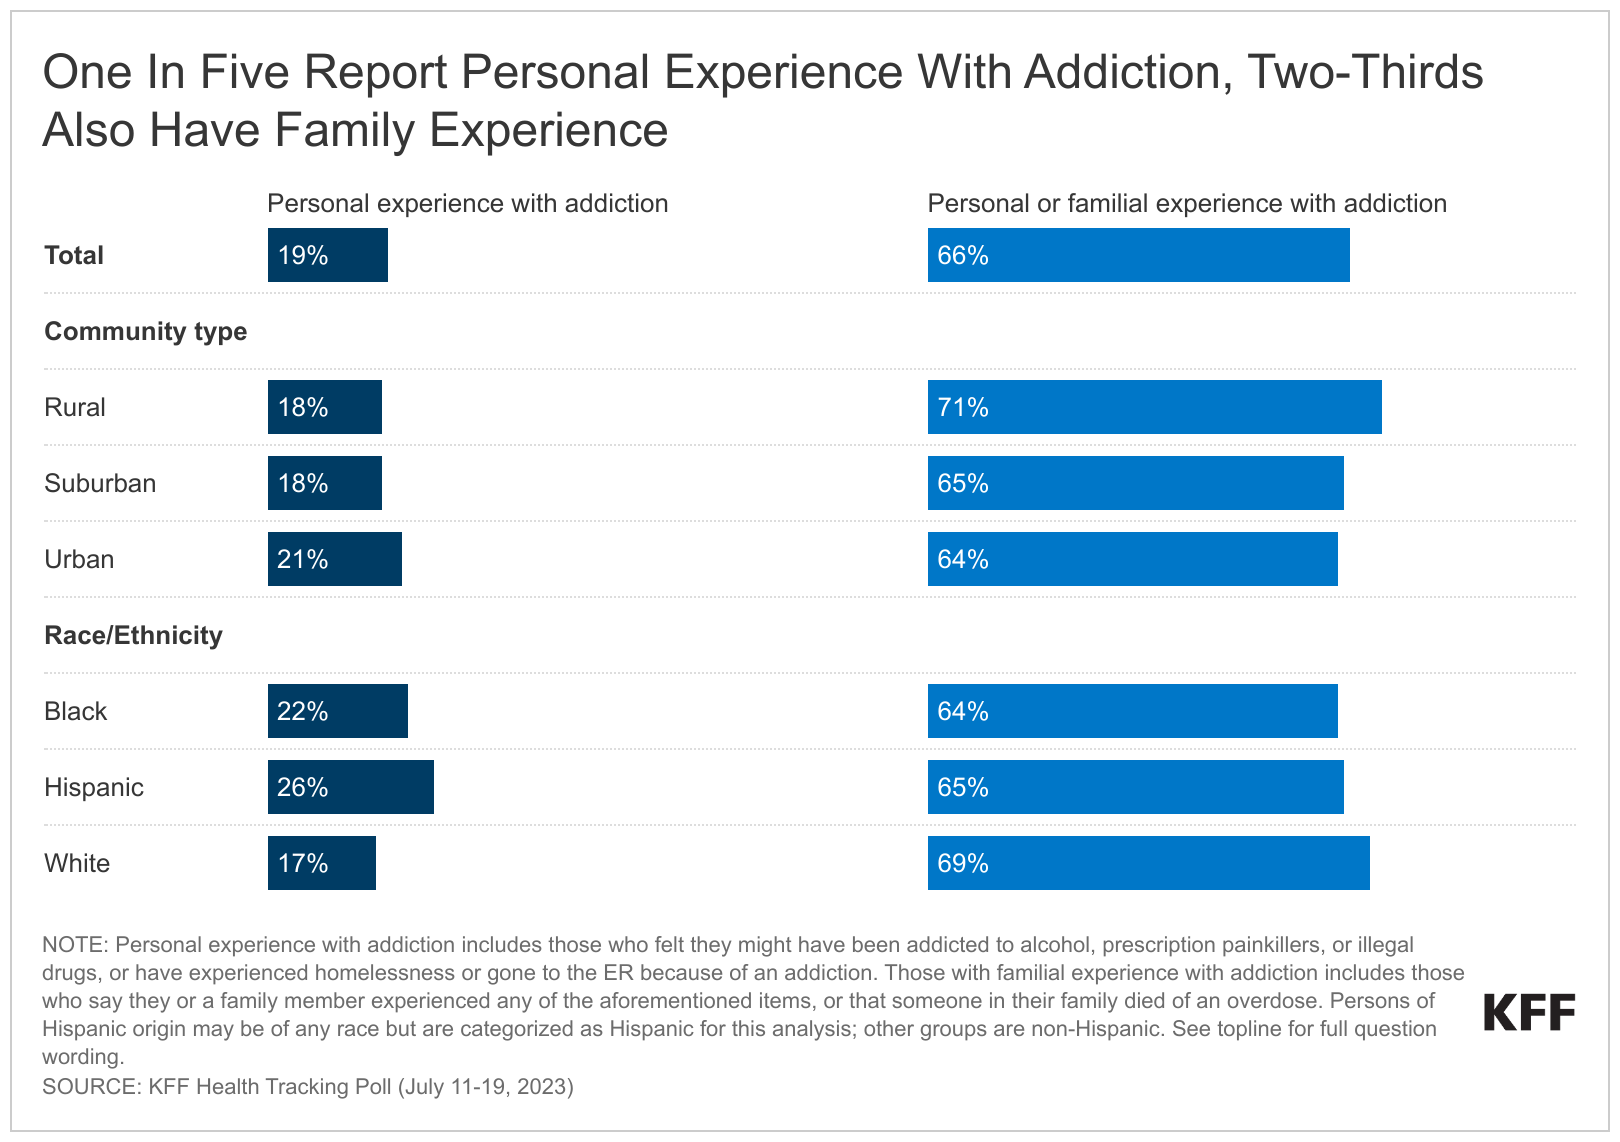
Experiences with addiction and overdose are widespread, with large shares across income groups, education, race and ethnicity, age, and urbanicity all reporting some experience, though some groups report higher incidence than others. Overall, one in five adults (19%) say they have personally been addicted to drugs or alcohol, had a drug overdose requiring an ER visit or hospitalization, or experienced homelessness because of an addiction.1 The share increases to a quarter (25%) among adults with a household income of under $40,000 a year, compared to almost one in five (18%) of those with an income between $40,000 and $90,000, and one in six (16%) of those with a household income of $90,000 or more annually.
Additionally, White adults are more likely than Black adults and Hispanic adults to say someone in their family has ever experienced addiction or overdose (67% compared to 58% and 56%, respectively). This gap is mostly driven by addiction to alcohol and prescription painkillers. Six in ten White adults (60%) report someone in their family has ever been addicted to alcohol compared to half of Black adults (49%) and Hispanic adults (47%), and nearly three in ten White adults (28%) say someone in their family has been addicted to prescription painkillers compared to two in ten Black adults (18%) and Hispanic adults (20%). Appendix Figures 1 and 2 show personal and familial addiction incidence by racial and ethnic groups as well as income. These racial and ethnicity differences are consistent with KFF analysis finding substance use disorder more common among White adults.
Opioid addiction
Three in ten (29%) say they or someone in their family have been addicted to opioids, including prescription painkillers or illegal opioids such as heroin or fentanyl. The share of adults who say they or a family member have been addicted to opioids increases to four in ten (42%) adults who live in rural areas, a larger share than those in suburban (30%) and urban (23%) areas. Similar to the racial differences reported above, a third of White adults (33%) say they or a family member have been addicted to opioids, a larger share compared to Black adults (23%), with the share of Hispanic adults in between (28%). The slightly larger share of White adults who report experiences with opioid addiction is consistent with KFF analysis,2 yet recent data shows a spike in opioid deaths among people of color.
The Impact of addiction on Families
Among the two-thirds who say they or a family member experienced addiction, three-quarters (76%), or 50% of all adults, say it had at least a minor impact on their relationship with their family. Most also say it impacted their mental health (70%, or 46% of all adults), or their family’s financial situation (57%, or 38% of all adults). Substantial shares say these were “major” impacts, with about three in ten adults who say so when asked about their mental health (32%) and their family’s financial situation (29%), and about four in ten (42%) when asked about familial relationships.
The impact of addiction isn’t just driven by personal addiction. A quarter (27%) of those who have had a family member suffer from addiction, but have not personally experienced addiction themselves, say their mental health was majorly impacted as a result.
Overall, half (51%) of adults are worried that someone in their family will experience substance use disorder or an addiction to drugs or alcohol. Another four in ten are worried that someone in their family will unintentionally consume the drug fentanyl (39%), while a third (32%) are worried that someone in their family will overdose on opioids, such as prescription painkillers or illegal drugs like heroin.
Concerns about unintentionally consuming the drug fentanyl3 looms large in rural areas. About half (48%) of those who live in rural areas compared to around four in ten of those in urban (39%) or suburban (37%) areas say they are worried that someone in their family will unintentionally consume the drug.
MENTAL HEALTH AND SUBSTANCE USE
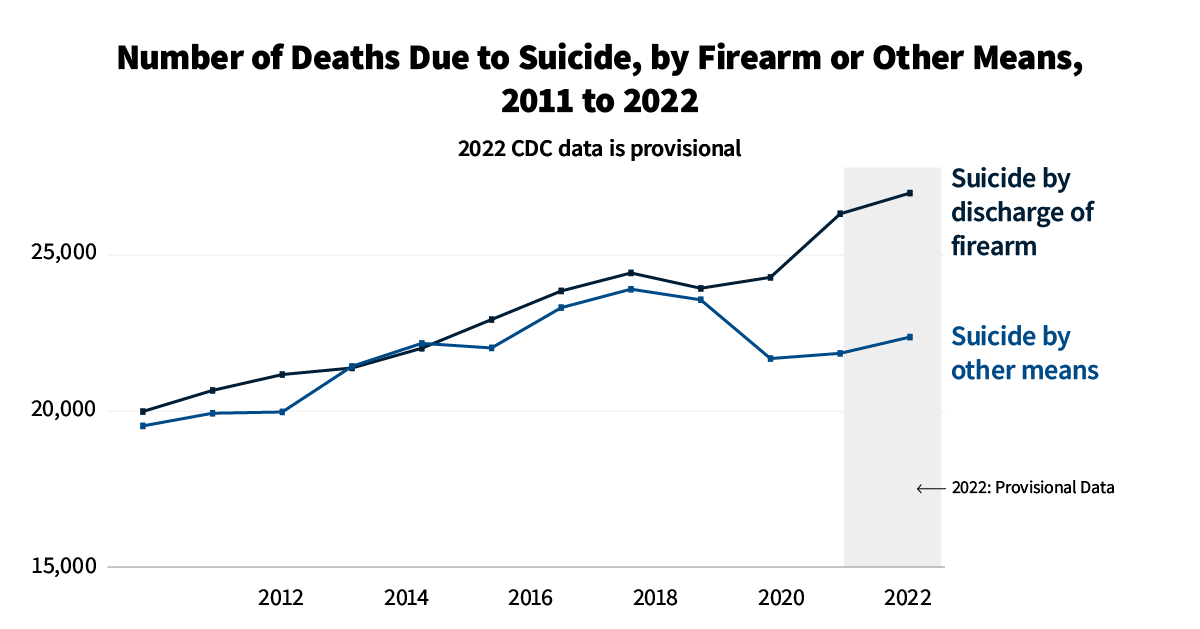
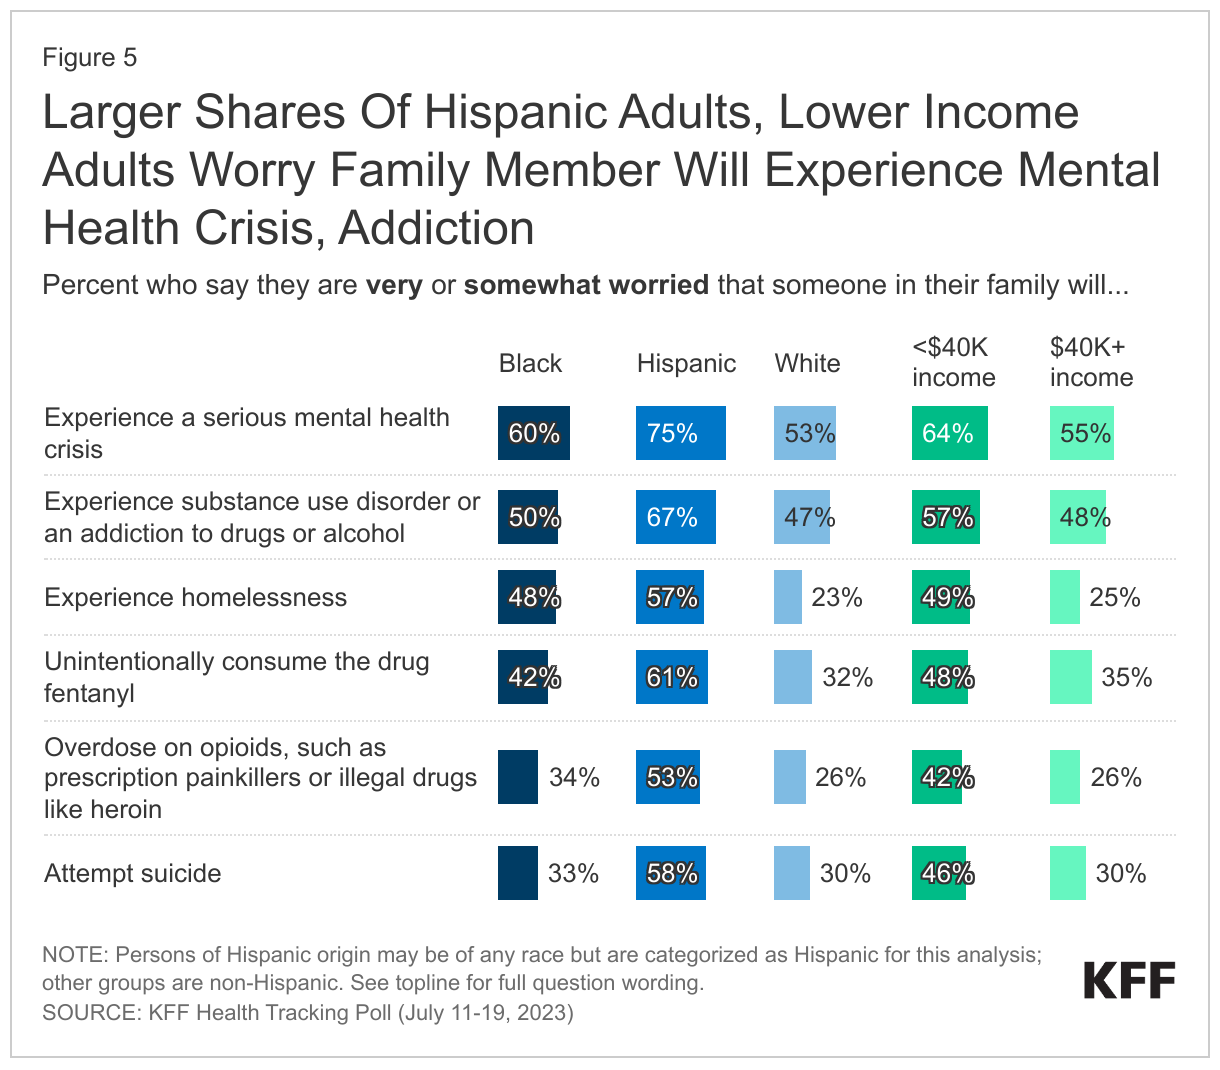
In addition to the substance use crisis, adults in the U.S. remain concerned about mental health issues for someone in their family, with new KFF analysis showing suicides at record levels. Significant shares of adults are worried about mental health issues for their families, with 58% who are “very” or “somewhat worried” that someone in their family will experience a serious mental health crisis, and a third who are worried someone in their family will attempt suicide (36%) or experience homelessness (33%). Three-quarters of Hispanic adults (75%), compared to six in ten Black adults (60%) and half of White adults (53%), say they are personally worried about someone in their family experiencing a serious mental health crisis.
Lower income populations are more likely to say they’re worried than those with higher household incomes about a family member experiencing any of the aforementioned concerns, including half (49%) of those with incomes of less than $40,000 a year who say they are worried someone in their family may experience homelessness, compared to one in four (25%) of those with incomes of more than $40,000 annually who say the same.
Treatment for Substance Use and Addiction
More than fifty years after the U.S. declared a war on drugs, evidence-based research has suggested that treatment rather than punishment may be the most impactful in addressing addiction, though White adults are more likely to report that they or their family member received treatment compared to Black adults and Hispanic adults.
Slightly less than half (46%) of those who say they or a family member experienced any addiction say the individual ever got treatment for drug addiction or substance use disorder (29% of all adults).4 White adults (51%) are more likely than Black adults (35%) and Hispanic adults (35%) to report that they or their family member received treatment for addiction or substance use disorder. The potential racial and ethnic disparities in accessing treatment, as have been highlighted by past research, may be exacerbated by the changing nature of the opioid epidemic with increasing prevalence among communities of color.
Among those who say they or someone in their family experienced addiction to prescription painkillers, illegal drugs, or alcohol, three in ten (29%) said they received in-patient treatment, and a quarter (26%) received out-patient treatment.
A quarter (25%) of those who say they or a family member experienced opioid addiction say they or their family member were treated using medication for opioid use disorder such as buprenorphine or methadone. Despite the rise in opioid deaths, KFF analysis still finds that buprenorphine is being under prescribed for patients, especially Black patients.5
Reasons for not getting treatment
Those who say they or their family member experienced addiction and didn’t receive treatment cite a variety of reasons, including not wanting help or refusing help, overcoming or stopping their addiction on their own, denial that they have an addiction, the cost or affordability associated with care, the shame or stigma, or even that a family member died before they could get help.
In Their Own Words: What is the main reason why you or your family member did not get treatment?
“We are not raised that way.” – 22 year-old Black woman, Georgia
“Brother quit on his on and been sober for 2 years, my dad was addicted to cocaine quit on his own.” – 37 year-old Hispanic man, Texas
“Lack of funding, no insurance coverage- turned away for treatment.” – 50 year-old White woman, South Carolina
“He said he could get better on his own. It hasn’t happened yet.” – 28 year-old American Indian/Alaskan Native woman, Oklahoma
“They passed away before they could.” – 30 year-old White woman, Texas
“Because I was able to quit all on my own. I was just tired of being tired and losing all respect within my family, especially my daughter. It was a long road but I have been clean for 30 years and enjoying everyday of my life, with my daughter.” – 70 year-old, multiracial woman, Arizona
“Affordability and family member didn’t have health insurance.” – 31 year-old multiracial woman, Florida
Understanding the Dangers of Prescription Opioid Use
Though the opioid epidemic has shifted, doctors continue patient education about the risks of prescription opioids. In the past decade, many have examined the role of doctors in the opioid epidemic, including an American Medical Association task force formed in 2014 charged in part with reforming physician practices. Among adults (29% of total) who have been prescribed an opioid painkiller in the past five years, majorities say their doctor talked to them about the possible ramifications of the drugs. About seven in ten (69%) say their doctor talked to them about possible side-effects of the opioid painkillers when they were first prescribed. Around six in ten (60%) say they were talked to about other ways to manage their pain, say their doctors talked to them about keeping their medications in a safe place so they weren’t misused by others (58%), or say their doctors talked to them about the possibility of addiction or dependence (57%). About half (48%) of those who have been prescribed opioids in the past five years say their doctor talked to them about a plan for stopping the medication, while the other half say they did not.
Policies Aimed at Reducing Drug Overdoses
When asked about several policies aimed at reducing drug overdoses, large majorities support addiction treatment centers in their community (90%) and making Narcan, a medicine that can reverse an opioid overdose, freely available in places likes bars, health clinics, and fire stations (82%) – including about half who “strongly support” either policy. Fewer, but still nearly half (45%), support safe consumption sites, places where people can use illegal drugs with trained personnel in case of emergency.
Large majorities across partisanship support addiction centers and Narcan availability. Nine in ten (92%) Democrats and independents (94%) support addiction treatment centers in their community, as do 86% of Republicans. Another nine in ten (89%) Democrats and eight in ten (83%) independents support making Narcan available publicly, compared to three-quarters (73%) of Republicans.
Partisan differences are larger when it comes to safe consumption sites. About a fourth of Republicans (23%) support places for people to use illicit drugs where there are trained personnel in case of emergency, compared to six in ten (61%) Democrats and half (49%) of independents.
Methodology
This KFF Health Tracking Poll was designed and analyzed by public opinion researchers at KFF. The survey was conducted July 11-19, 2023, online and by telephone among a nationally representative sample of 1,327 U.S. adults in English (1,246) and in Spanish (81). The sample includes 1,043 adults reached through the SSRS Opinion Panel either online or over the phone (n=46 in Spanish). The SSRS Opinion Panel is a nationally representative probability-based panel where panel members are recruited randomly in one of two ways: (a) Through invitations mailed to respondents randomly sampled from an Address-Based Sample (ABS) provided by Marketing Systems Groups (MSG) through the U.S. Postal Service’s Computerized Delivery Sequence (CDS); (b) from a dual-frame random digit dial (RDD) sample provided by MSG. For the online panel component, invitations were sent to panel members by email followed by up to three reminder emails. 1,022 panel members completed the survey online and panel members who do not use the internet were reached by phone (21).
Another 284 (n=35 in Spanish) interviews were conducted from a random digit dial telephone sample of prepaid cell phone numbers obtained through MSG. Phone numbers used for the prepaid cell phone component were randomly generated from a cell phone sampling frame with disproportionate stratification aimed at reaching Hispanic and non-Hispanic Black respondents. Stratification was based on incidence of the race/ethnicity groups within each frame. Respondents in the phone samples received a $15 incentive via a check received by mail, and web respondents received a $5 electronic gift card incentive (some harder-to-reach groups received a $10 electronic gift card).
The online questionnaire included two questions designed to establish that respondents were paying attention. Cases that failed both attention check questions, those with over 30% item non-response, and cases with a length less than one quarter of the mean length by mode were flagged and reviewed. Cases were removed from the data if they failed two or more of these quality checks. Based on this criterion, no cases were removed.
The combined cell phone and panel samples were weighted to match the sample’s demographics to the national U.S. adult population using data from the Census Bureau’s 2022 Current Population Survey (CPS). Weighting parameters included sex, age, education, race/ethnicity, region, and education. The sample was weighted to match patterns of civic engagement from the September 2019 Volunteering and Civic Life Supplement data from the CPS and to match frequency of internet use from the National Public Opinion Reference Survey (NPORS) for Pew Research Center. Finally, the sample was weighted to match patterns of political party identification based on a parameter derived from recent ABS polls conducted by SSRS polls. The weights take into account differences in the probability of selection for each sample type (prepaid cell phone and panel). This includes adjustment for the sample design and geographic stratification of the cell phone sample, within household probability of selection, and the design of the panel-recruitment procedure.
The margin of sampling error including the design effect for the full sample is plus or minus 3 percentage points. Numbers of respondents and margins of sampling error for key subgroups are shown in the table below. For results based on other subgroups, the margin of sampling error may be higher. Sample sizes and margins of sampling error for other subgroups are available by request. Sampling error is only one of many potential sources of error and there may be other unmeasured error in this or any other public opinion poll. KFF public opinion and survey research is a charter member of the Transparency Initiative of the American Association for Public Opinion Research.
| Group | N (unweighted) | M.O.S.E. |
| Total | 1,327 | ± 3 percentage points |
| Race/Ethnicity | ||
| White, non-Hispanic | 727 | ± 4 percentage points |
| Black, non-Hispanic | 203 | ± 9 percentage points |
| Hispanic | 276 | ± 8 percentage points |
| Health care provider told them they are overweight or obese in past five years | ||
| Yes | 542 | ± 5 percentage points |
| No | 784 | ± 4 percentage points |
Appendix
Endnotes
- KFF analysis of NSDUH data finds 18% have experienced mild, moderate, or severe substance use disorder, similar to the 19% of those in the poll findings who have personally experienced addiction to alcohol or drugs or experienced a drug overdose leading to an emergency room visit or hospitalization. ↩︎
- The incidence measured in this poll is slightly larger than measured in government data, the KFF polling data has a few key differences. KFF polling data asks about individual use as well as family member use and measures those who have ever experienced addiction to opioids, while the KFF’s State Health Facts, which includes government data, measures opioid addiction in the past year. ↩︎
- Fentanyl is recently being added to other illegally produced drugs, such as cocaine, causing fear among recreational drug users that their consumption of other drugs may carry an increased risk of death. ↩︎
- The question asked in the poll asks if those who say they or a family member ever experienced any addiction ever received treatment for drug addiction or substance use disorder, indicating a higher share of those who say they received treatment than in NSDUH analysis, with 6.3% of those who experienced substance use disorder received treatment that year, according to this data. ↩︎
- The use of medications, in combination with counseling and behavioral therapies are meant to provide a treatment plan for substance use disorders. In 2022, buprenorphine dispensing grew by 24% compared to pre-pandemic levels in 2019, but it remains unclear whether the progress in increasing prescriptions has reached people of color, a group that has remained under-prescribed for the opioid treatment. ↩︎