Modifying Medicare's Benefit Design: What's the Impact on Beneficiaries and Spending?
Executive Summary
Proposals to modify the benefit design of traditional Medicare have been frequently raised in federal budget and Medicare reform discussions, including in the June 2016 House Republican health plan as part of a broader set of proposed changes to Medicare.1 Typically, benefit design proposals include a single deductible for Medicare Part A and B services, modified cost-sharing requirements, and a new annual cost-sharing limit, combined with restrictions on “first-dollar” Medigap coverage. Some proposals also include additional financial protections for low-income beneficiaries. Objectives of these proposals may include reducing federal spending, simplifying Medicare cost sharing, providing people in traditional Medicare with protection against catastrophic medical costs, providing low-income beneficiaries with additional financial protections, and reducing the need for beneficiaries to buy supplemental coverage.
This report examines the expected effects of four options to modify Medicare’s benefit design and restrict Medigap coverage, drawing on policy parameters put forth in recent years by the Congressional Budget Office (CBO), the Medicare Payment Advisory Commission (MedPAC), and other organizations. For each option, we model the expected effects on out-of-pocket spending for beneficiaries in traditional Medicare, and assess how each option is expected to affect spending by the federal government, states, employers and other payers, assuming full implementation in 2018. The model is calibrated to CBO’s traditional Medicare and Medicare Advantage 2018 enrollment projections. Details on data and methods are provided in the Appendix.
Option 1 would establish a single $650 deductible for Medicare Part A and Part B services, modify cost-sharing requirements, add an annual $6,700 cost-sharing limit to traditional Medicare, and limit the extent to which Medigap plans could cover the deductible. Option 2 aims to reduce the spending burden on beneficiaries relative to Option 1 by reducing the deductible to $400 and the cost-sharing limit to $4,000. Option 3 aims to provide additional financial protection to some low-income beneficiaries by providing them with full Medicare cost-sharing subsidies under the modified benefit design. Option 4 aims to make the modified benefit resign more progressive by income-relating the deductible and cost-sharing limit.
Key Findings
Proposals to modify the benefit design of traditional Medicare have the potential to decrease—or increase—federal spending and beneficiaries’ out-of-pocket spending, depending upon the specific features of each option (Figure S1). These options can be designed to maximize federal savings, limit the financial exposure of beneficiaries, or target relief to beneficiaries with low-incomes, but not simultaneously. Among the four options modeled, Option 1 is expected to produce the greatest federal savings (-$5.5 billion) but minimal aggregate savings for beneficiaries (-$0.7 billion), while exposing more than three million low-income beneficiaries to higher out-of-pocket costs, compared to current law. Conversely, Option 2 would provide greater financial protections and savings for beneficiaries, but result in a substantial increase in federal spending. And under each of the four options, some beneficiaries would be better off relative to current law, while others would not fare as well.
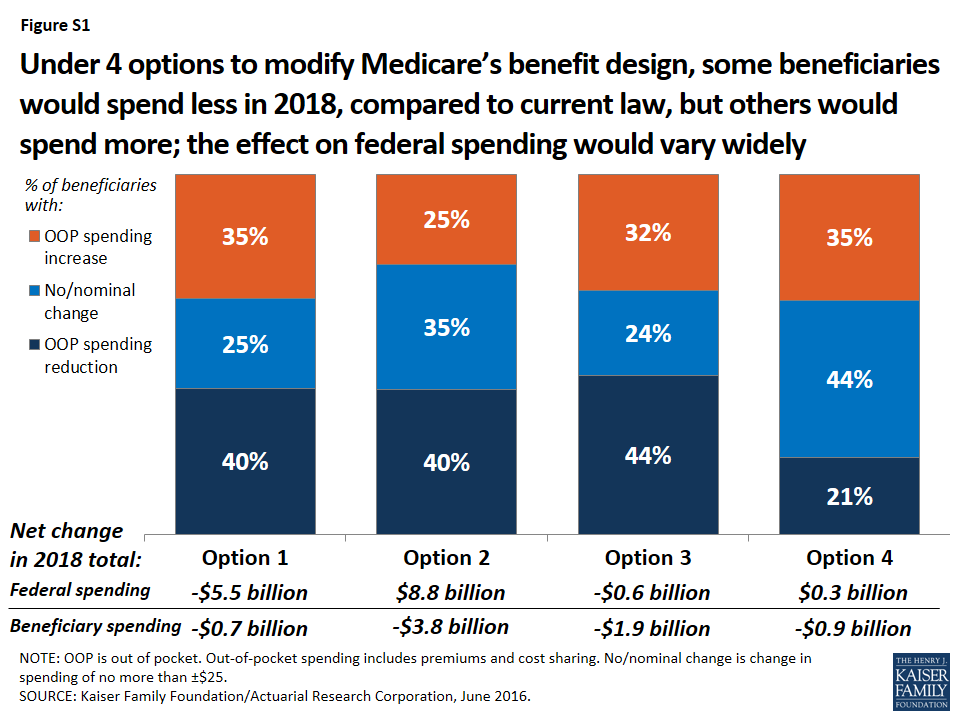
Figure S1: Under 4 options to modify Medicare’s benefit design, some beneficiaries would spend less in 2018, compared to current law, but others would spend more; the effect on federal spending would vary widely
- Modifying Medicare’s benefit design, with a single $650 Part A/B deductible, a new $6,700 cost-sharing limit, varying cost-sharing amounts, and restrictions on first-dollar Medigap coverage (Option 1) would reduce net federal spending by an estimated $5.5 billion and state Medicaid spending by $2.1 billion, with a more modest reduction of $0.7 billion in beneficiary spending in 2018. Just over one-third (35%) of beneficiaries would face higher costs under the modified benefit design, including 3.4 million beneficiaries with incomes below 150% of poverty,2 while 40% of beneficiaries in traditional Medicare would see savings.
- A similar approach, but with a lower deductible ($400) and cost-sharing limit ($4,000) (Option 2) would produce higher net savings for beneficiaries (-$3.8 billion) and for state Medicaid programs (-$3.8 billion) than Option 1, but would substantially increase net federal spending by an estimated $8.8 billion in 2018. A smaller share of beneficiaries would face spending increases compared to Option 1 (from 35% down to 25%).
- Fully subsidizing Medicare cost sharing for a subset of low-income beneficiaries (Option 3) would provide valuable financial help to some (but not all) low-income beneficiaries, but would eliminate nearly all the federal savings associated with the modified benefit design under Option 1. Compared to Option 1, a smaller share of low-income beneficiaries with incomes below 150% poverty would face higher out-of-pocket costs (from 36% down to 23%) and a larger share would face lower costs (from 25% up to 40%). This option would result in larger aggregate savings for beneficiaries than Option 1 (-$1.9 billion), but lower net federal savings (-$0.6 billion) and similar state Medicaid savings (-$2.0 billion) in 2018. As modeled, eligibility for subsidies under this option is narrowly defined (see page 3 for details) and only modestly improves upon existing subsidy programs for some low-income beneficiaries; expanding eligibility would help more low-income beneficiaries, but would also increase federal spending.
- Income-relating the deductible and cost-sharing limit (Option 4) would increase the progressivity of the modified benefit design, providing greater financial protection to beneficiaries with lower incomes and less financial protection to those with higher incomes. The lowest deductible and cost-sharing limit ($325 and $3,350, respectively) would apply to all traditional Medicare beneficiaries with incomes less than 150% of poverty, regardless of assets or supplemental coverage status, which results in a larger number of low-income beneficiaries receiving financial subsidies than under Option 3. Compared to Option 1, a smaller share of beneficiaries in traditional Medicare would see lower out-of-pocket costs in 2018 (from 40% down to 21%), even though more low-income beneficiaries would be helped. This option would reduce total beneficiary spending by an estimated $0.9 billion, while modestly increasing net federal spending by $0.3 billion in 2018 and reducing state Medicaid spending by $4.4 billion.
Conclusion
Our analysis shows that options to modify the benefit design of traditional Medicare combined with restrictions on first-dollar supplemental coverage vary widely in their impact on spending by the federal government, beneficiaries, and other payers. Aggregate changes in spending depend on the specific features of each option, including the level of the deductible and cost-sharing limit and whether additional financial protection is provided to low-income beneficiaries.
Some beneficiaries in traditional Medicare would be better off under each option than under current law, but others would not fare as well in a given year. The impact on beneficiaries’ out-of-pocket spending for premiums and cost sharing would depend on a number of factors, including beneficiaries’ use of services, whether or not they have supplemental coverage, and their incomes.
In general, adding a cost-sharing limit would provide valuable financial protection to a relatively small share of the Medicare population that incurs catastrophic expenses in any given year, although a larger share of beneficiaries would be helped by this provision over multiple years.3 Some beneficiaries could see savings due to lower premiums for Medicare and Medigap, but those without supplemental coverage may be more likely to incur higher spending because of cost-sharing increases.
Options designed to reduce the impact on out-of-pocket spending, whether for all beneficiaries in traditional Medicare or only for those with low incomes, can be expected to produce lower federal savings or could actually increase federal spending relative to current law. An income-related benefit design would be more progressive than if the same amounts applied to all beneficiaries regardless of income, and could be structured in a way to achieve aggregate savings for beneficiaries or the federal government, but at the same time, it would most certainly increase the complexity of the program for beneficiaries and program administrators.
Proposals to modify Medicare’s benefit design have the potential to produce federal savings, reduce aggregate beneficiary spending, and reduce spending by other payers, including spending by states on behalf of beneficiaries who are dually eligible for Medicare and Medicaid, and by employers who provide supplemental coverage to retirees. Such proposals could also simplify the program, provide beneficiaries with valuable protection against catastrophic expenses, add additional financial protections for low-income beneficiaries, and reduce the need for beneficiaries to purchase supplemental insurance. As this analysis demonstrates, however, it will be difficult for policymakers to achieve all of these ends simultaneously.
Report
Introduction
Proposals to modify the benefit design of traditional Medicare have been frequently raised in federal budget and Medicare reform discussions, including in the June 2016 House Republican health plan as part of a broader set of proposed changes to Medicare.1 Typically, Medicare benefit design proposals would establish a single deductible for Medicare Part A and Part B services (rather than two separate deductibles for these services, as is the case today), modify cost-sharing requirements for various Medicare-covered services, add an annual cost-sharing limit to traditional Medicare, and impose restrictions or surcharges on Medicare supplemental insurance (Medigap) policies.2 These proposals typically do not incorporate or make changes to the Medicare Part D prescription drug program.
Modifying the benefit design of traditional Medicare has generated interest among policymakers, perhaps partly because this approach to Medicare reform can achieve different objectives, including reducing federal spending, simplifying Medicare’s cost-sharing requirements, providing people in traditional Medicare with protection against catastrophic medical expenses, providing low-income beneficiaries with additional financial protections, and reducing the need for beneficiaries to obtain Medicare supplemental coverage (Medigap).
The specific objectives that could be achieved through any given Medicare benefit redesign proposal depend on the features of the design. Such features would have a substantial effect on expected outcomes, including the share of beneficiaries facing lower or higher out-of-pocket costs; the amount of Medicare savings or additional spending; and the change in spending by other payers, including Medicaid, Medigap, and employers who offer retiree health benefits. For example, setting an annual cost-sharing limit at a relatively low level would reduce costs for a larger share of beneficiaries than if the limit were set relatively high, but a lower cost-sharing limit would result in higher costs to Medicare. These features are also important in determining the extent to which a modified Medicare benefit design would provide relief from—or add to—the financial burden of health care costs for Medicare beneficiaries, half of whom lived on annual incomes below $24,150 in 2014.3
In 2011, we released an analysis of a proposal to modify Medicare’s benefit design in combination with restrictions on Medigap coverage, based on a set of parameters from the Congressional Budget Office (CBO).4 The modified benefit design included a single Part A/B deductible of $550, an annual cost-sharing limit of $5,500, uniform coinsurance of 20 percent for Medicare-covered services, and restrictions on “first-dollar” Medigap coverage, modeled as if fully implemented in 2013. The most recent House Republican proposal includes a similar set of parameters, to be implemented in 2020, although it does not specify the exact dollar amounts for the deductible or the cost-sharing limit. The results from our 2011 modeling of these parameters showed that, overall, more beneficiaries would see their out-of-pocket costs increase rather than decrease under this benefit design, although the spending effects would vary based on beneficiaries’ health status and other characteristics.
Since we conducted our previous analysis, a number of modifications to the basic benefit redesign approach described by CBO have been suggested. One alternative put forward by the Medicare Payment Advisory Commission (MedPAC) and others would charge varying service-specific copayments, rather than a uniform coinsurance rate, for most Medicare-covered services, similar to the cost-sharing structure in Medicare Advantage plans.5 For example, rather than adding a new coinsurance requirement for home health services, MedPAC included a $150 copayment per episode, which would limit the financial burden of the new cost-sharing requirement on beneficiaries who need extensive home health care. Other benefit design modifications have also been proposed, including varying the deductible and cost-sharing limit by income,6 exempting physician visits from the deductible,7 and providing additional financial protections to low-income beneficiaries.8 In addition, a number of options have been suggested for restricting supplemental coverage, including a premium surcharge on Medigap policies and employer retiree plans.9
This report updates our earlier work with an analysis of the effects on beneficiaries and payers of four options to modify the benefit design of traditional Medicare and restrict Medigap coverage, assuming full implementation in 2018 (Table 1).
| Table 1: Features of Medicare’s Benefit Design Under Current Law and Four Benefit Design Options, Modeled as if Fully Implemented in 2018 |
|||||
| Current law |
Option 1
Basic benefit redesign option
|
Option 2
Lower deductible/ cost-sharing limit option
|
Option 3
Low-income
subsidies option |
Option 4
Income-related option
|
|
|
Part A/B deductible
(options exclude physician office visits from deductible)
|
Separate deductibles
Part A: $1,360 in 20181
Part B: $170 in 20181
|
$650 | $400 |
Same as
Option 1
|
Income-related deductibles (% of poverty):
Up to 150%: $325
150-800%: $650
800-900%: $750
900-1000%: $850
1,000%+: $950
|
| Part A/B cost-sharing limit (does not apply to Part D) |
N/A in traditional Medicare ($6,700 maximum in Medicare Advantage in 2016) | $6,700 | $4,000 |
Same as
Option 1
|
Income-related cost-sharing limits (% of poverty): Up to 150%: $3,350 150-800%: $6,700 800-900%: $7,500 900-1000%: $8,500 1,000%+: $9,500 |
| Medigap coverage restrictions | N/A2 | Medigap covers 50% of the Part A/B deductible |
Same as
Option 1
|
Same as
Option 1
|
Same as
Option 1
|
| Low-income provisions | Medicaid helps pay Medicare premiums and/or cost sharing for some low-income beneficiaries |
Same as
current law
|
Same as
current law
|
Medicare covers 100% of cost sharing (deductible, cost-sharing limit, and copayments) for SLMB, QI, and Part D LIS beneficiaries3 | For beneficiaries up to 150% of poverty: Part A/B deductible: $325 Part A/B cost-sharing limit: $3,350 |
| Cost-sharing amounts4 |
Part A: daily copayments for long-term hospital and SNF stays
– Part B: 20% coinsurance for most services
|
Hospital: $750/stay
Outpatient: $130/visit
Primary care visit: $25
Specialist visit: $50
Part B drugs: 20%
Imaging: $130/study
SNF: $95/day
DME: 20%
Hospice: 0%
Home health: $140/episode5
|
Same as
Option 1
|
No cost sharing for SLMB, QI, and Part D LIS beneficiaries3
Same as
Option 1 for all other beneficiaries |
Same as
Option 1
|
|
NOTE: N/A is not applicable. SNF is skilled nursing facility. DME is durable medical equipment. 12018 projections from the 2016 Medicare Trustees report. 2Under current law, beginning in 2020, the sale of Medigap policies that cover the Part B deductible for newly-eligible Medicare beneficiaries will be prohibited. 3Applies to beneficiaries who are Specified Low-Income Medicare Beneficiaries (SLMB), Qualified Individuals (QI), or enrolled in the Part D Low-Income Subsidy (LIS) program who are not already receiving assistance with Medicare cost-sharing requirements from Medicaid or Medicare Savings Programs. 4No cost sharing for preventive services or wellness visit, as under current law. 5Modeled as 5 percent coinsurance.
SOURCE: Kaiser Family Foundation, June 2016.
|
|||||
The main features of Option 1, the basic benefit redesign option,10 are:
- A single $650 deductible for services covered under Medicare Parts A and B. The cost of physician visits would not be subject to the deductible, which aims to mitigate the effects of a de facto increase in the deductible for beneficiaries who primarily use Part B services only (that is, people who have no hospitalizations in any given year).11
- A $6,700 annual cost-sharing limit on services covered under Medicare Parts A and B (excluding costs under the Part D drug benefit). This feature aims to provide financial protection to beneficiaries in traditional Medicare who have very high medical costs, with the cost-sharing limit set to match the limit required in all Medicare Advantage plans.
- Various cost-sharing amounts for Medicare-covered services, including a new cost-sharing requirement for home health services.12
- Prohibiting Medigap policies from covering 50 percent of the Part A/B deductible, but no other restrictions on Medigap coverage. This approach is similar to the Medigap provision included in the Medicare Access and CHIP Reauthorization Act of 2015 (MACRA), which applies exclusively to new Medicare beneficiaries.13
We also evaluated three modifications to the basic benefit redesign option described above:
- Option 2, the lower deductible and cost-sharing limit option: Similar to Option 1, but lowers the deductible to $400 and the cost-sharing limit to $4,000 for all traditional Medicare beneficiaries. The aim of Option 2 is to reduce the share of beneficiaries who face spending increases, relative to Option 1, by lowering the deductible, and to increase the share of beneficiaries with a spending reduction by lowering the annual cost-sharing limit.
- Option 3, the low-income subsidies option: Similar to Option 1, but adds full Medicare cost-sharing subsidies (paid by Medicare) for beneficiaries in traditional Medicare who are enrolled in the Specified Low-Income Medicare Beneficiary (SLMB), Qualified Individual (QI), or Part D Low-Income Subsidy (LIS) program and do not receive assistance with Part A and Part B cost-sharing requirements from Medicaid or the Medicare Savings Programs. The vast majority of these beneficiaries have incomes below 150 percent of the federal poverty guidelines14 and limited assets.15 The aim of Option 3 is to reduce the spending burden associated with the modified benefit design under Option 1 for some low-income beneficiaries. We estimate that 2.3 million traditional Medicare beneficiaries would receive these additional subsidies in 2018. However, Option 3, as modeled, does not subsidize all low-income Medicare beneficiaries and assumes no woodwork effect. For example, it excludes beneficiaries who are eligible for but not enrolled in SLMB, QI, or LIS, and those with incomes below 150 percent of poverty but assets above program eligibility levels.
- Option 4, the income-related option: Similar to Option 1, but modifies the deductible and cost-sharing limit based on income, with a lower deductible and cost-sharing limit for those with incomes less than 150 percent of poverty ($325/$3,350), ranging up to $950/$9,500 for those with incomes greater than 1,000 percent of poverty. As modeled, the lowest deductible and cost-sharing limit apply to all traditional Medicare beneficiaries with incomes less than 150 percent of poverty, regardless of assets or supplemental coverage status, and therefore covers a larger number of low-income beneficiaries than the subsidies provided under Option 3. The aim of Option 4 is to increase the progressivity of the modified benefit design, compared to the deductible and cost-sharing limit that do not vary by income under Option 1.
The discussion below first examines the overall effects of Option 1, the basic benefit redesign option, compared to current law, assuming full implementation in 2018. This discussion highlights the expected effects on beneficiaries in traditional Medicare in terms of aggregate out-of-pocket spending on cost sharing and premiums, the share with higher or lower out-of-pocket costs, and expected changes in average per capita out-of-pocket spending, as well as the expected effects on payers (the federal government, including Medicare; state Medicaid programs; employers; and other payers). We then describe how these effects would change based on the benefit design modifications in Options 2-4.
Overview of Methods
Our analysis relies on a model developed by the Actuarial Research Corporation (ARC) to assess the spending effects of options to modify Medicare’s benefit design and restrict supplemental coverage, assuming full implementation in 2018. The model is primarily based on individual-level data from the Medical Expenditure Panel Survey (MEPS), which are calibrated to match aggregate Congressional Budget Office (CBO) Medicare spending and enrollment estimates and projections. To evaluate the effect of providing additional financial assistance to low-income beneficiaries, the model incorporates estimates and projections of the number of beneficiaries enrolled in Medicaid, Medicare Savings Programs, and the Part D Low Income Subsidy (LIS) program from the Medicare Chronic Conditions Data Warehouse and of the income distribution of beneficiaries from the DYNASIM model developed by The Urban Institute.
We first developed a current-law baseline for 2018 by identifying Medicare reimbursements for each individual in traditional Medicare (excluding beneficiaries enrolled in Medicare Advantage plans), inferring the individual’s cost-sharing obligations under current law, and dividing those obligations between the individual and their supplemental insurer as appropriate. We calculated Medicare and supplemental plan premiums and added these amounts to beneficiaries’ out-of-pocket costs. Next, we simulated the effects of benefit design changes by modifying cost-sharing obligations according to the benefit design features and by changing Medigap coverage and costs. We assumed that beneficiaries would use less (or more) care as cost sharing increases (or decreases) for specific services and that some beneficiaries would switch into or out of traditional Medicare, Medigap, or Medicare Advantage in response to the benefit design changes.
Although MEPS includes Medicare beneficiaries who are enrolled in Medicare Advantage, we excluded this group when evaluating the individual-level spending effects of the benefit design options because the options modify traditional Medicare. The model does incorporate indirect effects on aggregate Medicare Advantage spending and enrollment, based on the assumptions that changes in traditional Medicare reimbursement would be reflected in Medicare Advantage payments, and that aggregate Medicare Advantage payments will change to the extent that some beneficiaries switch between traditional Medicare and Medicare Advantage.
Modeling of this type involves some degree of uncertainty and invariably requires a number of assumptions. A discussion of limitations and assumptions following the discussion of findings. Details on data and methods are provided in the Appendix.
Findings
What are the expected effects on beneficiaries of a modified medicare benefit design combined with restrictions on medigap coverage?
Compared to current law, the modified Medicare benefit design and restrictions on Medigap first-dollar coverage under Option 1 would result in net savings of $0.7 billion in 2018 for beneficiaries in traditional Medicare, in the aggregate. This amount includes an estimated $4.3 billion increase in cost sharing for Medicare-covered services that occurs even with the addition of an annual cost-sharing limit, in part due to the higher deductible for Part B services compared to current law. The aggregate increase in cost sharing is offset by an estimated $5.0 billion reduction in premiums for Medicare Part B and Medigap (Table 2).
| Table 2: Change in Expected Annual Total Health Care Spending for Various Payers Under Four Medicare Benefit Design Options if Fully Implemented in 2018 | |||||
| Spending effects (in billions) | Option 1 Basic benefit redesign option |
Option 2 Lower deductible/cost-sharing limit option |
Option 3 Low-income subsidies option |
Option 4 Income-related option |
|
| Light blue shading indicates largest spending reduction of the 4 options | |||||
| Tan shading indicates largest spending increase of the 4 options | |||||
| Total health care spending | |||||
| Net change | -$8.8 | -$1.5 | -$5.9 | -$6.1 | |
| Spending1 | $4.8 | $15.1 | $4.9 | $9.4 | |
| Savings2 | -$13.5 | -$16.6 | -$10.8 | -$15.4 | |
| Federal spending | |||||
| Net change | -$5.5 | $8.8 | -$0.6 | $0.3 | |
| Medicare | -$3.0 | $14.1 | $1.8 | $5.9 | |
| Medicaid (federal) | -$2.8 | -$5.0 | -$2.7 | -$5.9 | |
| TRICARE | $0.3 | -$0.3 | $0.3 | $0.2 | |
| Beneficiary spending | |||||
| Net change | -$0.7 | -$3.8 | -$1.9 | -$0.9 | |
| Cost sharing | $4.3 | $1.1 | $2.8 | $3.2 | |
| Premiums | -$5.0 | -$4.8 | -$4.7 | -$4.1 | |
| Other payer spending | |||||
| Net change | -$2.6 | -$6.5 | -$3.4 | -$5.4 | |
| State Medicaid | -$2.1 | -$3.8 | -$2.0 | -$4.4 | |
| Employers | $0.2 | -$1.3 | -$0.4 | $0.04 | |
| Other supplemental insurers3 | -$0.6 | -$1.4 | -$1.0 | -$1.0 | |
| NOTE: 1Spending amounts are the sum of increases in federal, beneficiary, and other payer categories. 2Savings amounts are the sum of decreases in federal, beneficiary, and other payer categories. 3Other supplemental insurers includes Veterans’ Administration; Indian Health Service; Workers Compensation; other federal, state, and local sources; and other unclassified/unknown sources. SOURCE: Kaiser Family Foundation/Actuarial Research Corporation, June 2016. |
|||||
On a per capita basis, Part B premiums are expected to decrease under the basic benefit redesign option by $50 in 2018 (Table 3). This change corresponds to a projected reduction in Part B spending, which mainly reflects an increase in the deductible for beneficiaries who use only Part B services and an increase in cost sharing for certain services. Changes in Part B spending affect beneficiary Part B premiums because the standard Part B premium is set to cover 25 percent of program costs.1
| Table 3: Change in Expected Annual Per Capita Premiums by Traditional Medicare Beneficiaries Under Four Medicare Benefit Design Options if Fully Implemented in 2018 | |||||
| Option 1 Basic benefit redesign option |
Option 2 Lower deductible/cost-sharing limit option |
Option 3 Low-income subsidies option |
Option 4 Income-related option |
||
| Part B premiums | -$50 | $20 | -$30 | -$20 | |
| Medigap premiums | -$200 | -$400 | -$220 | -$280 | |
| Retiree premiums | $10 | -$110 | -$30 | <$10 | |
| NOTE: Estimates are rounded to the nearest $10. SOURCE: Kaiser Family Foundation/Actuarial Research Corporation, June 2016. |
|||||
Medigap premiums are also expected to decrease under the basic benefit redesign option by $200 per person in 2018. This is primarily because both the new cost-sharing limit in traditional Medicare and the prohibition on first-dollar Medigap coverage would reduce the amount of claims to be paid by Medigap (Table 3). Under this option, Medigap policyholders would be responsible for half ($325) of the Part A/B deductible, however, which would more than offset the amount of the premium reduction for those who incur even modest medical expenses and which could also lead to reductions in utilization by policyholders.
Although beneficiaries in traditional Medicare overall would see aggregate savings under the basic benefit redesign option, the spending effects at the individual level would vary, with some people expected to face higher costs and others expected to see lower costs compared to current law (Figure 1):
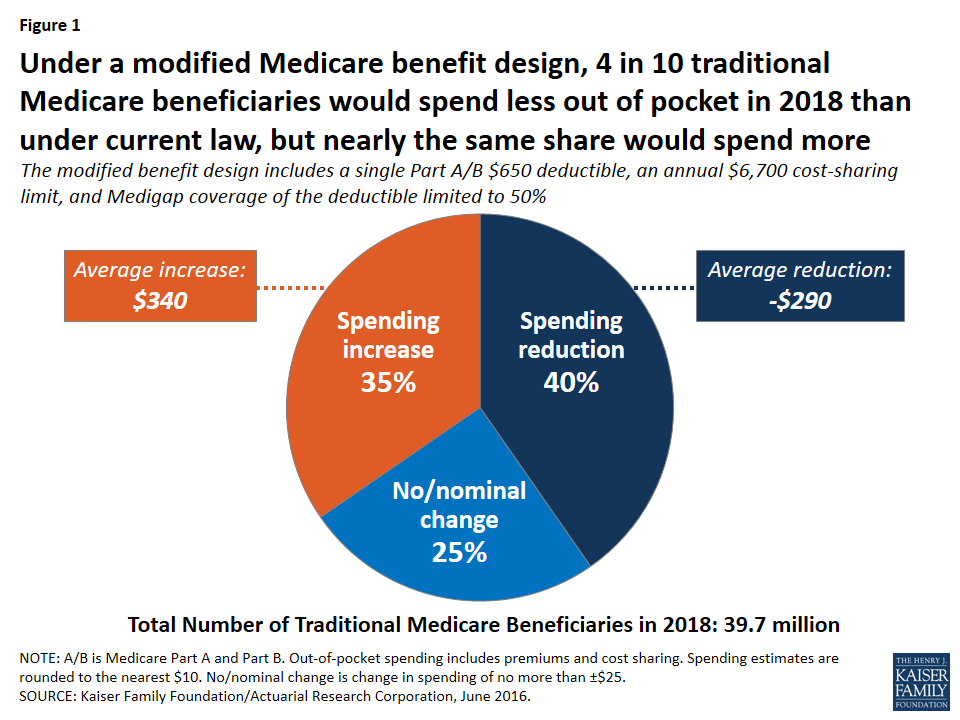
Figure 1: Under a modified Medicare benefit design, 4 in 10 traditional Medicare beneficiaries would spend less out of pocket in 2018 than under current law, but nearly the same share would spend more
- Overall, 40 percent of beneficiaries in traditional Medicare (16.0 million) are expected to see a reduction in out-of-pocket spending (including both premiums and cost sharing), averaging -$290 per person.
- Another 35 percent (13.7 million) would experience a spending increase, averaging $340 per person; this group includes 3.4 million beneficiaries with incomes below 150 percent of poverty, as discussed below.
- The remaining 25 percent (10.0 million) would experience no or only a nominal change in spending.
Some beneficiaries are expected to face higher out-of-pocket costs under the basic benefit redesign option as a result of the higher single A/B deductible relative to the deductible for Part B services under current law. At the same time, the new annual $6,700 cost-sharing limit in traditional Medicare would benefit 5 percent of traditional Medicare beneficiaries who are expected to exceed this limit in 2018. (Even more (11 percent) would benefit from a lower $4,000 limit, as under Option 2, discussed below.) Because of supplemental coverage, however, not all beneficiaries with high levels of cost sharing would directly benefit from the cost-sharing limit. For example, beneficiaries who are also enrolled in Medicaid and most Medigap policyholders already receive coverage for Medicare’s cost-sharing requirements.
Expected out-of-pocket spending effects by service use. Out-of-pocket spending changes would also vary depending upon a beneficiary’s use of services, with people using high-cost services benefitting more under the basic benefit redesign option, in general, than those using lower-cost services. Although beneficiaries who use costly services represent only a small share of the total traditional Medicare population, a larger share of these beneficiaries are expected to see a reduction in out-of-pocket spending than beneficiaries overall, and their average out-of-pocket cost savings are expected to be far greater. For example, just over half (52 percent) of beneficiaries who have an inpatient stay followed by a skilled nursing facility (SNF) stay would see a reduction in out-of-pocket spending under Option 1, versus 40 percent of all beneficiaries (Figure 2). More notably, average out-of-pocket cost savings among this group are estimated to be substantially greater than the overall average (-$1,480 per person versus -$290 overall) (Figure 3).
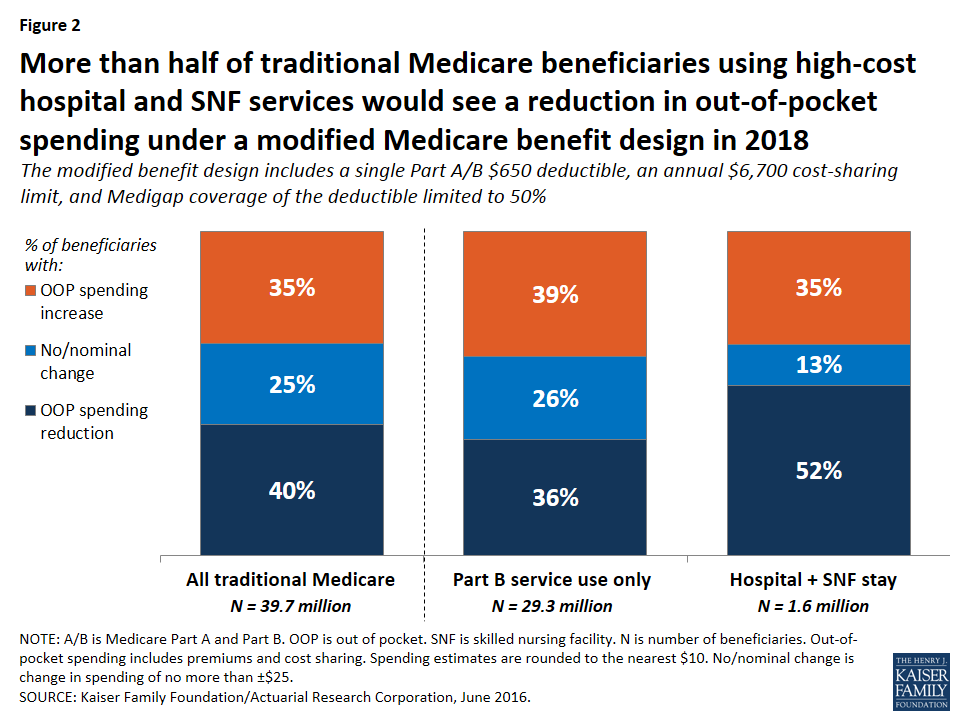
Figure 2: More than half of traditional Medicare beneficiaries using high-cost hospital and SNF services would see a reduction in out-of-pocket spending under a modified Medicare benefit design in 2018
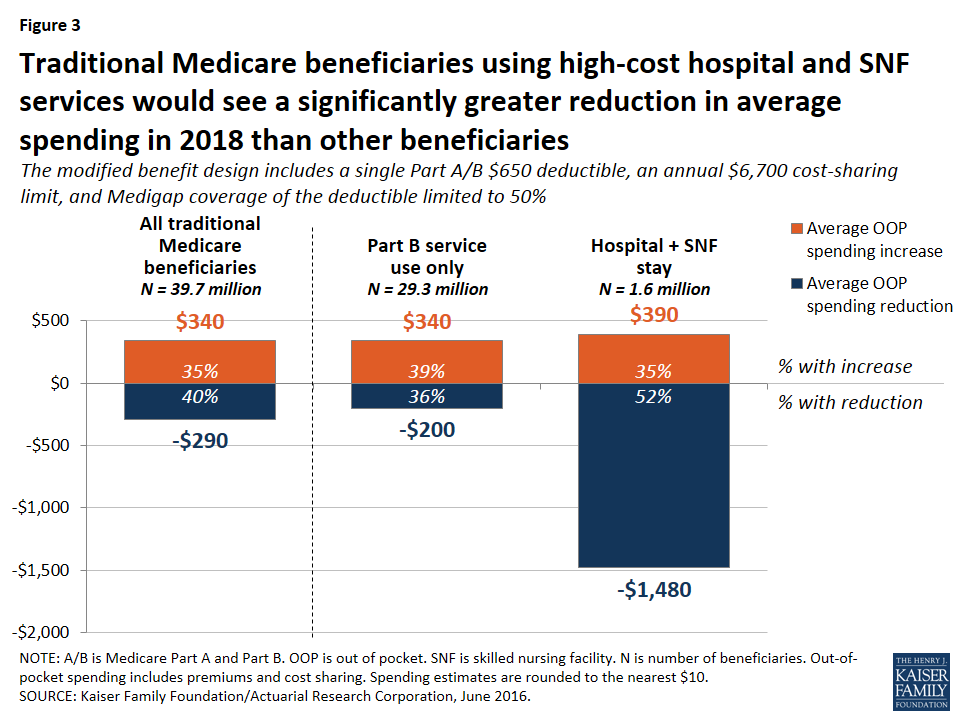
Figure 3: Traditional Medicare beneficiaries using high-cost hospital and SNF services would see a significantly greater reduction in average spending in 2018 than other beneficiaries
In contrast, among beneficiaries who use only Part B services (that is, those without a hospitalization, SNF stay, or other Part A service use)—a group that accounts for a majority of traditional Medicare beneficiaries—nearly four in 10 (39 percent) would pay more under the basic benefit redesign option compared to current law, a somewhat larger share than among beneficiaries overall (35 percent). These beneficiaries would face an average out-of-pocket spending increase that is the same as traditional beneficiaries overall ($340).
Expected out-of-pocket spending effects by income. The “near poor” (that is, beneficiaries with incomes between 100-150 percent of poverty) are not expected to fare as well under the basic benefit redesign option as those with lower or higher incomes, in terms of the share facing lower spending and average expected changes in spending. Among near-poor beneficiaries, 25 percent are expected to see lower out-of-pocket costs and 36 percent would face higher costs compared to current law (Figure 4). Altogether, 3.4 million traditional Medicare beneficiaries with incomes less than 150 percent of poverty would face higher out-of-pocket spending under the basic benefit redesign option compared to current law. This includes 1.8 million near-poor beneficiaries (36 percent, similar to the share of higher income beneficiaries facing a spending increase) and 1.6 million of those with incomes less than 100 percent of poverty (22 percent, a smaller share because many of the lowest-income beneficiaries receive assistance from Medicaid with Medicare cost-sharing requirements under current law).

Figure 4: A smaller share of lower-income traditional Medicare beneficiaries would see a reduction in out-of-pocket spending in 2018 under a modified Medicare benefit design than those with higher incomes
Among beneficiaries expected to see an increase in out-of-pocket spending, the average increase is expected to be larger among the near-poor group ($430) than among those with higher incomes ($330) or lower incomes ($350). The increase would be largest for near-poor beneficiaries because this group is less likely than higher-income beneficiaries to have supplemental coverage (such as employer or Medigap coverage) which would help enrollees with any increases in Medicare cost-sharing requirements.2 Moreover, beneficiaries with incomes above the federal poverty guidelines do not qualify for financial assistance from Medicaid to help pay Medicare Part A and Part B cost-sharing requirements, as many of those with the lowest incomes do under current law. As a result, the “near poor” would be disproportionately affected by increases in cost-sharing requirements under the basic benefit redesign option.
The share of beneficiaries expected to see a reduction in spending under the basic benefit redesign option increases with income. A smaller share of poor and near-poor beneficiaries would see a reduction in out-of-pocket spending in 2018 under the basic benefit redesign option than those with higher incomes (more than 150 percent of poverty) (19 percent, 25 percent, and 49 percent, respectively). While a smaller share of lower-income beneficiaries would see out-of-pocket cost savings, their average savings would be larger than savings among those with higher incomes (-$710, -$500, and -$220, respectively).
How would the basic benefit redesign option affect aggregate spending by Medicare, Medicaid, and other payers?
Overall, the basic benefit redesign option is expected to result in net total health care savings of $8.8 billion in 2018, including an estimated $5.5 billion in net federal savings, $2.6 billion in net savings to other payers, and $0.7 billion in net beneficiary savings (Figure 5; Table 2).
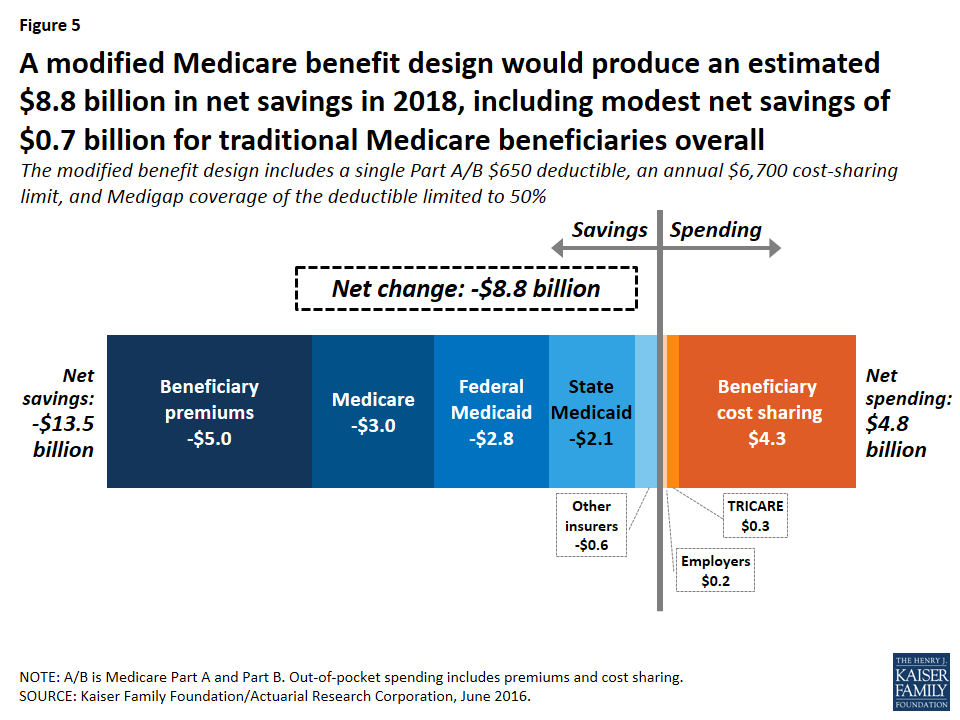
Figure 5: A modified Medicare benefit design would produce an estimated $8.8 billion in net savings in 2018, including modest net savings of $0.7 billion for traditional Medicare beneficiaries overall
- Net federal savings (-$5.5 billion) includes estimated savings for Medicare (-$3.0 billion) and Medicaid (-$2.8 billion), offset somewhat by modestly higher TRICARE spending ($0.3 billion).
- Other payers are projected to see a net spending reduction of $2.6 billion, with a $2.1 billion reduction in state Medicaid spending and a $0.6 billion reduction in spending by other supplemental insurers, offset somewhat by a $0.2 billion increase in employer spending.
Medicare spending. Medicare is expected to achieve estimated net savings of $3.0 billion under the basic benefit redesign option compared to current law, even with an increase in Medicare spending for some higher-cost services due to the new cost-sharing limit, including for inpatient and SNF services (Table 4).
| Table 4: Change in Expected Annual Medicare Benefit Payments Under Four Medicare Benefit Design Options if Fully Implemented in 2018 | ||||
| Spending effects, by type of service (in billions) | Option 1 Basic benefit redesign option |
Option 2 Lower deductible/cost-sharing limit option |
Option 3 Low-income subsidies option |
Option 4 Income-related option |
| Inpatient hospital | $2.3 | $4.2 | $2.8 | $3.5 |
| Outpatient | $0.8 | $4.5 | $1.7 | $2.6 |
| Physician | -$6.3 | -$0.6 | -$4.2 | -$3.4 |
| Skilled nursing facility | $2.6 | $4.6 | $2.9 | $3.4 |
| Home health (Part A) | -$0.5 | -$0.4 | -$0.5 | -$0.4 |
| Home health (Part B) | -$0.9 | -$0.7 | -$0.8 | -$0.7 |
| NOTE: Estimates do not sum to net change in Medicare spending for each option, as shown in Table 2, because they exclude aggregate spending changes for Medicare Advantage and Part B premiums. SOURCE: Kaiser Family Foundation/Actuarial Research Corporation, June 2016. |
||||
The net reduction in Medicare spending under the basic benefit redesign option is due to several factors.
- First, the single deductible for services covered under Parts A and B would mean a higher deductible than under current law for the majority of traditional Medicare beneficiaries who do not use Part A inpatient services; this change would shift costs from Medicare to beneficiaries.
- Second, the higher deductible (relative to the current-law Part B deductible) is expected to reduce beneficiaries’ utilization of Part B physician and other outpatient services and would thereby reduce Medicare spending for these services.
- Third, the new copayment on home health services under the basic benefit redesign option is expected to reduce utilization and spending for these services.
- Fourth, the restriction on Medigap coverage of the deductible would expose Medigap policyholders to a portion of their upfront costs for Medicare-covered services, which would in turn reduce their use of services and Medicare spending for beneficiaries with Medigap.
Federal and state Medicaid spending. Net Medicaid spending is expected to be lower under the basic benefit redesign option, with an estimated $2.8 billion reduction in federal Medicaid spending and a $2.1 billion reduction in state Medicaid spending in 2018. This reduction is mainly due to the new cost-sharing limit under Medicare, which would shift costs from Medicaid to Medicare for high-cost beneficiaries who are dually eligible for both programs. Lower Part B premiums would also reduce Medicaid costs for beneficiaries who are dually eligible for Medicare and Medicaid, because Medicaid currently pays Part B premiums for this group (along with Medicare cost-sharing requirements for many, but not all, dually eligible beneficiaries).
Employer spending. Costs to employers would increase by an estimated $0.2 billion in 2018 under Option 1. This would occur because employers would cover a portion of the new cost-sharing requirements, such as the higher Medicare deductible for beneficiaries without a hospitalization, on behalf of those with retiree coverage.
How would alternative benefit design options affect spending by beneficiaries and by medicare, medicaid, and other payers?
We evaluated the effects of three alternatives to the modified benefit design and Medigap coverage restrictions in Option 1:
- Option 2, the lower deductible and cost-sharing limit option, is similar to the basic benefit redesign option, but with a lower deductible and cost-sharing limit to reduce the share of beneficiaries facing spending increases and to increase the share of beneficiaries with a spending reduction, relative to Option 1.
- Option 3, the low-income subsidies option, has the same features as the basic benefit redesign option, and also provides full Medicare cost-sharing subsidies to a subset of low-income beneficiaries to reduce the spending burden associated with the modified benefit design for these beneficiaries.
- Option 4, the income-related option, is similar to the basic benefit redesign option, but modifies the deductible and cost-sharing limit based on income, with lower amounts for people with lower incomes and higher amounts for those with higher incomes, to increase the progressivity of the modified benefit design.
The following discussion compares how the effects on beneficiaries and spending by payer under Option 1, are expected to change under the alternative options described above, assuming full implementation in 2018.
Option 2: Lowering the deductible and cost-sharing limit for services covered under Medicare parts a and b
Expected effects on out-of-pocket spending. Compared to the basic benefit redesign option, lowering the deductible and cost-sharing limit to $400 and $4,000, respectively, for all traditional Medicare beneficiaries (Option 2) would reduce the share of beneficiaries facing a spending increase (from 35 percent to 25 percent) and increase average savings among those facing a spending reduction (from -$290 to -$440) (Figure 6).
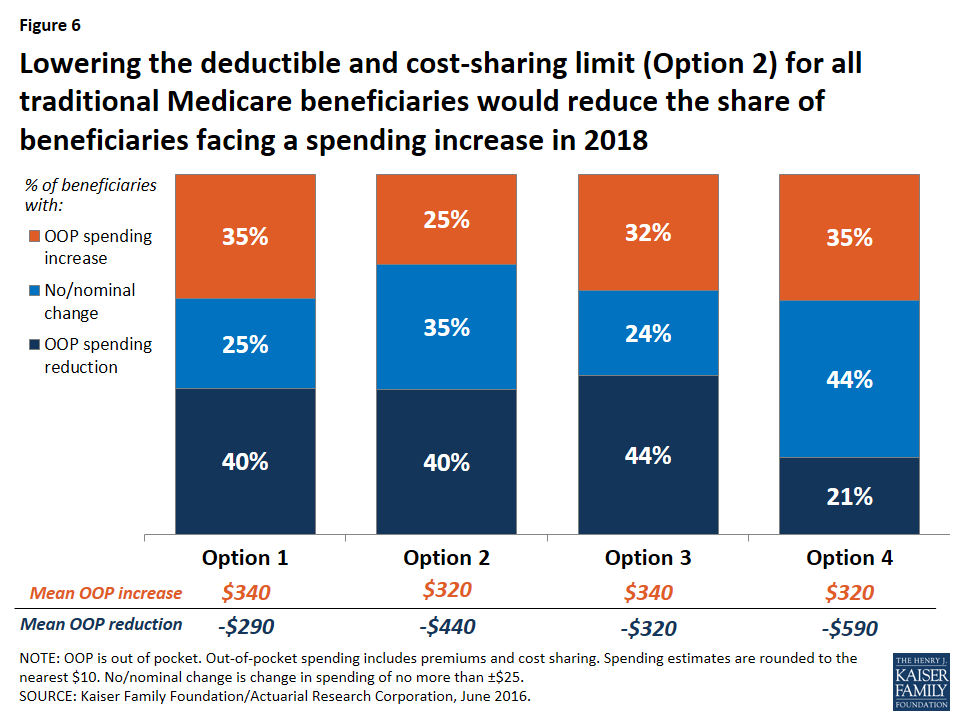
Figure 6: Lowering the deductible and cost-sharing limit (Option 2) for all traditional Medicare beneficiaries would reduce the share of beneficiaries facing a spending increase in 2018
Modifying the basic benefit redesign by lowering the deductible and cost-sharing limit would be particularly likely to benefit sicker beneficiaries, who would be more likely to reach the cost-sharing limit than other beneficiaries. For example, among those with both a hospital and SNF stay, the lower deductible and cost-sharing limit option would reduce the share who are expected to face an increase in their out-of-pocket costs by twenty percentage points (from 35 percent to 15 percent) and increase the share who are expected to see a reduction in their out-of-pocket costs by the same amount (from 52 percent to 72 percent), relative to the basic benefit redesign option (Figure 7).
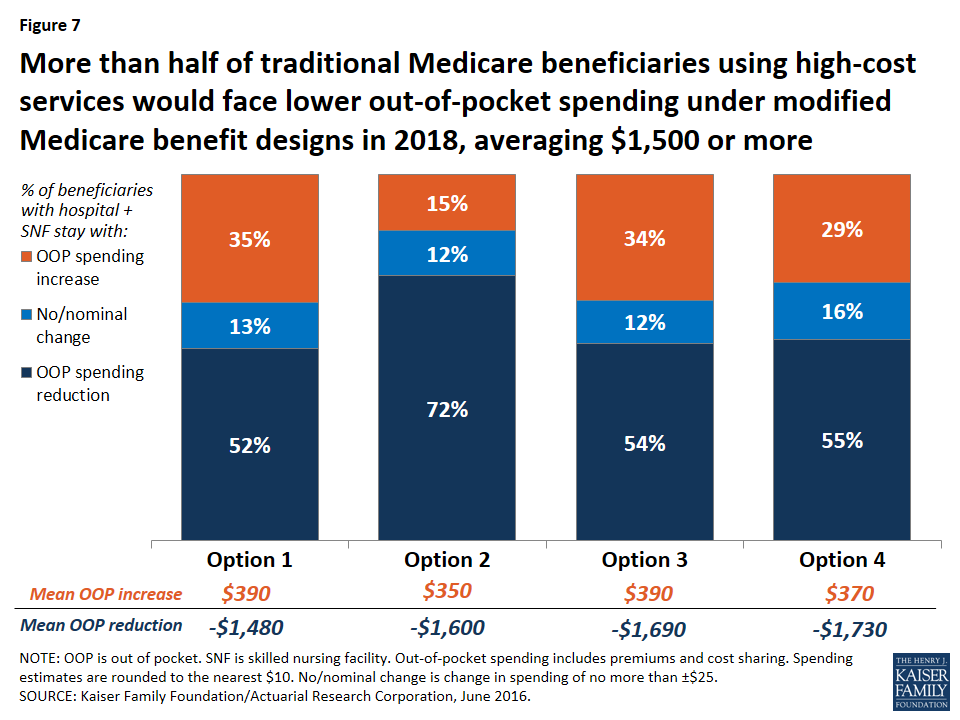
Figure 7: More than half of traditional Medicare beneficiaries using high-cost services would face lower out-of-pocket spending under modified Medicare benefit designs in 2018, averaging $1,500 or more
Expected effects on aggregate beneficiary spending. In terms of the aggregate effects on beneficiaries, savings are largest under Option 2 (-$3.8 billion), with its lower deductible and cost-sharing limit, compared to all other options. Net savings to beneficiaries under Option 2 is comprised of a $1.1 billion increase in spending on cost sharing offset by a $4.8 billion reduction in premium spending. On the one hand, the Part B premium would increase under the lower deductible and cost-sharing limit option, versus a decrease under the basic benefit redesign option (see Table 3 above). This is because with a lower deductible under Option 2, beneficiaries are expected to use more services than they would under the basic benefit redesign option, and Medicare would pay for a higher proportion of it, which would lead to higher Part B spending and, therefore, higher Part B premiums. In contrast, Medigap and employer premiums would be lower under Option 2 than under the basic benefit redesign option. This is because the lower deductible and cost-sharing limit would reduce the liability of supplemental insurers, which would be expected to result in lower premiums. These decreases would offset the more modest increase in Part B premiums, resulting in an aggregate reduction in premium spending by beneficiaries under the lower deductible and cost-sharing limit option.
Expected effects on aggregate spending by other payers. Lowering the deductible and cost-sharing limit would produce the largest aggregate savings to beneficiaries of the four options considered in this report, but it would also more than offset any federal savings from the basic benefit redesign option, resulting in an increase in federal spending of $8.8 billion (Figure 8). Net total health care savings would also be lower under the lower deductible and cost-sharing limit option (Option 2) than under the basic benefit redesign option (Option 1) (-$1.5 billion instead of -$8.8 billion), largely as a result of an expected increase in service use by beneficiaries and higher Medicare spending above the annual cost-sharing limit (see Table 2 above).
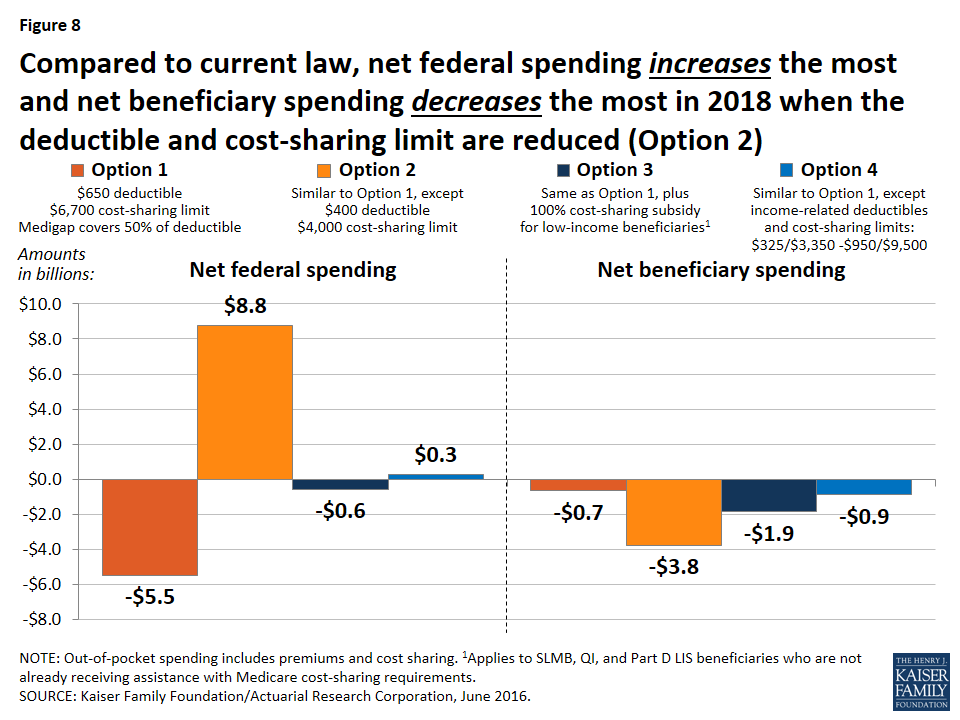
Figure 8: Compared to current law, net federal spending increases the most and net beneficiary spending decreases the most in 2018 when the deductible and cost-sharing limit are reduced (Option 2)
Option 3: Fully-subsidized Medicare cost sharing for certain low-income beneficiaries
Expected effects on out-of-pocket spending. Relative to the basic benefit redesign option, the low-income subsidies option (Option 3) compares favorably for lower-income beneficiaries in traditional Medicare, especially those with incomes between 100-150 percent of poverty. For this group of near-poor beneficiaries, providing a full subsidy for Medicare’s cost-sharing requirements would decrease the share expected to face a spending increase by 13 percentage points (from 36 percent under the basic benefit redesign option to 23 percent under the low-income subsidies option) and increase the share expected to face a reduction in spending by 15 percentage points (from 25 percent under the basic benefit redesign option to 40 percent under the low-income subsidies option) (Figure 9). The average out-of-pocket spending increase for beneficiaries in this group (among those facing an increase) would also be lower under the low-income subsidies option than under the basic benefit redesign option ($360 versus $430), and the average out-of-pocket spending reduction (among those facing a reduction) would be higher (-$690 versus -$500).
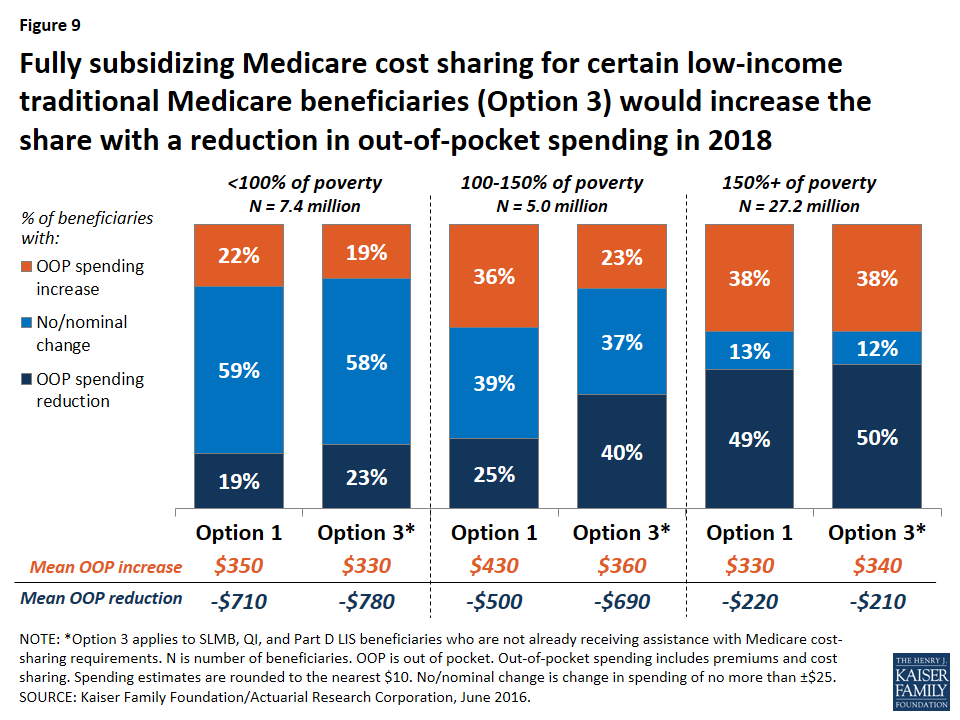
Figure 9: Fully subsidizing Medicare cost sharing for certain low-income traditional Medicare beneficiaries (Option 3) would increase the share with a reduction in out-of-pocket spending in 2018
Although “near poor” beneficiaries are the intended target group for the low-income subsidies option—specifically, beneficiaries enrolled in SLMB, QI, and Part D LIS, the vast majority of whom have incomes below 150 percent of poverty and limited assets—the analysis still shows that some low-income beneficiaries are expected to see higher costs under Option 3. This is because, as modeled, the option does not provide cost-sharing subsidies to all beneficiaries with incomes below 150 percent of poverty, such as those who are eligible for but not receiving SLMB, QI, or LIS, and those who are eligible for these programs based on their incomes but whose assets are too high to qualify. The model also assumes no woodwork effect and does not account for a potential increase in enrollment in SLMB, QI, or LIS from beneficiaries who are eligible but not currently enrolled. Providing full Medicare cost-sharing subsidies to more low-income beneficiaries would reduce the share of beneficiaries facing higher costs under this option, though it would also increase federal spending relative to the effects we observed (see the discussion of spending effects below).
Option 3, the low-income subsidies option, would lead to more modest improvements for those below 100 percent of poverty, because many (although not all) of these beneficiaries already receive assistance with Medicare’s cost-sharing requirements through Medicaid or Medicare Savings Programs. Not surprisingly, providing additional cost-sharing assistance to low-income beneficiaries would not substantially affect out-of-pocket spending changes among beneficiaries with incomes above 150 percent of poverty, relative to the basic benefit redesign option, because eligibility for SLMB, QI, and Part D LIS generally extends only to beneficiaries with incomes up to 150 percent of poverty.
Expected effects on aggregate spending. Adding low-income protections to the modified benefit design would increase aggregate beneficiary savings (from -$0.7 billion under the basic benefit redesign option to -$1.9 billion under the low-income subsidies option) but generate lower net federal savings (-$0.6 billion under the low-income subsidies option versus -$5.5 billion under the basic benefit redesign option) (see Table 2 above). In contrast to the basic benefit redesign option, total Medicare spending would increase under the low-income subsidies option (from a -$3.0 billion reduction under Option 1 to a $1.8 billion increase under Option 3)—and it would have increased by an even larger amount had we modeled the participation of a larger group of low-income beneficiaries beyond those receiving SLMB, QI, or Part D LIS.3 However, as modeled, it would still be the case that federal Medicaid spending would decrease under Option 3, more than offsetting the increase in aggregate Medicare spending. And with lower-income beneficiaries expected to use more services due to the new cost-sharing subsidies, net health care savings would be lower under the low-income subsidies option compared to the basic benefit redesign option (-$5.9 billion versus -$8.8 billion).
Option 4: Income-related deductible and cost-sharing limit
Expected effects on out-of-pocket spending. Compared to the basic benefit redesign option, Option 4, with income-related deductibles and cost-sharing limits, would decrease the share of traditional beneficiaries overall who are expected to face a spending reduction by nearly 20 percentage points (from 40 percent under the basic benefit redesign option to 21 percent under the income-related option) and increase the share expected to face no or a nominal change in spending by the same amount (from 25 percent to 44 percent), while having no effect on the share expected to face a spending increase (see Figure 6 above).
The effects of the income-related benefit design option would vary by income group, as designed. Option 4 would help a larger number of low-income beneficiaries than Option 3, the low-income subsidies option, because, as modeled, the lowest levels of the deductible and cost-sharing limit ($325/$3,350) under Option 4 would apply to all traditional Medicare beneficiaries with incomes less than 150 percent of poverty, regardless of assets or supplemental coverage status, as opposed to just a subset of low-income beneficiaries who would receive subsidies under Option 3. But those low-income beneficiaries who receive full Medicare cost-sharing subsidies under Option 3 would not benefit as much from the income-related benefit design (Option 4), since they would still face some cost-sharing responsibility under the income-related option.
Lower-income beneficiaries would be helped somewhat more under the income-related option than under the basic benefit redesign option (Table 5). This is due to the lower deductible and cost-sharing limit they would face relative to higher-income beneficiaries under the income-related option. In particular, a somewhat smaller share of beneficiaries with incomes below 100 percent of poverty and between 100-150 percent of poverty are expected to see an increase in out-of-pocket spending under the income-related option than under the basic benefit redesign option (18 percent versus 22 percent, and 30 percent versus 36 percent, for the two income groups respectively). But for beneficiaries with incomes between 100-150 percent of poverty, an even smaller share (23 percent) would face a spending increase under the low-income subsidies option (Option 3).
A smaller share of beneficiaries with incomes below 150 percent of poverty are expected to see a spending reduction under the income-related option compared to the basic benefit redesign option (although the average spending reduction would be larger), while a larger share of low-income beneficiaries would face no or a nominal change in spending. The reason for this is that the Part B premium would not fall as much under the income-related option than under the basic benefit redesign option (-$20 versus -$50) because aggregate Part B spending would be larger under the income-related option and premiums are set to cover a portion of total Part B spending. For some low-income beneficiaries, the benefit of having the lower deductible and cost-sharing limit under the income-related option compared to the basic benefit redesign option would more than offset the higher Part B premium. For others, such as those who use relatively few services, the higher Part B premium under the income-related option would be the more relevant factor in determining their change in cost sharing relative to current law.
| Table 5: Distribution of Traditional Medicare Beneficiaries by Poverty Level, by Change in Expected Annual Out-of-Pocket Spending and Average Change in Spending Under Four Medicare Benefit Design Options in 2018 | |||||||
| Percent of beneficiaries by change in OOP spending | % of poverty | Option 1 Basic benefit redesign option |
Option 2 Lower deductible/cost-sharing limit option |
Option 3 Low-income subsidies option |
Option 4 Income-related option |
||
| Reduction | <100% | 19% | 19% | 23% | 16% | ||
| 100-150% | 25% | 31% | 40% | 20% | |||
| 150%+ | 49% | 48% | 50% | 22% | |||
| No/nominal change1 | <100% | 59% | 64% | 58% | 66% | ||
| 100-150% | 39% | 43% | 37% | 50% | |||
| 150%+ | 13% | 26% | 12% | 37% | |||
| Increase (all >$25) | <100% | 22% | 18% | 19% | 18% | ||
| 100-150% | 36% | 26% | 23% | 30% | |||
| 150%+ | 38% | 27% | 38% | 41% | |||
| Average change in OOP spending | |||||||
| Reduction | <100% | -$710 | -$1,010 | -$780 | -$1,220 | ||
| 100-150% | -$500 | -$590 | -$690 | -$840 | |||
| 150%+ | -$220 | -$360 | -$210 | -$420 | |||
| Increase (all >$25) | <100% | $350 | $310 | $330 | $280 | ||
| 100-150% | $430 | $380 | $360 | $320 | |||
| 150%+ | $330 | $320 | $340 | $320 | |||
| NOTE: OOP is out of pocket. Out-of-pocket spending includes premiums and cost sharing. Spending estimates rounded to nearest $10. 1No/nominal change is change in spending of no more than ±$25. SOURCE: Kaiser Family Foundation/Actuarial Research Corporation, June 2016. |
|||||||
Expected effects on aggregate spending. Although aggregate beneficiary spending would be similar under the basic benefit redesign option and the income-related option (-$0.7 billion and -$0.9 billion, respectively), introducing an income-related deductible and cost-sharing limit would erase net federal savings (from a $5.5 billion reduction under the basic benefit redesign option to an increase of $0.3 billion under the income-related option). This is the result of Medicare paying for a much greater share of spending above the new cost-sharing limit for a subset of low-income beneficiaries. While this would help some low-income beneficiaries, it would simply displace Medicaid spending for certain dually eligible beneficiaries (with the reduction in Medicaid spending being divided between the states and the federal government). Finally, because aggregate beneficiary cost sharing would be lower under the income-related option relative to the basic benefit redesign option, it is expected that beneficiaries would use more services under the income-related option. The net effect would be to lower total health care savings (from -$8.8 billion under the basic benefit redesign option to -$6.1 billion under the income-related option), as was also the case under the lower deductible and cost-sharing limit option (Option 2) and the low-income subsidies option (Option 3).
Limitations and Assumptions
Limitations
An important limitation of this single-year analysis is that it does not consider or evaluate the potential long-term effects on health outcomes or the long-term spending effects of the Medicare benefit design options. Our model incorporates the assumption that as beneficiary cost sharing increases, beneficiaries would use fewer services, which could produce short-term savings to Medicare but which could also result in poor (or worse) health outcomes—thereby increasing costs to Medicare over the longer term. It is outside the scope of our analysis to determine whether beneficiaries would forgo necessary or unnecessary services, and the extent to which this would affect their health or expenses over the longer term, but previous research has suggested the existence of secondary (and unintended) effects of increasing cost sharing on both patients and insurers.1 For example, Trivedi and coauthors found that Medicare Advantage plans that nearly doubled copayments for ambulatory care experienced increases in hospitalizations, especially for enrollees with certain chronic conditions.2 Chandra and coauthors also found increases in hospitalizations after a large retiree health plan introduced copayments for physician services and increased copayments for pharmaceuticals.3 We also do not evaluate or incorporate any potential substitution effects that might offset certain reductions in utilization. For instance, beneficiaries who use fewer home health services because of new cost sharing might use more physical therapy or physician visits.
Based on the available evidence, it was not possible to model these longer-term effects with any degree of confidence. As a result, our model may overestimate the amount of savings to Medicare and underestimate the cost to beneficiaries that could result from increased cost sharing in the long run—for instance, if beneficiaries simply substitute some types of care for other services, or if their health deteriorates, requiring additional care in the future. At the same time, the single-year analysis could underestimate the share of beneficiaries with high out-of-pocket costs who could experience spending reductions associated with the new annual cost-sharing limit.4 These are important areas to explore in future research.
MEPS does not include beneficiaries in long-term care facilities, a group that tends to use a relatively large amount of services. Therefore, our model may understate the number of beneficiaries who would benefit from a cost-sharing limit. Another caveat is that many beneficiaries in long-term care facilities are dually eligible for Medicaid and Medicare. As a result, our model may understate the effects on Medicaid spending associated with the benefit redesign options. Altogether, only 5 percent of Medicare beneficiaries are in long-term care facilities, so we do not expect that including this population would have a substantial effect on our outcomes.
Assumptions
Modeling programmatic and policy reforms involves some degree of uncertainty and invariably requires a number of assumptions that may oversimplify individual decisions and responses, while averaging out variations in circumstances. We nonetheless took this approach to develop a greater understanding of the possible effects of reforming Medicare’s benefit design on beneficiaries and spending.
Full implementation in 2018. We modeled full implementation as of January 1, 2018 to assess the effects of Medicare benefit redesign options if implemented in one year, rather than phased in over time. We recognize the administrative challenges of implementing such changes by then. We also acknowledge possible legal issues associated with prohibiting first-dollar coverage for current Medigap policyholders rather than an approach that only applies to new policyholders (as in the new Medigap restrictions included in MACRA).
Changes in utilization. We assumed that an increase in cost sharing would cause beneficiaries to use fewer services (and vice-versa). To model this assumption, we used “induction factors” based on those used by the Health Care Financing Administration (HCFA, now the Centers for Medicare & Medicaid Services, or CMS), which in turn were based on the RAND Health Insurance Experiment. Specifically, for every $1 increase in cost sharing, we assumed that total spending would decline by $0.70 for physician and outpatient services, by $0.50 for home health care, and by $0.20 for inpatient hospital and SNF services.5
No changes in Medicaid eligibility. We assumed that Medicaid eligibility would not change under any of the benefit redesign options. State Medicaid programs currently pay all or a portion of Medicare’s cost-sharing requirements on behalf of beneficiaries who are enrolled in both programs. Because benefit redesign would alter beneficiaries’ cost-sharing obligations, it would subsequently affect Medicaid expenditures. For example, introducing a cost-sharing limit would shift spending from Medicaid to the Medicare program. If Medicaid programs chose to scale back coverage for optional populations in response to these changes, then our analysis would understate the spending effects of these options for low-income beneficiaries.
No erosion of employer-sponsored or other supplemental coverage. We assumed that the benefit redesign options would not affect the share of enrollees’ cost-sharing liabilities (including premiums, if applicable) covered by ESI and other supplemental coverage. We also assumed that the options would not affect employer offer rates or take-up rates by retirees. If some employers decided to drop retiree health benefits altogether, retirees would likely incur higher out-of-pocket costs and subsequently use fewer services, resulting in a decrease in Medicare spending. The magnitude of the effect on employer spending would depend on how much employers reduced coverage and how many employers did so. If employers or other supplemental payers were to make changes in coverage by shifting some, if not all, of the additional cost-sharing requirements onto beneficiaries—and therefore no longer covered the same share of beneficiary spending as under current law—we would expect savings to supplemental insurers and higher costs for beneficiaries with this coverage, relative to the effects we observe.
No effect on retirement decisions. We assumed the benefit redesign options would not affect retirement decisions in the short term. If changes in Medicare’s benefit design prompted workers to delay retirement and remain covered by employer-sponsored insurance as their primary source of coverage, out-of-pocket spending would decline for younger workers if their employer policies’ cost-sharing rules are more generous than the redesigned Medicare benefit, and Medicare spending would decline somewhat if Medicare then became the secondary payer for these workers rather than the primary payer. In this case, employer costs could increase.
Changes in Medicare Advantage and Medigap enrollment. We assumed that changing traditional Medicare’s benefit design—most importantly, with the addition of an annual cost-sharing limit—would lead to changes in Medicare Advantage and Medigap enrollment. Our switching assumptions are shown in Table 6. We used the estimates in the third column (“benefit redesign plus Medigap coverage restrictions”) for all four options in this report.
| Table 6: Share of Medicare Advantage and Medigap Enrollees Switching Coverage Under Medicare Benefit Redesign Options in 2018 | |||
| Benefit redesign only | Medigap coverage restrictions only | Benefit redesign plus Medigap coverage restrictions | |
| % of Medicare Advantage enrollees switching to traditional Medicare | 2.4% | No effect | 2.4% |
| % of Medigap enrollees switching to traditional Medicare | 2.4% | 0.8% | 3.2% |
| % of Medigap enrollees switching to Medicare Advantage | No effect | 3.1% | 3.2% |
| SOURCE: Kaiser Family Foundation/Actuarial Research Corporation, June 2016. | |||
The switching assumptions are expressed as a percent of current law enrollment in that supplemental type. The pool of possible switchers consists of an estimated 36.4 million beneficiaries in 2018: 21.3 million Medicare Advantage enrollees (58 percent of the pool), 9.5 million Medigap enrollees (26 percent), and 5.7 million traditional Medicare beneficiaries with no supplemental coverage (16 percent).
The literature does not provide clear guidance on how to establish these “switching” parameters. Our estimates are based on the reasoning described below.
- Enrollment switches under Medicare benefit redesign. One reason why beneficiaries might choose to purchase Medigap coverage or enroll in Medicare Advantage is that traditional Medicare currently lacks protection from catastrophic medical expenses through a cost-sharing limit. Thus, we assume that adding a cost-sharing limit to traditional Medicare would induce a small share of Medigap enrollees to disenroll (2.4 percent) and a small share Medicare Advantage enrollees to switch to traditional Medicare (2.4 percent).
- Enrollment switches under Medigap coverage restrictions. Because the restrictions would only apply to Medigap, we assume that some Medigap enrollees (3.1 percent) would switch to Medicare Advantage where they would still have the option of paying a premium (as applicable) for more generous coverage. We also assume that because some beneficiaries purchase Medigap policies in order to avoid the hassle of paying medical bills directly, a small share of Medigap enrollees (0.8 percent) would drop this coverage and revert to traditional Medicare only if coverage restrictions were imposed on Medigap plans.
- Enrollment switches under the combined options. For all four options in this report that combine benefit redesign plus Medigap coverage restrictions, we added the estimates for each separate option and increased the total slightly to incorporate the effects of compounding.
In general, we do not expect Medicare benefit redesign options to have a dramatic effect on switching between coverage types. Because the switching effects we modeled are small relative to overall Medicare enrollment, even moderate changes in these assumptions are not likely to affect the direction of or conclusions drawn from our main outcomes of interest. However, if a larger share of Medigap enrollees drop their Medigap policies and switched to traditional Medicare only (or to Medicare Advantage) in response to the modified benefit design, then federal savings would be of larger magnitude, while more beneficiaries would see spending reductions since the former Medigap policyholders would no longer be paying Medigap premiums. If a larger share of Medicare Advantage enrollees switched to traditional Medicare, then we would expect to see greater federal savings, to the extent that payments made to Medicare Advantage plans are slightly higher than what traditional Medicare would pay per beneficiary. It is not possible to quantify more specifically what spending effects we would observe under different switching assumptions. The magnitude of the effect on spending would depend on the specific benefit design option under consideration, since the overall effects are highly sensitive to design details, such as the deductible amount and the cost-sharing limit, for example.
Take-up of new subsidies for low-income beneficiaries. We assume that all Medicare beneficiaries who are SLMBs, QIs, and Part D LIS enrollees who are not already receiving full cost-sharing assistance from Medicaid or Medicare Savings Programs would automatically receive the new 100 percent cost-sharing subsidies. However, Option 3, as modeled, does not subsidize all low-income Medicare beneficiaries. We did not include other low-income beneficiaries who might be eligible for but are not enrolled in SLMB, QI, or LIS, and beneficiaries with incomes below 150 percent of poverty but assets above program eligibility thresholds. Including these low-income beneficiaries would increase federal spending on this option relative to the current effects estimated by the model, but would also increase the share of low-income beneficiaries who would experience spending reductions under the modified benefit design that includes low-income subsidies.
Discussion
This report examines the effects on beneficiaries and spending of a proposal to modify the benefit design of traditional Medicare and place restrictions on “first-dollar” supplemental Medigap coverage that is frequently raised in the context of federal budget and Medicare reform discussions. The analysis also examines the effects of alternative approaches, including lowering or income-relating the deductible and cost-sharing limit, and providing cost-sharing subsidies to a subset of low-income beneficiaries.
Our analysis of the four options that we modeled shows that each would reduce out-of-pocket spending by some beneficiaries in traditional Medicare but increase spending by others, with variation in expected spending depending on the deductible and cost-sharing limits specified under each option and whether additional financial protections are provided to low-income beneficiaries. In our analysis, beneficiaries with lower incomes fared relatively poorly compared to higher-income beneficiaries under the basic modified benefit design, as measured by the effect on their out-of-pocket costs. Subsidizing Medicare cost sharing for a subset of low-income beneficiaries would reduce the spending burden for these beneficiaries associated with changes to Medicare’s benefit design, but the tradeoff is that federal savings would not be as large as under the modified benefit design alone.
The effects on beneficiaries’ spending would also depend on their use of services. In general, adding a cost-sharing limit would provide valuable financial protection to a relatively small share of the Medicare population that incurs catastrophic expenses in any given year, although a larger share of beneficiaries would be helped by this provision over multiple years.1 The single deductible for Parts A and B would reduce the deductible amount paid by the relatively small share of sicker beneficiaries who are hospitalized in any given year, but would increase the deductible amount for the majority of healthier beneficiaries who use physician and outpatient services, but who are not hospitalized in any given year. The expected reduction in out-of-pocket spending for relatively sicker beneficiaries would be substantial compared to current law, while the increase in spending for relatively healthier beneficiaries would be more modest.
Overall, our analysis shows that savings to the federal government can be achieved by modifying Medicare’s benefit design in part by shifting spending onto beneficiaries in the form of higher cost sharing, such as by charging a higher deductible for Part B-covered services relative to current law. Higher beneficiary cost sharing also would likely lead beneficiaries to use fewer services, which would produce federal savings. Conversely, federal savings would not be as large under more generous alternatives to the modified benefit design that offer greater financial protections to some low-income beneficiaries, and there would likely be an increase in federal spending if these protections were extended to a larger group of low-income beneficiaries than we modeled in our analysis. And federal spending can be expected to increase substantially compared to current law when the deductible is set at a relatively low level and when greater protection is extended to beneficiaries with high costs in the form of a lower cost-sharing limit.
Policy Implications
Our analysis shows the expected effects of a set of four specific Medicare benefit design options, and these options could be modified by policymakers in any number of ways, with the expected effects likely to vary depending on the specific benefit design decisions that are made. Indeed, our analysis shows that the aggregate effects on spending—overall, and for beneficiaries, Medicare, and other payers, including Medicaid and employers—depend on the specific features of the four benefit design options we modeled, such as the amount of the deductible and cost-sharing limit, whether additional financial protections are provided to low-income beneficiaries (and how many low-income beneficiaries receive subsidies), and whether the deductible and cost-sharing limit vary by income. Aggregate and individual-level savings would also vary depending on policy decisions made with regard to the treatment of supplemental coverage, and whether the restrictions imposed on the generosity of supplemental coverage are relatively tight or loose.2
Drawing on the results of our analysis, policymakers could choose to mitigate some of the less desirable effects of implementing a modified Medicare benefit design in several ways. For example, to avoid a large increase in the deductible that would otherwise be incurred by the majority of relatively healthy beneficiaries for Part B-covered services, policymakers could exempt current beneficiaries from the cost-sharing changes under the modified benefit design and phase it in over time for people who gain Medicare eligibility in the future. A phased-in approach to implementation would ease the financial impact on beneficiaries associated with shifting to the new benefit design, but would reduce shorter-term savings to Medicare and introduce a layer of complexity in administering a program with different sets of cost-sharing rules applied to different cohorts of beneficiaries in traditional Medicare.
In our analysis, beneficiaries with lower incomes fared relatively poorly compared to higher-income beneficiaries under the basic modified benefit design, as measured by the effect on their out-of-pocket costs. To mitigate the cost impact for beneficiaries with lower incomes, policymakers could consider providing additional financial assistance in the form of Medicare cost-sharing subsidies, similar to the approach used in the Part D LIS program, or charging income-related deductibles and cost-sharing limits. This latter approach provides greater financial protection to beneficiaries with lower incomes and less financial protection to those with higher incomes, but implementing income-related Medicare benefits could pose operational challenges, making Medicare potentially more complex for beneficiaries to understand and for the government to administer.3
Providing subsidies for Medicare cost sharing to low-income beneficiaries would offer valuable financial assistance to a vulnerable population. However, Option 3, as modeled, does not subsidize all low-income Medicare beneficiaries. We did not include those who might be eligible for but are not enrolled in SLMB, QI, or LIS, and beneficiaries with incomes below 150 percent of poverty but assets above program eligibility thresholds. With older research showing only a small share of eligible beneficiaries enrolled in Medicare’s existing subsidy programs,4 providing financial protections for low-income beneficiaries under a modified Medicare benefit design may be more effective if done in conjunction with an outreach campaign to identify as many eligible beneficiaries as possible. Including more low-income beneficiaries than we modeled, however, would increase federal spending on this option relative to the current effects estimated by the model. But it would offer important financial protections for many beneficiaries who might otherwise face spending increases they could not afford in the absence of cost-sharing subsidies.
Adding an annual cost-sharing limit would be a significant improvement to the traditional Medicare program, and would level the playing field between traditional Medicare and Medicare Advantage. Even so, under current proposals, the limit applies only to costs for services covered under Parts A and B, not to costs under the Part D drug benefit. Part D has a separate catastrophic coverage threshold ($4,850 in out-of-pocket costs in 2016), above which beneficiaries are required to pay 5 percent of their total drug costs. If Medicare were to maintain two separate cost-sharing limits, one for Parts A and B and another for Part D, the modified benefit design would be out of step with the catastrophic coverage protections required for Marketplace plans today, which limit annual cost sharing under individual policies to $6,850 in 2016.
Conclusion
Our analysis shows that proposals to modify Medicare’s benefit design have the potential to produce federal and Medicare savings, reduce aggregate beneficiary spending, and reduce spending by other payers, including spending by employers for retiree health plans and by states on behalf of beneficiaries who are dually eligible for Medicare and Medicaid. Such proposals could also simplify the program, provide beneficiaries with valuable protection against catastrophic expenses, add additional financial protections for low-income beneficiaries, and reduce the need for beneficiaries to purchase supplemental insurance. As this analysis demonstrates, however, it will be difficult for policymakers to achieve all of these ends simultaneously.
Juliette Cubanski, Tricia Neuman, and Gretchen Jacobson are with the Kaiser Family Foundation. Zachary Levinson is an independent consultant. Monica Brenner and James Mays are with Actuarial Research Corporation.
Appendix
Appendix: Methodology
Data
The model’s primary data source is the 2009-2012 Medical Expenditure Panel Survey (MEPS), an annual survey of households and medical providers conducted by the Agency for Healthcare Research and Quality. This dataset includes individual-level information on demographics, income, health status and conditions, use of medical care, health expenses, and insurance coverage for nonelderly and elderly people. We supplemented the MEPS-based analysis with 2009-2011 data from the Medicare Current Beneficiary Survey (MCBS), a nationally representative survey of Medicare beneficiaries sponsored by the Centers for Medicare & Medicaid Services, to impute additional information where needed (for example, for SNF use and spending) and to validate some of our results (for example, the spending distribution by payer).
Although MEPS includes Medicare beneficiaries who are enrolled in Medicare Advantage, we excluded this group when evaluating the individual-level spending effects of the benefit design options because the options modify traditional Medicare. The model does incorporate indirect effects on aggregate Medicare Advantage spending and enrollment, based on the assumptions that changes in traditional Medicare reimbursement would be reflected in Medicare Advantage payments, and that aggregate Medicare Advantage payments will change to the extent that some beneficiaries switch between traditional Medicare and Medicare Advantage.
We aligned the poverty distribution to conform to the income and poverty distribution in the 2011 DYNASIM microsimulation model developed by researchers at The Urban Institute, with additional refinements using a CBO distribution of Part B enrollees by poverty status and Medicaid enrollment from 2004. We estimated the number of enrollees in the Medicare Savings Programs (with and without Medicaid) and the Part D Low Income Subsidy (LIS) program, using the Chronic Conditions Data Warehouse (2011 data) and CBO total enrollment counts, to determine the number of beneficiaries receiving cost-sharing assistance versus assistance with their Part B and/or Part D premiums only, projected to 2018, in order to model the effects of options to extend additional financial protections to low-income beneficiaries in traditional Medicare.
We used MEPS to assign beneficiaries to one of five supplemental coverage groups: 1) traditional Medicare only; 2) Medicaid; 3) employer-sponsored insurance (ESI), including TRICARE; 4) Medigap; and 5) other insurers, including Veterans’ Administration (VA), Indian Health Service, Worker’s Compensation, other federal, state, and local sources, and unclassified/unknown sources. Beneficiaries who listed more than one supplemental insurer were assigned to the coverage source they had for the most months during the calendar year. Enrollment estimates under the current-law baseline and the four options are provided in Table A1.
Calculating changes in cost sharing
The analysis looks exclusively at spending associated with Medicare-covered services. We excluded spending on non-Medicare covered services—such as dental care and other specific procedures, providers, or visit types that Medicare does not cover—from the MEPS data prior to conducting the analysis. As a survey of the non-institutionalized population, MEPS also does not include data for long-term services and supports. We began by estimating, at the individual level, what share of Medicare-covered services would be covered by the beneficiary and what share would be covered by each payer under current law in 2018. We controlled the MEPS Medicare channel of payment (i.e., Medicare reimbursement) by service to data from the August 2015 update1 of the CBO March 2015 Medicare baseline2 for Medicare benefits spending, with refinements at the
| Table A1: Enrollment in Traditional Medicare, Medicare Advantage, and Other Types of Coverage under Current Law and Four Medicare Benefit Design Options if Fully Implemented in 2018 | |||||
| Enrollment (in millions) | Current law | Option 1 Basic benefit redesign option |
Option 2 Lower deductible/cost-sharing limit option |
Option 3 Low-income subsidies option |
Option 4 Income-related option |
| Total | 61.2 | 61.2 | 61.2 | 61.2 | 61.2 |
| Traditional Medicare1 | 40.0 | 40.2 | 40.2 | 40.2 | 40.2 |
| Employer (including TRICARE) | 15.1 | 15.1 | 15.1 | 14.4 | 15.1 |
| Medigap | 9.5 | 8.9 | 8.9 | 8.9 | 8.9 |
| Medicaid | 7.8 | 7.8 | 7.8 | 7.8 | 7.8 |
| Other | 1.9 | 1.9 | 1.9 | 1.5 | 1.9 |
| None (traditional Medicare only) | 5.7 | 6.5 | 6.5 | 5.3 | 6.5 |
| New low-income subsidies2 | N/A | N/A | N/A | 2.3 | N/A3 |
| Medicare Advantage | 21.3 | 21.1 | 21.1 | 21.1 | 21.1 |
| NOTE: N/A is not applicable. 1The number of traditional Medicare beneficiaries under Options 1-4 includes 0.5 million beneficiaries who switch from Medicare Advantage to traditional Medicare, but who are not included in the analysis of individual-level cost-sharing effects due to differences in the cost-sharing structure of each coverage type. 2Applies to beneficiaries enrolled in SLMB, QI, and Part D LIS who are not already receiving assistance with Medicare cost-sharing requirements from Medicaid or Medicare Savings Programs. 3Beneficiaries with incomes below 150 percent of poverty would have a lower deductible and cost-sharing limit under Option 4 than those with higher incomes. SOURCE: Kaiser Family Foundation/Actuarial Research Corporation, June 2016. |
|||||
service and aged/disabled level (where available) based on the 2015 Medicare Trustees report3 and the 2013 Medicare & Medicaid Statistical Supplement.4 Total covered charges for each service in the record are then calculated based on the controlled Medicare reimbursement amount and the cost sharing for the service corresponding to the utilization data in the record. In this way, spending for each record is limited to Medicare-covered services only. The cost sharing (total covered charges minus Medicare spending) is distributed across the beneficiary and third-party payers according to their respective shares of total cost sharing for that service. To determine an individual’s out-of-pocket spending liability, we applied Medicare cost-sharing rules under current law to each beneficiary’s spending to divide the amount between Medicare and the beneficiary. Next, cost-sharing obligations were distributed among beneficiaries and supplemental insurers based on the share covered by each in the baseline.
We then applied alternative cost-sharing requirements under the Medicare benefit redesign options to determine shifts in the amount and distribution of spending for Medicare, beneficiaries, and other payers. (See the last section in this appendix for an example of how we model changes in the distribution of cost sharing under current law versus benefit redesign.) We first calculated the impact of the new cost-sharing rules on each individual’s exposure to cost sharing holding utilization constant. We also subject any increased cost sharing to the supplemental insurance the individual has, assuming insurers pay the same percentage of cost sharing under the benefit redesign options that they pay under current law. We then adjusted these calculations to account for changes in utilization and spending that would be expected to occur in response to cost-sharing changes, based on research showing that individuals tend to reduce their use of services, and thereby their spending, when their exposure to cost sharing increases (and vice-versa). The magnitude of these adjustments are described below. After making these adjustments and determining the new spending levels for each beneficiary, we recalculated the share of spending covered by each payer.
Because Medicaid is jointly-financed by the federal and state governments, we divided spending between the two payers based on current average spending patterns, with the federal government covering 57 percent of Medicaid spending on average and states covering the remaining 43 percent.5
Calculating changes in premiums
We estimated total spending by Medigap plans on Medicare-covered services and derived an expected average premium using current administrative expense loads and profit rates. We adopted a similar approach for ESI premiums, using a different administrative expense load and assuming employers would pick up half of the additional expenses, with the other half converted into a base premium. Using data from the Person Round Plan (PRPL) file in MEPS, we looked at deciles of Medigap and ESI premium amounts and used this information to make adjustments to the base premiums. We then randomly distributed these varying levels of premiums to enrollees’ records. It is important to note that for the purposes of this analysis, our emphasis is on the magnitude of changes in out-of-pocket spending (including premiums), rather than on absolute levels.
Medicare Part B premiums. Part B premiums are adjusted annually to cover 25 percent of the total predicted Part B costs for that year. However, the actual amount of premiums paid by enrollees is complicated by issues such as the income-related premium. We thus determined the Part B premium under modified benefit design options by adjusting the total premiums paid—taken from the CBO March 2015 Medicare Baseline, adjusted for the August 2015 update—by the percent change in Part B spending calculated by the model. The Part B premium was then adjusted to reflect beneficiaries’ incomes. We used a similar adjustment to CBO’s estimate for the federal share of premiums paid by Medicaid on behalf of beneficiaries dually eligible for Medicare and Medicaid.6
Supplemental insurance premiums. For supplemental insurance, we calculated premiums based on the insurers’ total spending on Medicare-covered services and related administrative expenses.
- Medigap: Medigap plans were assumed to set premiums in order to cover Medigap costs (including administrative expenses) as well as a constant rate of profit. Thus, the Medigap premium was simply total Medigap expenses divided by the number of enrollees.
- Employer-sponsored coverage: Employers were assumed to cover half of their employees’ expenses. The other half was converted into a uniform premium.
- TRICARE, Medicaid, and other insurers: We assumed no premiums for these groups. TRICARE does not charge its enrollees a premium, and premiums are prohibited for most Medicaid enrollees. We also assumed that other supplemental insurers do not charge a premium because this category is primarily VA, Worker’s Compensation, and other federal and state programs.
- Administrative expenses. For every dollar of spending, we assumed that payers would spend the following amounts on administrative costs: $0.017 and $0.015 for Medicare Part A and Part B, respectively; $0.052 for Medicaid; $0.25 for Medigap; $0.15 for ESI; and $0.10 for TRICARE and other insurers. These figures are based on the 2015 Trustees Report, CBO’s March 2015 Medicare Baseline, and data from the National Association of Insurance Commissioners (NAIC). Because administrative expenses vary by payer, benefit redesign options that change the distribution of spending also change total administrative costs. For instance, an option that shifts spending from Medicare to Medigap plans would also increase administrative expenses because the latter spends more on administration than the former.
Modeling changes in the distribution of cost sharing under current law versus a modified Medicare benefit design
Suppose we have a record for a Medicare beneficiary enrolled in an employer-sponsored retiree health plan who has one inpatient stay under 60 days, two primary care physician (PCP) visits, and three specialist visits. Under current law, total costs for these services are distributed among payers as follows (Table A2):
| Table A2: Example of Distribution of Total Costs Under Current Law in 2018 | ||||
| Total spending | Medicare spending | Beneficiary out-of-pocket spending |
Private spending | |
| Inpatient services | $10,500 | $9,124 | $688 | $688 |
| Physician services | $3,500 | $2,663 | $83.68 | $753.12 |
| TOTAL | $14,000 | $11,787.20 | $771.68 | $1,441.12 |
| SOURCE: Kaiser Family Foundation/Actuarial Research Corporation, June 2016. | ||||
Under current law, for inpatient services, this beneficiary is responsible for the Part A deductible ($1,376 in 2018, according to the 2015 Medicare Trustees Report), which the MEPS record shows is split evenly between beneficiary out-of-pocket and private spending ($688 each). For physician services, the beneficiary is responsible for the Part B deductible ($171 in 2018, according to the 2015 Medicare Trustees Report), along with 20 percent of costs above the deductible: (($3,500 – $171) x 0.2) + $171 = $836.80. The MEPS record shows that the beneficiary pays 10 percent ($83.68) and the employer plan pays the rest ($753.12).
To model the Medicare benefit redesign with a single A/B deductible of $650, a $6,700 cost-sharing limit, and varying copayments by service, we first apply the $650 deductible amount to inpatient services only, since physician visits are exempt from the deductible.
The cost-sharing amount for inpatient services is $750 per inpatient stay. For physician services, cost sharing is $25 for each of the two PCP visits plus and $50 for each of the three specialist visits for a total of
(2 x $25) + (3 x $50) = $200. Adding the deductible to the inpatient copayment produces a total cost sharing for inpatient of $650 + $750 = $1,400. Note that if other services had been used, the combined deductible would have been split pro-rata across the applicable services. This method enables us to retain the underlying cost-sharing distributions for each service as well as apply induction effects by service.
For inpatient services, the total cost sharing is split evenly, as under current law, between beneficiary out-of-pocket and private spending ($700 each), and for physician services, 10 percent ($20) of the cost sharing is paid out of pocket (as per the MEPS record under current-law cost-sharing rules). Thus, under the new benefit design, the beneficiary’s total costs would be distributed among payers as follows (Table A3):
| Table A3: Example of Distribution of Total Costs Under Medicare Benefit Redesign in 2018 | ||||
| Total spending | Medicare spending | Beneficiary out-of-pocket spending |
Private spending | |
| Inpatient services | $10,500 | $9,100 | $700 | $700 |
| Physician services | $3,500 | $3,300 | $20 | $180 |
| TOTAL | $14,000 | $12,400 | $720 | $880 |
| SOURCE: Kaiser Family Foundation/Actuarial Research Corporation, June 2016. | ||||
Endnotes
Executive Summary
A Better Way: Our Vision for a Confident America, June 22, 2016, available at http://abetterway.speaker.gov/_assets/pdf/ABetterWay-HealthCare-PolicyPaper.pdf.
In this report, the word ‘poverty’ is used to refer to the federal poverty guidelines.
Kaiser Family Foundation/MedPAC, "An Analysis of the Share of Medicare Beneficiaries Who Would Benefit from an Annual Out-of-Pocket Maximum under Traditional Medicare Over Multiple Years," June 2013, available at https://www.kff.org/medicare/issue-brief/analysis-of-share-of-medicare-beneficiaries-who-would-benefit-from-out-of-pocket-maximum-over-multiple-years/.
Report
Introduction
A Better Way: Our Vision for a Confident America, June 22, 2016.
An alternative approach would add enhanced Medicare benefits as a separate part of the program, sometimes referred to as Medicare Part E, Medicare Extra, or Medicare Essential. See, for example, Karen Davis et al., “Medicare Essential: An Option to Promote Better Care and Curb Spending Growth,” Health Affairs, May 2013.
Gretchen Jacobson, Christina Swoope, Tricia Neuman, and Karen Smith, “Income and Assets of Medicare Beneficiaries, 2014-2030,” Kaiser Family Foundation, September 2015, available at https://www.kff.org/medicare/issue-brief/income-and-assets-of-medicare-beneficiaries-2014-2030/.
Juliette Cubanski, Tricia Neuman, Zachary Levinson, Monica Brenner, and James Mays, Restructuring Medicare’s Benefit Design: Implications for Beneficiaries and Spending, Kaiser Family Foundation, November 2011, available at https://www.kff.org/medicare/report/restructuring-medicares-benefit-design/.
See, for example, Medicare Payment Advisory Commission (MedPAC), June 2012 Report to the Congress: Medicare and the Health Care Delivery System, Chapter 1: Reforming Medicare's Benefit Design, June 2012, available at http://www.medpac.gov/documents/reports/jun12_ch01.pdf.
See, for example, Moment of Truth Project, A Bipartisan Path Forward to Securing America’s Future, April 2013, available at http://www.momentoftruthproject.org/sites/default/files/Full%20Plan%20of%20Securing%20America's%20Future.pdf; Jonathan Gruber, “Restructuring Cost Sharing and Supplemental Insurance for Medicare,” in 15 Ways to Rethink the Federal Budget, The Hamilton Project, February 2013, available at http://www.hamiltonproject.org/assets/legacy/files/downloads_and_links/THP_15WaysFedBudget_Prop3.pdf.
See, for example, Bipartisan Policy Center, A Bipartisan Rx for Patient-Centered Care and System-Wide Cost Containment, April 2013, available at http://bipartisanpolicy.org/wp-content/uploads/sites/default/files/BPC%20Cost%20Containment%20Report.pdf.
See, for example, Bipartisan Policy Center, A Bipartisan Rx for Patient-Centered Care and System-Wide Cost Containment, April 2013.
MedPAC, Reforming Medicare’s Benefit Design, June 2012.
The actuarial value of the modified benefit design under Option 1 is roughly equivalent to the actuarial value of the current law benefit design under traditional Medicare. The per capita reimbursement is $10,149 under current law and $10,050 under Option 1, a difference of about -1 percent. Dividing benefits per capita by the associated covered charges, which change slightly from current to future law, the actuarial values for both Option 1 and Medicare’s current law benefit design are 85 percent.
The combined deductible for Part A and Part B services would be lower than the current-law deductible for Part A services but higher than the current-law deductible for Part B services.
This cost-sharing structure is similar to the illustrative benefit design put forward by MedPAC, based on the cost-sharing structure of Medicare Advantage plans. The cost-sharing amounts shown in Table 1 are not the same as suggested by MedPAC because they have been updated using trends in reimbursement by type of service to 2018 levels and to ensure cost-sharing neutrality under the modified benefit design, as under the MedPAC illustrative option. See MedPAC, Reforming Medicare’s Benefit Design, June 2012.
Beginning in 2020, MACRA prohibits the sale of Medigap policies that cover the Part B deductible for newly-eligible Medicare beneficiaries. In the 2015 Medicare Trustees report, the Part B deductible was projected to be $196 in 2020. Existing enrollees or currently eligible beneficiaries may keep or continue to be offered policies that cover the Part B deductible.
Hereafter, we use the word ‘poverty’ to refer to the federal poverty guidelines.
Each program has specific income and asset eligibility requirements. In some states, beneficiaries with incomes above 150 percent of poverty are eligible for SLMB.
Findings
Beneficiaries with higher incomes (more than $85,000 for individuals and $170,000 for married couples) pay a higher percentage of Part B program costs, ranging from 35 percent to 80 percent, depending on their incomes.
Supplemental insurance typically covers a portion of Medicare’s cost-sharing requirements, thereby reducing the additional costs that beneficiaries would otherwise pay when they seek medical care.
The model does not incorporate potential savings to Medicare associated with possible reductions in disproportionate share hospital (DSH) payments that might be made under current law on behalf of some low-income beneficiaries who would benefit from the cost-sharing subsidies under Option 3, due to the difficulty in estimating the possible magnitude of this effect.
Limitations and Assumptions
For a review of research on this subject, see Katherine Swartz, Cost-Sharing: Effects on Spending and Outcomes, Robert Wood Johnson Foundation, December 2010, available at http://www.rwjf.org/en/library/research/2011/12/cost-sharing--effects-on-spending-and-outcomes.html.
Amal Trivedi, Husein Moloo, and Vincent Mor, “Increased Ambulatory Care Copayments and Hospitalizations among the Elderly,” New England Journal of Medicine, January 2010.
Amitabh Chandra, Jonathan Gruber, and Robin McKnight, “Patient Cost-Sharing, Hospitalization Offsets, and the Design of Optimal Health Insurance for the Elderly,” National Bureau of Economic Research Working Paper Series, March 2007.
Kaiser Family Foundation/MedPAC, "An Analysis of the Share of Medicare Beneficiaries Who Would Benefit from an Annual Out-of-Pocket Maximum under Traditional Medicare Over Multiple Years," June 2013, available at https://www.kff.org/medicare/issue-brief/analysis-of-share-of-medicare-beneficiaries-who-would-benefit-from-out-of-pocket-maximum-over-multiple-years/.
See the American Academy of Actuaries, “Medical Savings Accounts: Cost Implications and Design issues,” May 1995, Table II-2A, available at http://www.actuary.org/pdf/health/msa_cost.pdf. We used a slightly more conservative estimate for inpatient care (0.2 instead of 0.3).
Discussion
Kaiser Family Foundation/MedPAC, "An Analysis of the Share of Medicare Beneficiaries Who Would Benefit from an Annual Out-of-Pocket Maximum under Traditional Medicare Over Multiple Years," June 2013, available at https://www.kff.org/medicare/issue-brief/analysis-of-share-of-medicare-beneficiaries-who-would-benefit-from-out-of-pocket-maximum-over-multiple-years/.
In an analysis not presented in this report, we modeled the addition of a 20 percent Medigap premium surcharge paid by policyholders in combination with the modified Medicare cost-sharing parameters under Option 1. The analysis showed that the surcharge would generate an estimated $3.0 billion in revenues in 2018, and, in conjunction with other changes to Medicare’s benefit design, would produce federal savings of $8.1 billion, relative to current law. Federal savings would be higher than under Option 1, which includes a restriction on Medigap coverage of the deductible, solely due to the surcharge revenues. In fact, Medicare savings are modestly lower with a Medigap premium surcharge than with Medigap coverage restrictions, because a coverage restriction is expected to lead Medigap policyholders to reduce their service use somewhat, but this would be less of a factor with a premium surcharge.
Juliette Cubanski, Tricia Neuman, and Zachary Levinson, “Adding an Out-of-Pocket Spending Maximum to Medicare: Implementation Issues and Challenges,” Kaiser Family Foundation, February 2014, available at https://www.kff.org/medicare/issue-brief/adding-an-out-of-pocket-spending-maximum-to-medicare-implementation-issues-and-challenges/.
Medicare Payment Advisory Commission, Report to the Congress: Medicare Payment Policy, Chapter 5, “Increasing Participation in the Medicare Savings Programs and the Low-Income Drug Subsidy,” March 2008, available at www.medpac.gov/documents/mar08_ entirereport.pdf.
Appendix
Appendix: Methodology
Congressional Budget Office, An Update to the Budget and Economic Outlook: 2015 to 2025, August 2015, available at https://www.cbo.gov/publication/50724.
Congressional Budget Office, “March 2015 Medicare Baseline,” March 9, 2015, available at https://www.cbo.gov/sites/default/files/51302-2015-03-Medicare.pdf.
2015 Annual Report of the Boards of Trustees of the Federal Hospital Insurance and Federal Supplementary Medical Insurance Trust Funds, July 2015.
Centers for Medicare & Medicaid Services, Medicare & Medicaid Statistical Supplement, 2013 Edition, available at https://www.cms.gov/Research-Statistics-Data-and-Systems/Statistics-Trends-and-Reports/MedicareMedicaidStatSupp/2013.html.
Current per 2013 Medicaid 64 (CMS administrative data).
Based on CBO estimates, we assume that federal Medicaid spending covers 57 percent of Part B premiums on behalf of Medicaid enrollees and states pay the rest. This is the same assumption we make about cost-sharing coverage.