How Much Is Enough? Out-of-Pocket Spending Among Medicare Beneficiaries: A Chartbook
Executive Summary
As part of efforts to rein in the federal budget and constrain the growth in Medicare spending, some policy leaders and experts have proposed to increase Medicare premiums and cost-sharing obligations. Today, 54 million people ages 65 and over and younger adults with permanent disabilities rely on Medicare to help cover their health care costs. With half of all people on Medicare having incomes of less than $23,500 in 2013, and because the need for health care increases with age, the cost of health care for the Medicare population is an important issue.1
Although Medicare helps to pay for many important health care services, including hospitalizations, physician services, and prescription drugs, people on Medicare generally pay monthly premiums for physician services (Part B) and prescription drug coverage (Part D). Medicare has relatively high cost-sharing requirements for covered benefits and, unlike typical large employer plans, traditional Medicare does not limit beneficiaries’ annual out-of-pocket spending. Moreover, Medicare does not cover some services and supplies that are often needed by the elderly and younger beneficiaries with disabilities—most notably, custodial long-term care services and supports, either at home or in an institution; routine dental care and dentures; routine vision care or eyeglasses; or hearing exams and hearing aids.
Many people who are covered under traditional Medicare obtain some type of private supplemental insurance (such as Medigap or employer-sponsored retiree coverage) to help cover their cost-sharing requirements. Premiums for these policies can be costly, however, and even with supplemental insurance, beneficiaries can face out-of-pocket expenses in the form of copayments for services including physician visits and prescription drugs as well as costs for services not covered by Medicare. Although Medicaid supplements Medicare for many low-income beneficiaries, not all beneficiaries with low incomes qualify for this additional support because they do not meet the asset test.
Because people on Medicare can face out-of-pocket costs on three fronts—cost sharing for Medicare-covered benefits, costs for non-covered services, and premiums for Medicare and supplemental coverage—it is important to take into account all of these amounts in assessing the total out-of-pocket spending burden among Medicare beneficiaries. Our prior research documented that many beneficiaries bear a considerable burden for health care spending, even with Medicare and supplemental insurance, and that health care spending is higher among older households compared to younger households.2
This new analysis builds on prior work to examine out-of-pocket spending among Medicare beneficiaries, including spending on health and long-term care services and insurance premiums, using the most current year of data available (2010) from a nationally representative survey of people on Medicare. It explores which types of services account for a relatively large share of out-of-pocket spending, which groups of beneficiaries are especially hard hit by high out-of-pocket costs for services and premiums, and trends in out-of-pocket spending on services and premiums between 2000 and 2010.
Data and Methods
The analysis is based on data from the Medicare Current Beneficiary Survey (MCBS) Cost and Use file from 2000 to 2010 (the most recent year of data available). The dataset includes detailed information on Medicare-covered and non-covered services, utilization, and spending, including spending by Medicare, Medicaid, third-party payers, and out-of-pocket payments by beneficiaries. The types of services included in the MCBS are dental, home health, inpatient hospital, long-term care facility, medical providers and supplies, outpatient hospital, prescription drugs, and skilled nursing facility. The MCBS does not include spending and use for personal care services and supports, which can be a significant expense for people on Medicare who require long-term services and supports (LTSS) in the community. Therefore, any out-of-pocket spending on personal care and support delivered in the home or the value of unpaid personal care and support services is not included in the out-of-pocket spending estimate for home health services.
The analysis excludes beneficiaries enrolled in Medicare Advantage plans, totaling 10.8 million or 22 percent of the 48.4 million Medicare beneficiaries represented in the 2010 MCBS, because the MCBS does not include reliable utilization and out-of-pocket spending data for this population, which would introduce significant bias if this population was included in the analysis.
To estimate total out-of-pocket spending per beneficiary in traditional Medicare, including premiums and services, we calculate for each sample person the sum of out-of-pocket spending on insurance premiums for Medicare Parts A and B and supplemental insurance coverage and medical and long-term care services reported in the MCBS. These amounts are averaged across the entire sample of traditional Medicare beneficiaries and weighted to be representative of the traditional Medicare beneficiary population or specific subgroups of beneficiaries. References to “total out-of-pocket spending” in this analysis always include both premiums and service spending. We also often refer to the separate components of total spending (either out-of-pocket spending on services or premiums) in presenting results.
For analysis of high out-of-pocket spending, we divide traditional Medicare beneficiaries’ total out-of-pocket spending (including services and premiums) into quartiles and deciles, and estimate the share of beneficiaries overall and by subgroup who have spending in the top quartile and top decile of total out-of-pocket spending. For a more detailed discussion of methods, data, and limitations, see Methodology.
Key Findings
In 2010, Medicare beneficiaries spent $4,734 out of their own pockets for health care spending, on average, including premiums for Medicare and other types of supplemental insurance and costs incurred for medical and long-term care services.
- Premiums for Medicare and supplemental insurance accounted for 42 percent of average total out-of-pocket spending among beneficiaries in traditional Medicare in 2010 (Exhibit ES.1).
- Of the remaining 58 percent of average total out-of-pocket spending on services, long-term facility costs are the largest component (accounting for 18 percent of total out-of-pocket spending), followed by medical providers/supplies (14%), prescription drugs (11%), and dental care (6%). Neither long-term care services and supports nor dental services are covered by Medicare.
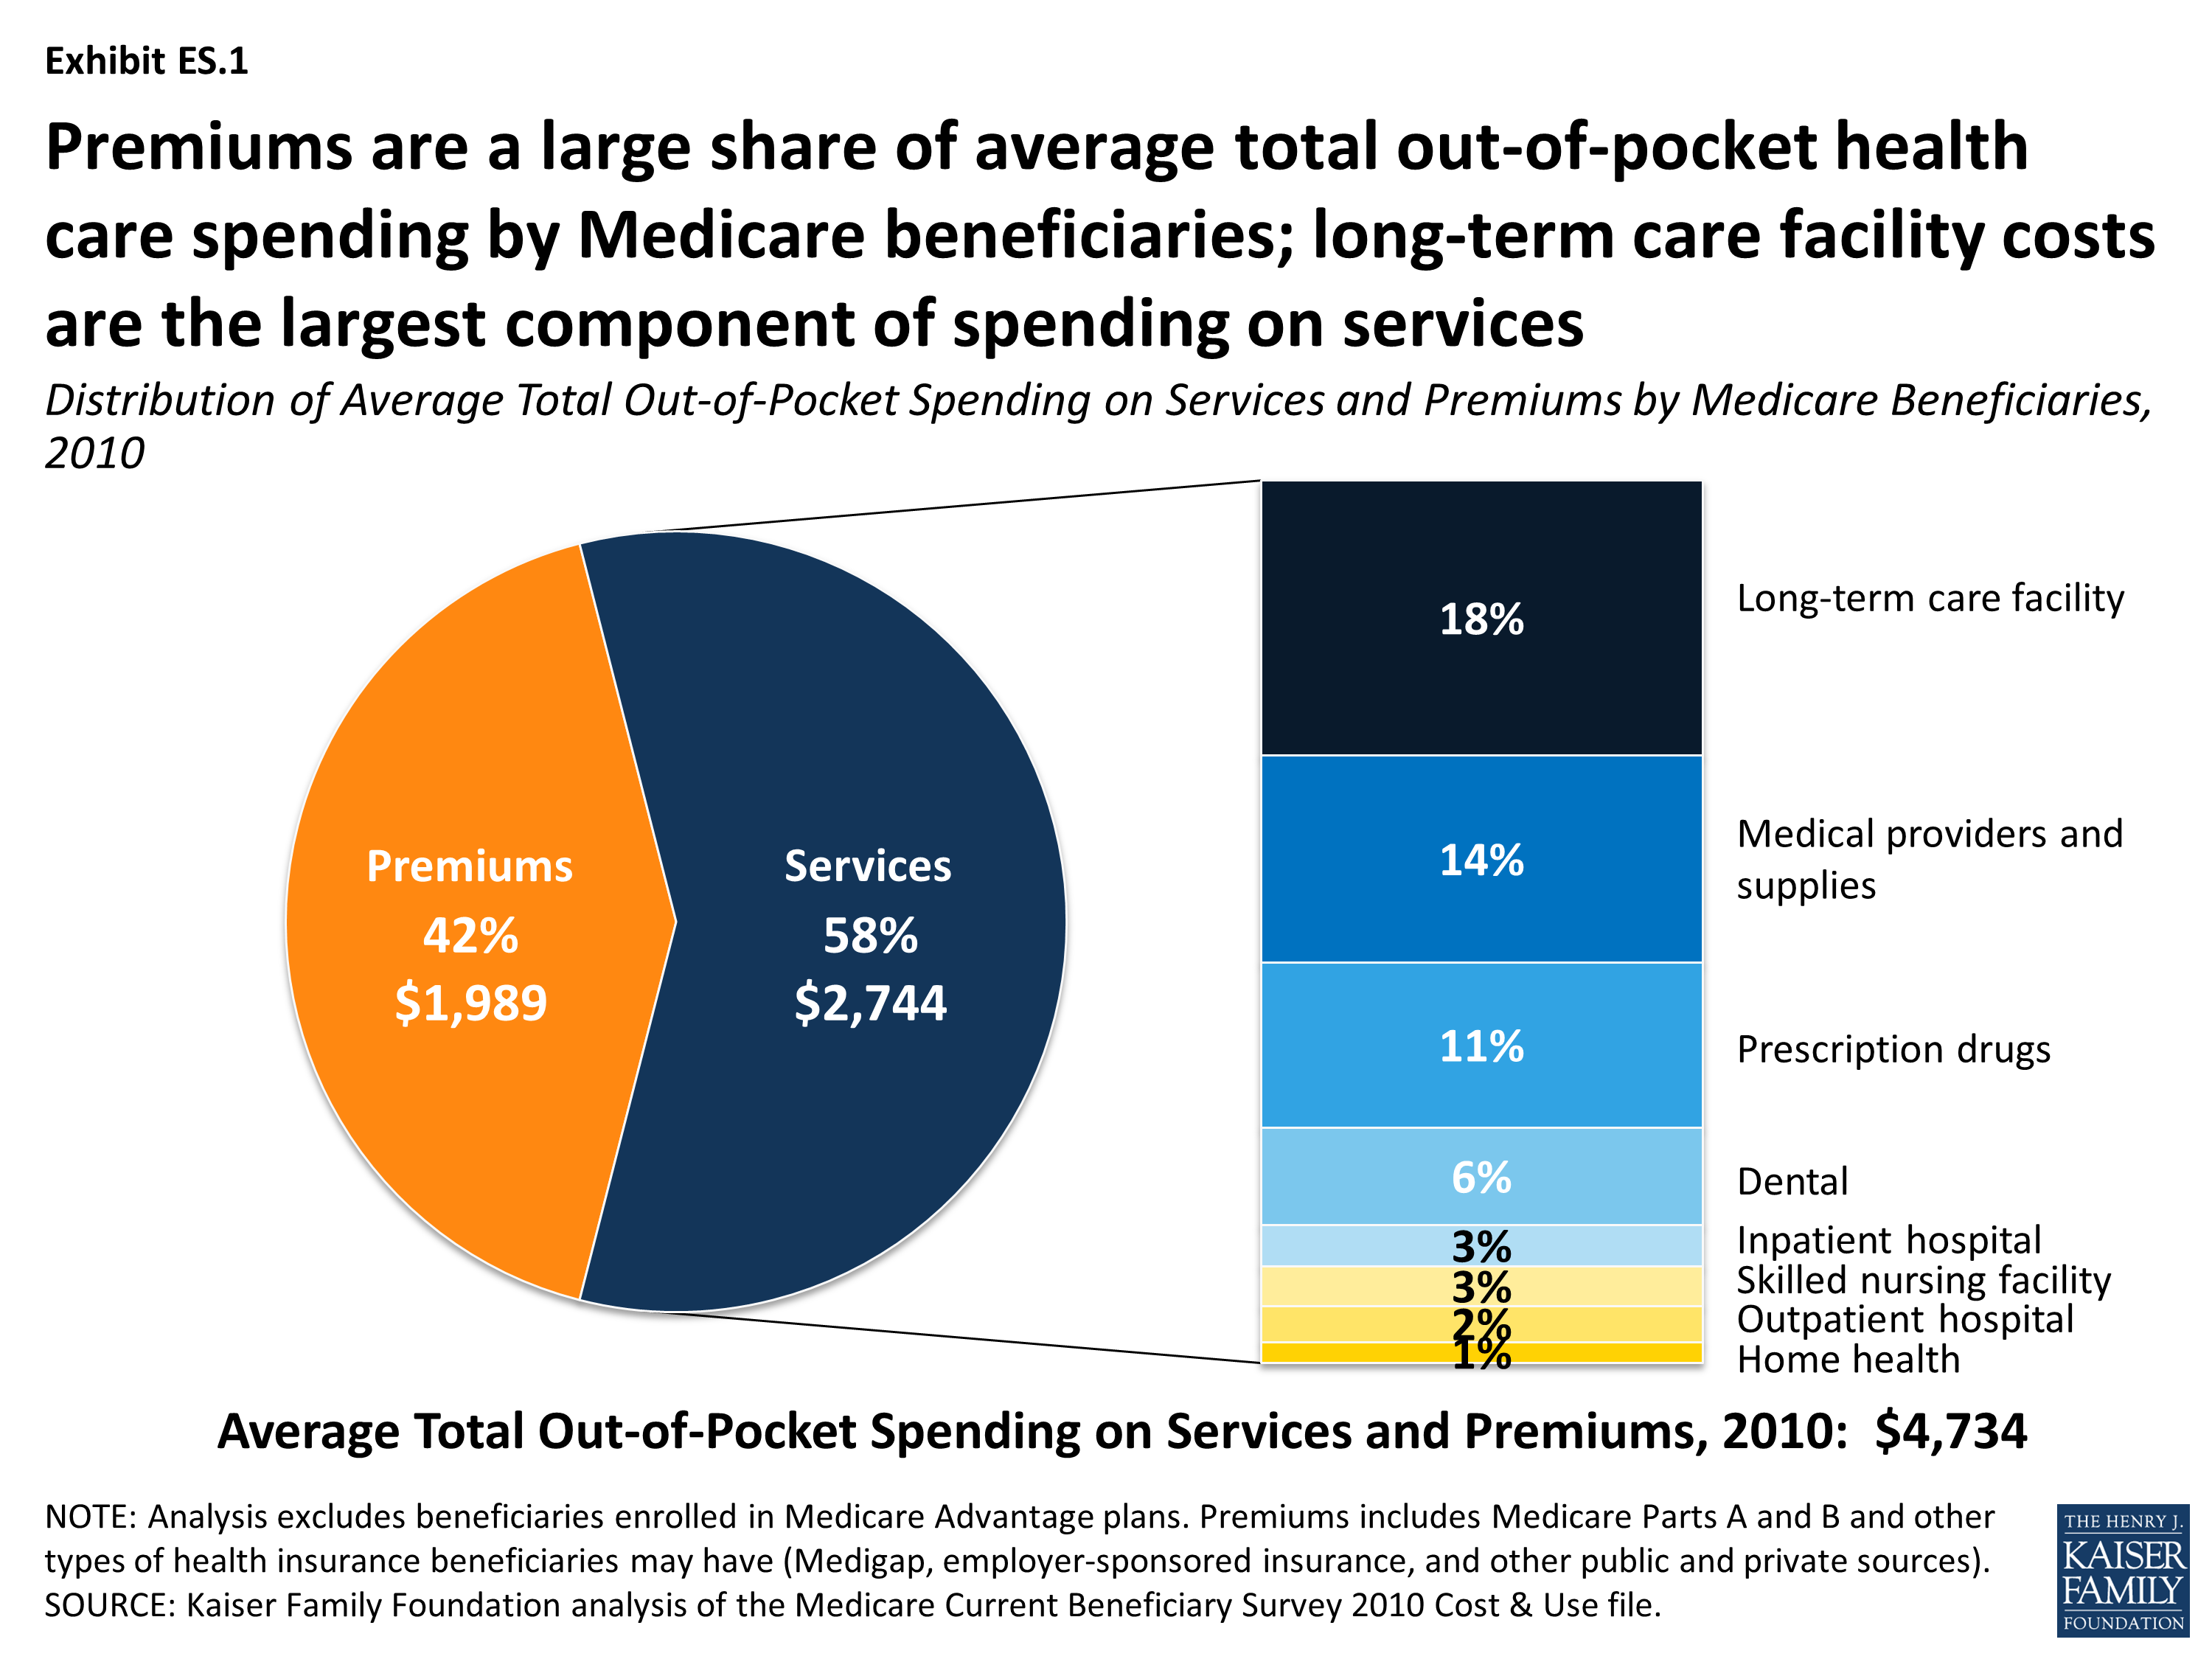
Exhibit ES.1: Distribution of Average Total Out-of-Pocket Spending on Services and Premiums by Medicare Beneficiaries, 2010
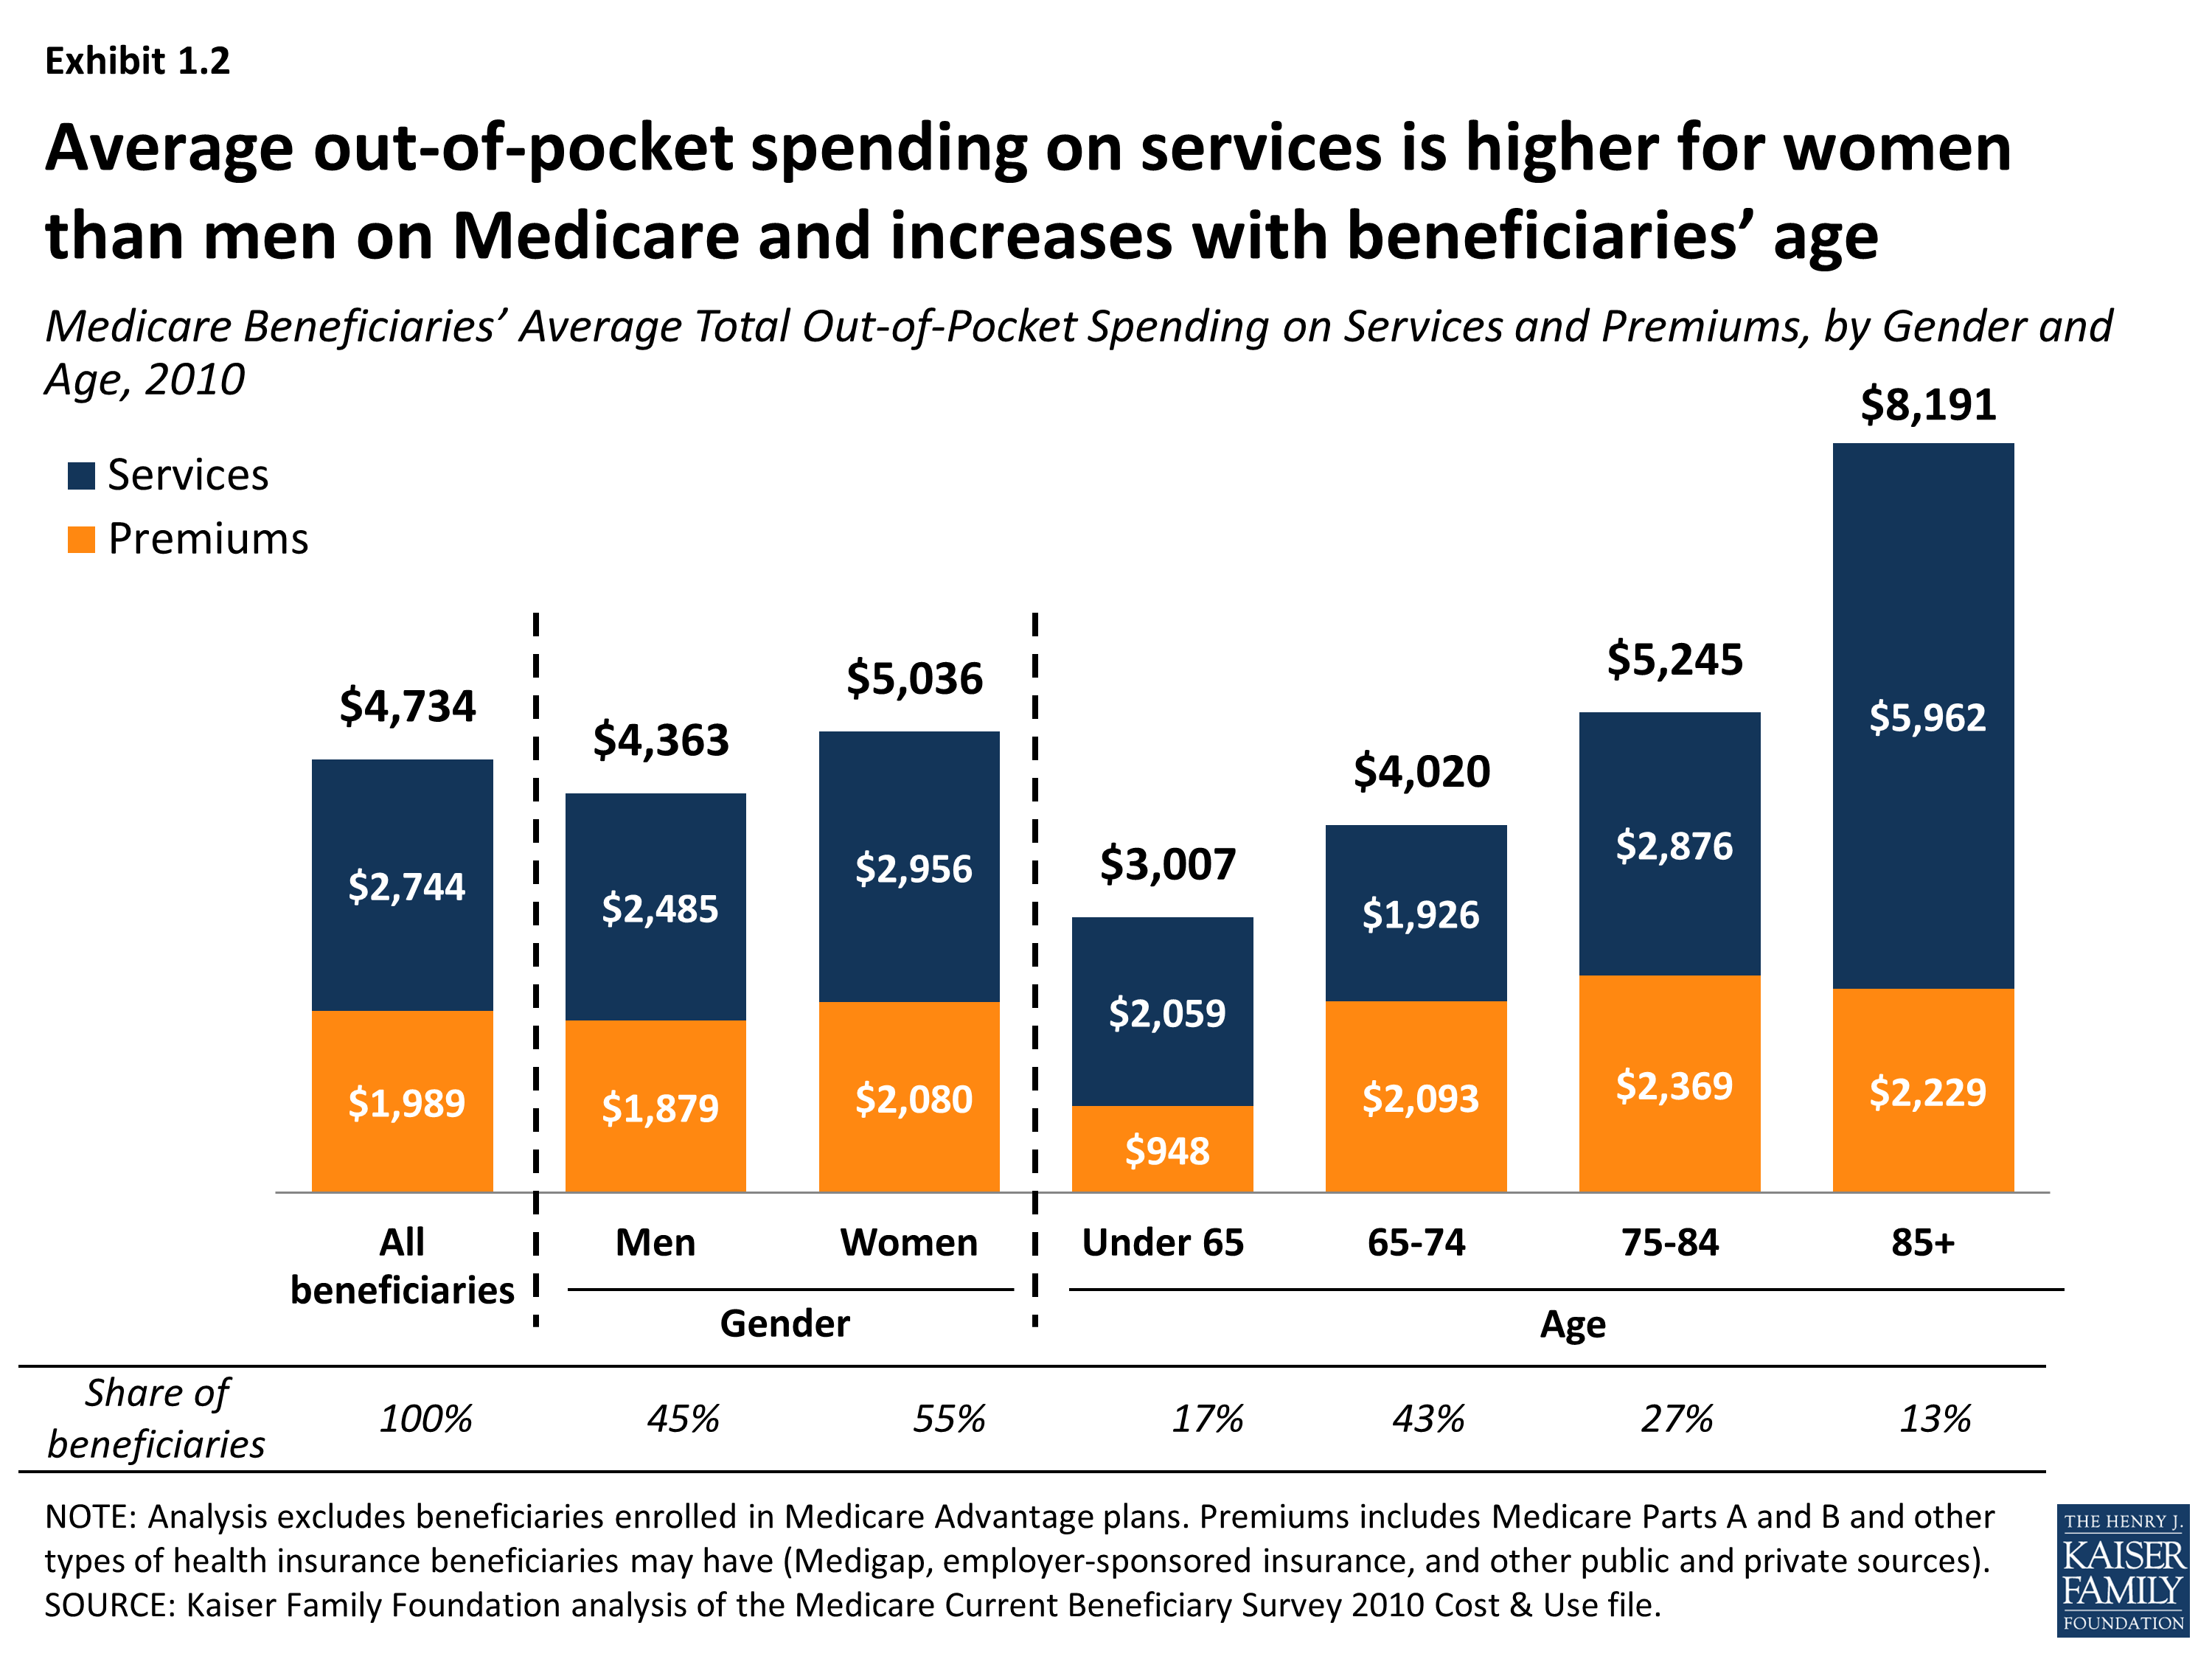
Out-of-pocket spending rises with age among beneficiaries ages 65 and older and is higher for women than men, especially among those ages 85 and older.
- Out-of-pocket spending tends to increase with age; in 2010, beneficiaries ages 85 and older spent three times more out-of-pocket on services, on average, than beneficiaries ages 65 to 74 ($5,962 vs. $1,926).
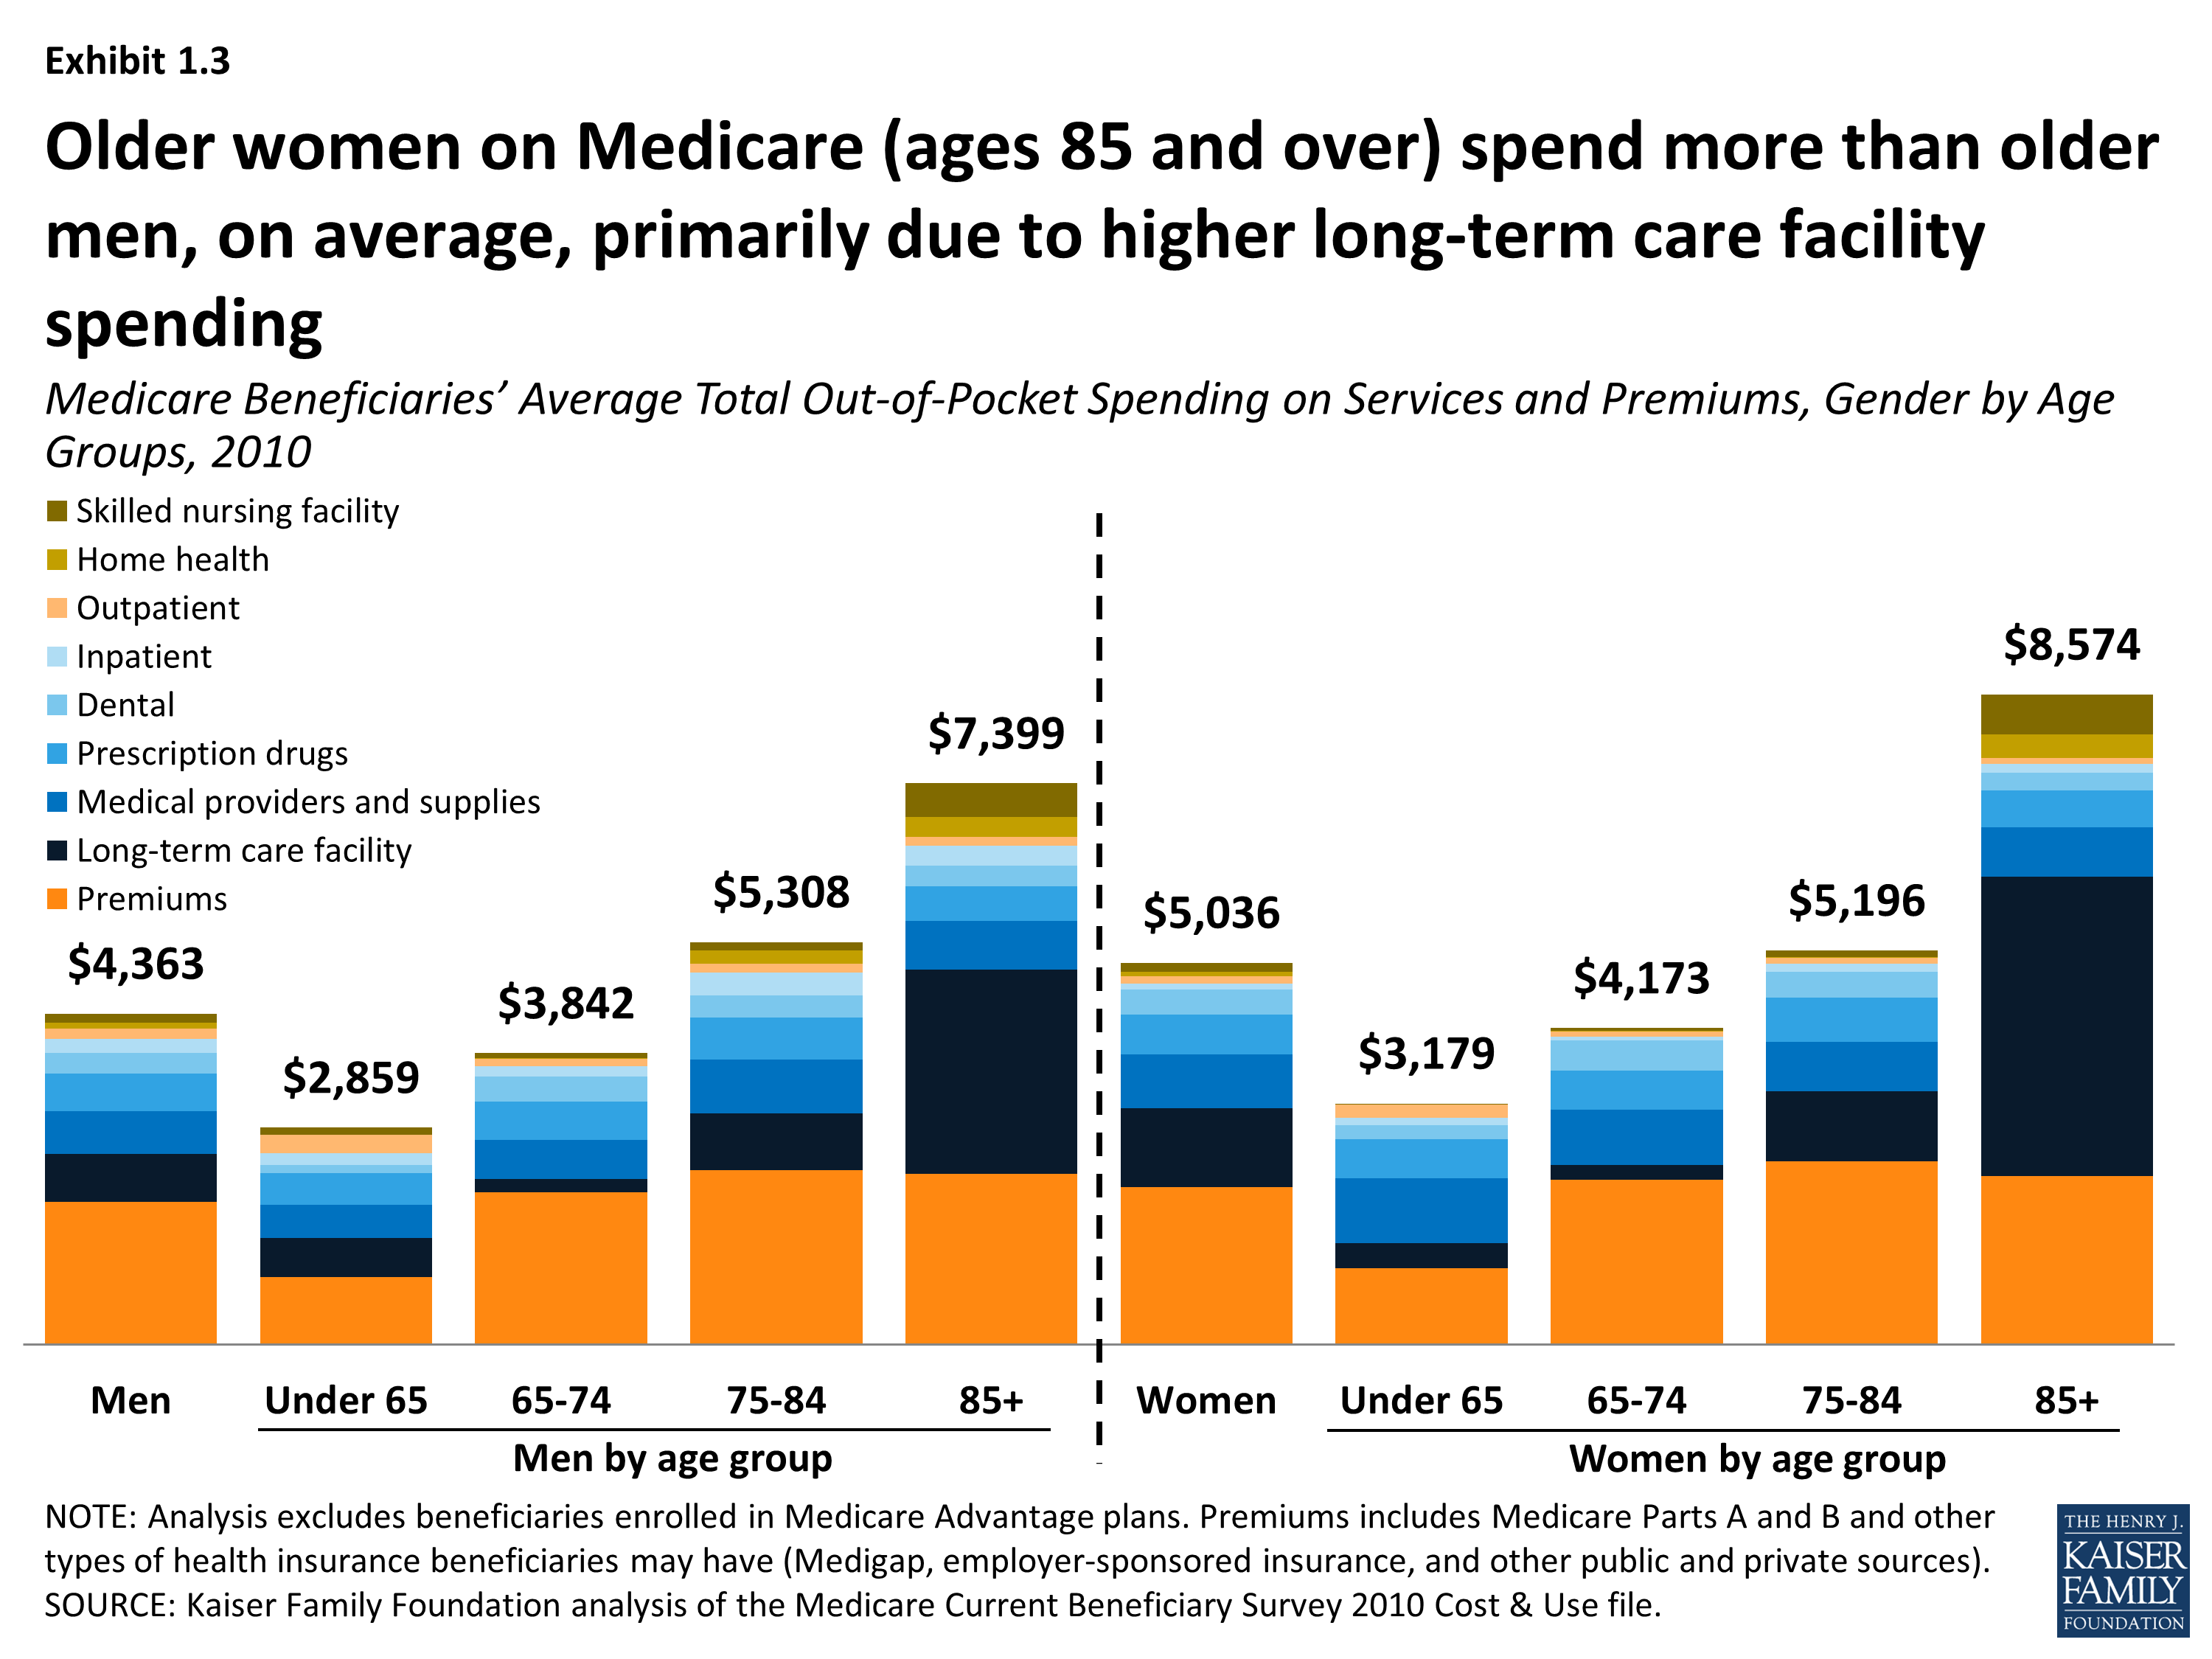
- On average, women on Medicare pay more out of pocket for services and premiums combined than men on Medicare ($5,036 vs. $4,363, respectively, in 2010), and this difference grows somewhat wider with age. Women ages 85 and over spent an average of $8,574 in 2010 on services and premiums while men ages 85 and over spent an average of $7,399 in total. This difference is primarily attributable to higher long-term care facility costs among older women.
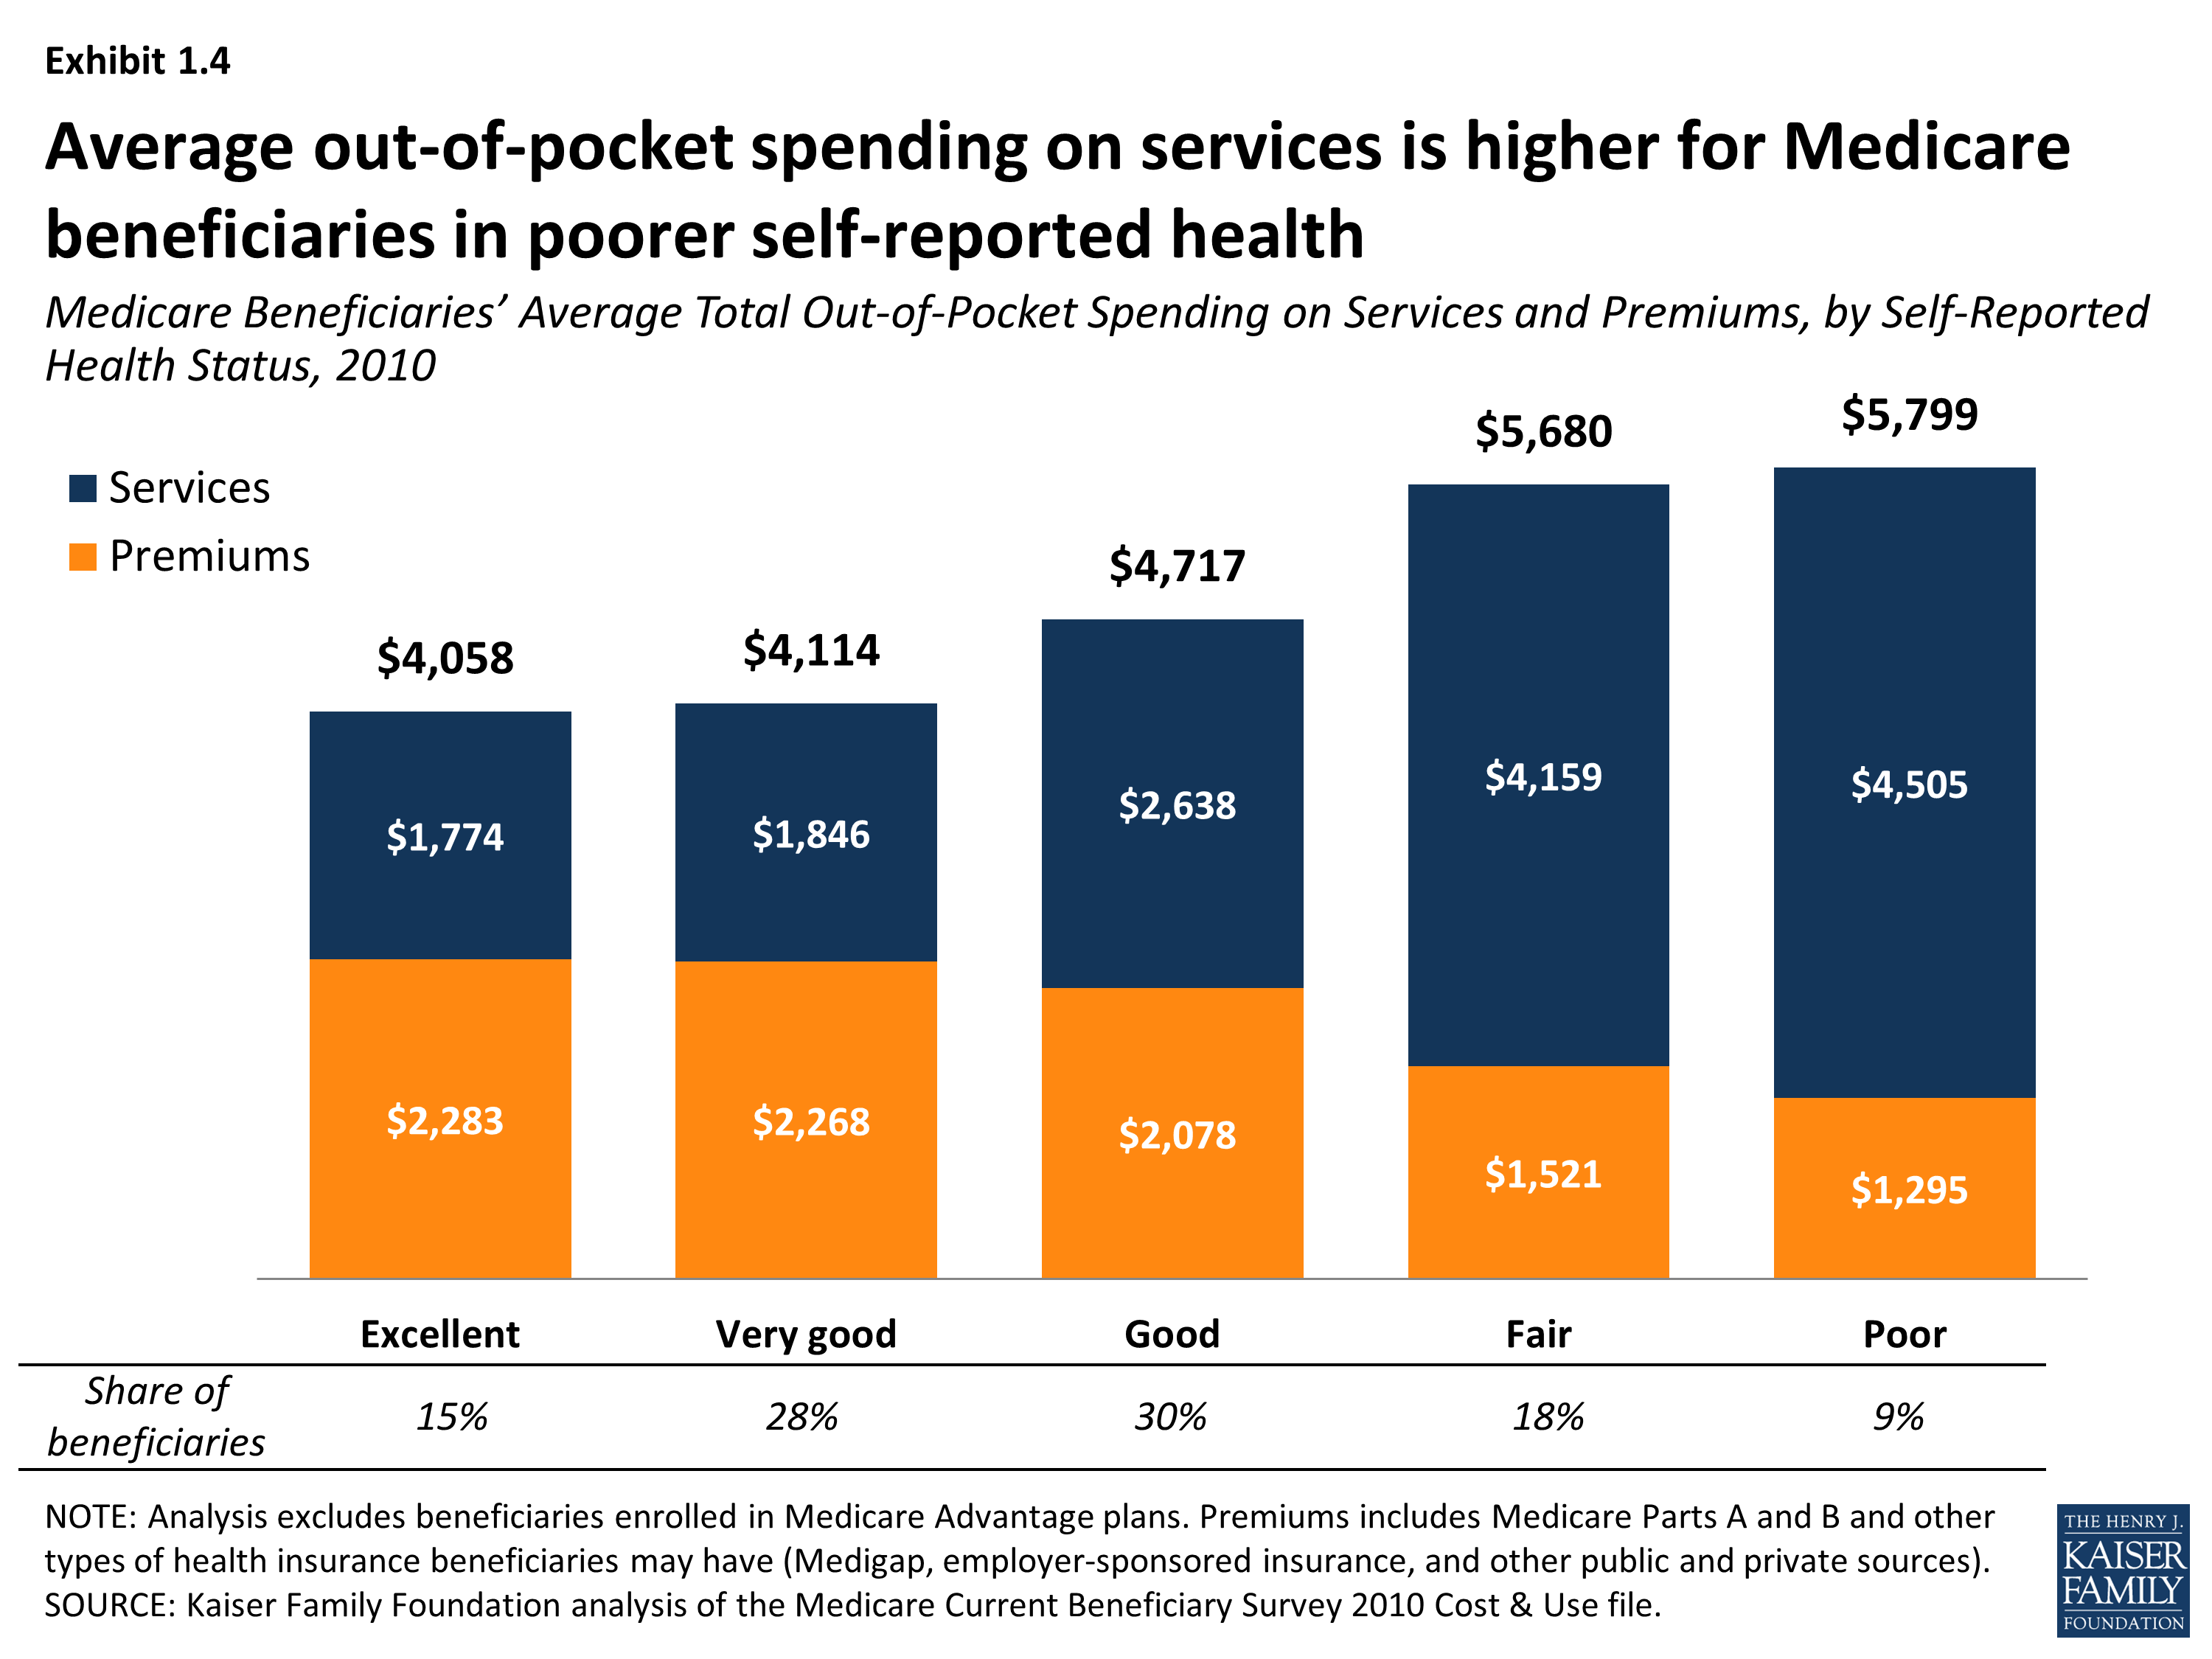
As might be expected, beneficiaries in poorer health, who typically need and use more medical and long-term care services, have higher out-of-pocket costs, on average. This is the case whether measured by self-reported health status, number of chronic conditions or limitations in activities of daily living (ADLs), or use of services, such as hospitalizations, post-acute care, and long-term care.
- Average out-of-pocket spending on services rises as beneficiaries’ health status declines, and rises with the number of functional impairments and chronic conditions. For example, average out-of-pocket spending on services by beneficiaries in poor self-reported health was 2.5 times greater than among beneficiaries who said they were in excellent health ($4,505 vs. $1,774, respectively, in 2010). Similarly, beneficiaries with three or more ADL limitations spent five times more on services as those with no ADLs or IADLs in 2010 ($7,737 vs. $1,528, on average).
- Beneficiaries with Alzheimer’s disease, Parkinson’s disease, and end-stage renal disease (ESRD) have relatively high out-of-pocket spending on services compared to beneficiaries with certain other conditions ($8,305, $5,841 and $5,439, respectively, on average in 2010), but their higher costs are driven by use of different types of services. For example, for people with Alzheimer’s disease, long-term care facility costs accounted for a majority of their average out-of-pocket costs in 2010, while those with ESRD faced higher out-of-pocket costs for medical services.
Just as Medicare spends more on beneficiaries who use more Medicare-covered services, more extensive use of services leads to higher out-of-pocket spending. This is especially true for beneficiaries who have multiple hospitalizations and post-acute care use and those who live in long-term care facilities.
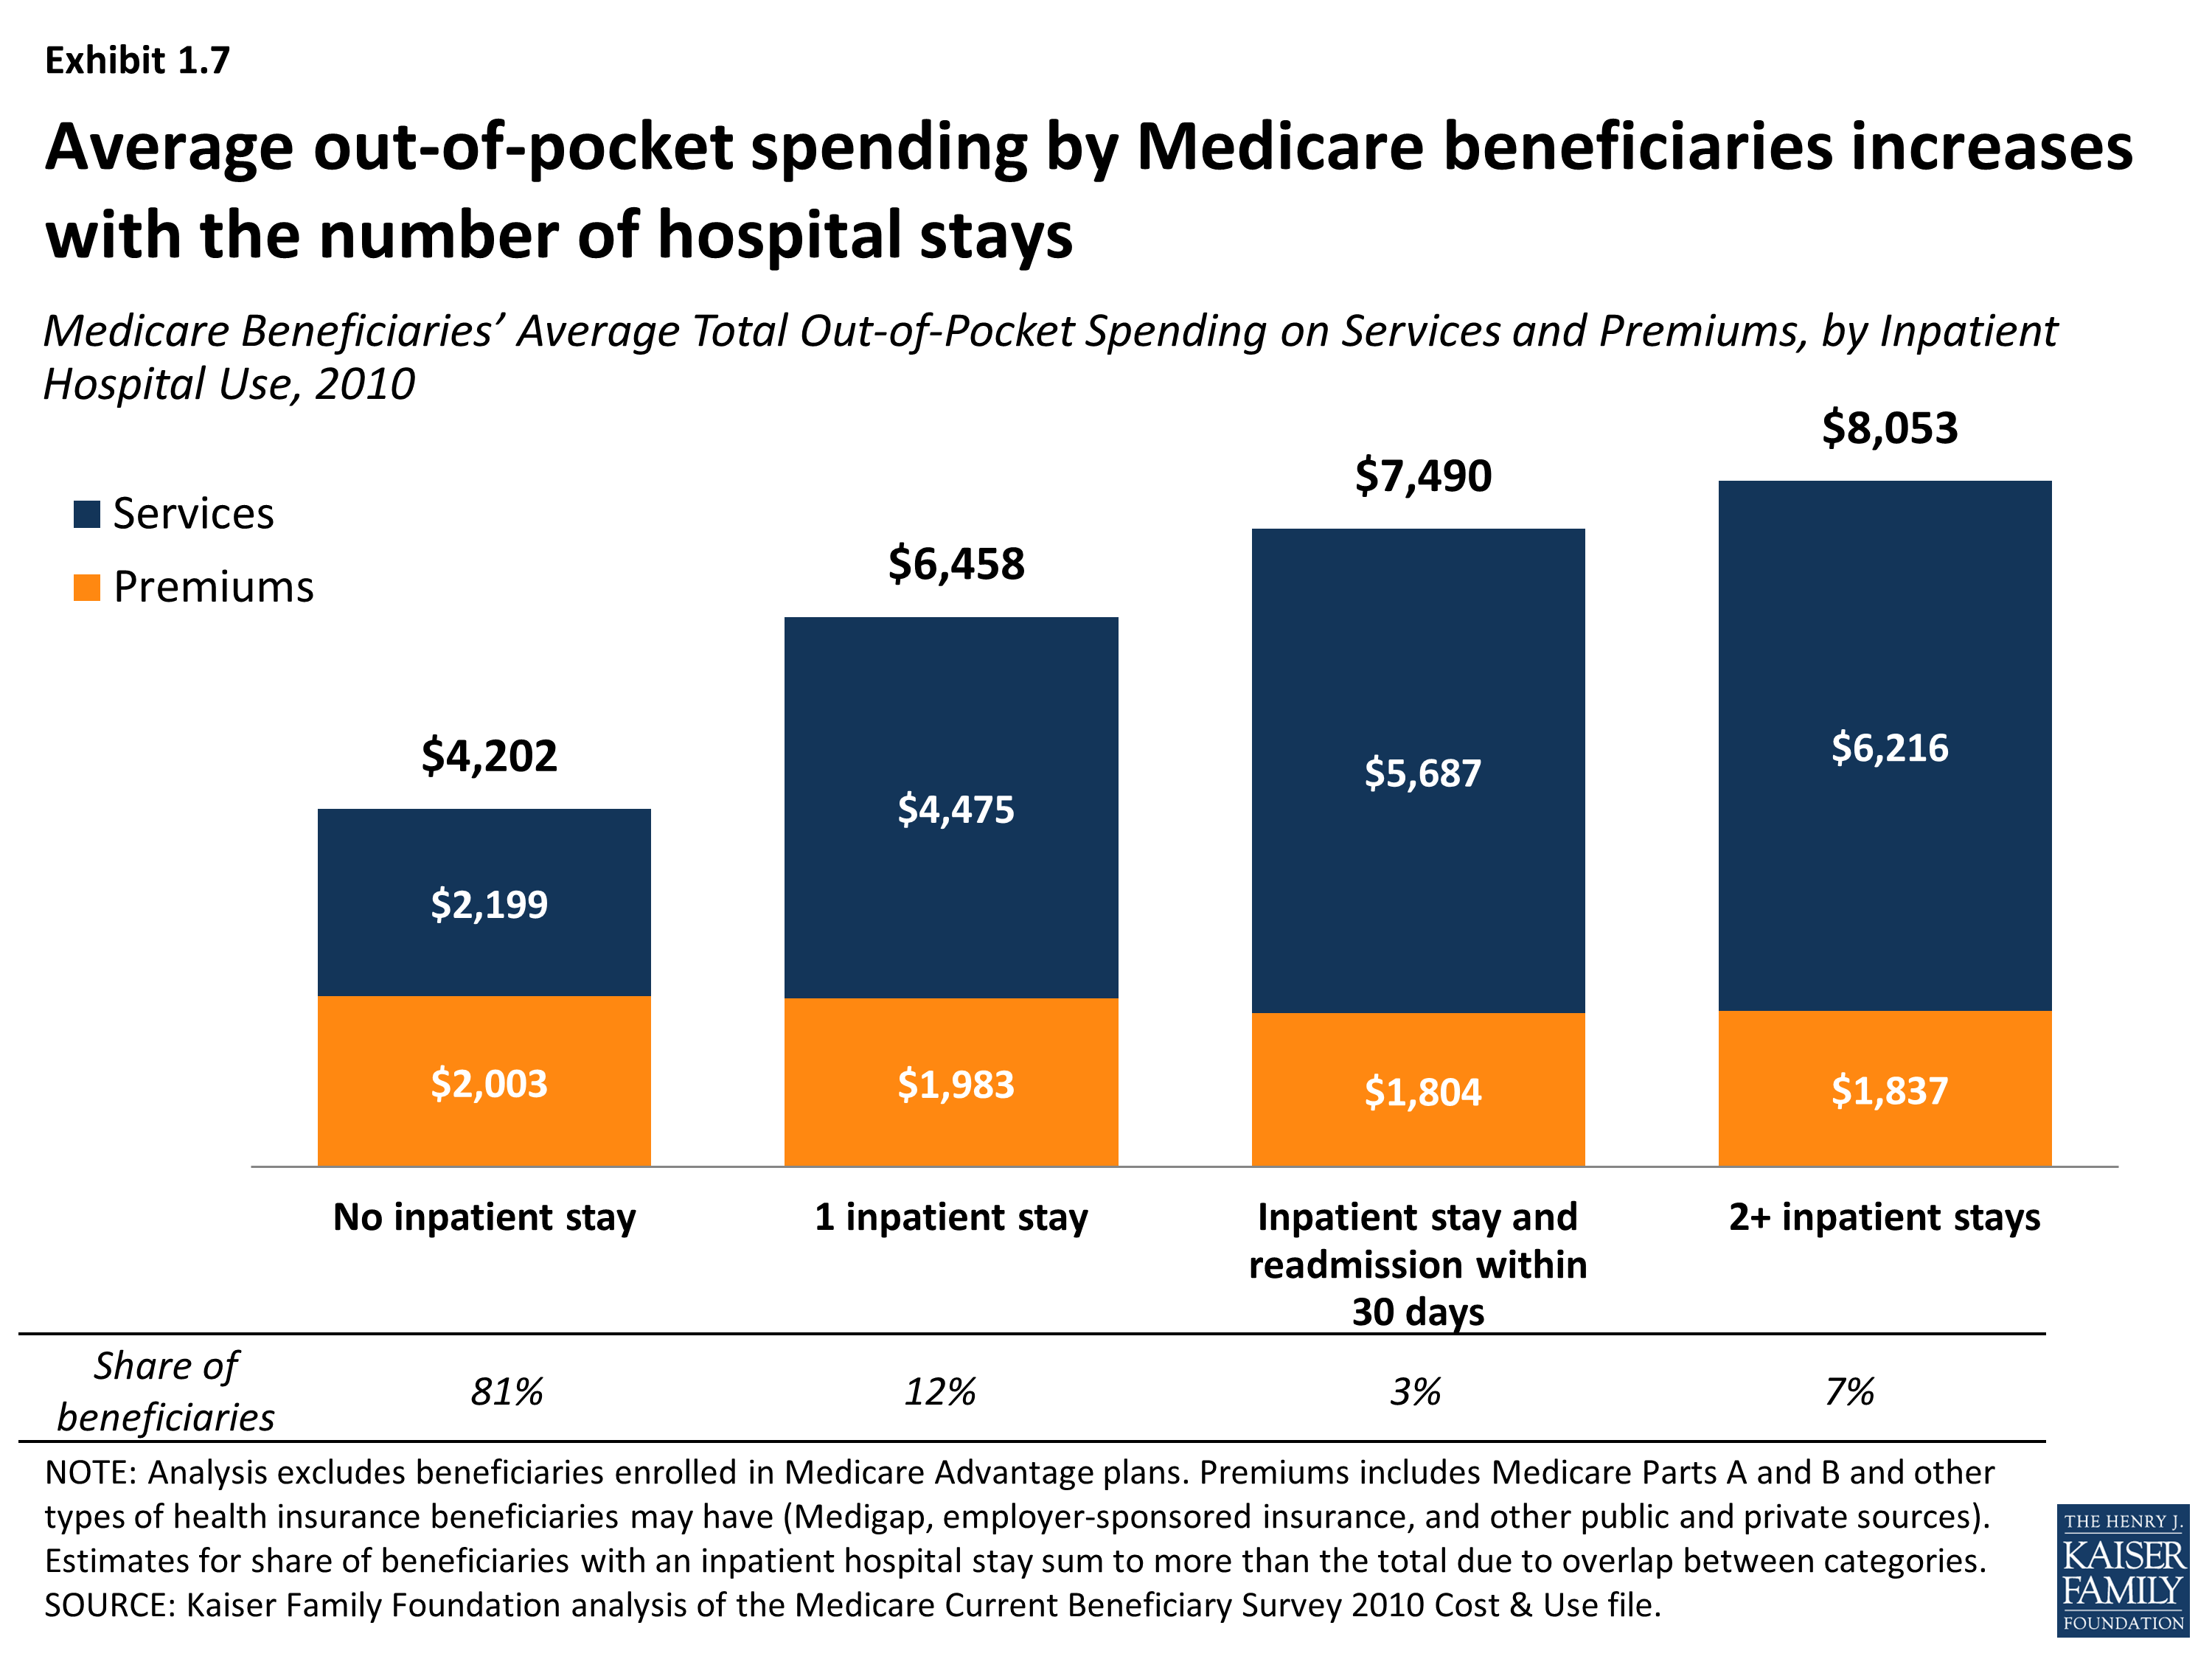
- Average out-of-pocket spending on services rises with the number of hospitalizations; Medicare beneficiaries with one hospitalization in 2010 paid $4,475 out of pocket on services, on average, while those with two or more hospitalizations paid $6,216.
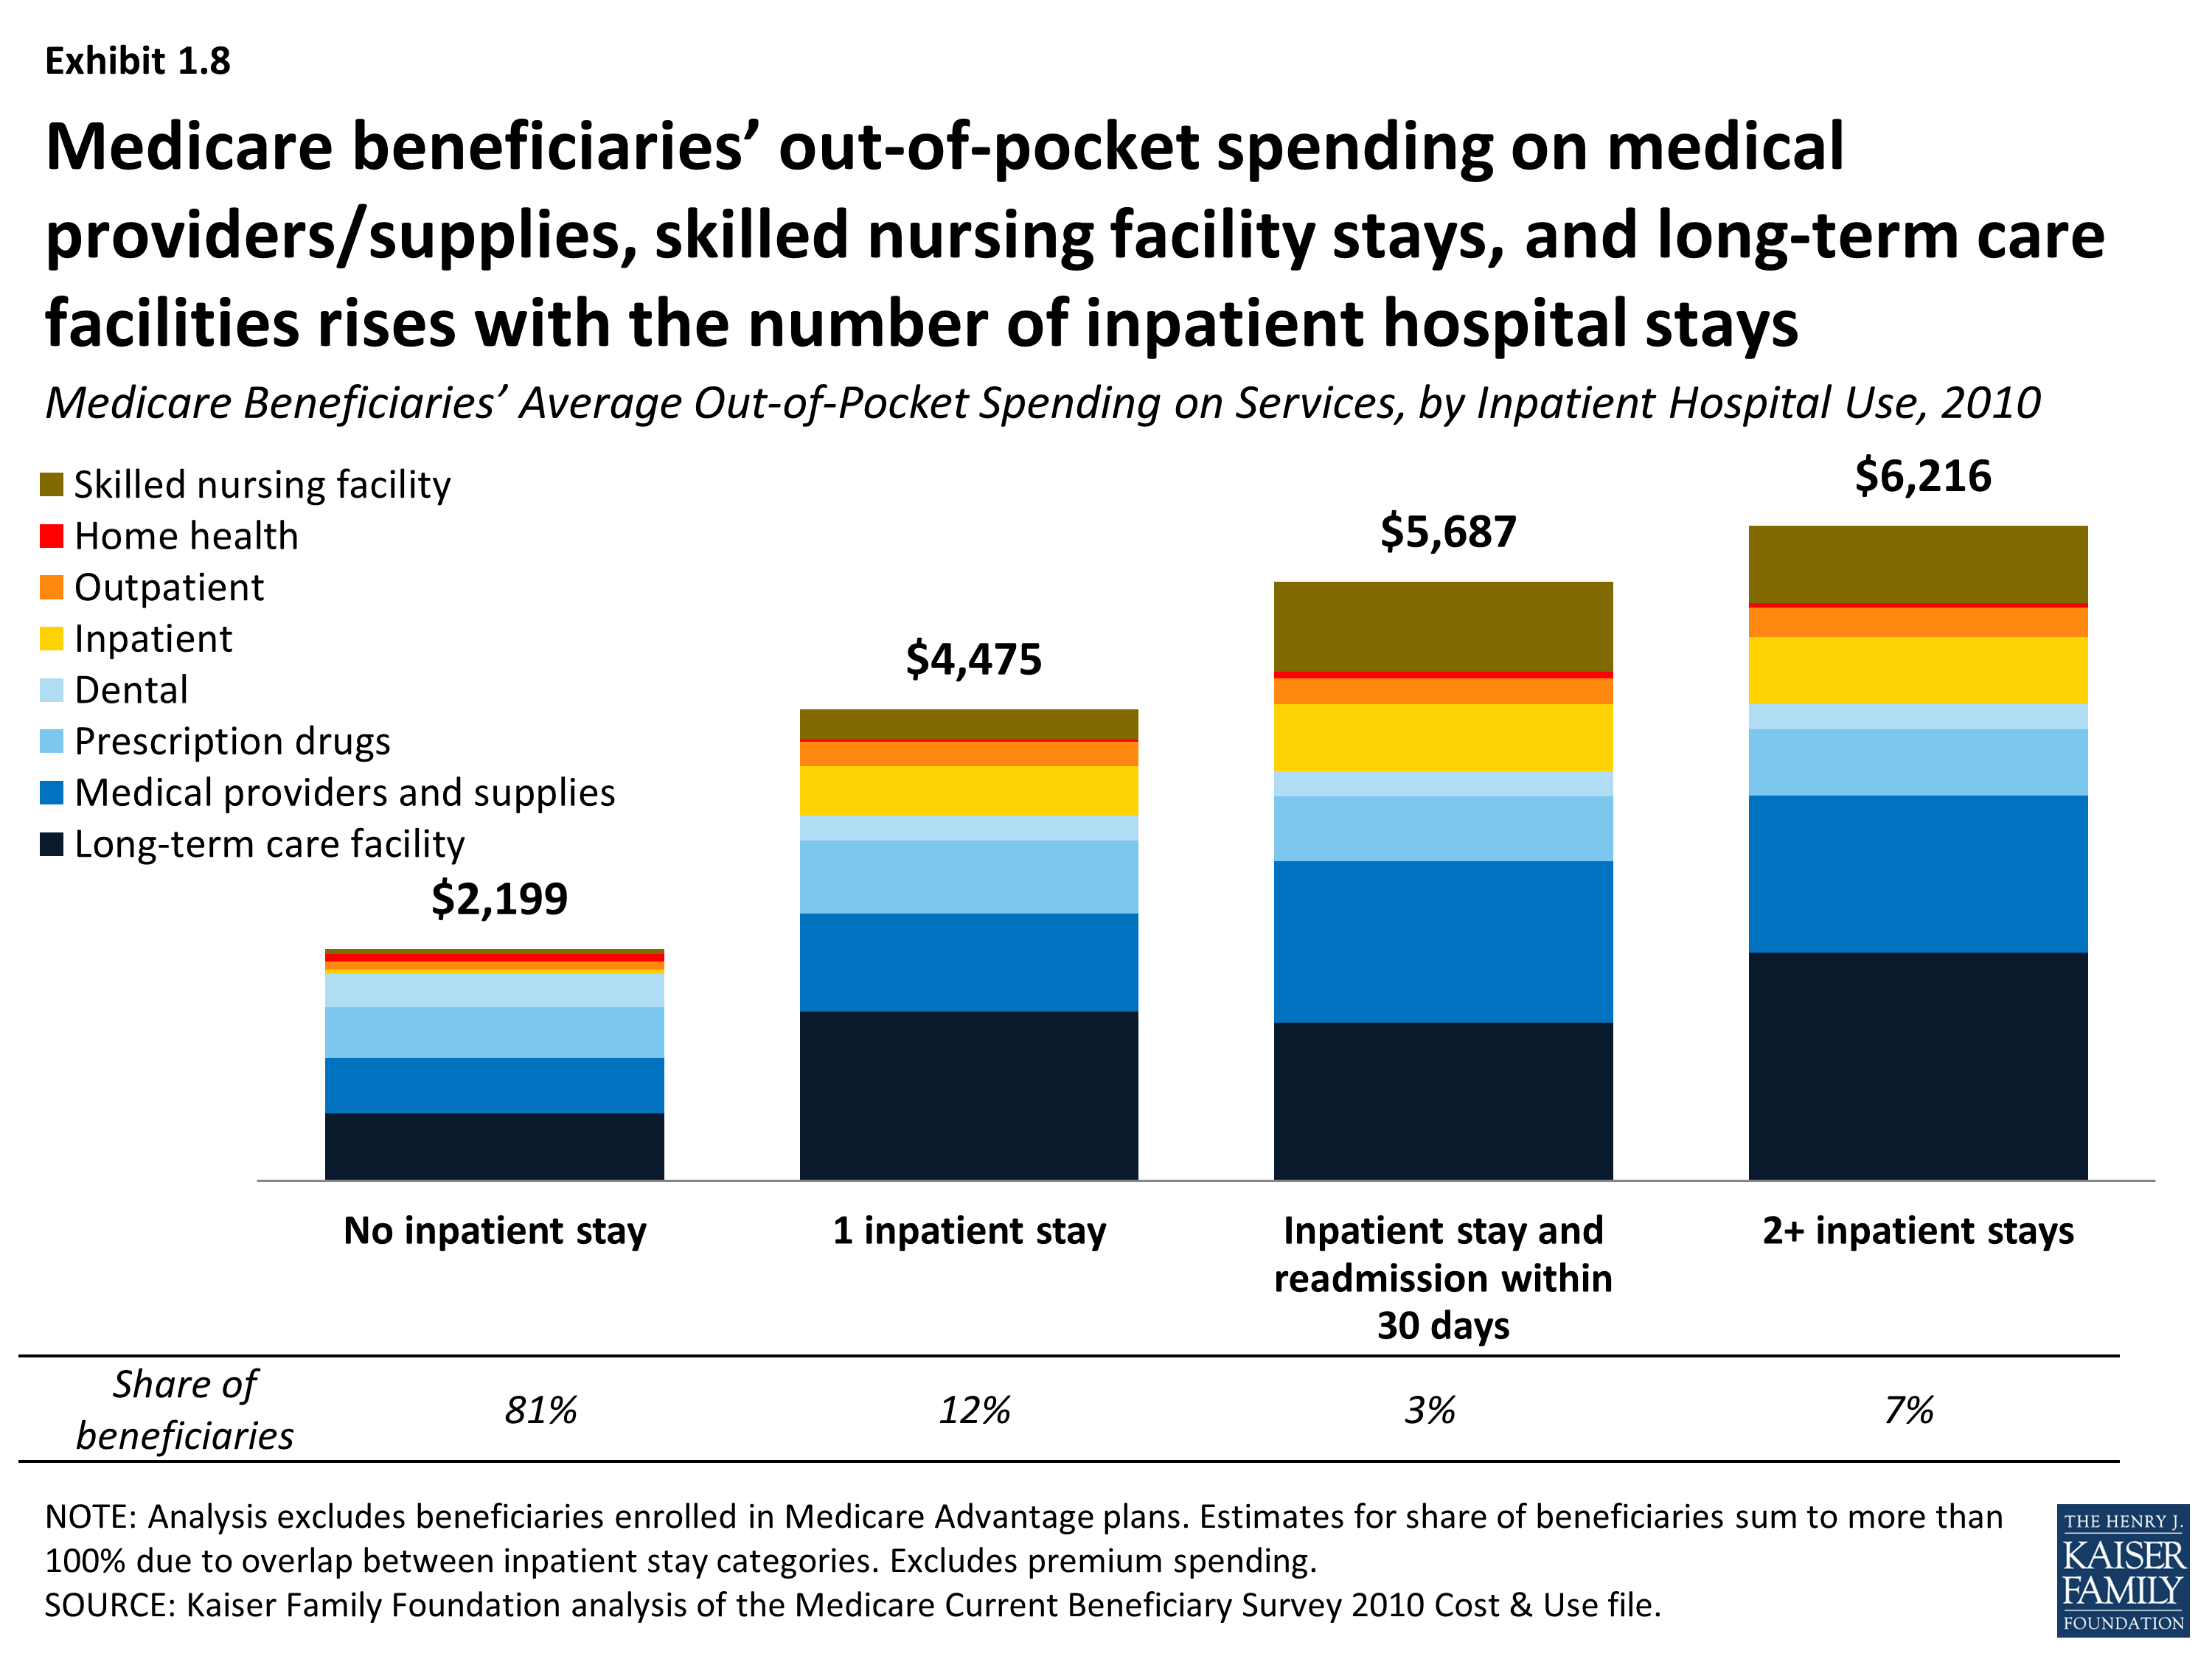
- Patients with a hospital readmission within 30 days of discharge spent roughly $1,200 more on services than those with only one inpatient stay in 2010 ($5,687 vs. $4,475, respectively, on average), including higher spending for medical providers and supplies, inpatient hospital services, and skilled nursing facility (SNF) services.
- Among beneficiaries who were hospitalized in 2010, those who received post-acute care in a SNF had significantly higher out-of-pocket spending on services than those who were discharged without SNF care ($9,508 vs. $3,645, respectively, on average); this was especially the case for long-term care facility residents with an inpatient stay and post-acute SNF care. Among beneficiaries with an inpatient stay followed by a skilled nursing facility stay, average out-of-pocket spending on SNF services was seven times greater among facility residents ($4,258) than among community residents ($595) in 2010.
- The small share of beneficiaries who live in long-term care facilities face significantly higher out-of-pocket spending on medical and long-term care services than those in the community (averaging $17,534 and $1,858, respectively, in 2010). While most of their spending on services is for long-term care facility expenses, facility residents also incur higher costs for inpatient hospital and post-acute care services than beneficiaries living in the community.
Spending on premiums, a significant component of total out-of-pocket spending among Medicare beneficiaries, varies less across subgroups of the Medicare population than spending on services. Unlike out-of-pocket spending on services, premium spending does not vary by health status or utilization, though it does vary somewhat by age, income, and source of supplemental coverage.
- While there is little variation in premiums among those ages 65 and over, premiums tend to be lower for beneficiaries under age 65 than among beneficiaries ages 65 and over, on average. This is most likely related to the fact that a relatively large share of Medicare beneficiaries under age 65 is also covered by Medicaid and thus not liable for premiums.
- Average premiums are generally similar for beneficiaries with incomes above $20,000, but lower for beneficiaries with lower incomes, most likely due to three factors: 1) lower-income beneficiaries with Medicaid typically do not pay premiums; 2) lower-income beneficiaries with full Medicaid benefits have little need for supplemental coverage; and 3) lower-income beneficiaries without Medicaid may not be able to afford supplemental insurance.
- Among beneficiaries in traditional Medicare, those with a Medigap supplemental insurance policy pay more in premiums for this additional coverage, on average, than beneficiaries with employer-sponsored retiree health benefits ($2,166 vs $1,335, on average, in 2010). Not surprisingly, premiums are considerably lower for beneficiaries with Medicaid and those with no supplemental coverage.
Analysis of ‘high out-of-pocket spenders’ finds a disproportionate share of certain groups, including older women, beneficiaries living in long-term care facilities, those with Alzheimer’s disease and ESRD, and beneficiaries who were hospitalized, in the top quartile and top decile of total out-of-pocket spending (including both services and premiums). In 2010, one in four beneficiaries spent at least $5,244 out of pocket on medical and long-term care services and premiums (the top quartile), and one in ten spent at least $8,235 (the top decile). Average total out-of-pocket spending among the top quartile—$11,530 in 2010—was more than twice as much as the average among all beneficiaries ($4,734), while among the top decile, it was four times as much ($19,236).
- Long-term care facility costs are a major component of spending for beneficiaries in the top quartile of total out-of-pocket spending, accounting for more than one-fourth of their average out-of-pocket spending in 2010; indeed, seven out of ten beneficiaries living in long-term care facilities are in the top quartile. But it is not just long-term care facility spending that drives higher out-of-pocket costs; higher spending on medical providers and supplies, prescription drugs, and dental services also contribute to relatively high spending among those in the top quartile.
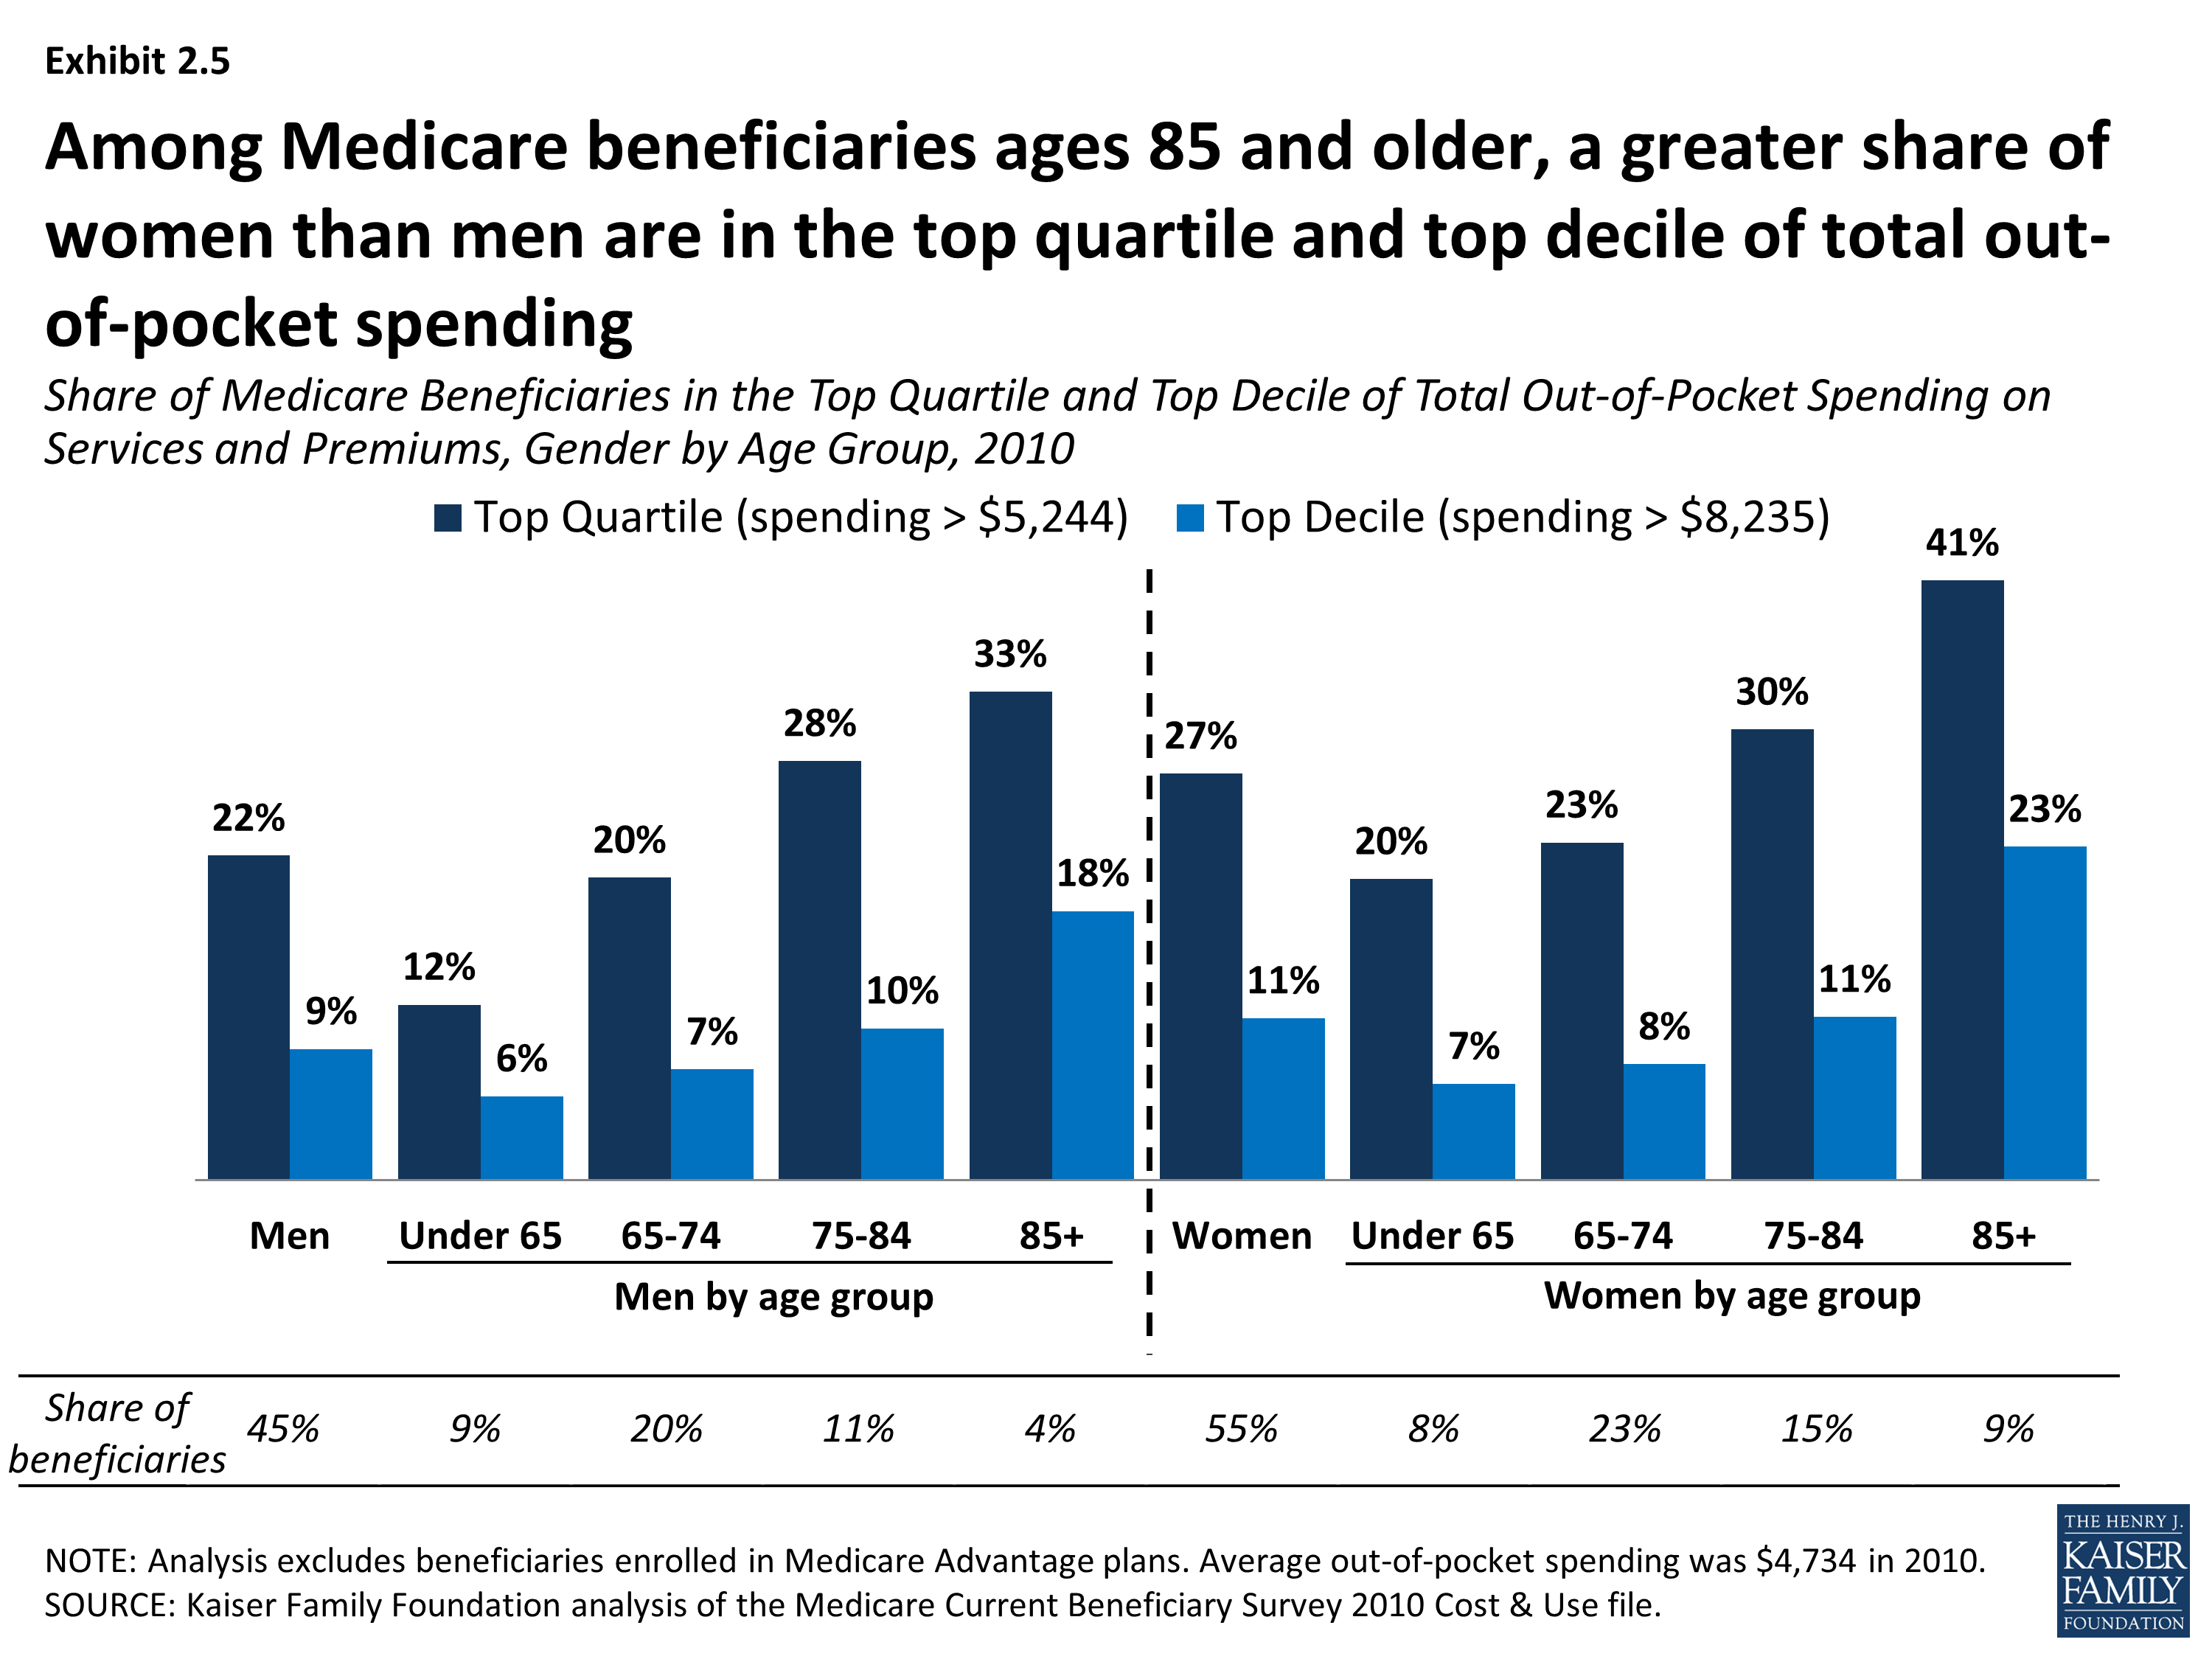
- Overall, four in ten women ages 85 and older are in the top quartile of total out-of-pocket spending on services and premiums, compared to only one-third of men ages 85 and older. These differences are attenuated but not eliminated when looking at out-of-pocket spending among community residents only.
- A disproportionate share of beneficiaries ages 85 and older are in both the top quartile and decile of total spending on services and premiums, compared to younger beneficiaries. Nearly four in ten beneficiaries ages 85 and older are in the top quartile versus just over two in ten of those ages 65-74.
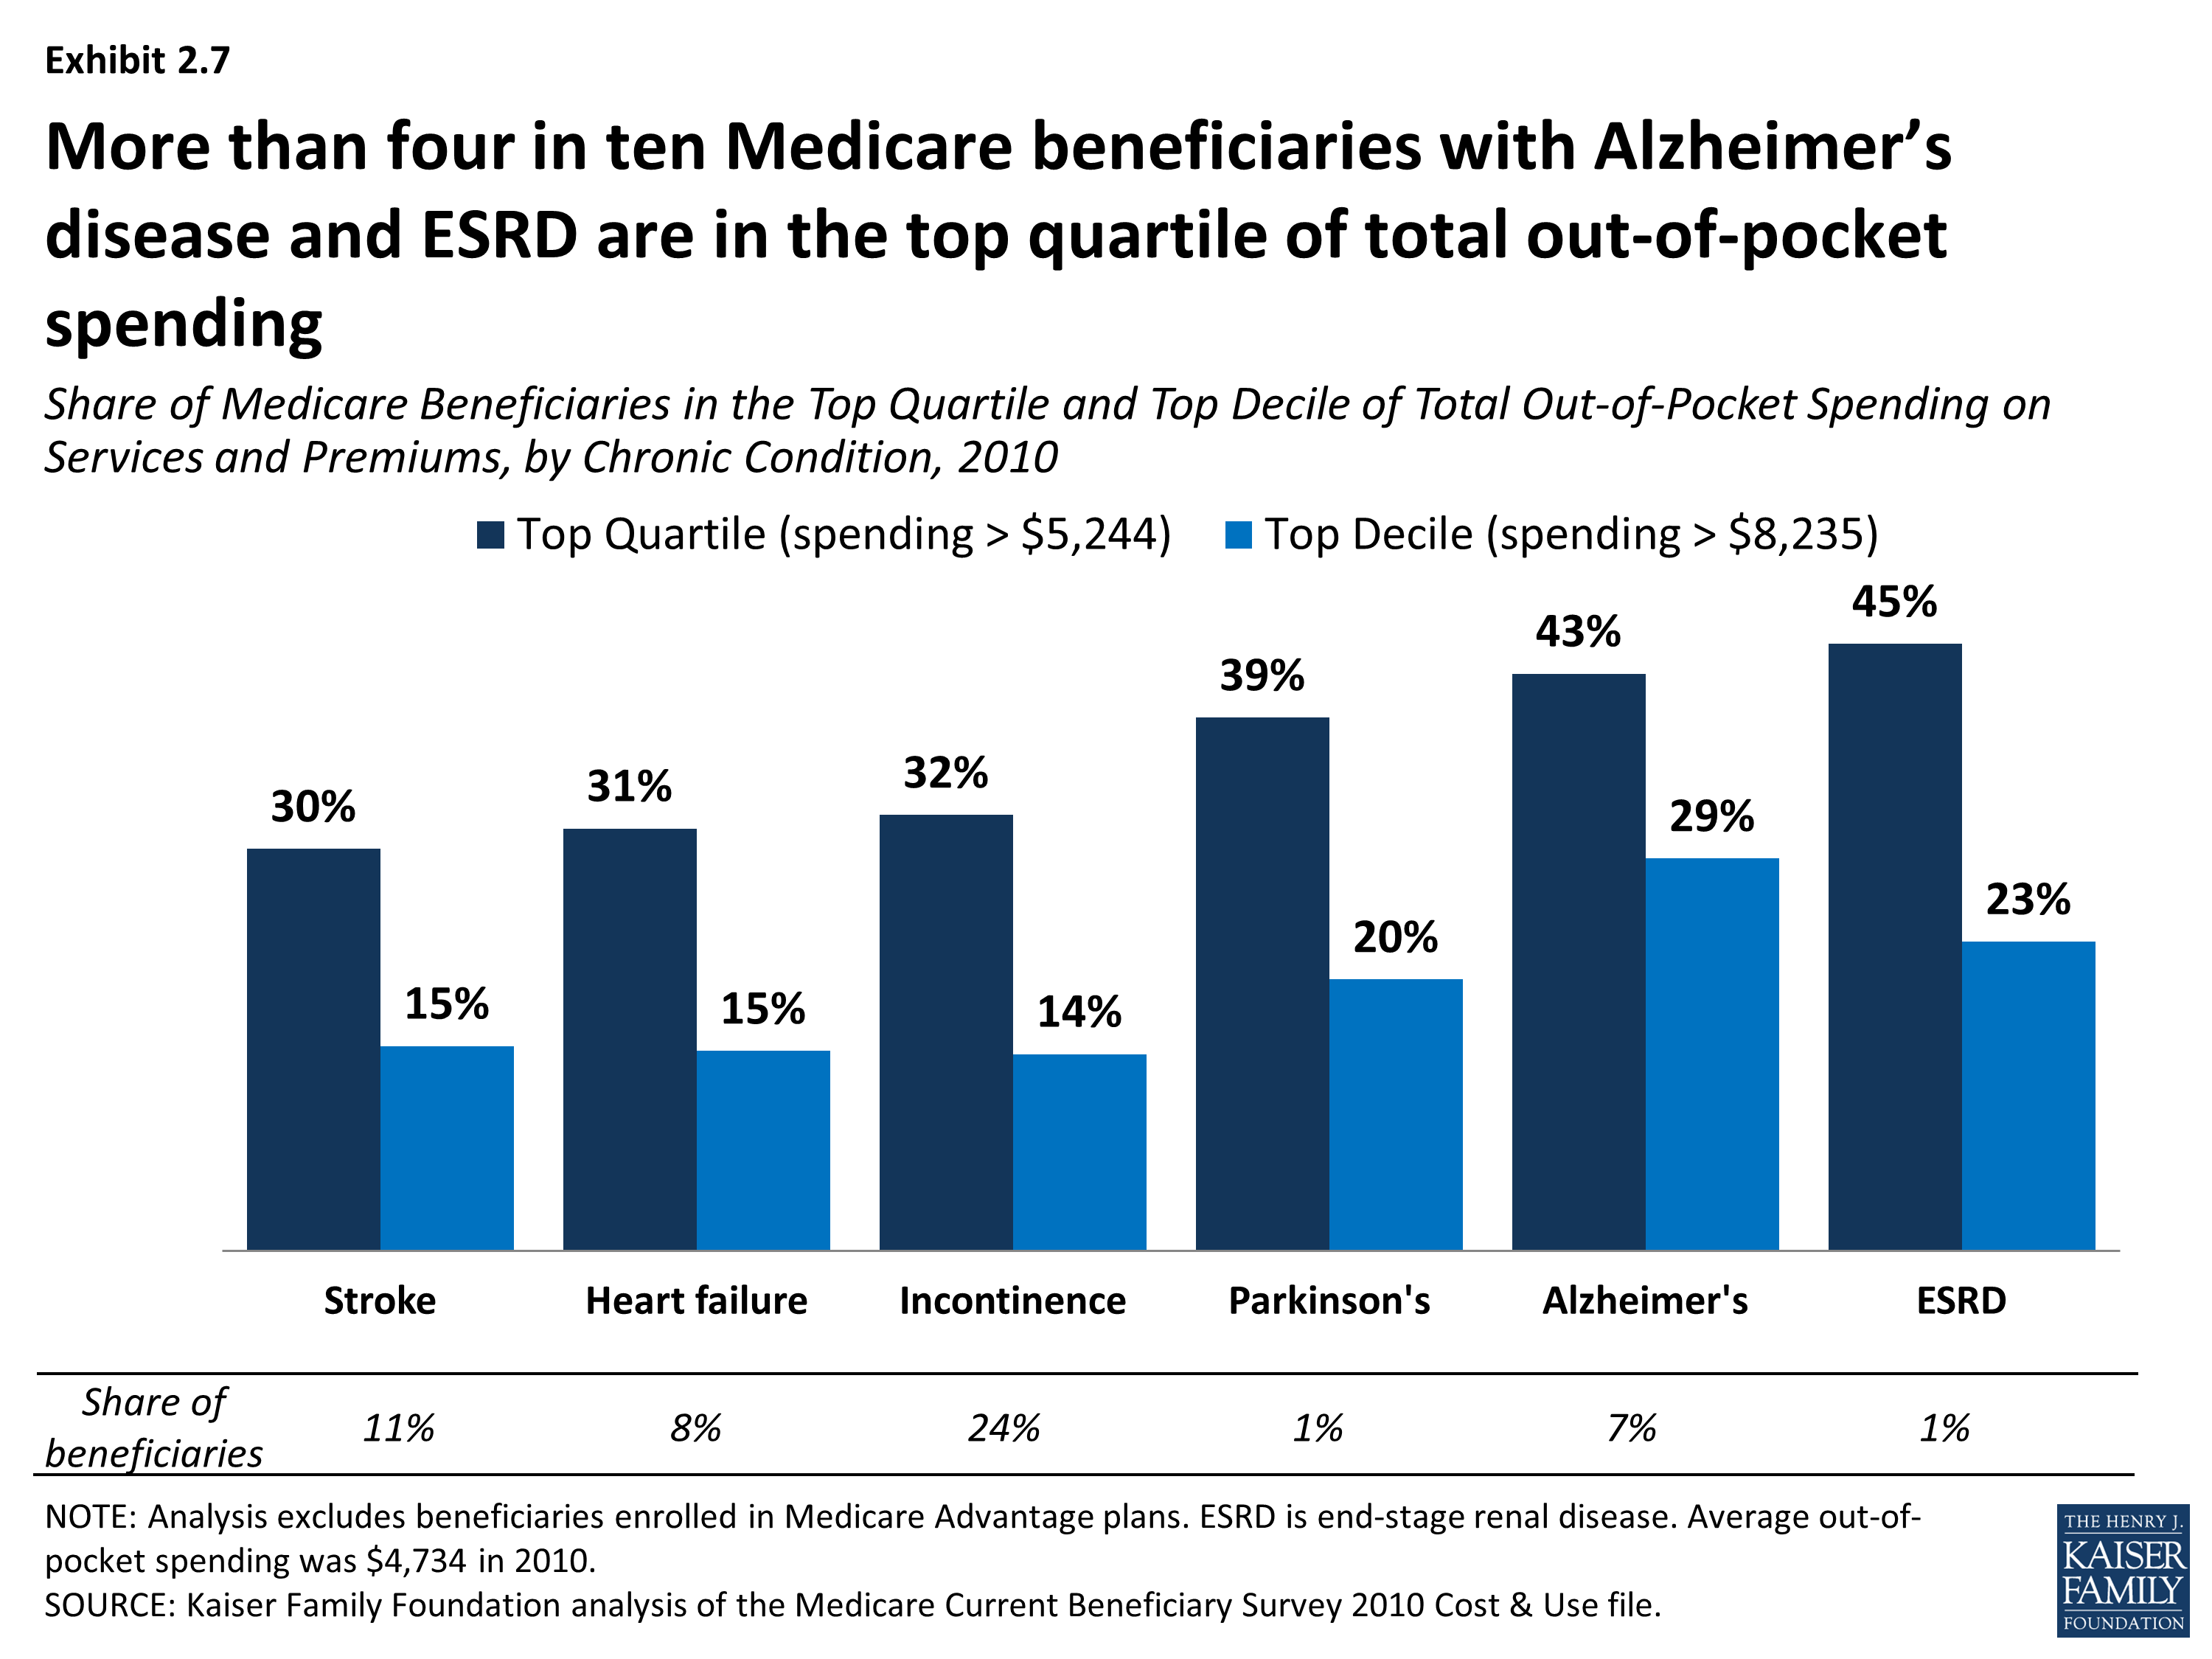
- More than four in ten beneficiaries with Alzheimer’s disease and ESRD were in the top quartile of total out-of-pocket spending in 2010, and nearly four in ten with Parkinson’s disease.
- Close to half of beneficiaries with two or more hospitalizations (45%) and more than half of those with an inpatient stay and a SNF stay (54%) were in the top quartile of total out-of-pocket spending in 2010.
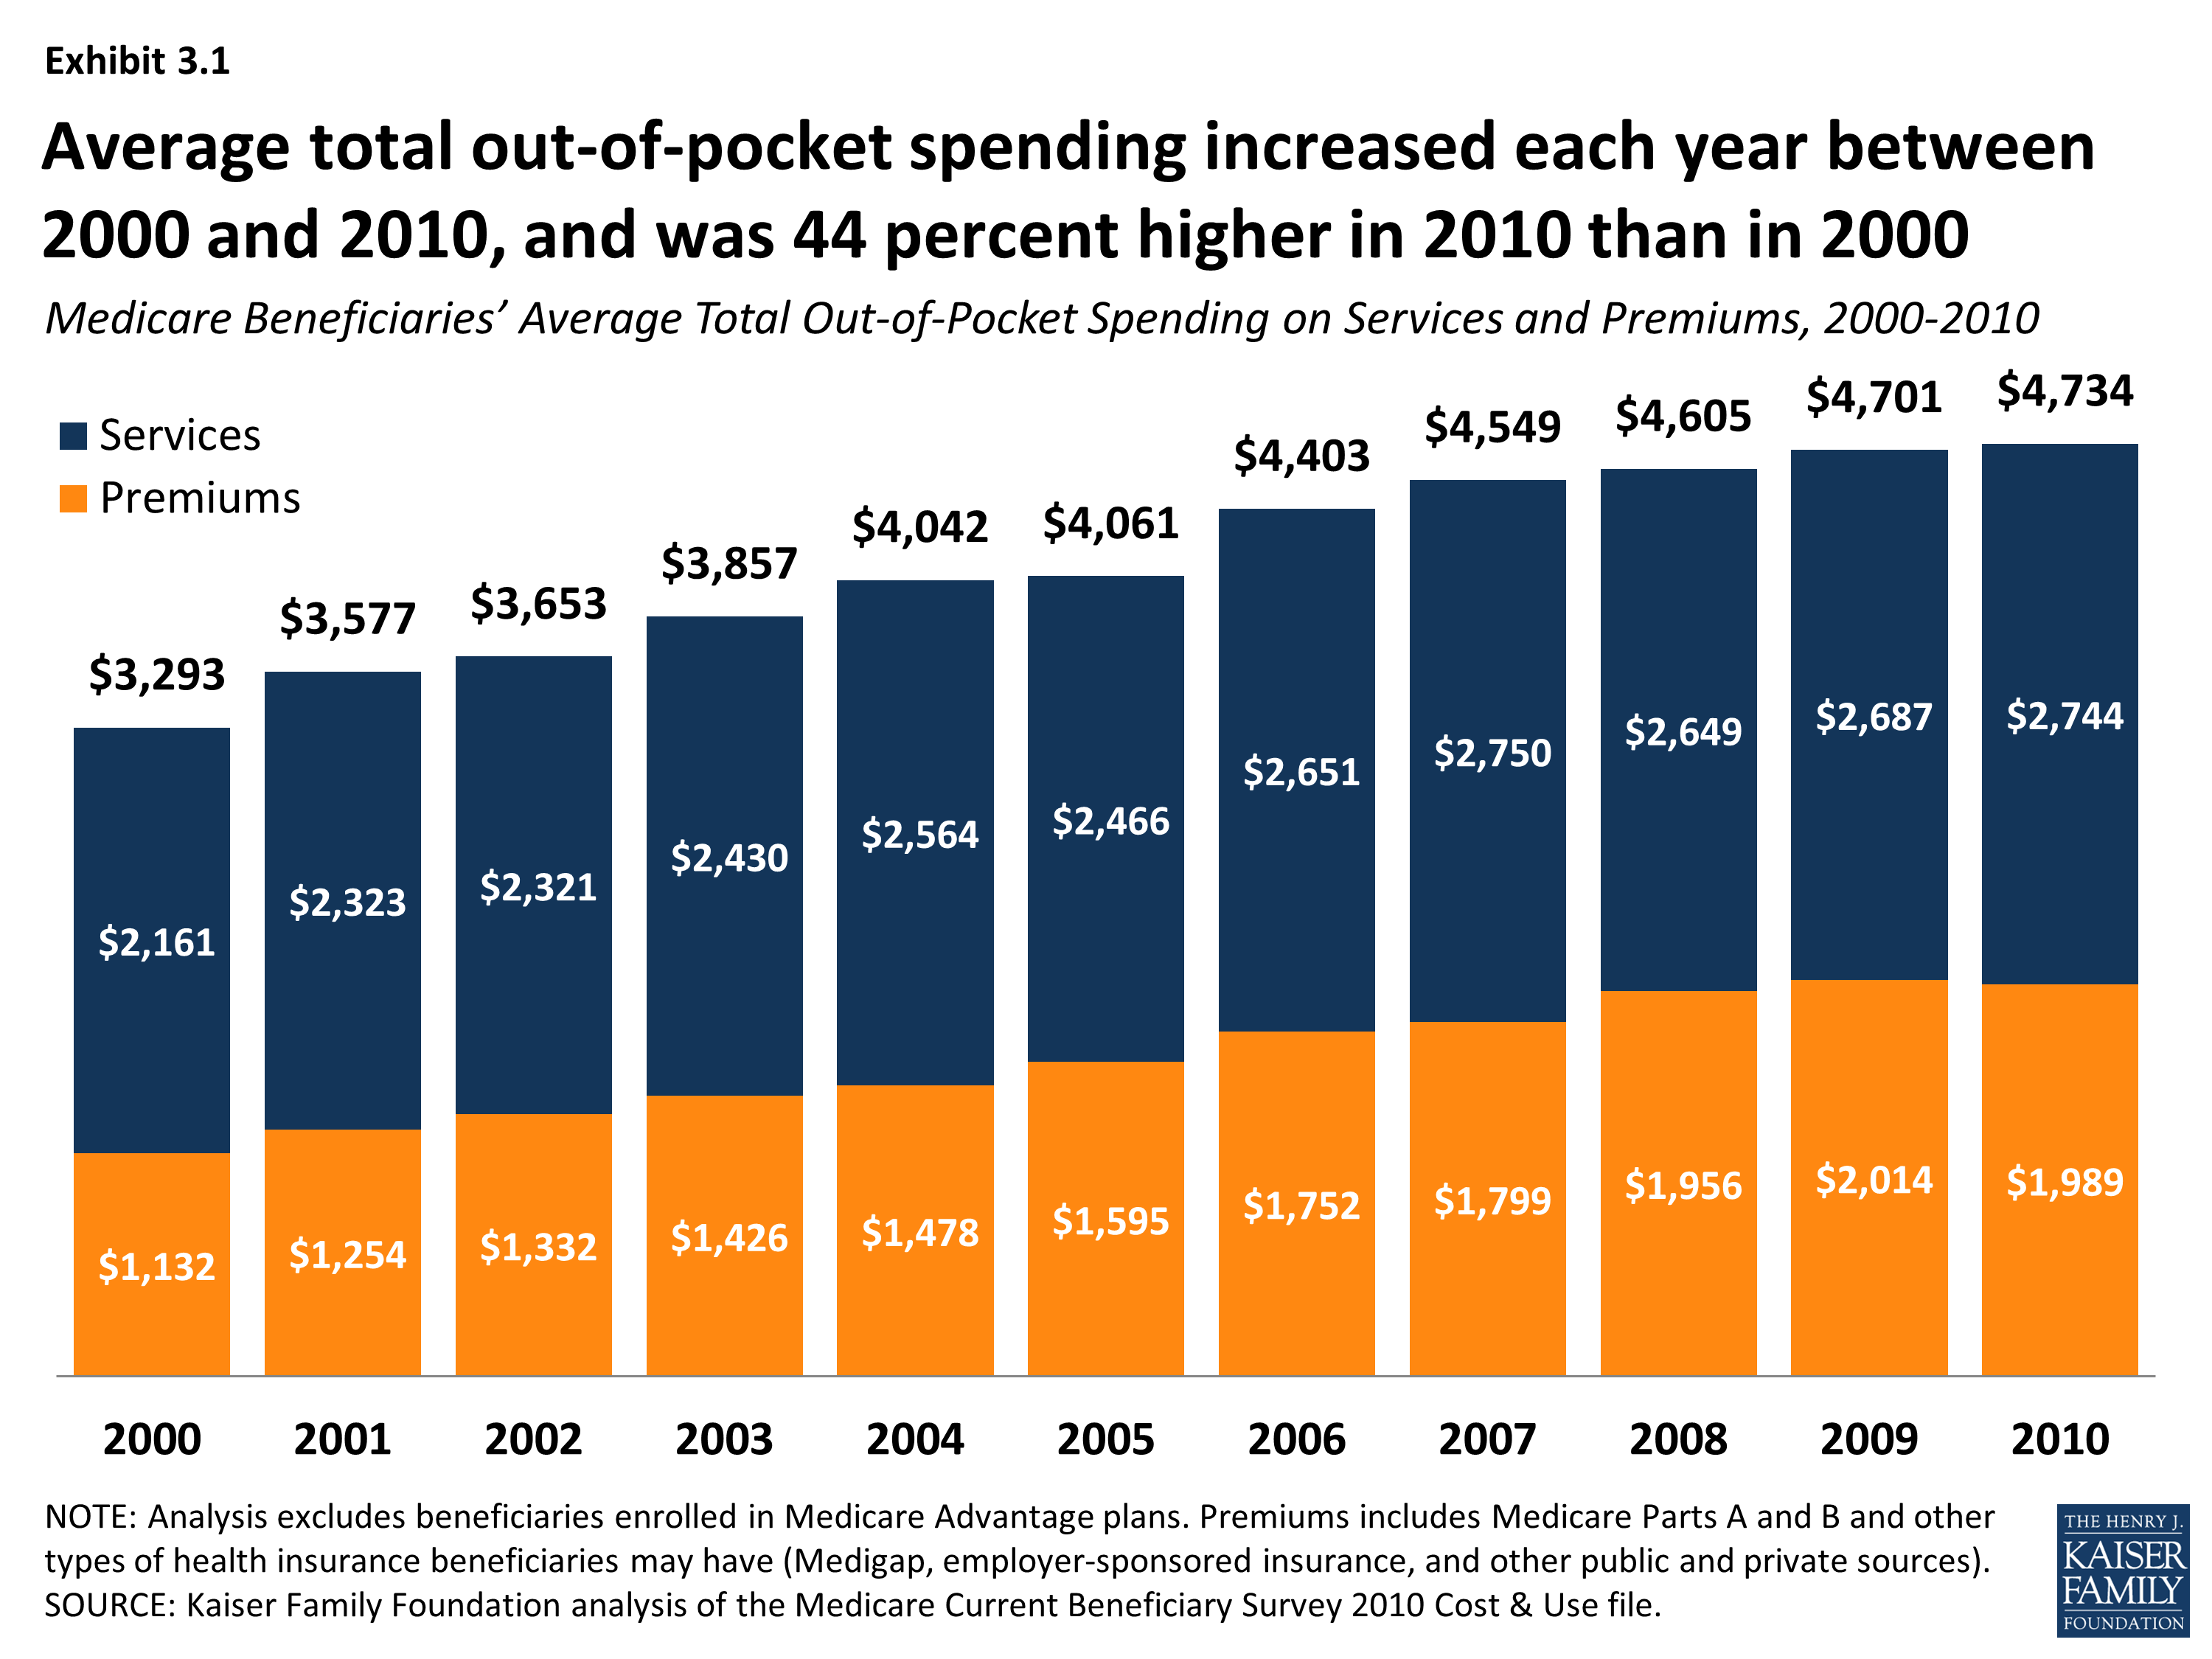
Between 2000 and 2010, average total out-of-pocket spending among beneficiaries in traditional Medicare increased from $3,293 to $4,734, a 44 percent increase.
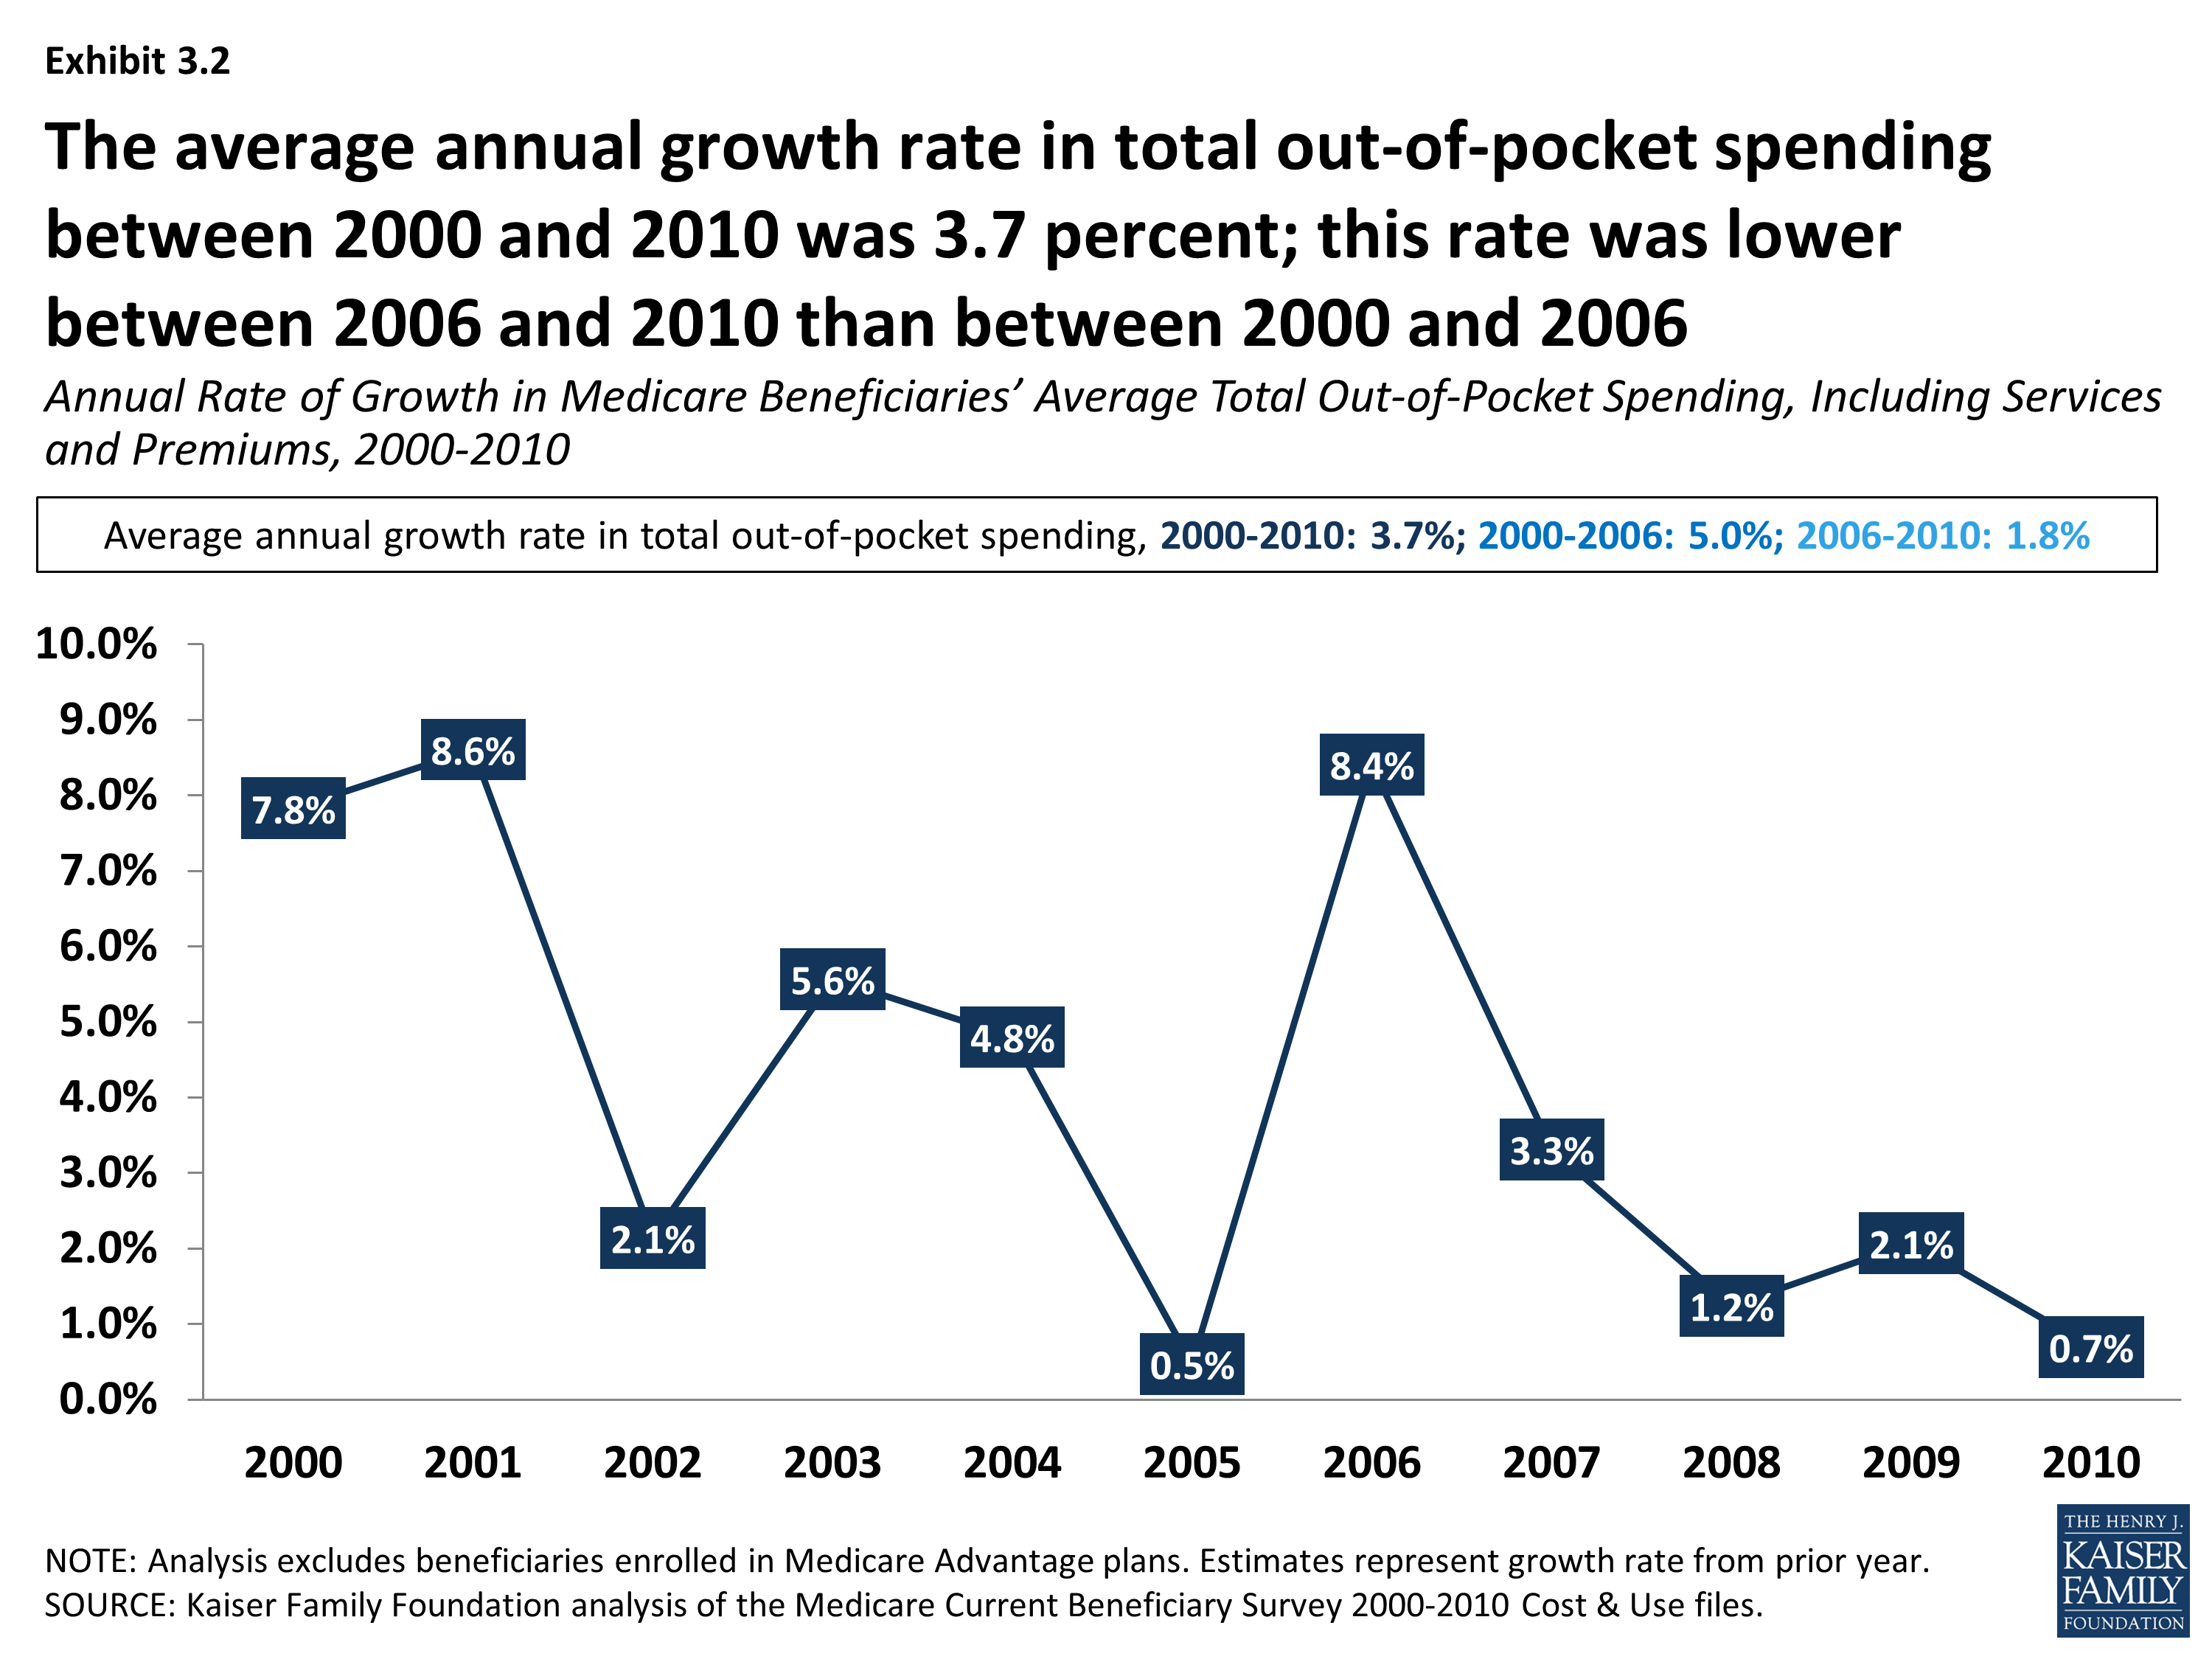
- During this period, total out-of-pocket costs increased at an average annual growth rate of 3.7 percent; the average annual growth rate between 2000 and 2010 was higher for premiums (5.8%) than for services (2.4%).
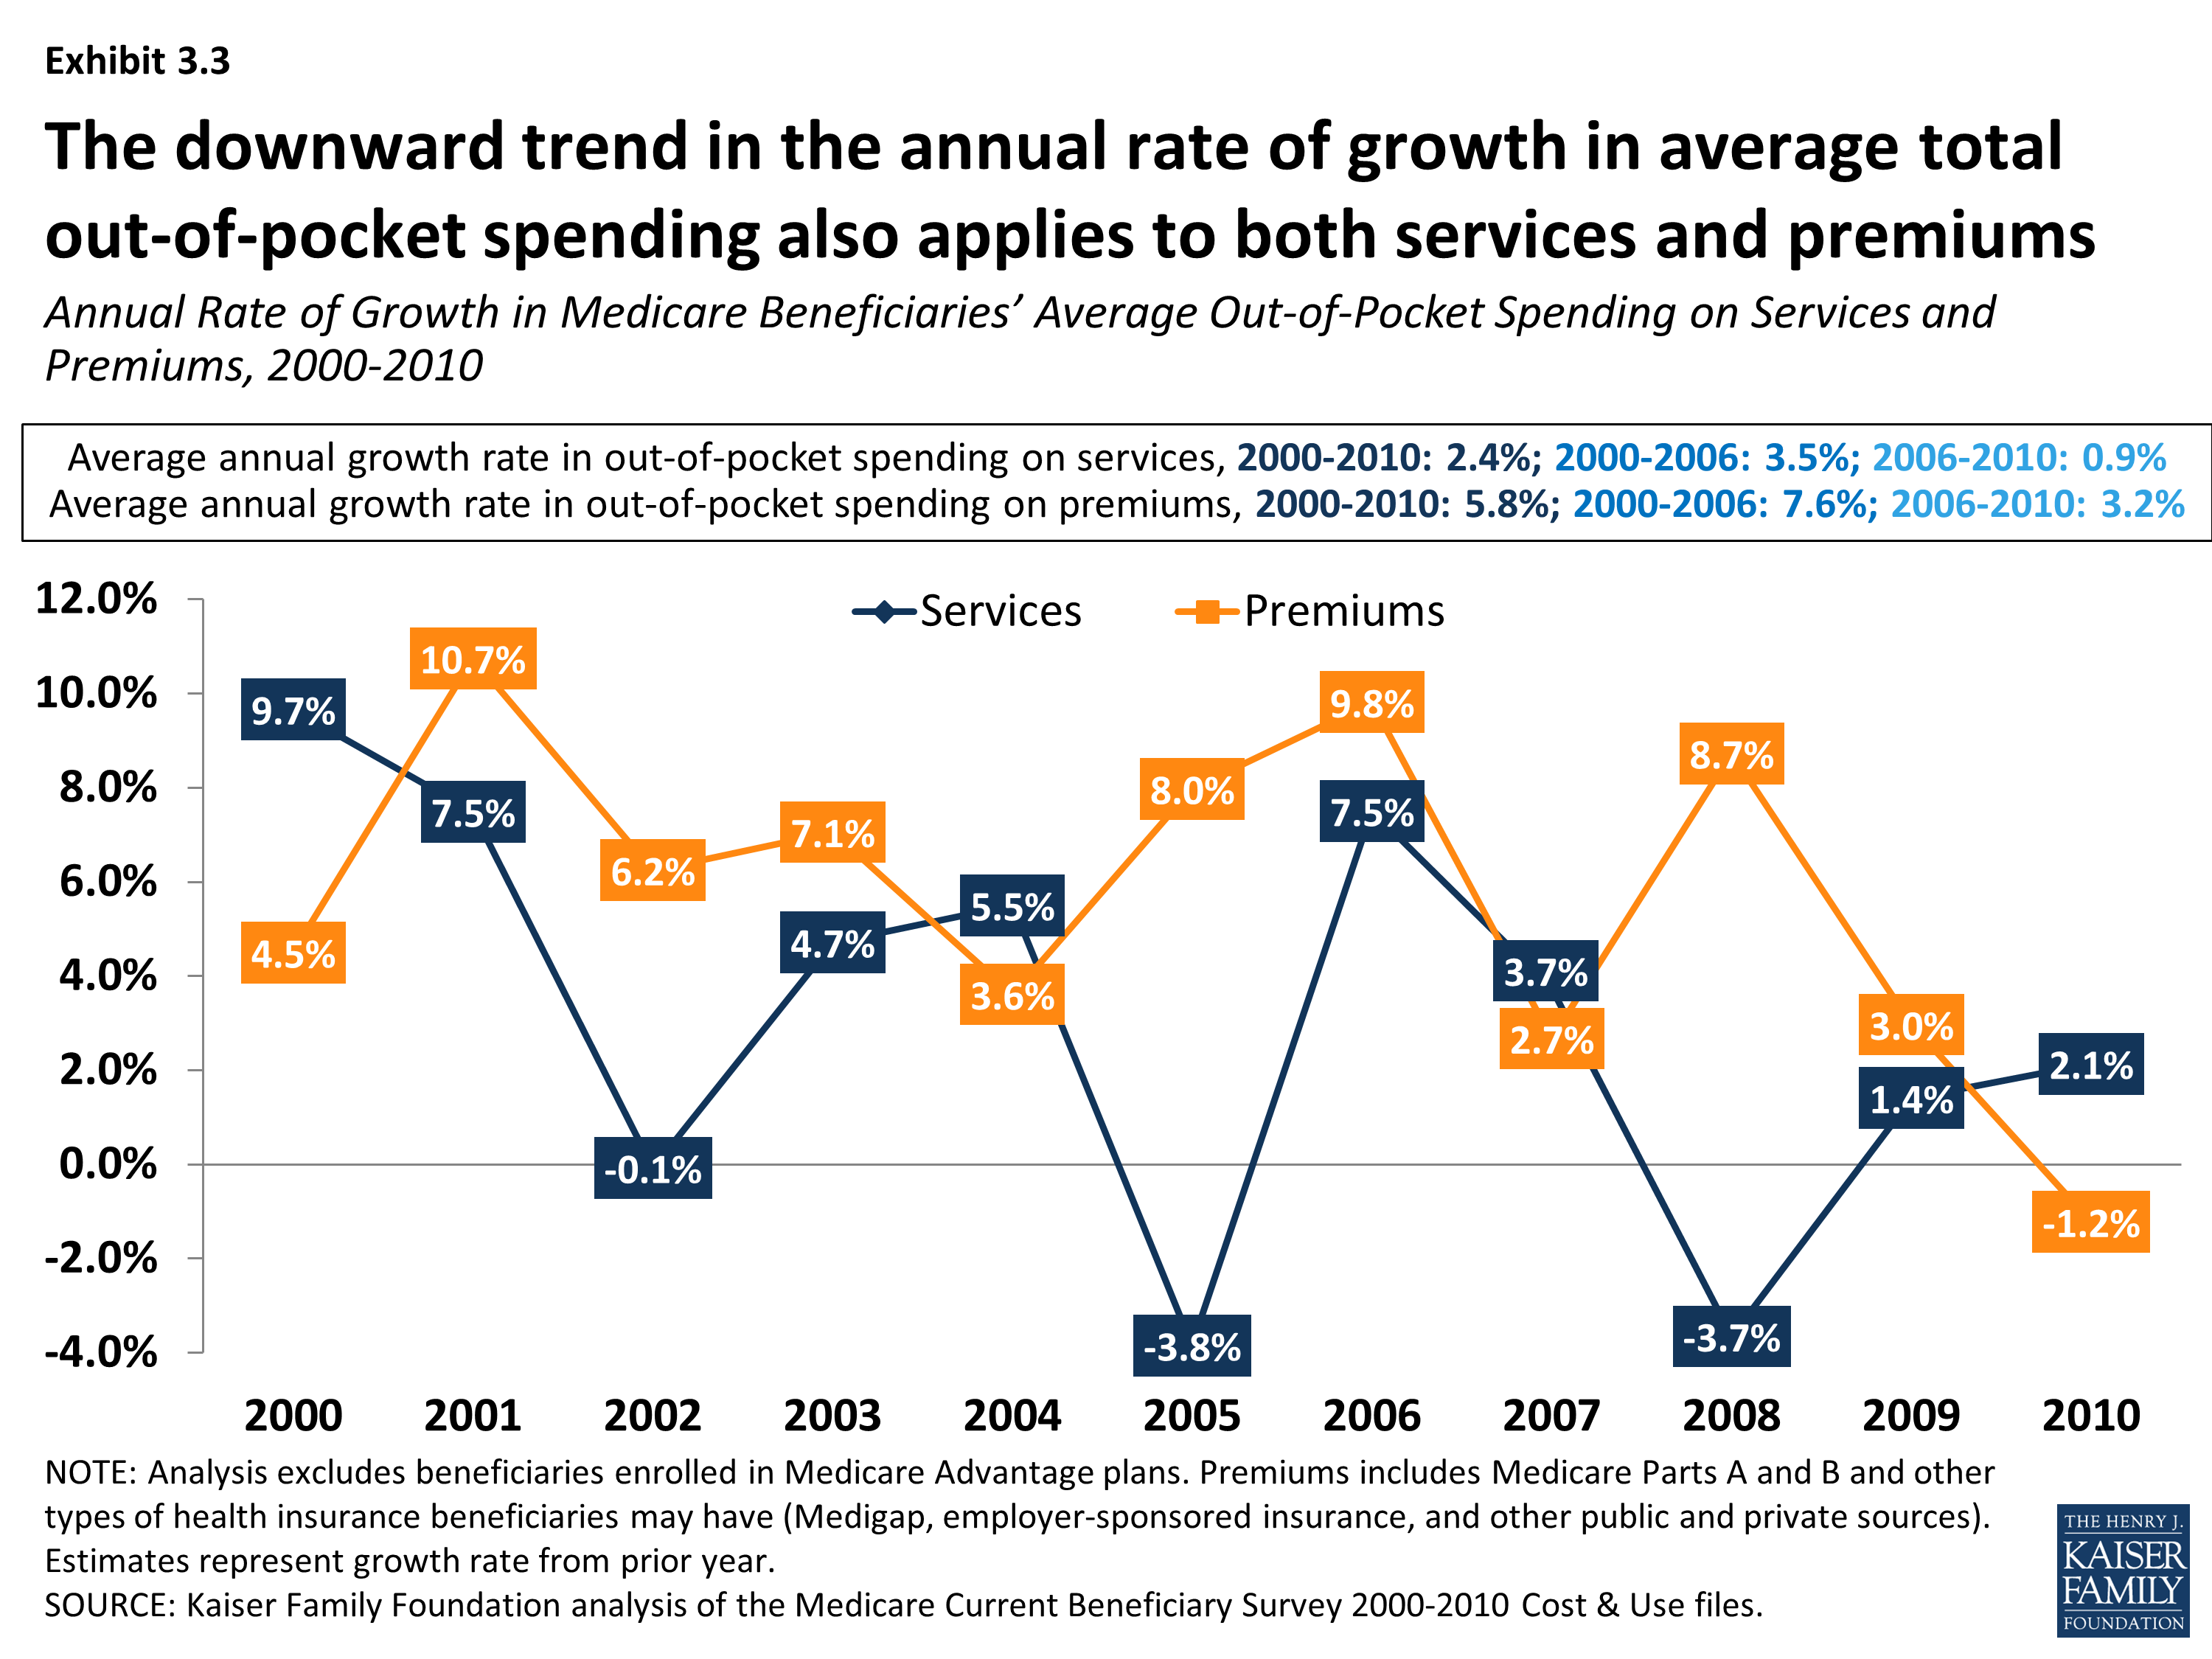
- Over these years, the average annual growth rate in out-of-pocket spending fluctuated, but trended down after 2006. Total out-of-pocket spending among beneficiaries in traditional Medicare grew at an average annual rate of 5.0 percent between 2000 and 2006, but fell to 1.8 percent between 2006 and 2010. This downward trend in the annual rate of growth in average total out-of-pocket spending also applies to both services and premiums. Out-of-pocket spending on services increased at an average annual growth rate of 3.5 percent between 2000 and 2006, but this growth rate dropped to 0.9 percent between 2006 and 2010; for premiums, the average annual growth rate decreased from 7.6 percent between 2000 and 2006 to 3.2 percent between 2006 and 2010.
Implications
The typical person on Medicare in 2010 paid about $4,700 out of pocket in premiums, cost sharing for Medicare-covered benefits, and costs for services not covered by Medicare. Even with financial protections provided by Medicare and supplemental insurance, some groups of Medicare beneficiaries incurred significantly higher out-of-pocket spending than others, which could pose challenges for those living on fixed or modest incomes. Out-of-pocket spending tends to rise with age and number of chronic conditions and functional impairments, and is greater for beneficiaries with one or more hospitalizations, particularly those who receive post-acute care.
Efforts to prevent unnecessary hospitalizations and readmissions and improve the coordination of post-acute care could not only help to reduce Medicare spending but also help to reduce out-of-pocket spending among beneficiaries with the greatest needs. Monitoring trends in out-of-pocket spending among people on Medicare in the coming years will be important in understanding whether such efforts are making a difference.
Report
Section 1: Out-of-Pocket Spending By Medicare Beneficiaries, 2010
In 2010, Medicare beneficiaries spent $4,734 out of pocket, on average, including premiums for Medicare and other types of supplemental insurance and medical and long-term care services. Premiums are a large share of average total out-of-pocket health care spending for all Medicare beneficiaries, accounting for 42 percent of spending. Of the 58 percent of average total out-of-pocket spending on services, long-term facility costs are the largest component (18%), followed by medical providers/supplies (14%) and prescription drugs (11%) (Exhibit 1.1).
Out-of-pocket spending rises with age among beneficiaries ages 65 and older and is higher for women than men, especially among those ages 85 and older; these differences are driven primarily by variation in average spending on medical and long-term care services, rather than in premium spending. Total out-of-pocket spending on services and premiums was particularly high among beneficiaries ages 85 and older who spent, on average, twice the amount spent by beneficiaries ages 65 to 74 in 2010 ($8,191 vs. $4,020). In 2010, average total out-of-pocket spending was higher for women than men ($5,036 vs. $4,363, respectively, in 2010), and this difference grew somewhat wider with age. Women ages 85 and over spent an average of $8,574 while men ages 85 and over spent an average of $7,399—a difference of nearly $1,200. This difference is primarily attributable to higher long-term care facility costs among older women (Exhibit 1.2) and (Exhibit 1.3).
Beneficiaries’ health status and chronic conditions also are significant drivers of out-of-pocket spending, primarily due to large differences in spending on health and long-term care services. Not surprisingly, those beneficiaries with poorer self-reported health status spend more than those who rate themselves in better health. In 2010, beneficiaries in poor health spent around $1,700 more out of pocket in total than those in excellent or very good health, on average (Exhibit 1.4). Those in poor health spent less on premiums than those in excellent health ($1,295 vs. $2,283, on average) but significantly more on medical and long-term care services ($4,505 vs. $1,774). Average total out-of-pocket spending also rises with the number of functional impairments and chronic conditions beneficiaries have, and is especially high among those with three or more limitations in activities of daily living (Exhibit 1.5). Beneficiaries with Alzheimer’s disease, Parkinson’s disease, and end-stage renal disease (ESRD) incurred significantly higher out-of-pocket spending than beneficiaries with certain other conditions (averaging $9,836, $7,702 and $6,918, respectively, in total, including $8,305, $5,841, and $5,439 on services alone), but their higher costs were driven by using more and different types of services (Exhibit 1.6). For example, for those with Alzheimer’s, long-term care facility costs accounted for a majority of their out-of-pocket costs in 2010, while those with ESRD faced higher out-of-pocket costs for medical services. Among chronic conditions, Alzheimer’s disease is one of the most costly in terms of out-of-pocket spending, primarily due to long-term care facility expenses.
The types of medical services beneficiaries use leads to large differences in average total out-of-pocket spending; in particular, being hospitalized and using post-acute skilled nursing facility services. Being hospitalized leads to higher total out-of-pocket spending, on average, compared to those without an inpatient hospital stay (Exhibit 1.7). In 2010, roughly one in five Medicare beneficiaries experienced an inpatient hospital stay; those with one inpatient stay had average total out-of-pocket spending more than 50 percent higher than those without a hospital stay ($6,458 vs. $4,202) and their spending on services was twice as high, on average ($4,475 vs. $2,199). Those with two or more inpatient stays spent nearly twice as much in total as those without a hospital stay, on average ($8,053 vs. $4,202) and their average spending on services was nearly three times as much ($6,216 vs. $2,199). Patients with a hospital readmission within 30 days in 2010 spent on average roughly $1,200 more on services than those with only one inpatient stay ($5,687 vs. $4,475, respectively), including higher spending for medical providers/supplies, inpatient services, and skilled nursing facility services (Exhibit 1.8).
Among Medicare beneficiaries with an inpatient hospital stay, skilled nursing facility users spend substantially more out of pocket than others, on average, particularly long-term care facility residents. Among beneficiaries who were hospitalized in 2010, those who received post-acute care in a SNF had significantly higher total out-of-pocket spending than those who were discharged without SNF care ($11,434 vs. $5,574, respectively, on average); their spending on medical and long-term care services was 2.5 times greater ($9,508 vs. $3,645); these average amounts were even larger for long-term care facility residents with an inpatient stay and post-acute SNF care (Exhibit 1.9). For this group, out-of-pocket spending on SNF services among those with a hospital stay and SNF care averaged $4,258 in 2010, seven times greater than average SNF spending among community residents ($595) (Exhibit 1.10). These beneficiaries also spent nearly twice as many days in a SNF than community residents in 2010 (49 days vs. 28 days, on average).1
Whether beneficiaries live in the community or in long-term care facilities produces significant differences in the average amount spent out of pocket on services and where those dollars go. Community residents spent $1,858 out of pocket in 2010 on medical and long-term care services, on average, while long-term care facility residents spent $17,534 on average. For the majority of Medicare beneficiaries who lived in the community in 2010, medical providers/supplies accounted for just over one-third of average out-of-pocket service spending ($647), followed by prescription drugs ($542) and dental services ($320) (Exhibit 1.11). For the six percent of beneficiaries who were long-term care facility residents in 2010, the largest component of average out-of-pocket service spending was long-term care facility costs ($14,474)—which is not surprising, given the high cost of long-term care (Exhibit 1.12). This average amount is substantially lower than the total annual cost of nursing home care because the average includes significantly lower annual long-term care facility spending by beneficiaries who had either full-year or part-year Medicaid coverage for their long-term care costs. In addition to their higher spending on long-term care facilities, facility residents spent more out of pocket than community residents for medical services in 2010, on average ($3,060 vs. $1,819), more than half of which ($1,689) was for skilled nursing facility stays (Exhibit 1.13).
The use of dental services and out-of-pocket spending on dental care varies among beneficiaries. Although dental services are not covered by Medicare, people continue to need and use dental care as they age. However, less than a quarter of those in poor health reported visiting a dentist in 2010, and they spent far less on dental care than beneficiaries in better health (Exhibit 1.14). Average out-of-pocket spending on dental services was highest among beneficiaries in excellent health—a majority of whom (57%) visited a dentist in 2010—and five times higher than those in poor health ($538 vs. $111, respectively).
While premiums for Medicare and supplemental insurance are a significant component of total out-of-pocket spending by Medicare beneficiaries, our analysis shows less variation across different groups of beneficiaries in out-of-pocket costs for premiums than for services; premiums do vary, however, by age, income, and supplemental coverage. Among beneficiaries ages 65 and older, there is little variation in premiums by age group, while beneficiaries under age 65 with disabilities pay lower premiums than older beneficiaries (Exhibit 1.2). This is most likely related to the fact that a relatively large share of Medicare beneficiaries under age 65 is also covered by Medicaid and thus not liable for premiums. Average premiums are generally similar for beneficiaries with incomes above $20,000, but lower for beneficiaries with lower incomes, most likely due to three factors: 1) lower-income beneficiaries with Medicaid typically do not pay premiums; 2) lower-income beneficiaries with full Medicaid benefits have little need for supplemental coverage; and 3) lower-income beneficiaries without Medicaid may not be able to afford supplemental insurance (Exhibit 1.15).
Beneficiaries with Medigap supplemental policies pay higher premiums than those with employer-sponsored retiree health coverage, while those with Medicaid pay significantly lower premiums, on average. In 2010, beneficiaries with Medigap supplemental insurance policies paid more in supplemental insurance premiums than beneficiaries with employer-sponsored retiree health insurance, on average ($2,166 and $1,335, respectively) (Exhibit 1.16). Supplemental insurance premiums accounted for more than one-third of average total out-of-pocket spending by Medigap policyholders. Medicare beneficiaries enrolled in Medicaid face lower out-of-pocket costs if they are full-year enrollees or community residents, and higher costs if they are part-year enrollees or long-term care facility residents (Exhibit 1.17).

Distribution of Average Total Out-of-Pocket Spending on Services and Premiums by Medicare Beneficiaries, 2010
Medicare Beneficiaries’ Average Total Out-of-Pocket Spending on Services and Premiums, by Gender and Age, 2010
Medicare Beneficiaries’ Average Total Out-of-Pocket Spending on Services and Premiums, Gender by Age Groups, 2010
Medicare Beneficiaries’ Average Total Out-of-Pocket Spending on Services and Premiums, by Self-Reported Health Status, 2010
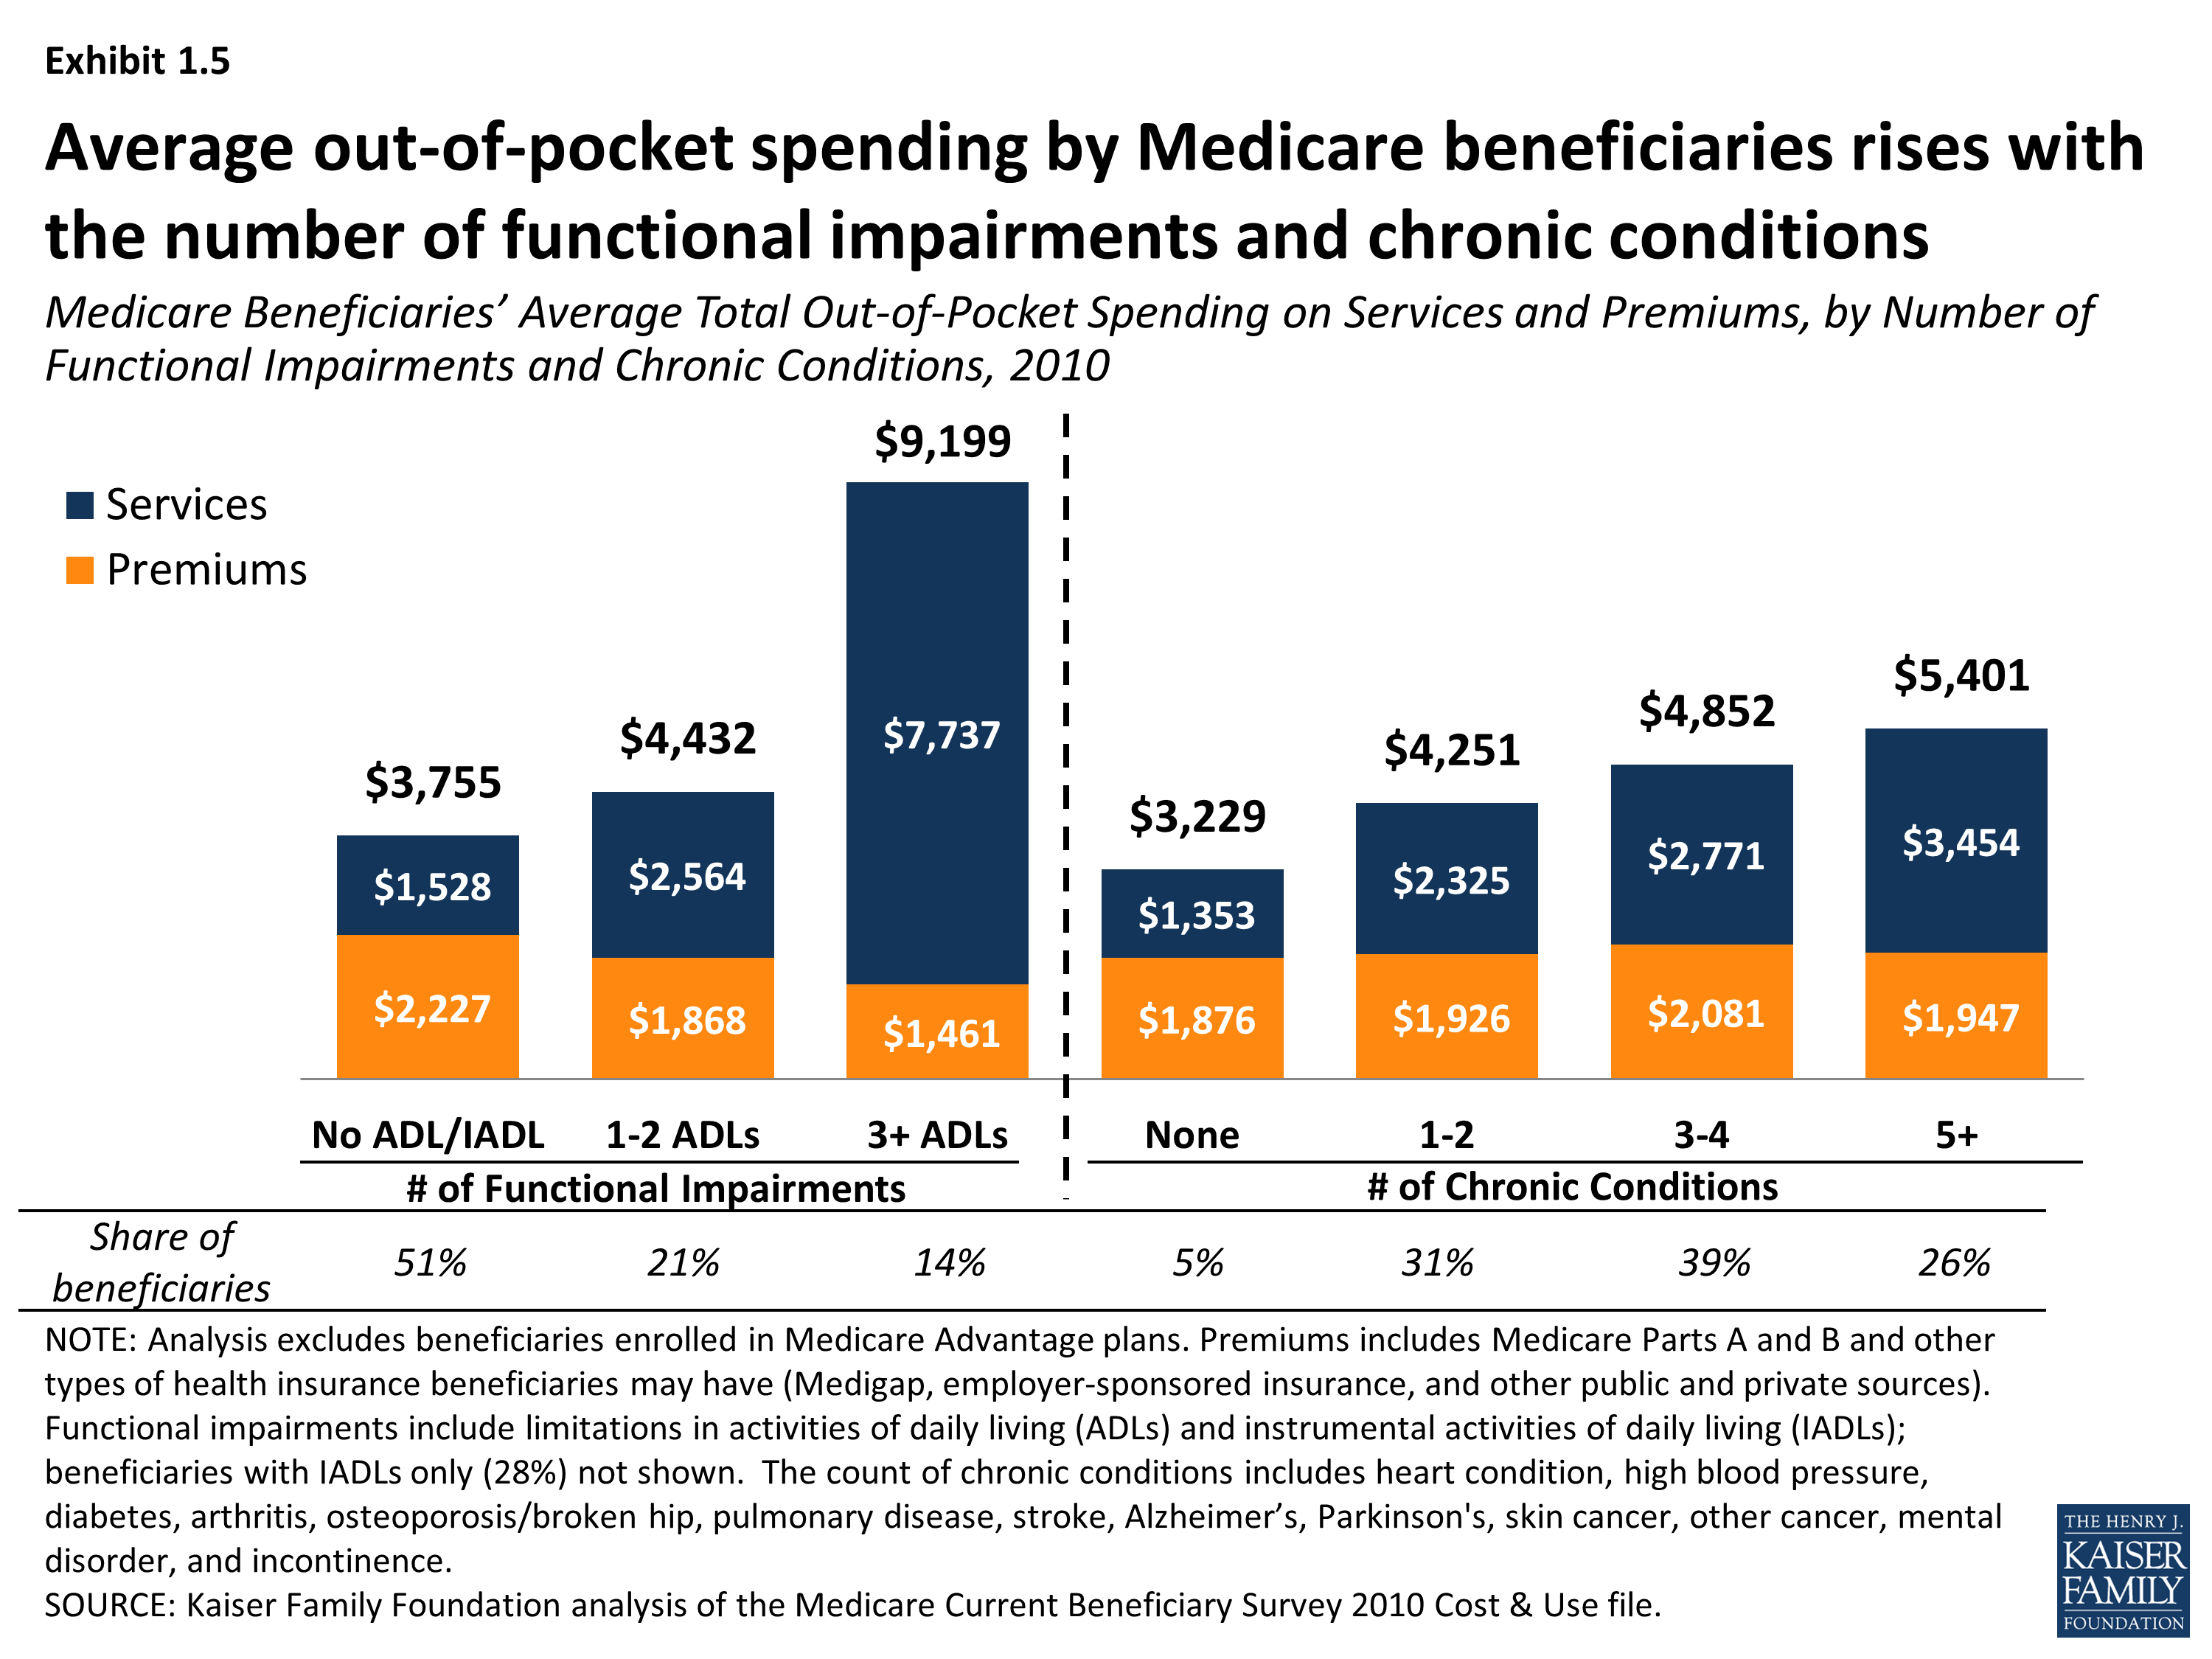
Medicare Beneficiaries’ Average Total Out-of-Pocket Spending on Services and Premiums, by Number of Functional Impairments and Chronic Conditions, 2010
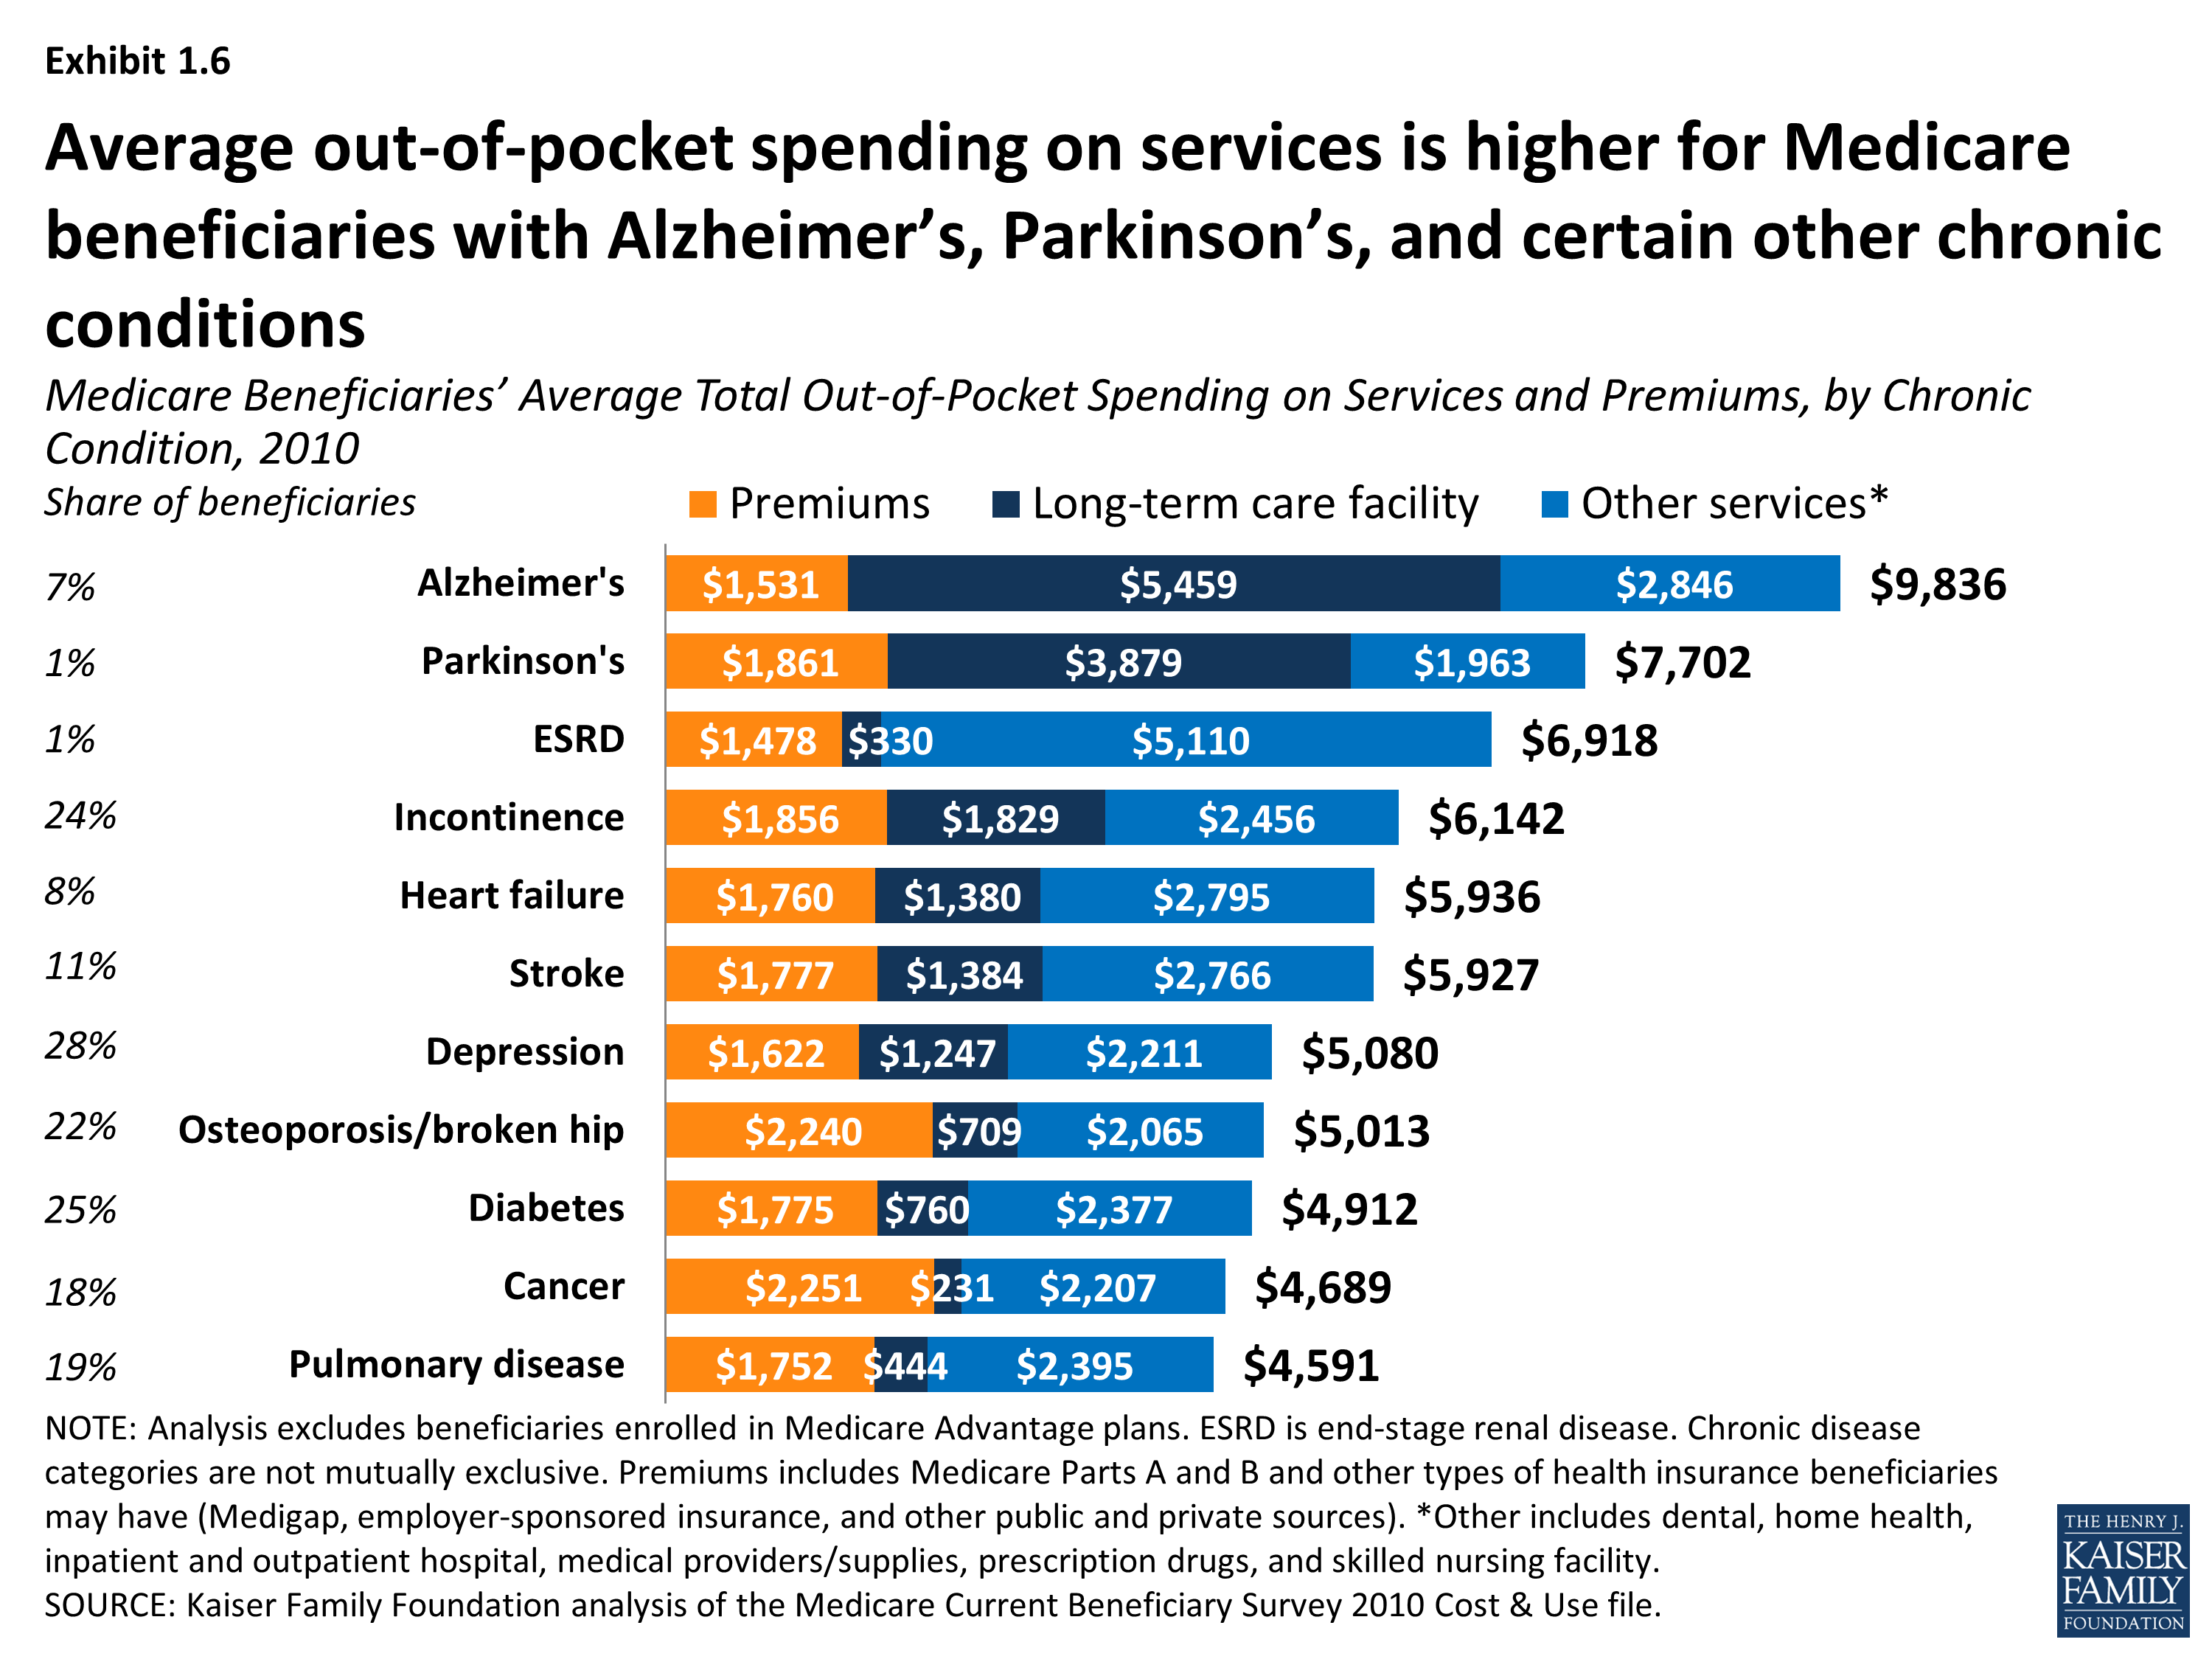
Medicare Beneficiaries’ Average Total Out-of-Pocket Spending on Services and Premiums,by Chronic Condition, 2010
Medicare Beneficiaries’ Average Total Out-of-Pocket Spending on Services and Premiums, by Inpatient Hospital Use, 2010
Medicare Beneficiaries’ Average Out-of-Pocket Spending on Services, by Inpatient Hospital Use, 2010
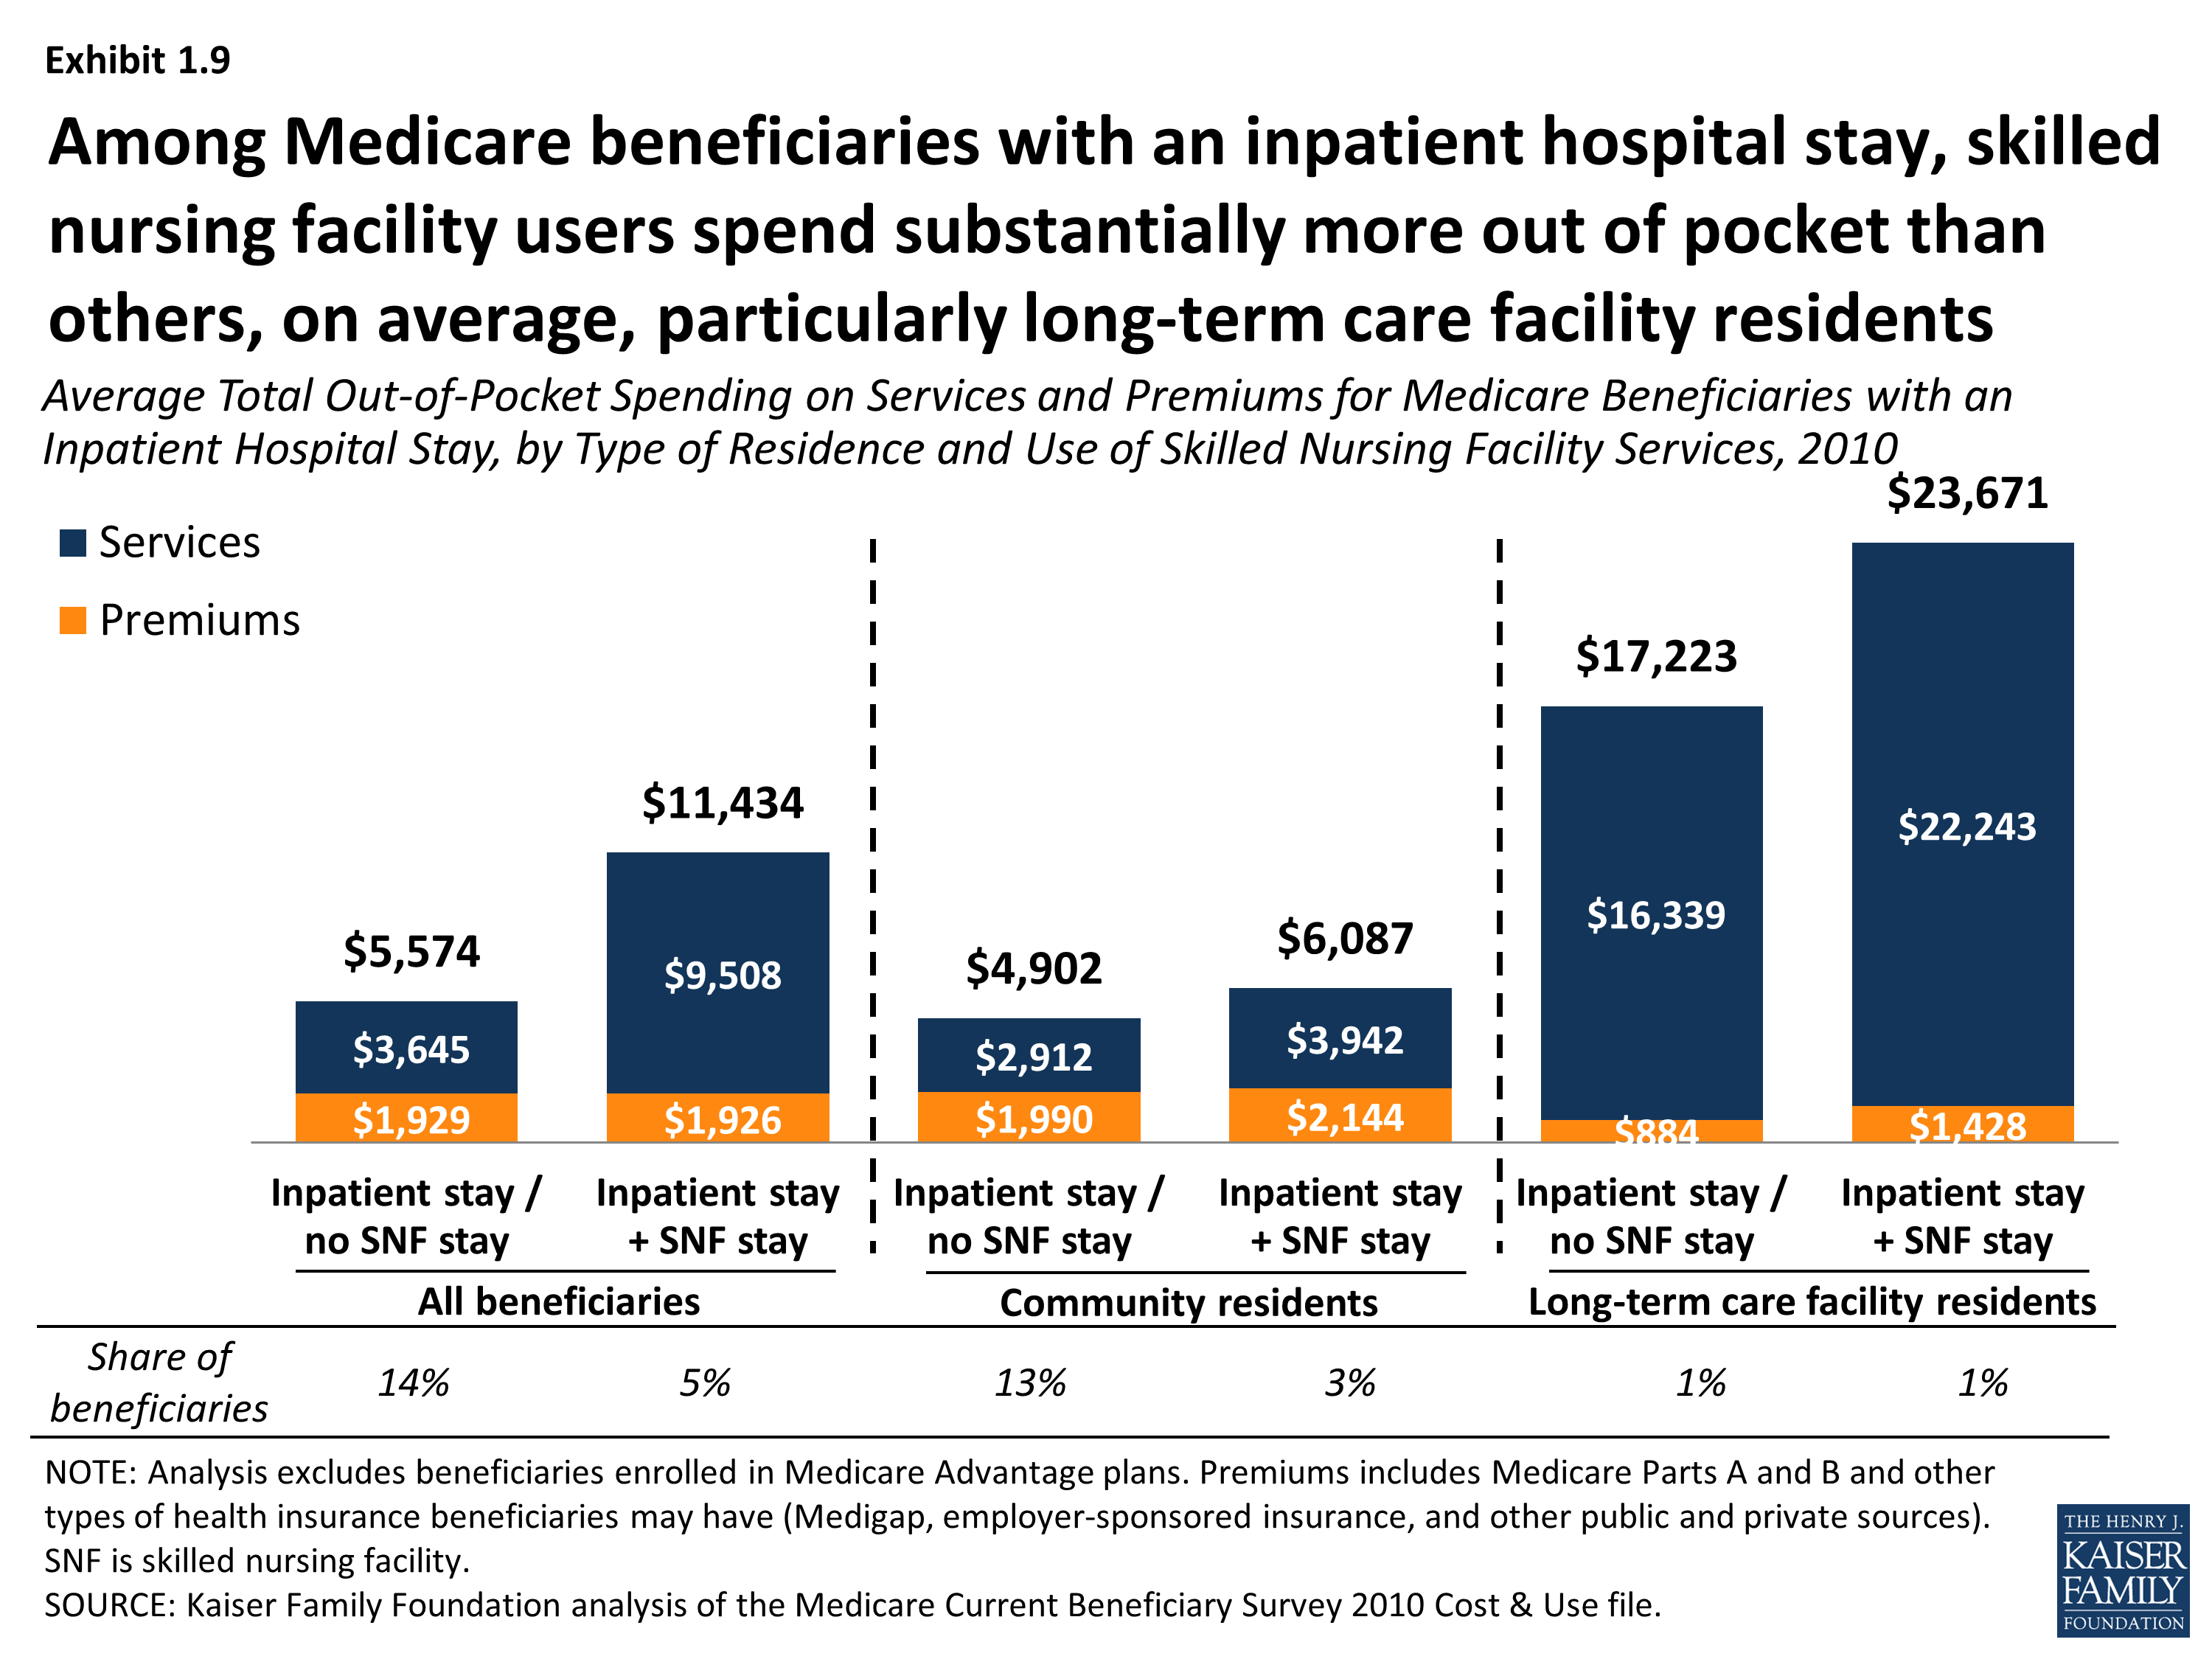
Average Total Out-of-Pocket Spending on Services and Premiums for Medicare Beneficiaries with an Inpatient Hospital Stay, by Type of Residence and Use of Skilled Nursing Facility Services, 2010
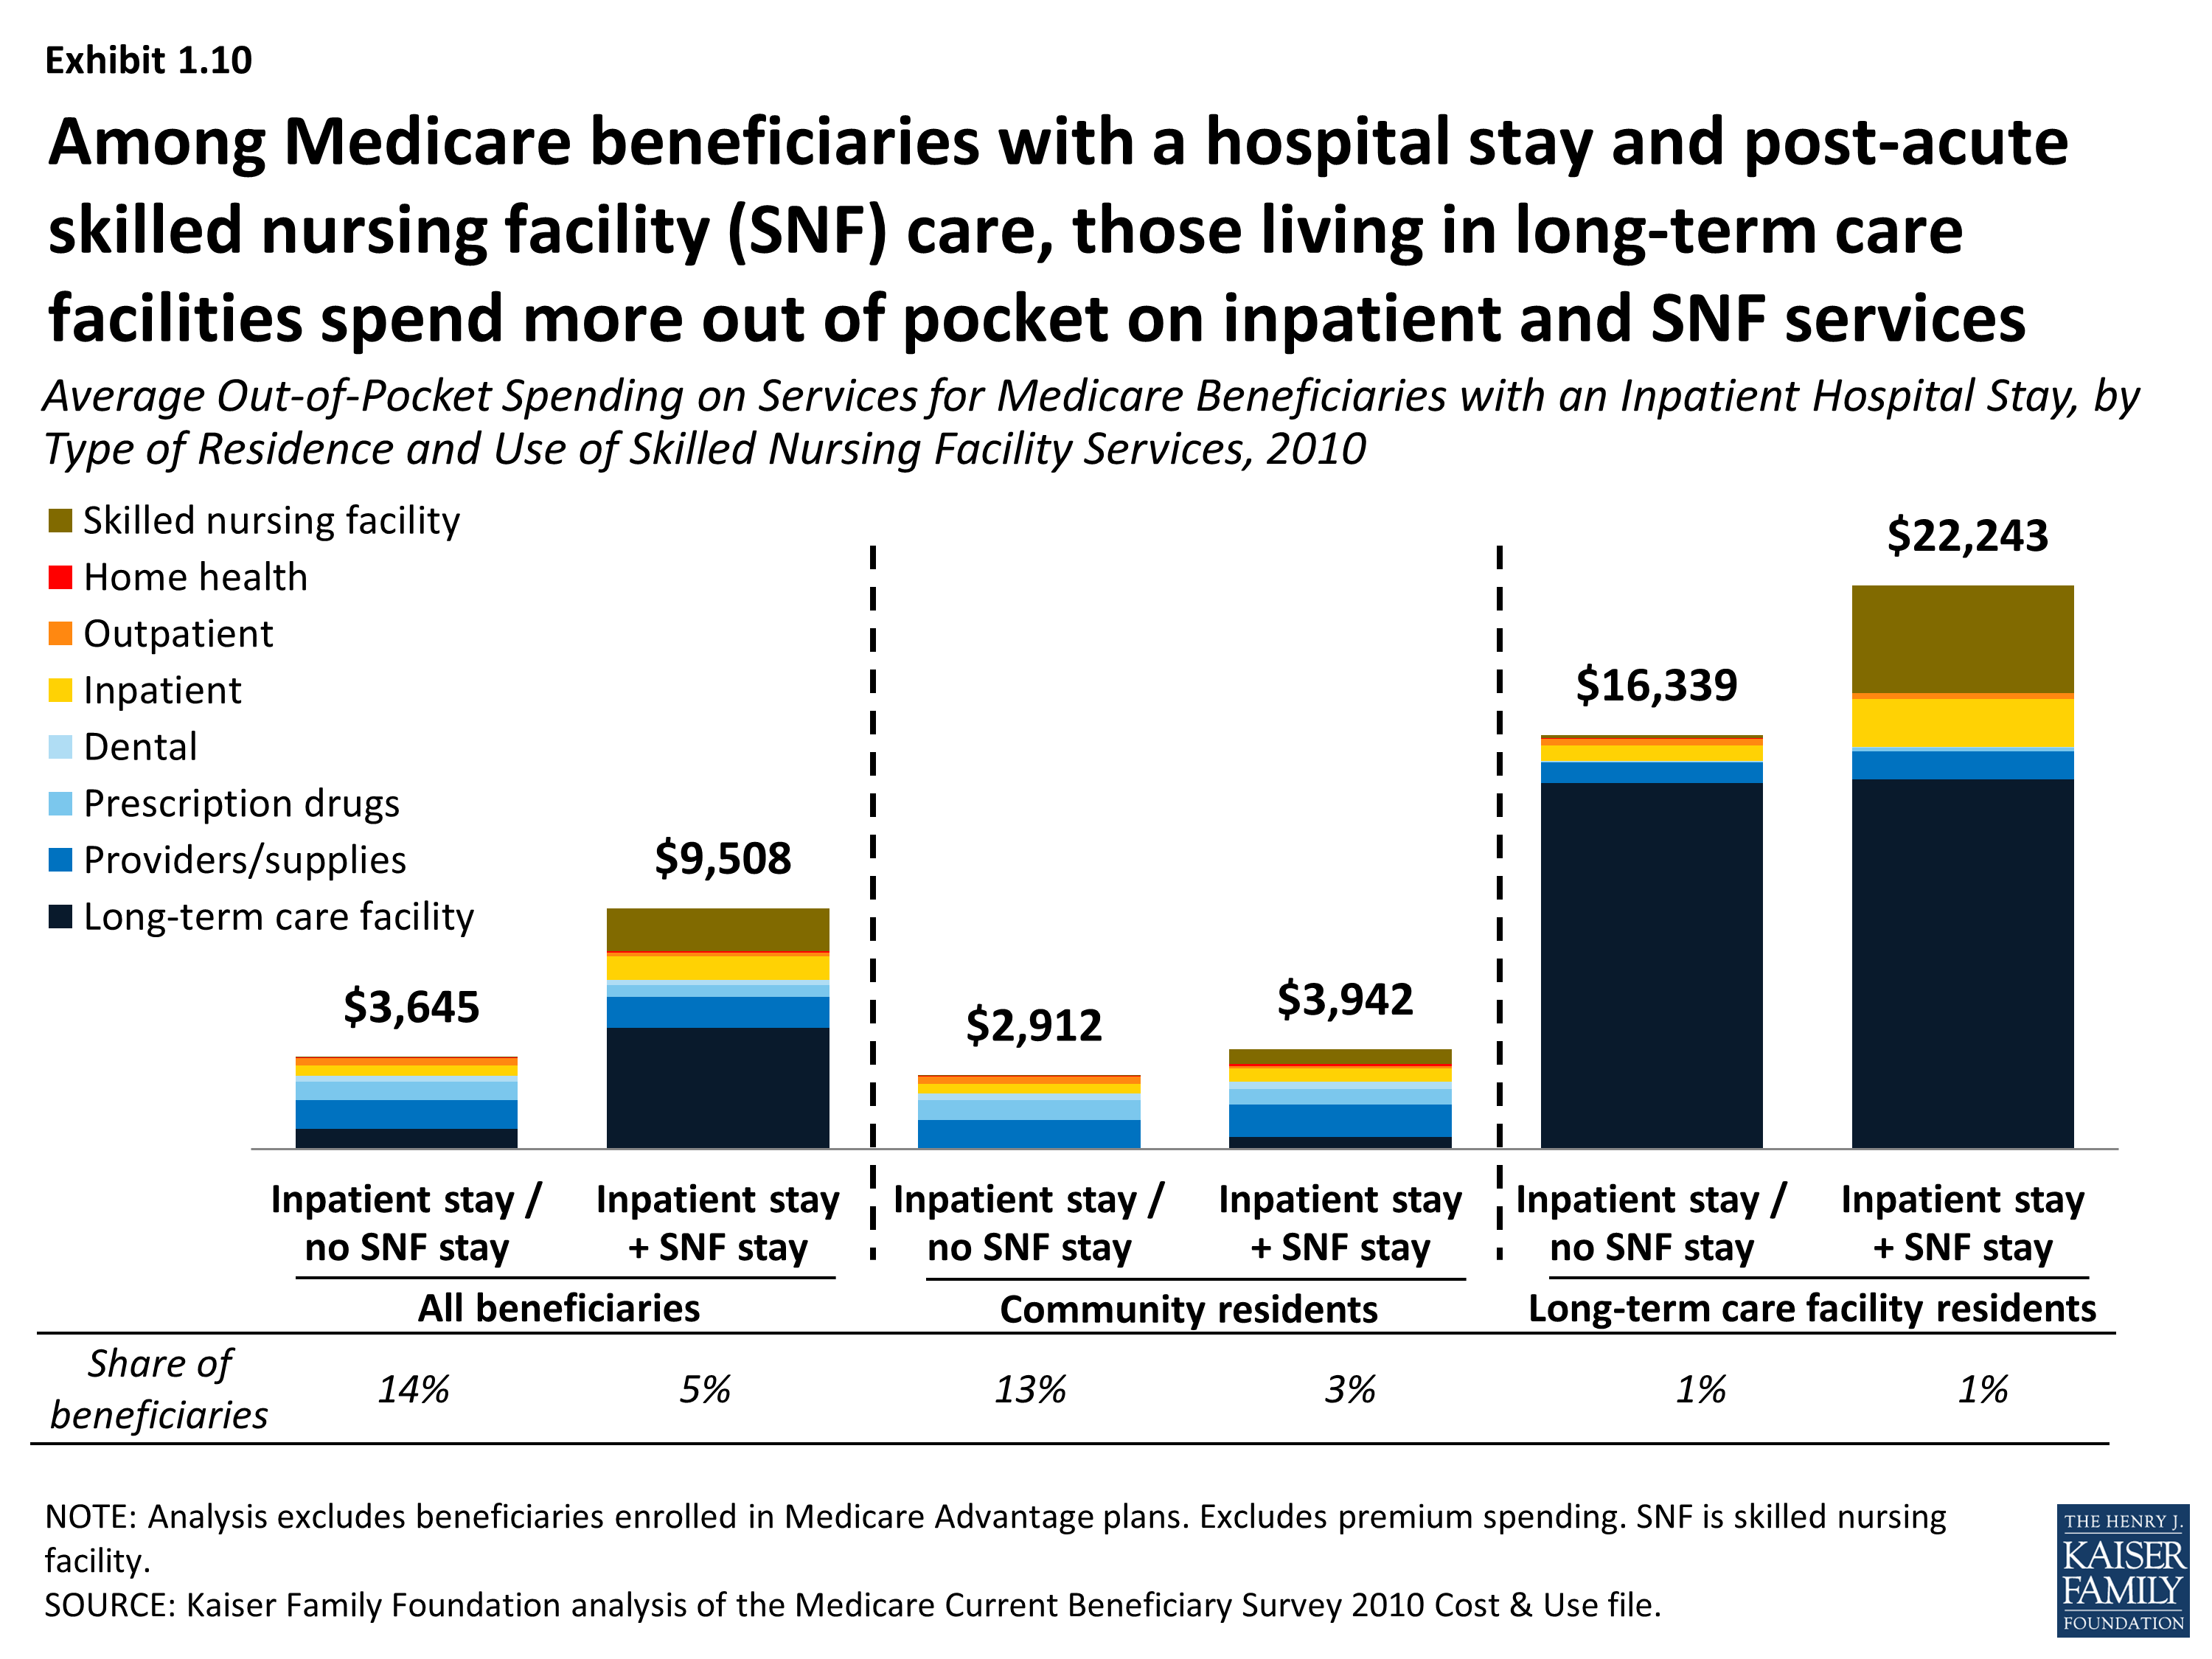
Average Out-of-Pocket Spending on Services for Medicare Beneficiaries with an Inpatient Hospital Stay, by Type of Residence and Use of Skilled Nursing Facility Services, 2010
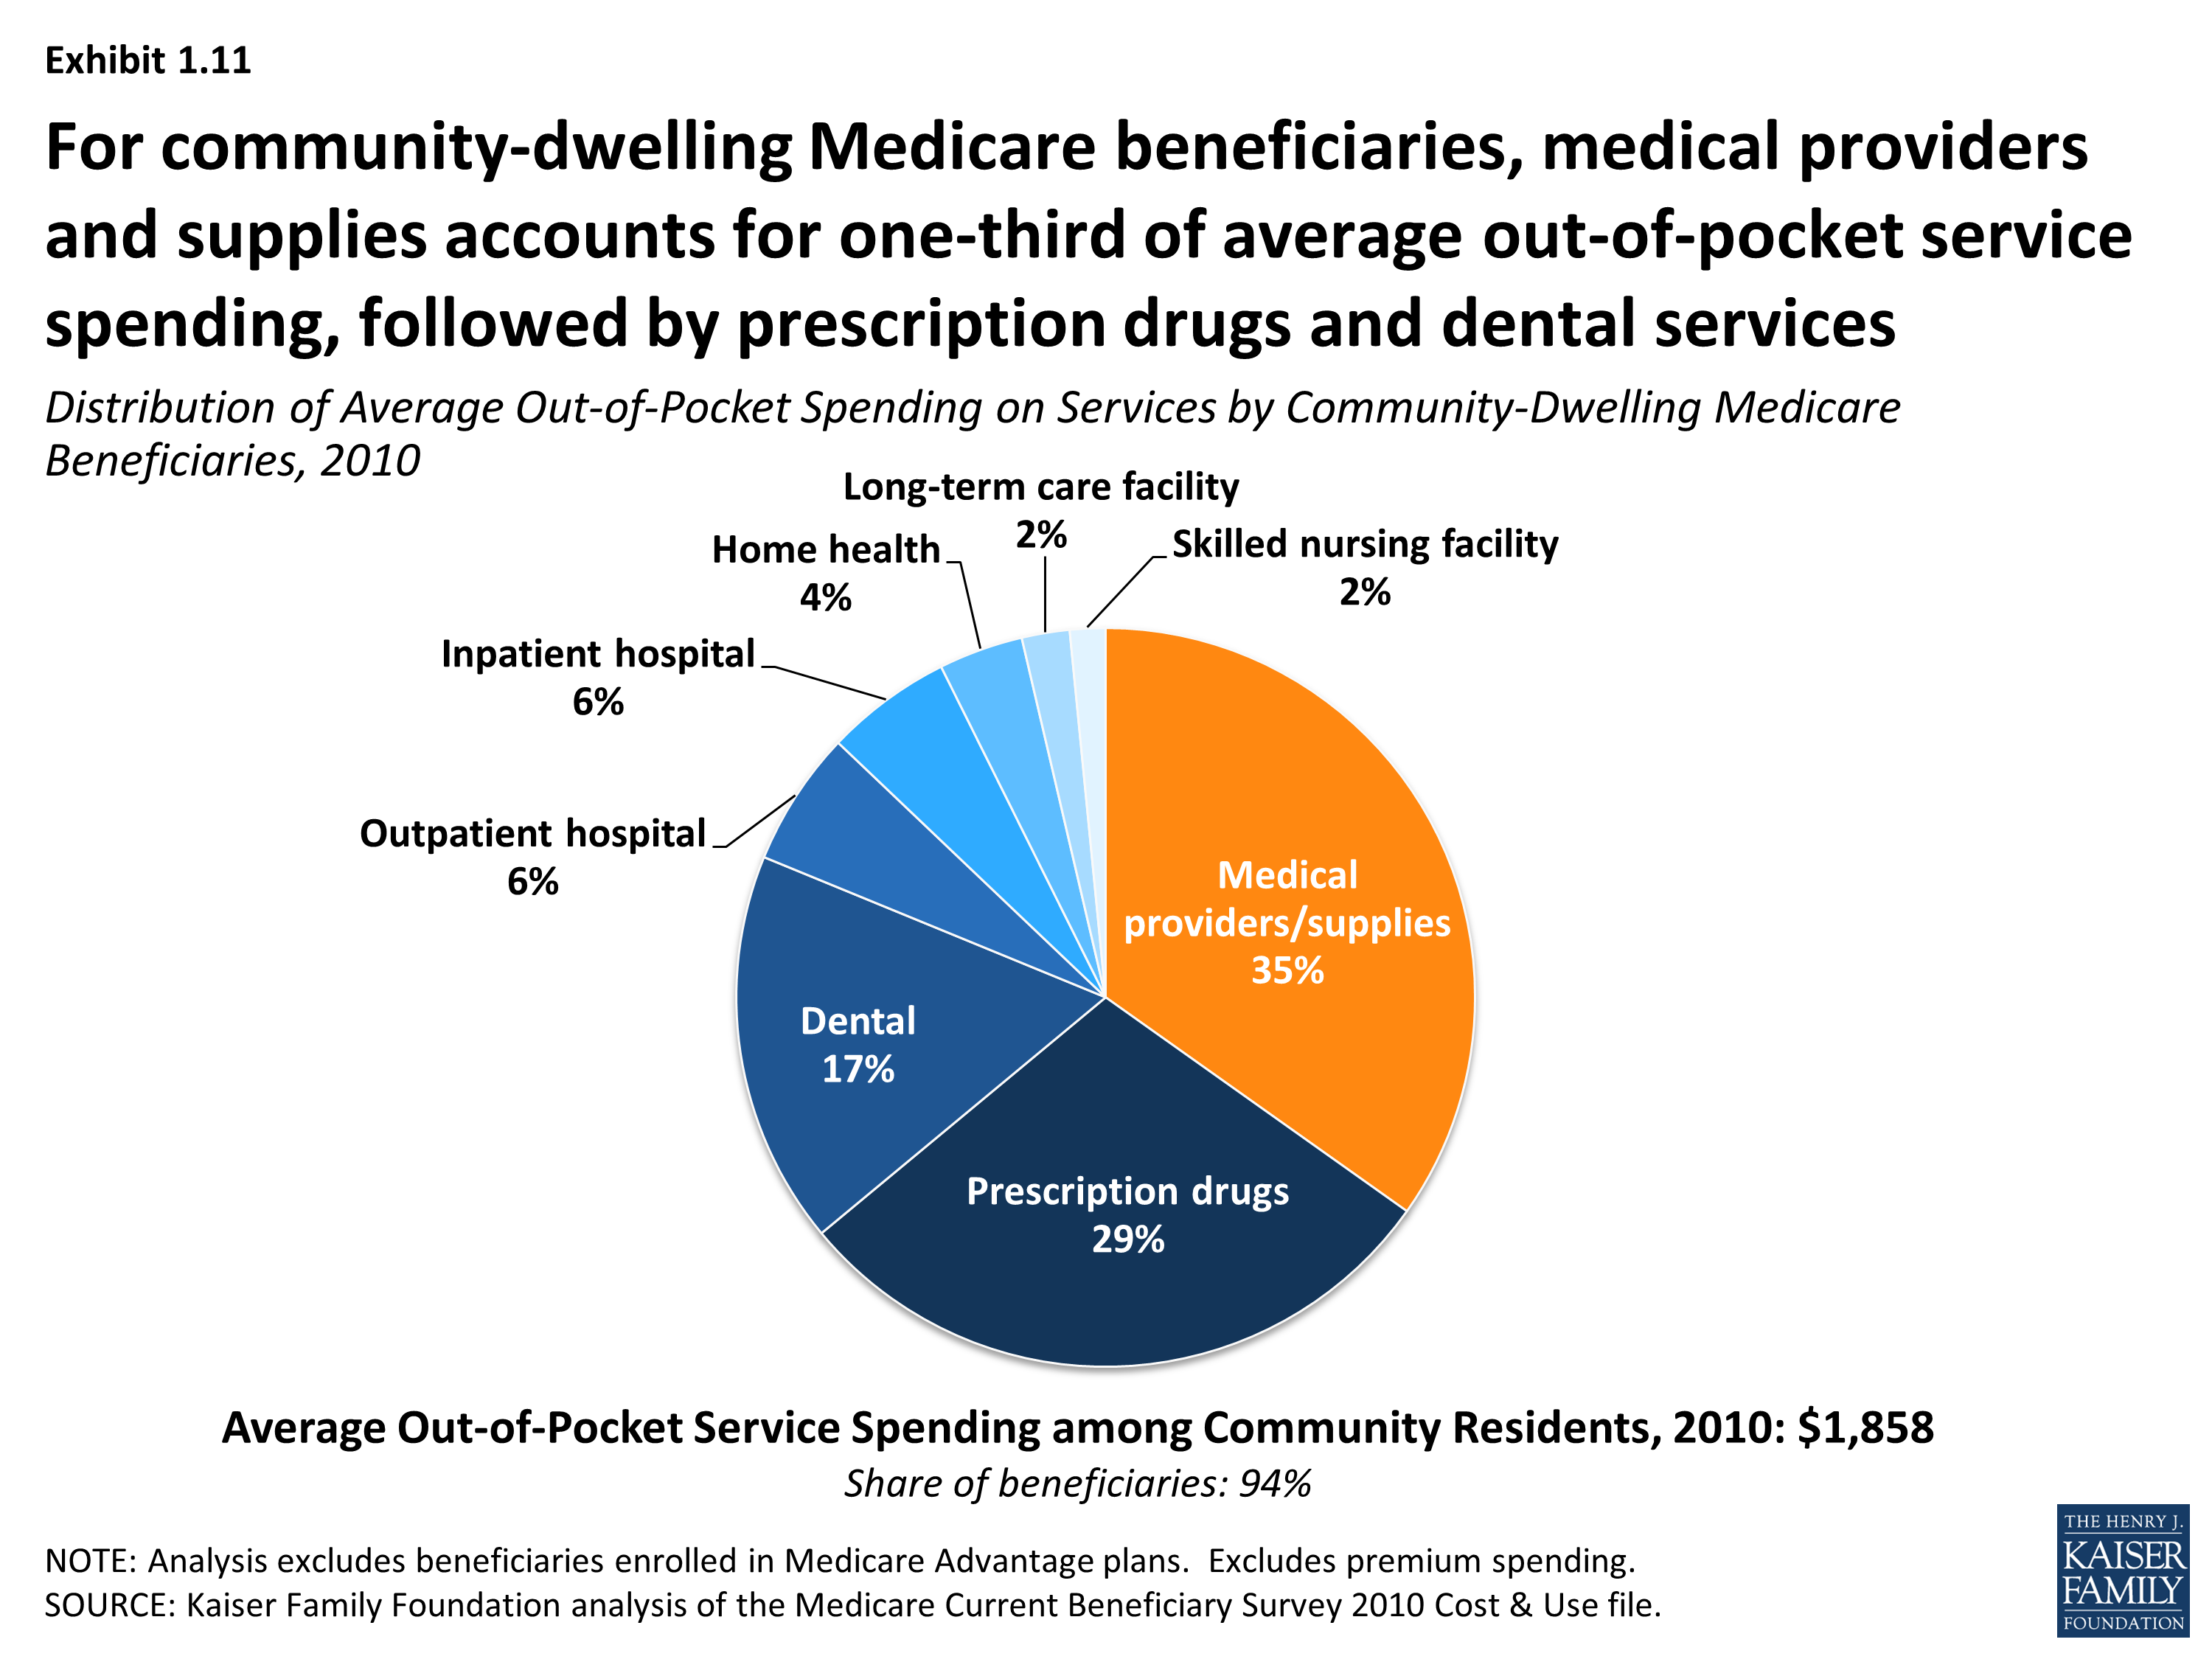
Distribution of Average Out-of-Pocket Spending on Services by Community-dwelling Medicare Beneficiaries, 2010
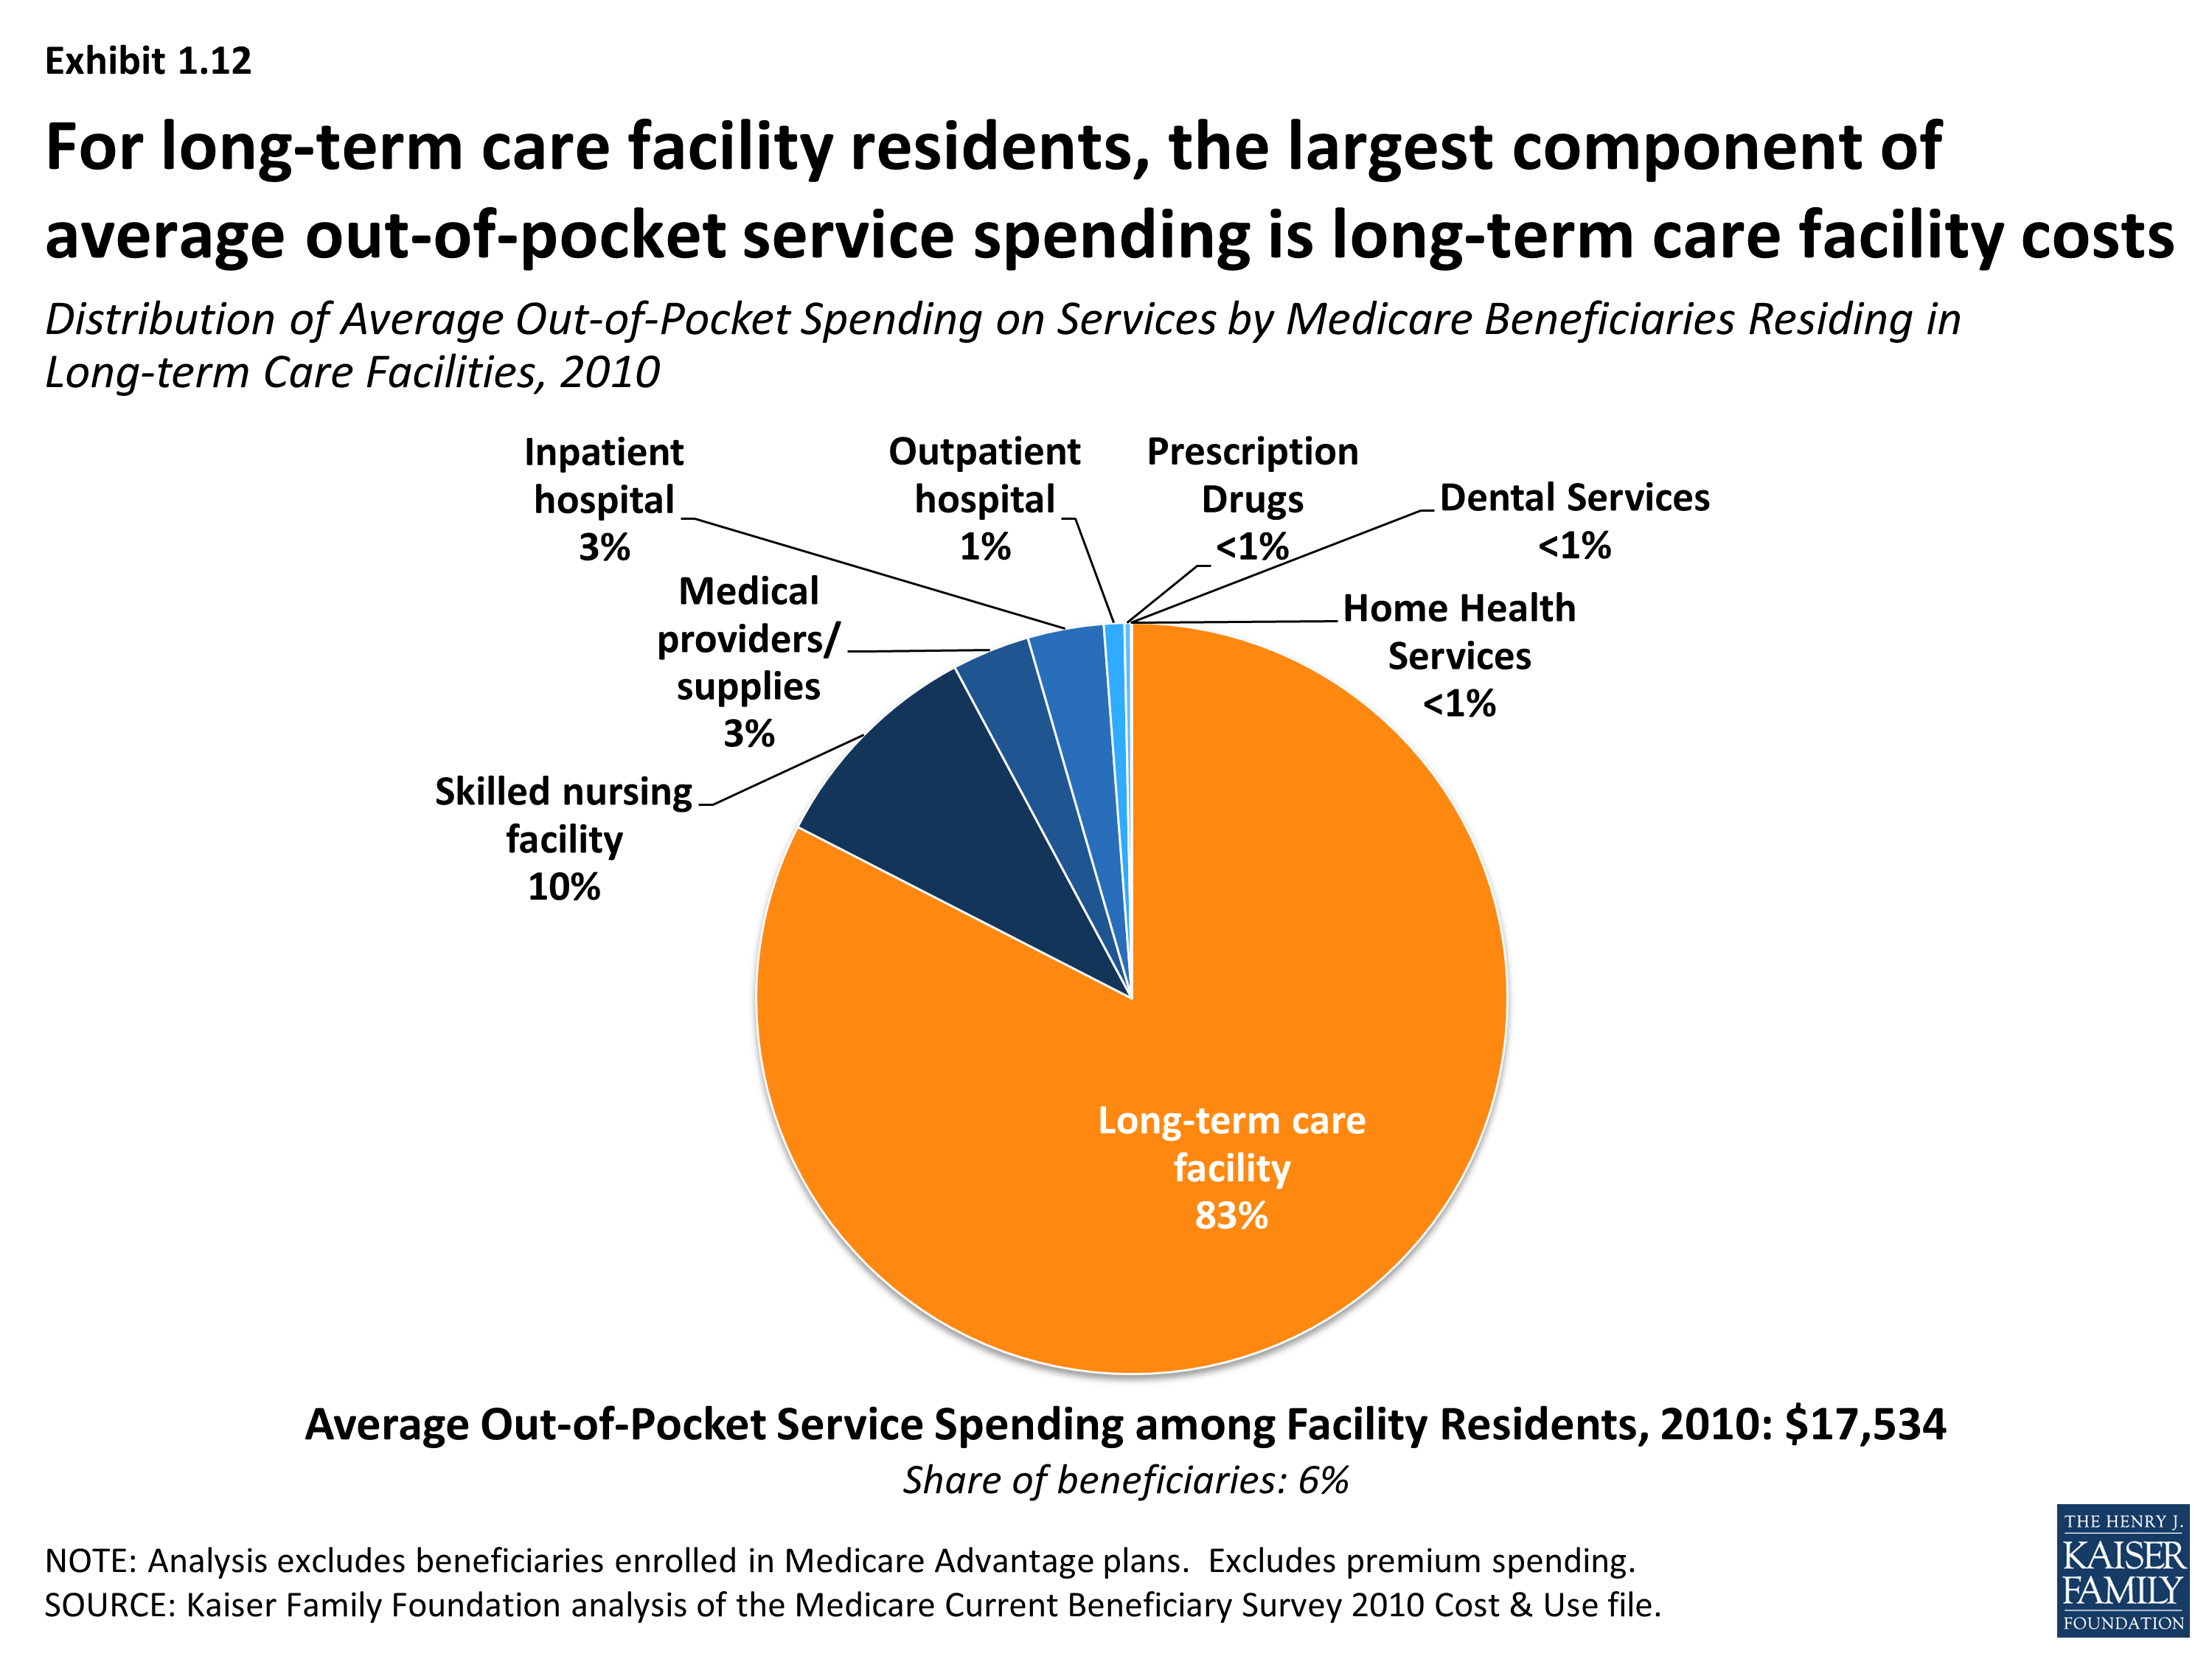
Distribution of Average Out-of-Pocket Spending on Services by Medicare Beneficiaries Residing in Long-term Care Facilities, 2010
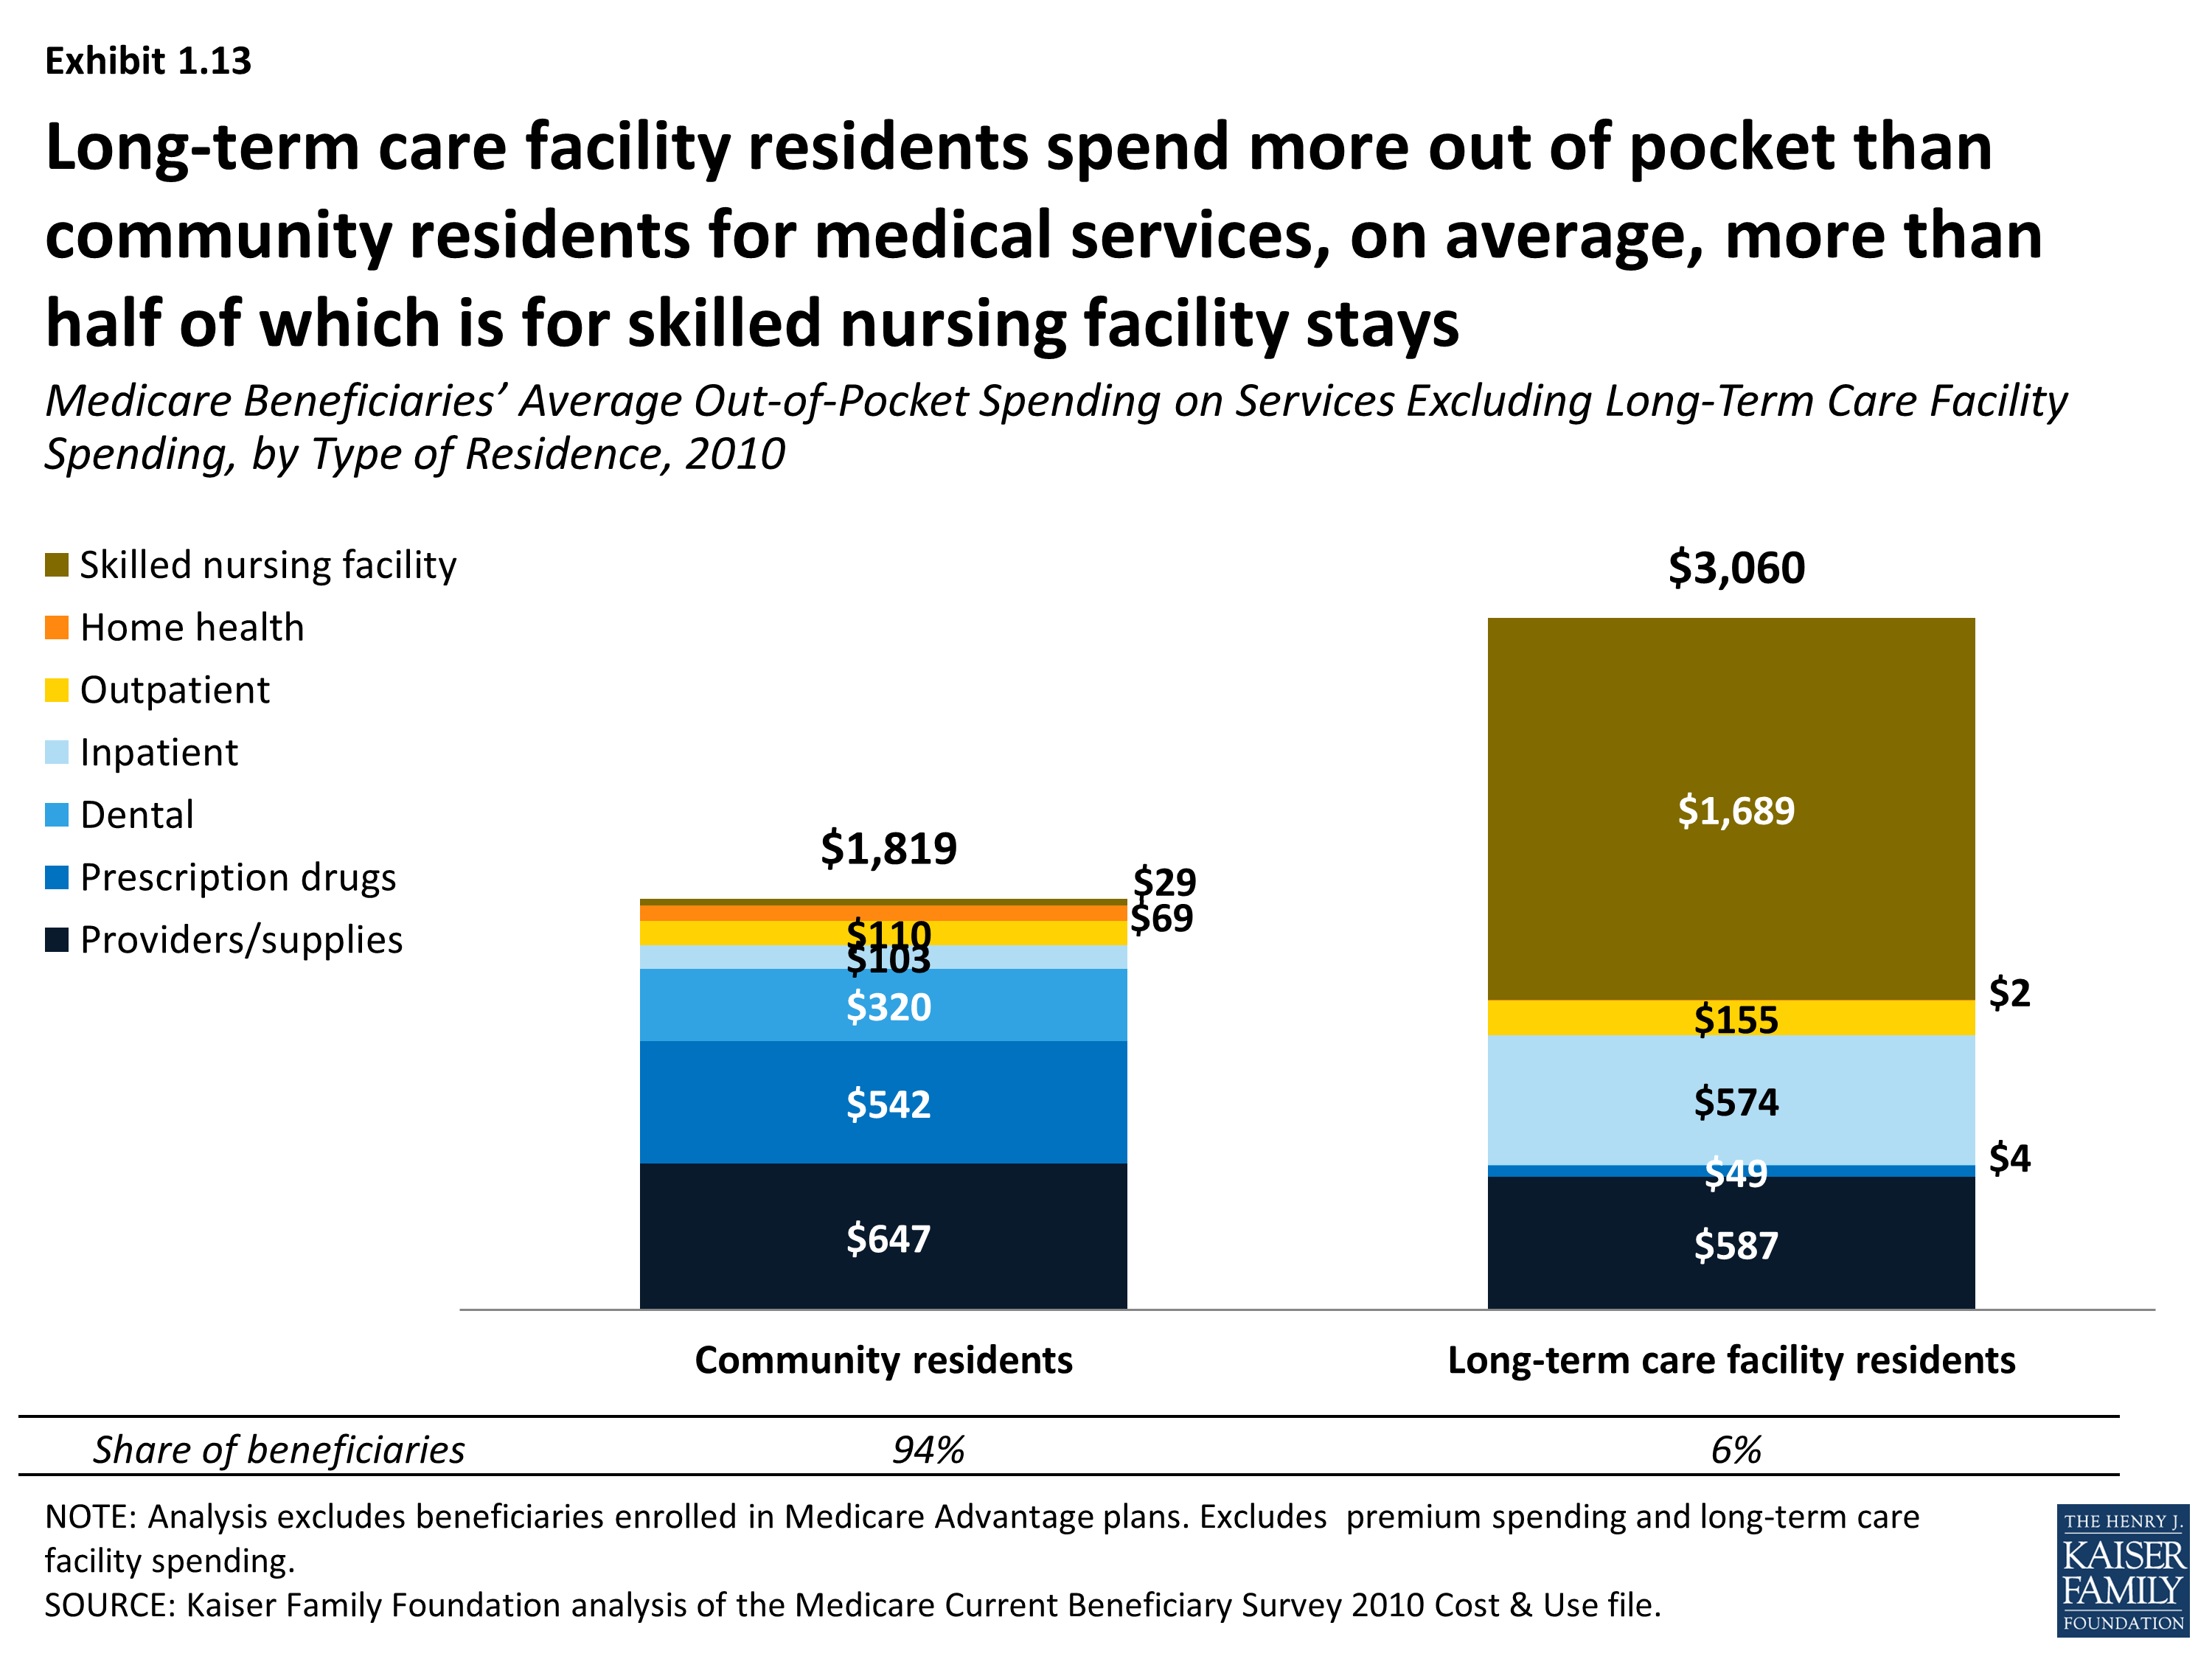
Medicare Beneficiaries’ Average Out-of-Pocket Spending on Services Excluding Long-Term Care Facility Spending, by Type of Residence, 2010
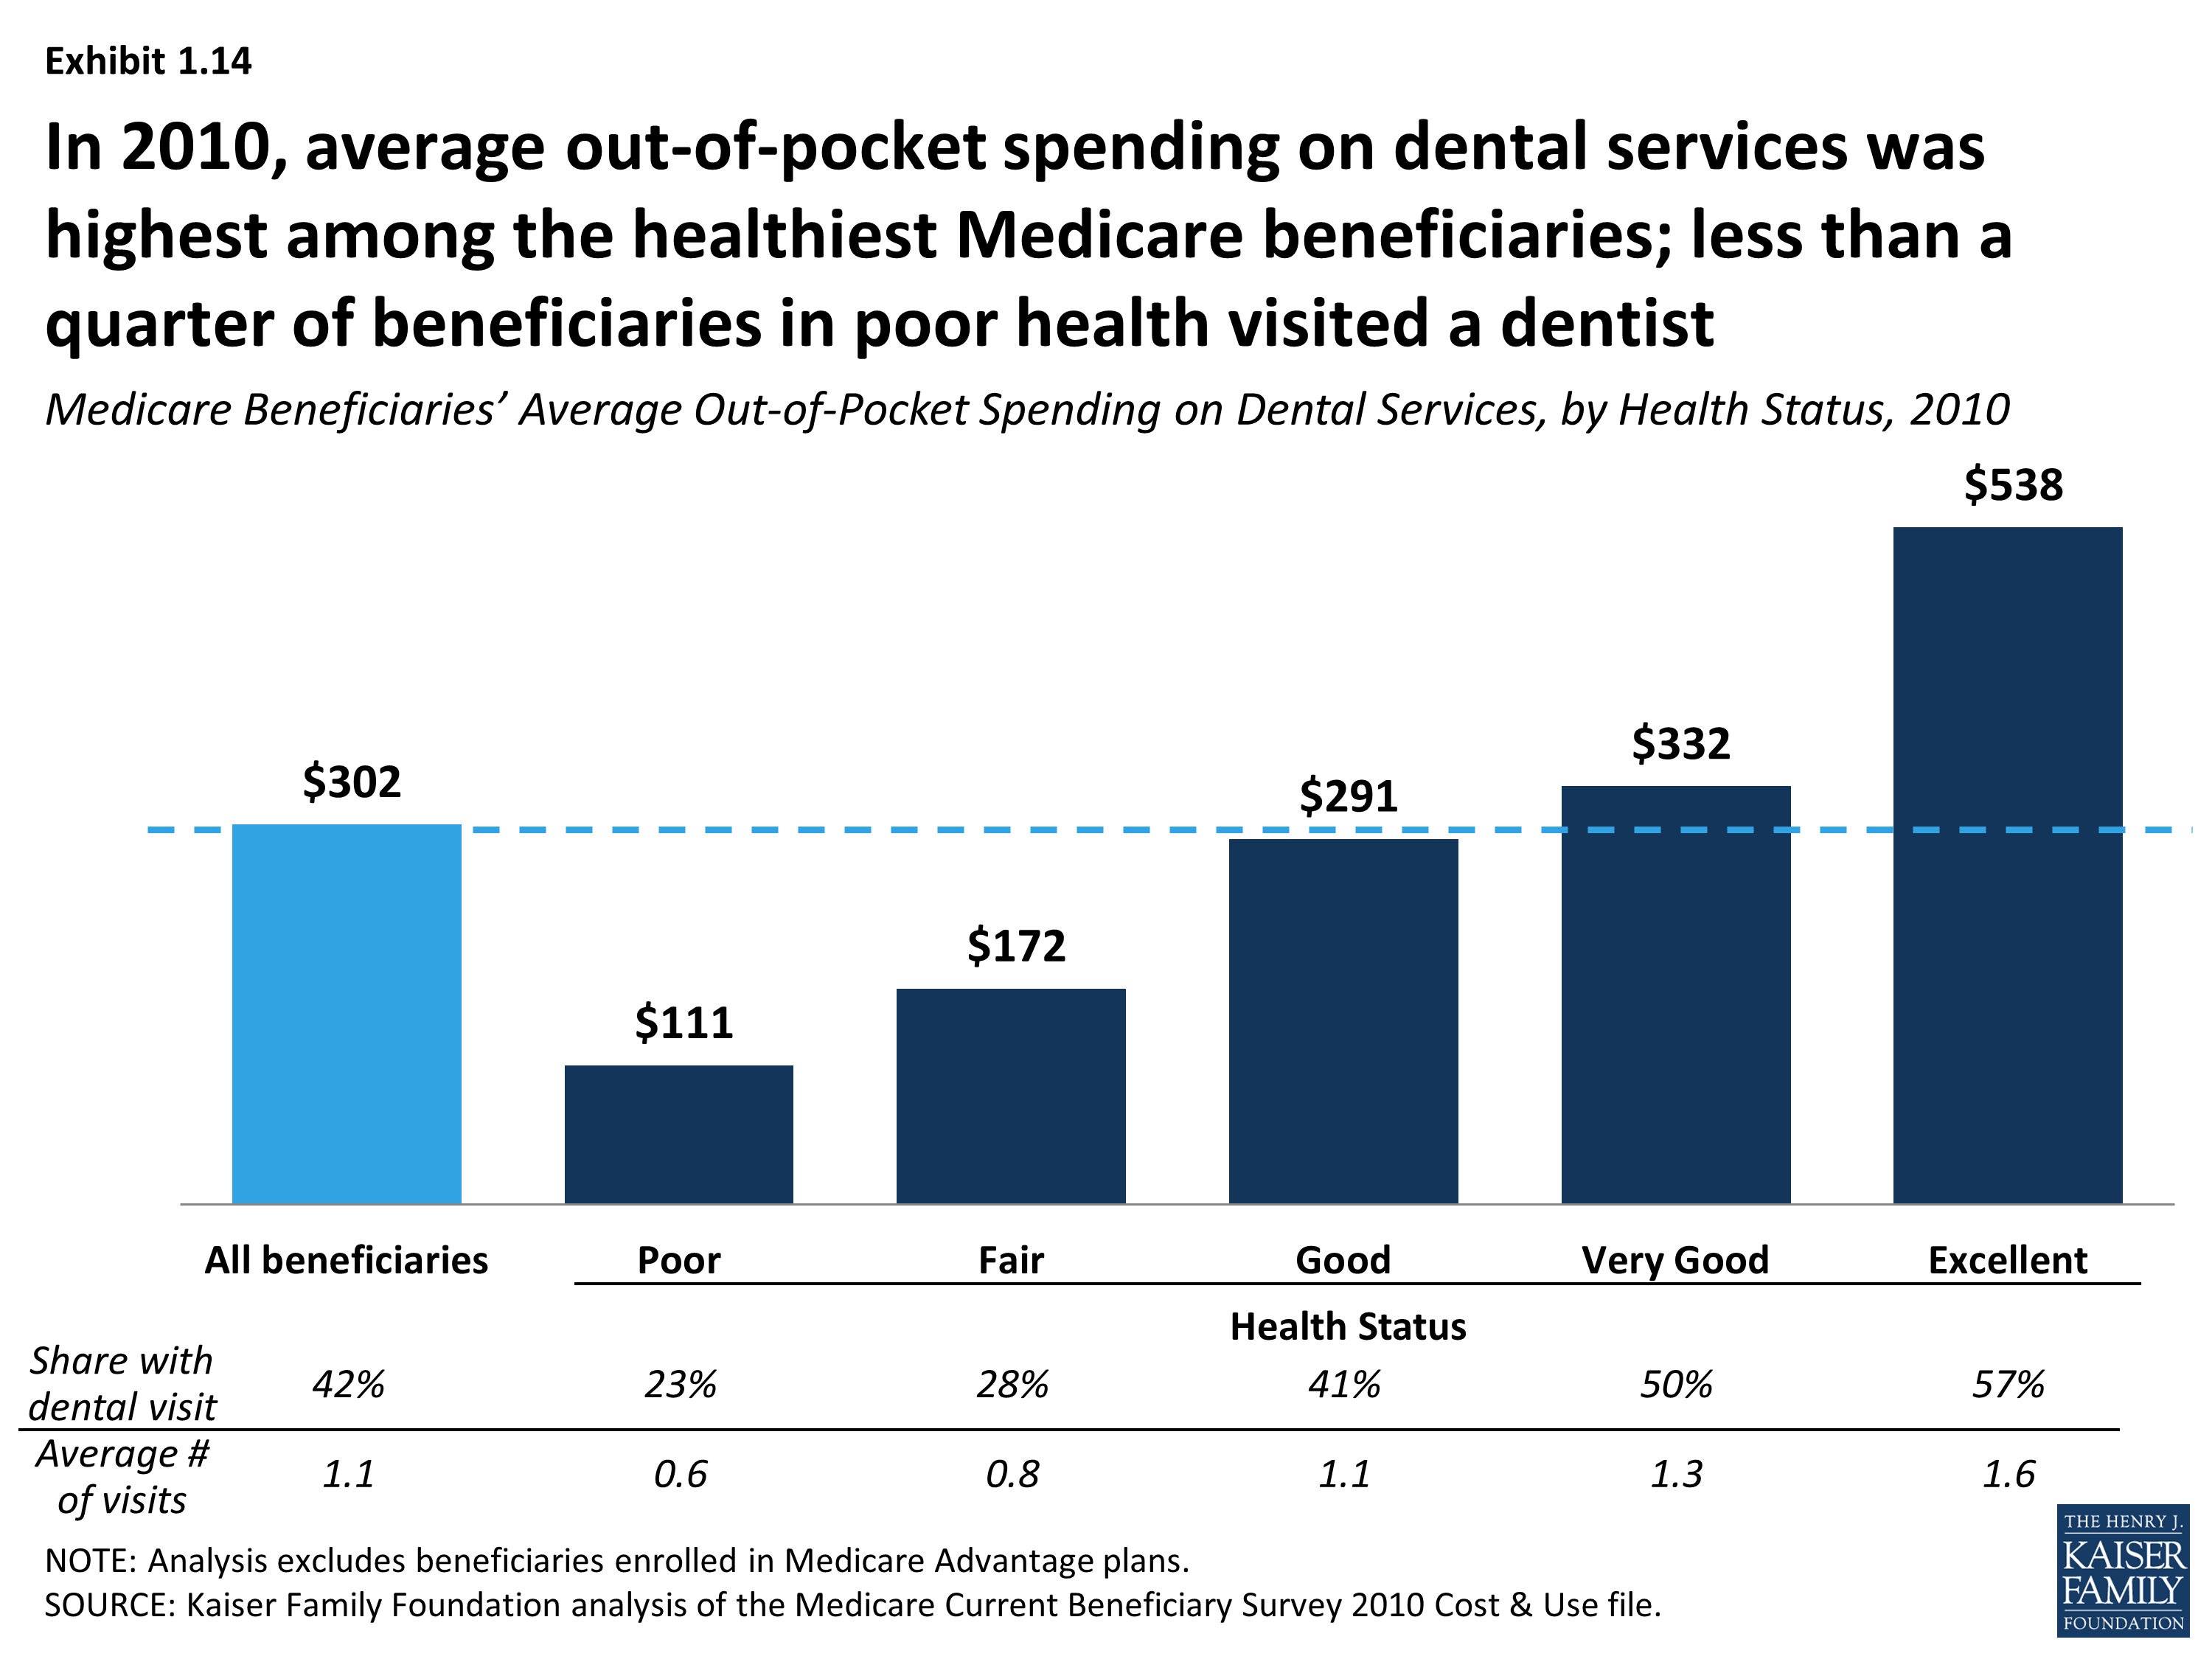
Medicare Beneficiaries’ Average Out-of-Pocket Spending on Dental Services, by Health Status, 2010
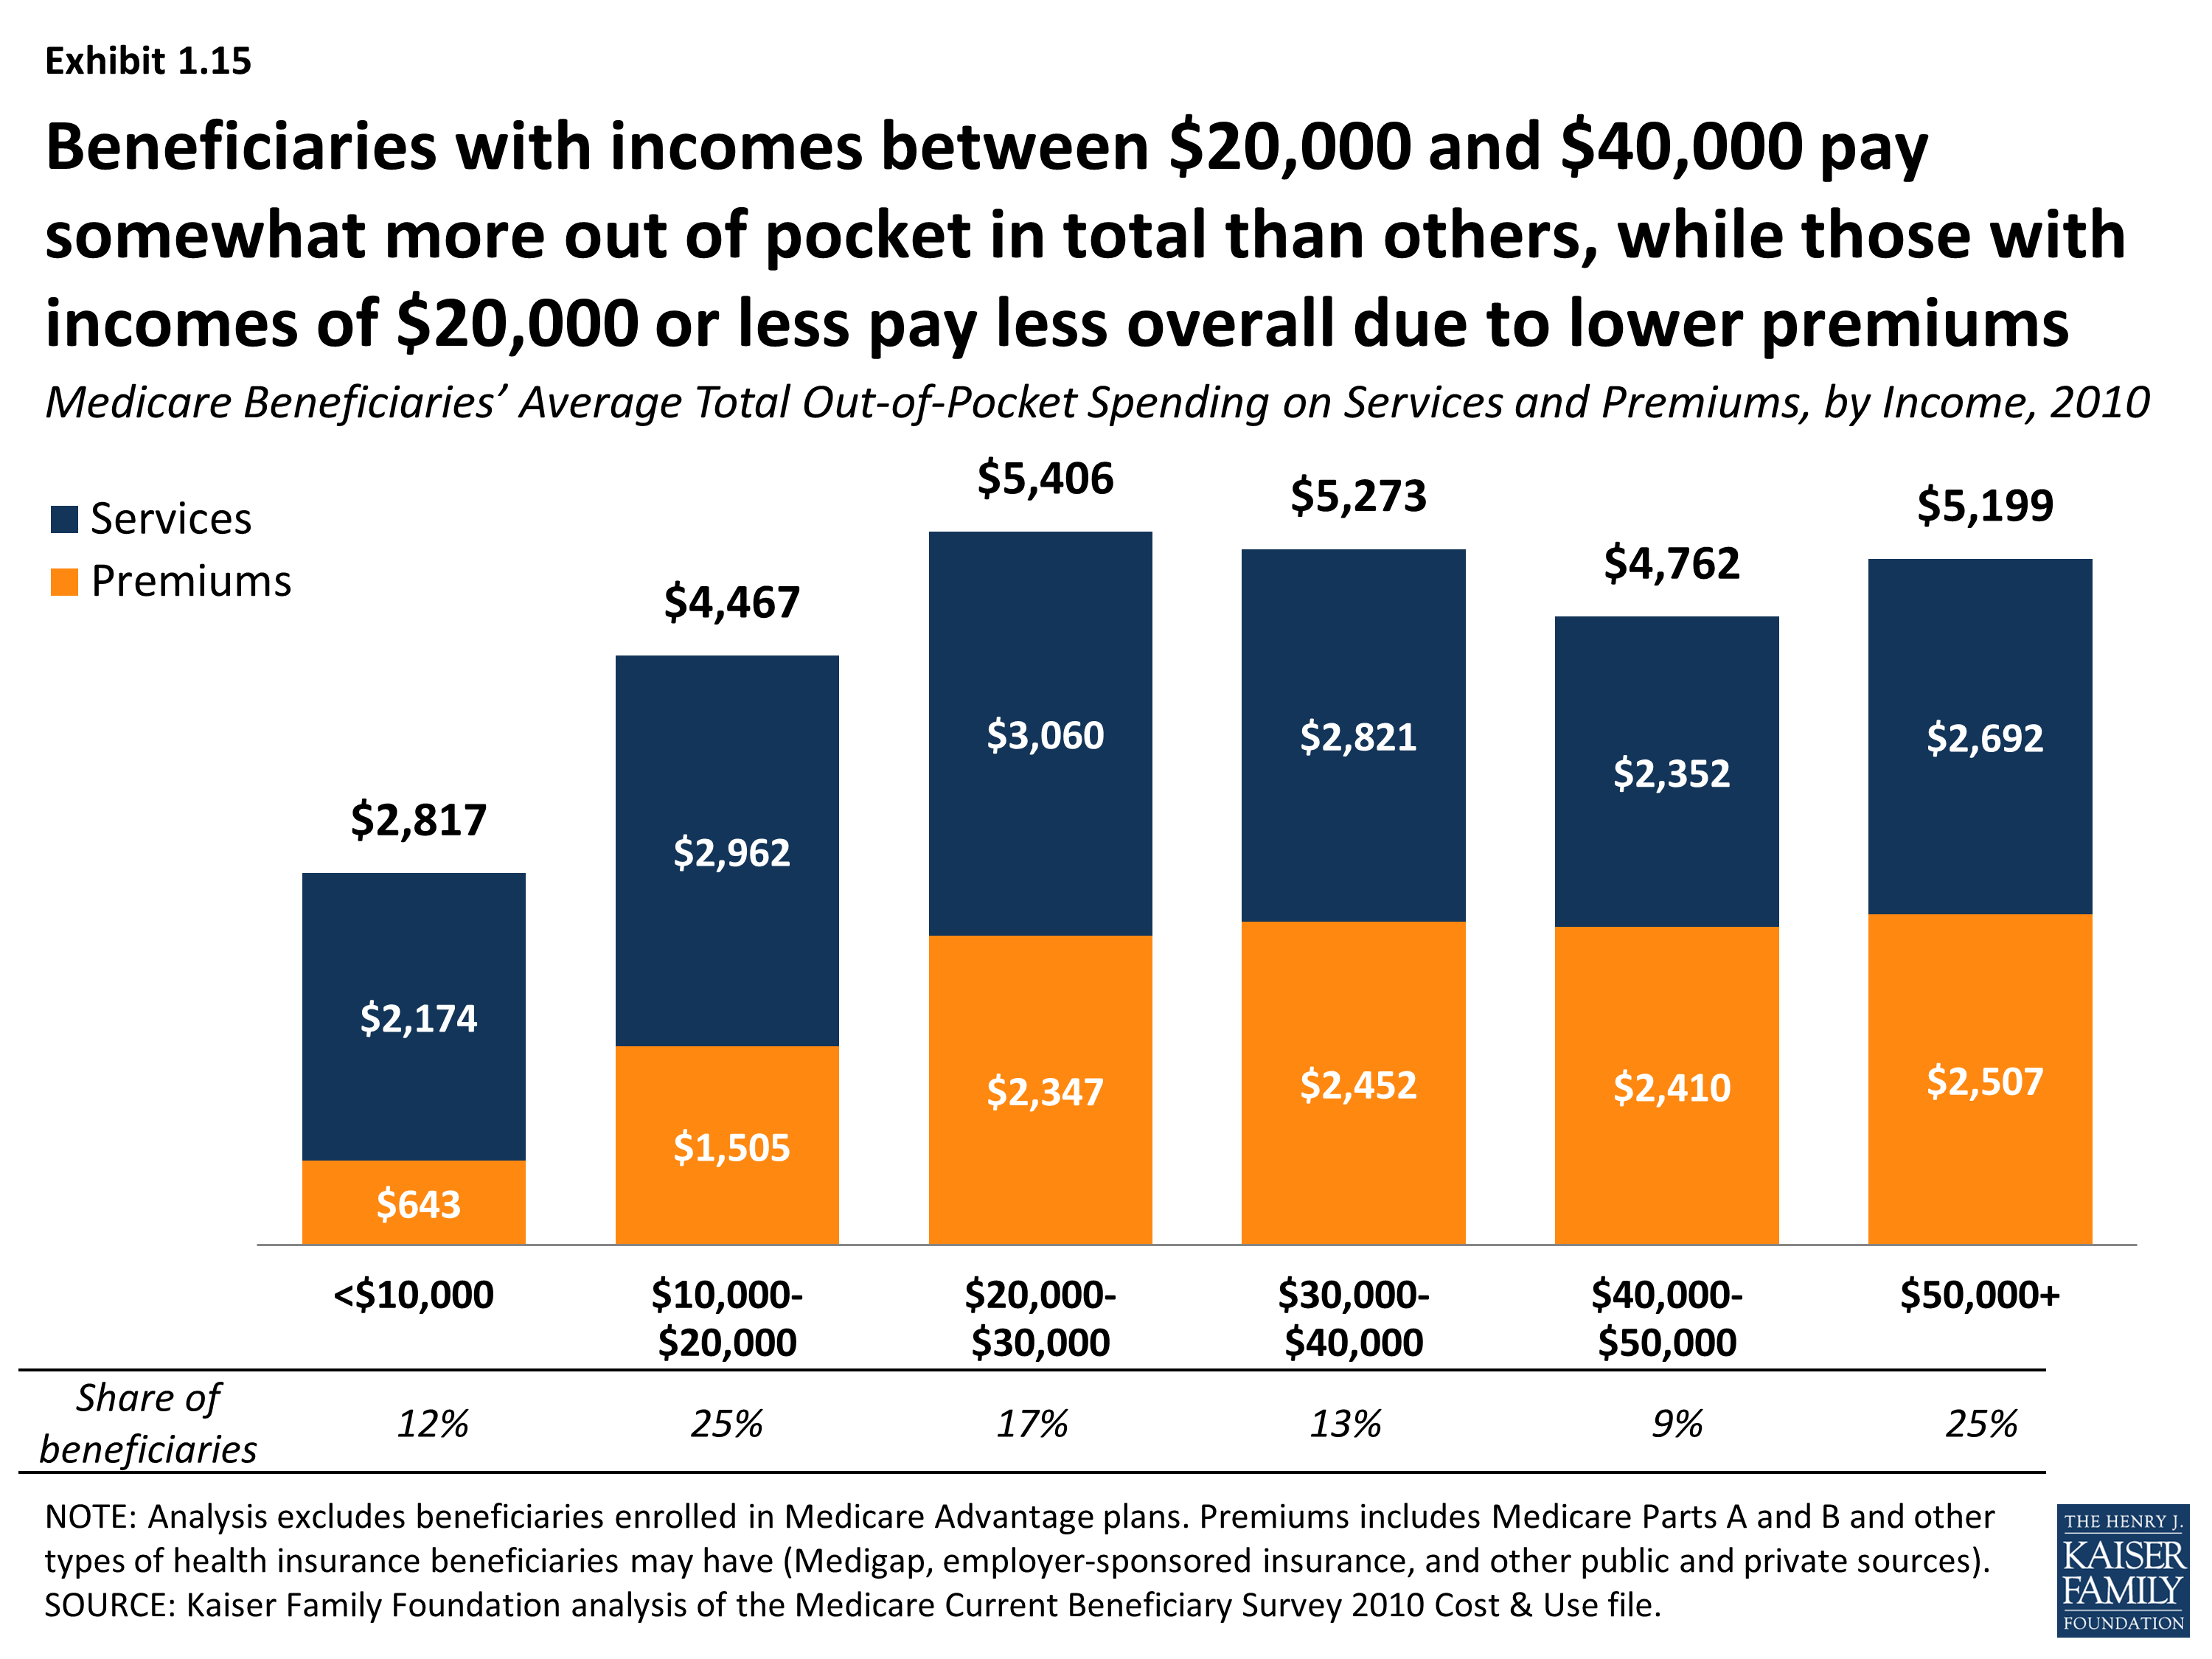
Medicare Beneficiaries’ Average Total Out-of-Pocket Spending on Services and Premiums, by Income, 2010
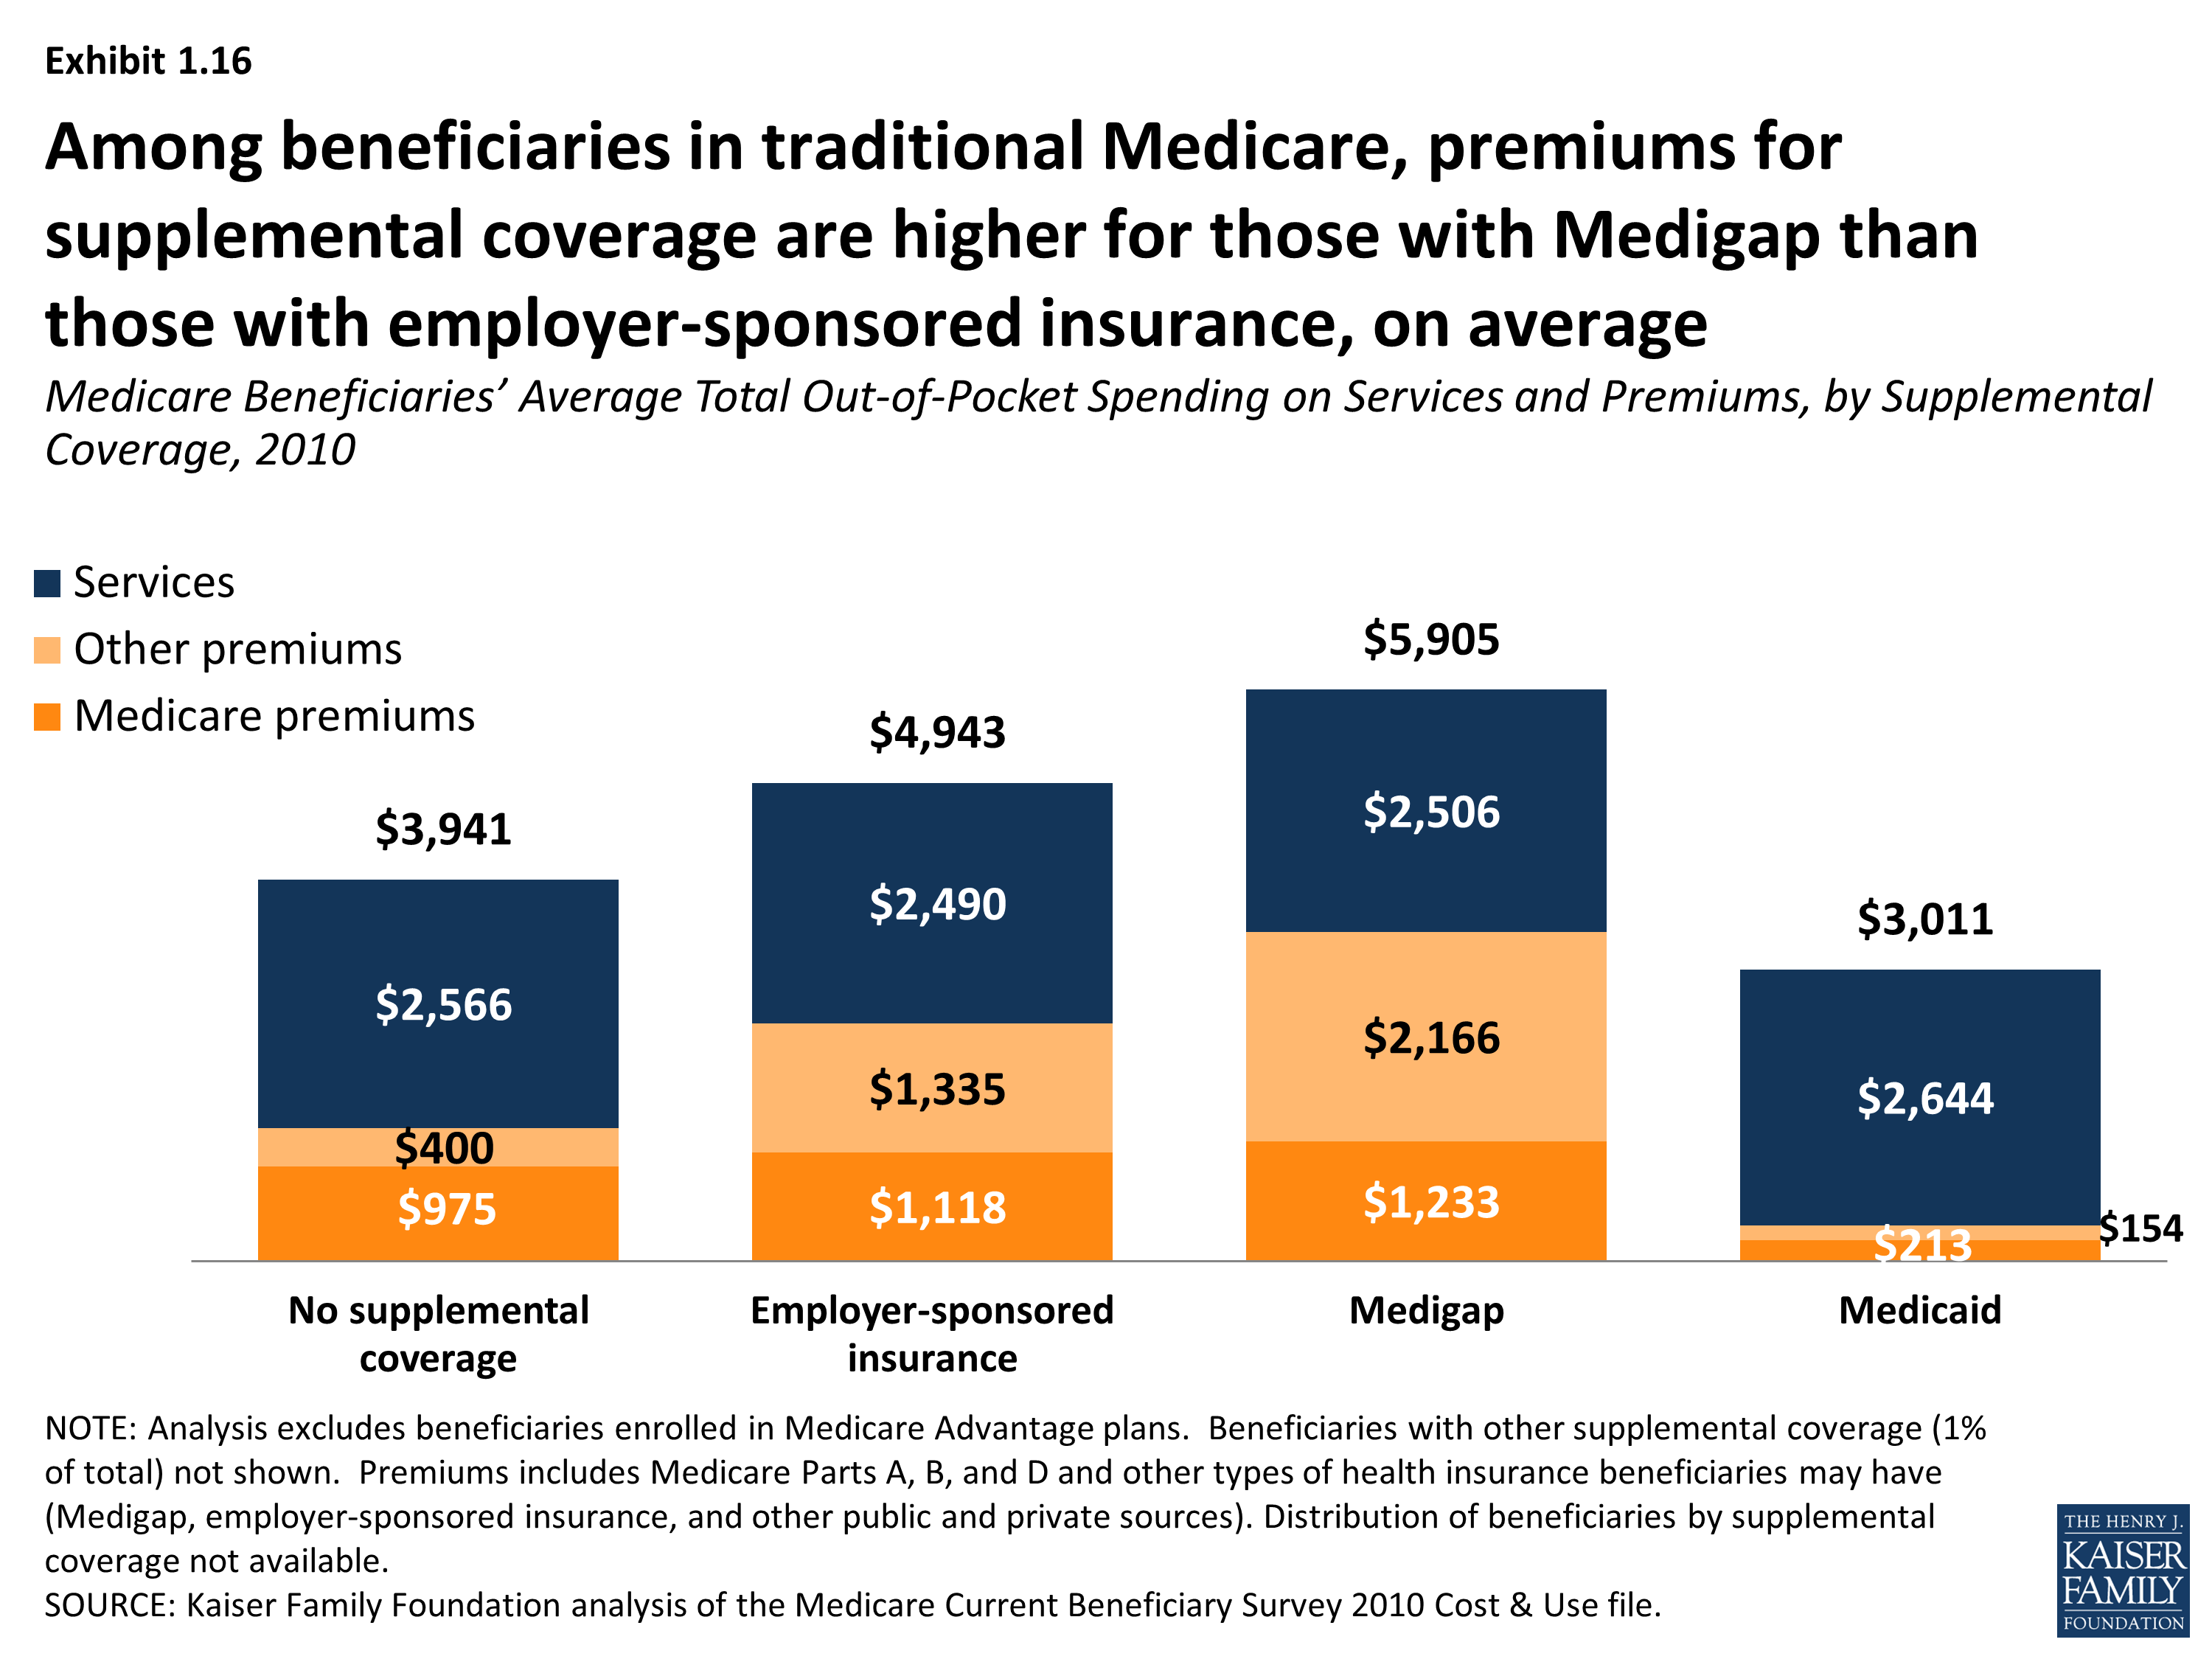
Medicare Beneficiaries’ Average Total Out-of-Pocket Spending on Services and Premiums, by Supplemental Coverage, 2010
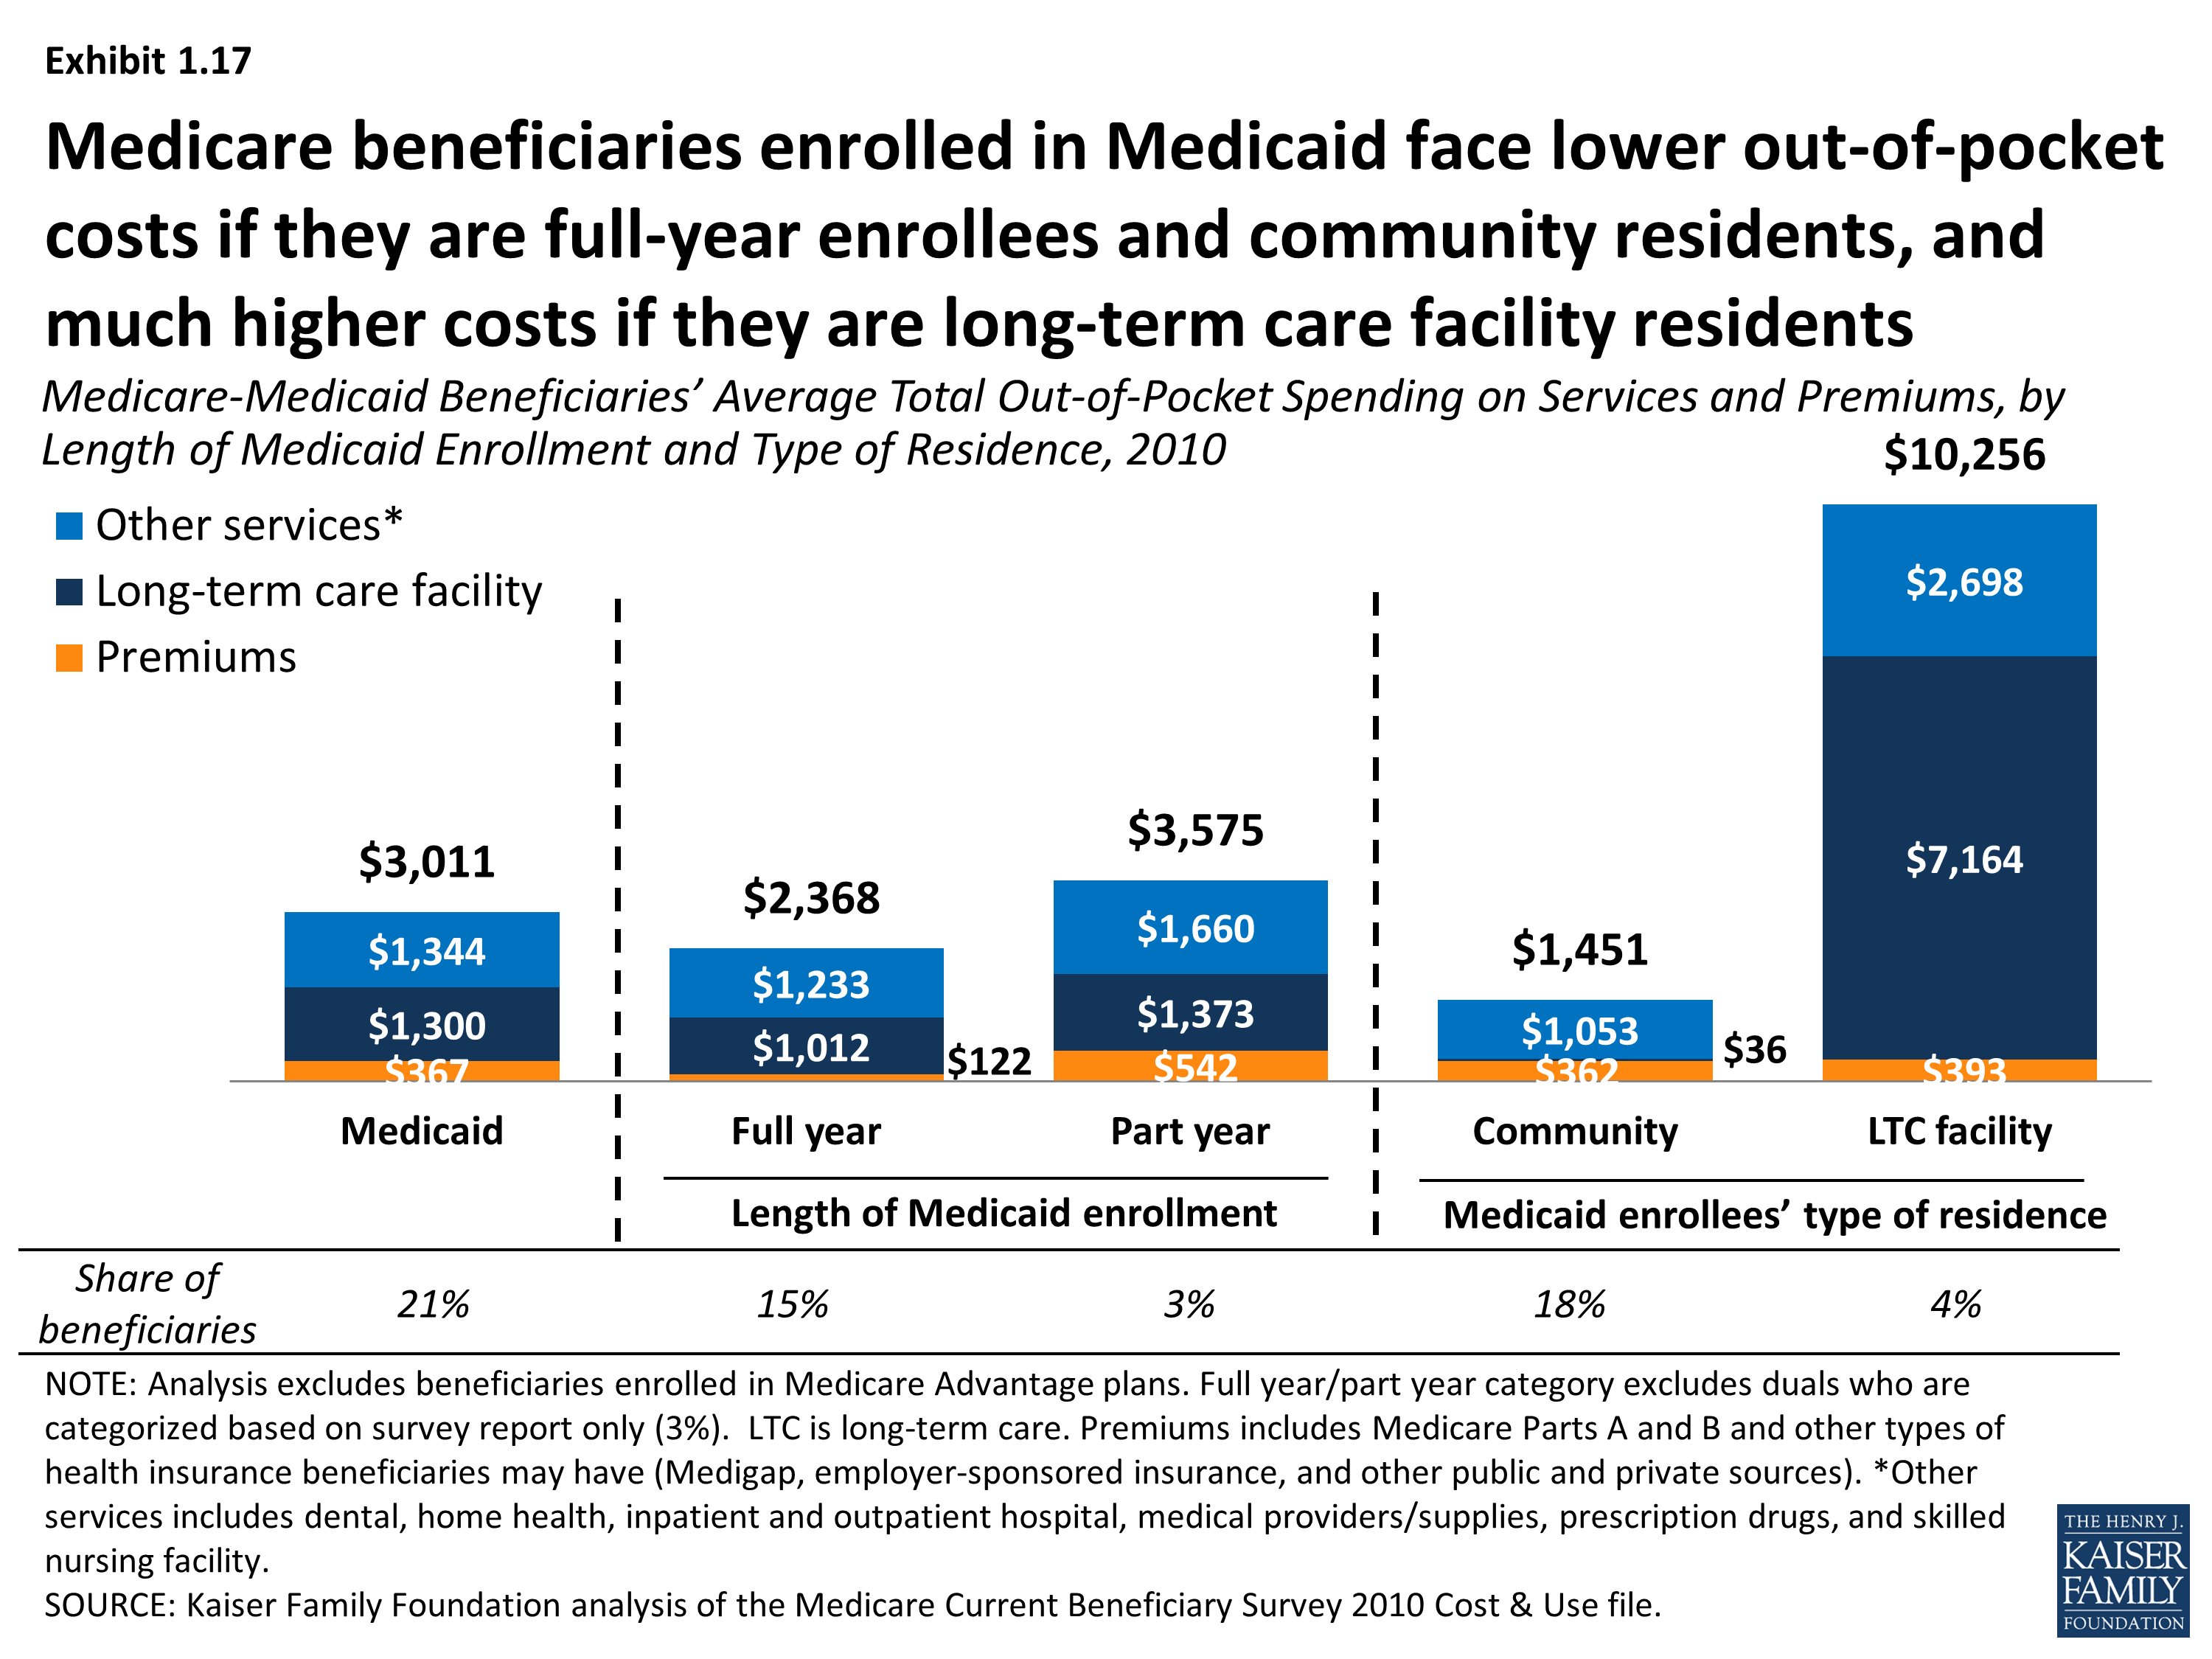
Medicare-Medicaid Beneficiaries’ Average Total Out-of-Pocket Spending on Services and Premiums, by Length of Medicaid Enrollment and Type of Residence, 2010
Section 2: High Out-of-Pocket Spenders, 2010
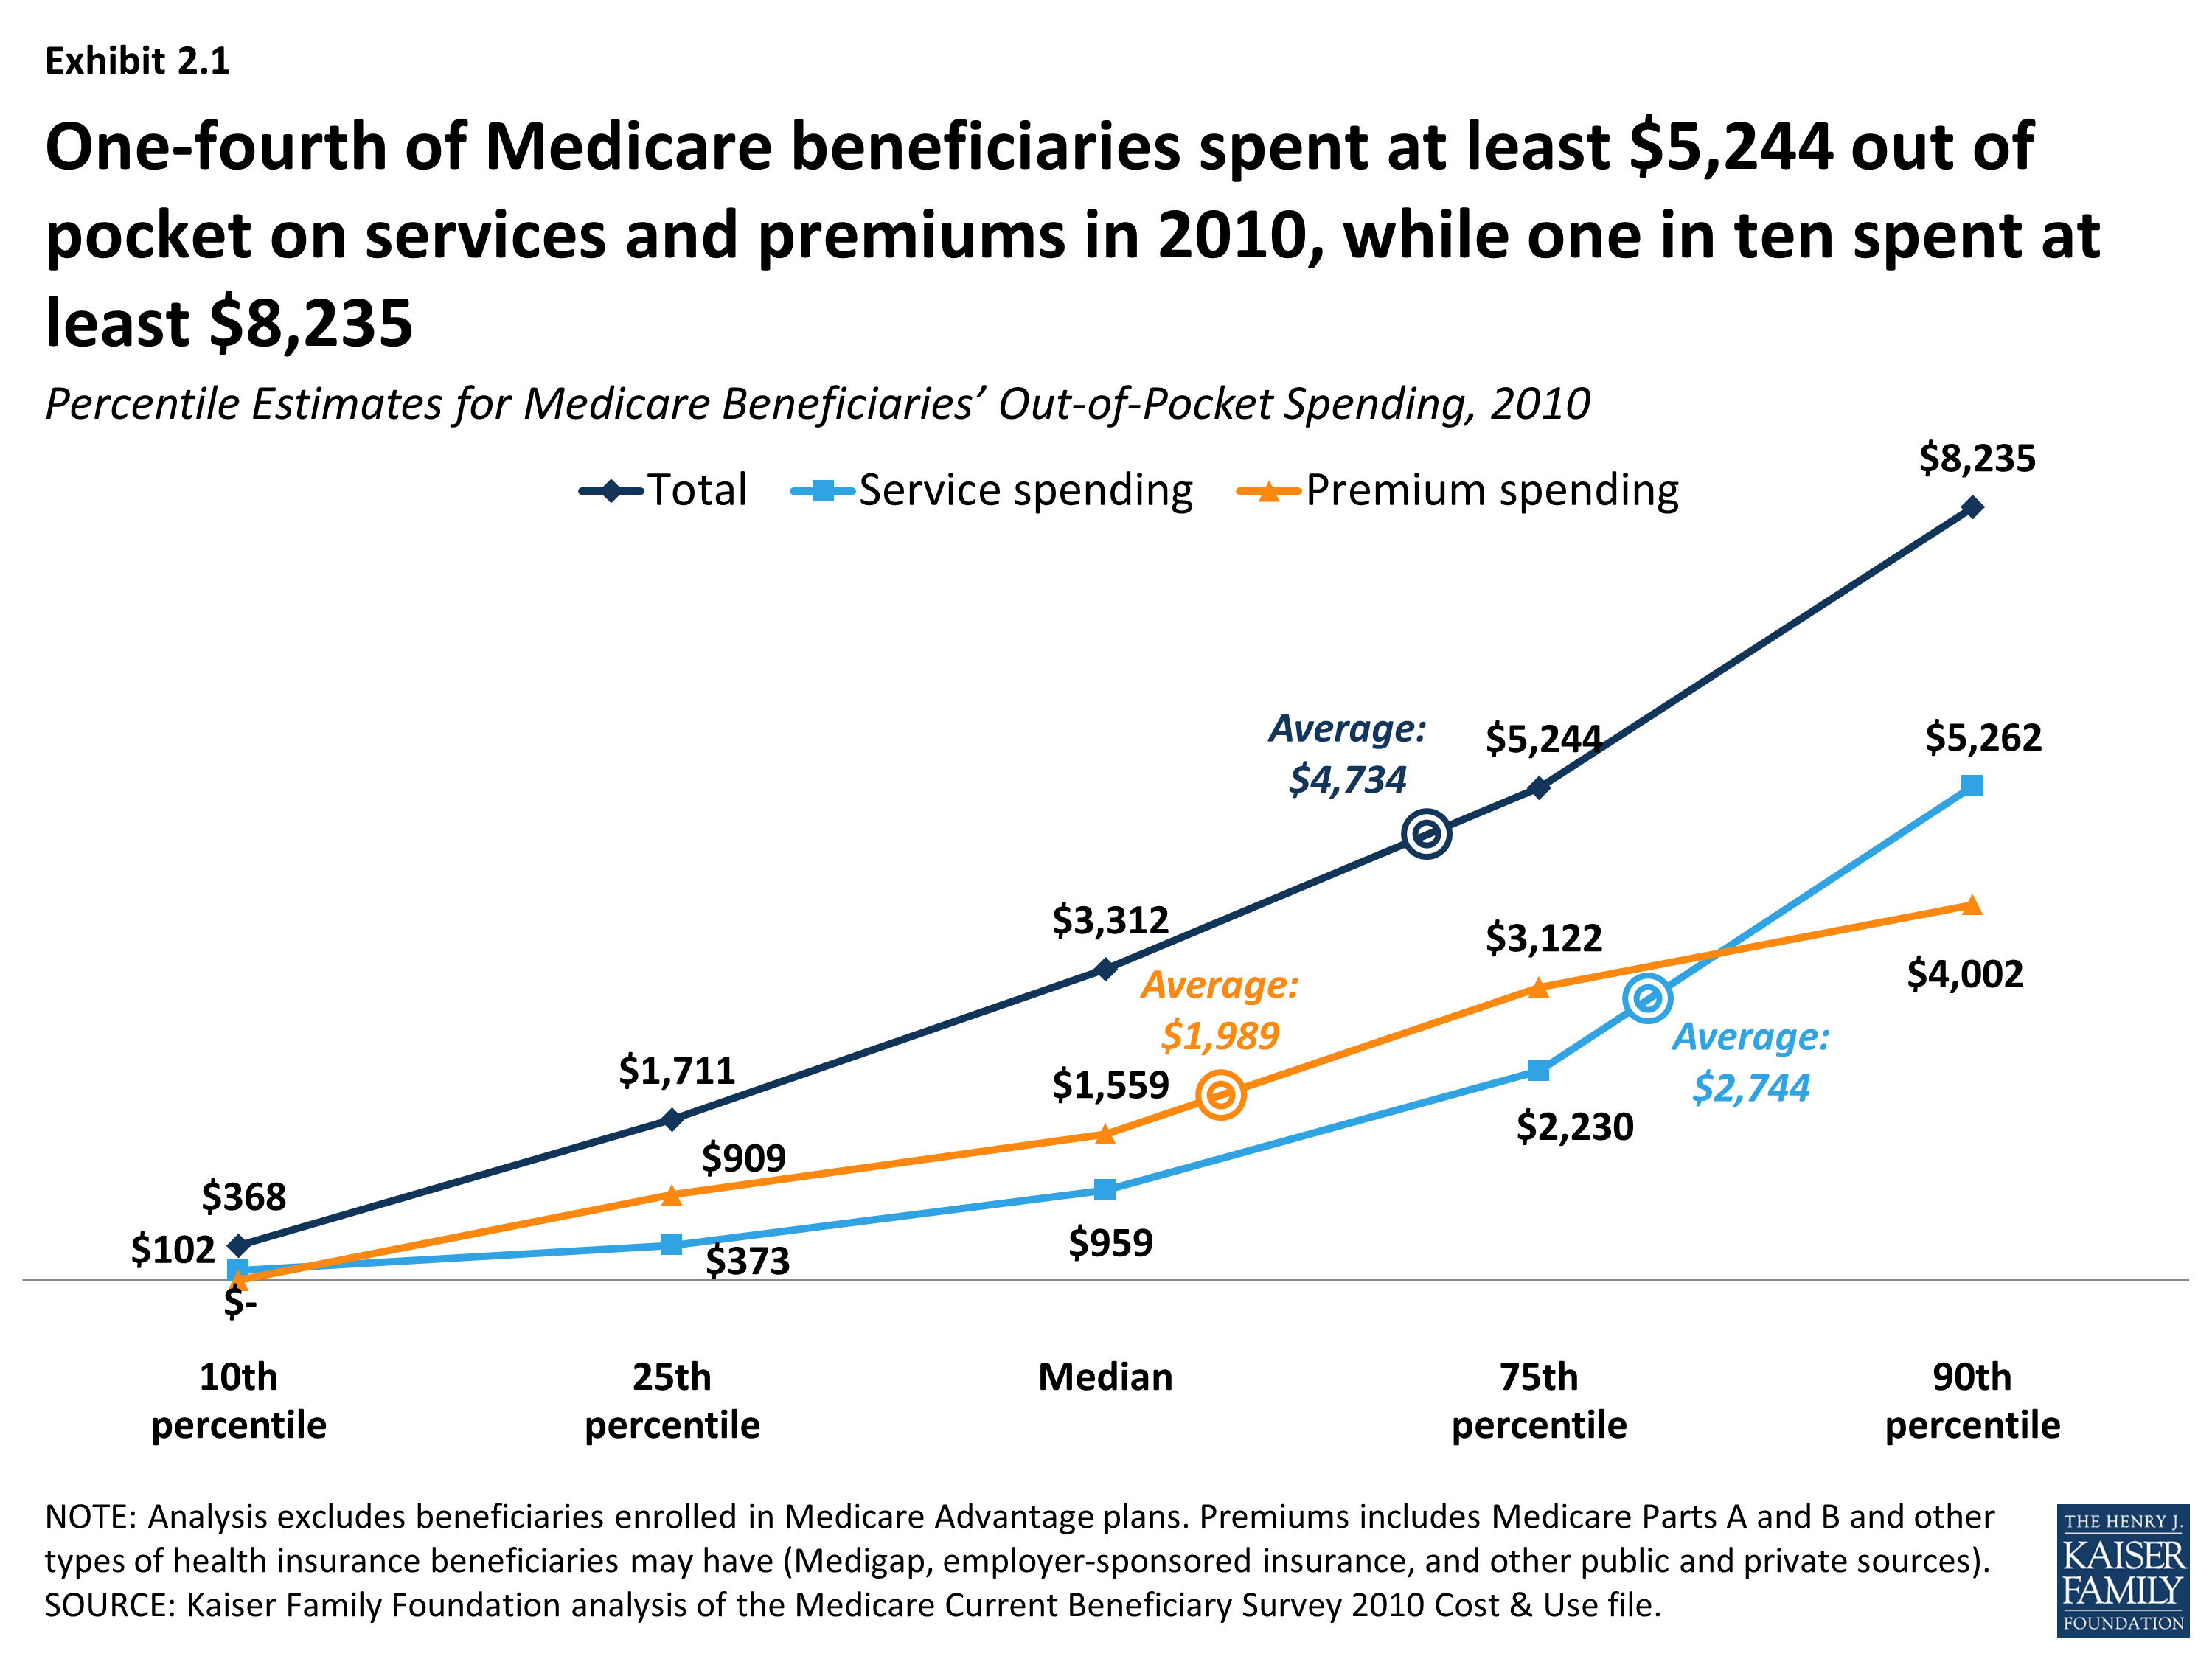
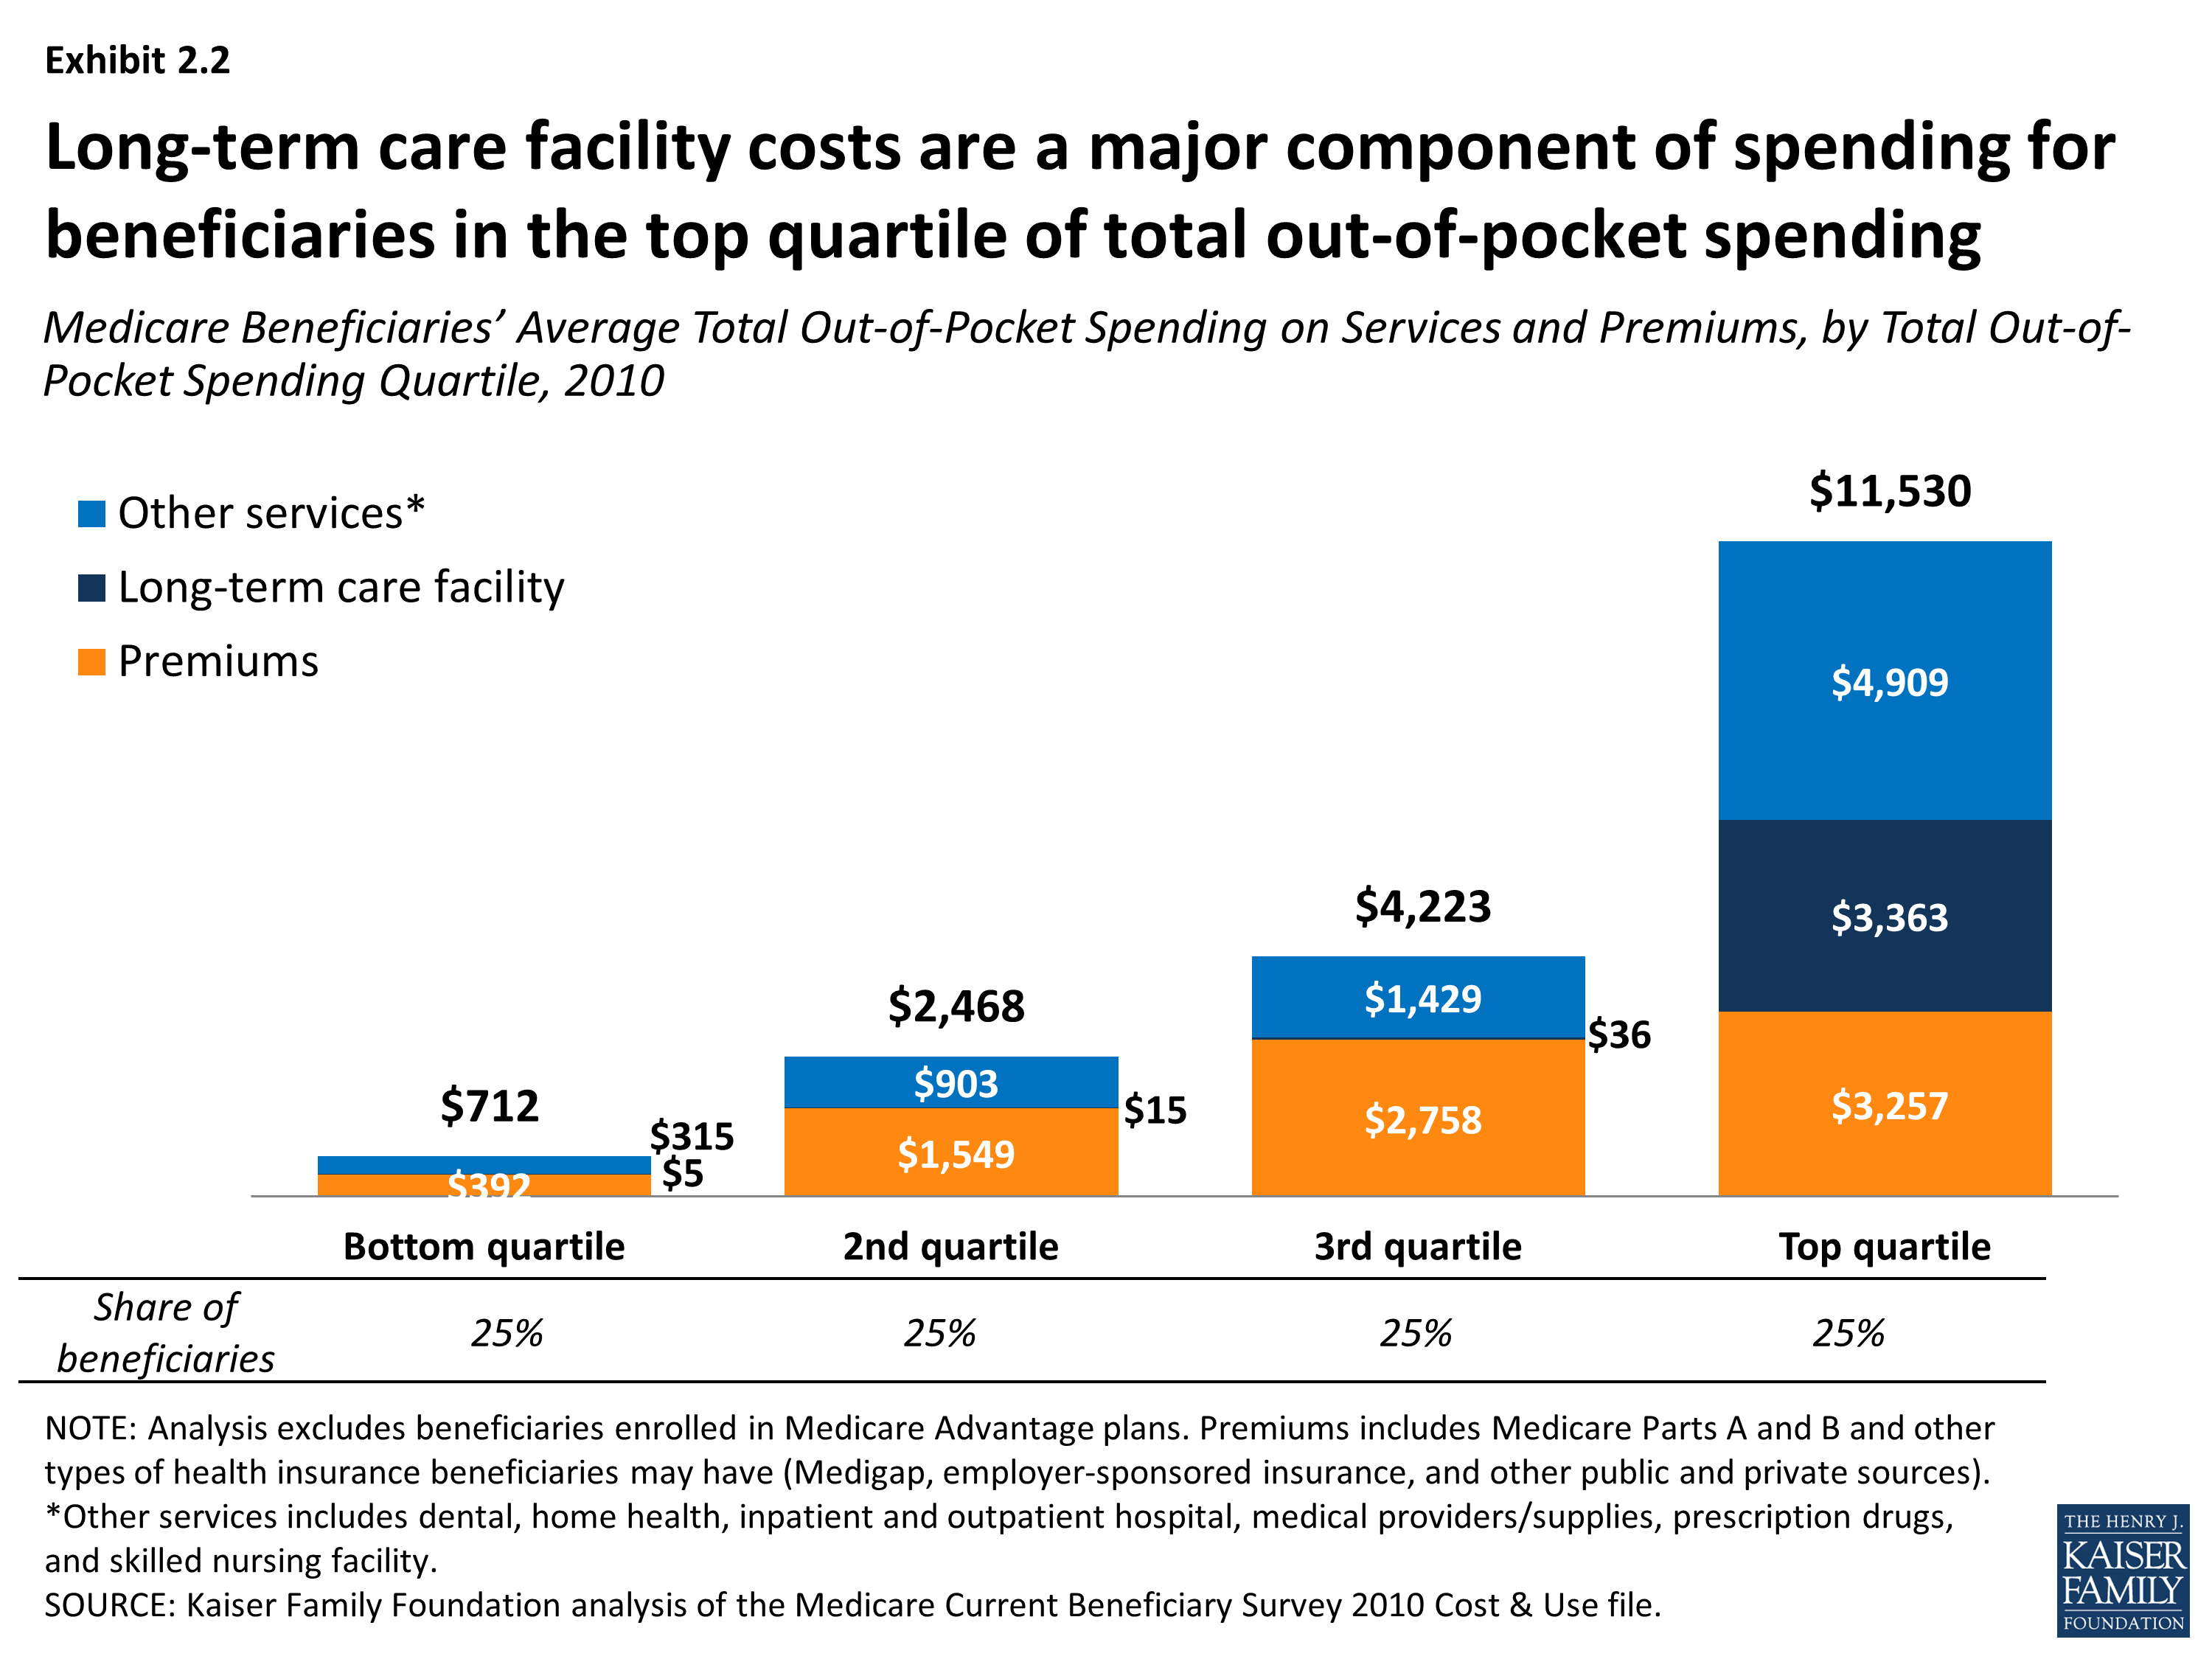
While the average person in traditional Medicare spent $4,734 out of pocket on medical and long-term care services and premiums in 2010, one-fourth of beneficiaries spent at least $5,244 out of pocket on services and premiums (the top quartile), and one in ten spent at least $8,235 (the top decile) that year (Exhibit 2.1). In 2010, total out-of-pocket spending among beneficiaries in the top quartile of spenders averaged $11,530, 2.7 times average spending by beneficiaries in the third quartile ($4,223) and more than 16 times that of beneficiaries in the bottom quartile ($712) (Exhibit 2.2). In addition to premium spending, long-term care facility costs are a major component of spending for beneficiaries in the top quartile of total out-of-pocket spending, accounting for more than one-fourth of their average total out-of-pocket spending, while these costs are a relatively small fraction of spending by beneficiaries in the bottom three quartiles of total out-of-pocket spending. Long-term care facility spending is not the only contributor to high out-of-pocket costs, however; higher spending on medical providers and supplies, prescription drugs, and dental services also contribute to relatively high spending among those in the top quartile.
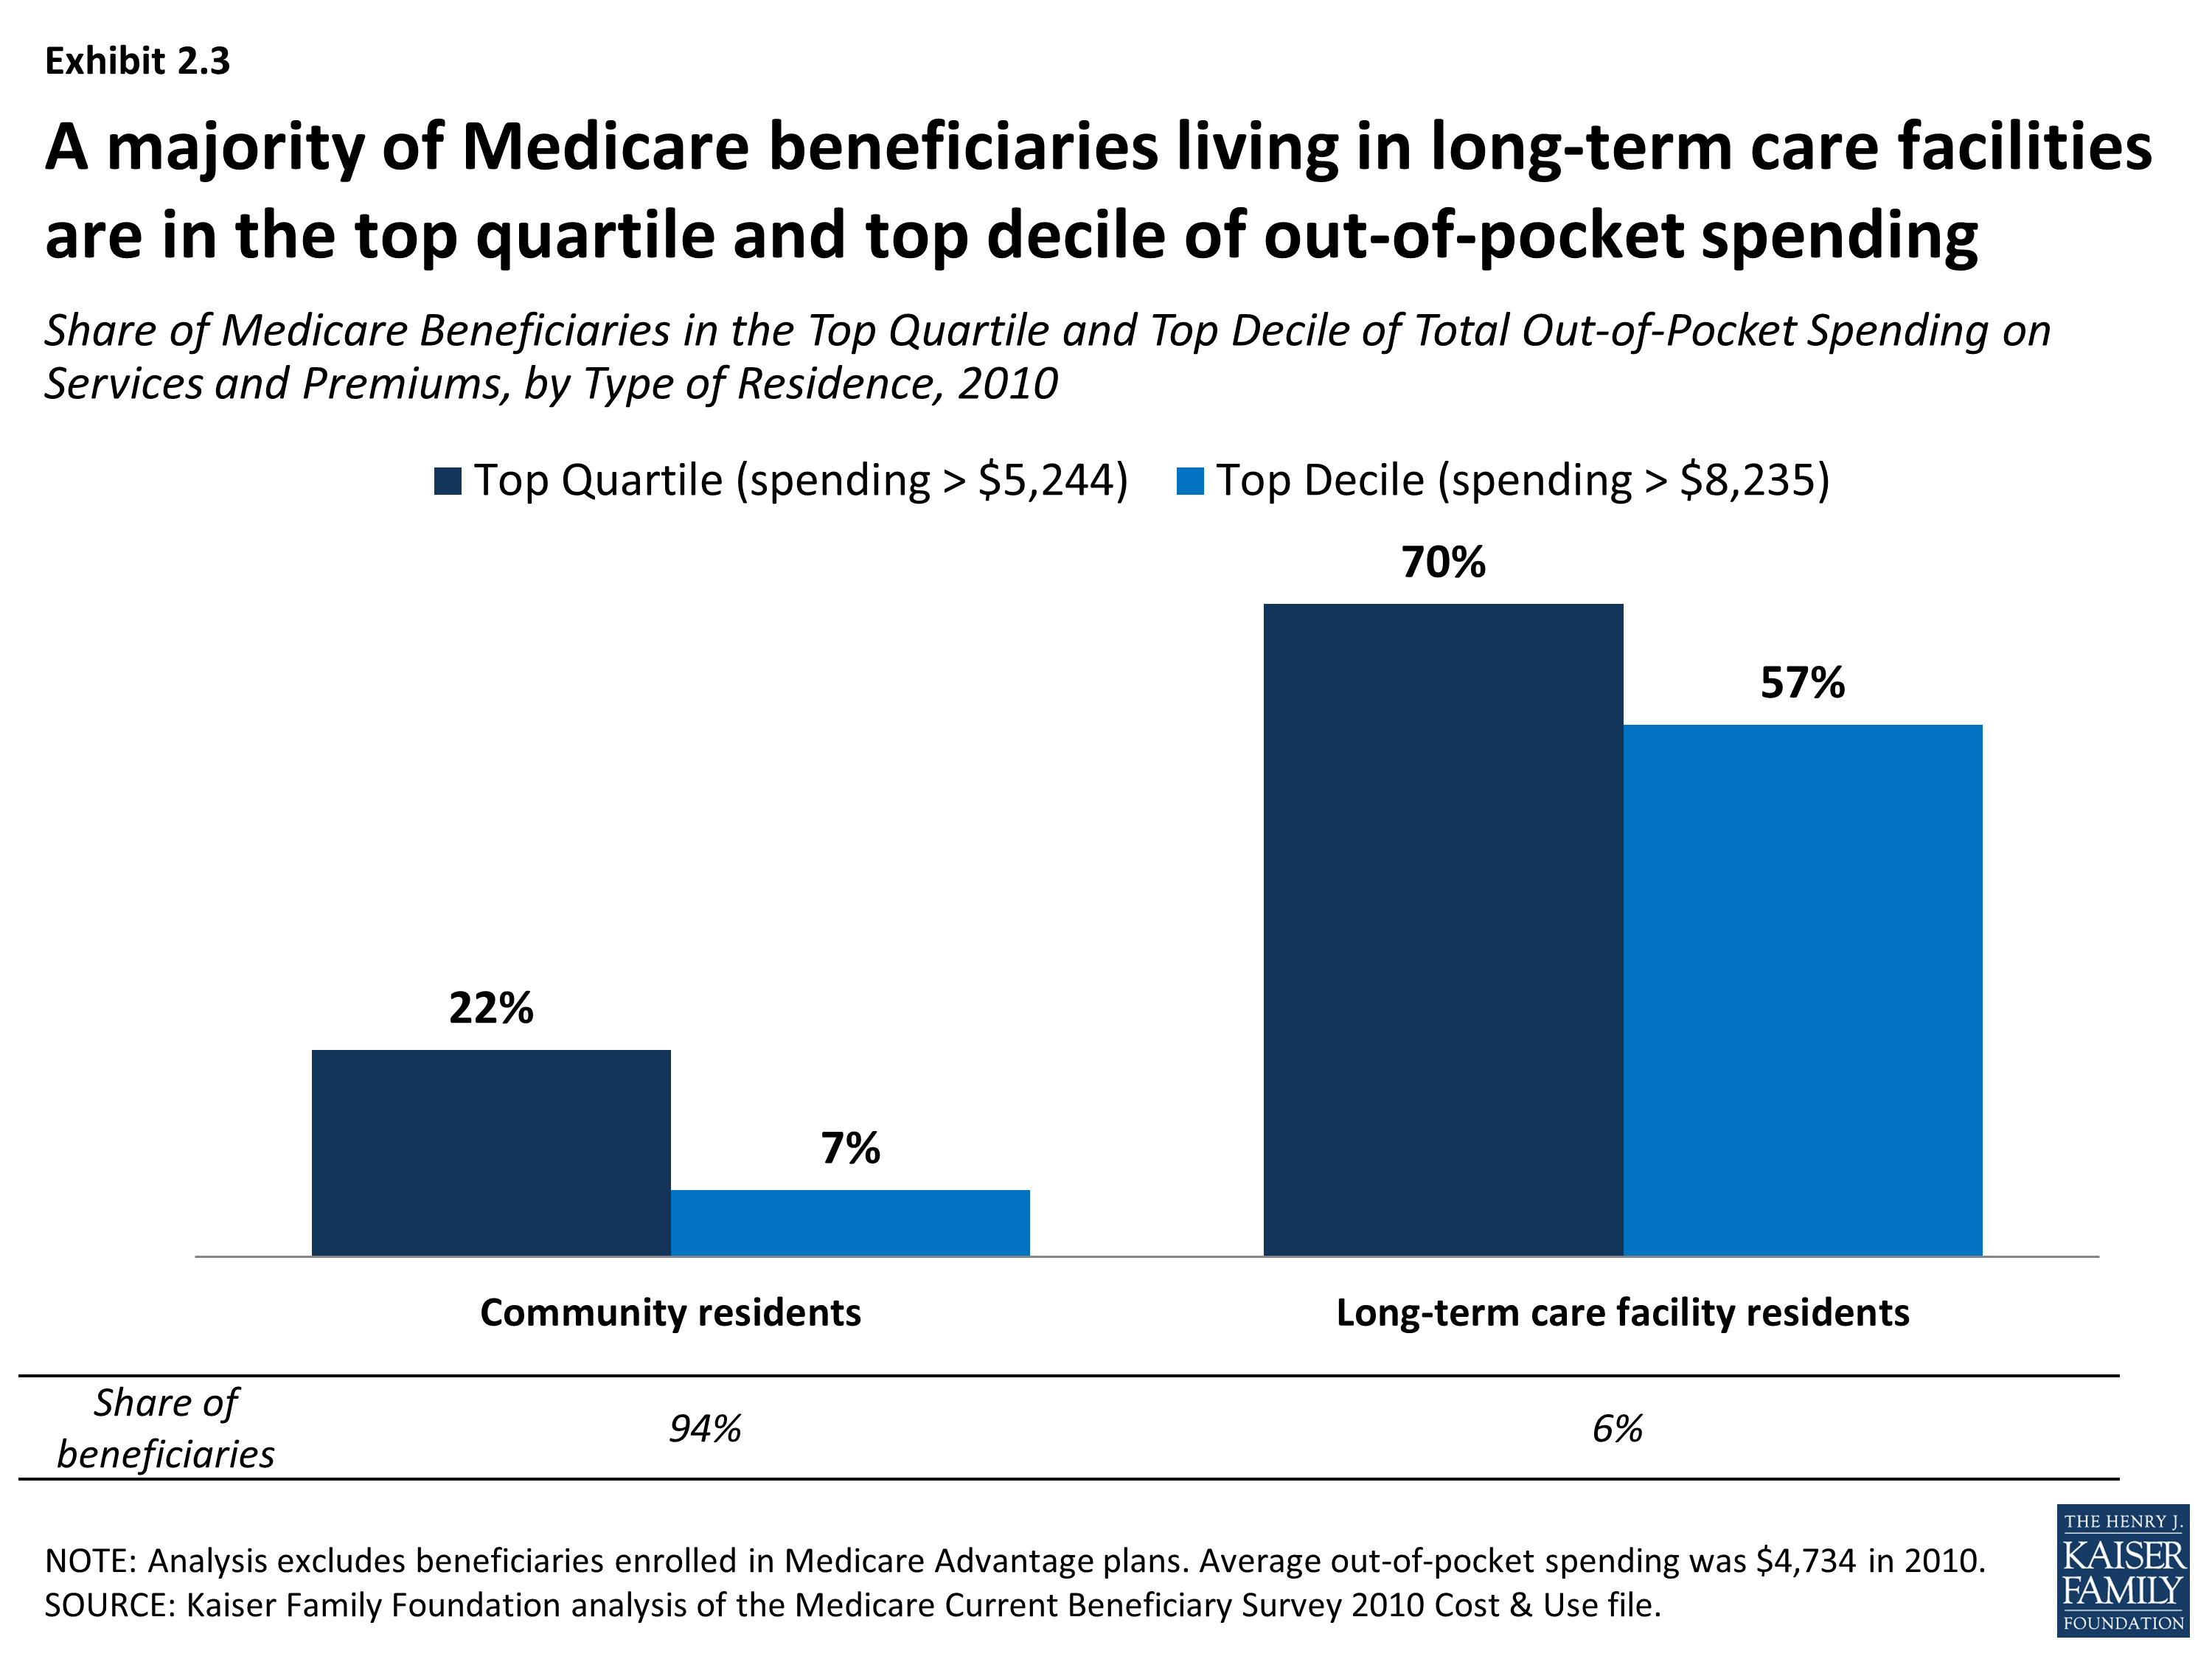
A greater share of some groups of beneficiaries than others are high out-of-pocket spenders. Perhaps not surprisingly, this includes the vast majority of Medicare beneficiaries who live in long-term care facilities, 70 percent of whom are in the top quartile of out-of-pocket spending on services and premiums (Exhibit 2.3). Overall, a greater share of older beneficiaries than younger beneficiaries are high out-of-pocket spenders, with more than one-third (38%) of beneficiaries ages 85 and older in the top quartile of total out-of-pocket spending (Exhibit 2.4). This estimate is somewhat lower but the results are directionally the same when looking at different age groups among community residents only; 33 percent of community residents ages 85 and over are in the top quartile compared to 24 percent of those ages 65 to 74 (data not shown).
Among beneficiaries ages 85 and older, a greater share of women than men are high out-of-pocket spenders, with 41 percent of women ages 85 and older in the top quartile compared to 33 percent of older men (Exhibit 2.5). These differences are attenuated but not eliminated when looking at out-of-pocket spending among community residents only; for example, 34 percent of women ages 85 and older living in the community are in the top quartile of total out-of-pocket spending compared to 31 percent of older men (data not shown).
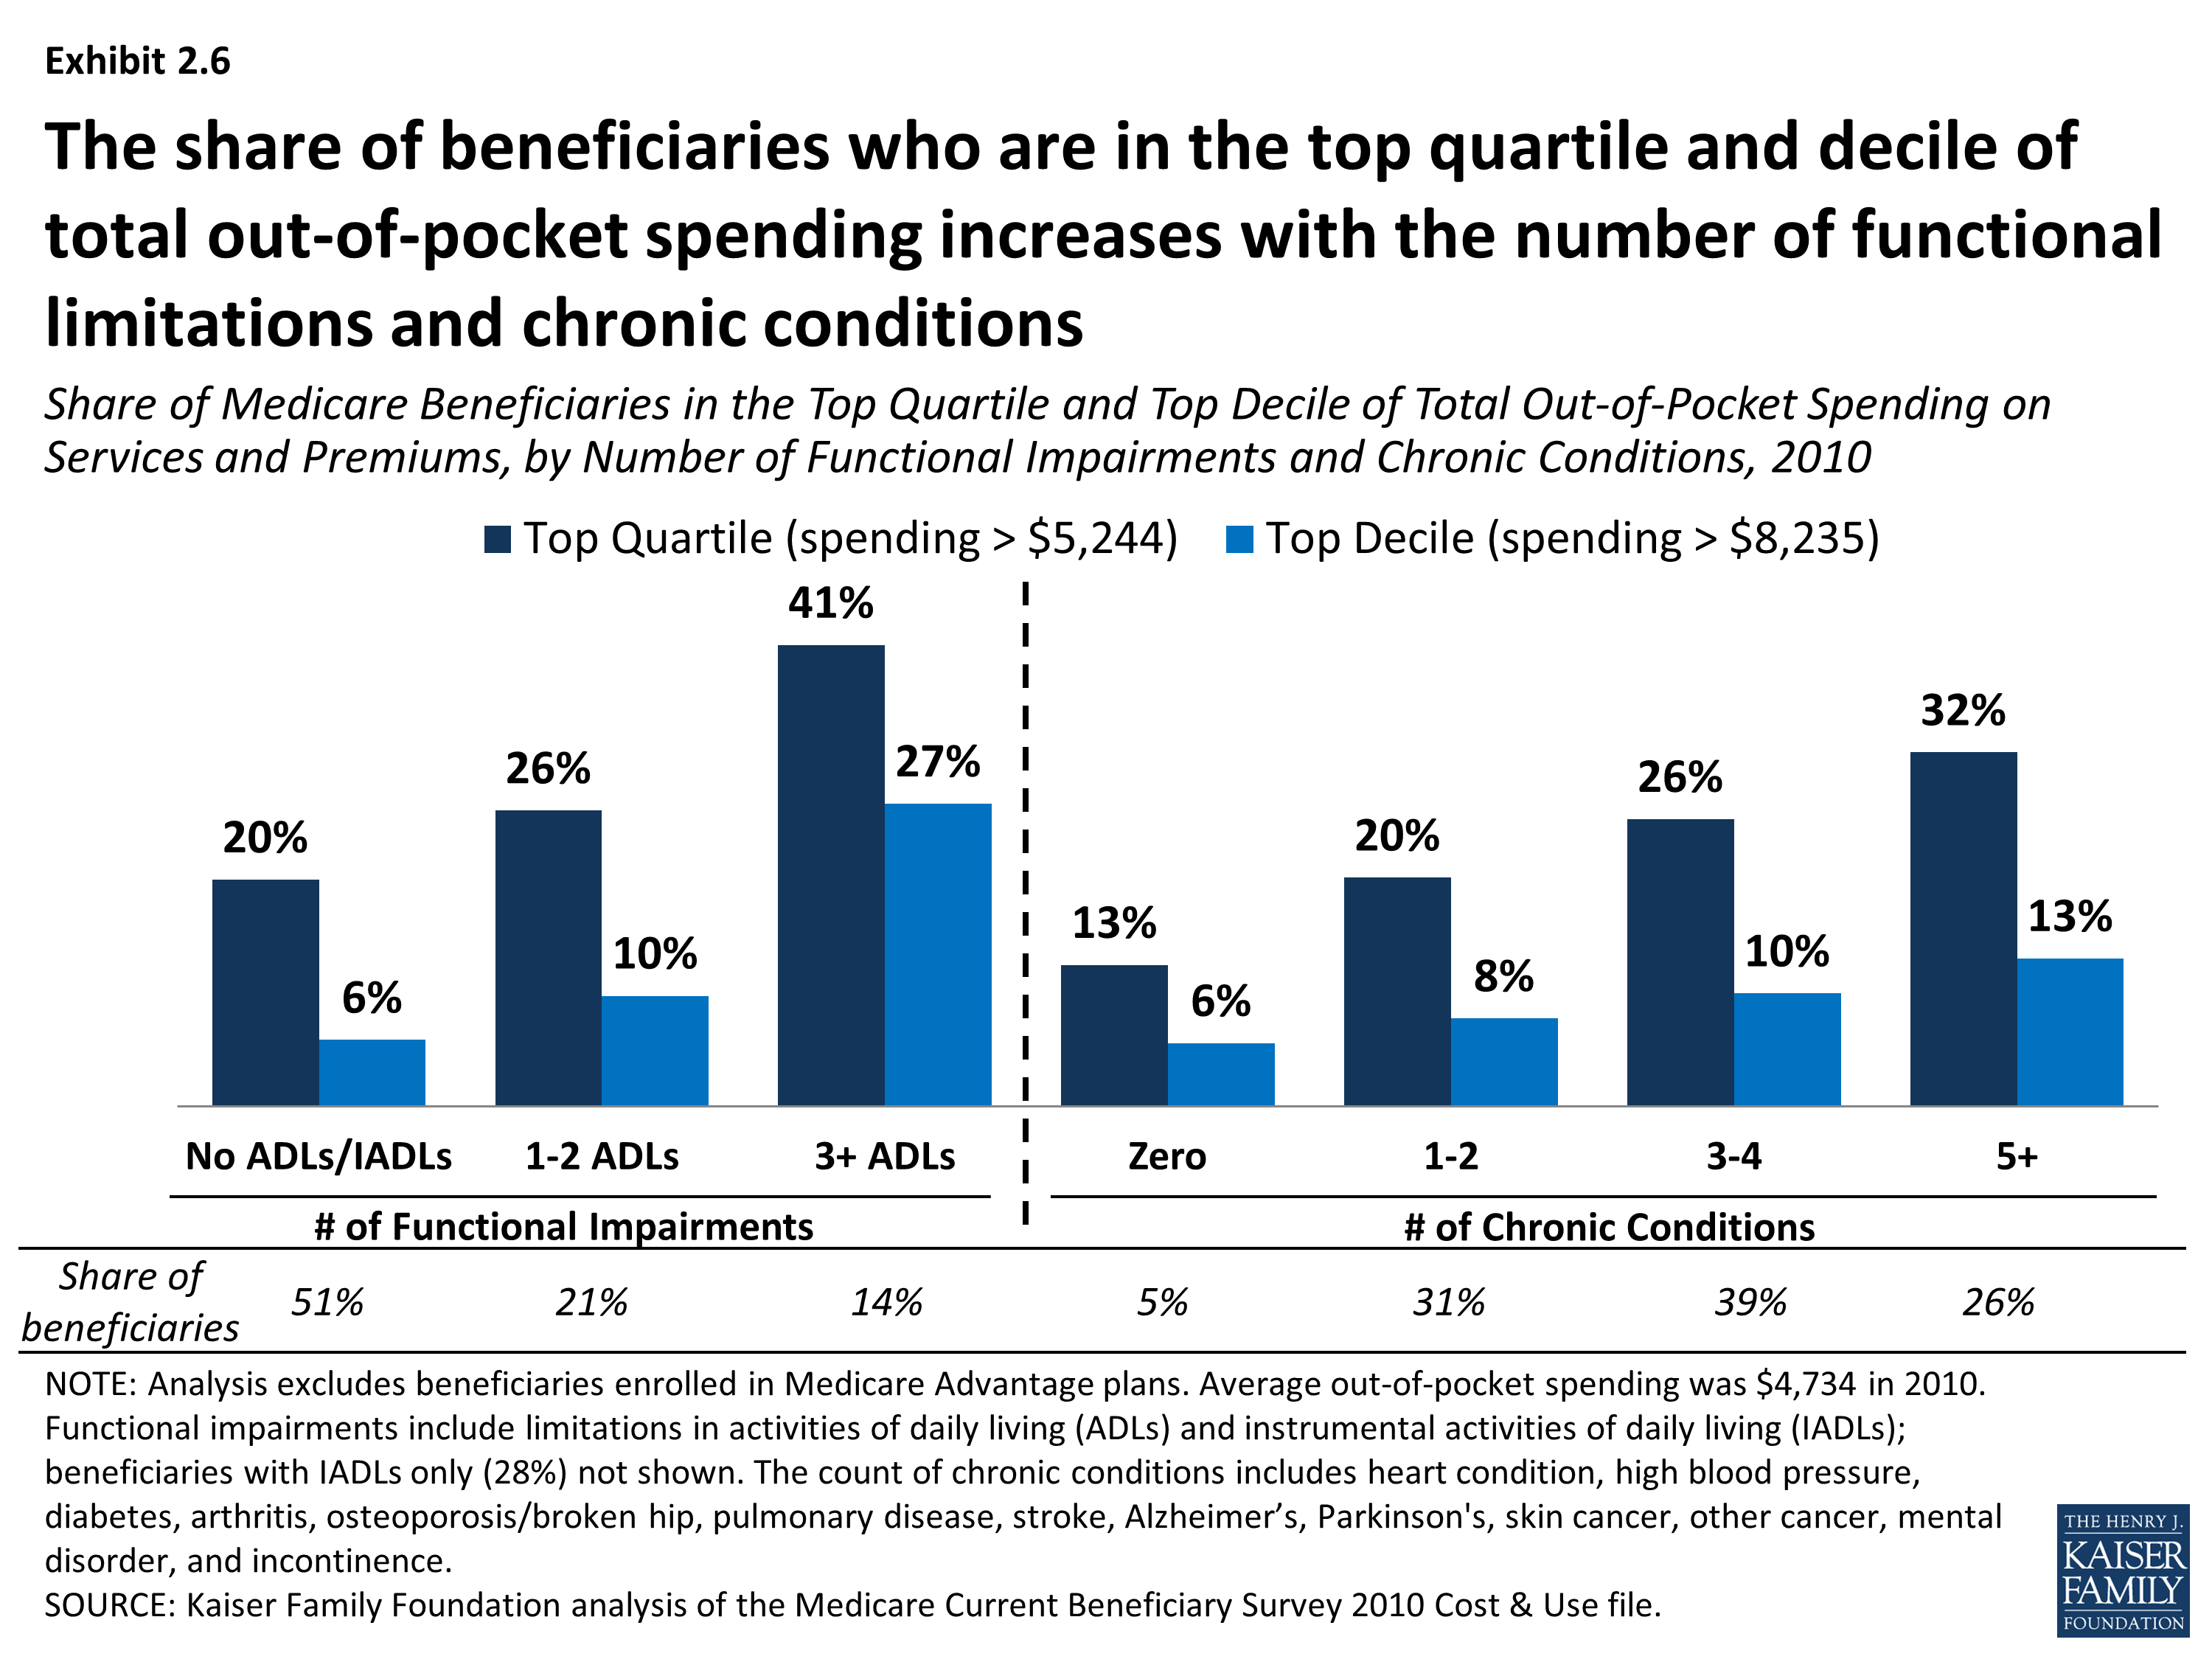
Just as average total out-of-pocket spending increases with the number of functional limitations and chronic conditions, the share of beneficiaries who are high out-of-pocket spenders increases with the number of functional limitations and chronic conditions. In 2010, 41 percent of beneficiaries with three or more limitations in activities of daily living (ADLs) were among the top quartile of spenders, compared to only 20 percent of those without any ADLs or IADLs (Exhibit 2.6). Nearly one-third (32%) of beneficiaries with five or more chronic conditions were in the top quartile of spending, compared to one-fifth of those with one or two chronic conditions. A greater share of beneficiaries with certain conditions are high out-of-pocket spenders; this includes more than four in ten beneficiaries with Alzheimer’s and end-stage renal disease (ESRD) in the top quartile of out-of-pocket spending, and roughly one-third of beneficiaries with certain other conditions. At least one in five beneficiaries with Parkinson’s disease, Alzheimer’s disease, and ESRD are in the top decile of out-of-pocket spending (Exhibit 2.7).
The share of Medicare beneficiaries in the top quartile and top decile of total out-of-pocket spending increases with the number of hospitalizations and skilled nursing facility (SNF) use. More than one-third (38%) of beneficiaries with one inpatient hospital stay were in the top quartile of total out-of-pocket spending in 2010, while 45 percent of beneficiaries with two or more hospitalizations and over half (54%) of beneficiaries with an inpatient stay and a SNF stay were in the top quartile of total out-of-pocket spending (this latter group may include beneficiaries in the first two groups) (Exhibit 2.8).
Percentile Estimates for Medicare Beneficiaries’ Out-of-Pocket Spending, 2010
Medicare Beneficiaries’ Average Total Out-of-Pocket Spending on Services and Premiums, by Total Out-of-Pocket Spending Quartile, 2010
Share of Medicare Beneficiaries in the Top Quartile and Top Decile of Total Out-of-Pocket Spending on Services and Premiums, by Type of Residence, 2010
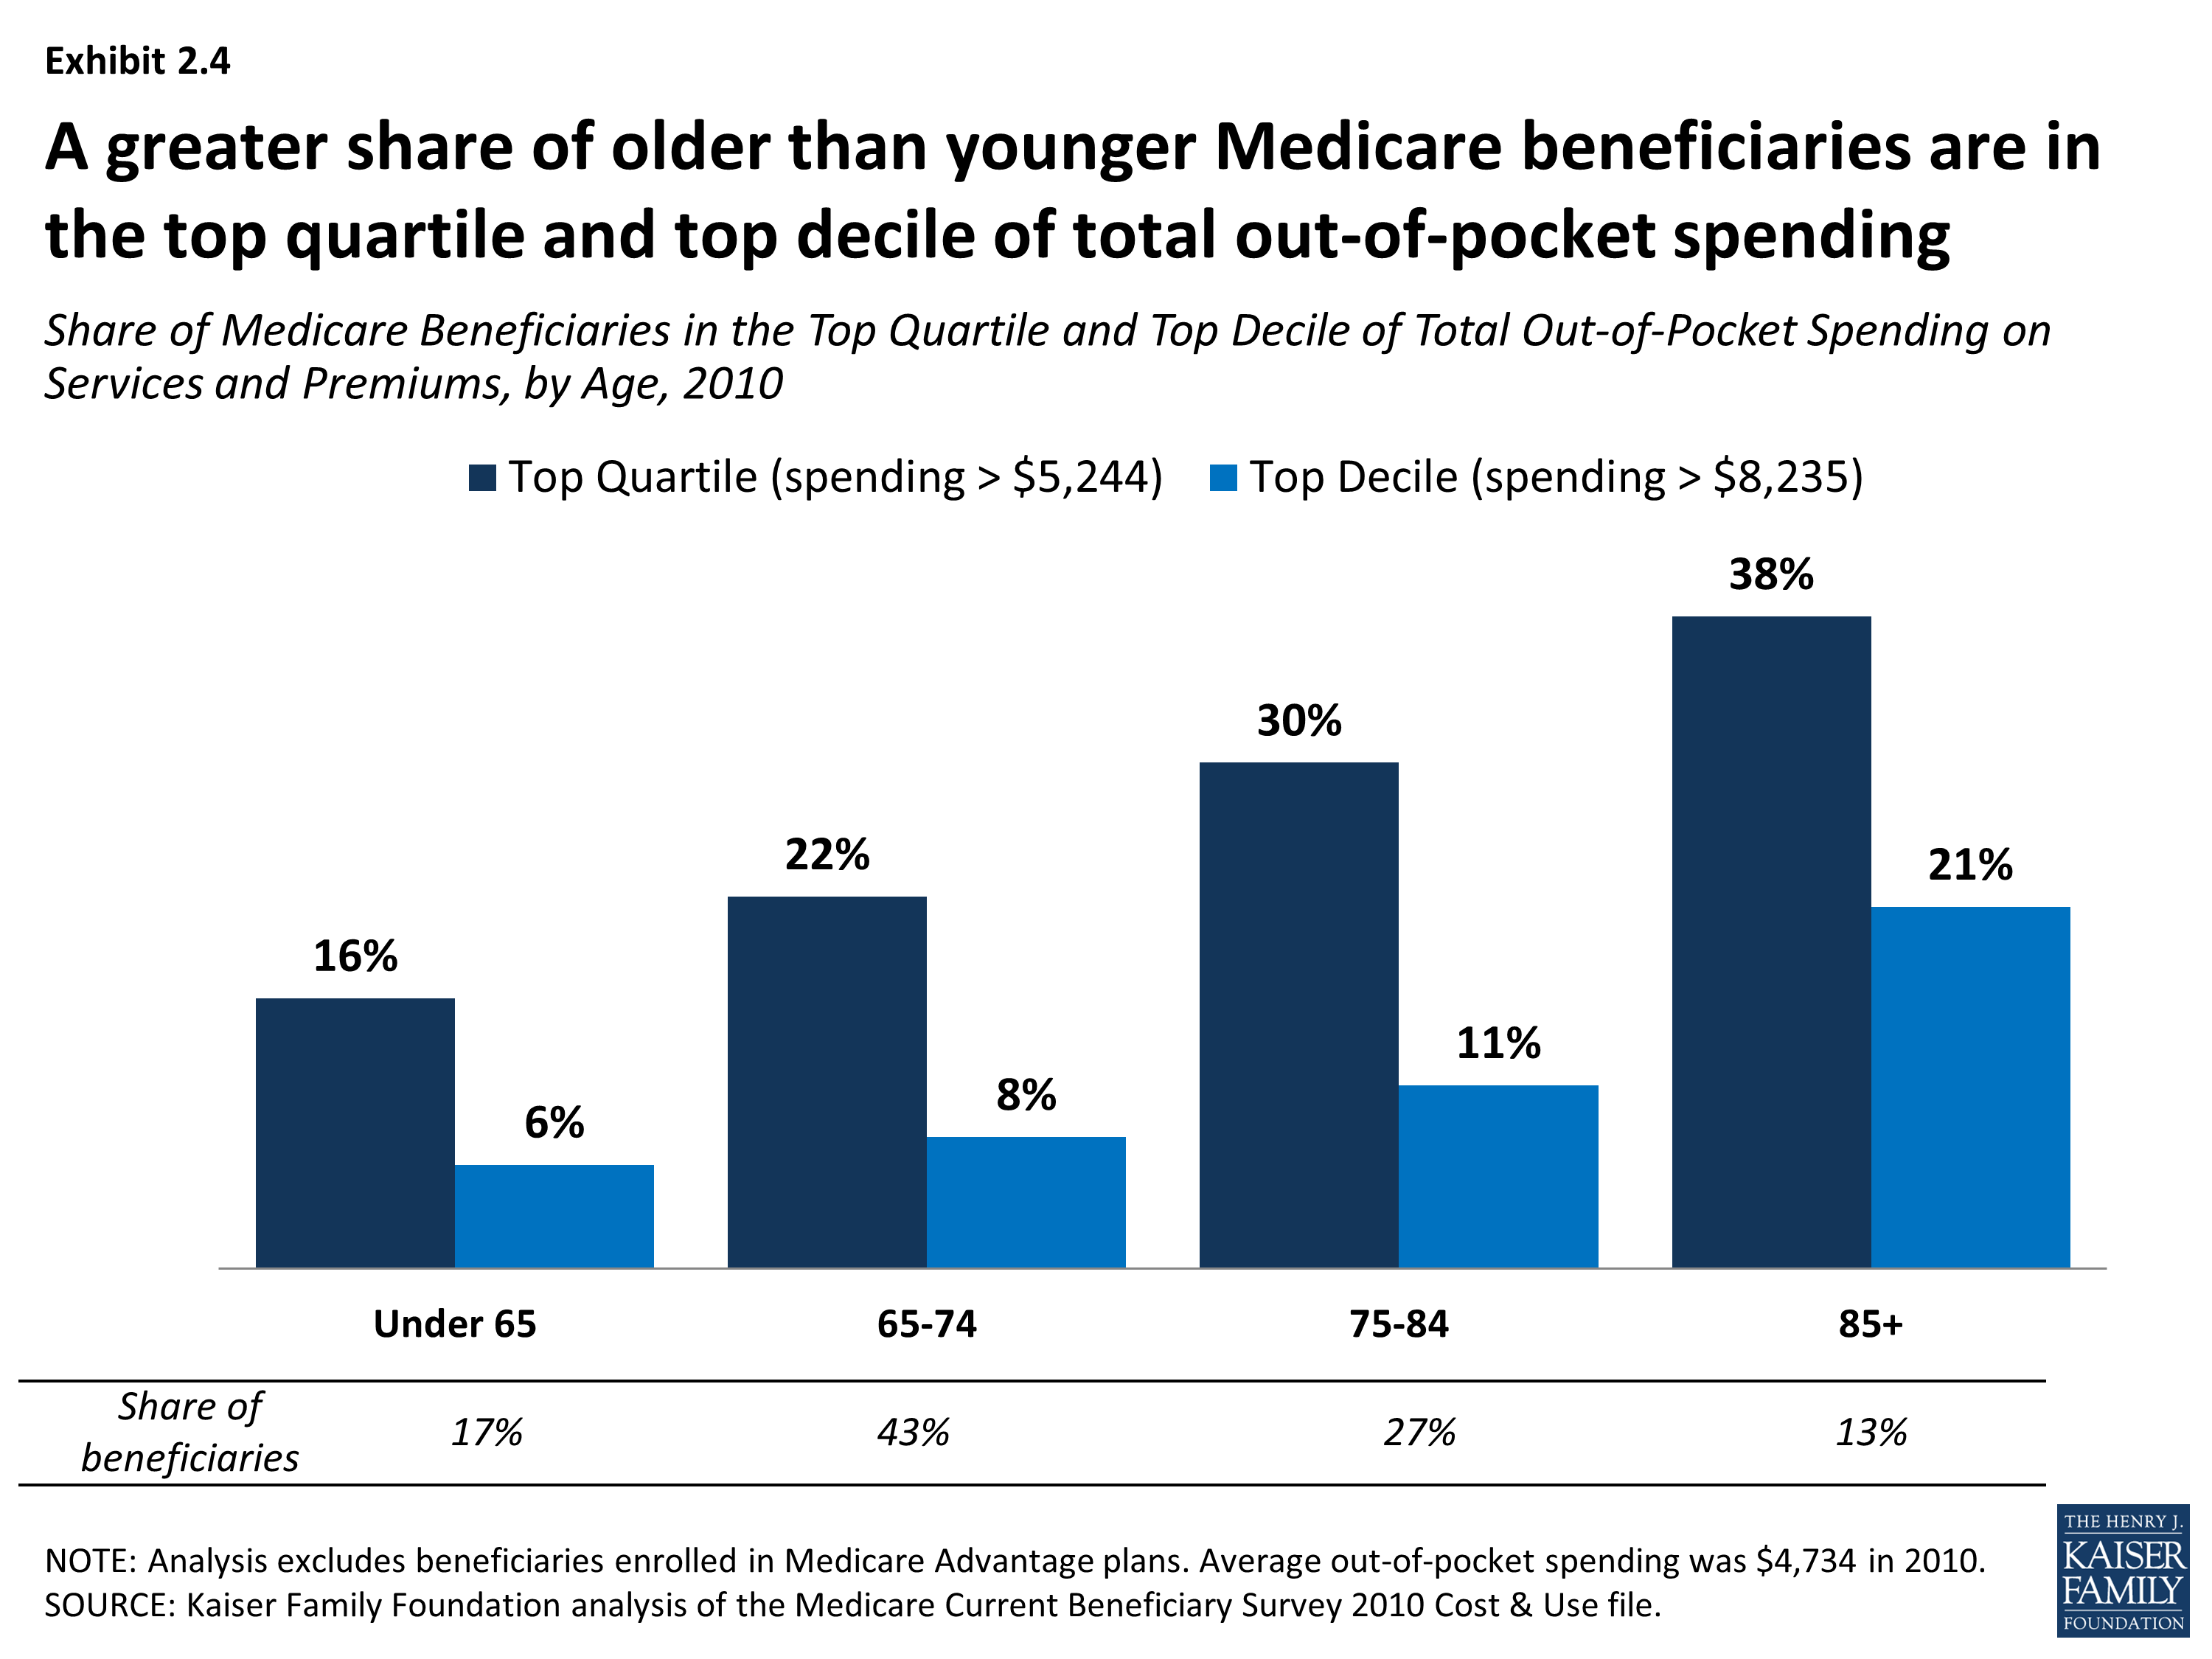
Share of Medicare Beneficiaries in the Top Quartile and Top Decile of Total Out-of-Pocket Spending on Services and Premiums, by Age, 2010
Share of Medicare Beneficiaries in the Top Quartile and Top Decile of Total Out-of-Pocket Spending on Services and Premiums, Gender by Age Group, 2010
Share of Medicare Beneficiaries in the Top Quartile and Top Decile of Total Out-of-Pocket Spending on Services and Premiums, by Number of Functional Impairments and Chronic Conditions, 2010
Share of Medicare Beneficiaries in the Top Quartile and Top Decile of Total Out-of-Pocket Spending on Services and Premiums, by Chronic Condition, 2010
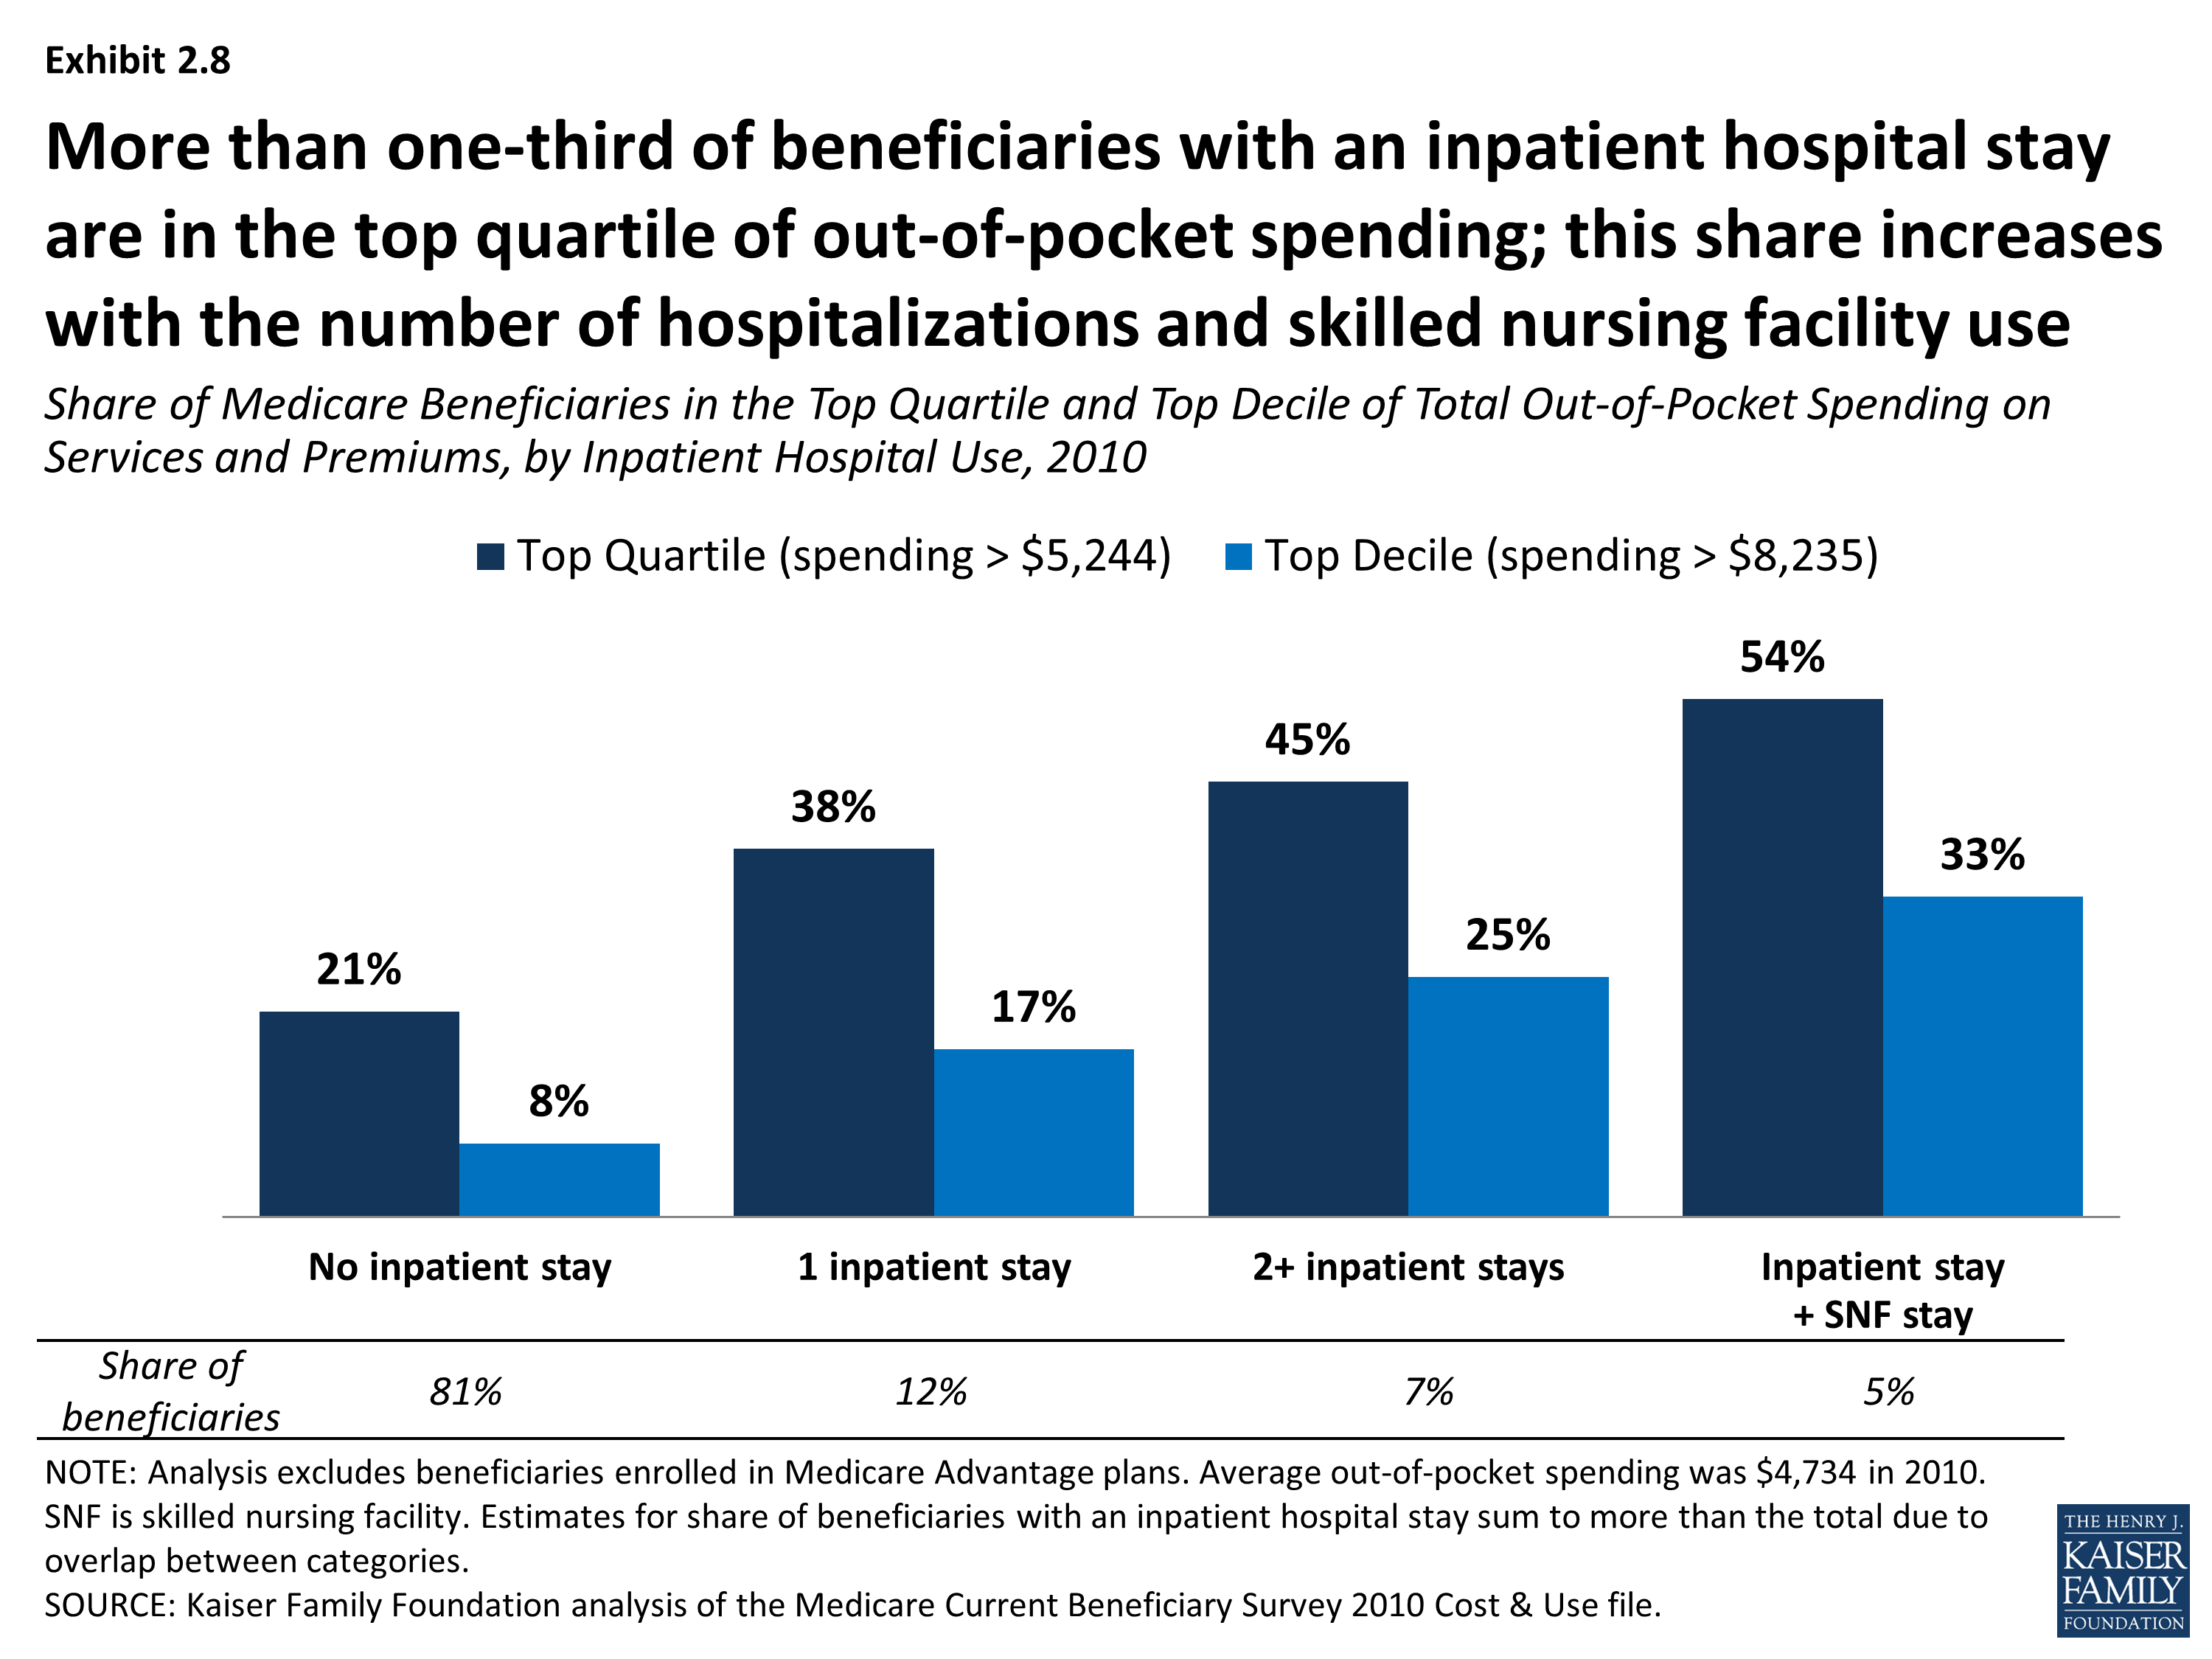
Share of Medicare Beneficiaries in the Top Quartile and Top Decile of Total Out-of-Pocket Spending on Services and Premiums, by Inpatient Hospital Use, 2010
Section 3: Trends in Out-of-Pocket Spending By Medicare Beneficiaries, 2000-2010
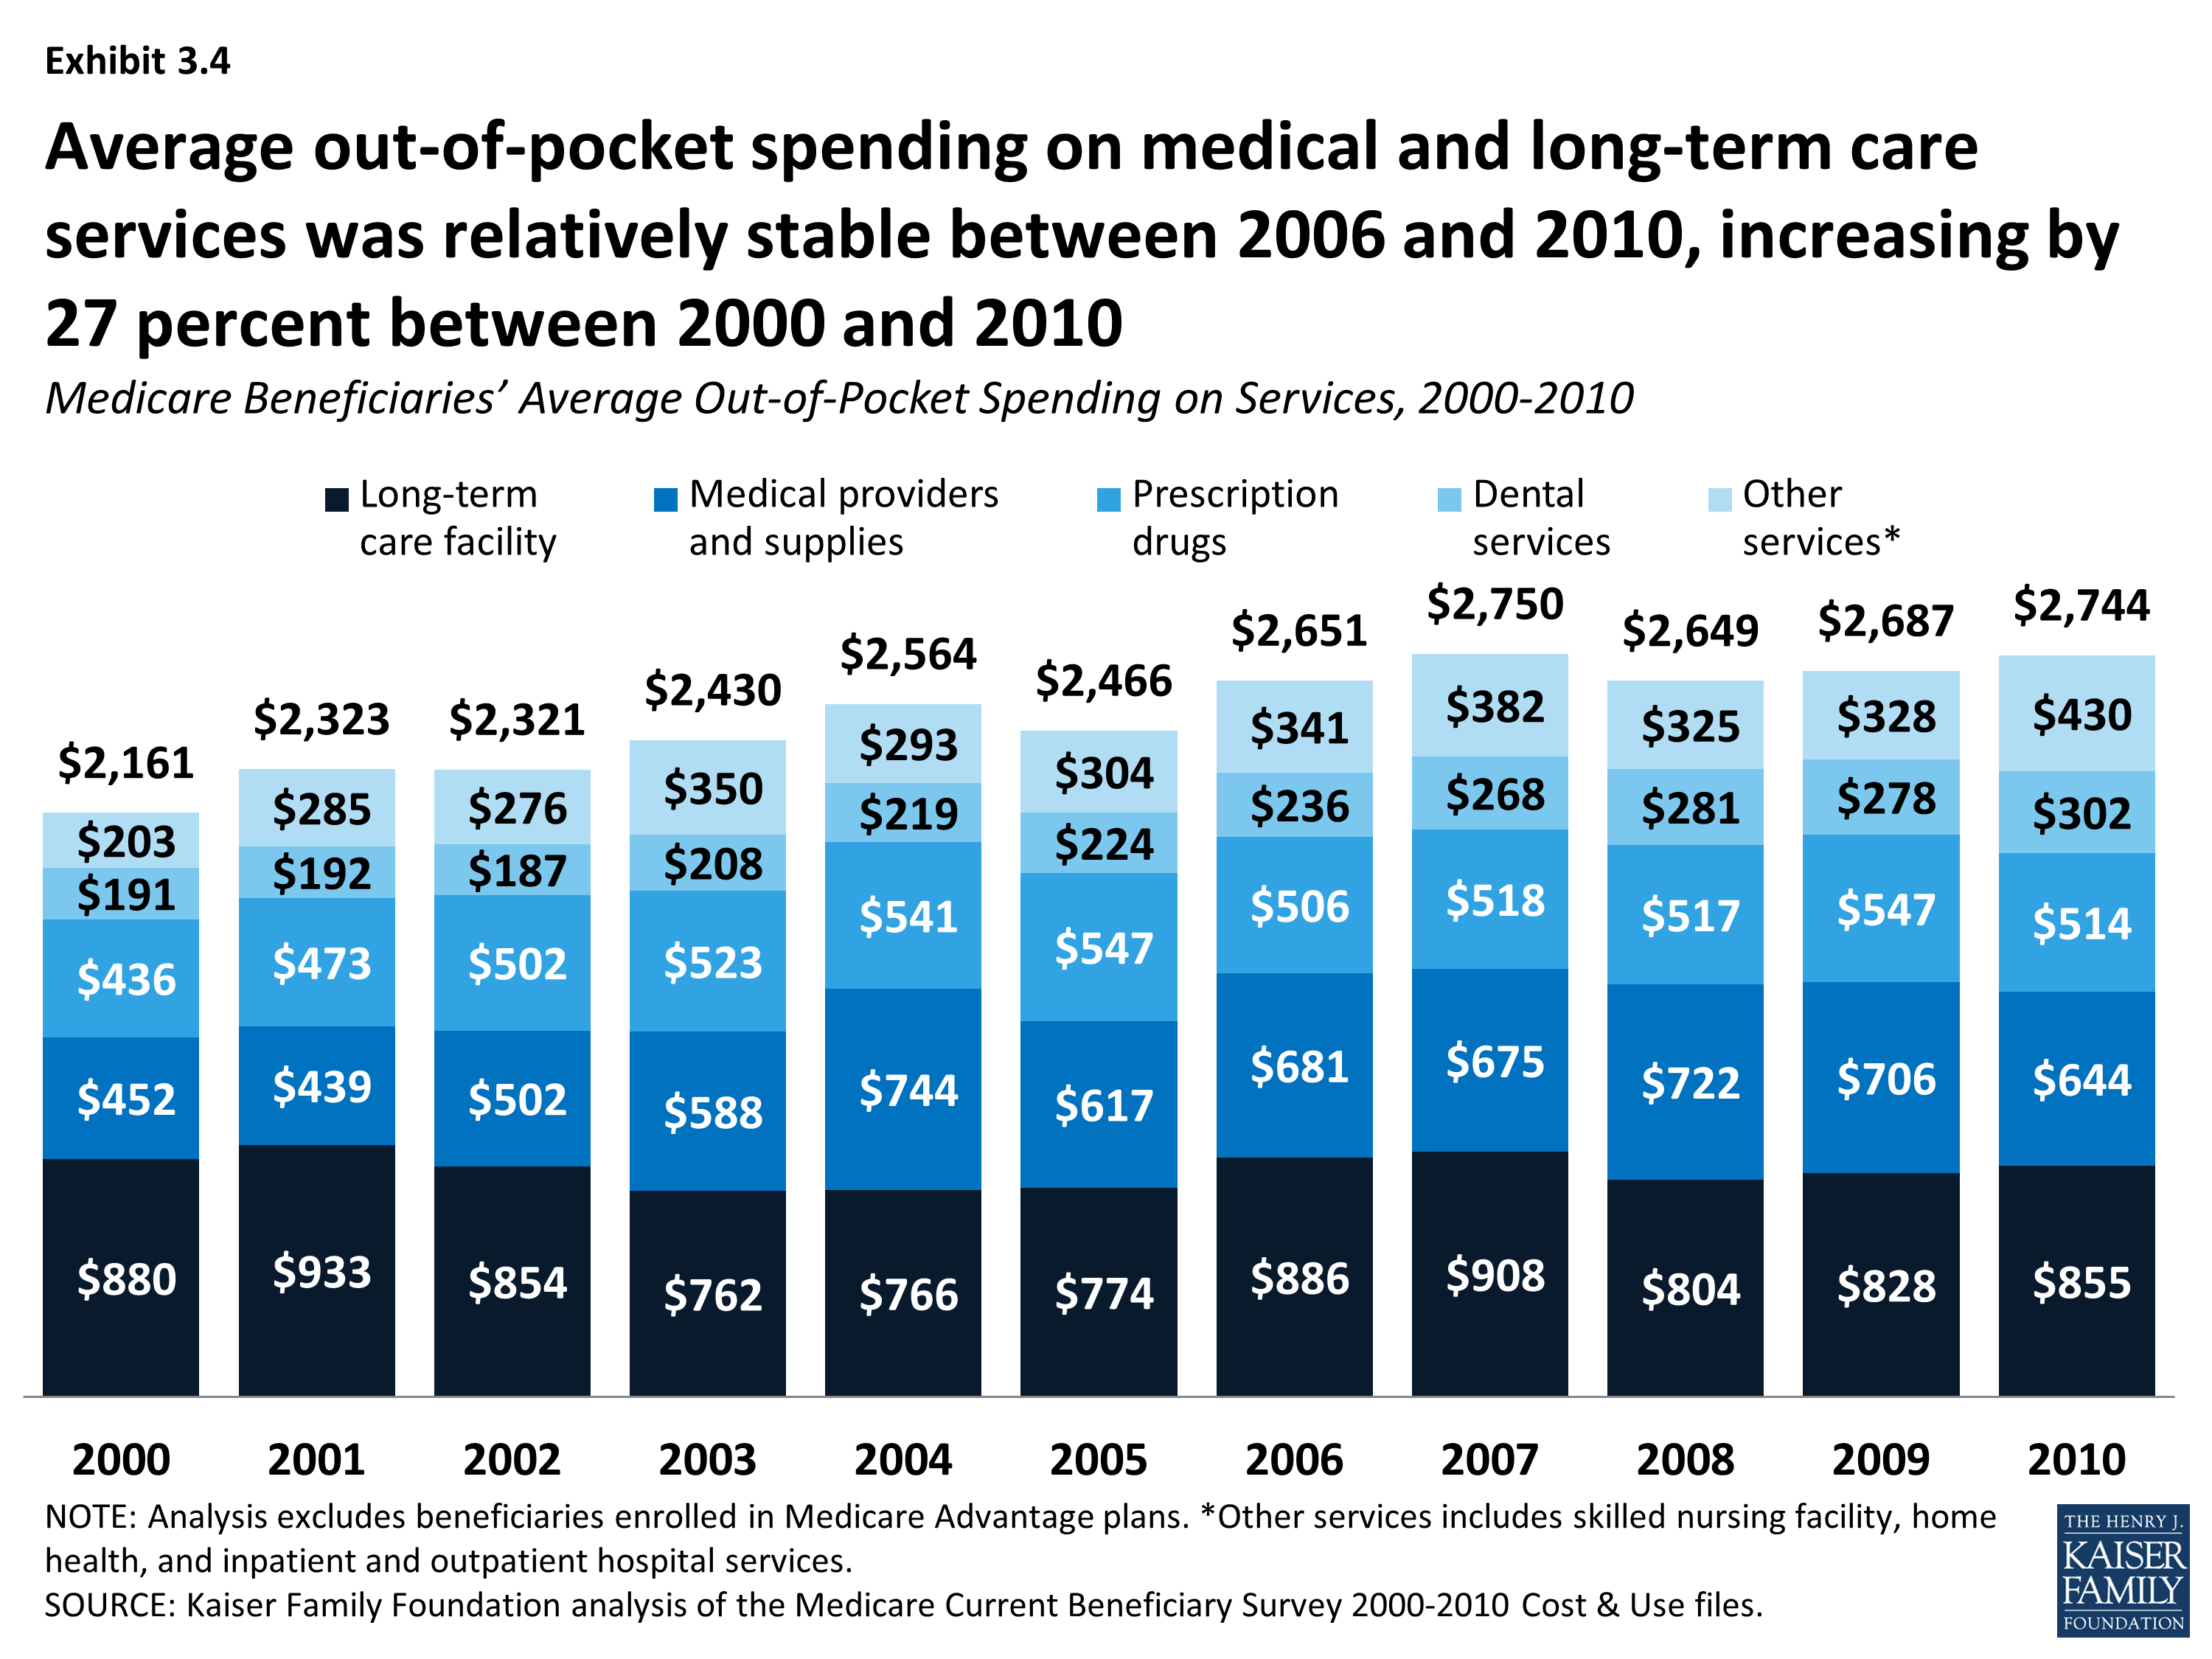
Medicare beneficiaries’ average total out-of-pocket spending, including services and premiums, increased by nearly $1,500 between 2000 and 2010. On average, beneficiaries in traditional Medicare spent $1,500 more (a 44 percent increase) on their total out-of-pocket costs (including services and premiums) in 2010 than in 2000 ($4,734 vs. $3,293, respectively) (Exhibit 3.1). Average out-of-pocket spending on medical and long-term care services increased by 27 percent between 2000 and 2010 (from $2,161 to $2,744), while average out-of-pocket spending on Medicare and other premiums increased by 76 percent (from $1,132 to $1,989).
Between 2000 and 2010, total out-of-pocket costs increased at an average annual growth rate of 3.7 percent; the average annual growth rate between 2000 and 2010 was higher for premiums (5.8%) than for services (2.4%) (Exhibit 3.2) and (Exhibit 3.3).
While average total out-of-pocket spending increased between 2000 and 2010, the annual rate of growth in spending trended downward after 2006. The annual rate of growth in average total out-of-pocket spending fluctuated over the years between 2000 and 2010, but trended down in the latter part of the decade (Exhibit 3.2). Total out-of-pocket spending among beneficiaries in traditional Medicare increased at an average annual rate of growth of 5.0 percent between 2000 and 2006, but this growth rate fell to 1.8 percent between 2006 and 2010.
This downward trend in the annual rate of growth in average total out-of-pocket spending also applies to both services and premiums. Similar to the downward trend in the average annual growth rate for total out-of-pocket spending, we observed slower growth in the separate components of total out-of-pocket spending (Exhibit 3.3). Out-of-pocket spending on services increased at an average annual growth rate of 3.5 percent between 2000 and 2006, but this growth rate dropped to 0.9 percent between 2006 and 2010; for premiums, the average annual growth rate decreased from 7.6 percent between 2000 and 2006 to 3.2 percent between 2006 and 2010.
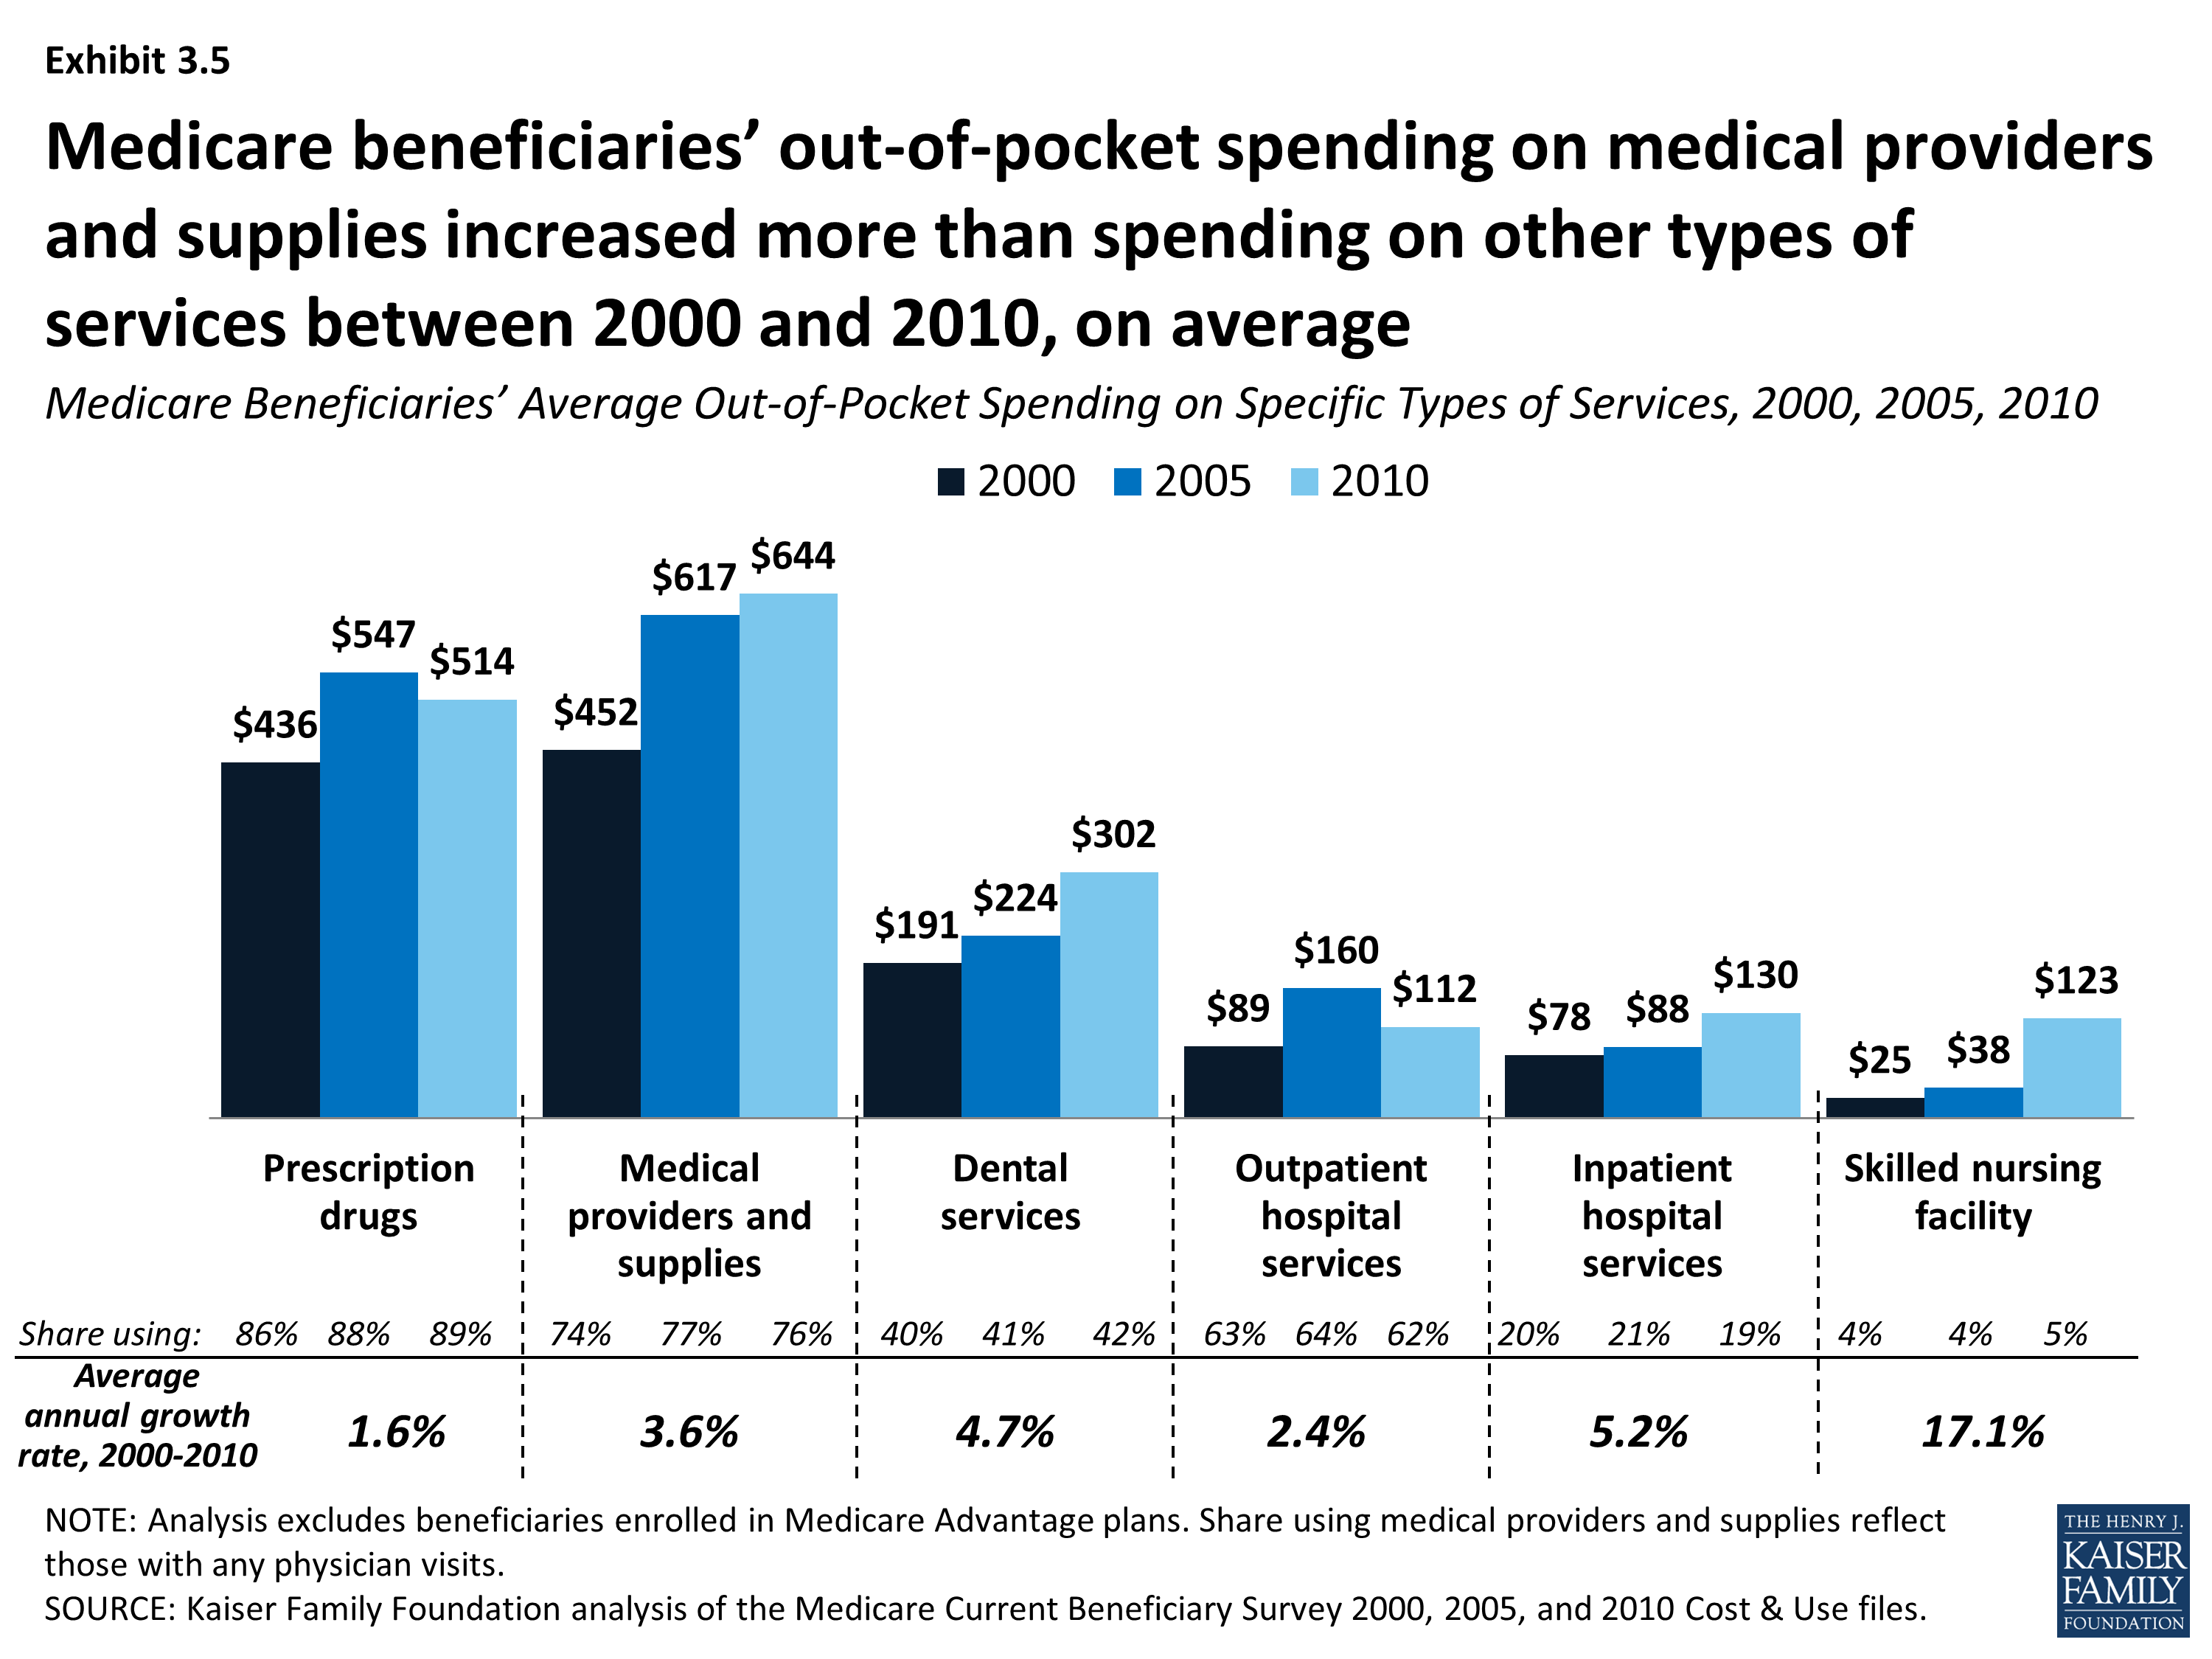
Among all beneficiaries, average out-of-pocket spending on medical providers/supplies, dental services, and skilled nursing facility services increased more than average spending on other types of services between 2000 and 2010.(Exhibit 3.4) However, the average annual rate of growth in out-of-pocket spending between 2000 and 2010 was more than three times greater for spending on skilled nursing facilities (17.1%) than the next fastest growing category of spending (inpatient hospital services; 5.2%) (Exhibit 3.5).
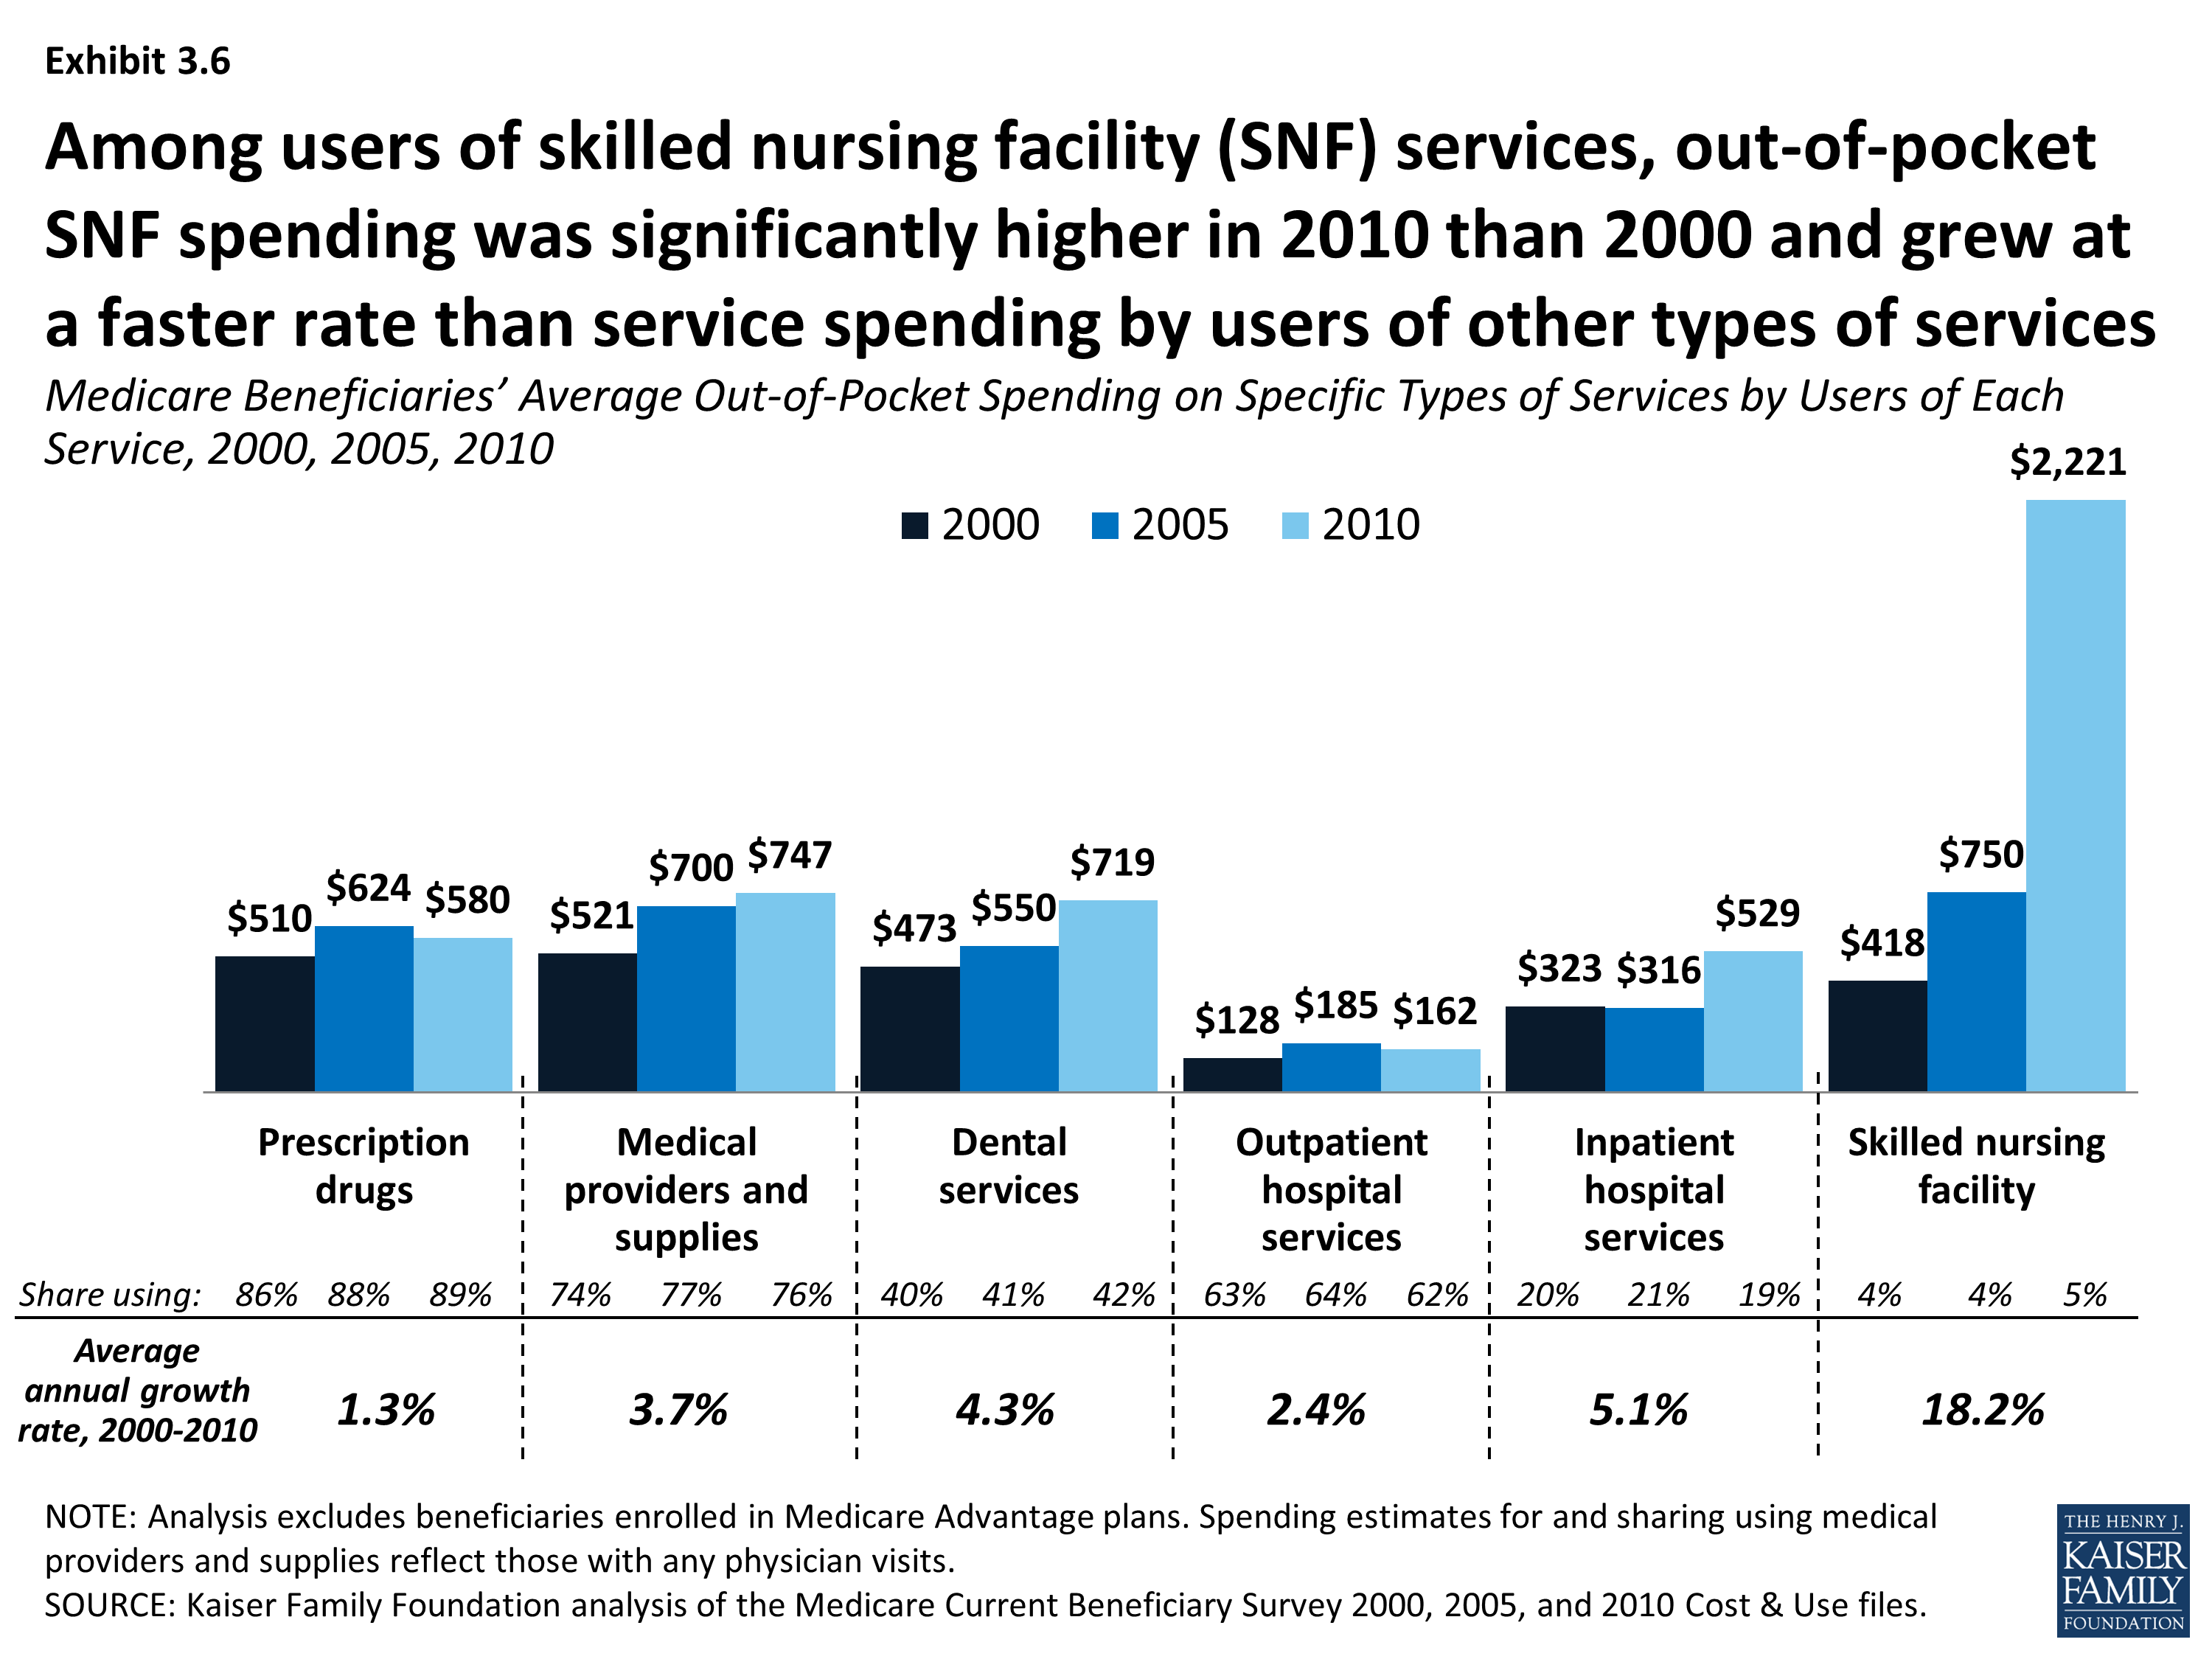
Among users of services, average out-of-pocket spending for most types of services increased between 2000 and 2010. In 2010, beneficiaries with a skilled nursing facility stay spent five times more on SNF services than those with a SNF stay in 2000 ($2,221 vs. $418, respectively, on average) (Exhibit 3.6). The average number of days associated with SNF stays increased from 28 to 35 over the same period.1 Users of prescription drugs spent somewhat more out of pocket on prescription drugs in 2010 than in 2000, on average—increasing from $510 in 2000 to $580 in 2000, while the average number of prescription drug fills increased from 28 to 42 over these years.2 It is likely that the introduction of the Part D prescription drug benefit in 2006 and the shift toward greater use of generic drugs helped to moderate the average out-of-pocket spending increase among prescription drug users, as well as contributing to the growth in the number of prescription fills.
Medicare Beneficiaries’ Average Total Out-of-Pocket Spending on Services and Premiums, 2000-2010
Annual Rate of Growth in Medicare Beneficiaries’ Average Total Out-of-Pocket Spending, Including Services and Premiums, 2000-2010
Annual Rate of Growth in Medicare Beneficiaries’ Average Out-of-Pocket Spending on Services and Premiums, 2000-2010
Medicare Beneficiaries’ Average Out-of-Pocket Spending on Services, 2000-2010
Medicare Beneficiaries’ Average Out-of-Pocket Spending on Specific Types of Services, 2000, 2005, 2010
Medicare Beneficiaries’ Average Out-of-Pocket Spending on Specific Types of Services by Users of Each Service, 2000, 2005, 2010
Methodology
The analysis in this chartbook is based on data from the Centers for Medicare & Medicaid Services (CMS) Medicare Current Beneficiary Survey (MCBS) Cost and Use file, 2000-2010 (the most recent year available). The MCBS is a survey of a nationally-representative sample of the Medicare population, including both aged and disabled enrollees who are living in the community as well as facility residents. The Cost and Use file integrates survey information reported directly by beneficiaries with Medicare administrative data. Survey-reported data includes the demographics of respondents, such as sex, age, race, living arrangements, income, health status, and physical functioning, the use and costs of health care services, and supplementary health insurance arrangements. The survey also collects information on inpatient and outpatient hospital care, physician and other medical provider services, home health services, durable medical equipment, long-term and skilled nursing facility services, hospice services, dental services, and prescription drugs. Survey-reported information is matched to and supplemented by administrative records and billing and claims-level data when possible. Extensive efforts are made to verify the accuracy of survey reports and to reconcile discrepancies using administrative bill data to produce a more complete and reliable dataset.
At present, however, this reconciliation process is not possible for beneficiaries enrolled in Medicare Advantage plans, because Medicare Advantage plans were not required to report encounter data to CMS until recently. Because the 2010 MCBS does not include reliable utilization and out-of-pocket spending data for beneficiaries in Medicare Advantage plans, to include this population would introduce significant bias associated with underreporting of events and spending for Medicare Advantage enrollees. Therefore, our analysis excludes these beneficiaries, totaling 10.8 million or 22 percent of the 48.4 million Medicare beneficiaries represented in the 2010 MCBS. Our analysis is limited to beneficiaries enrolled in traditional Medicare only, representing 78 percent of all Medicare beneficiaries in 2010.
Out-of-pocket spending for medical and long-term care services reported in the MCBS is not the same as beneficiary liability or the Medicare cost-sharing amount for services used. Instead, out-of-pocket spending amounts are net of payments by any third-party payers, such as payments by Medicaid, Medigap, or employer-sponsored insurance. Survey-reported out-of-pocket payments are those payments made by the beneficiary or their family, including direct cash payments or in the form of Social Security or Supplemental Security Income (SSI) checks to a nursing home. Out-of-pocket spending on premiums is derived from administrative data on Medicare Part A and Part B premiums paid by each sample person along with survey-reported estimates of premium spending for other types of health insurance beneficiaries may have (including Medigap, employer-sponsored insurance, and other public and private sources).
To estimate total out-of-pocket spending per beneficiary in traditional Medicare, we calculate for each sample person aggregate estimates of out-of-pocket spending on both insurance premiums for Medicare Parts A and B and supplemental insurance coverage and medical and long-term care services reported in the MCBS. These amounts are averaged across the entire sample of traditional Medicare beneficiaries and weighted to be representative of the traditional Medicare beneficiary population or specific subgroups of beneficiaries. For analysis of high out-of-pocket spending, we divide total out-of-pocket spending by traditional Medicare beneficiaries into quartiles and deciles, and estimate the share of beneficiaries overall and by subgroup who have spending in the top quartile and top decile of total out-of-pocket spending.
The medical and long-term care services included in this analysis are:
- Dental services: Includes cleaning, x-rays, repair, purchase or repair of dentures, and orthodontic procedures. The basic unit measuring use of these services is a single visit to the dentist, where a variety of services might be rendered.
- Home health: Includes home health visits by professionals (nurses, doctors, social workers, therapists, and hospice workers) or friends (persons who do not live with the beneficiary, but help the beneficiary at home with personal care or other daily needs; these persons may be home health aides, homemakers, friends, neighbors or relatives).
- Inpatient hospital services: Includes inpatient hospital stays, including emergency room visits which result in an inpatient admission. The basic unit measuring use of inpatient hospital services is a single admission.
- Long-term care facility services: Includes individual long-term care facility events; a long-term care facility is defined as having three or more beds and providing long-term care services throughout the facility or in a separately identifiable unit. Types of facilities participating in the survey include nursing homes, retirement homes, domiciliary or personal care facilities, distinct long-term units in a hospital complex, mental health facilities and centers, assisted and foster care homes, and institutions for the mentally retarded and developmentally disabled. The basic unit measuring use of long-term care facility services is a “stay” in a nursing home or other long-term care facility. Stays are measured in terms of days of residence in that facility.
- Medical providers/supplies: Includes medical doctor and practitioner visits; diagnostic laboratory and radiology; medical and surgical services; and durable medical equipment and non-durable supplies, such as eyeglasses or contact lenses and hearing aids, orthopedic items such as canes, walkers, wheelchairs and corrective shoes, diabetic supplies, oxygen supplies and equipment. Types of practitioners include chiropractors, podiatrists, audiologists and optometrists; mental health professionals such as psychiatrists, psychologists and clinical social workers; therapists such as physical therapists, speech therapists, occupational therapists, and intravenous and respiratory therapists; other medical practitioners such as nurses and paramedics; and other places offering medical care, such as clinics, neighborhood health centers, infirmaries and urgent care centers. The basic unit measuring use of these services is a separate visit, procedure, service, or a supplied item for a survey reported event.
- Outpatient hospital services: Includes outpatient visits to the outpatient department or outpatient clinic of a hospital, as well as emergency room visits that do not result in a hospital admission. The basic unit measuring use of outpatient services is a separate visit to any part of the outpatient department for a survey-reported event.
- Prescription drugs: Includes individual outpatient prescribed medicine events, including drugs provided to enrollees in Medicare Part D drug plans; excludes prescription medicines provided by the doctor or practitioner as samples and those provided in an inpatient setting. The basic unit measuring use of prescription drugs is a single purchase of a single drug in a single container.
- Skilled nursing facility services: Includes short-term institutional stays, such as skilled nursing home stays or rehabilitation hospital stays; excludes inpatient hospital admissions and long-term care facility stays. The basic unit measuring use of these services is an admission.
There is one important limitation in the data related to home health care. The home health use and payment records in the MCBS Cost and Use file are designed to represent events where medical care, as opposed to personal care and support, was furnished to the sample person. This exclusion of personal care services and supports is deliberate, since the MCBS is intended to capture medical service use and spending of Medicare covered and non-covered services. Therefore, any out-of-pocket spending on personal care and support delivered in the home or the value of unpaid personal care and support services is not included in the out-of-pocket spending estimate for home health services. For some beneficiaries, this would produce a lower estimate of their total out-of-pocket spending for home-based care, but we are not able to estimate the magnitude of this effect.
Appendices
| Table 1: Average and Percentile Estimates of Medicare Beneficiaries’ Total Out-of-Pocket Spending on Services and Premiums, by Demographics, 2010 | |||||||
| Beneficiaries | Out-of-pocket spending | ||||||
| Number | % of Total | Average | 25th percentile | Median | 75th percentile | 90th percentile | |
| TOTAL | 37,582,769 | 100% | $4,734 | $1,711 | $3,312 | $5,244 | $8,235 |
| Sex | |||||||
| Men | 16,874,786 | 45 | 4,363 | 1,581 | 3,012 | 4,933 | 7,660 |
| Women | 20,707,984 | 55 | 5,036 | 1,819 | 3,550 | 5,459 | 8,636 |
| Race/ethnicity | |||||||
| White | 29,646,586 | 79 | 5,179 | 2,026 | 3,642 | 5,528 | 8,683 |
| Black | 3,555,108 | 9 | 3,151 | 575 | 1,862 | 3,801 | 6,530 |
| Hispanic | 2,513,783 | 7 | 2,826 | 518 | 1,733 | 3,635 | 5,480 |
| Age | |||||||
| Under 65 | 6,410,667 | 17 | 3,007 | 437 | 1,826 | 3,898 | 6,463 |
| 65-74 | 16,125,438 | 43 | 4,020 | 1,753 | 3,179 | 4,955 | 7,427 |
| 75-84 | 9,991,714 | 27 | 5,245 | 2,274 | 3,868 | 5,687 | 8,536 |
| 85+ | 5,054,949 | 13 | 8,191 | 2,439 | 4,388 | 7,255 | 16,830 |
| Health status | |||||||
| Excellent | 5,712,735 | 15 | 4,058 | 1,857 | 3,188 | 4,889 | 6,897 |
| Very good | 10,386,666 | 28 | 4,114 | 1,903 | 3,402 | 4,974 | 7,400 |
| Good | 11,072,707 | 29 | 4,717 | 1,840 | 3,468 | 5,332 | 7,952 |
| Fair | 6,879,881 | 18 | 5,680 | 1,173 | 3,047 | 5,785 | 10,652 |
| Poor | 3,282,052 | 9 | 5,799 | 929 | 2,963 | 5,902 | 11,822 |
| Income | |||||||
| Under $10,000 | 4,576,593 | 12 | 2,817 | 186 | 870 | 3,416 | 6,771 |
| $10,000-20,000 | 9,318,874 | 25 | 4,467 | 1,050 | 2,581 | 4,705 | 7,441 |
| $20,000-30,000 | 6,240,589 | 17 | 5,406 | 2,246 | 3,723 | 5,524 | 8,513 |
| $30,000-40,000 | 4,957,866 | 13 | 5,273 | 2,275 | 3,799 | 5,368 | 8,922 |
| $40,000-50,000 | 3,269,558 | 9 | 4,762 | 2,310 | 3,722 | 5,496 | 7,805 |
| More than $50,000 | 9,219,289 | 25 | 5,199 | 2,384 | 3,934 | 5,807 | 8,768 |
| Type of residence | |||||||
| Community | 35,439,416 | 94 | 3,918 | 1,680 | 3,220 | 4,987 | 7,264 |
| Facility | 2,125,088 | 6 | 18,351 | 3,790 | 10,247 | 25,975 | 46,594 |
| Number of functional impairments | |||||||
| No ADLs/IADLs | 19,236,952 | 51 | 3,755 | 1,803 | 3,232 | 4,847 | 6,891 |
| Only IADLs | 5,238,023 | 14 | 4,338 | 1,495 | 3,205 | 5,100 | 7,446 |
| 1-2 ADLs | 7,760,135 | 21 | 4,432 | 1,618 | 3,342 | 5,393 | 8,171 |
| 3+ ADLs | 5,195,370 | 14 | 9,199 | 1,398 | 4,192 | 9,021 | 20,611 |
| Number of chronic conditions | |||||||
| None | 1,762,237 | 5 | 3,229 | 1,255 | 2,127 | 3,610 | 6,004 |
| 1-2 | 11,491,433 | 31 | 4,251 | 1,526 | 2,959 | 4,706 | 7,414 |
| 3-4 | 14,635,202 | 39 | 4,852 | 1,899 | 3,530 | 5,288 | 8,259 |
| 5+ | 9,693,897 | 26 | 5,401 | 1,839 | 3,751 | 6,040 | 9,397 |
| NOTE:Analysis excludes beneficiaries enrolled in Medicare Advantage plans. Functional impairments include limitations in activities of daily living (ADLs) and instrumental activities of daily living (IADLs).The count of chronic conditions includes heart condition, high blood pressure, diabetes, arthritis, osteoporosis/broken hip, pulmonary disease, stroke, Alzheimer’s, Parkinson’s, skin cancer, other cancer, mental disorder, and incontinence. SOURCE: Kaiser Family Foundation analysis of the Medicare Current Beneficiary Survey 2010 Cost & Use file. |
|||||||
| Table 2: Medicare Beneficiaries’ Average Total Out-of-Pocket Spending on Services and Premiums, by Demographics, 2000 and 2010 | ||||||||||
| 2000 | 2010 | |||||||||
| Beneficiaries | Out-of-pocket spending | Beneficiaries | Out-of-pocket spending | |||||||
| Number | % of Total | Premiums | Services | Total | Number | % of Total | Premiums | Services | Total | |
| TOTAL | 33,594,228 | 100% | $1,132 | $2,161 | $3,293 | 37,582,769 | 100% | $1,989 | $2,744 | $4,734 |
| Sex | ||||||||||
| Men | 14,690,408 | 44 | 1,081 | 1,778 | 2,859 | 16,874,786 | 45 | 1,879 | 2,485 | 4,363 |
| Women | 18,903,820 | 56 | 1,172 | 2,458 | 3,630 | 20,707,984 | 55 | 2,080 | 2,956 | 5,036 |
| Race/ethnicity | ||||||||||
| White | 27,055,448 | 81 | 1,255 | 2,333 | 3,588 | 29,646,586 | 79 | 2,196 | 2,983 | 5,179 |
| Black | 3,024,231 | 9 | 564 | 1,611 | 2,175 | 3,555,108 | 9 | 1,135 | 2,016 | 3,151 |
| Hispanic | 2,220,219 | 7 | 646 | 1,328 | 1,974 | 2,513,783 | 7 | 1,199 | 1,627 | 2,826 |
| Age | ||||||||||
| Under 65 | 5,058,221 | 15 | 449 | 1,759 | 2,208 | 6,410,667 | 17 | 948 | 2,059 | 3,007 |
| 65-74 | 14,137,492 | 42 | 1,185 | 1,403 | 2,588 | 16,125,438 | 43 | 2,093 | 1,926 | 4,020 |
| 75-84 | 10,316,096 | 31 | 1,385 | 2,175 | 3,560 | 9,991,714 | 27 | 2,369 | 2,876 | 5,245 |
| 85+ | 4,082,419 | 12 | 1,155 | 5,249 | 6,405 | 5,054,949 | 13 | 2,229 | 5,962 | 8,191 |
| Health status | ||||||||||
| Excellent | 4,289,314 | 13 | 1,375 | 1,084 | 2,460 | 5,712,735 | 15 | 2,283 | 1,774 | 4,058 |
| Very good | 7,945,551 | 24 | 1,329 | 1,390 | 2,719 | 10,386,666 | 28 | 2,268 | 1,846 | 4,114 |
| Good | 10,538,972 | 31 | 1,185 | 2,049 | 3,234 | 11,072,707 | 29 | 2,078 | 2,638 | 4,717 |
| Fair | 7,188,604 | 21 | 894 | 3,180 | 4,074 | 6,879,881 | 18 | 1,521 | 4,159 | 5,680 |
| Poor | 3,534,777 | 11 | 720 | 3,309 | 4,029 | 3,282,052 | 9 | 1,295 | 4,505 | 5,799 |
| Income | ||||||||||
| Under $10,000 | 8,177,862 | 24 | 516 | 2,081 | 2,597 | 4,576,593 | 12 | 643 | 2,174 | 2,817 |
| $10,000-20,000 | 9,451,333 | 28 | 1,165 | 2,366 | 3,531 | 9,318,874 | 25 | 1,505 | 2,962 | 4,467 |
| $20,000-30,000 | 5,918,629 | 18 | 1,343 | 2,020 | 3,363 | 6,240,589 | 17 | 2,347 | 3,060 | 5,406 |
| $30,000-40,000 | 3,672,472 | 11 | 1,403 | 2,002 | 3,406 | 4,957,866 | 13 | 2,452 | 2,821 | 5,273 |
| $40,000-50,000 | 2,121,199 | 6 | 1,421 | 2,671 | 4,091 | 3,269,558 | 9 | 2,410 | 2,352 | 4,762 |
| More than $50,000 | 4,252,733 | 13 | 1,571 | 1,938 | 3,510 | 9,219,289 | 25 | 2,507 | 2,692 | 5,199 |
| Type of residence | ||||||||||
| Community | 31,394,889 | 93 | 1,187 | 1,345 | 2,532 | 35,439,416 | 94 | 2,060 | 1,858 | 3,918 |
| Facility | 2,199,339 | 7 | 353 | 13,806 | 14,159 | 2,125,088 | 6 | 816 | 17,534 | 18,351 |
| Number of functional impairments | ||||||||||
| No ADLs/IADLs | 16,647,765 | 50 | 1,274 | 1,135 | 2,409 | 19,236,952 | 51 | 2,227 | 1,528 | 3,755 |
| Only IADLs | 5,201,027 | 15 | 1,107 | 1,541 | 2,649 | 5,238,023 | 14 | 1,824 | 2,513 | 4,338 |
| 1-2 ADLs | 6,628,009 | 20 | 1,053 | 2,319 | 3,372 | 7,760,135 | 21 | 1,868 | 2,564 | 4,432 |
| 3+ ADLs | 5,062,063 | 15 | 796 | 5,857 | 6,653 | 5,195,370 | 14 | 1,461 | 7,737 | 9,199 |
| Number of chronic conditions | ||||||||||
| None | 2,425,586 | 7 | 1,076 | 1,093 | 2,169 | 1,762,237 | 5 | 1,876 | 1,353 | 3,229 |
| 1-2 | 12,615,489 | 38 | 1,122 | 1,935 | 3,056 | 11,491,433 | 31 | 1,926 | 2,325 | 4,251 |
| 3-4 | 12,461,312 | 37 | 1,149 | 2,336 | 3,485 | 14,635,202 | 39 | 2,081 | 2,771 | 4,852 |
| 5+ | 6,091,841 | 18 | 1,140 | 2,697 | 3,837 | 9,693,897 | 26 | 1,947 | 3,454 | 5,401 |
| NOTE:Analysis excludes beneficiaries enrolled in Medicare Advantage plans. Premiums includes Medicare Parts A, B, and D and other types of health insurance beneficiaries may have (Medigap, employer-sponsored insurance, and other public and private sources). Functional impairments include limitations in activities of daily living (ADLs) and instrumental activities of daily living (IADLs).The count of chronic conditions includes heart condition, high blood pressure, diabetes, arthritis, osteoporosis/broken hip, pulmonary disease, stroke, Alzheimer’s, Parkinson’s, skin cancer, other cancer, mental disorder, and incontinence. SOURCE: Kaiser Family Foundation analysis of the Medicare Current Beneficiary Survey 2000 and 2010 Cost & Use files. |
||||||||||
Endnotes
Executive Summary
Gretchen Jacobson, Jennifer Huang, Tricia Neuman, and Karen Smith, "Income and Assets of Medicare Beneficiaries, 2013-2030," Kaiser Family Foundation, January 2014, https://www.kff.org/medicare/issue-brief/income-and-assets-of-medicare-beneficiaries-2013-2030/.
Juliette Cubanski, Christina Swoope, Anthony Damico, and Tricia Neuman, "Health Care on a Budget: The Financial Burden of Health Spending by Medicare Households," Kaiser Family Foundation, January 2014, https://www.kff.org/medicare/issue-brief/health-care-on-a-budget-the-financial-burden-of-health-spending-by-medicare-households/; Tricia Neuman, Juliette Cubanski, Jennifer Huang, and Anthony Damico, "How Much Skin in the Game is Enough? The Financial Burden of Health Spending for People on Medicare, Kaiser Family Foundation, May 2011, https://www.kff.org/medicare/report/how-much-skin-in-the-game-is-enough-the-financial-burden-of-health-spending-for-people-on-medicare/; Tricia Neuman, Juliette Cubanski, and Anthony Damico, "Revisiting 'Skin in the Game' Among Medicare Beneficiaries," February 2009, Kaiser Family Foundation, https://www.kff.org/medicare/revisiting-skin-in-the-game-among-medicare/; Tricia Neuman, Juliette Cubanski, Katherine Desmond, and Tom Rice, "How Much Skin in the Game Do Medicare Beneficiaries Have? The Increasing Financial Burden of Health Care Spending, 1997-2003," Health Affairs, November/December 2007, https://www.kff.org/health-costs/issue-brief/how-much-skin-in-the-game-do-medicare-beneficiaries-have-the-increasing-financial-burden-of-health-care-spending-1997-2003/.
Report
Section 1: Out-of-Pocket Spending By Medicare Beneficiaries, 2010
Kaiser Family Foundation analysis of the Medicare Current Beneficiary Survey 2010 Cost & Use file.
Section 3: Trends in Out-of-Pocket Spending By Medicare Beneficiaries, 2000-2010
Kaiser Family Foundation analysis of the Medicare Current Beneficiary Survey 2010 Cost & Use file.
Kaiser Family Foundation analysis of the Medicare Current Beneficiary Survey 2010 Cost & Use file.