Medicare Spending at the End of Life: A Snapshot of Beneficiaries Who Died in 2014 and the Cost of Their Care
Introduction
Of the 2.6 million people who died in the U.S. in 2014,1 2.1 million, or eight out of 10, were people on Medicare,2 making Medicare the largest insurer of medical care provided at the end of life. Spending on Medicare beneficiaries in their last year of life accounts for about 25% of total Medicare spending on beneficiaries age 65 or older.3 The fact that a disproportionate share of Medicare spending goes to beneficiaries at the end of life is not surprising given that many have serious illnesses or multiple chronic conditions and often use costly services, including inpatient hospitalizations, post-acute care, and hospice, in the year leading up to their death.
This data note provides a snapshot of Medicare beneficiaries who died at some point in 2014 and spending at the end of life. It examines Medicare per capita spending in 2014 and trends since 2000, both overall and by type of service, for beneficiaries in traditional Medicare who died at some point during the year (referred to here as “decedents”) compared to those who lived for the entire year (referred to here as “survivors”). The analysis includes beneficiaries who are under age 65 with disabilities, those who qualified for Medicare due to having end-stage renal disease, and those who are age 65 or older.4 The analysis of per capita spending excludes beneficiaries enrolled in Medicare Advantage because data on Medicare spending, overall and by type of service, are not available for these enrollees.5 The analysis is based on data from a 5% sample of Medicare claims for services covered under Parts A, B, and D for traditional Medicare beneficiaries from the Centers for Medicare & Medicaid Services (CMS) Chronic Conditions Data Warehouse (CCW) from 2000 to 2014.
Key Findings
Findings
What are the characteristics of medicare beneficiaries who died at some point in 2014?
More than half of Medicare decedents were age 80 or older in 2014.
- Of the more than 2.1 million Medicare beneficiaries who died at some point in 2014—representing 4.0% of the total Medicare population that year—over half (55%) were age 80 or older, which is more than double their share of the Medicare population overall (22%) (Figure 1). Just over half (52%) of decedents were women and eight out of 10 were non-Hispanic white (81%), roughly comparable to their shares of the overall Medicare population (54% and 77%, respectively).
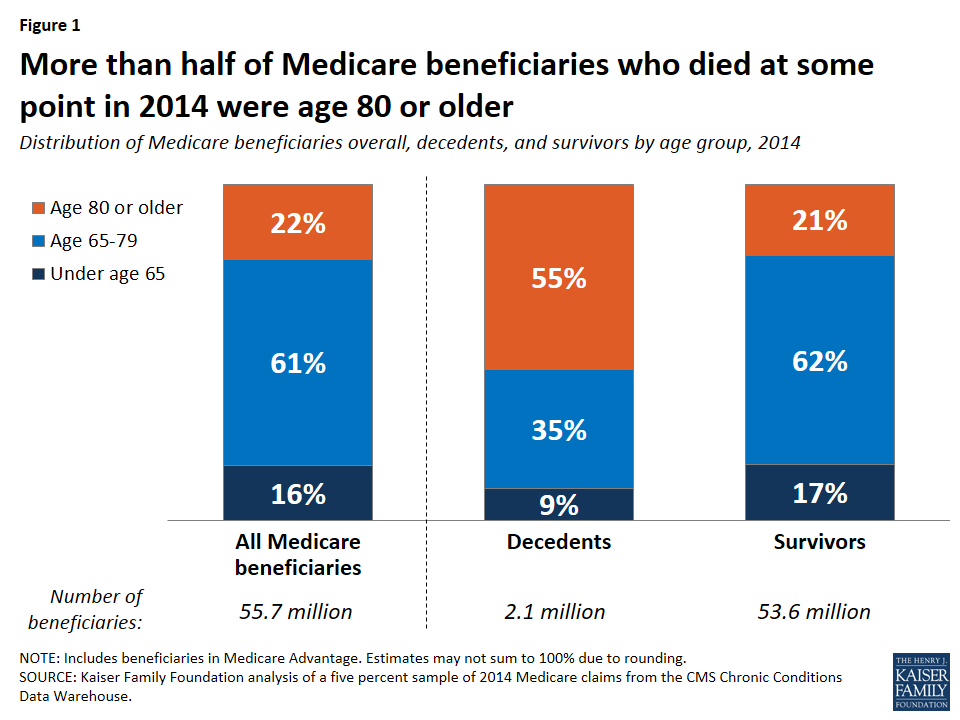
Figure 1: More than half of Medicare beneficiaries who died at some point in 2014 were age 80 or older
- More than seven in 10 (72%, or 1.5 million) Medicare decedents were in traditional Medicare in 2014, and the remainder (28%, or 0.6 million) were enrolled in Medicare Advantage plans, reflecting overall enrollment patterns in traditional Medicare and Medicare Advantage.
- Diseases that were highly prevalent among decedents in traditional Medicare in 2014 include hypertension (67%), ischemic heart disease (53%), chronic kidney disease (51%), congestive heart failure (48%), Alzheimer’s disease or dementia (43%), diabetes (38%), and cancer (17%). The prevalence of each of these conditions was higher among beneficiaries who died at some point in 2014 than among beneficiaries overall, in some cases substantially higher (Table 1). For example, more than 4 in 10 decedents had Alzheimer’s or dementia, compared to only 9% of beneficiaries overall, and more half of decedents had ischemic heart disease, compared to one fourth of beneficiaries overall.
How does medicare per capita spending differ for decedents and survivors in 2014 and over time?
Average total Medicare per capita spending was nearly four times higher for beneficiaries in traditional Medicare who died at some point in 2014 than for those who lived the entire year.
- Average Medicare per capita spending on services covered under Parts A, B, and D for traditional Medicare beneficiaries who died at some point in 2014 was $34,529—nearly four times higher than per capita spending for survivors ($9,121) and more than three times higher than the average among all beneficiaries in traditional Medicare ($10,126) (Figure 2).
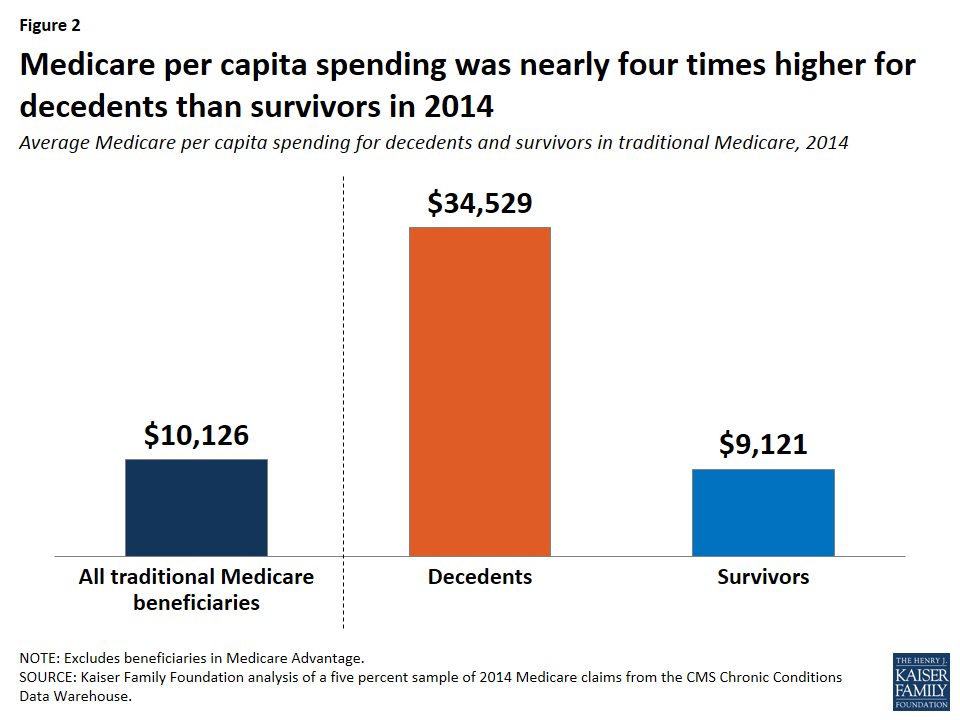
Figure 2: Medicare per capita spending was nearly four times higher for decedents than survivors in 2014
- In 2014, beneficiaries who died at some point during the year accounted for 4% of all beneficiaries in traditional Medicare, but 13.5% of traditional Medicare spending. This amount is disproportionate to the decedent share of beneficiaries overall, but it accounts for a relatively small share of total spending that year. This estimate is lower than the 25% estimate cited earlier because it is based on Medicare spending for people who died at some point in a given calendar year (in this case, 2014), rather than the last 12 months of spending for people who died.1
The share of total traditional Medicare spending on beneficiaries who died at some point during the year has decreased over time.
- The share of total traditional Medicare spending on beneficiaries who died at some point during the year has dropped over time, from 18.6% in 2000 to 13.5% in 2014 (Figure 3). This drop is likely due to a combination of factors affecting total traditional Medicare spending over time and spending on decedents, including: growth in the number of Medicare beneficiaries overall, particularly in recent years as the baby boom generation ages on to Medicare, which means more younger, healthier beneficiaries, on average; longer life expectancy, which means people are living longer and dying at older ages (as seen in a decline in the share of traditional Medicare beneficiaries who die at some point in a given year—from 4.9% in 2000 to 4.0% in 2014); lower average per capita spending on older decedents compared to younger decedents (as described further below); and slower growth in the rate of annual per capita spending for decedents than survivors (also described further below).
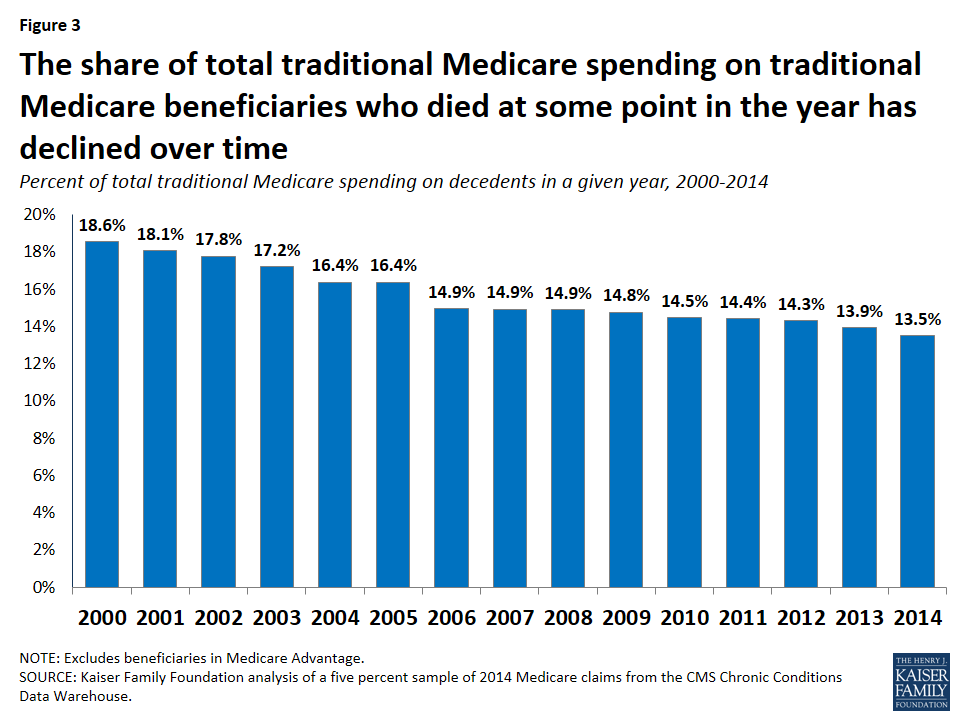
Figure 3: The share of total traditional Medicare spending on traditional Medicare beneficiaries who died at some point in the year has declined over time
Between 2000 and 2014, the annual rate of growth in average Medicare per capita spending was lower among decedents than survivors.
- Average Medicare spending among decedents was 80% higher per person in 2014 ($34,529) than in 2000 ($19,130), while average spending among survivors more than doubled between 2000 and 2014, from $4322 to $9,121 (Figure 4).
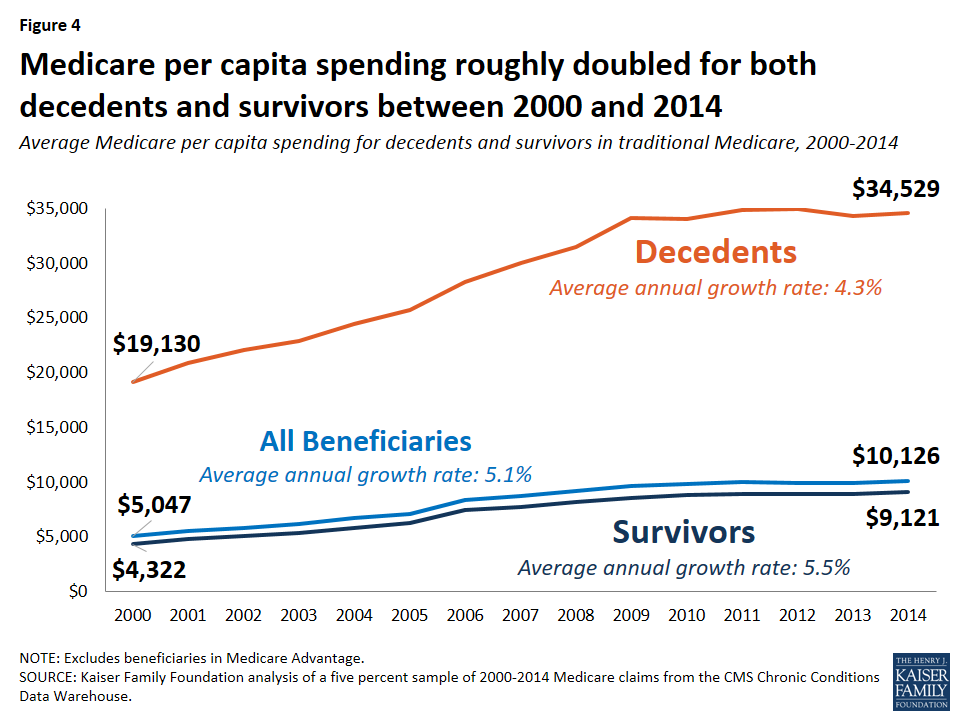
Figure 4: Medicare per capita spending roughly doubled for both decedents and survivors between 2000 and 2014
- Although average per capita spending was higher for decedents than survivors in each year between 2000 and 2014, the average annual rate of growth in spending over this time period was lower for decedents (4.3%) than for survivors (5.5%).
What services account for the difference in medicare per capita spending between decedents and survivors?
Higher Medicare per capita spending among decedents than survivors in traditional Medicare is primarily driven by much higher spending on inpatient hospital services.
- Spending on inpatient hospital services accounted for the largest amount of per capita Medicare spending by type of service among decedents in traditional Medicare in 2014 (Figure 5; Table 2), and was the primary reason for the substantial difference in spending between decedents and survivors. Per capita inpatient hospital spending among decedents was $17,574 in 2014, on average, seven times higher than among survivors ($2,497). Decedents also incurred much higher spending on post-acute care (skilled nursing facility (SNF) and home health services) and hospice care than survivors in 2014.
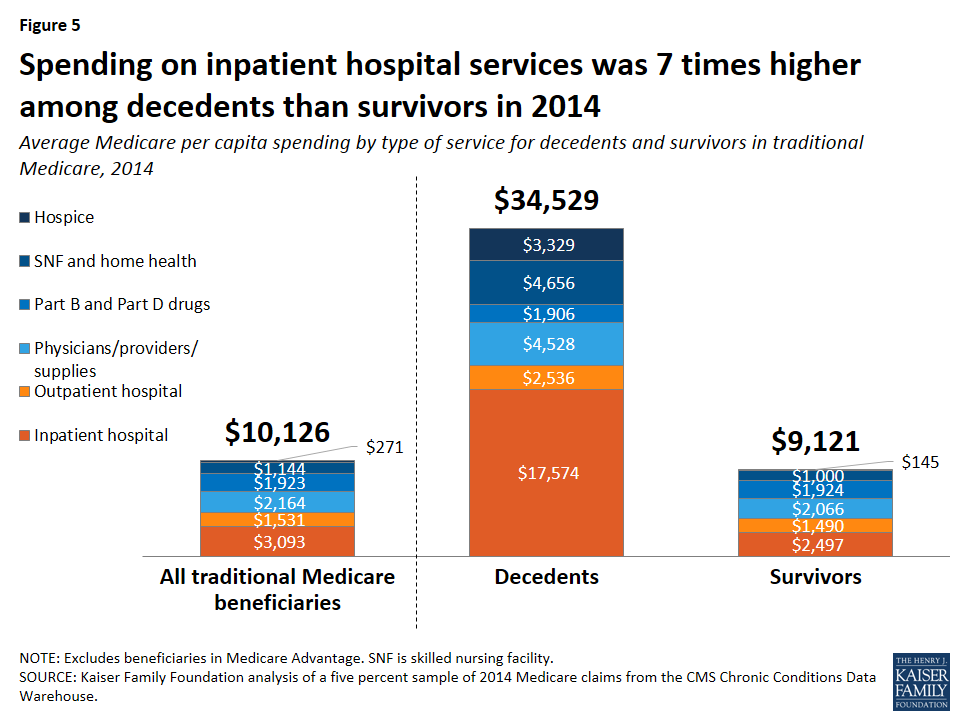
Figure 5: Spending on inpatient hospital services was 7 times higher among decedents than survivors in 2014
- Inpatient hospital services accounted for the largest share of average Medicare per capita spending by type of service for traditional Medicare beneficiaries overall in 2014 (31%), but the share of per capita spending on inpatient hospital services was particularly large for decedents, accounting for just over half (51%) of total spending in 2014 (Figure 6).

Figure 6: Inpatient hospital care accounted for the largest share of per capita Medicare spending for decedents and survivors in 2014
- For decedents, the next largest service categories were physicians, providers, and supplies combined and post-acute care (skilled nursing facilities and home health services), at 13% each, followed by hospice care (10%). For surviving beneficiaries in traditional Medicare, inpatient hospital services accounted for 27% of total per capita Medicare spending in 2014, followed closely by spending on physicians/providers/supplies (23%) and Part B and Part D prescription drugs (21%).
How does Medicare per capita spending differ for decedents under and over age 65, and what accounts for the difference in spending?
Medicare per capita spending was higher for decedents under age 65 in 2014 than for those over age 65.
- Among decedents in traditional Medicare in 2014 who were younger than age 65, Medicare per capita spending was $41,950, on average (Figure 7). This amount is 25% more than average per capita spending among decedents over age 65 in 2014 ($33,676).

Figure 7: Average Medicare per capita spending was higher for decedents under age 65 than those over age 65 in 2014
- The fact that Medicare per capita spending is higher for decedents under age 65 than those over age 65 is related to the fact that a larger share of traditional Medicare beneficiaries under age 65 who died at some point in 2014 is dually eligible for Medicare and Medicaid than of decedents who are over age 65, and their Medicare per capita spending is significantly higher, on average, than dually eligible beneficiaries over age 65. Among dually eligible decedents in 2014, average Medicare per capita spending among those under age 65 was $51,997, compared to $36,037 among those over age 65.
- In terms of Medicare spending by type of service, higher per capita spending among decedents under age 65 than among those over age 65 was driven by higher spending on inpatient hospital services ($24,515 versus $16,701, respectively), along with higher spending on outpatient hospital, physician/providers/supplies, and Part B/D prescription drugs (Figure 8). By contrast, among decedents over age 65, spending was higher on post-acute care and hospice care.
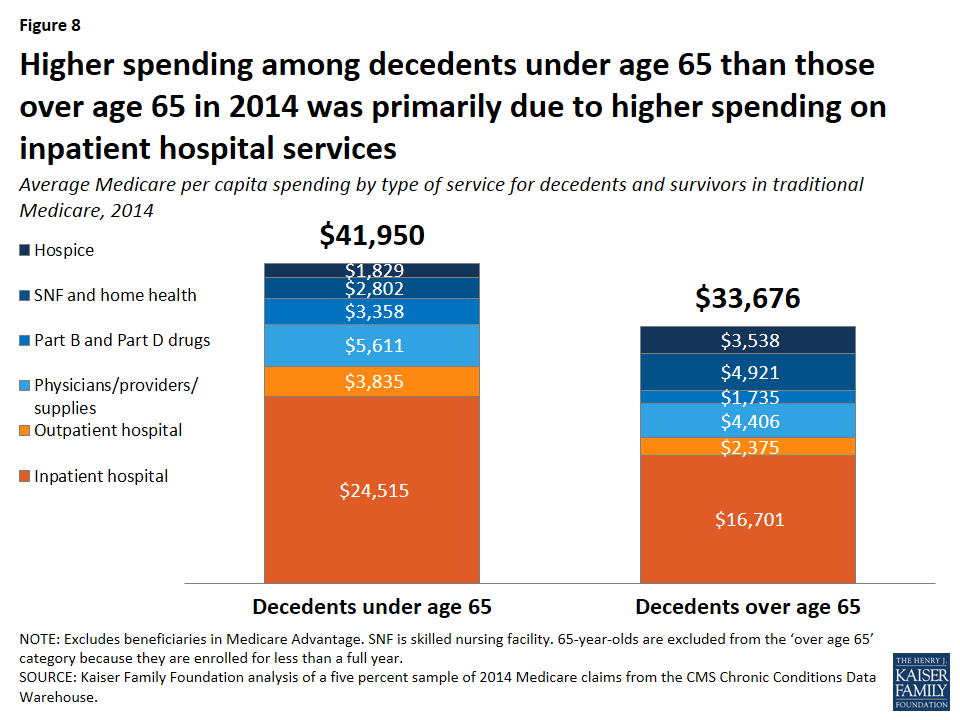
Figure 8: Higher spending among decedents under age 65 than those over age 65 in 2014 was primarily due to higher spending on inpatient hospital services
How does medicare per capita spending differ among decedents over age 65?
Per capita Medicare spending generally declines with age among decedents in traditional Medicare who are over age 65.
- Among decedents over age 65, Medicare per capita spending was highest for those in their early 70s and then declined with each year of age in 2014 (Figure 9). Among survivors over age 65, the opposite pattern occurred, with spending rising steadily with each year of age in 2014.
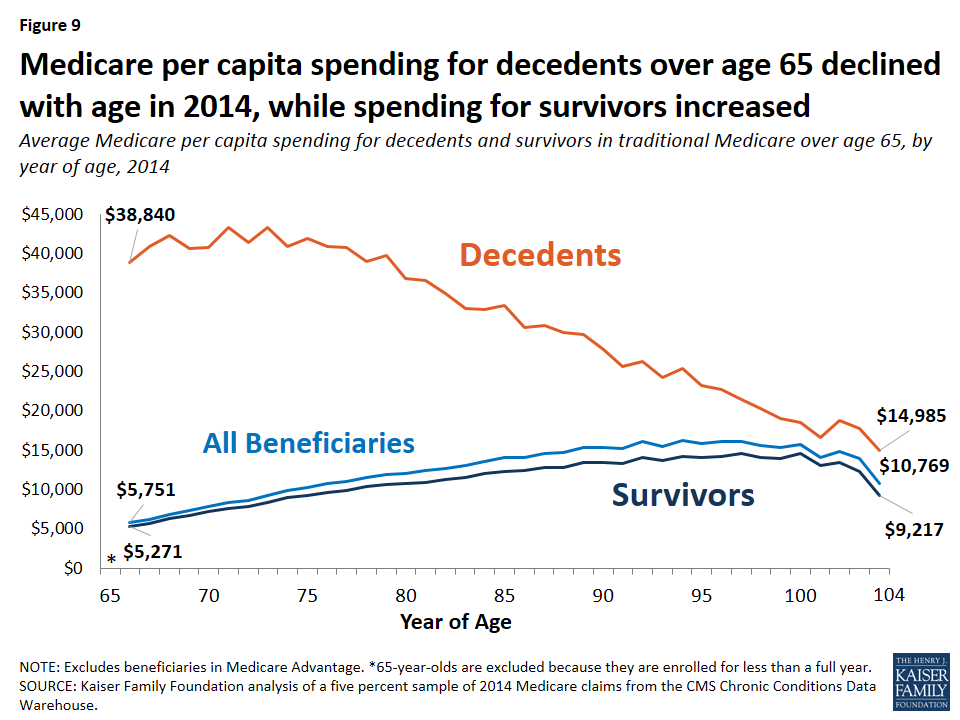
Figure 9: Medicare per capita spending for decedents over age 65 declined with age in 2014, while spending for survivors increased
What services account for the difference in spending by age among decedents over age 65?
The decline in Medicare per capita spending by age for decedents over age 65 in 2014 was mainly due to lower inpatient spending.
- Per capita Medicare spending on inpatient hospital services decreased steadily with age among decedents in 2014 (Figure 10; Table 3), declining from more than $20,000 for decedents in their late sixties and seventies to around $10,000 or less among decedents older than age 90. In contrast, per capita spending for hospice services increased with age among decedents, from around $2,000 to $5,000 or more between the ages of 66 and 100. Spending on post-acute care (SNF and home health) also increased with advancing age.
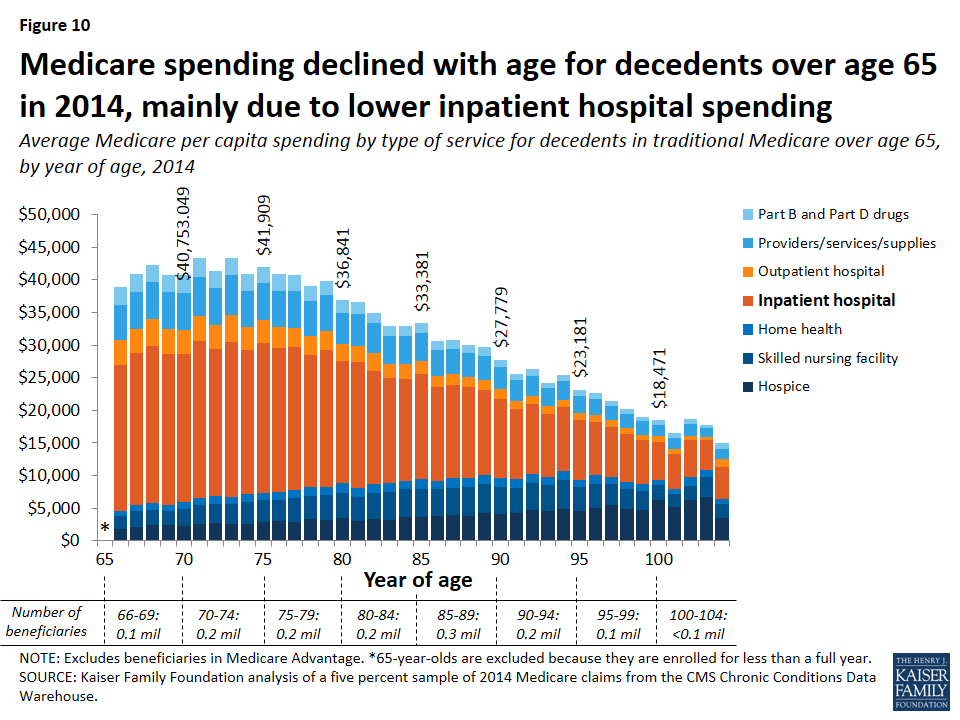
Figure 10: Medicare spending declined with age for decedents over age 65 in 2014, mainly due to lower inpatient hospital spending
- In contrast, spending increased with each year of age among survivors over age 65 in 2014, primarily due to increasing spending on post-acute and hospice care (Figure 11; Table 4). Inpatient hospital care was the costliest type of service for survivors in traditional Medicare up to the early nineties, after which age spending on post-acute care was the largest amount.
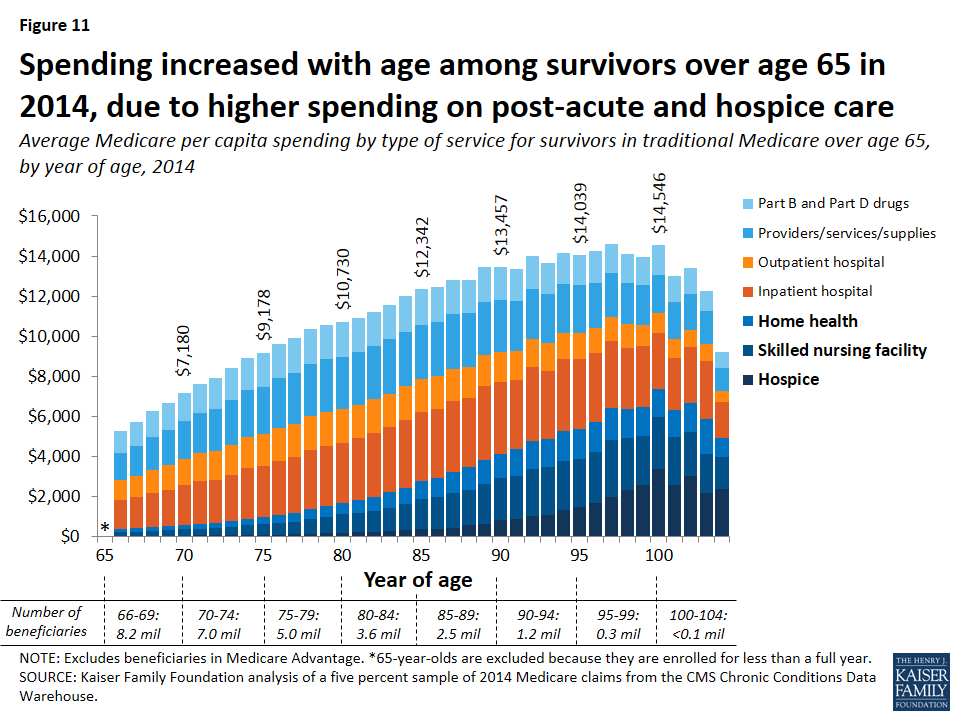
Figure 11: Spending increased with age among survivors over age 65 in 2014, due to higher spending on post-acute and hospice care
Discussion
Much attention has been focused lately on end-of-life care, the services patients receive at the end of life, and Medicare spending on these services. This analysis contributes a number of important findings to the discussion surrounding these issues.
Our analysis shows that Medicare per capita spending for beneficiaries in traditional Medicare who died at some point in 2014 was substantially higher than for those who lived the entire year, as might be expected. It also shows that Medicare per capita spending among beneficiaries over age 65 who die in a given year declines steadily with age. Per capita spending for inpatient services is lower among decedents in their eighties, nineties, and older than for decedents in their late sixties and seventies, while spending is higher for hospice care among older decedents. These results suggest that providers, patients, and their families may be inclined to be more aggressive in treating younger seniors compared to older seniors, perhaps because there is a greater expectation for positive outcomes among those with a longer life expectancy, even those who are seriously ill.
In addition, we find that total spending on people who die in a given year accounts for a relatively small and declining share of traditional Medicare spending. This reduction is likely due to a combination of factors, including: growth in the number of traditional Medicare beneficiaries overall as the baby boom generation ages on to Medicare, which means a younger, healthier beneficiary population, on average; gains in life expectancy, which means beneficiaries are living longer and dying at older ages; lower average per capita spending on older decedents compared to younger decedents; slower growth in the rate of annual per capita spending for decedents than survivors, and a slight decline between 2000 and 2014 in the share of beneficiaries in traditional Medicare who died at some point in each year.
This analysis focuses exclusively on beneficiaries in traditional Medicare, excluding the roughly one in three beneficiaries who are enrolled in Medicare Advantage plans,2 because comparable spending data for Medicare Advantage enrollees are not available. With research showing significant differences in certain demographic and health status characteristics between decedents in traditional Medicare and in Medicare Advantage,3 it is possible that spending and service use patterns may differ as well. While the majority of Medicare beneficiaries who died at some point in 2014 were in traditional Medicare, the inclusion of Medicare Advantage enrollees would provide a better understanding of whether and how the experiences of traditional Medicare and Medicare Advantage beneficiaries differ at the end of life.
Decisions pertaining to end-of-life care are among the most difficult for patients, families, and health care providers. The recent change in Medicare payment policy to reimburse physicians for conversations about advance care planning with their patients4 could bring about changes that better align services delivered with patient preferences and that also potentially reduce the costs associated with care at the end of life.
Juliette Cubanski, Tricia Neuman, and Shannon Griffin are with the Kaiser Family Foundation. Anthony Damico is an independent consultant.
Tables
|
Table 1: Prevalence of Selected Conditions Among Traditional Medicare Beneficiaries, 2014 |
|||
|
Condition |
All traditional Medicare beneficiaries |
Decedents |
Survivors |
| Hypertension | 50% | 67% | 49% |
| Ischemic Heart disease | 25% | 53% | 23% |
| Chronic Kidney Disease | 15% | 51% | 14% |
| Anemia | 20% | 50% | 19% |
| Congestive Heart Failure | 12% | 48% | 11% |
| Alzheimer’s Disease/Dementia | 9% | 43% | 8% |
| Diabetes | 24% | 38% | 24% |
| Rheumatoid Arthritis/Osteoarthritis | 27% | 35% | 26% |
| Chronic Obstructive Pulmonary Disease | 10% | 29% | 9% |
| Depression | 15% | 27% | 14% |
| Any Cancer | 7% | 17% | 7% |
| Stroke/Transient Ischemic Attack | 3% | 11% | 3% |
| NOTE: Excludes beneficiaries in Medicare Advantage. SOURCE: Kaiser Family Foundation analysis of a five percent sample of 2014 Medicare claims from the CMS Chronic Conditions Data Warehouse. |
|||
| Table 2: Amount and Distribution of Average Medicare Per Capita Spending Overall and by Type of Service for Traditional Medicare Beneficiaries, 2014 | |||||||
| Type of service | Part of Medicare covering service | All traditional Medicare beneficiaries |
Decedents | Survivors | |||
| Amount | Percent of total | Amount | Percent of total | Amount | Percent of total | ||
| Total | $10,126 | 100.0% | $34,529 | 100.0% | $9,121 | 100.0% | |
| Part D drugs | D | 1,590 | 15.7 | 1,352 | 3.9 | 1,600 | 17.5 |
| Acute inpatient hospital | A | 2,691 | 26.6 | 15,586 | 45.1 | 2,160 | 23.7 |
| Outpatient hospital | A | 1,531 | 15.1 | 2,536 | 7.3 | 1,490 | 16.3 |
| Other inpatient hospital | A | 402 | 4.0 | 1,988 | 5.8 | 337 | 3.7 |
| Evaluation & management | B | 446 | 4.4 | 2,026 | 5.9 | 381 | 4.2 |
| Other Part B procedures | B | 477 | 4.7 | 636 | 1.8 | 470 | 5.2 |
| Skilled nursing facility | A | 702 | 6.9 | 3,425 | 9.9 | 589 | 6.5 |
| Physician office services | B | 390 | 3.9 | 277 | 0.8 | 395 | 4.3 |
| Home health | A or B1 | 443 | 4.4 | 1,231 | 3.6 | 410 | 4.5 |
| Part B drugs | B | 333 | 3.3 | 554 | 1.6 | 324 | 3.5 |
| Tests | B | 236 | 2.3 | 211 | 0.6 | 237 | 2.6 |
| Durable medical equipment | B | 143 | 1.4 | 190 | 0.6 | 141 | 1.6 |
| Other Part B services | B | 166 | 1.6 | 764 | 2.2 | 141 | 1.5 |
| Imaging | B | 157 | 1.6 | 264 | 0.8 | 153 | 1.7 |
| Hospice | A | 271 | 2.7 | 3,329 | 9.6 | 145 | 1.6 |
| Dialysis | B | 21 | 0.2 | 57 | 0.2 | 20 | 0.2 |
| Anesthesia | B | 51 | 0.5 | 81 | 0.2 | 50 | 0.5 |
| Ambulatory surgery center | B | 77 | 0.8 | 21 | 0.1 | 79 | 0.9 |
| NOTE: Excludes beneficiaries in Medicare Advantage. Percentages may not sum to 100% due to rounding. 1Home health services can be covered under Part A or Part B depending on whether or not the services follow a hospital stay. SOURCE: Kaiser Family Foundation analysis of a five percent sample of 2014 Medicare claims from the CMS Chronic Conditions Data Warehouse. |
|||||||
| Table 3: Amount and Distribution of Average Medicare Per Capita Spending Overall and by Type of Service for Decedents in Traditional Medicare Over Age 65, by Age, 2014 | ||||||||||||||||
| TOTAL PER CAPITA | Inpatient hospital | Outpatient hospital | Part B providers/ services/ supplies | Part B and Part D prescription drugs |
Skilled nursing facility | Hospice | Home health | |||||||||
| AGE | Amount | % of total | Amount | % of total | Amount | % of total | Amount | % of total | Amount | % of total | Amount | % of total | Amount | % of total | Amount | % of total |
| All >65 | $33,676 | 100% | $16,701 | 49.6% | $2,375 | 7.1% | $4,406 | 13.1% | $1,735 | 5.2% | $3,641 | 10.8% | $3,538 | 10.5% | $1,280 | 3.8% |
| 66 | 38,840 | 100 | 22,289 | 57.4 | 3,842 | 9.9 | 5,493 | 14.1 | 2,614 | 6.7 | 1,907 | 4.9 | 1,849 | 4.8 | 846 | 2.2 |
| 67 | 40,843 | 100 | 23,265 | 57.0 | 3,701 | 9.1 | 5,657 | 13.9 | 2,734 | 6.7 | 2,375 | 5.8 | 2,158 | 5.3 | 954 | 2.3 |
| 68 | 42,314 | 100 | 24,111 | 57.0 | 4,130 | 9.8 | 5,607 | 13.3 | 2,696 | 6.4 | 2,321 | 5.5 | 2,412 | 5.7 | 1,038 | 2.5 |
| 69 | 40,692 | 100 | 23,101 | 56.8 | 3,797 | 9.3 | 5,751 | 14.1 | 2,473 | 6.1 | 2,160 | 5.3 | 2,385 | 5.9 | 1,024 | 2.5 |
| 70 | 40,753 | 100 | 22,557 | 55.3 | 3,772 | 9.3 | 5,599 | 13.7 | 2,817 | 6.9 | 2,631 | 6.5 | 2,281 | 5.6 | 1,096 | 2.7 |
| 71 | 43,316 | 100 | 23,942 | 55.3 | 3,942 | 9.1 | 5,941 | 13.7 | 2,856 | 6.6 | 2,950 | 6.8 | 2,550 | 5.9 | 1,135 | 2.6 |
| 72 | 41,381 | 100 | 22,520 | 54.4 | 3,664 | 8.9 | 5,757 | 13.9 | 2,587 | 6.3 | 2,901 | 7.0 | 2,789 | 6.7 | 1,162 | 2.8 |
| 73 | 43,353 | 100 | 23,652 | 54.6 | 4,124 | 9.5 | 6,133 | 14.1 | 2,655 | 6.1 | 3,091 | 7.1 | 2,547 | 5.9 | 1,150 | 2.7 |
| 74 | 40,939 | 100 | 22,079 | 53.9 | 3,548 | 8.7 | 5,592 | 13.7 | 2,568 | 6.3 | 3,432 | 8.4 | 2,515 | 6.1 | 1,206 | 2.9 |
| 75 | 41,909 | 100 | 22,994 | 54.9 | 3,432 | 8.2 | 5,791 | 13.8 | 2,332 | 5.6 | 3,334 | 8.0 | 2,856 | 6.8 | 1,171 | 2.8 |
| 76 | 40,882 | 100 | 22,034 | 53.9 | 3,149 | 7.7 | 5,649 | 13.8 | 2,522 | 6.2 | 3,173 | 7.8 | 3,028 | 7.4 | 1,327 | 3.2 |
| 77 | 40,758 | 100 | 21,851 | 53.6 | 3,007 | 7.4 | 5,660 | 13.9 | 2,426 | 6.0 | 3,575 | 8.8 | 2,956 | 7.3 | 1,282 | 3.1 |
| 78 | 39,014 | 100 | 20,223 | 51.8 | 2,960 | 7.6 | 5,395 | 13.8 | 2,219 | 5.7 | 3,672 | 9.4 | 3,278 | 8.4 | 1,268 | 3.3 |
| 79 | 39,760 | 100 | 20,954 | 52.7 | 2,976 | 7.5 | 5,526 | 13.9 | 2,031 | 5.1 | 3,758 | 9.5 | 3,222 | 8.1 | 1,293 | 3.3 |
| 80 | 36,841 | 100 | 18,710 | 50.8 | 2,572 | 7.0 | 4,800 | 13.0 | 1,896 | 5.1 | 3,858 | 10.5 | 3,549 | 9.6 | 1,456 | 4.0 |
| 81 | 36,640 | 100 | 19,396 | 52.9 | 2,393 | 6.5 | 4,986 | 13.6 | 1,806 | 4.9 | 3,642 | 9.9 | 3,073 | 8.4 | 1,344 | 3.7 |
| 82 | 34,938 | 100 | 17,408 | 49.8 | 2,694 | 7.7 | 4,552 | 13.0 | 1,591 | 4.6 | 3,962 | 11.3 | 3,300 | 9.4 | 1,431 | 4.1 |
| 83 | 32,969 | 100 | 16,081 | 48.8 | 2,144 | 6.5 | 4,372 | 13.3 | 1,542 | 4.7 | 4,199 | 12.7 | 3,263 | 9.9 | 1,368 | 4.1 |
| 84 | 32,880 | 100 | 15,595 | 47.4 | 2,269 | 6.9 | 4,252 | 12.9 | 1,526 | 4.6 | 4,168 | 12.7 | 3,724 | 11.3 | 1,347 | 4.1 |
| 85 | 33,381 | 100 | 16,105 | 48.2 | 2,009 | 6.0 | 4,304 | 12.9 | 1,523 | 4.6 | 4,399 | 13.2 | 3,620 | 10.8 | 1,422 | 4.3 |
| 86 | 30,634 | 100 | 14,388 | 47.0 | 1,759 | 5.7 | 3,885 | 12.7 | 1,407 | 4.6 | 4,123 | 13.5 | 3,789 | 12.4 | 1,285 | 4.2 |
| 87 | 30,831 | 100 | 14,249 | 46.2 | 1,644 | 5.3 | 3,935 | 12.8 | 1,365 | 4.4 | 4,204 | 13.6 | 3,940 | 12.8 | 1,495 | 4.9 |
| 88 | 30,009 | 100 | 13,841 | 46.1 | 1,627 | 5.4 | 3,701 | 12.3 | 1,167 | 3.9 | 4,393 | 14.6 | 3,839 | 12.8 | 1,440 | 4.8 |
| 89 | 29,655 | 100 | 12,998 | 43.8 | 1,496 | 5.0 | 3,612 | 12.2 | 1,387 | 4.7 | 4,437 | 15.0 | 4,274 | 14.4 | 1,451 | 4.9 |
| 90 | 27,779 | 100 | 12,030 | 43.3 | 1,500 | 5.4 | 3,454 | 12.4 | 1,118 | 4.0 | 4,199 | 15.1 | 4,064 | 14.6 | 1,415 | 5.1 |
| 91 | 25,592 | 100 | 10,717 | 41.9 | 1,307 | 5.1 | 3,136 | 12.3 | 963 | 3.8 | 3,799 | 14.8 | 4,329 | 16.9 | 1,341 | 5.2 |
| 92 | 26,276 | 100 | 10,740 | 40.9 | 1,220 | 4.6 | 3,118 | 11.9 | 961 | 3.7 | 4,151 | 15.8 | 4,662 | 17.7 | 1,424 | 5.4 |
| 93 | 24,270 | 100 | 9,627 | 39.7 | 1,213 | 5.0 | 2,774 | 11.4 | 835 | 3.4 | 3,960 | 16.3 | 4,568 | 18.8 | 1,293 | 5.3 |
| 94 | 25,443 | 100 | 9,867 | 38.8 | 1,091 | 4.3 | 2,883 | 11.3 | 922 | 3.6 | 4,503 | 17.7 | 4,864 | 19.1 | 1,313 | 5.2 |
| 95 | 23,181 | 100 | 9,129 | 39.4 | 1,046 | 4.5 | 2,691 | 11.6 | 940 | 4.1 | 3,690 | 15.9 | 4,538 | 19.6 | 1,147 | 4.9 |
| 96 | 22,668 | 100 | 8,107 | 35.8 | 1,123 | 5.0 | 2,548 | 11.2 | 855 | 3.8 | 3,652 | 16.1 | 5,068 | 22.4 | 1,317 | 5.8 |
| 97 | 21,491 | 100 | 7,768 | 36.1 | 1,000 | 4.7 | 2,223 | 10.3 | 750 | 3.5 | 3,192 | 14.9 | 5,475 | 25.5 | 1,083 | 5.0 |
| 98 | 20,259 | 100 | 7,344 | 36.2 | 893 | 4.4 | 2,130 | 10.5 | 814 | 4.0 | 3,091 | 15.3 | 4,816 | 23.8 | 1,170 | 5.8 |
| 99 | 19,011 | 100 | 6,740 | 35.5 | 771 | 4.1 | 2,107 | 11.1 | 684 | 3.6 | 2,930 | 15.4 | 4,739 | 24.9 | 1,041 | 5.5 |
| 100 | 18,471 | 100 | 5,926 | 32.1 | 813 | 4.4 | 1,688 | 9.1 | 773 | 4.2 | 2,279 | 12.3 | 6,247 | 33.8 | 745 | 4.0 |
| 101 | 16,564 | 100 | 5,288 | 31.9 | 825 | 5.0 | 1,604 | 9.7 | 842 | 5.1 | 1,958 | 11.8 | 5,163 | 31.2 | 885 | 5.3 |
| 102 | 18,739 | 100 | 5,714 | 30.5 | 570 | 3.0 | 1,876 | 10.0 | 841 | 4.5 | 2,203 | 11.8 | 6,188 | 33.0 | 1,348 | 7.2 |
| 103 | 17,714 | 100 | 4,488 | 25.3 | 516 | 2.9 | 1,338 | 7.6 | 467 | 2.6 | 3,015 | 17.0 | 6,727 | 38.0 | 1,163 | 6.6 |
| 104 | 14,985 | 100 | 4,932 | 32.9 | 1,206 | 8.0 | 1,469 | 9.8 | 961 | 6.4 | 2,243 | 15.0 | 3,438 | 22.9 | 736 | 4.9 |
| NOTE: Excludes beneficiaries in Medicare Advantage. 65-year-olds are excluded from the analysis of spending by year of age because they are enrolled for less than a full year. Percentages may not sum to 100% due to rounding. SOURCE: Kaiser Family Foundation analysis of a five percent sample of 2014 Medicare claims from the CMS Chronic Conditions Data Warehouse. |
||||||||||||||||
| Table 4: Amount and Distribution of Average Medicare Per Capita Spending Overall and by Type of Service for Survivors in Traditional Medicare Over Age 65, by Age, 2014 | ||||||||||||||||
| TOTAL PER CAPITA | Inpatient hospital | Outpatient hospital | Part B providers/ services/ supplies | Part B and Part D prescription drugs |
Skilled nursing facility | Hospice | Home health | |||||||||
| AGE | Amount | % of total | Amount | % of total | Amount | % of total | Amount | % of total | Amount | % of total | Amount | % of total | Amount | % of total | Amount | % of total |
| All >65 | $8,839 | 100% | $2,441 | 27.6% | $1,404 | 15.9% | $2,154 | 24.4% | $1,509 | 17.1% | $691 | 7.8% | $179 | 2.0% | $461 | 5.2% |
| 66 | 5,271 | 100 | 1,472 | 27.9 | 986 | 18.7 | 1,368 | 26.0 | 1,092 | 20.7 | 183 | 3.5 | 19 | 0.4 | 151 | 2.9 |
| 67 | 5,694 | 100 | 1,551 | 27.2 | 1,052 | 18.5 | 1,509 | 26.5 | 1,174 | 20.6 | 210 | 3.7 | 26 | 0.5 | 172 | 3.0 |
| 68 | 6,257 | 100 | 1,738 | 27.8 | 1,128 | 18.0 | 1,655 | 26.5 | 1,282 | 20.5 | 239 | 3.8 | 27 | 0.4 | 188 | 3.0 |
| 69 | 6,676 | 100 | 1,824 | 27.3 | 1,232 | 18.5 | 1,778 | 26.6 | 1,338 | 20.0 | 268 | 4.0 | 30 | 0.4 | 206 | 3.1 |
| 70 | 7,180 | 100 | 2,003 | 27.9 | 1,277 | 17.8 | 1,903 | 26.5 | 1,412 | 19.7 | 311 | 4.3 | 40 | 0.6 | 235 | 3.3 |
| 71 | 7,632 | 100 | 2,142 | 28.1 | 1,374 | 18.0 | 2,021 | 26.5 | 1,453 | 19.0 | 330 | 4.3 | 51 | 0.7 | 260 | 3.4 |
| 72 | 7,889 | 100 | 2,150 | 27.2 | 1,422 | 18.0 | 2,098 | 26.6 | 1,536 | 19.5 | 352 | 4.5 | 51 | 0.7 | 280 | 3.6 |
| 73 | 8,398 | 100 | 2,292 | 27.3 | 1,488 | 17.7 | 2,228 | 26.5 | 1,607 | 19.1 | 396 | 4.7 | 72 | 0.9 | 314 | 3.7 |
| 74 | 8,933 | 100 | 2,509 | 28.1 | 1,569 | 17.6 | 2,327 | 26.1 | 1,640 | 18.4 | 472 | 5.3 | 76 | 0.8 | 340 | 3.8 |
| 75 | 9,178 | 100 | 2,517 | 27.4 | 1,599 | 17.4 | 2,390 | 26.0 | 1,693 | 18.5 | 521 | 5.7 | 84 | 0.9 | 372 | 4.1 |
| 76 | 9,627 | 100 | 2,667 | 27.7 | 1,644 | 17.1 | 2,492 | 25.9 | 1,728 | 18.0 | 588 | 6.1 | 90 | 0.9 | 416 | 4.3 |
| 77 | 9,886 | 100 | 2,796 | 28.3 | 1,631 | 16.5 | 2,536 | 25.6 | 1,742 | 17.6 | 642 | 6.5 | 101 | 1.0 | 439 | 4.4 |
| 78 | 10,370 | 100 | 2,947 | 28.4 | 1,722 | 16.6 | 2,603 | 25.1 | 1,738 | 16.8 | 724 | 7.0 | 128 | 1.2 | 508 | 4.9 |
| 79 | 10,579 | 100 | 3,021 | 28.6 | 1,697 | 16.0 | 2,624 | 24.8 | 1,728 | 16.3 | 810 | 7.7 | 147 | 1.4 | 552 | 5.2 |
| 80 | 10,730 | 100 | 2,986 | 27.8 | 1,678 | 15.6 | 2,618 | 24.4 | 1,764 | 16.4 | 920 | 8.6 | 178 | 1.7 | 587 | 5.5 |
| 81 | 10,909 | 100 | 3,099 | 28.4 | 1,636 | 15.0 | 2,622 | 24.0 | 1,720 | 15.8 | 967 | 8.9 | 226 | 2.1 | 640 | 5.9 |
| 82 | 11,201 | 100 | 3,181 | 28.4 | 1,673 | 14.9 | 2,677 | 23.9 | 1,680 | 15.0 | 1,088 | 9.7 | 199 | 1.8 | 704 | 6.3 |
| 83 | 11,540 | 100 | 3,286 | 28.5 | 1,635 | 14.2 | 2,711 | 23.5 | 1,706 | 14.8 | 1,164 | 10.1 | 272 | 2.4 | 766 | 6.6 |
| 84 | 11,983 | 100 | 3,391 | 28.3 | 1,673 | 14.0 | 2,717 | 22.7 | 1,780 | 14.9 | 1,303 | 10.9 | 299 | 2.5 | 821 | 6.9 |
| 85 | 12,342 | 100 | 3,449 | 27.9 | 1,639 | 13.3 | 2,731 | 22.1 | 1,770 | 14.3 | 1,460 | 11.8 | 390 | 3.2 | 902 | 7.3 |
| 86 | 12,434 | 100 | 3,425 | 27.5 | 1,676 | 13.5 | 2,677 | 21.5 | 1,735 | 14.0 | 1,564 | 12.6 | 390 | 3.1 | 967 | 7.8 |
| 87 | 12,793 | 100 | 3,518 | 27.5 | 1,634 | 12.8 | 2,706 | 21.2 | 1,710 | 13.4 | 1,758 | 13.7 | 430 | 3.4 | 1,036 | 8.1 |
| 88 | 12,818 | 100 | 3,488 | 27.2 | 1,538 | 12.0 | 2,669 | 20.8 | 1,678 | 13.1 | 1,781 | 13.9 | 551 | 4.3 | 1,112 | 8.7 |
| 89 | 13,446 | 100 | 3,668 | 27.3 | 1,534 | 11.4 | 2,685 | 20.0 | 1,722 | 12.8 | 2,023 | 15.0 | 613 | 4.6 | 1,201 | 8.9 |
| 90 | 13,457 | 100 | 3,588 | 26.7 | 1,507 | 11.2 | 2,592 | 19.3 | 1,645 | 12.2 | 2,113 | 15.7 | 808 | 6.0 | 1,205 | 9.0 |
| 91 | 13,335 | 100 | 3,481 | 26.1 | 1,425 | 10.7 | 2,505 | 18.8 | 1,576 | 11.8 | 2,166 | 16.2 | 871 | 6.5 | 1,311 | 9.8 |
| 92 | 13,999 | 100 | 3,701 | 26.4 | 1,390 | 9.9 | 2,510 | 17.9 | 1,621 | 11.6 | 2,334 | 16.7 | 1,037 | 7.4 | 1,406 | 10.0 |
| 93 | 13,640 | 100 | 3,419 | 25.1 | 1,414 | 10.4 | 2,443 | 17.9 | 1,524 | 11.2 | 2,365 | 17.3 | 1,093 | 8.0 | 1,381 | 10.1 |
| 94 | 14,173 | 100 | 3,557 | 25.1 | 1,327 | 9.4 | 2,436 | 17.2 | 1,567 | 11.1 | 2,447 | 17.3 | 1,341 | 9.5 | 1,497 | 10.6 |
| 95 | 14,039 | 100 | 3,526 | 25.1 | 1,284 | 9.1 | 2,370 | 16.9 | 1,502 | 10.7 | 2,382 | 17.0 | 1,473 | 10.5 | 1,503 | 10.7 |
| 96 | 14,232 | 100 | 3,444 | 24.2 | 1,242 | 8.7 | 2,239 | 15.7 | 1,572 | 11.0 | 2,575 | 18.1 | 1,661 | 11.7 | 1,498 | 10.5 |
| 97 | 14,620 | 100 | 3,349 | 22.9 | 1,178 | 8.1 | 2,206 | 15.1 | 1,470 | 10.1 | 2,881 | 19.7 | 1,957 | 13.4 | 1,579 | 10.8 |
| 98 | 14,114 | 100 | 3,064 | 21.7 | 1,195 | 8.5 | 2,067 | 14.6 | 1,442 | 10.2 | 2,591 | 18.4 | 2,319 | 16.4 | 1,436 | 10.2 |
| 99 | 13,929 | 100 | 3,065 | 22.0 | 1,038 | 7.5 | 2,015 | 14.5 | 1,371 | 9.8 | 2,434 | 17.5 | 2,578 | 18.5 | 1,428 | 10.3 |
| 100 | 14,546 | 100 | 2,791 | 19.2 | 976 | 6.7 | 1,940 | 13.3 | 1,470 | 10.1 | 2,563 | 17.6 | 3,377 | 23.2 | 1,429 | 9.8 |
| 101 | 13,018 | 100 | 2,625 | 20.2 | 952 | 7.3 | 1,831 | 14.1 | 1,313 | 10.1 | 2,378 | 18.3 | 2,593 | 19.9 | 1,327 | 10.2 |
| 102 | 13,386 | 100 | 2,790 | 20.8 | 864 | 6.5 | 1,816 | 13.6 | 1,259 | 9.4 | 2,192 | 16.4 | 3,024 | 22.6 | 1,442 | 10.8 |
| 103 | 12,273 | 100 | 2,938 | 23.9 | 833 | 6.8 | 1,630 | 13.3 | 1,028 | 8.4 | 1,935 | 15.8 | 2,182 | 17.8 | 1,728 | 14.1 |
| 104 | 9,217 | 100 | 1,780 | 19.3 | 582 | 6.3 | 1,139 | 12.4 | 801 | 8.7 | 1,632 | 17.7 | 2,350 | 25.5 | 935 | 10.1 |
| NOTE: Excludes beneficiaries in Medicare Advantage. 65-year-olds are excluded from the analysis of spending by year of age because they are enrolled for less than a full year. SOURCE: Kaiser Family Foundation analysis of a five percent sample of 2014 Medicare claims from the CMS Chronic Conditions Data Warehouse. |
||||||||||||||||
Endnotes
Introduction
National Center for Health Statistics, Health, United States, 2015: With Special Feature on Racial and Ethnic Health Disparities, 2016, Table 19: “Leading causes of death and numbers of deaths, by sex, race, and Hispanic origin: United States, 1980 and 2014,” available at http://www.cdc.gov/nchs/data/hus/hus15.pdf#019.
Kaiser Family Foundation analysis of a five percent sample of 2014 Medicare claims from the Centers for Medicare & Medicaid Services’ Chronic Conditions Data Warehouse.
Gerald F. Riley and James D. Lubitz, “Long-Term Trends in Medicare Payments in the Last Year of Life,” Health Services Research April 2010; 45(2):565-576.
We exclude beneficiaries who are exactly age 65 from the analysis of spending by year of age and spending comparisons between beneficiaries under age 65 and over age 65 because many are enrolled for less than a full year, resulting in less than an entire year of Medicare spending data.
Medicare spending for Medicare Advantage enrollees takes the form of monthly capitation payments which are not based on actual service utilization.
Key Findings
Findings
We are unable to examine spending data that spans the last 12 months of life for decedents in our analysis because we are unable to disaggregate spending data for a given beneficiary for periods of time less than one calendar year. Had we been able to calculate Medicare spending for a 12-month period for both survivors and dependents, the difference in per capita spending between decedents and survivors and the estimate of spending on decedents as a share of total Medicare spending would have been larger.
Gretchen Jacobson, Giselle Casillas, Anthony Damico, Tricia Neuman, and Marsha Gold, “Medicare Advantage 2016 Spotlight: Enrollment Market Update,” Kaiser Family Foundation, May 2016, available at https://www.kff.org/medicare/issue-brief/medicare-advantage-2016-spotlight-enrollment-market-update/.
Elena Byhoff, John A. Harris, and John Z. Ayanian, “Characteristics of Decedents in Medicare Advantage and Traditional Medicare,” Research Letter, JAMA Internal Medicine June 2016; Published online ahead of print: E1-3.
For more information, see “10 FAQs: Medicare’s Role in End-of-Life Care,” Kaiser Family Foundation, November 2015, available at https://www.kff.org/medicare/fact-sheet/10-faqs-medicares-role-in-end-of-life-care/.