Medicare Advantage 2016 Data Spotlight: Overview of Plan Changes
Introduction
In 2015, more than 17 million Medicare beneficiaries (31%) are enrolled in Medicare Advantage plans,1 such as health maintenance organizations (HMOs) or preferred provider organization (PPOs). Medicare Advantage plans are offered as an alternative to the traditional Medicare program. Medicare beneficiaries can enroll in a Medicare Advantage plan, change Medicare Advantage plans, or switch from Medicare Advantage to traditional Medicare during the annual open enrollment period. Changes in the Medicare Advantage marketplace have always been closely watched, and since 2010 when the Affordable Care Act (ACA) was enacted, many have been interested in the effects of the ACA phasing down federal payments to Medicare Advantage plans. More recently, proposed mergers between health insurance firms with large footprints in Medicare Advantage have raised questions about how the mergers could affect beneficiaries.
This spotlight analyzes publicly available data to review the Medicare Advantage plans offered in 2016. It provides updated information describing how Medicare Advantage plan choices are changing in 2016, includes new information on premiums, out-of-pocket limits and other plan features, and examines the role of large firms offering plans in the marketplace. Findings include:
- The average Medicare beneficiary will be able to choose from 19 plans in 2016, a number which has been relatively stable since 2012. Relatively few plans are entering or exiting the Medicare Advantage market, and for the most part, the same plans that were available in 2015 will be available in 2016.
- While the average Medicare beneficiary can choose from many plans, these plans will be offered by a handful of firms. The average beneficiary will be able to choose from plans offered by six firms; one-quarter of beneficiaries nationwide will have a choice of plans offered by three or fewer firms in 2016.
- If enrollees in Medicare Advantage plans with prescription drug coverage (MA-PDs) stay in the same plan between 2015 and 2016, their premiums will increase by 8 percent, on average. Similar to past years, about four-fifths of beneficiaries (81%) will have access to an MA-PD with no premium in 2016.
- Plans’ limits on out-of-pocket costs for Part A and B benefits will rise in 2016, as they have in prior years. Almost two-fifths (39%) of plans will have limits equal to the maximum allowed ($6,700 per year) in 2016, up from 17 percent in 2013.
- Nearly half (45%) of MA-PDs will impose a deductible for Part D prescription drugs in 2016, an increase from 2015, and the average Part D drug deductible will be higher in 2016 than 2015.
- The average quality star rating for plans will be higher in 2016, with substantial growth in the number of contracts with 4 and 4.5 stars.
Issue Brief
Plan Offerings in 2016
Number of Plans Offered
In total, 2,001 Medicare Advantage plans will be available nationwide for individual enrollment in 2016, 56 more than in 2015 (Figure 1). In 2016, 203 plans that were available in 2015 will be exiting the Medicare Advantage market, and 259 plans will be offered for the first time. An earlier analysis describes the nature of change at the national and state level as plans enter and exit the market in 2016.1 While virtually every state will see some change in the number of plan offerings, most of the plans exiting the market in 2016 attracted relatively few enrollees in 2015. Nationwide, the number of plans offered has been relatively stable since 2011.
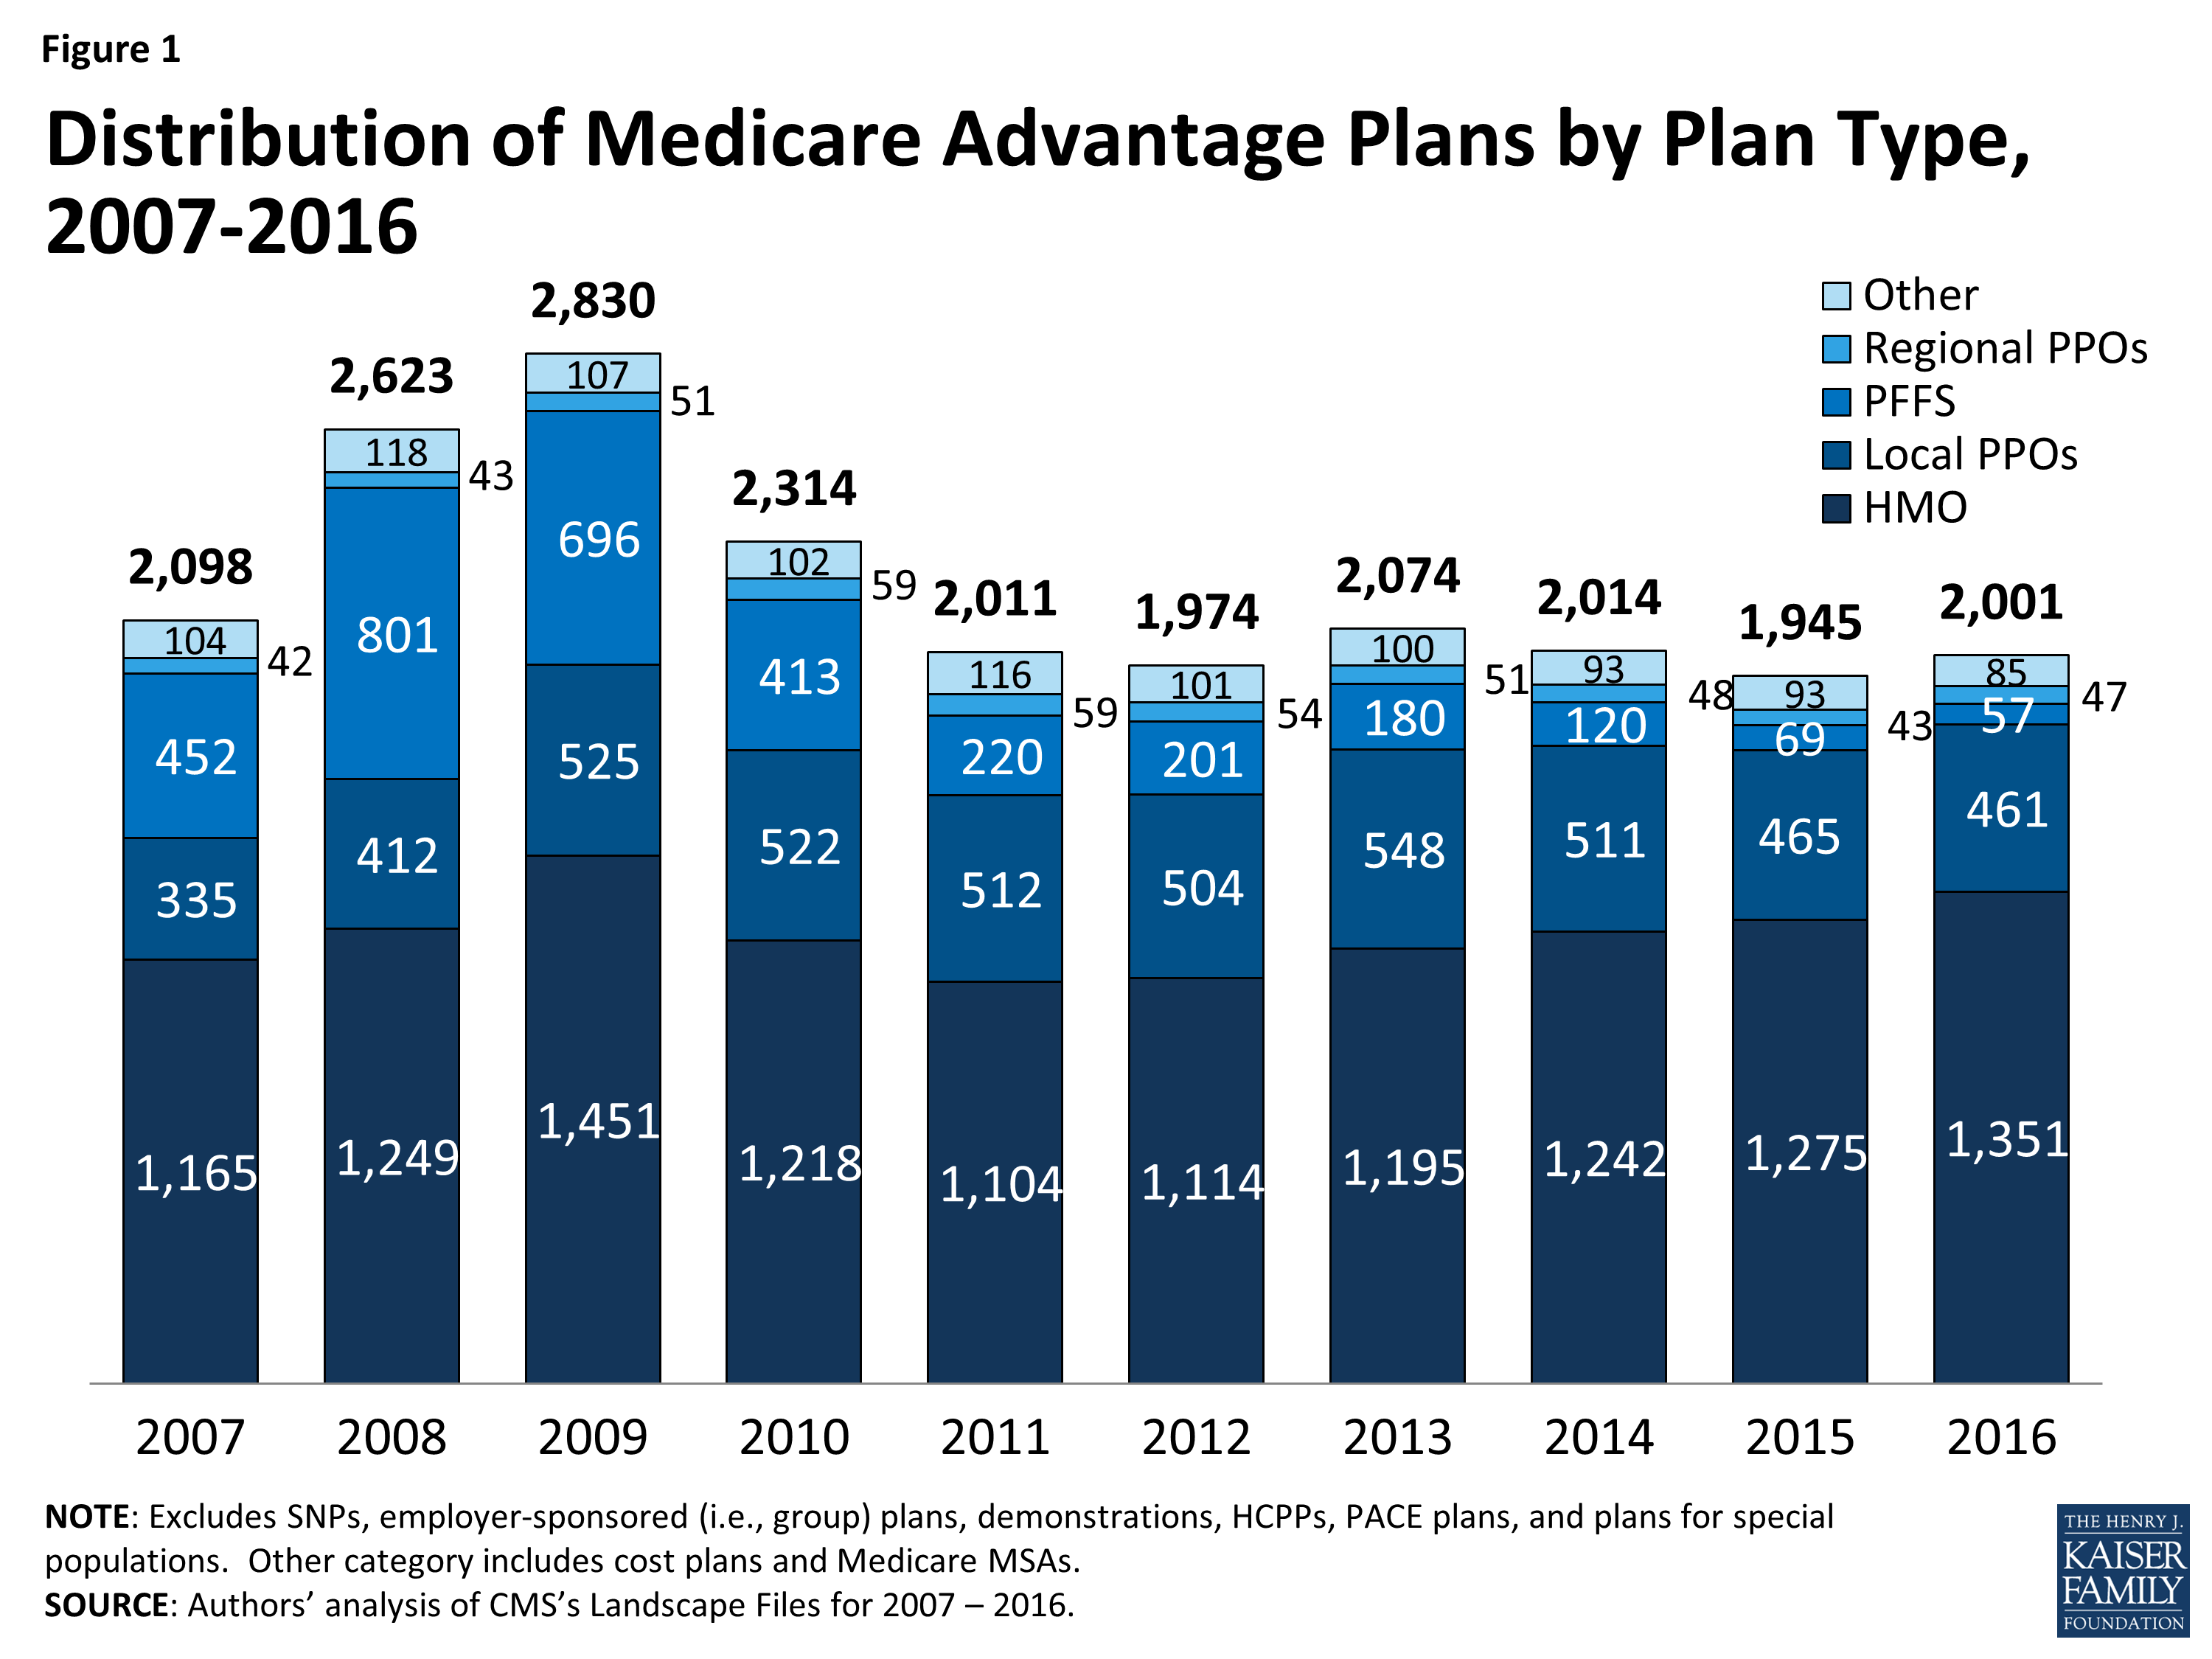
Figure 1: Distribution of Medicare Advantage Plans by Plan Type, 2007-2016
HMOs continue to account for the majority of plans available, and will account for two-thirds of all plans offered in 2016 (Table A1). Since 2013, the number of HMOs has increased each year, with 76 more HMOs in 2016, while the availability of other plan types has either remained similar or decline. In 2016, there will be limited changes in the number of local PPOs, regional PPOs, and private fee-for-service (PFFS) plans.
Locally, the number of plans available to Medicare beneficiaries in 2016 will not be very different from in 2015. The average beneficiary will be able to choose from among 19 plans, on average, in 2016 – as compared with 18 plans in 2015 (Figure 2). Beneficiaries in metropolitan areas will be able to choose from 21 plans, on average, and beneficiaries in non-metropolitan areas will be able to choose from 11 plans, on average, an increase of 1 plan from 2015. The average number of plans available in the lowest cost counties (i.e., lowest quartile of counties) will remain the same (15 plans) while the average number of plans available in other counties will increase by 1 plan (from 22 plans to 23 plans in the highest cost counties; Table A2).
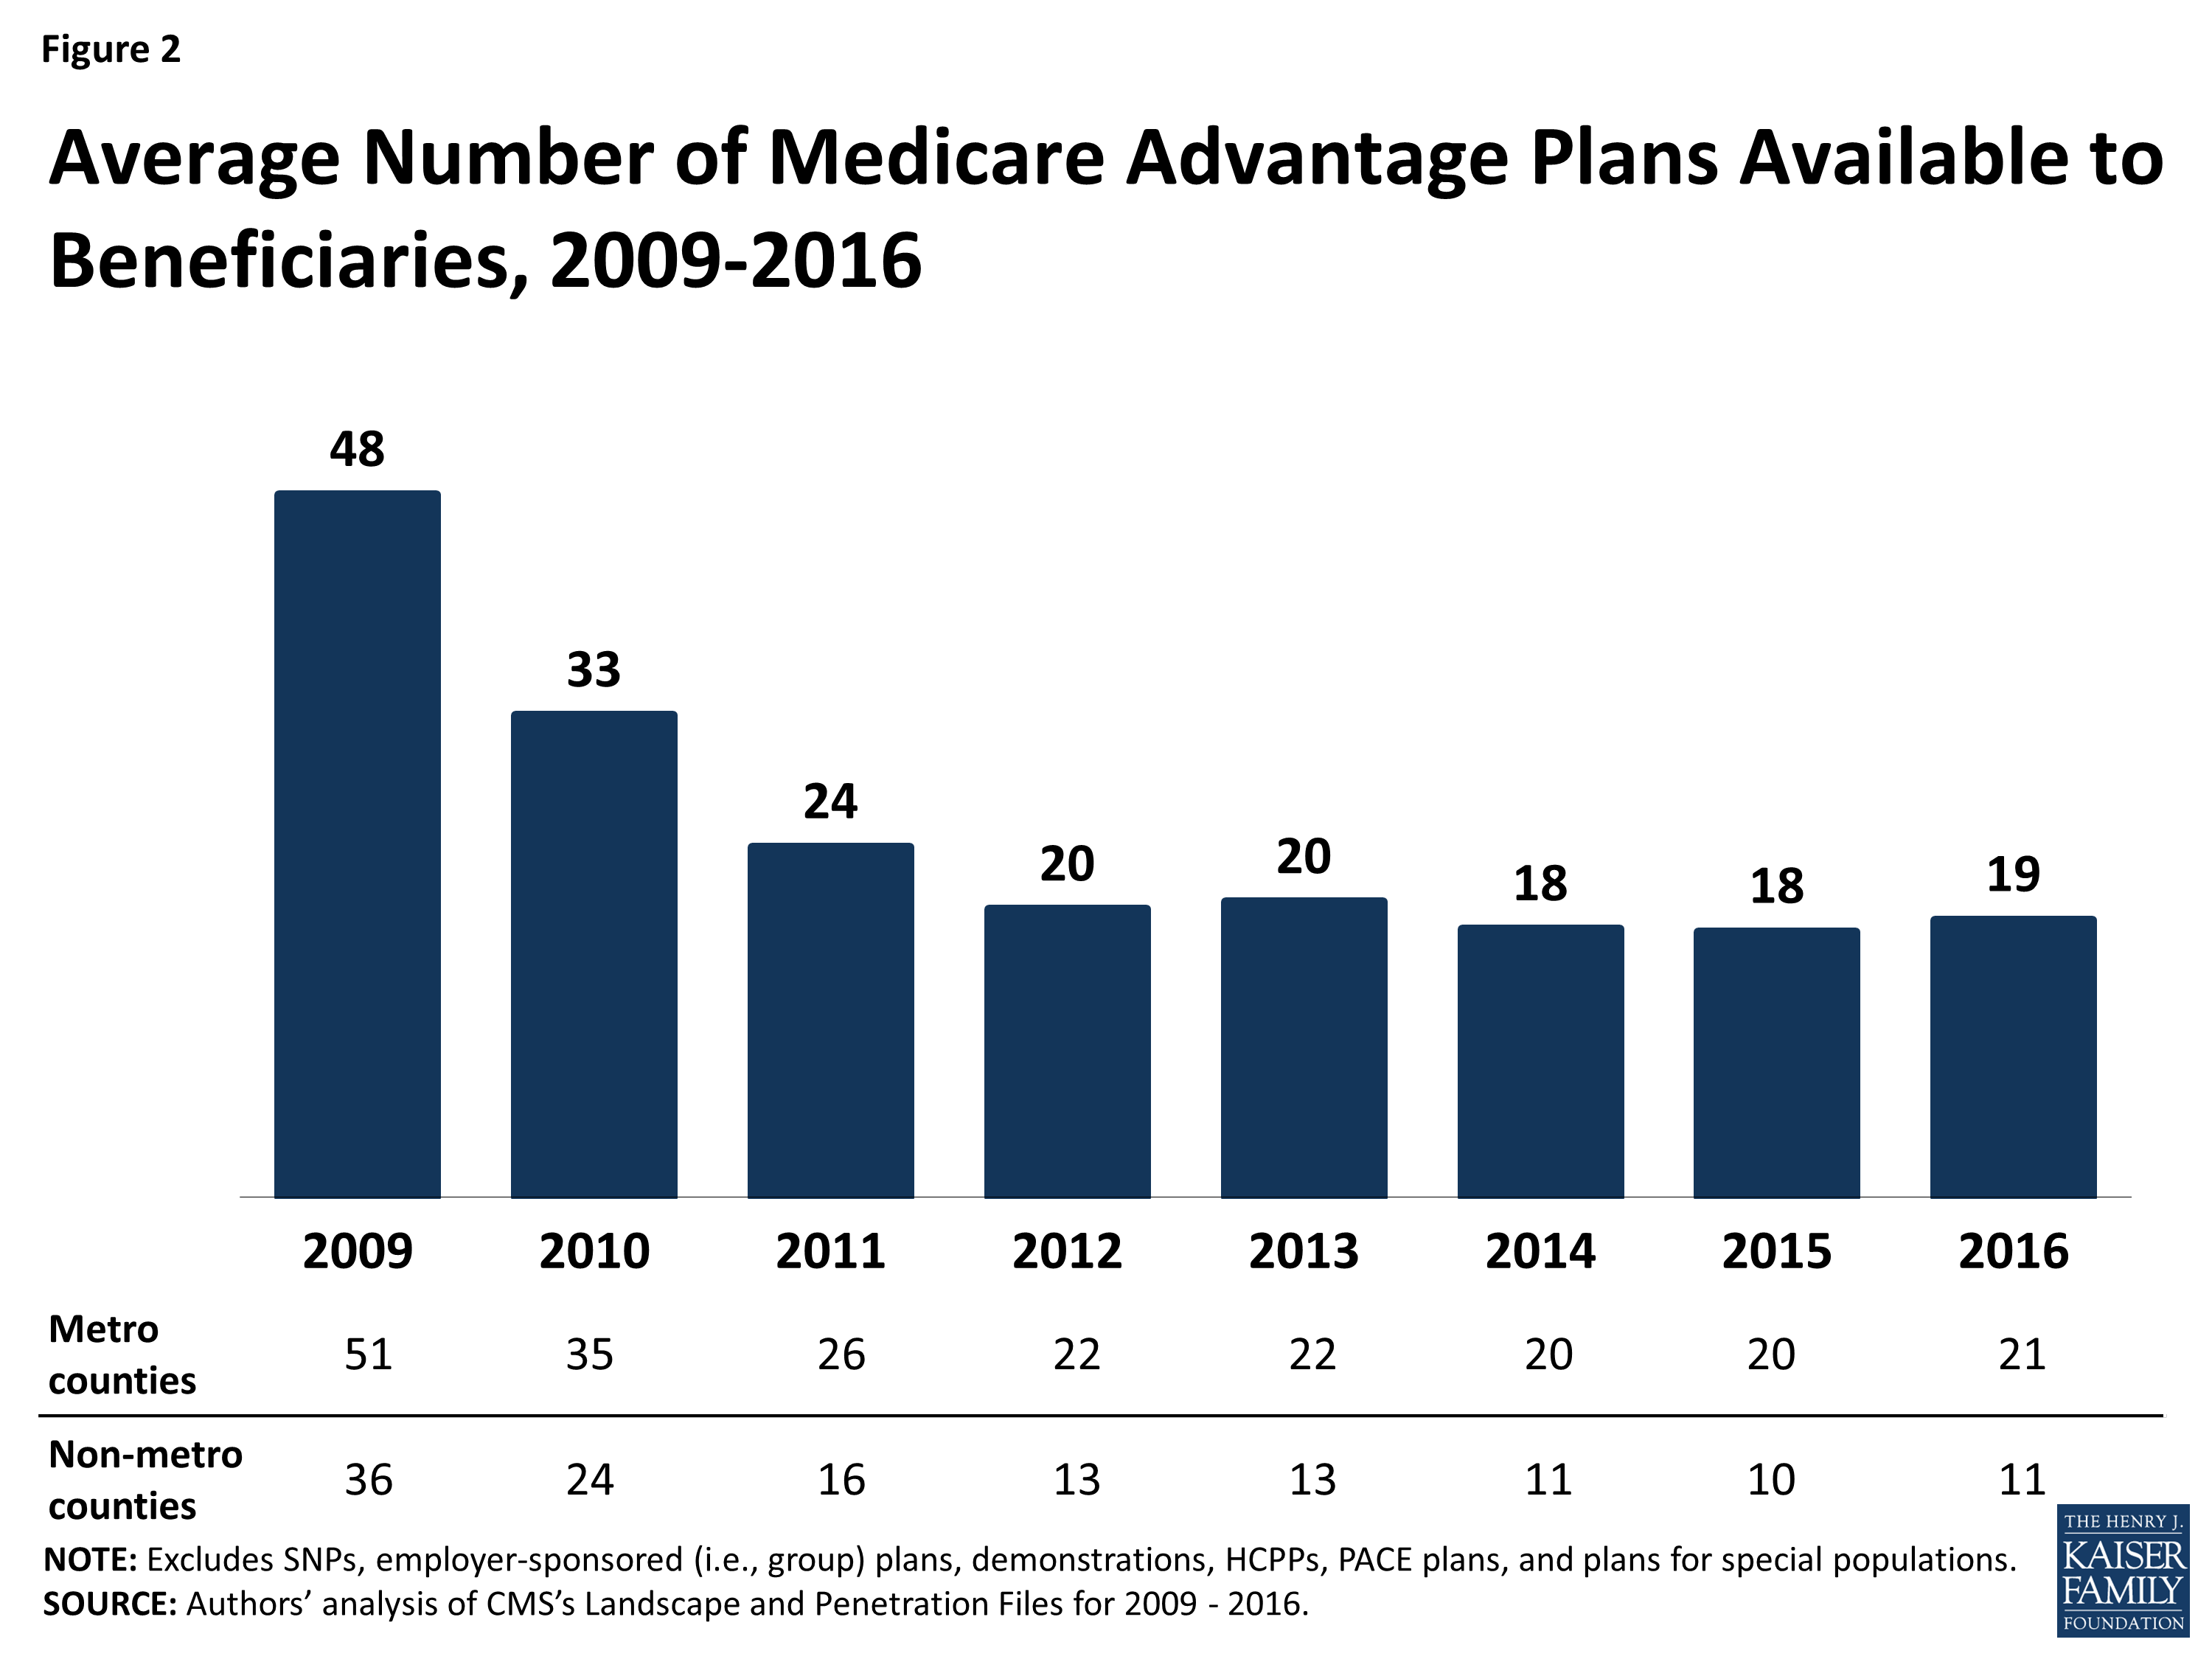
Figure 2: Average Number of Medicare Advantage Plans Available to Beneficiaries, 2009-2016
Number of Firms Offering Medicare Advantage Plans
The average Medicare beneficiary will be able to choose from many plans, but in some areas, these plans will be offered by a handful of firms. The average Medicare beneficiary will be able to choose from plans offered by 6 firms, on average, in 2016, with sizeable variation across counties (Figure 3). One-quarter of beneficiaries will be able to choose from plans offered by three or fewer firms, while another quarter of beneficiaries will be able to choose from plans offered by 8 or more firms. The number of firms offering Medicare Advantage plans will be highest in the New York City area, with at least 19 firms offering plans in Bronx County, Kings County, New York County, and Queens County. In contrast, in 445 counties in 28 states accounting for 4 percent of Medicare beneficiaries, only one firm will offer Medicare Advantage plans in 2016.
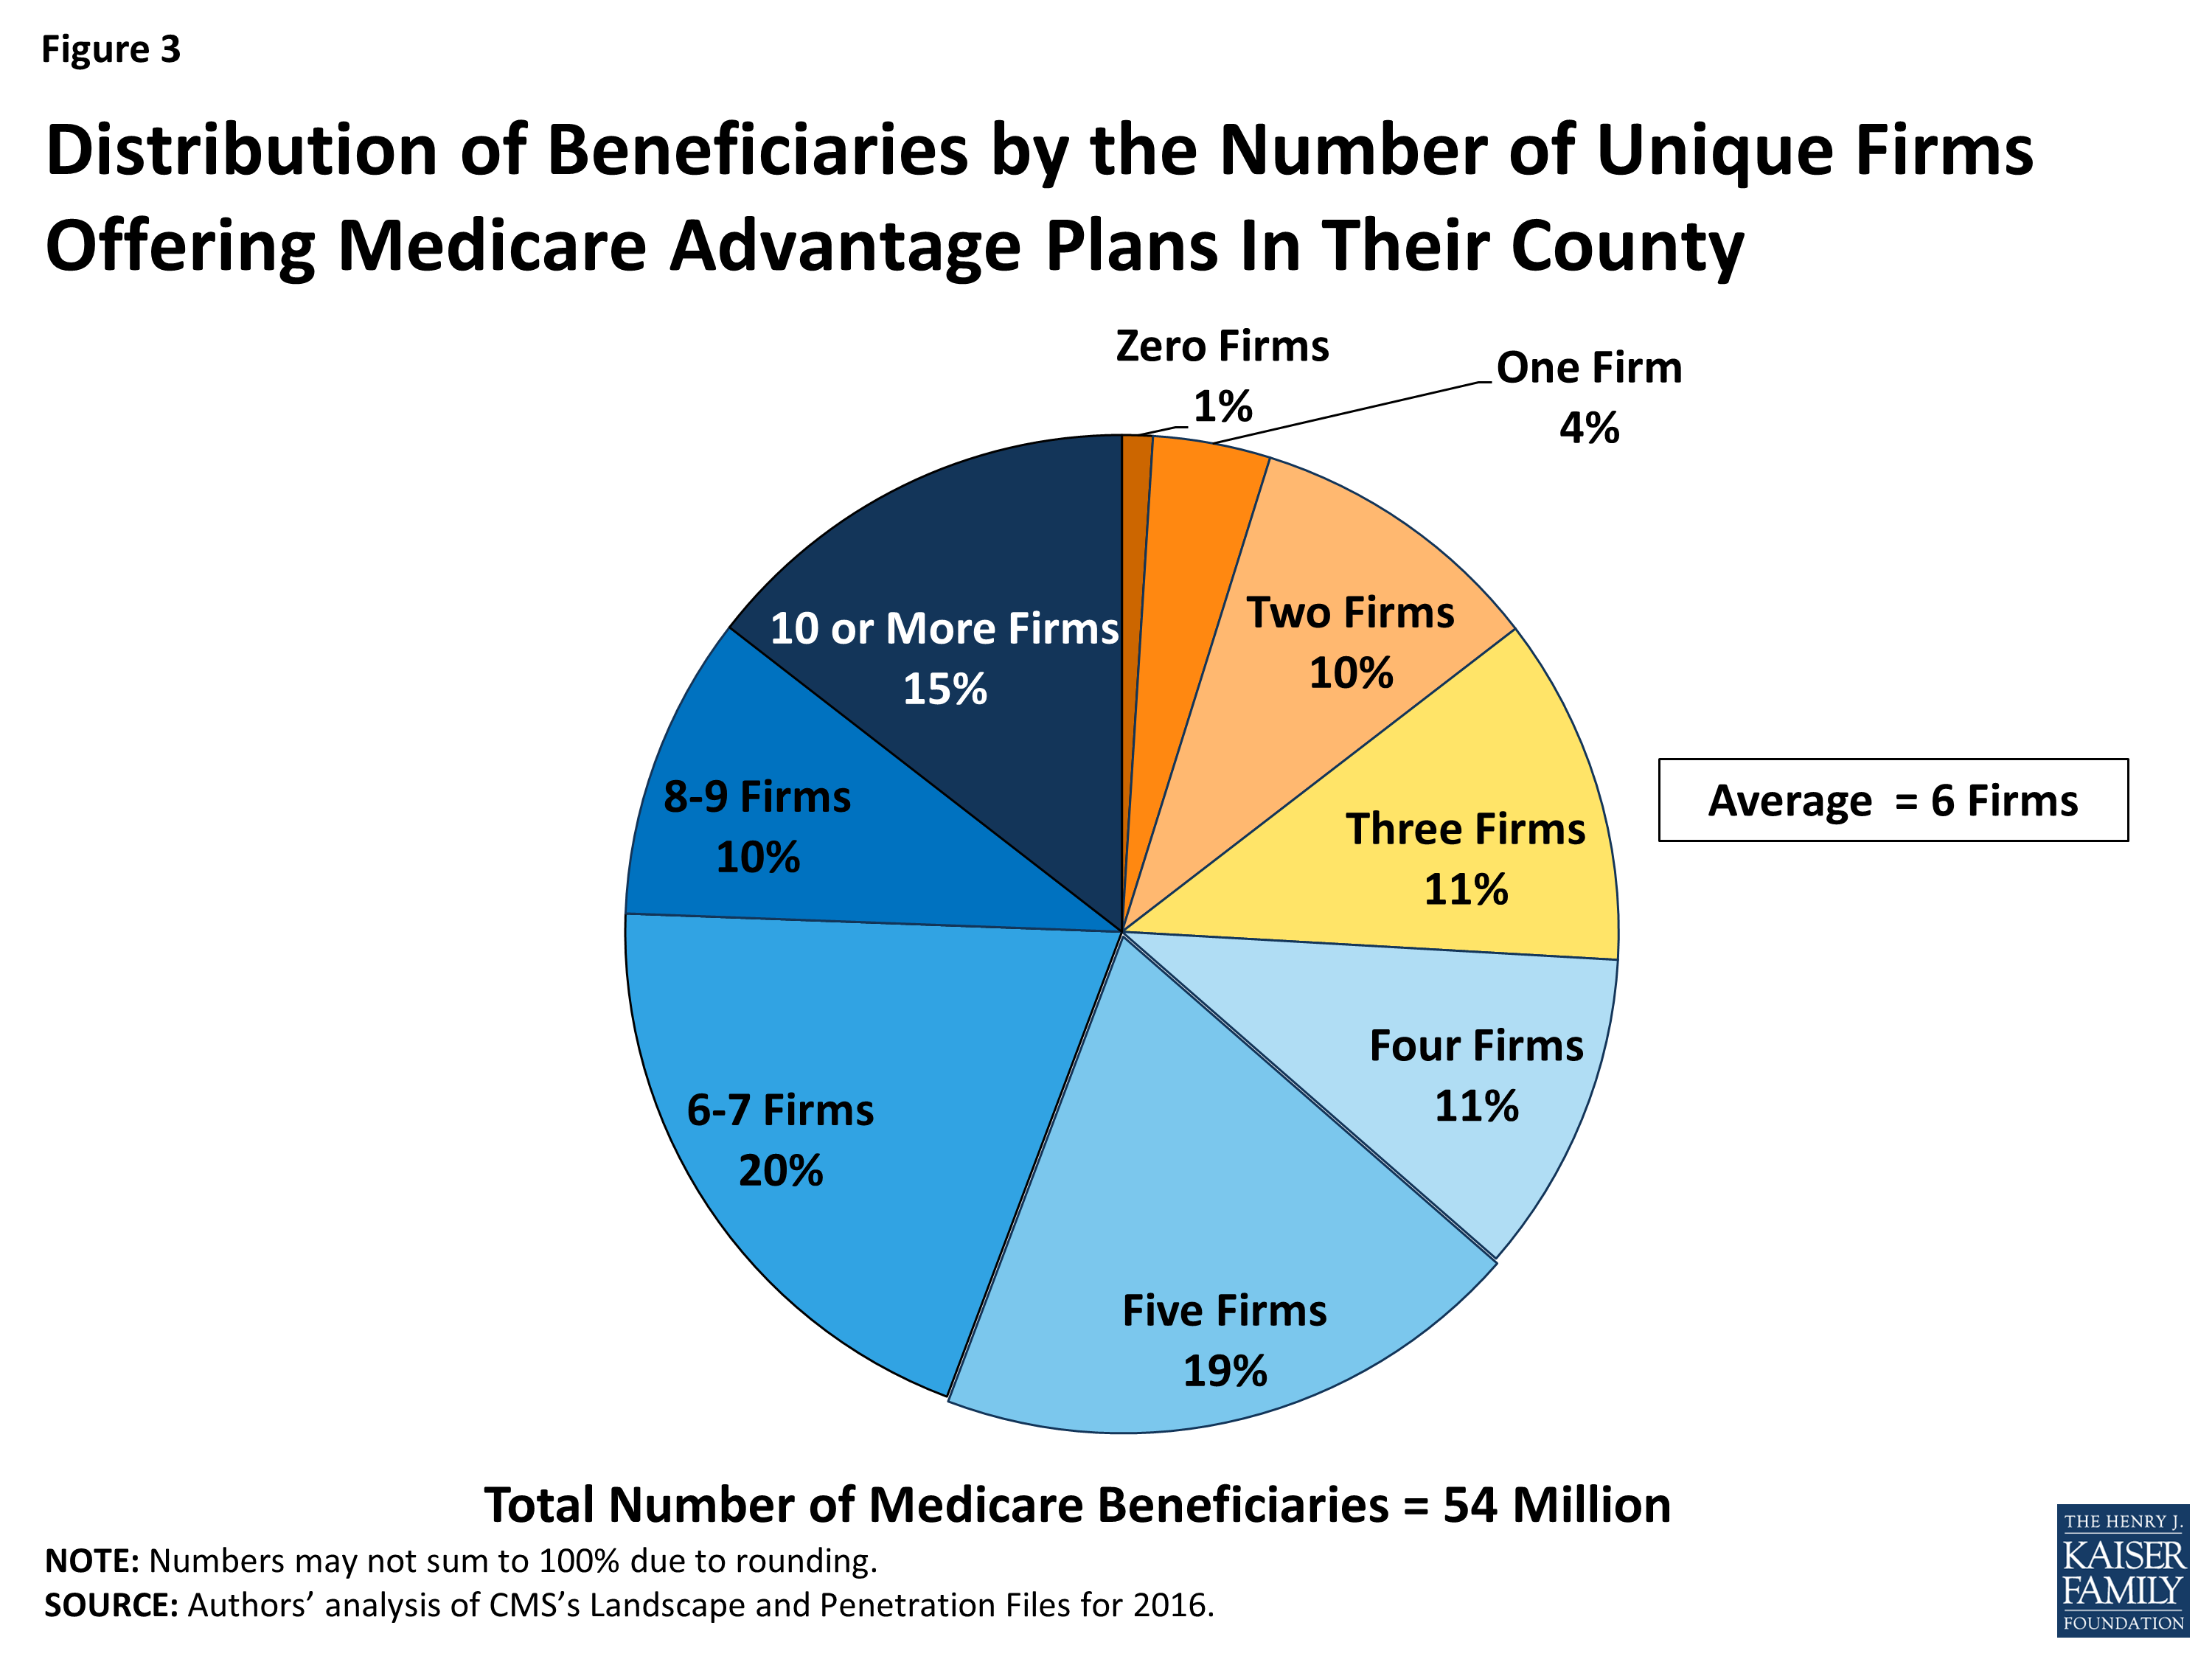
Figure 3: Distribution of Beneficiaries by the Number of Unique Firms Offering Medicare Advantage Plans In Their County
Access to Medicare Advantage Plans
As in recent years, virtually all Medicare beneficiaries (99%) will continue to have access to a Medicare Advantage plan as an alternative to traditional Medicare (Figure 4). All beneficiaries in metropolitan areas (100%) and the vast majority of beneficiaries in non-metropolitan areas (97%) will continue to have access to at least one Medicare Advantage plan – the same percentages as in 2015. Consistent with prior years, a smaller share of beneficiaries in non-metropolitan counties than in metropolitan counties will have access to HMOs or local PPOs, although these plans will be available to at least 70 percent of beneficiaries in non-metropolitan counties.
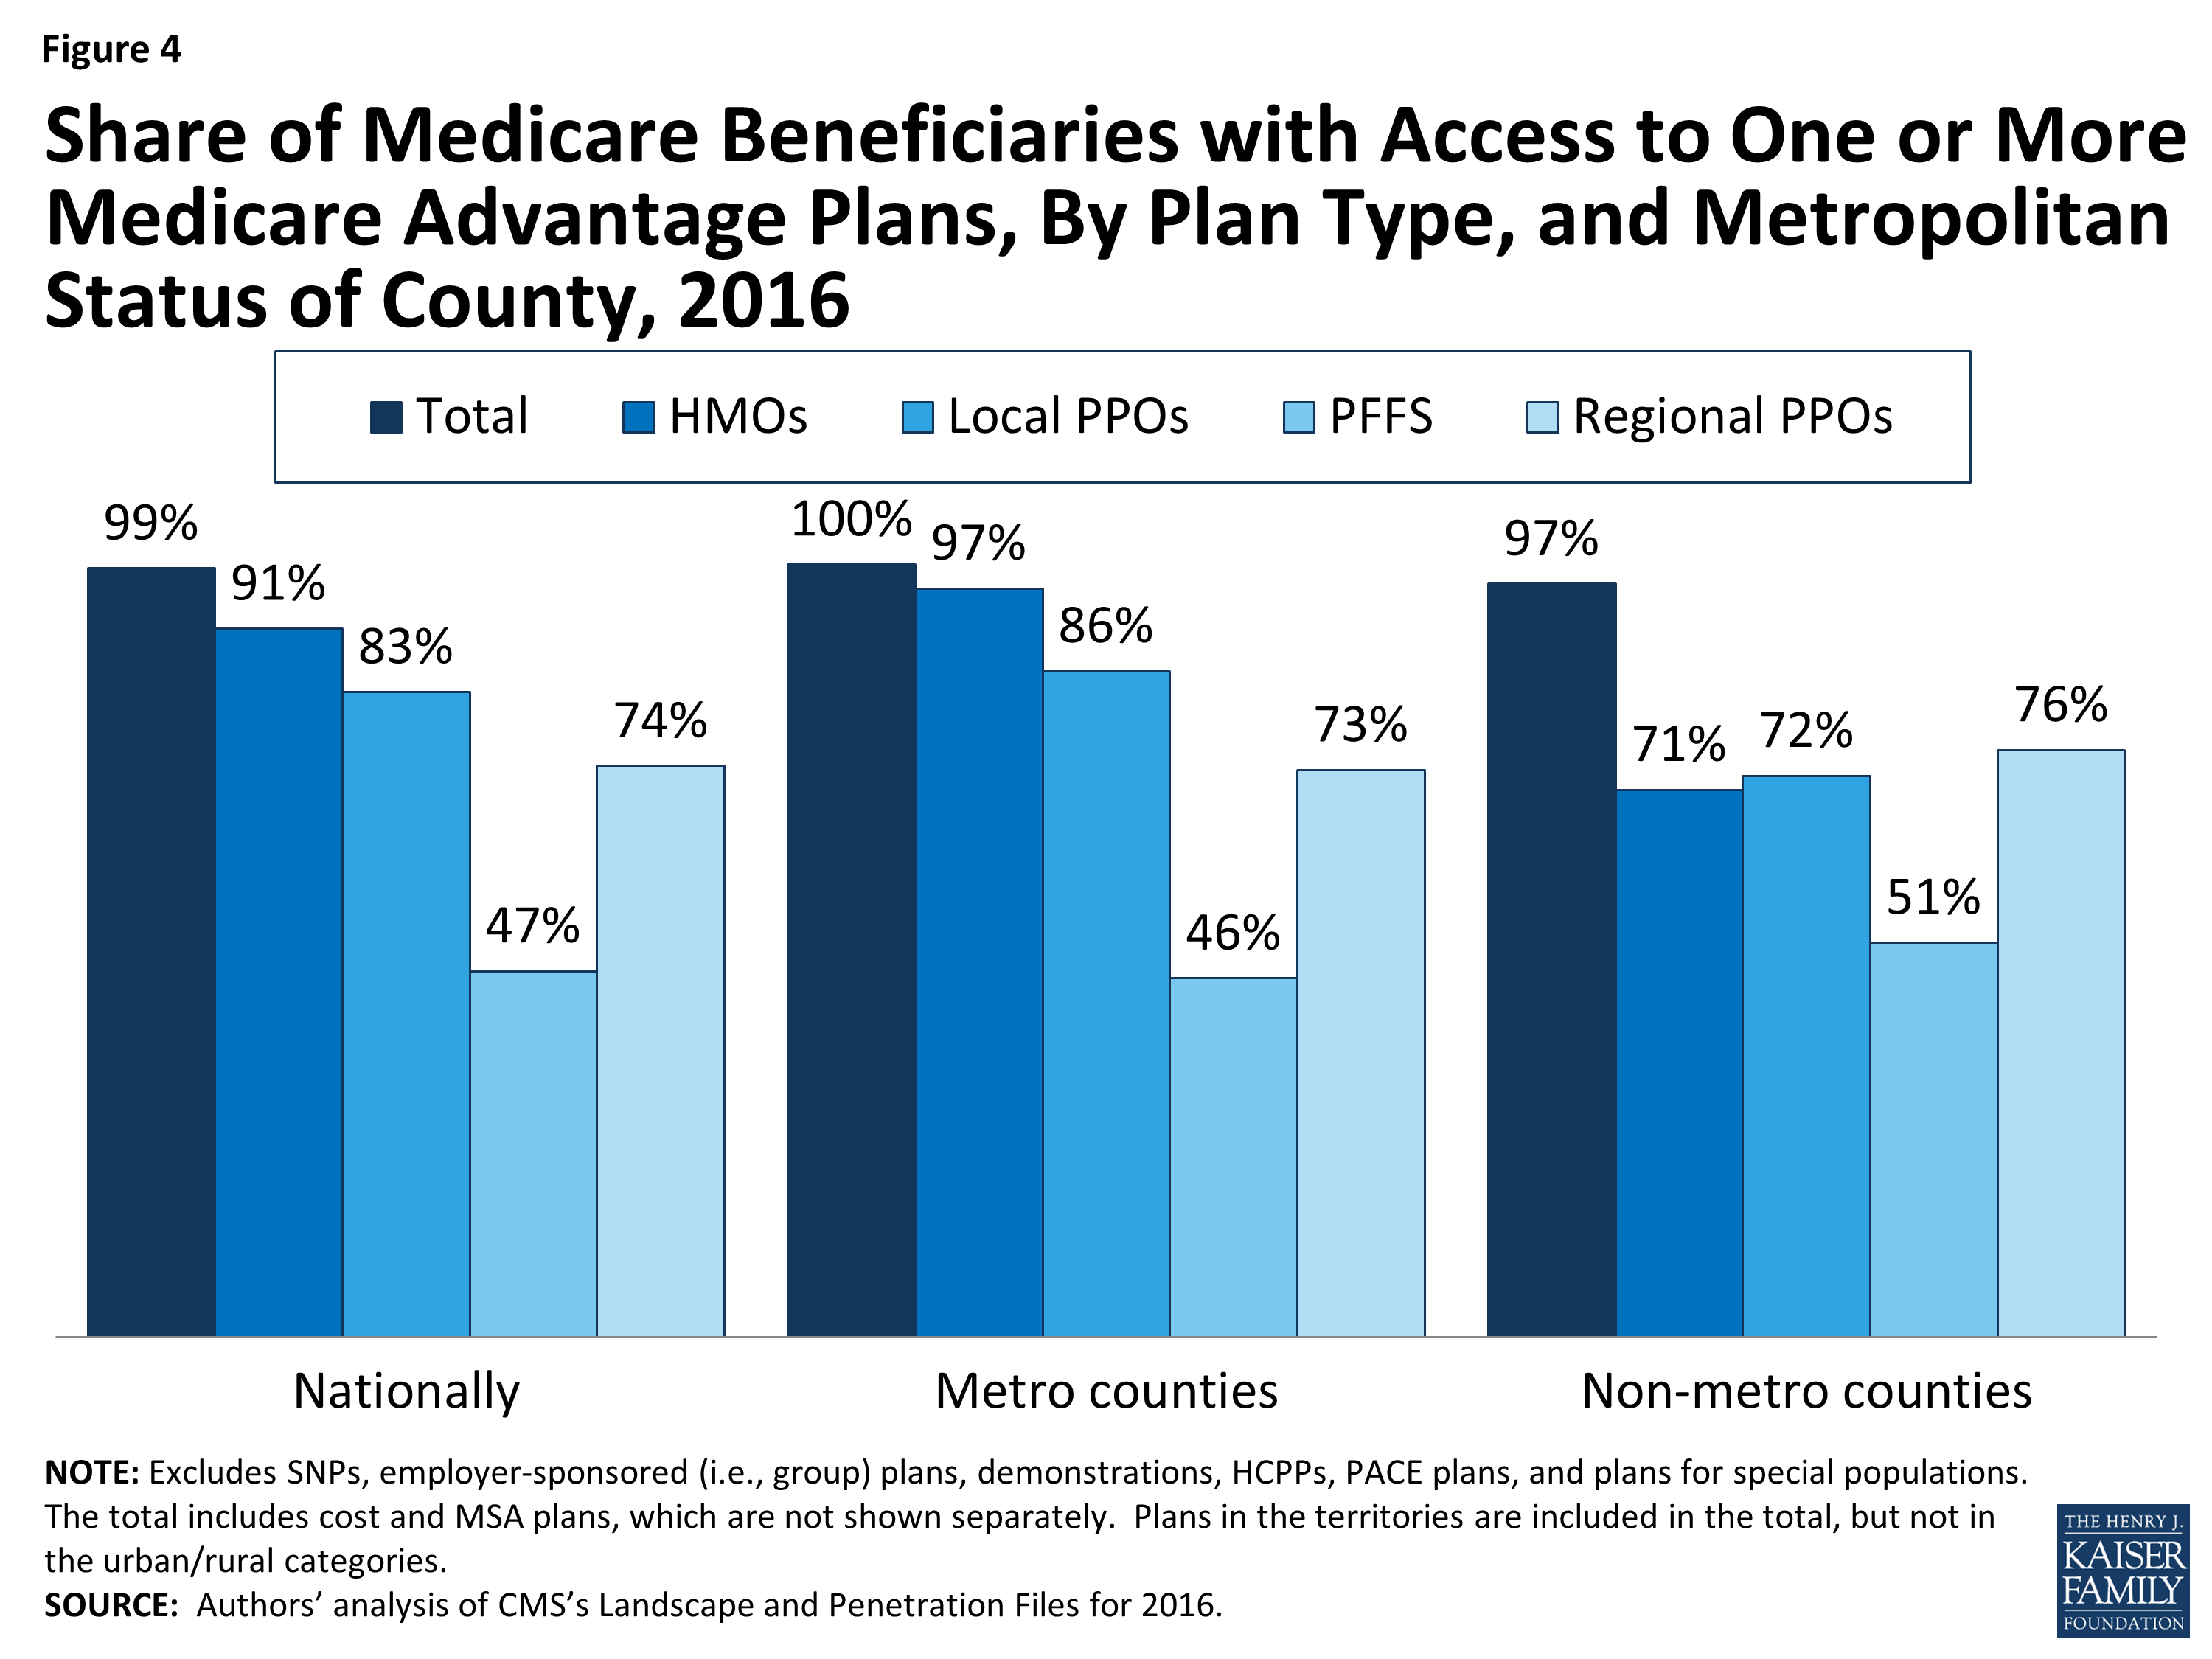
Figure 4: Share of Medicare Beneficiaries with Access to One or More Medicare Advantage Plans, By Plan Type, and Metropolitan Status of County, 2016
Plan Premiums
Premiums are the most visible and the easiest factor for beneficiaries to compare across plans. While other factors, such as limits on out-of-pocket spending, cost-sharing, prescription drugs, extra benefits, and provider networks, can have an even larger impact on beneficiaries’ out-of-pocket spending on health care and access to providers, information on them is less readily accessible and often more difficult to interpret. For cost-sharing and provider networks in particular, it is nearly impossible from publicly available data to construct an apples-to-apples comparison across plans that appropriately weights all factors. As a result, many people use the plan premiums to choose among plans.
Medicare beneficiaries enrolled in Medicare Advantage plans pay the Part B premium like other beneficiaries (less any rebate provided by the Medicare Advantage plan), and may also pay an additional monthly premium charged by the Medicare Advantage plan for benefits and prescription drug coverage. This analysis of premiums includes only Medicare Advantage plans that offer prescription drug coverage (MA-PDs). The minority of Medicare Advantage plans (13%) that do not cover prescription drugs are not included in the analysis, in order to better compare premiums across plan types and years.
Monthly Premiums (Unweighted by Enrollment)
To examine how premiums for all plans available to beneficiaries will change between 2015 and 2016, this spotlight first examines the change in premiums for all MA-PDs, without weighting them by the number of enrollees in each plan. The analysis includes plans with no premiums as well as plans with monthly premiums. In 2016, the average premium for MA-PDs (unweighted by plan enrollment) will be $53 per month – similar to 2015 (Table A3). Premiums for HMOs will average $39 per month, up $1 from 2015. Similar to prior years, HMOs will continue to have lower premiums than regional PPOs ($75 per month), local PPOs ($79 per month) and PFFS plans ($91 per month). Similar to 2015, regional PPOs will have the largest change in premiums, on average, and average premiums will increase $7, on average, from $68 per month in 2015. In contrast, premiums for local PPOs will decrease by $2, on average, from $81 per month in 2015.
Monthly Premiums (Weighted by Enrollment), Assuming Enrollees Remain in the Same Plan
To examine how premiums will change for Medicare Advantage enrollees, assuming they remain in the same plan between 2015 and 2016, this spotlight examines the premiums among MA-PDs offered in both years and weight the premiums by plan enrollment in 2015. These enrollee “weighted average” premiums are a clearer indication than unweighted premiums of the amount paid by the average Medicare Advantage enrollee because enrollment across plans is uneven. Similar to the prior analysis, this analysis includes plans with no premiums as well as plans with monthly premiums. Enrollees may be able to prevent or reduce increases in premiums by switching to another plan. After the open enrollment period, we will analyze the premiums for plans selected by all Medicare Advantage enrollees in 2016.1 In recent years, average premiums, weighted by actual enrollment, have tended to be lower than estimates of weighted premiums based on prior year enrollment. The difference reflects the net impact of beneficiaries making enrollment changes between one year and the next, and plan choices among new Medicare Advantage enrollees.
Based on plan enrollment in the Fall of 2015, the average Medicare Advantage enrollee in a plan that will continue to be offered in 2016 will pay about $41 per month, an increase of $3 per month (or 8%) compared to 2015, if they stay in the same plan (Figure 5). In percentage terms, enrollees in PFFS plans will experience a larger increase in premiums (13% on average) than enrollees in other types of Medicare Advantage plans, and average premiums for PFFS plan enrollees will rise from $52 per month to $58 per month, assuming no change in enrollment. The average increase in enrollment weighted premiums is lower than it has been since 2012 when there was a 3 percent increase. Premiums could be rising at a somewhat slower pace for many reasons including the fact that the changes in payments to plans as a result of the ACA are fully implemented in most counties. Monthly premiums, weighted for 2015 enrollment will be lower for enrollees in HMOs ($31 per month) than for enrollees in other types of Medicare Advantage plans, and higher for enrollees in local PPOs ($68 per month), on average.
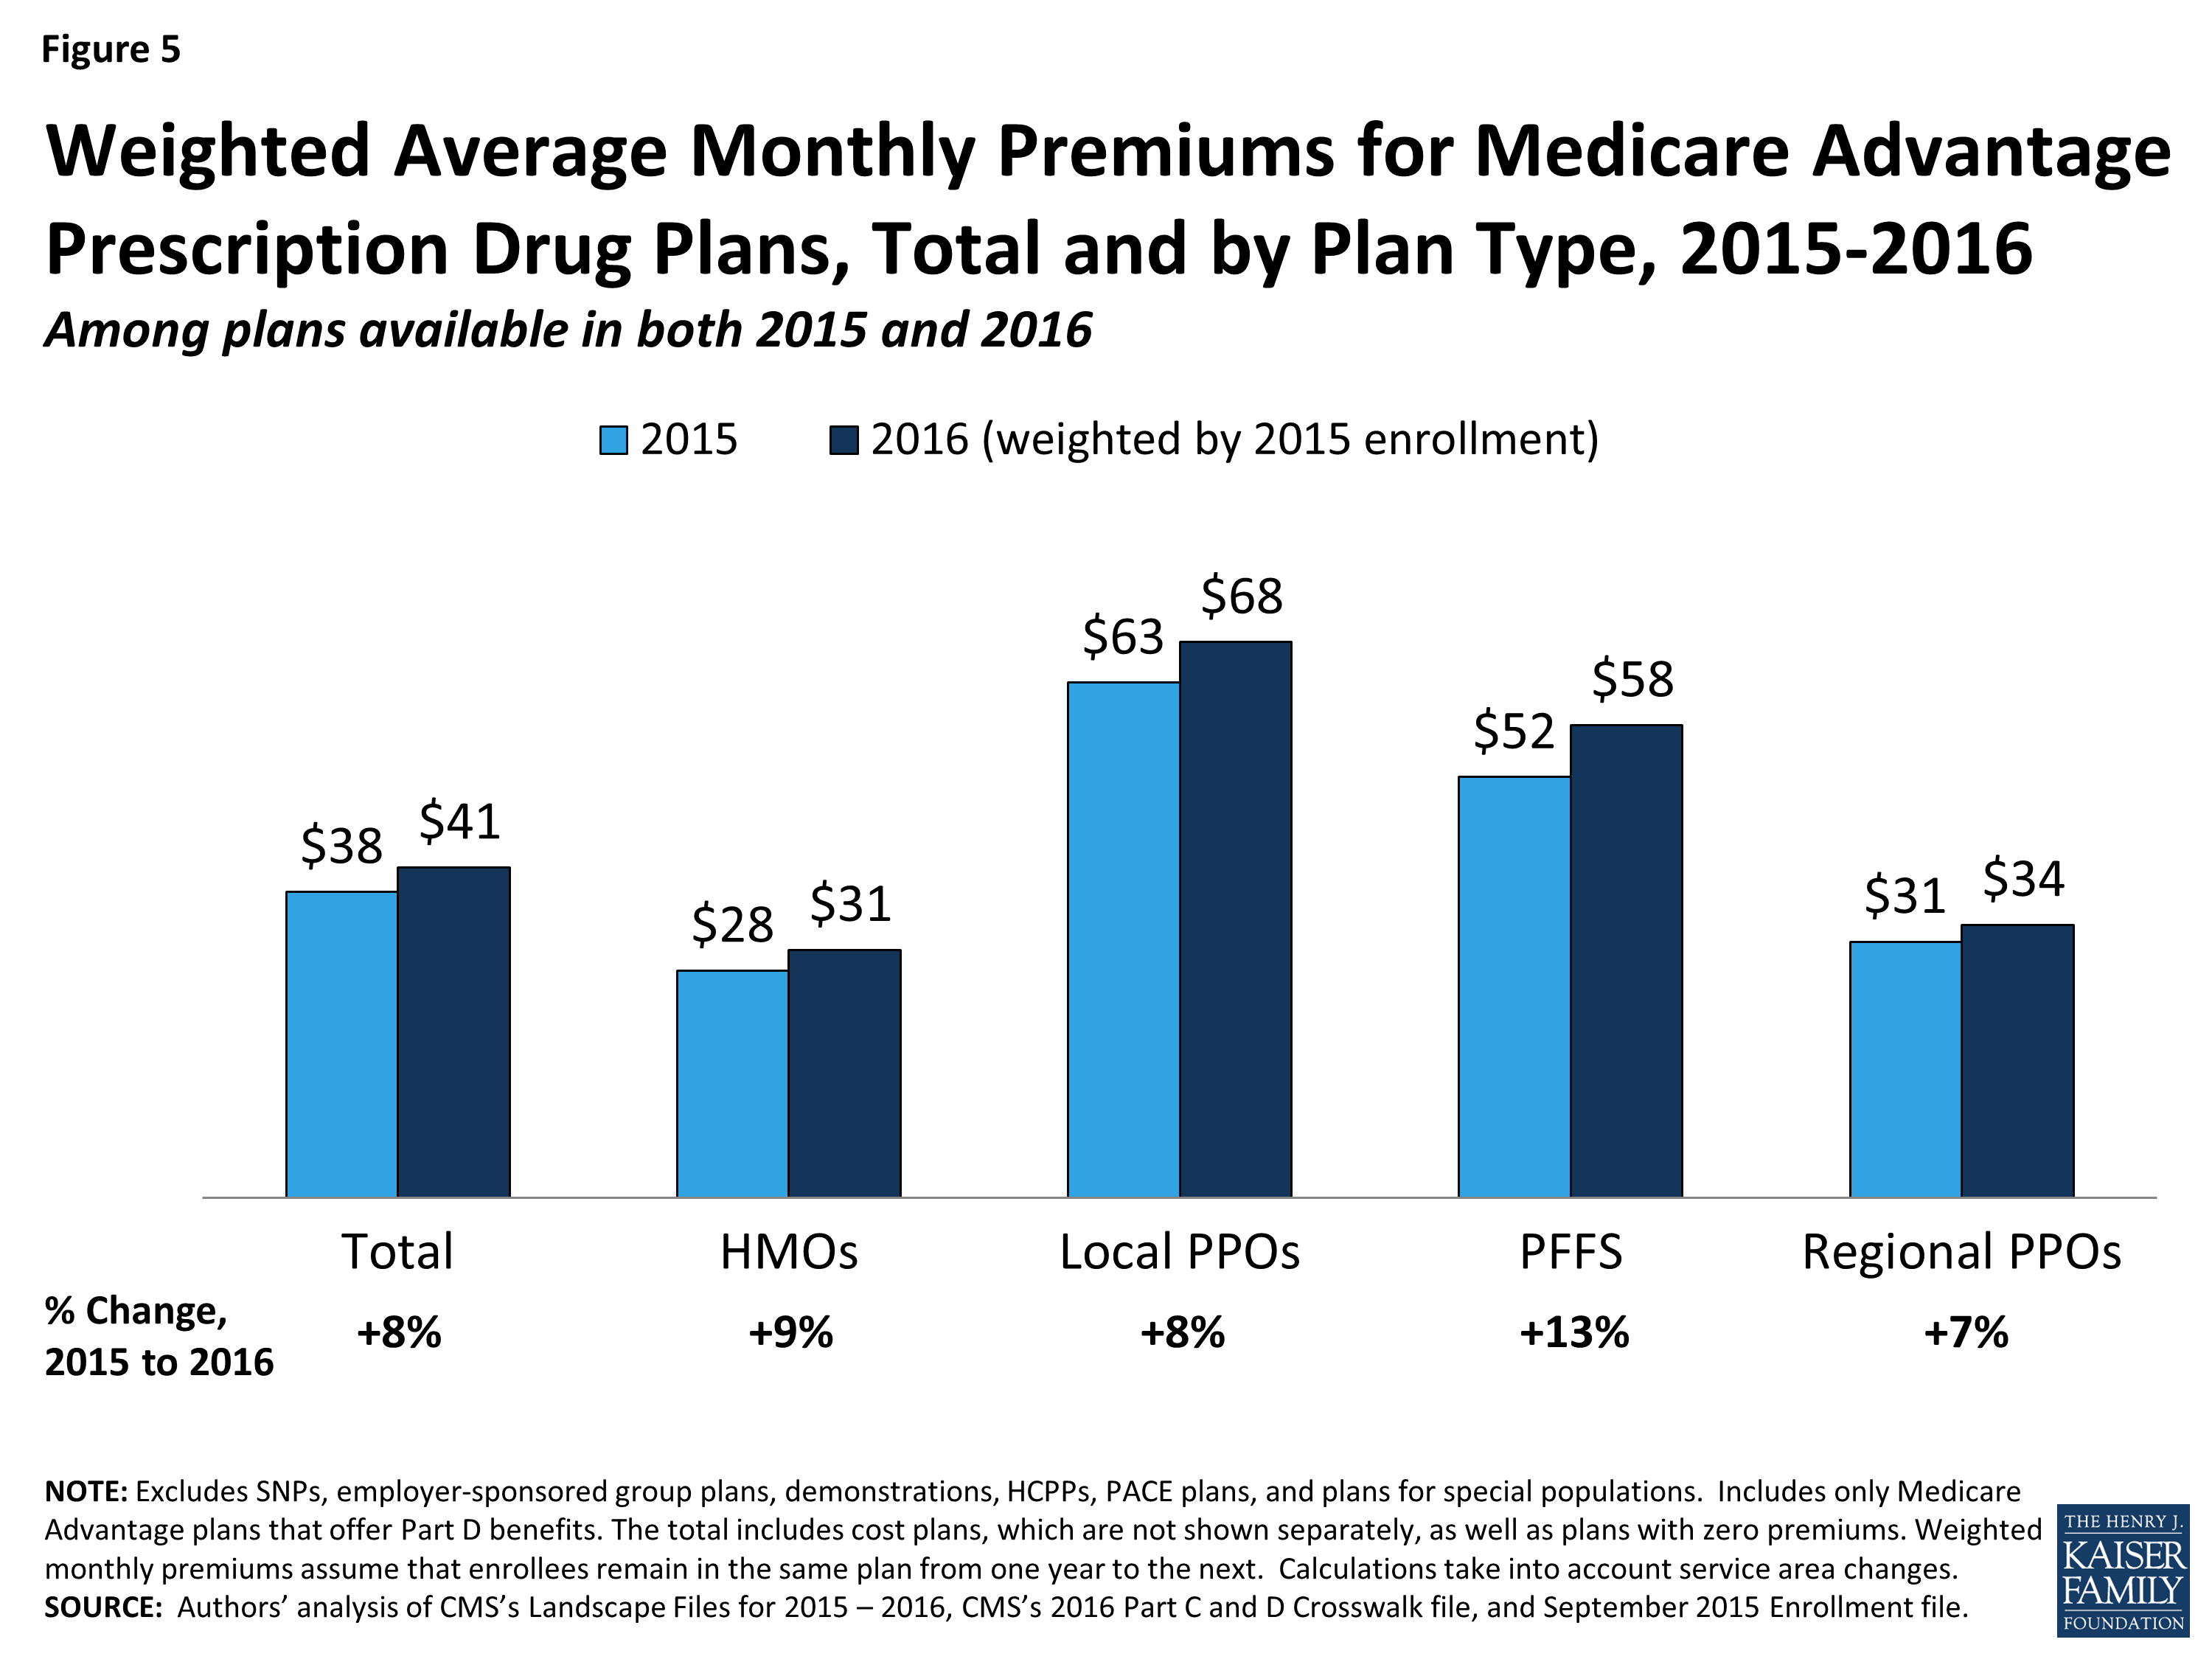
Figure 5: Weighted Average Monthly Premiums for Medicare Advantage Prescription Drug Plans, Total and by Plan Type, 2015-2016
In general, enrollees in MA-PDs that will continue to be offered in 2016 had somewhat lower premiums in 2015, on average, than enrollees in plans that will be exiting the Medicare Advantage market in 2016 (Table A1). The 2015 premiums for plans remaining in the market in 2016 averaged $38 per month as compared to $41 per month for those exiting the market. However, the difference varies across plan types and these changes are difficult to interpret because plan premiums are a function of many plan-specific factors (e.g., benefits, cost-sharing, provider networks), as well regional-specific factors (e.g., local practice patterns, payments from the Medicare program).
Access to Plans with No Premium
Medicare Advantage plans with no additional premium (other than the Medicare Part B premium) – so called “zero premium plans” – have been a feature of the Medicare Advantage landscape for many years. About four-fifths (81%) of all beneficiaries will have access to a zero-premium MA-PD in 2016, an increase from 78 percent in 2015 (Figure 6). The continued availability of zero-premium plans mainly reflects offerings among HMOs since zero-premium plans are less common among other plan types.
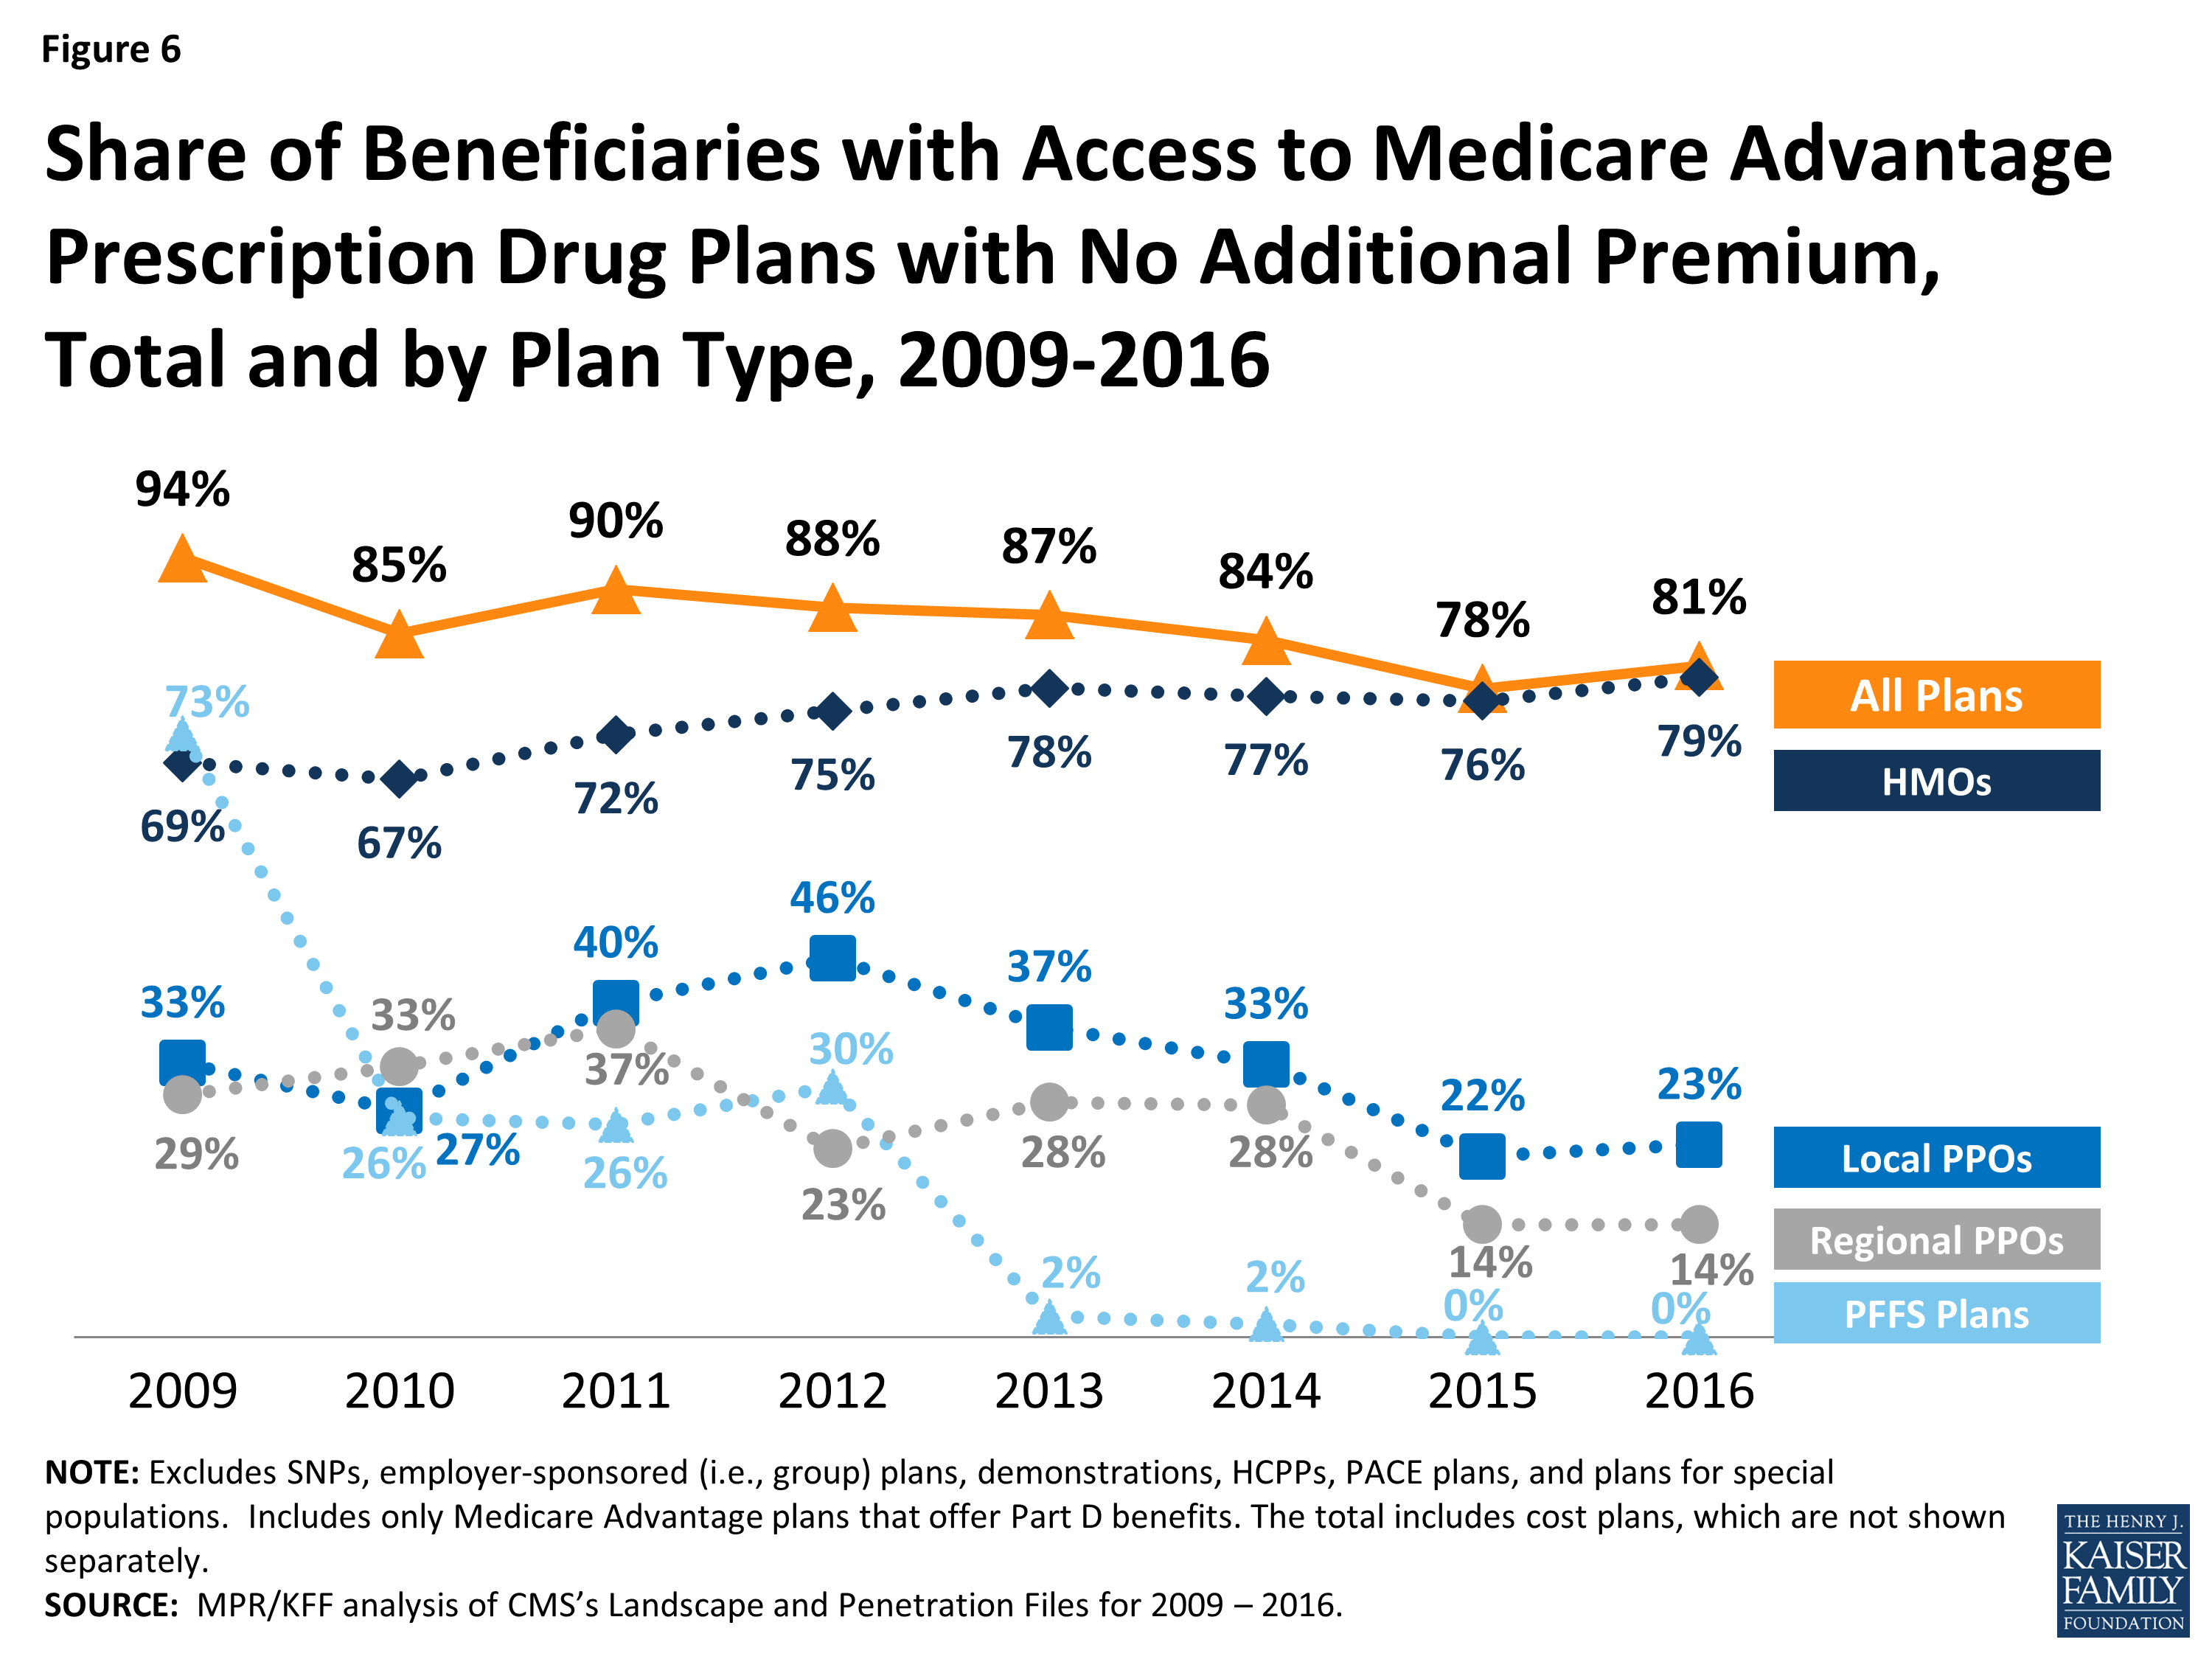
Figure 6: Share of Beneficiaries with Access to Medicare Advantage Prescription Drug Plans with No Additional Premium, Total and by Plan Type, 2009-2016
Limits on Out-of-Pocket Spending
People on Medicare have said that out-of-pocket spending is important to them when selecting their plan.1 Yet, it is challenging for beneficiaries to estimate their future out-of-pocket costs for all plans available in their area because it is difficult to predict their health care needs and virtually impossible to compare cost-sharing for specific services. One alternative for beneficiaries is to use the plans’ limits on out-of-pocket spending to gauge the maximum amount they could pay out-of-pocket in a plan for services covered under Medicare Part A and Part B, assuming they use only in-network providers.
The traditional Medicare program does not include a limit on out-of-pocket spending for services covered under Parts A and B, leaving beneficiaries in traditional Medicare with unlimited financial liability – an impetus for many beneficiaries to acquire supplemental coverage. In contrast, Medicare Advantage plans are required to limit enrollees’ out-of-pocket expenses for services covered under Parts A and B to no more than $6,700, with higher limits allowed for services received from out-of-network providers. Even before the 2011 implementation of this requirement, most Medicare Advantage plans (79% in 2010) voluntarily included a limit on enrollees’ out-of-pocket spending.2 CMS encourages plans to limit enrollees’ out-of-pocket expenses to no more than $3,400 per year, by allowing these plans to charge higher cost-sharing for some services. These out-of-pocket limits do not include expenses for prescription drugs covered under MA-PDs (which have separate Part D catastrophic threshold), nor do they include expenses for extra benefits or for services not covered by the plan.
Out-of-pocket limits for MA-PDs will be higher in 2016 than in 2015, on average. In 2016, two-fifths of plans (39%) will have limits equal to the maximum ($6,700), an increase from 17 percent of plans in 2013 (Figure 7). One-quarter (24%) of plans will have a limit of $3,400 or less in 2016, a sharp decline since 2013. In 2016, the average plan’s limit will be $5,257, up from $4,352 in 2013. When weighted by 2015 enrollment, out-of-pocket limits will increase by $193 between 2015 and 2016, on average (Table A1).
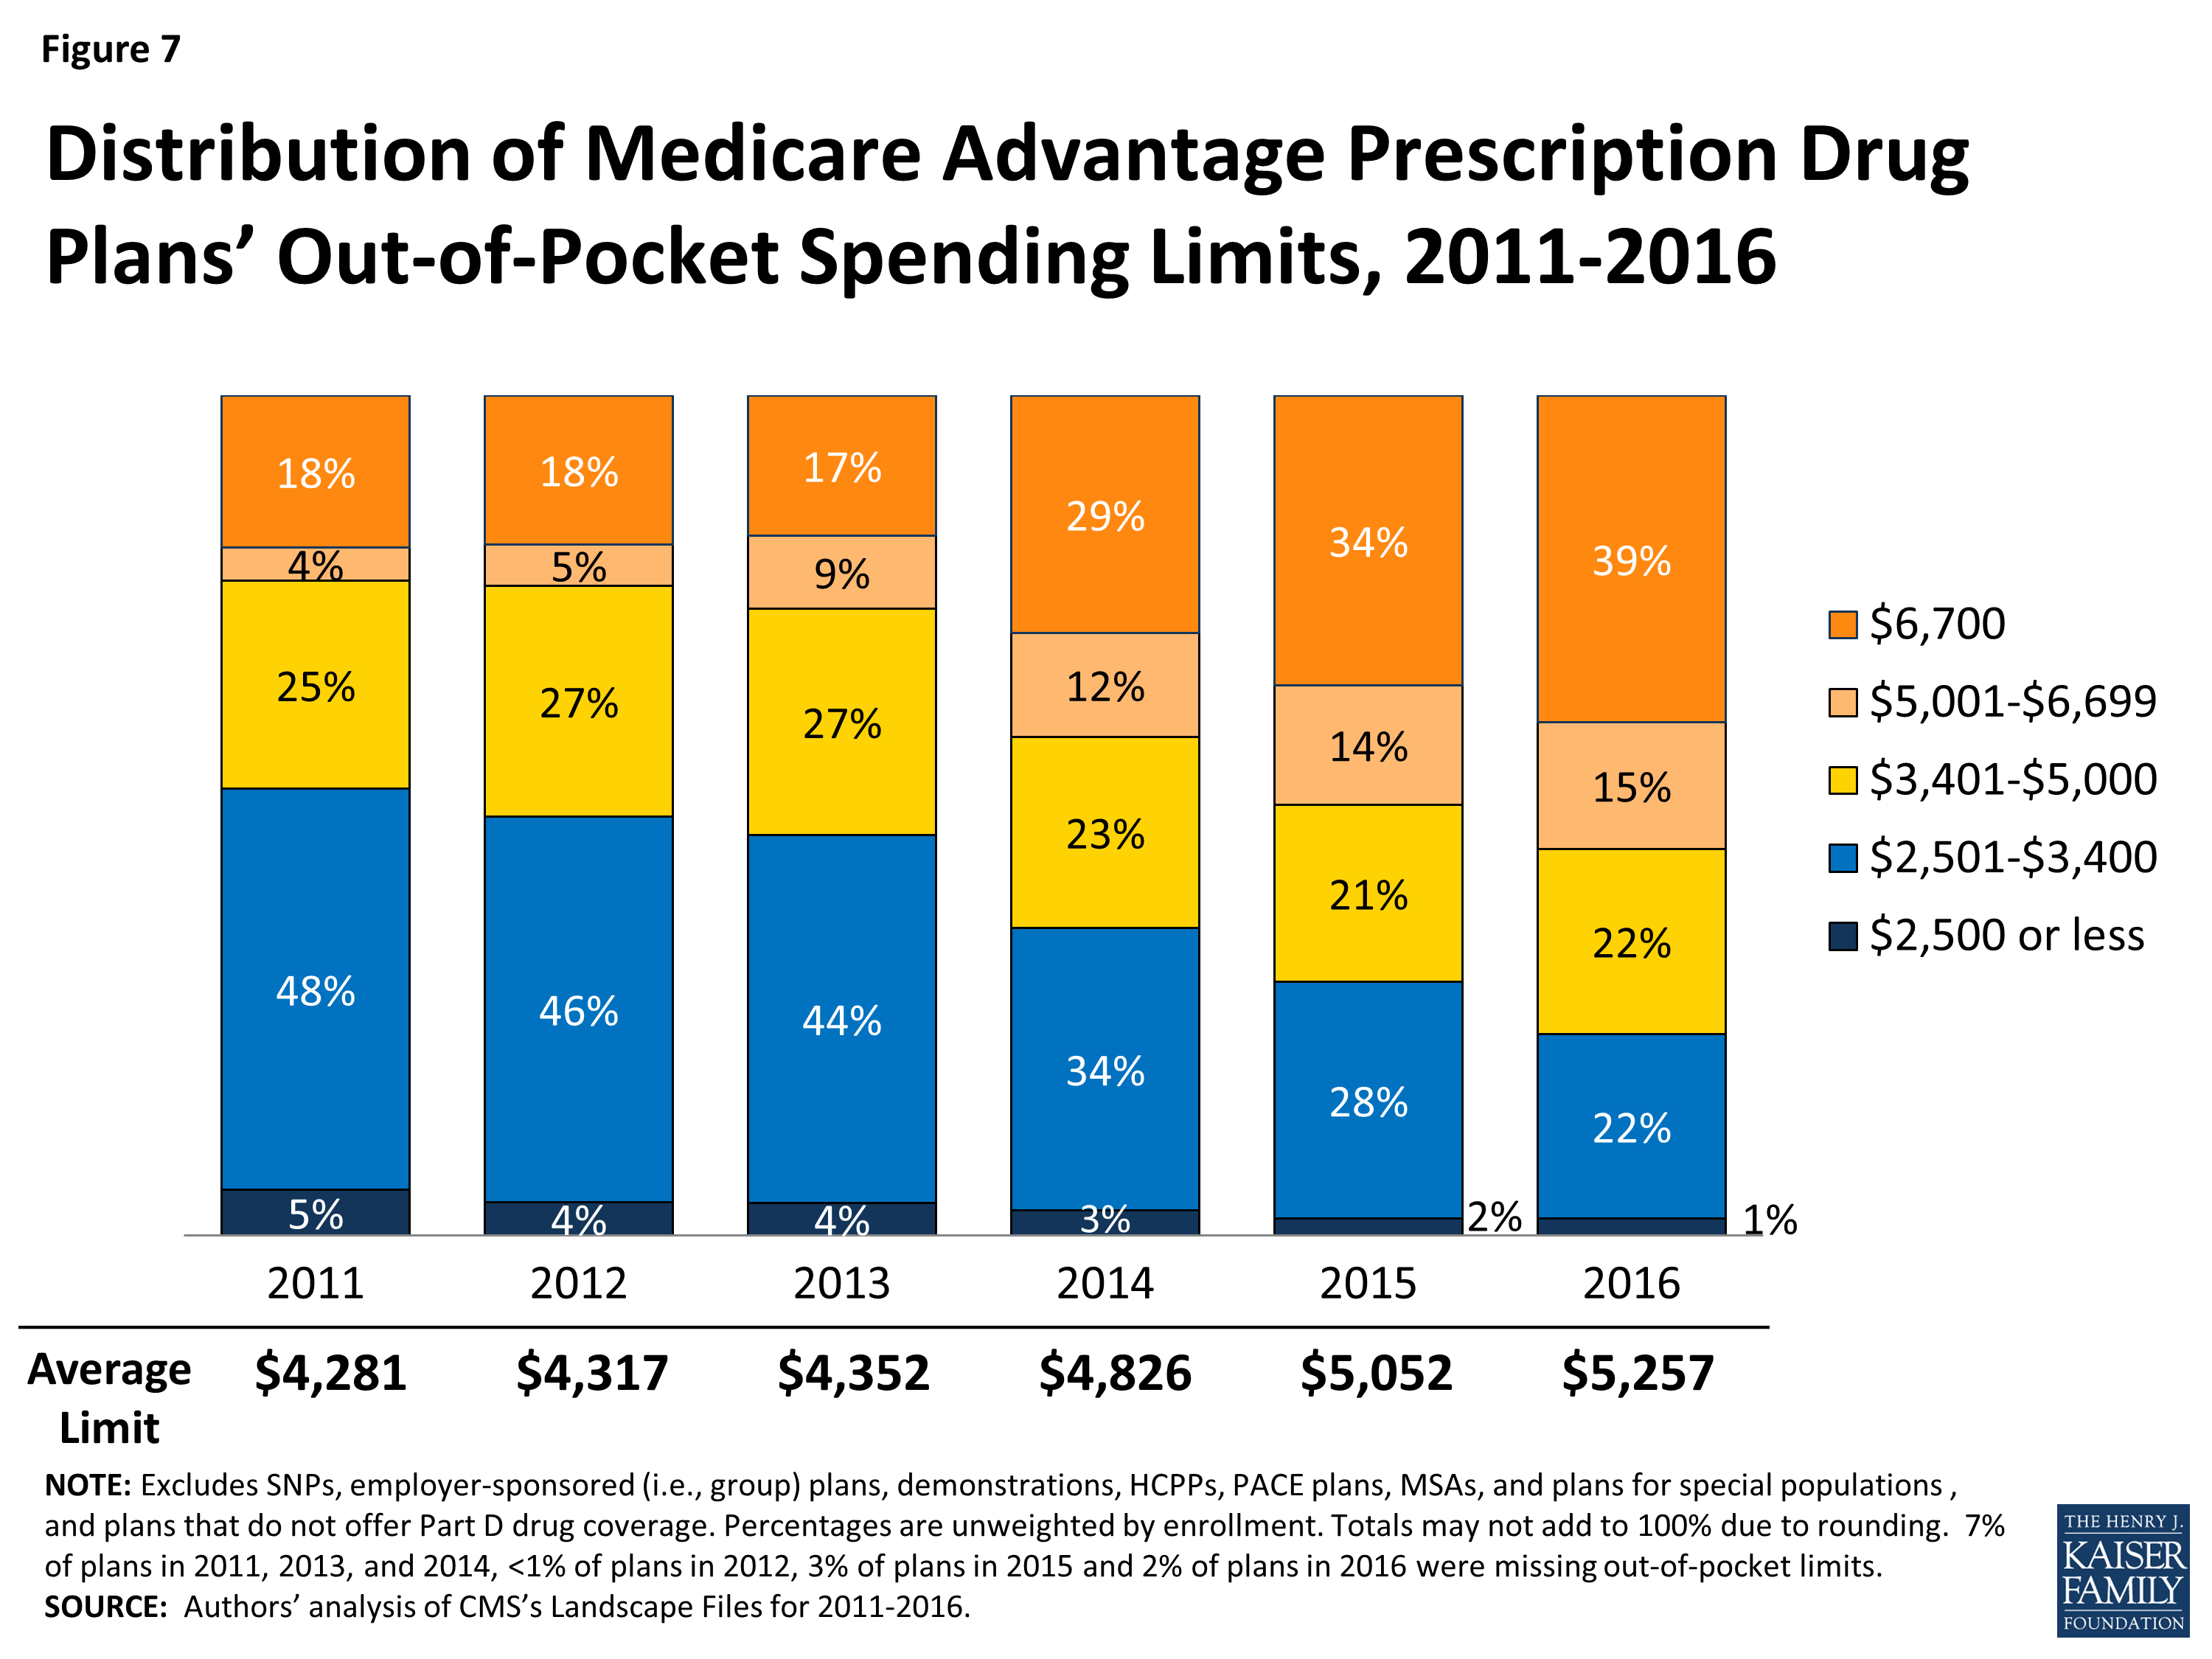
Figure 7: Distribution of Medicare Advantage Prescription Drug Plans’ Out-of-Pocket Spending Limits, 2011-2016
Average out-of-pocket limits are increasing across all plan types but a smaller share of HMOs than local PPOs or regional PPOs will have the maximum out-of-pocket limit allowed in 2016 (Figure 8). About three-quarters (73%) of regional PPOs, half (49%) of local PPOs, and one-third (35%) of HMOs have out of pocket limits equal to the maximum limit of $6,700. Limits at or below $3,400 now are rare in across all plan types.
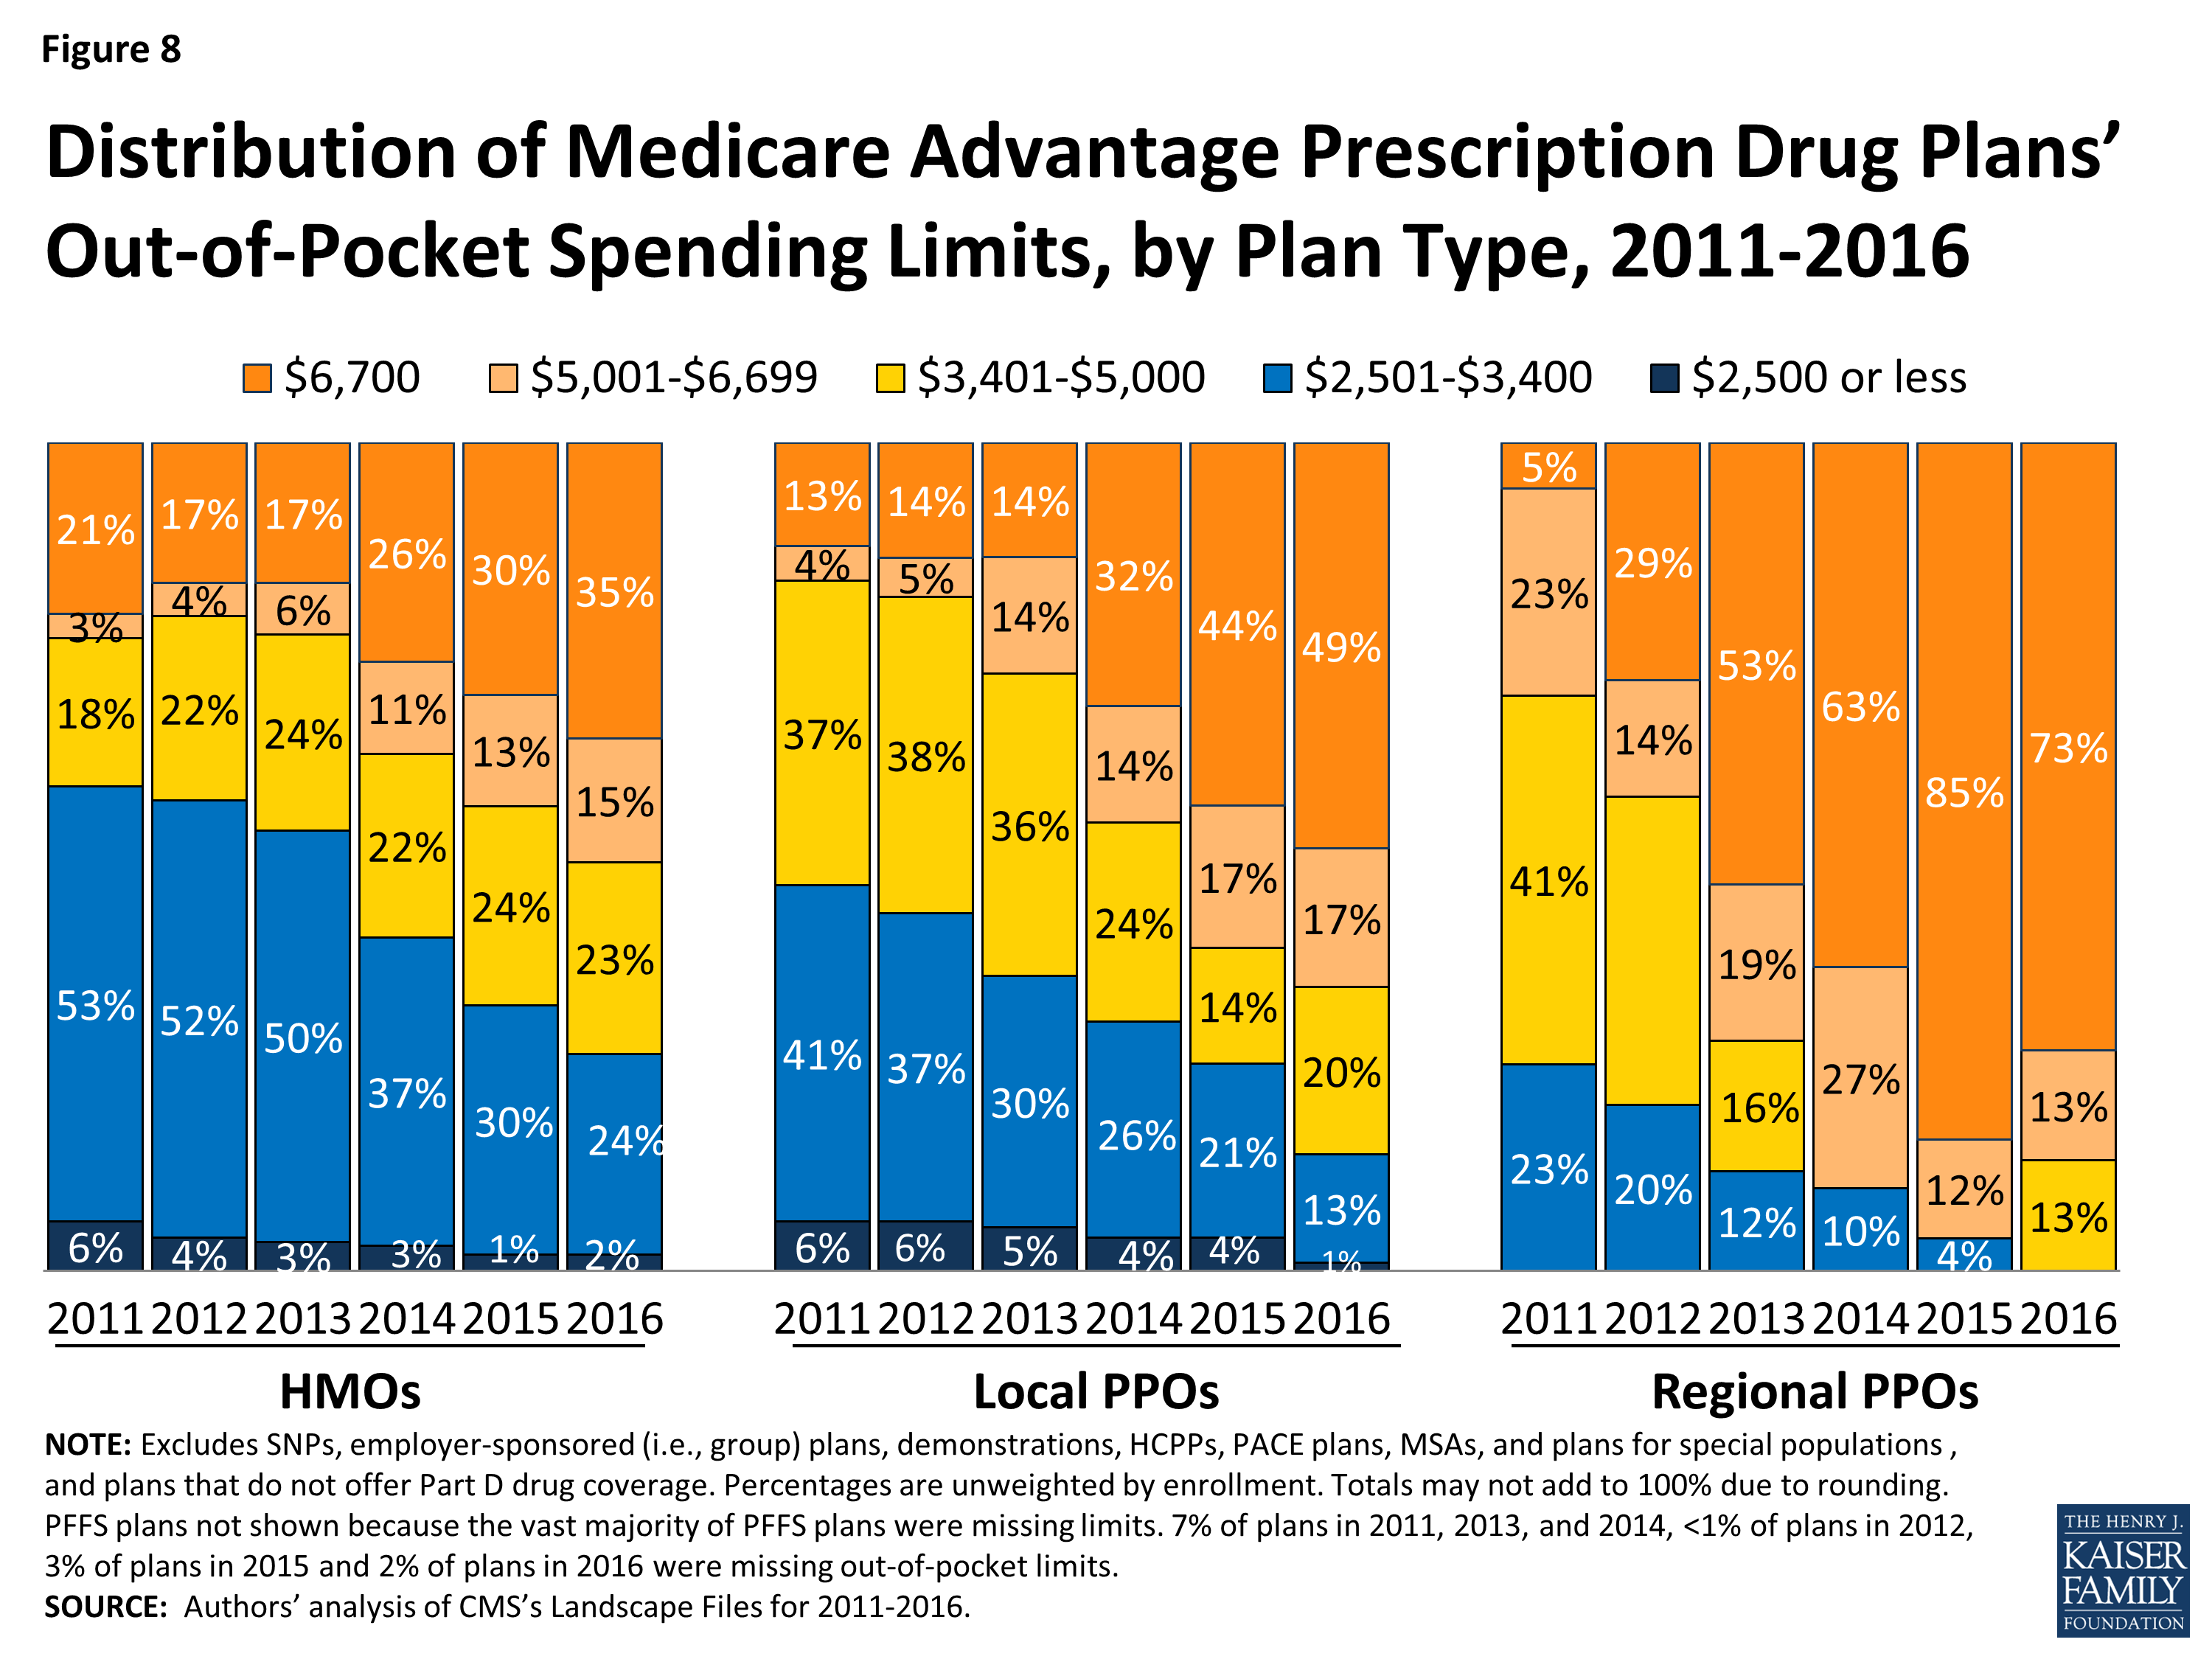
Figure 8: Distribution of Medicare Advantage Prescription Drug Plans’ Out-of-Pocket Spending Limits, by Plan Type, 2011-2016
Prescription Drug Coverage
In 2016, the vast majority (87%) of Medicare Advantage plans will offer prescription drug coverage. Historically, Medicare Advantage plans without a drug benefit were developed to meet the needs of beneficiaries who may have access to other sources of prescription drug coverage, such as retiree health coverage from former employers or the Veterans Health Administration, as well as those who for any other reason do not want to purchase such coverage.
Coverage of the Part D Deductible
The standard design of the drug benefit includes an initial coverage deductible which is updated each year, and is $360 in 2016. Plans can vary the benefit design as long as they provide cost-sharing that is at least actuarially equivalent to the standard benefit.
In 2016, nearly half (45%) of MA-PDs will impose a deductible for prescription drug coverage. Since 2013, the share of MA-PDs imposing a Part D deductible has increased three-fold from 14 percent to 45 percent while average MA-PD deductibles have quadrupled from $29 in 2013 to $118 in 2015 (Figure 9). Similar to 2015, 16 percent of MA-PDs will charge the maximum deductible in 2016 ($360 in 2016 compared to $320 in 2015).
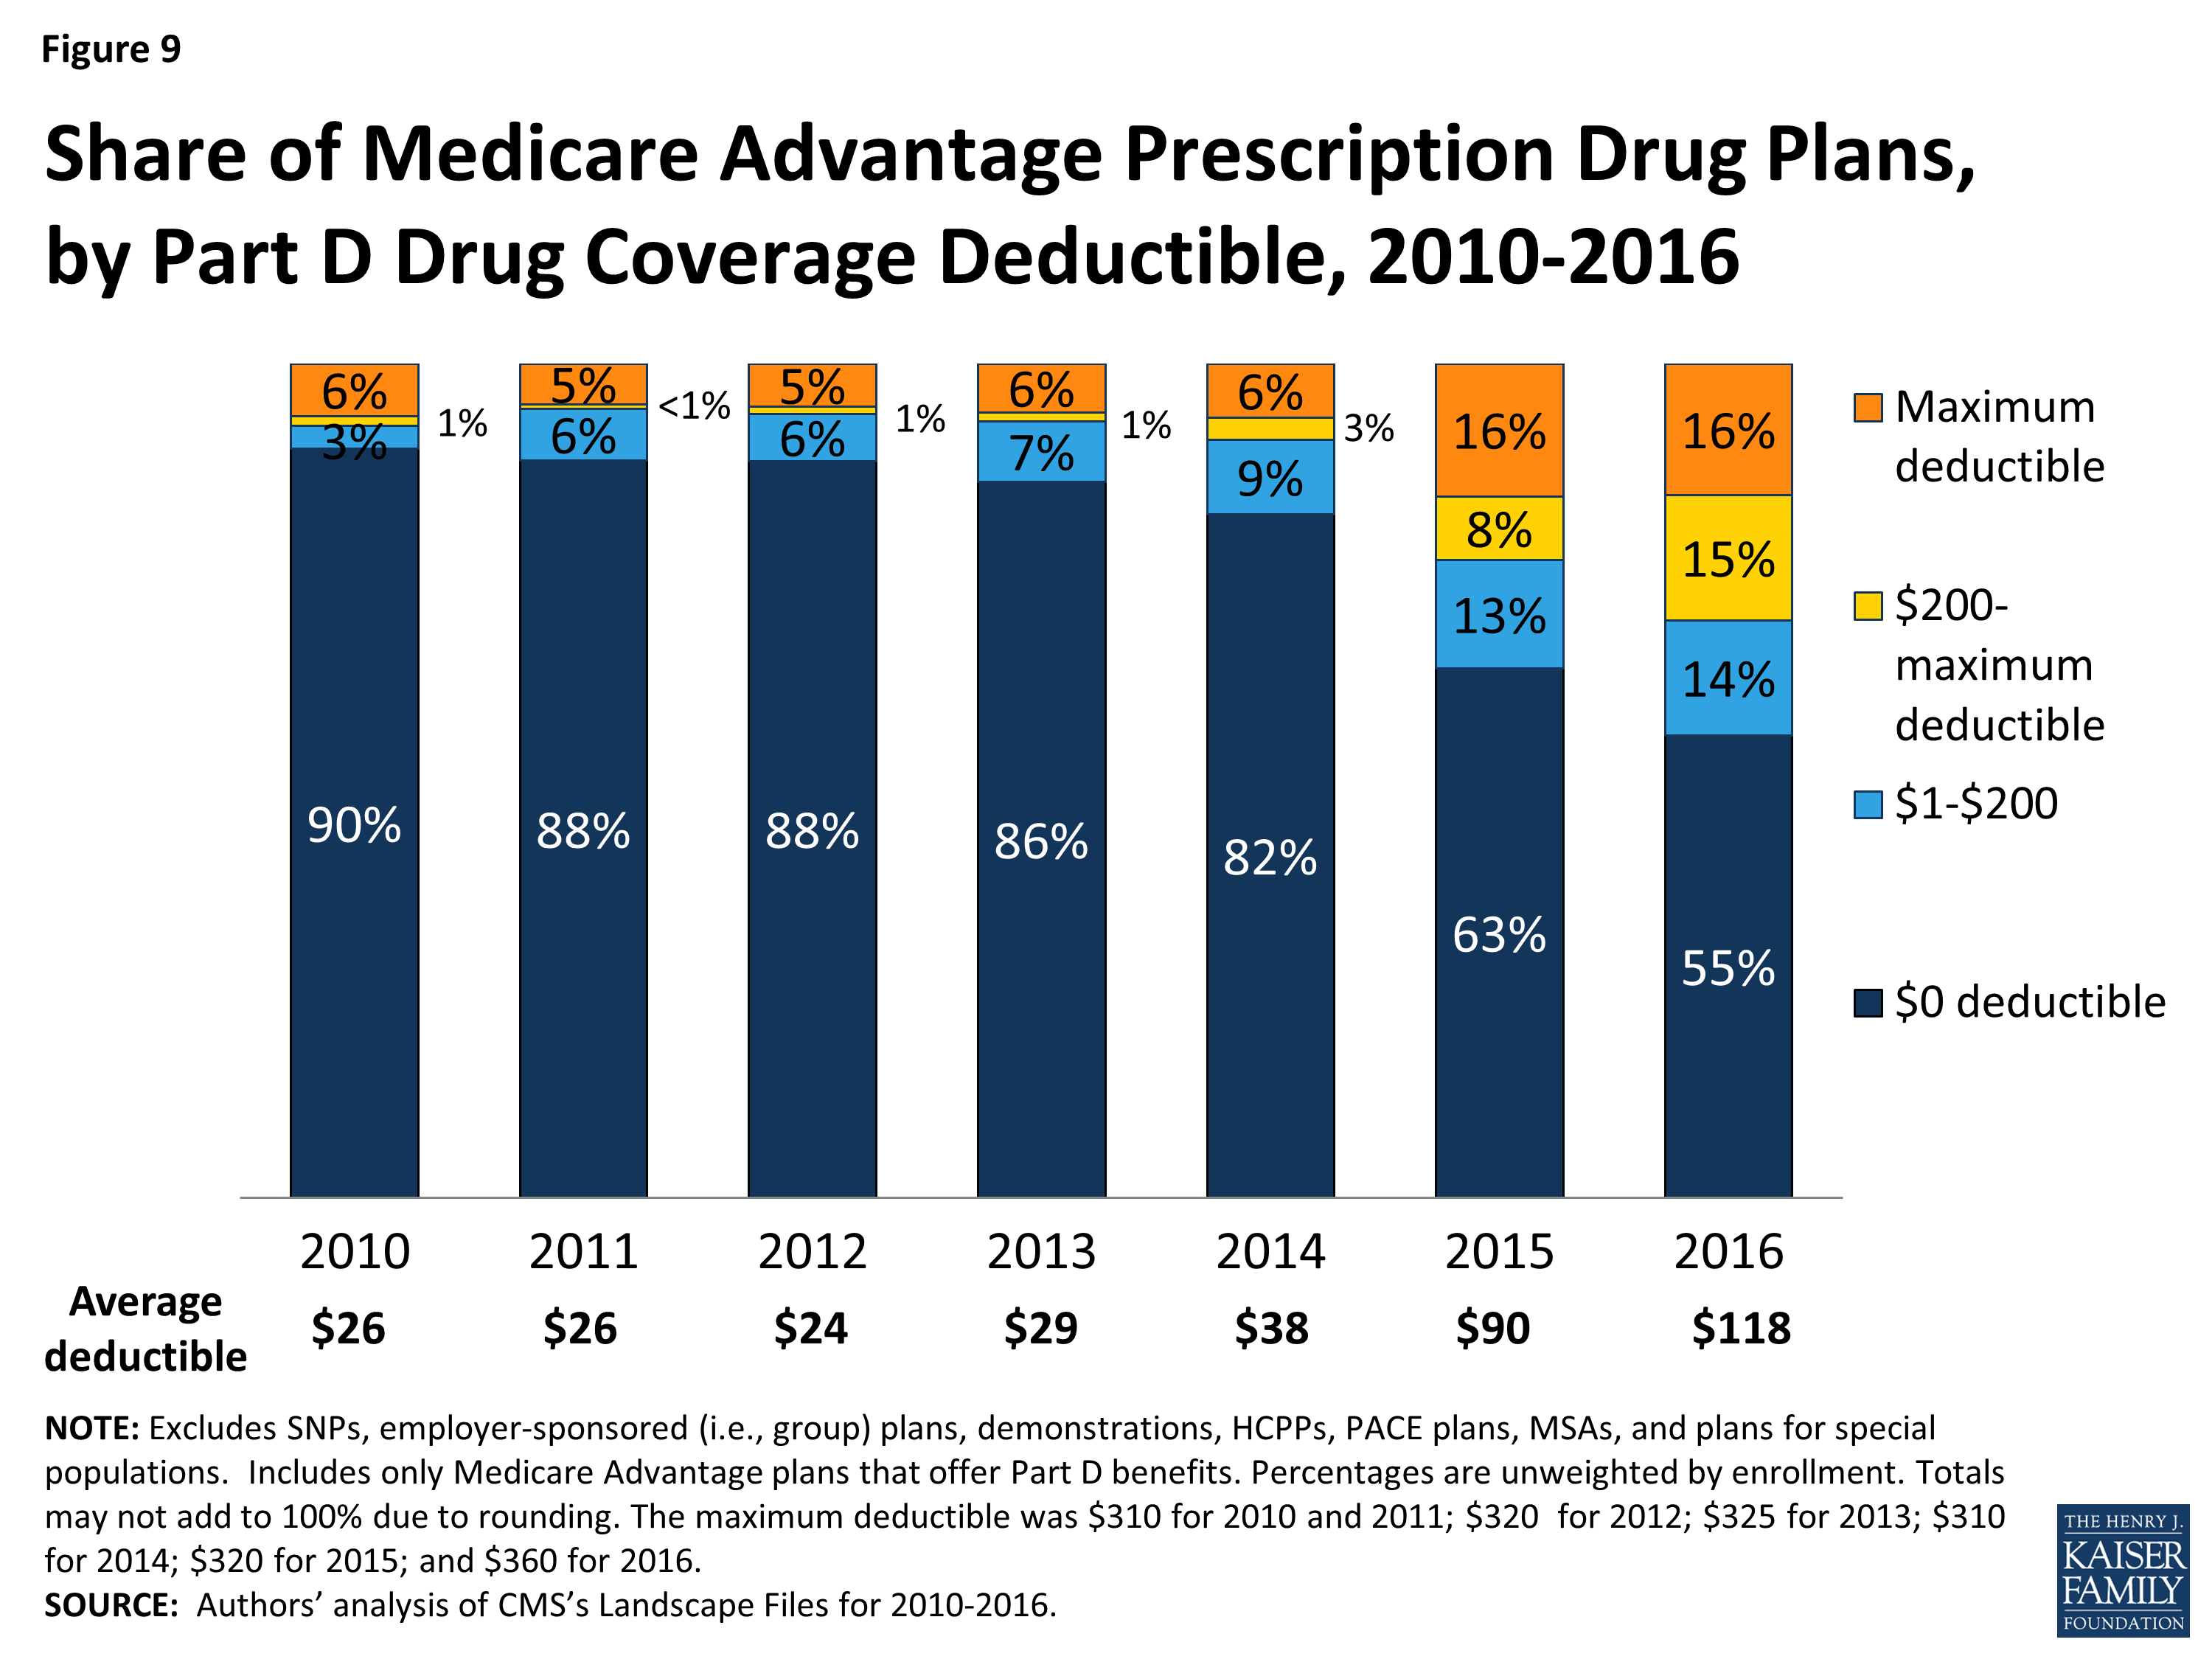
Figure 9: Share of Medicare Advantage Prescription Drug Plans, by Part D Drug Coverage Deductible, 2010-2016
MA-PDs are better situated than stand-alone prescription drug plans (PDPs) to offset the costs of drugs with other benefits because they combine Part D with other Medicare-covered benefits. The use of Part D deductibles is increasing among MA-PDs, although they still are used more commonly by stand-alone PDPs. In 2016, two-thirds of PDPs will charge a deductible, and a larger share of PDPs than MA-PDs will charge the maximum amount allowed.1 Further research is needed to assess how cost sharing between MA-PDs and PDPs varies and whether the two types of plans generally include the same drugs on the same formulary tier, as this has cost implications for beneficiaries.
Coverage within the “Doughnut Hole”
The initial design of the Medicare drug benefit in 2006 included a coverage gap, or “doughnut hole,” which required beneficiaries with relatively high drug costs to pay 100 percent of their expenses in the coverage gap until they qualified for catastrophic protection. The ACA gradually closes the doughnut hole and eliminates the gap by 2020. In 2016, beneficiaries will be responsible for no more than 45 percent of the cost of brand-name drugs and 58 percent of the cost of generic drugs in the gap.
Less than half (44%) of MA-PDs will provide additional coverage in the Part D coverage gap in 2016, beyond that which is required by the ACA, similar to 2015 and down from 50 percent in 2014 (Figure 10). In contrast, less than one-quarter of PDPs offer any additional coverage in the gap.2 Little is known about the extent of additional coverage MA-PDs provide in the gap, or whether the additional coverage is for only a handful of drugs or is more extensive.
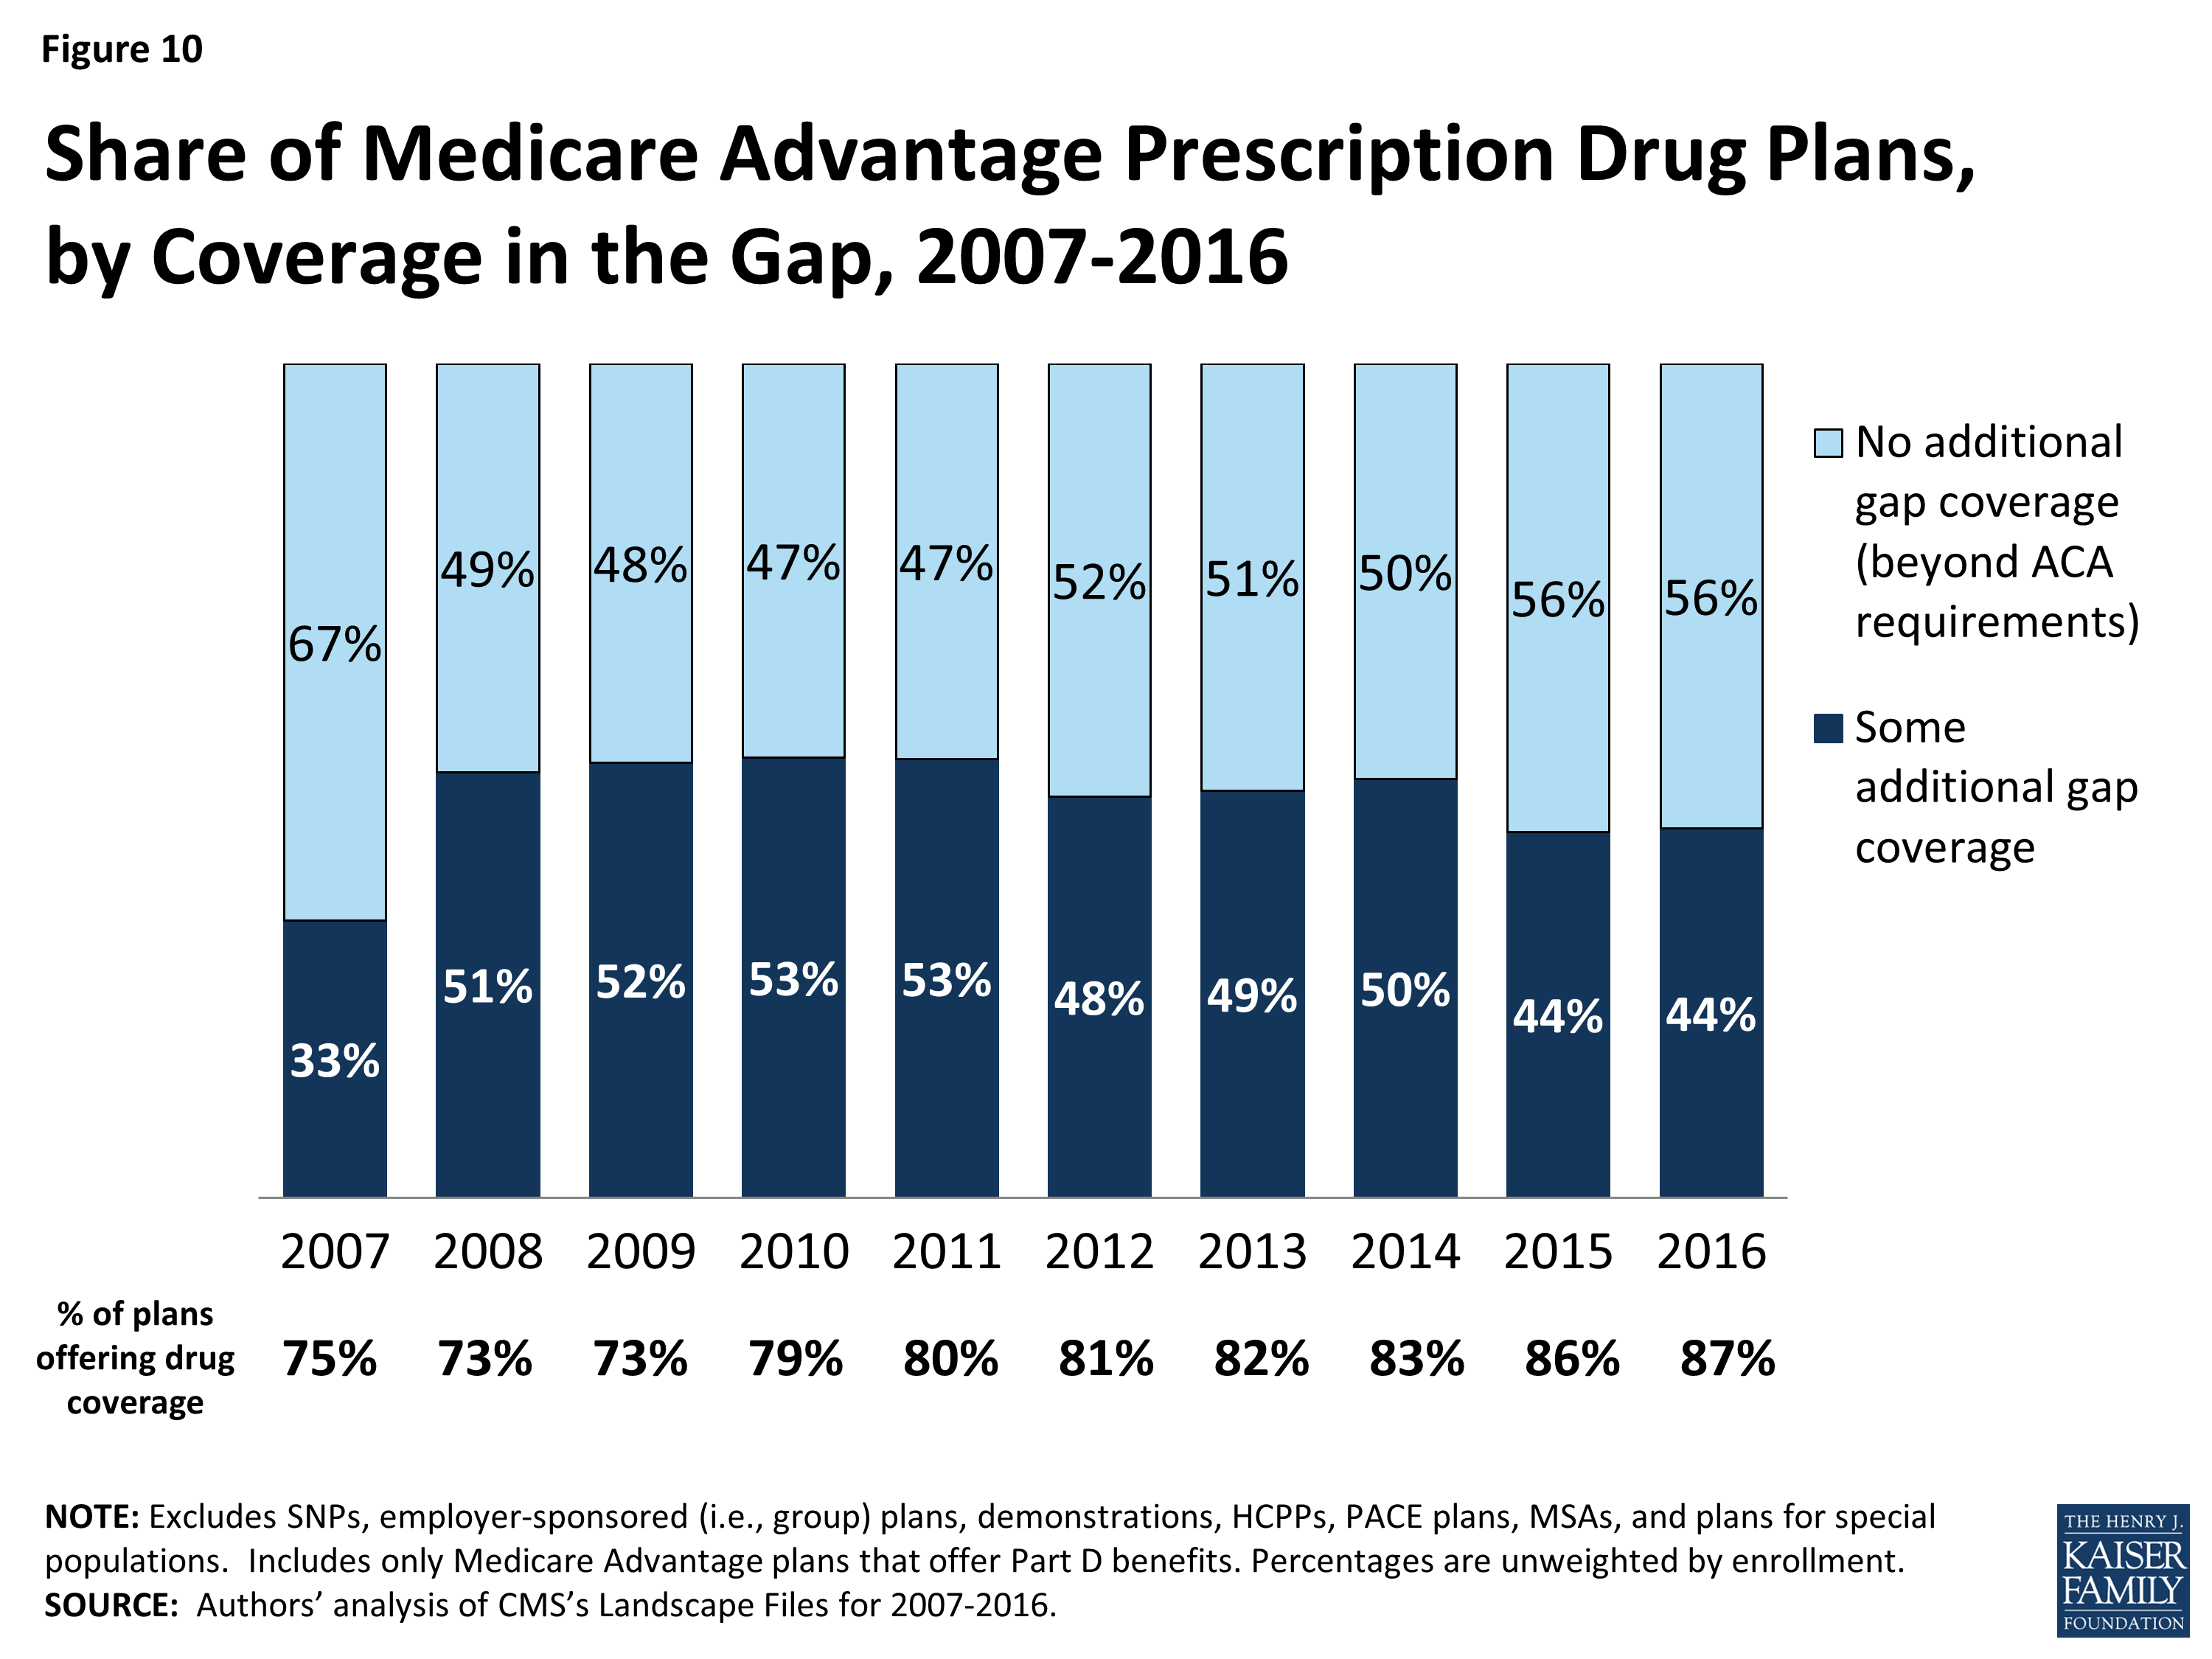
Figure 10: Share of Medicare Advantage Prescription Drug Plans, by Coverage in the Gap, 2007-2016
Quality Ratings
For many years, the CMS has posted quality ratings of Medicare Advantage plans to provide Medicare beneficiaries with additional information about plans offered in their area. All Medicare Advantage plans are rated on a 1 to 5 star scale, with 1 star representing poor performance, 3 stars representing average performance, and 5 stars representing excellent performance. CMS assigns quality ratings at the contract level, rather than for each individual plan. This means that every Medicare Advantage plan covered under the same contract receives the same quality rating, and most contracts cover multiple plans.
Since 2012, Medicare Advantage plans have received bonus payments based on the quality ratings, and plans with higher ratings also receive higher rebate amounts. In 2016, plans with 4 or more stars will receive bonuses of 5 percent, and new plans and plans with low enrollment will receive bonuses of 3.5 percent; these bonus percentages are doubled in some counties.1 Additionally, beneficiaries can enroll in a plan with 5 stars at any time during the year, not just during the annual open enrollment period.
In 2016, the majority (40%) of Medicare Advantage contracts will have ratings of four or more stars – an increase from 33 percent in 2015 (Figure 11). In 2016, as in prior years, few contracts (4%) receive the top star rating (5 stars), a slight increase from 2 percent of contracts in 2015. The vast majority of Medicare beneficiaries (94%) will have access to at least one plan with four or more stars in 2016, including one-quarter (24%) of beneficiaries who will have access to a plan with five stars (data not shown).
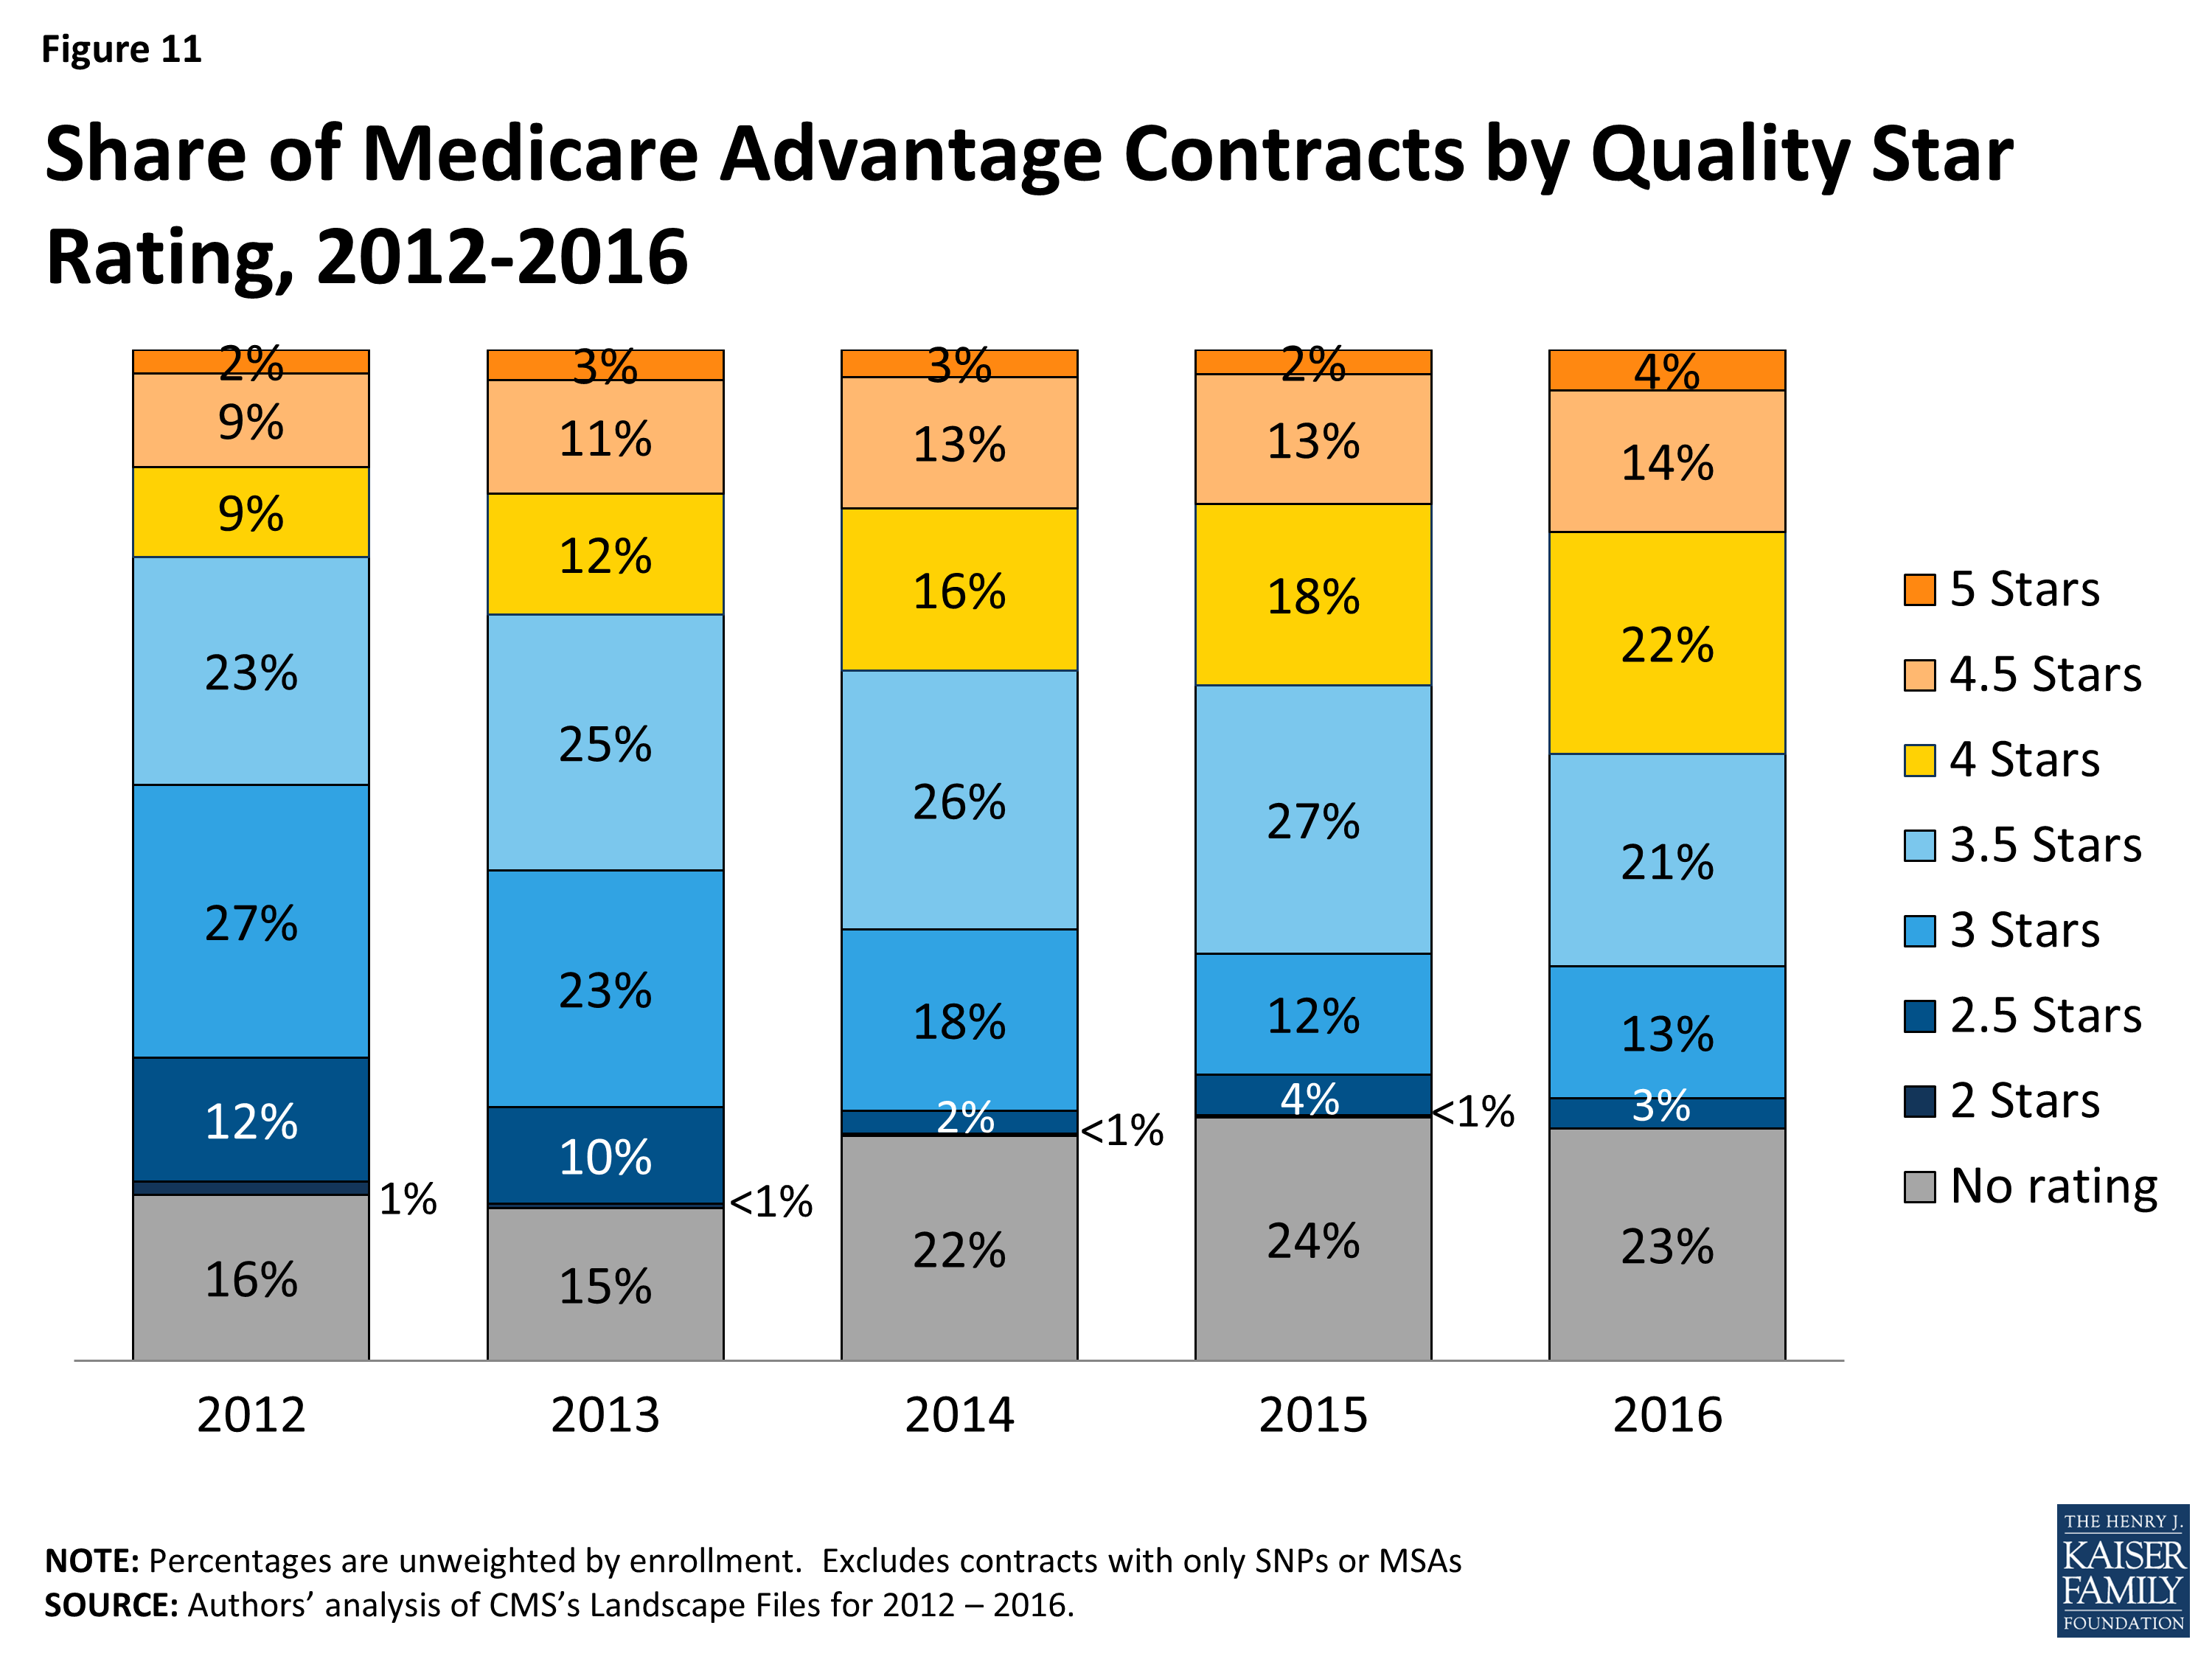
Figure 11: Share of Medicare Advantage Contracts by Quality Star Rating, 2012-2016
Slightly more than one-third (35%) of contracts will have average ratings (3 or 3.5 stars), and 3 percent of contracts will have below average ratings (2 or 2.5 stars) in 2015; 23 percent of contracts will be too new or have too few enrollees to be rated.
Market Structure: Plan Availability and Characteristics of Plans Offered by Major Firms
While many organizations offer Medicare Advantage plans, a handful of firms and affiliates have historically accounted for the majority of all Medicare Advantage enrollment nationally. This spotlight examines trends among and across these firms and affiliates that account for large shares of Medicare Advantage enrollment nationally: UnitedHealthcare, Humana, Blue Cross and Blue Shield (BCBS) affiliated companies (including Anthem BCBS plans), Kaiser Permanente, Aetna, Cigna, and Wellcare. Together, these seven firms and affiliates accounted for almost three-quarters of all Medicare Advantage enrollment in 2015.1 The potential impact of proposed mergers between some of these large firms (Aetna’s proposed acquisition of Humana and Anthem’s proposed acquisition of Cigna) is not yet clear.
Change in Number and Availability of Plans Offered by Firm
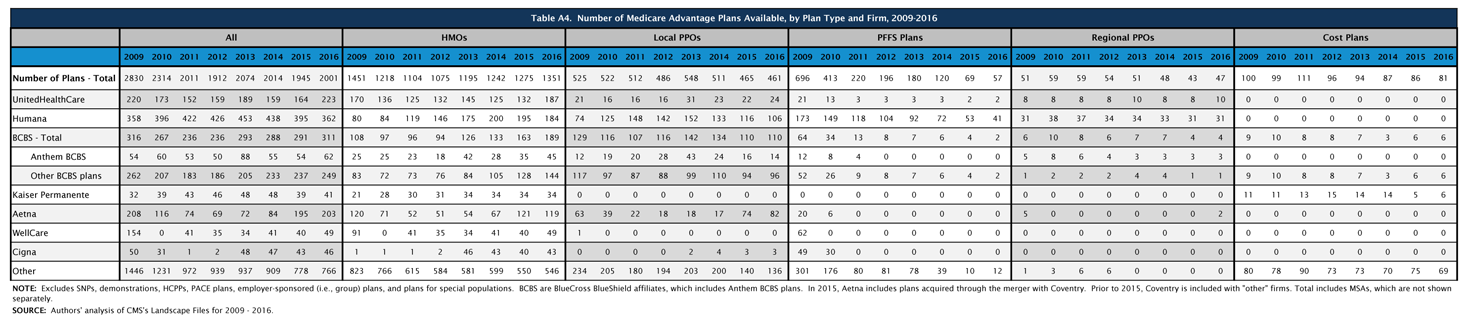
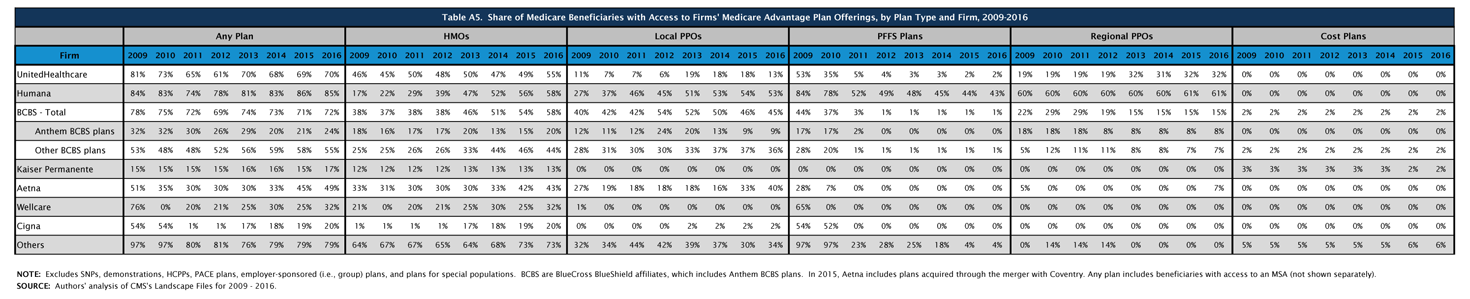
The firms and affiliates profiled in Table A4 account for 61 percent of available plans being offered in 2016 (Table A4). The types of plans offered vary across these firms and affiliates. Firm strategies are reflected both in the types of plans they offer and the share of beneficiaries to whom they are available (Figure 12; Table A5). This analysis focuses only on plans offered for broad based individual enrollment, and excludes special needs plans, employer-sponsored group plans for retirees and other types of plans only available to certain beneficiaries.
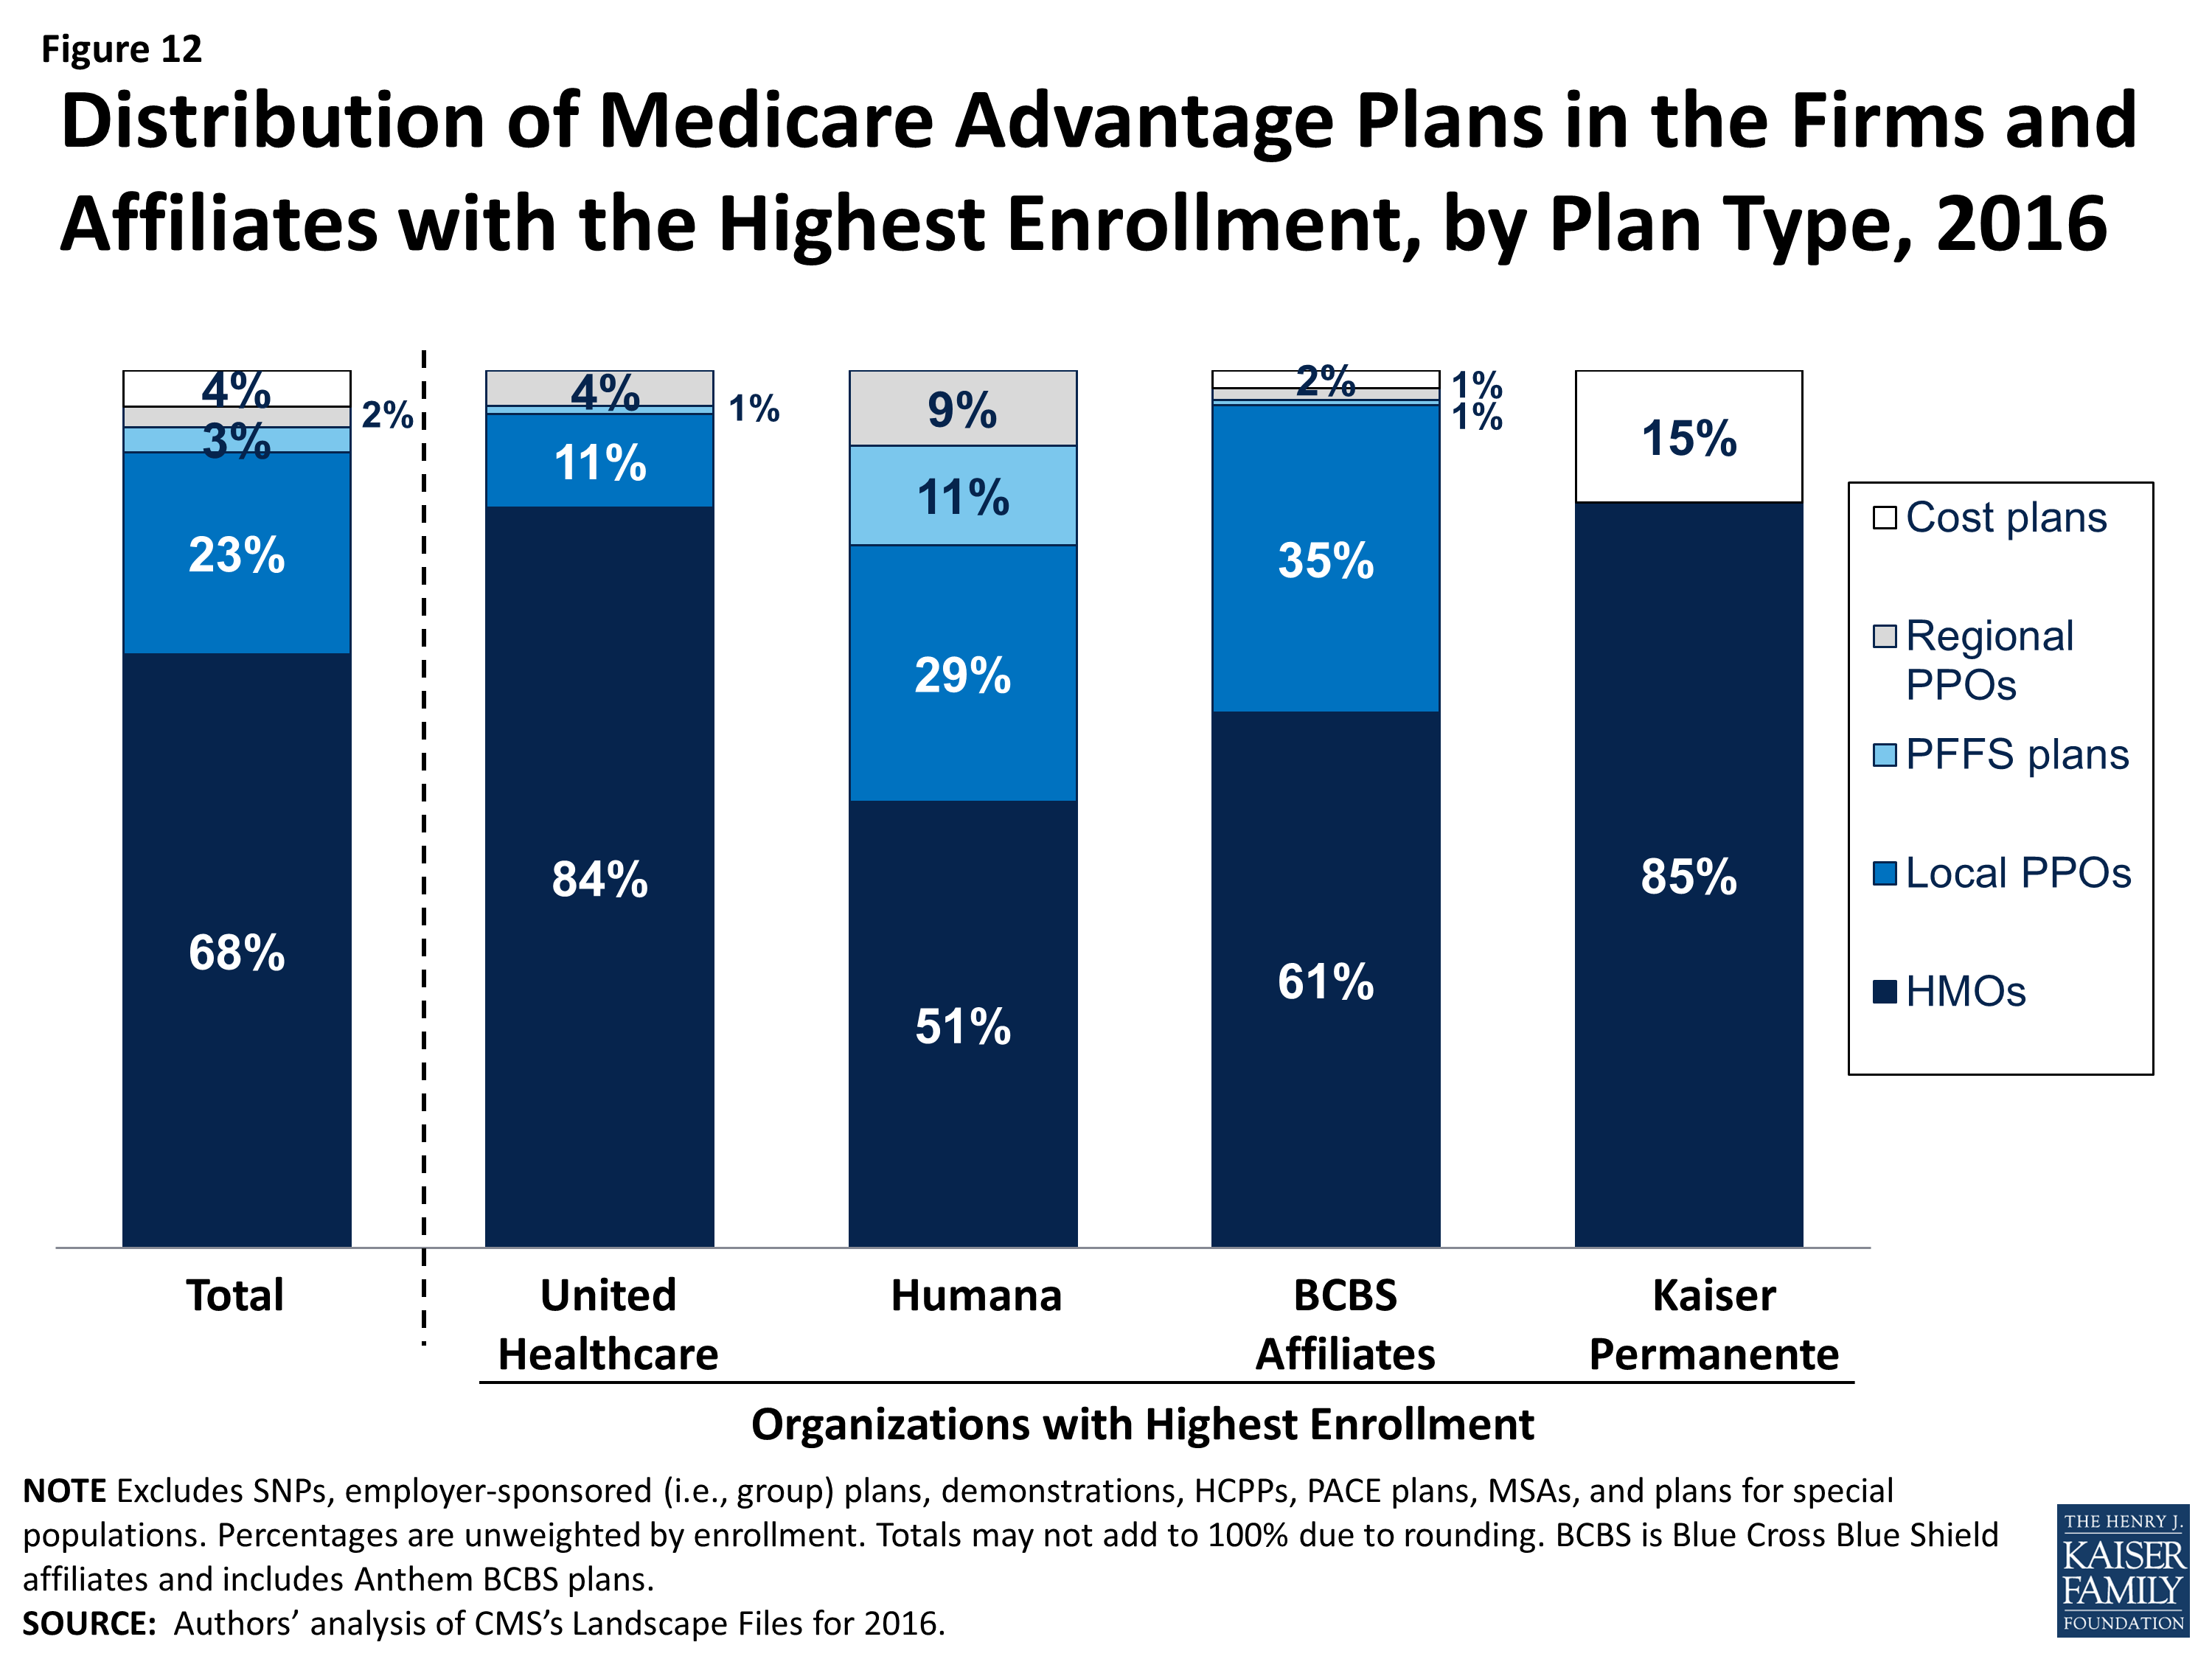
Figure 12: Distribution of Medicare Advantage Plans in the Firms and Affiliates with the Highest Enrollment, by Plan Type, 2016
UnitedHealthcare. UnitedHealthcare has historically had a large Medicare Advantage footprint and it will continue to do so in 2016. Seven in ten Medicare beneficiaries (70%) will have access to a UnitedHealthcare plan in 2016. UnitedHealthcare has historically offered a mix of plan types, but HMOs comprise the vast majority (84%) of its plan offerings, with a smaller share local PPOs (11%), regional PPOs (5%) and PFFS plans (1%). More than half of beneficiaries (55%) will have access to a UnitedHealthcare HMO in 2016, up from 50 percent of beneficiaries in 2015. Average premiums (not weighted by enrollment) in HMOs offered by UnitedHealthcare will decline between 2015 and 2016, while premiums for the firm’s local PPOs, PFFS plans, and regional PPOs will increase (Table A6). This is a slight reversal of the firm’s strategy in 2015 when it introduced premiums across most of its plans that previously had zero-premiums. In early 2015, 20 percent of Medicare Advantage enrollees were in a UnitedHealthcare plan.2
Humana. Humana also has had a large footprint in Medicare Advantage for over a decade, and Medicare Advantage likewise comprises a large share of Humana’s business. Humana will continue to offer a broader mix of plan types than any other large firm or affiliate in 2016, but the total number of plans the firm offers will decline from 395 plans to 362 plans, continuing the firm’s trend of offering fewer plans each year since 2013. Similar to prior years, about half (51%) of Humana’s plans will be HMOs, about three in ten will be local PPOs (29%), and about one in ten will be PFFS plans (11%) or regional PPOs (9%). The vast majority of Medicare beneficiaries (85%) will have access to a plan offered by Humana in 2016, similar to 2015. HMOs, local PPOs, and regional PPOs offered by Humana will be available to more than half of beneficiaries (58%, 53%, and 61%, respectively) and Humana PFFS plans will be available to more than four in ten beneficiaries (43%). Average premiums (not weighted by enrollment) for local PPOs offered by Humana will decline between 2015 and 2016, while average premiums for other plan types offered by Humana will increase, with the largest average increases in premiums among PFFS plans. In early 2015, 19 percent of Medicare Advantage enrollees were in a Humana plan.
Blue Cross and Blue Shield Affiliates (BCBS). BCBS affiliates are separate companies that do not directly compete with each other and are affiliated nationally.3 Some have converted from non-profit to for-profit status in recent years, most notably Anthem BCBS. We analyze the BCBS affiliates together because the affiliation results in some similarities in approach. In 2016, more than six in ten of BCBS affiliates’ Medicare Advantage offerings will be HMOs (61%) while 35 percent will be local PPOs. Nearly three out of four beneficiaries nationwide (72%) will have access to a BCBS affiliated plan, including almost one-quarter (24%) who will have with access to an Anthem BCBS plan and 55 percent who will have access to plans offered by other companies under the BCBS trademark. In early 2015, 3 percent of Medicare Advantage enrollees were in an Anthem plan, including Anthem BCBS plans, and another 13 percent were in plans offered by other BCBS affiliates.
Kaiser Permanente. Similar to prior years, fewer beneficiaries (17%) will have access to a Kaiser Permanente plan than other firms included in this analysis. Kaiser Permanente has historically been geographically concentrated in California, Colorado, Georgia, Hawaii, Oregon, Washington, and the metropolitan area surrounding the District of Columbia, but its plans tend to have many enrollees in the places in which it operates. In contrast to other firms, Kaiser Permanente only offers HMOs (83%) and cost plans, which are somewhat similarly structured. Only 13 percent of beneficiaries will have access to a Kaiser Permanente HMO and only 2 percent of beneficiaries will have access to a Kaiser Permanente cost plan in 2016. In early 2015, 8 percent of Medicare Advantage enrollees were in a plan offered by Kaiser Permanente.
Aetna. Aetna’s footprint in the Medicare Advantage market has expanded since its acquisition of Coventry, and will become even larger if its proposed acquisition of Humana is approved by the Department of Justice. In 2016, Aetna plans will be available to almost half (49%) of all beneficiaries, up slightly from 45 percent in 2015 and 33 percent in 2014 prior to the acquisition of Coventry. Between 2015 and 2016, Aetna will increase the number of local PPOs it offers, rising from 74 plans in 2015 to 82 plans in 2016. Accordingly, a larger share of beneficiaries will have access to an Aetna local PPO (40%) in 2016, up from one-third (33%) of beneficiaries in 2015. Beginning in 2016, Aetna will begin offering regional PPOs in New Jersey and Ohio, and 7 percent of beneficiaries nationwide will have access to these new regional PPOs in 2016. In prior years, the only firms and affiliates that offered regional PPOs were UnitedHealthcare, Humana, and BCBS affiliates. In early 2015, 7 percent of Medicare Advantage enrollees were in a plan offered by Aetna.
Other Firms. About one-third (32%) and one-fifth (20%) of beneficiaries will have access to a plan offered by Wellcare and Cigna, respectively. Both firms heavily emphasize HMOs, with Wellcare exclusively offering HMOs and Cigna offering predominantly HMOs. Wellcare will increase the number of HMOs it offers from 40 plans in 2015 to 49 plans in 2016; Cigna will slightly increase the number of HMOs it offers by 3 plans, increasing from 40 plans in 2015 to 43 plans in 2016.
Beyond these firms, many other firms and organizations sponsor Medicare Advantage plans, usually in limited geographical markets. Taken together, these firms provide plan options to 79 percent of beneficiaries.
Discussion
Plan choices for beneficiaries will be relatively stable between 2015 and 2016, with very little change in the number or type of plans available to beneficiaries or the firms offering those plans. In 2016, there will be relatively few plan exits that could cause disruption in coverage. Firms continue to offer diverse products and most beneficiaries have a choice of HMOs and PPOs, while fewer beneficiaries have access to PFFS plans. Medicare Advantage plans’ low premiums (relative to Medigap) and their ability to package traditional Part A and B benefits, prescription drugs, and some aspects of supplemental coverage into a single offering have proven popular both with insurers and a sizeable subgroup of Medicare beneficiaries.
Medicare beneficiaries enrolling in a Medicare Advantage plan will find that the plans available to them, on average, have somewhat higher quality ratings in 2016 than in 2015 but provide less financial protection with higher out-of-pocket costs. While premiums are rising at a somewhat slow rate, a higher share of plans will set their out-of-pocket limit for Part A and B benefits at the maximum amount allowed ($6,700), with few plans setting the limit at the lower standard encouraged by CMS ($3,400). Additionally, more plans are requiring enrollees to pay a deductible for Part D drugs, exposing Medicare beneficiaries with relatively high health care costs to greater financial risk. The reality is that both traditional Medicare and Medicare Advantage plans face challenges in providing financial protection to beneficiaries, in that traditional Medicare does not have an out-of-pocket limit for Part A and Part B covered services.
The Department of Justice is considering proposed mergers among some of the leading national firms in the Medicare Advantage market—Aetna’s proposed acquisition of Humana and Anthem’s proposed acquisition of Cigna. While the four firms’ products differ from one another, their combined share of the Medicare Advantage market means that the acquisitions could have important implications for the Medicare Advantage program. Aetna and Humana together account for about one-quarter (26%) of all Medicare Advantage enrollees, while Anthem and Cigna together account for about six percent of all enrollees in 2015.1
The potential effect of the proposed acquisitions on Medicare beneficiaries is not yet clear. For the individual Medicare Advantage market which we focus on here, mergers may affect the number of plan choices available to beneficiaries if the merging firms decide to consolidate plans, but divestiture requirements could offset some of this reduction. Mergers could also reduce the number of different firms offering plans and competing for enrollees, and this effect is likely to vary across the country. While the average beneficiary in 2016 will have plan choices offered by six firms, one-quarter of all beneficiaries in 2016 will have only three firms competing for their business. While mergers will affect the national marketplace, they also have very specific effects on individual markets that require analysis that anticipates the potential short and long term consequences, as well as any related effects on the characteristics of plans that are offered, and implications for beneficiaries’ costs and access.2
Gretchen Jacobson, Tricia Neuman, and Giselle Casillas are with the Kaiser Family Foundation; Anthony Damico is an independent consultant; and Marsha Gold is a Senior Fellow Emeritus with Mathematica Policy Research and independent consultant.
Appendix
| Box 1: Availability of Special Needs Plans in 2016 |
| Special Needs Plans (SNPs) are a type of Medicare Advantage plan that was authorized in 2003 as part of the Medicare Prescription Drug, Improvement and Modernization Act (MMA) to provide a managed care option for beneficiaries with significant or relatively specialized health care needs. Medicare beneficiaries can enroll in a SNP if they are dually eligible for Medicare and Medicaid (D-SNPs), require an institutional-level of care (I-SNPs), or have a severe or chronic condition (C-SNP). Most SNPs are HMOs, but they can also be PPOs.
When SNPs were authorized, there were few requirements beyond those otherwise required of other Medicare Advantage plans. The Medicare Improvements for Patients and Providers Act (MIPPA) of 2008 established additional requirements for SNPs, including requiring all SNPs to provide a care management plan to document how care would be provided for enrollees and requiring C-SNPs to limit enrollment to beneficiaries with specific diagnoses or conditions. As a result of the MIPPA requirements, the number of SNPs declined in 2010. The ACA required D-SNPs to have a contract with the Medicaid agency for every state in which the plan operates, beginning in 2013. Additionally, in 2013, joint federal-state financial alignment demonstrations to improve the coordination of Medicare and Medicaid for dually eligible beneficiaries began to enroll beneficiaries. Today, financial alignment demonstrations are underway in 12 states: California, Colorado, Illinois, Massachusetts, Michigan, Minnesota, New York, Ohio, South Carolina, Texas, Virginia, and Washington. The financial alignment demonstrations could influence the availability of D-SNPs in these states, either increasing or decreasing the availability of SNPs, depending on the design of the demonstration. In 2016, 550 SNPs will be available, similar to 548 plans available in 2015 (Figure 13; Table A7). The availability of SNPs will continue to vary across states in 2016, as it has in prior years. In 2016, at least one SNP of any type will be available in all states but eight (AK, IA, NE, ND, RI, SD, VT, and WY). While Montana did not have SNPs available in 2015, 1 new D-SNP will be available in Montana in 2016, and similarly while New Hampshire did not have SNPs available in 2015, 1 new I-SNP will be available in the state in 2016. In Iowa, Nebraska, and Rhode Island, SNPs were available in 2015 but will not be available in these states in 2016. As in past years, SNPs will be most numerous in selected high population states, notably Florida (94 plans), California (72 plans), and New York (53 plans). The total number of D-SNPs will slightly increase from 339 plans to 342 plans between 2015 and 2016, with some variation across states. In Florida, the number of D-SNPs increased from 49 plans in 2015 to 58 plans in 2016. Other states will experience smaller changes in the availability of D-SNPs. Notably, states with ongoing financial alignment demonstrations to improve the coordination of Medicare and Medicaid for dual eligibles will not see large changes, if any, in the number of available D-SNPs between 2015 and 2016. The total number of C-SNPs will decline from 152 plans in 2015 to 139 plans in 2016, and the total number of I-SNPs will increase from 57 plans in 2015 to 69 plans in 2016. With the exception of Florida where the number of C-SNPs will decrease from 39 plans to 30 plans, no states will experience large changes in the availability of C-SNPs and I-SNPs between 2015 and 2016. Similar to prior years, most C-SNPs (66%) will focus on diabetes, chronic heart failure, or cardiovascular disorders. |
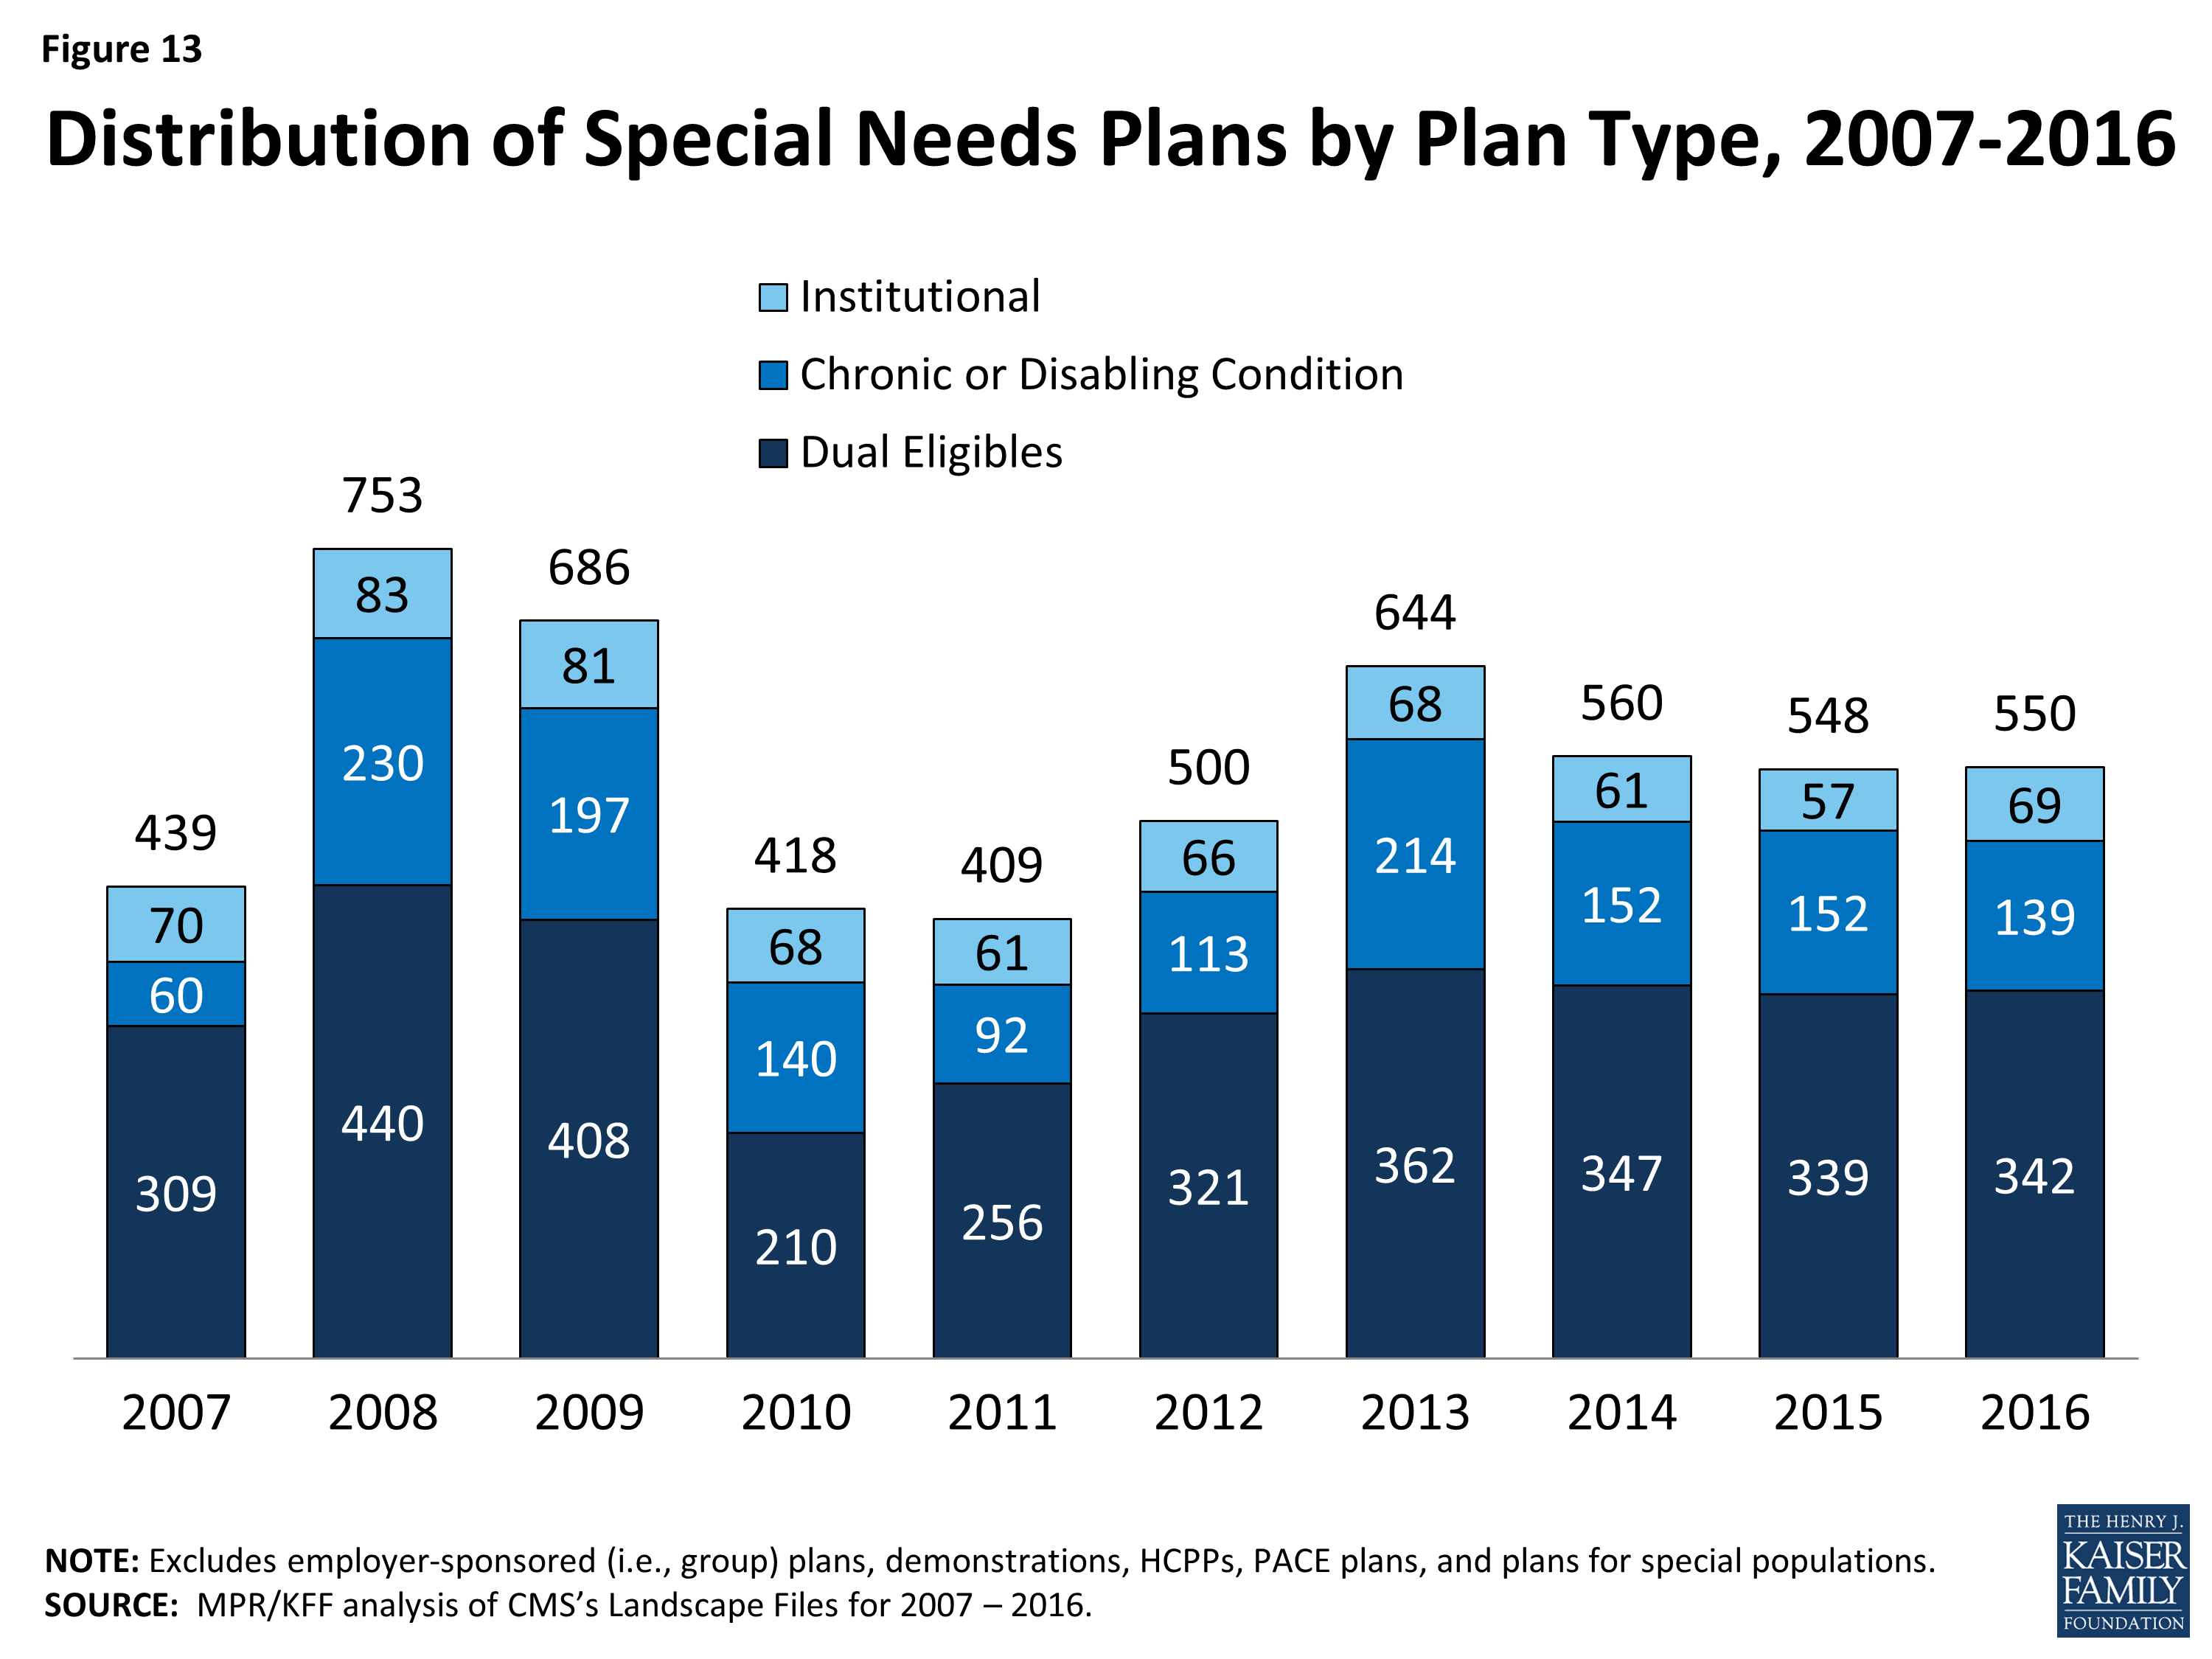
Figure 13: Distribution of Special Needs Plans by Plan Type, 2007-2016
| Table A1. Medicare Advantage Plan Market Entries and Exits, Average Monthly Premiums and Average Out-of-Pocket Spending Limits for Medicare Advantage Prescription Drug plans (MA-PDs), Weighted by 2015 Enrollment, 2015-2016 | |||||||
| All Medicare Advantage Plans (MA-PD and MA-only plans) | All plans | HMO | Local PPO | PFFS | Regional PPO | Cost | MSA |
| 2015 Plan Total | 1,945 | 1,275 | 465 | 69 | 43 | 86 | 7 |
| Total number of staying plans | 1,742 | 1,151 | 413 | 55 | 43 | 79 | 1 |
| Number of staying plans with no service area reductions | 1,565 | 983 | 365 | 33 | 43 | 76 | 1 |
| Number of staying plans with reduced service areas | 111 | 64 | 33 | 14 | – | – | – |
| Number of consolidating plans, post consolidation | 66 | 40 | 15 | 8 | – | 3 | – |
| Total number of departing plans | 203 | 124 | 52 | 14 | – | 7 | 6 |
| Number of plans departing due to consolidation | 78 | 46 | 19 | 10 | – | 3 | – |
| Number of terminating plans | 125 | 78 | 33 | 4 | – | 4 | 6 |
| Number of new plans | 259 | 200 | 48 | 2 | 4 | 2 | 3 |
| 2016 Plan Total | 2,001 | 1,351 | 461 | 57 | 47 | 81 | 4 |
| Total Medicare Advantage enrollees, as of September 2015 | 11,637,572 | 7,988,548 | 1,991,109 | 249,694 | 995,330 | 400,924 | 11,967 |
| Number of staying plans’ enrollees | 11,309,785 | 7,809,203 | 1,865,672 | 239,000 | 995,330 | 399,643 | 937 |
| Number of enrollees losing access to their plan | 327,787 | 179,345 | 125,437 | 10,694 | – | 1,281 | 11,030 |
| Average premiums of MA-PDs, weighted by 2015 enrollment | |||||||
| Premiums for all plans, 2015 | $37.63 | $27.94 | $63.38 | $51.75 | $31.49 | $110.23 | N/A |
| Terminating plans, 2015 | $40.57 | $26.19 | $63.41 | $53.66 | N/A | $58.26 | N/A |
| Staying plans, 2015 | $37.54 | $27.98 | $63.37 | $51.67 | $31.49 | $110.39 | N/A |
| 2016 Premiums for remaining 2015 plans | $40.63 | $30.51 | $68.36 | $58.14 | $33.59 | $116.26 | N/A |
| Change in premiums for plans available in both 2015 and 2016 | $3.09 | $2.52 | $4.98 | $6.47 | $2.10 | $5.86 | N/A |
| Share of enrollees in MA-PDs with no premiums, among plans available in both 2015 and 2016 | |||||||
| 2015 | 48% | 59% | 19% | 8% | 45% | 1% | N/A |
| 2016 | 46% | 56% | 19% | 6% | 45% | 1% | N/A |
| Change in share of plans with no premiums | -2% | -3% | 0% | -1% | 0% | 0% | N/A |
| Average premiums paid per enrollee, among MA-PDs with premiums (excluding zero premium plans) and available in both 2015 and 2016 | |||||||
| 2015 | $72.25 | $68.30 | $77.96 | $55.96 | $57.47 | $111.76 | N/A |
| 2016 | $75.39 | $69.75 | $84.13 | $62.02 | $61.30 | $117.69 | N/A |
| Average out-of-pocket spending limits per year among MA-PDs, weighted by 2015 enrollment, among plans available in both 2015 and 2016 | |||||||
| 2015 | $5,043 | $4,850 | $5,257 | N/A | $6,651 | $3,280 | N/A |
| 2016 | $5,235 | $5,010 | $5,688 | N/A | $6,619 | $3,531 | N/A |
| Change in average out-of-pocket spending limits | $193 | $160 | $431 | N/A | -$32 | $251 | N/A |
| Total MA-PD enrollees, as of September 2015 | 11,038,587 | 7,819,071 | 1,956,315 | 173,839 | 889,195 | 200,167 | – |
| Number of staying MA-PDs’ enrollees | 10,729,142 | 7,644,846 | 1,831,671 | 164,544 | 889,195 | 198,886 | – |
| Number of enrollees losing access to their MA-PD | 309,445 | 174,225 | 124,644 | 9,295 | – | 1,281 | – |
|
NOTE: Excludes Special Needs Plans (SNPs), demonstrations, Health Care Prepayment Plans (HCPPs), Program of All Inclusive Care for the Elderly (PACE) plans, employer-sponsored (i.e., group) plans, and plans for special populations.
SOURCE: Authors’ analysis of CMS’s Landscape Files for 2015 and 2016 and CMS’s 2015 and 2016 Part C and D Crosswalk file and September 2015 enrollment.
|
|||||||
| Table A2. Average Number of Plans Available to Beneficiaries by County of Residence, 2009-2016 | ||||||||
| 2009 | 2010 | 2011 | 2012 | 2013 | 2014 | 2015 | 2016 | |
| National Average | 48 | 33 | 24 | 20 | 20 | 18 | 18 | 19 |
| Metro counties | 51 | 35 | 26 | 22 | 22 | 20 | 20 | 21 |
| Non-metro counties | 36 | 24 | 16 | 13 | 13 | 11 | 10 | 11 |
| Fee-for-Service Costs, by Quartile | ||||||||
| Lowest cost quartile | 45 | 28 | 18 | 17 | 17 | 17 | 15 | 15 |
| Second quartile | 46 | 31 | 20 | 17 | 16 | 15 | 14 | 15 |
| Third quartile | 44 | 30 | 20 | 17 | 18 | 16 | 16 | 17 |
| Highest cost counties | 53 | 37 | 30 | 24 | 24 | 21 | 22 | 23 |
| NOTE: Excludes SNPs, employer-sponsored (i.e., group) plans, demonstrations, HCPPs, PACE plans, and plans for special populations. SOURCE: Authors’ analysis of CMS’s Landscape and Penetration Files for 2009 – 2016. |
||||||||
| Table A3. Unweighted Average Monthly Premiums for Medicare Advantage Prescription Drug Plans, by Plan Type, 2009-2016 | |||||||||
| 2009 | 2010 | 2011 | 2012 | 2013 | 2014 | 2015 | 2016 | Change, 2015-2016 | |
| All Plans | $51.81 | $55.86 | $50.61 | $49.80 | $51.43 | $51.47 | $53.42 | $52.57 | -$0.85 |
| HMOs | $34.52 | $40.11 | $36.24 | $33.20 | $34.11 | $35.37 | $38.28 | $39.14 | $0.86 |
| Local PPOs | $65.12 | $70.17 | $65.72 | $69.14 | $72.57 | $74.92 | $81.02 | $78.61 | -$2.41 |
| PFFS plans | $74.46 | $75.09 | $65.79 | $70.96 | $83.29 | $90.93 | $87.86 | $91.40 | $3.54 |
| Regional PPOs | $55.68 | $59.29 | $53.38 | $55.64 | $56.89 | $59.30 | $67.85 | $74.93 | $7.08 |
|
NOTE: Excludes SNPs, demonstrations, HCPPs, PACE plans, employer-sponsored (i.e., group) plans, and plans for special populations. Premiums include plans with premiums as well as plans with no premiums. Cost plans are included in the total but are not shown separately.
SOURCE: Authors’ analysis of CMS’s Landscape Files for 2009-2016.
|
|||||||||
|
Table A4. Number of Medicare Advantage Plans Available, by Plan Type and Firm, 2009-2016 |
 |
| click on table to enlarge |
|
Table A5. Share of Medicare Beneficiaries with Access to Firms’ Medicare Advantage Plan Offerings, by Plan Type and Firm, 2009-2016 |
 |
| click on table to enlarge |
| Table A6. Unweighted Average Monthly Premiums for Medicare Advantage Prescription Drug Plans, by Plan Type and Firm, 2015 and 2016 | ||||||||||||
| 2015 | 2016 | |||||||||||
| All | HMOs | Local PPOs | PFFS Plans | Regional PPOs | Cost Plans | All | HMOs | Local PPOs | PFFS Plans | Regional PPOs | Cost Plans | |
| All Plans Combined | $53.42 | $38.28 | $81.02 | $87.86 | $67.85 | $141.09 | $52.57 | $39.14 | $78.61 | $91.40 | $74.93 | $146.14 |
| UnitedHealthCare | $26.59 | $26.23 | $29.62 | $43.00 | $20.17 | N/A | $26.37 | $24.68 | $35.91 | $50.00 | $32.25 | N/A |
| Humana | $47.42 | $18.73 | $73.09 | $93.90 | $87.29 | N/A | $46.90 | $19.99 | $71.44 | $99.58 | $88.88 | N/A |
| BCBS – Total | $76.14 | $50.34 | $108.93 | $41.95 | $53.03 | $108.40 | $70.64 | $49.55 | $103.87 | $56.48 | $56.97 | $102.27 |
| Anthem BCBS | $37.94 | $12.14 | $80.75 | N/A | $61.50 | N/A | $37.48 | $19.45 | $78.44 | N/A | $65.50 | N/A |
| Other BCBS plans | $85.57 | $61.39 | $114.35 | $41.95 | $36.10 | $108.40 | $79.41 | $59.21 | $108.59 | $56.48 | $39.90 | $102.27 |
| Kaiser Permanente | $48.86 | $47.50 | N/A | N/A | N/A | $72.00 | $52.92 | $52.50 | N/A | N/A | N/A | $57.67 |
| Aetna | $37.68 | $31.34 | $47.46 | N/A | N/A | N/A | $43.01 | $33.86 | $52.90 | N/A | $154.00 | N/A |
| WellCare | $7.10 | $7.10 | N/A | N/A | N/A | N/A | $5.60 | $5.60 | N/A | N/A | N/A | N/A |
| CIGNA | $23.89 | $23.34 | $33.75 | N/A | N/A | N/A | $28.24 | $27.96 | $33.75 | N/A | N/A | N/A |
| Other | $61.72 | $49.11 | $90.15 | $64.40 | N/A | $148.04 | $62.90 | $51.58 | $87.25 | $76.94 | N/A | $160.33 |
|
NOTE: Excludes SNPs, demonstrations, HCPPs, PACE plans, employer-sponsored (i.e., group) plans, and plans for special populations. BCBS are BlueCross BlueShield affiliates, which includes Anthem BCBS plans. In 2015, Aetna includes plans acquired through the merger with Coventry. Premiums include plans with premiums as well as plans with no premiums. N/A indicates plan not available.
SOURCE: Authors’ analysis of CMS’s Landscape Files for 2015 and 2016.
|
||||||||||||
| Table A7. Number and Type of Special Needs Plans, by State, 2015 and 2016 | |||||||||||||||||
| 2015 | 2016 | ||||||||||||||||
| State | Overall | Dual eligibles | Institutional | Chronic conditions | Overall | Dual eligibles | Institutional | Chronic conditions | |||||||||
| Alabama | 5 | 4 | 1 | 0 | 6 | 4 | 2 | 0 | |||||||||
| Alaska | 0 | 0 | 0 | 0 | 0 | 0 | 0 | 0 | |||||||||
| Arizona | 34 | 22 | 2 | 10 | 33 | 21 | 4 | 8 | |||||||||
| Arkansas | 8 | 5 | 0 | 3 | 7 | 4 | 0 | 3 | |||||||||
| California | 69 | 29 | 2 | 38 | 72 | 31 | 4 | 37 | |||||||||
| Colorado | 8 | 4 | 3 | 1 | 9 | 4 | 3 | 2 | |||||||||
| Connecticut | 3 | 2 | 1 | 0 | 4 | 2 | 2 | 0 | |||||||||
| Delaware | 4 | 1 | 2 | 1 | 3 | 1 | 1 | 1 | |||||||||
| District of Columbia | 7 | 3 | 2 | 2 | 5 | 2 | 1 | 2 | |||||||||
| Florida | 92 | 49 | 4 | 39 | 94 | 58 | 6 | 30 | |||||||||
| Georgia | 16 | 10 | 2 | 4 | 14 | 8 | 2 | 4 | |||||||||
| Hawaii | 4 | 4 | 0 | 0 | 5 | 5 | 0 | 0 | |||||||||
| Idaho | 1 | 1 | 0 | 0 | 1 | 1 | 0 | 0 | |||||||||
| Illinois | 10 | 6 | 1 | 3 | 10 | 5 | 2 | 3 | |||||||||
| Indiana | 8 | 3 | 1 | 4 | 8 | 4 | 2 | 2 | |||||||||
| Iowa | 3 | 1 | 0 | 2 | 0 | 0 | 0 | 0 | |||||||||
| Kansas | 2 | 0 | 1 | 1 | 2 | 0 | 1 | 1 | |||||||||
| Kentucky | 10 | 6 | 0 | 4 | 13 | 8 | 1 | 4 | |||||||||
| Louisiana | 14 | 10 | 0 | 4 | 13 | 9 | 0 | 4 | |||||||||
| Maine | 3 | 3 | 0 | 0 | 4 | 2 | 1 | 1 | |||||||||
| Maryland | 9 | 2 | 3 | 4 | 10 | 3 | 3 | 4 | |||||||||
| Massachusetts | 10 | 6 | 3 | 1 | 9 | 7 | 1 | 1 | |||||||||
| Michigan | 12 | 8 | 3 | 1 | 6 | 4 | 1 | 1 | |||||||||
| Minnesota | 9 | 9 | 0 | 0 | 9 | 9 | 0 | 0 | |||||||||
| Mississippi | 8 | 6 | 0 | 2 | 6 | 4 | 0 | 2 | |||||||||
| Missouri | 10 | 4 | 2 | 4 | 12 | 3 | 5 | 4 | |||||||||
| Montana | 0 | 0 | 0 | 0 | 1 | 1 | 0 | 0 | |||||||||
| Nebraska | 1 | 0 | 0 | 1 | 0 | 0 | 0 | 0 | |||||||||
| Nevada | 6 | 0 | 0 | 6 | 7 | 0 | 1 | 6 | |||||||||
| New Hampshire | 0 | 0 | 0 | 0 | 1 | 0 | 1 | 0 | |||||||||
| New Jersey | 8 | 3 | 4 | 1 | 9 | 4 | 3 | 2 | |||||||||
| New Mexico | 7 | 4 | 2 | 1 | 3 | 2 | 1 | 0 | |||||||||
| New York | 56 | 40 | 10 | 6 | 53 | 37 | 11 | 5 | |||||||||
| North Carolina | 11 | 6 | 1 | 4 | 14 | 7 | 2 | 5 | |||||||||
| North Dakota | 0 | 0 | 0 | 0 | 0 | 0 | 0 | 0 | |||||||||
| Ohio | 18 | 11 | 3 | 4 | 18 | 11 | 4 | 3 | |||||||||
| Oklahoma | 1 | 0 | 1 | 0 | 1 | 0 | 1 | 0 | |||||||||
| Oregon | 12 | 7 | 4 | 1 | 11 | 7 | 3 | 1 | |||||||||
| Pennsylvania | 21 | 10 | 6 | 5 | 21 | 11 | 6 | 4 | |||||||||
| Puerto Rico | 16 | 12 | 0 | 4 | 15 | 13 | 0 | 2 | |||||||||
| Rhode Island | 1 | 0 | 1 | 0 | 0 | 0 | 0 | 0 | |||||||||
| South Carolina | 8 | 3 | 1 | 4 | 8 | 3 | 1 | 4 | |||||||||
| South Dakota | 0 | 0 | 0 | 0 | 0 | 0 | 0 | 0 | |||||||||
| Tennessee | 7 | 6 | 1 | 0 | 8 | 7 | 1 | 0 | |||||||||
| Texas | 31 | 21 | 3 | 7 | 31 | 22 | 2 | 7 | |||||||||
| Utah | 2 | 2 | 0 | 0 | 2 | 2 | 0 | 0 | |||||||||
| Vermont | 0 | 0 | 0 | 0 | 0 | 0 | 0 | 0 | |||||||||
| Virginia | 11 | 2 | 4 | 5 | 9 | 2 | 3 | 4 | |||||||||
| Washington | 6 | 5 | 1 | 0 | 8 | 6 | 2 | 0 | |||||||||
| West Virginia | 1 | 1 | 0 | 0 | 1 | 1 | 0 | 0 | |||||||||
| Wisconsin | 19 | 15 | 3 | 1 | 18 | 13 | 4 | 1 | |||||||||
| Wyoming | 0 | 0 | 0 | 0 | 0 | 0 | 0 | 0 | |||||||||
| Total, U.S. | 548 | 339 | 57 | 152 | 550 | 342 | 69 | 139 | |||||||||
|
NOTE: Columns do not sum to U.S. total because some SNPs overlap state boundaries.
SOURCE: Authors’ analysis of CMS’s Landscape Files for 2015-2016.
|
|||||||||||||||||
Endnotes
Introduction
See Jacobson G, Damico A, Neuman T, and Gold M. “Medicare Advantage 2015 Spotlight: Enrollment Market Update.” June 2015. https://www.kff.org/medicare/issue-brief/medicare-advantage-2015-spotlight-enrollment-market-update/
Issue Brief
Plan Offerings in 2016
Jacobson G, Damico A, and Neuman T. “What’s In and What’s Out? Medicare Advantage Market Entries and Exits for 2016.” October 2015. https://www.kff.org/medicare/issue-brief/whats-in-and-whats-out-medicare-advantage-market-entries-and-exits-for-2016/
Plan Premiums
For example, see Gold M, Jacobson G, Damico A, and Neuman T, “Medicare Advantage 2014 Spotlight: Enrollment Market Update.” May 2014. https://www.kff.org/medicare/issue-brief/medicare-advantage-2014-spotlight-enrollment-market-update/
Limits on Out-of-Pocket Spending
For more on the factors affecting seniors’ plan enrollment decisions, see Jacobson G, Swoope C, Perry M, Slosar M, “How are Seniors Choosing and Changing Health Insurance Plans?” May 2014. https://www.kff.org/medicare/report/how-are-seniors-choosing-and-changing-health-insurance-plans/
See Gold M, Hudson M, Jacobson G, and Neuman T, “Medicare Advantage 2010 Data Spotlight: Benefits and Cost-Sharing.” February 2010. https://www.kff.org/medicare/issue-brief/medicare-advantage-2010-data-spotlight-benefits-and/
Prescription Drug Coverage
Hoadley J, Cubanski J, and Neuman T. “Medicare Part D: A First Look at Plan Offerings in 2016.” October 2015. https://www.kff.org/medicare/issue-brief/medicare-part-d-a-first-look-at-plan-offerings-in-2016
Hoadley J, Cubanski J, and Neuman T. “Medicare Part D: A First Look at Plan Offerings in 2016.” October 2015. https://www.kff.org/medicare/issue-brief/medicare-part-d-a-first-look-at-plan-offerings-in-2016
Quality Ratings
For a list of the counties, see Jacobson G, Neuman T, Damico A, and Huang J. “Medicare Advantage Plan Star Ratings and Bonus Payments in 2012.” November 2011. https://www.kff.org/medicare/report/medicare-advantage-2012-star-ratings-and-bonuses/
Market Structure: Plan Availability and Characteristics of Plans Offered by Major Firms
See Jacobson G, Damico A, Neuman T, and Gold M. “Medicare Advantage 2015 Spotlight: Enrollment Market Update.” June 2015. https://www.kff.org/medicare/issue-brief/medicare-advantage-2015-spotlight-enrollment-market-update/
Jacobson G, Damico A, Neuman T, and Gold M. “Medicare Advantage 2015 Spotlight: Enrollment Market Update.” June 2015. https://www.kff.org/medicare/issue-brief/medicare-advantage-2015-spotlight-enrollment-market-update/
Blue Cross and Blue Shield Association. 2015 Medicare Advantage and Prescription Drug Plans Offered by Blue Cross and Blue Shield Affiliated Companies, Updated January 2015. http://www.bcbs.com/about-the-companies/
Discussion
G. Jacobson, A. Damico, and T. Neuman. “Data Note: Medicare Advantage Enrollment, by Firm, 2015.” July 2015. https://www.kff.org/medicare/issue-brief/data-note-medicare-advantage-enrollment-by-firm-2015/
Altman D. “Amid Merger Talk, a Look at Health Insurers’ Medicare Business.” Wall Street Journal. July 1, 2015. http://blogs.wsj.com/washwire/2015/07/01/amid-merger-talk-a-look-at-health-insurers-medicare-business/