
What Drives Spending and Utilization on Medicaid Drug Benefits in States?
Executive Summary
Medicaid is one of the country’s biggest payers for prescription drugs, but because prescription drugs have accounted for a small share of total Medicaid spending, Medicaid’s pharmacy benefit policies have not been at the top of mainstream healthcare policy debate. However, with the approval of new specialty drugs, such as the Hepatitis C treatment Sovaldi, states are mindful that the price tag for the Medicaid drug program could increase significantly. While states have implemented many cost-saving policies targeting their Medicaid prescription drug benefits, there remains room for additional cost savings, better management, and improved health outcomes. To ensure appropriate policy for this central benefit and achieve these goals, it is important to understand which drugs are most frequently prescribed and which drive spending.
Using state drug utilization data, as well as an industry drug database, this issue brief examines trends in Medicaid drug prescriptions and drug spending before rebates from 2010 through 2012.1 As part of the Medicaid drug benefit, manufacturers provide rebates to the state and federal government. However, rebates are based on proprietary data and they are not available to the public at the drug level. As a result we are unable to include them, or use this data to calculate total Medicaid drug spending. After presenting this analysis, we place these findings in the context of policy discussions. Key findings of the analysis include:
- Comprising 35% of prescriptions and 34% of spending before rebates in 2012, Central Nervous System Agents, a class of drugs that include pain killers, antidepressants, and antipsychotics, constitute the largest share of Medicaid drug utilization and spending. Within this drug class, pain killers and fever reducers represent a third of utilization.
- Specialty drugs account for just two percent of drug utilization in 2012, but they comprise 28% of drug spending. This share increased from 2010 when they totaled 24% of drug spending before rebates. The specialty drug share of total drug spending varies at the state level.
- Brand-name drugs account for a disproportionate amount of drug spending. In 2012, they accounted for 20% of Medicaid drug prescriptions but 76% of spending. In the past three years, the share of Medicaid drugs that are generic has risen slightly, possibly due to a number of blockbuster brand drugs losing their exclusivity and facing generic competition in the past several years.
Issue Brief
Introduction
Medicaid is one of the country’s biggest payers for prescription drugs1, but because prescription drugs account for only about 5 percent of total Medicaid spending2, Medicaid’s pharmacy benefit policies have not been at the top of mainstream healthcare policy debate. However, with the approval of new specialty drugs, such as the Hepatitis C treatment Sovaldi, states are mindful that the price tag for the Medicaid drug program could increase significantly. While states have implemented many cost-saving policies targeting their Medicaid prescription drug benefits, there remains room for additional cost savings, better management, and improved health outcomes.3 In order to create policy to reach these goals, it is fundamental to understand what the most frequently prescribed drugs are and what drugs are driving spending. In this paper, we first provide a background for understanding the Medicaid drug benefit. Then we analyze recent spending and utilization trends by drug class, specialty drug status, and brand or generic status. Finally, we discuss some of the policy implications of these findings. A detailed explanation of the data and methods underlying the analysis is available in Appendix B at the end of the brief.
Background
In 1991, Congress created the Medicaid Drug Rebate Program to control the rising cost of the prescription drug benefit in the Medicaid program. In return for Medicaid reimbursement for their prescription drugs, it requires that all manufacturers enter into rebate agreements with the Secretary of Health and Human Services.4 Prior to the Affordable Care Act of 2010, the Drug Rebate Program prohibited the collection of federally-mandated rebates from manufacturers for drugs dispensed to beneficiaries enrolled in managed care plans if the health plans paid for those drugs out of their capitated rates. Consequently, many states chose to “carve out” pharmacy benefits from the package of services included in managed care and pay for drugs on a fee-for-service basis so that the state could capture the rebates directly. However, the ACA changed the rules for the rebate program, requiring manufacturers to pay the standard Medicaid rebate amount for drugs paid for by managed care plans in addition to the traditional fee-for-service claims. This change has prompted some states that utilized a carved-out approach for outpatient drug services to switch to a carved-in approach.5 Drug rebates offset a sizable share of gross Medicaid drug spending: in FY 2010, rebates recouped 42% of outpatient fee-for-service drug spending.6
Over half of Medicaid fee-for-service drug expenditures before rebates in FY 2010 were for individuals with disabilities.7 Medicaid also spends more money before rebates on individuals with disabilities at the recipient level than any other eligibility group. Persons with disabilities tend to have complex health needs including physical, behavioral or cognitive ailments that lead to long-term use of drug therapies. They also tend to be older (ages 45 and up), and increasing age is associated with greater use of prescription drugs. Medicaid spends relatively little on outpatient prescription drugs for persons aged 65 and older, as they predominately receive prescription drugs through Medicare. Children, pregnant women, and other caretaker adults enrolled in Medicaid tend to use prescription drugs more for shorter-term, acute illnesses. Although Medicaid spends more money for prescription drugs on individuals with disabilities than other eligibility groups, prescription drug spending has grown the fastest for adults over the FY 2007 to 2010 period.8 This is in large part due to enrollment growth within the adult eligibility group during this period, which in turn, is in large part due to the recession and slow recovery.9 However, despite this growth within the adult eligibility group, and despite the Medicaid enrollment growth, total Medicaid spending for prescribed drugs has remained relatively stable.10 Reasons for the slow growth in Medicaid drug expenditures include states’ emphasis on promoting the use of generic drugs; the introduction of many newly available, generic versions of blockbuster brand-name medications; increases in manufacturer rebates, as required by the Affordable Care Act; and other cost containment efforts implemented by states.11
Despite the historically low growth rates of expenditures in recent years, federal and state Medicaid administrators continue to see prescription drug spending as an area where substantial savings could be achieved while continuing to meet enrollee health needs. Pressures to restrain the growth of Medicaid spending have long existed for states and the federal government, due to overall health care cost growth that exceeds inflation. These pressures were exacerbated by the 2007-2009 recession and its slow recovery. Reimbursement to pharmacies for prescribed drugs, including ingredient costs and dispensing fees, is an area of ongoing concentration for states and the federal government.12 Administrators are also looking for ways to better manage drug benefits, such as reconsidering managed care “carve outs” and adopting more stringent authorization and review strategies. Consistent with trends across the health insurance marketplace, administrators also are reexamining cost sharing requirements. Final rules issued by CMS in July 2012 allow states to apply higher cost-sharing amounts for certain Medicaid-covered drugs.13
Government projections point to rapid escalation in Medicaid drug expenditures in the near future.14 Factors expected to contribute to higher growth include increases in enrollment due to Medicaid coverage expansions authorized by the Affordable Care Act; continued growth in use and costs of specialty drugs; and fewer new generic drugs entering the marketplace to temper the long-term upward trend of increasing per unit drug costs (e.g. due to price increases for existing drugs and introduction of new drugs at relatively higher prices). Medicaid administrators are reassessing the ways that federal and state rules affect the use of and costs for prescribed drugs, in light of these trends.
Trends in Drug Spending and Utilization
Spending and Utilization by Drug Class
Using drug classes defined by the American Hospital Formulary Service,15 we found that Central Nervous System (CNS) Agents were the largest drug class of Medicaid prescriptions in 2010, 2011, and 2012, both in terms of number of prescriptions and total spending (Figure 1 and Figure 3). This class of drugs accounted for over a third of total prescriptions and over a third of total spending in each of those years (Appendix Table A1). The Central Nervous System Agents class of drugs has 12 subclasses that encompass a range of drugs, but most of the use and spending concentrates in five of them (Figure 2 and Appendix Table A2).16 The text box below summarizes these five subclasses.
Analgesics and Antipyretics is the largest subclass of CNS Agents ranked by use, and third when ranked by expenditures. Drugs in this subclass are used to manage pain, fever and inflammation.
Psychotherapeutic Agents is the second largest subclass of CNS Agents ranked by use, and first when ranked by expenditures. Drugs in this subclass include antidepressants and antipsychotics used in treatment of emotional and mental disorders and serious mental illness.
Anxiolytics, Sedatives and Hypnotics is the third largest subclass of CNS Agents ranked by use but sixth by expenditures. This subclass primarily encompasses benzodiazepines and other drugs often used to treat anxiety and insomnia, although they may be used for other conditions. Most of the highly-utilized drugs in this subclass are available as generics.
Anticonvulsants is the fourth largest subclass of CNS Agents, ranked by use or expenditures. As the name suggests, drugs in this class are used to manage epileptic seizures but increasingly they may also be used as mood stabilizers or to treat chronic neuropathic pain.
Anorexigenic Agents and Respiratory and CNS Stimulants is the fifth largest subclass of CNS Agents ranked by use, but second when ranked by expenditures. Drugs in this subclass include popular treatments for attention deficit hyperactivity disorder (ADHD) and narcolepsy.
Because the CNS class encompasses so many different types of drugs, we examine this class at the subclass level. Analgesics, or painkillers, are the most commonly used drugs worldwide, so the fact that CNS drugs account for most Medicaid prescription drugs and drug spending is not surprising. There are numerous generic options within this subclass, contributing to its lower rank in terms of total expenditures.
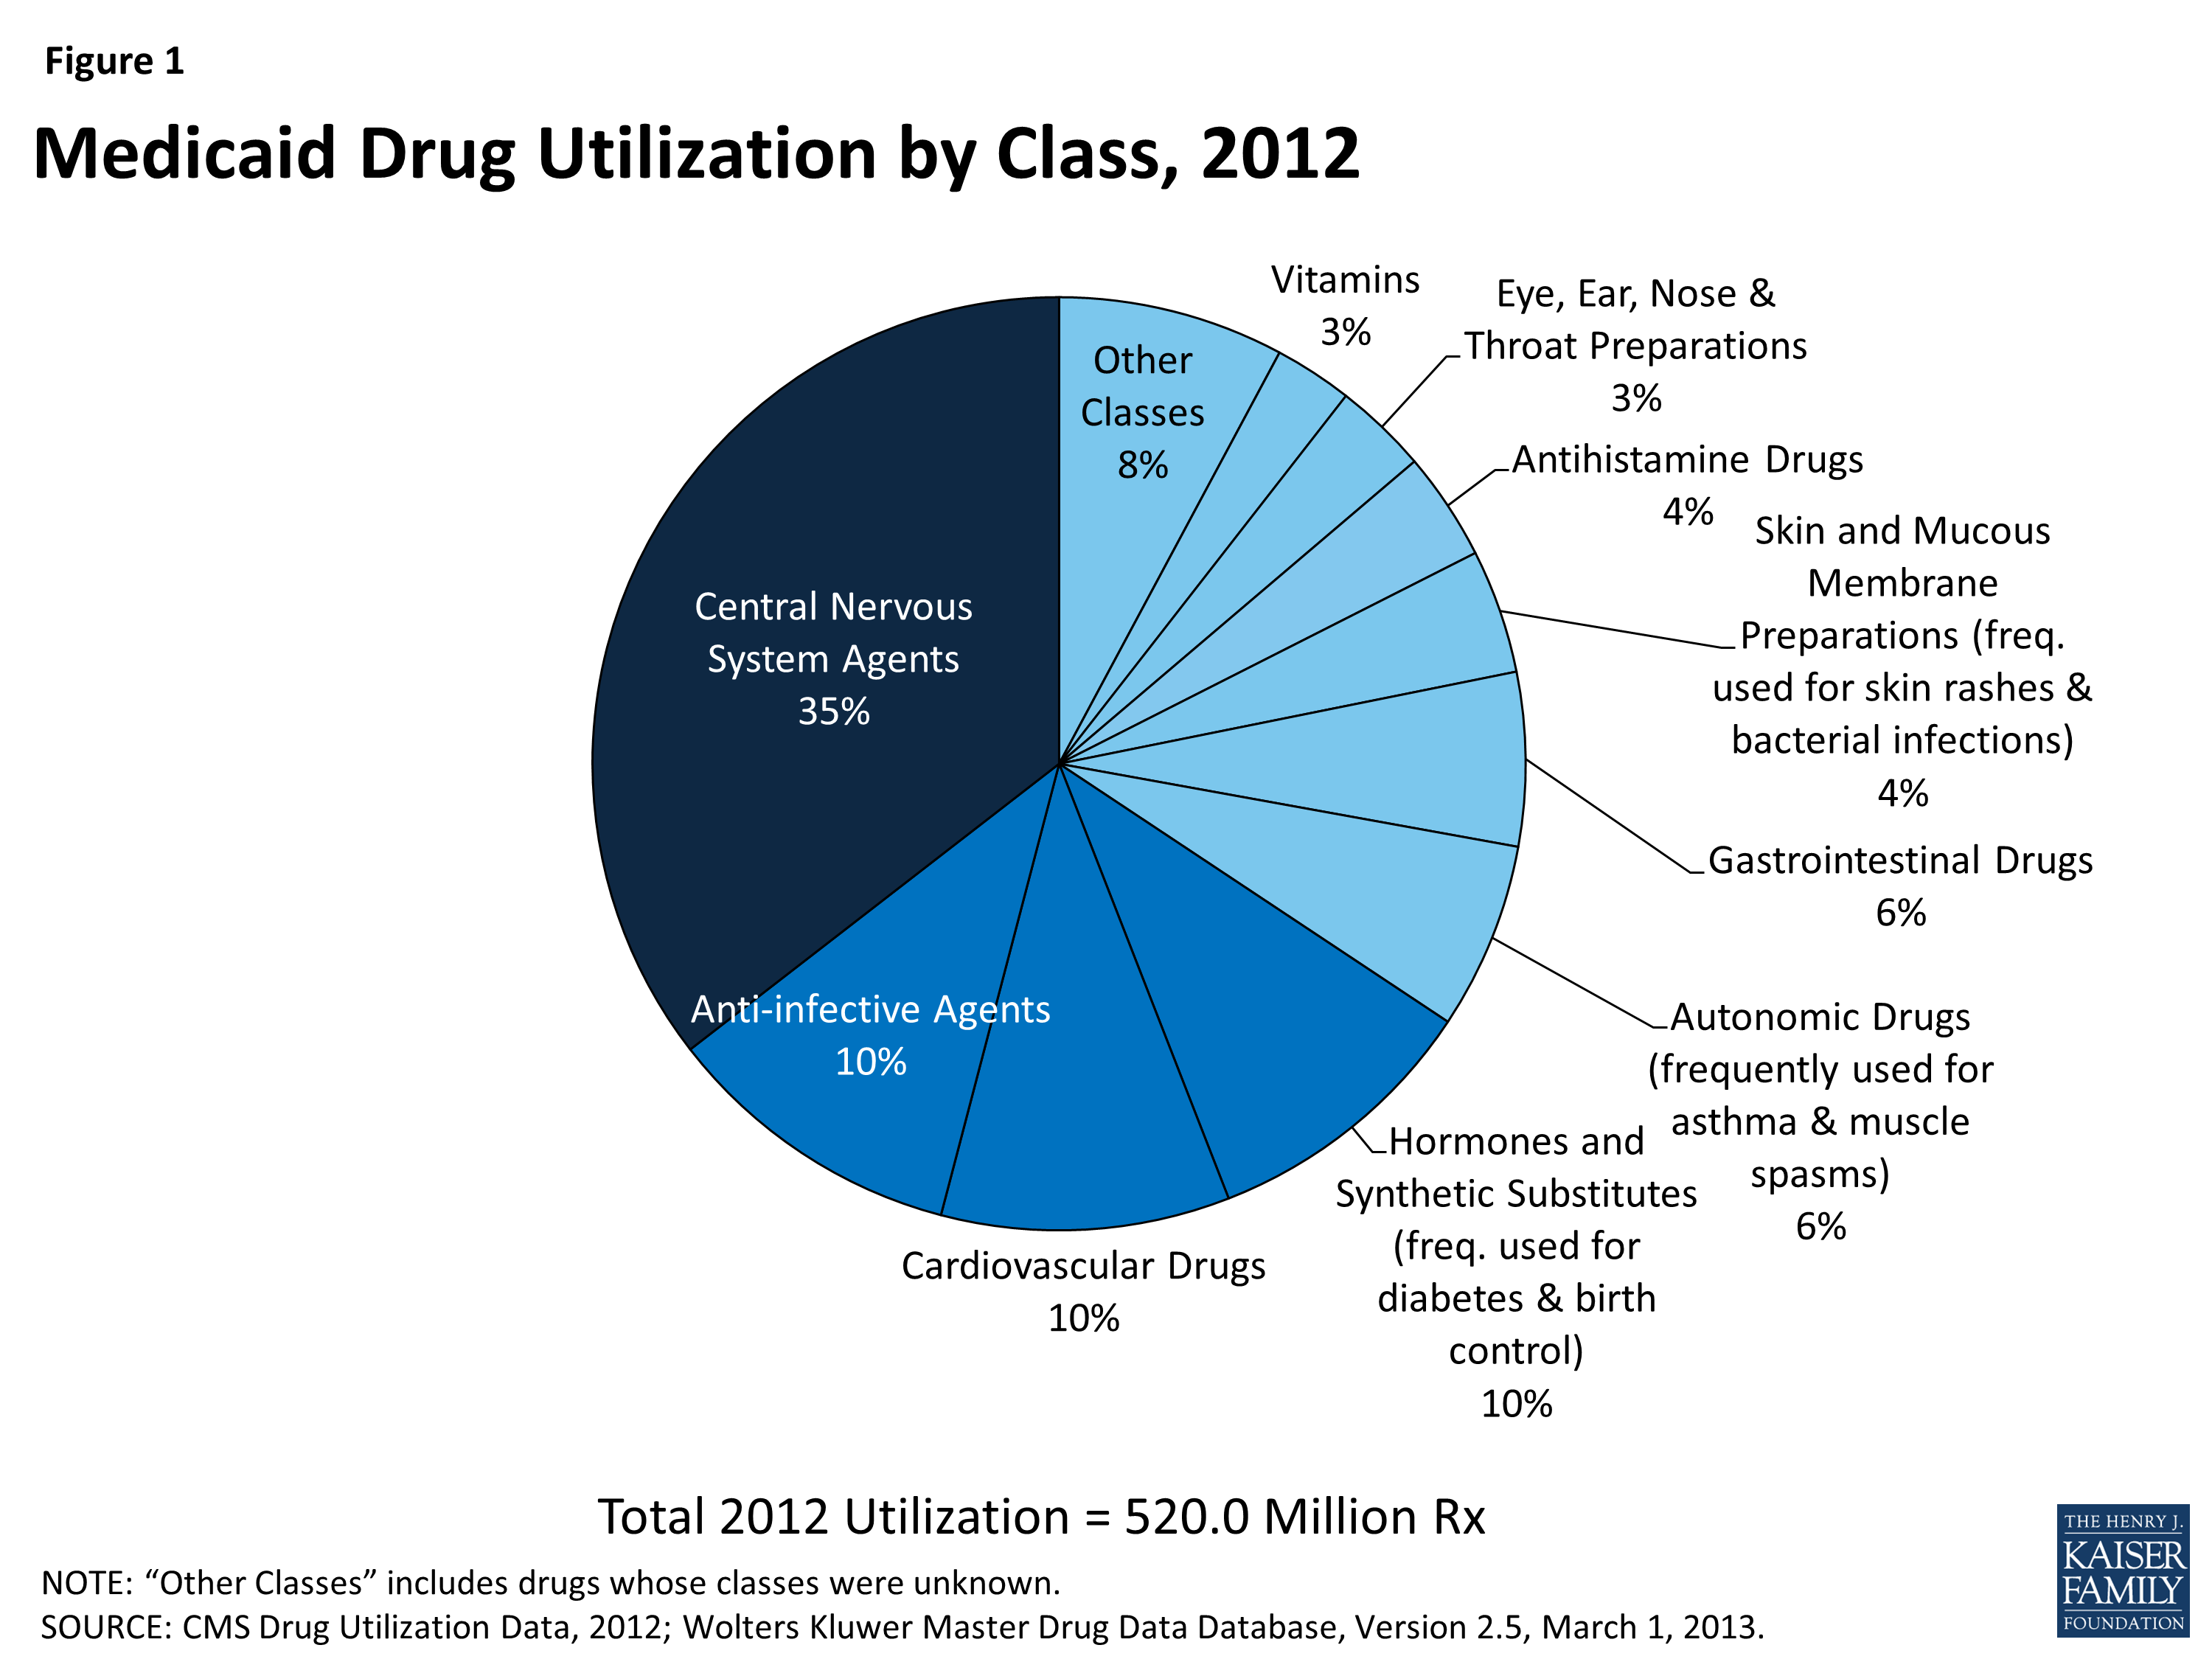
Figure 1: Medicaid Drug Utilization by Class, 2012
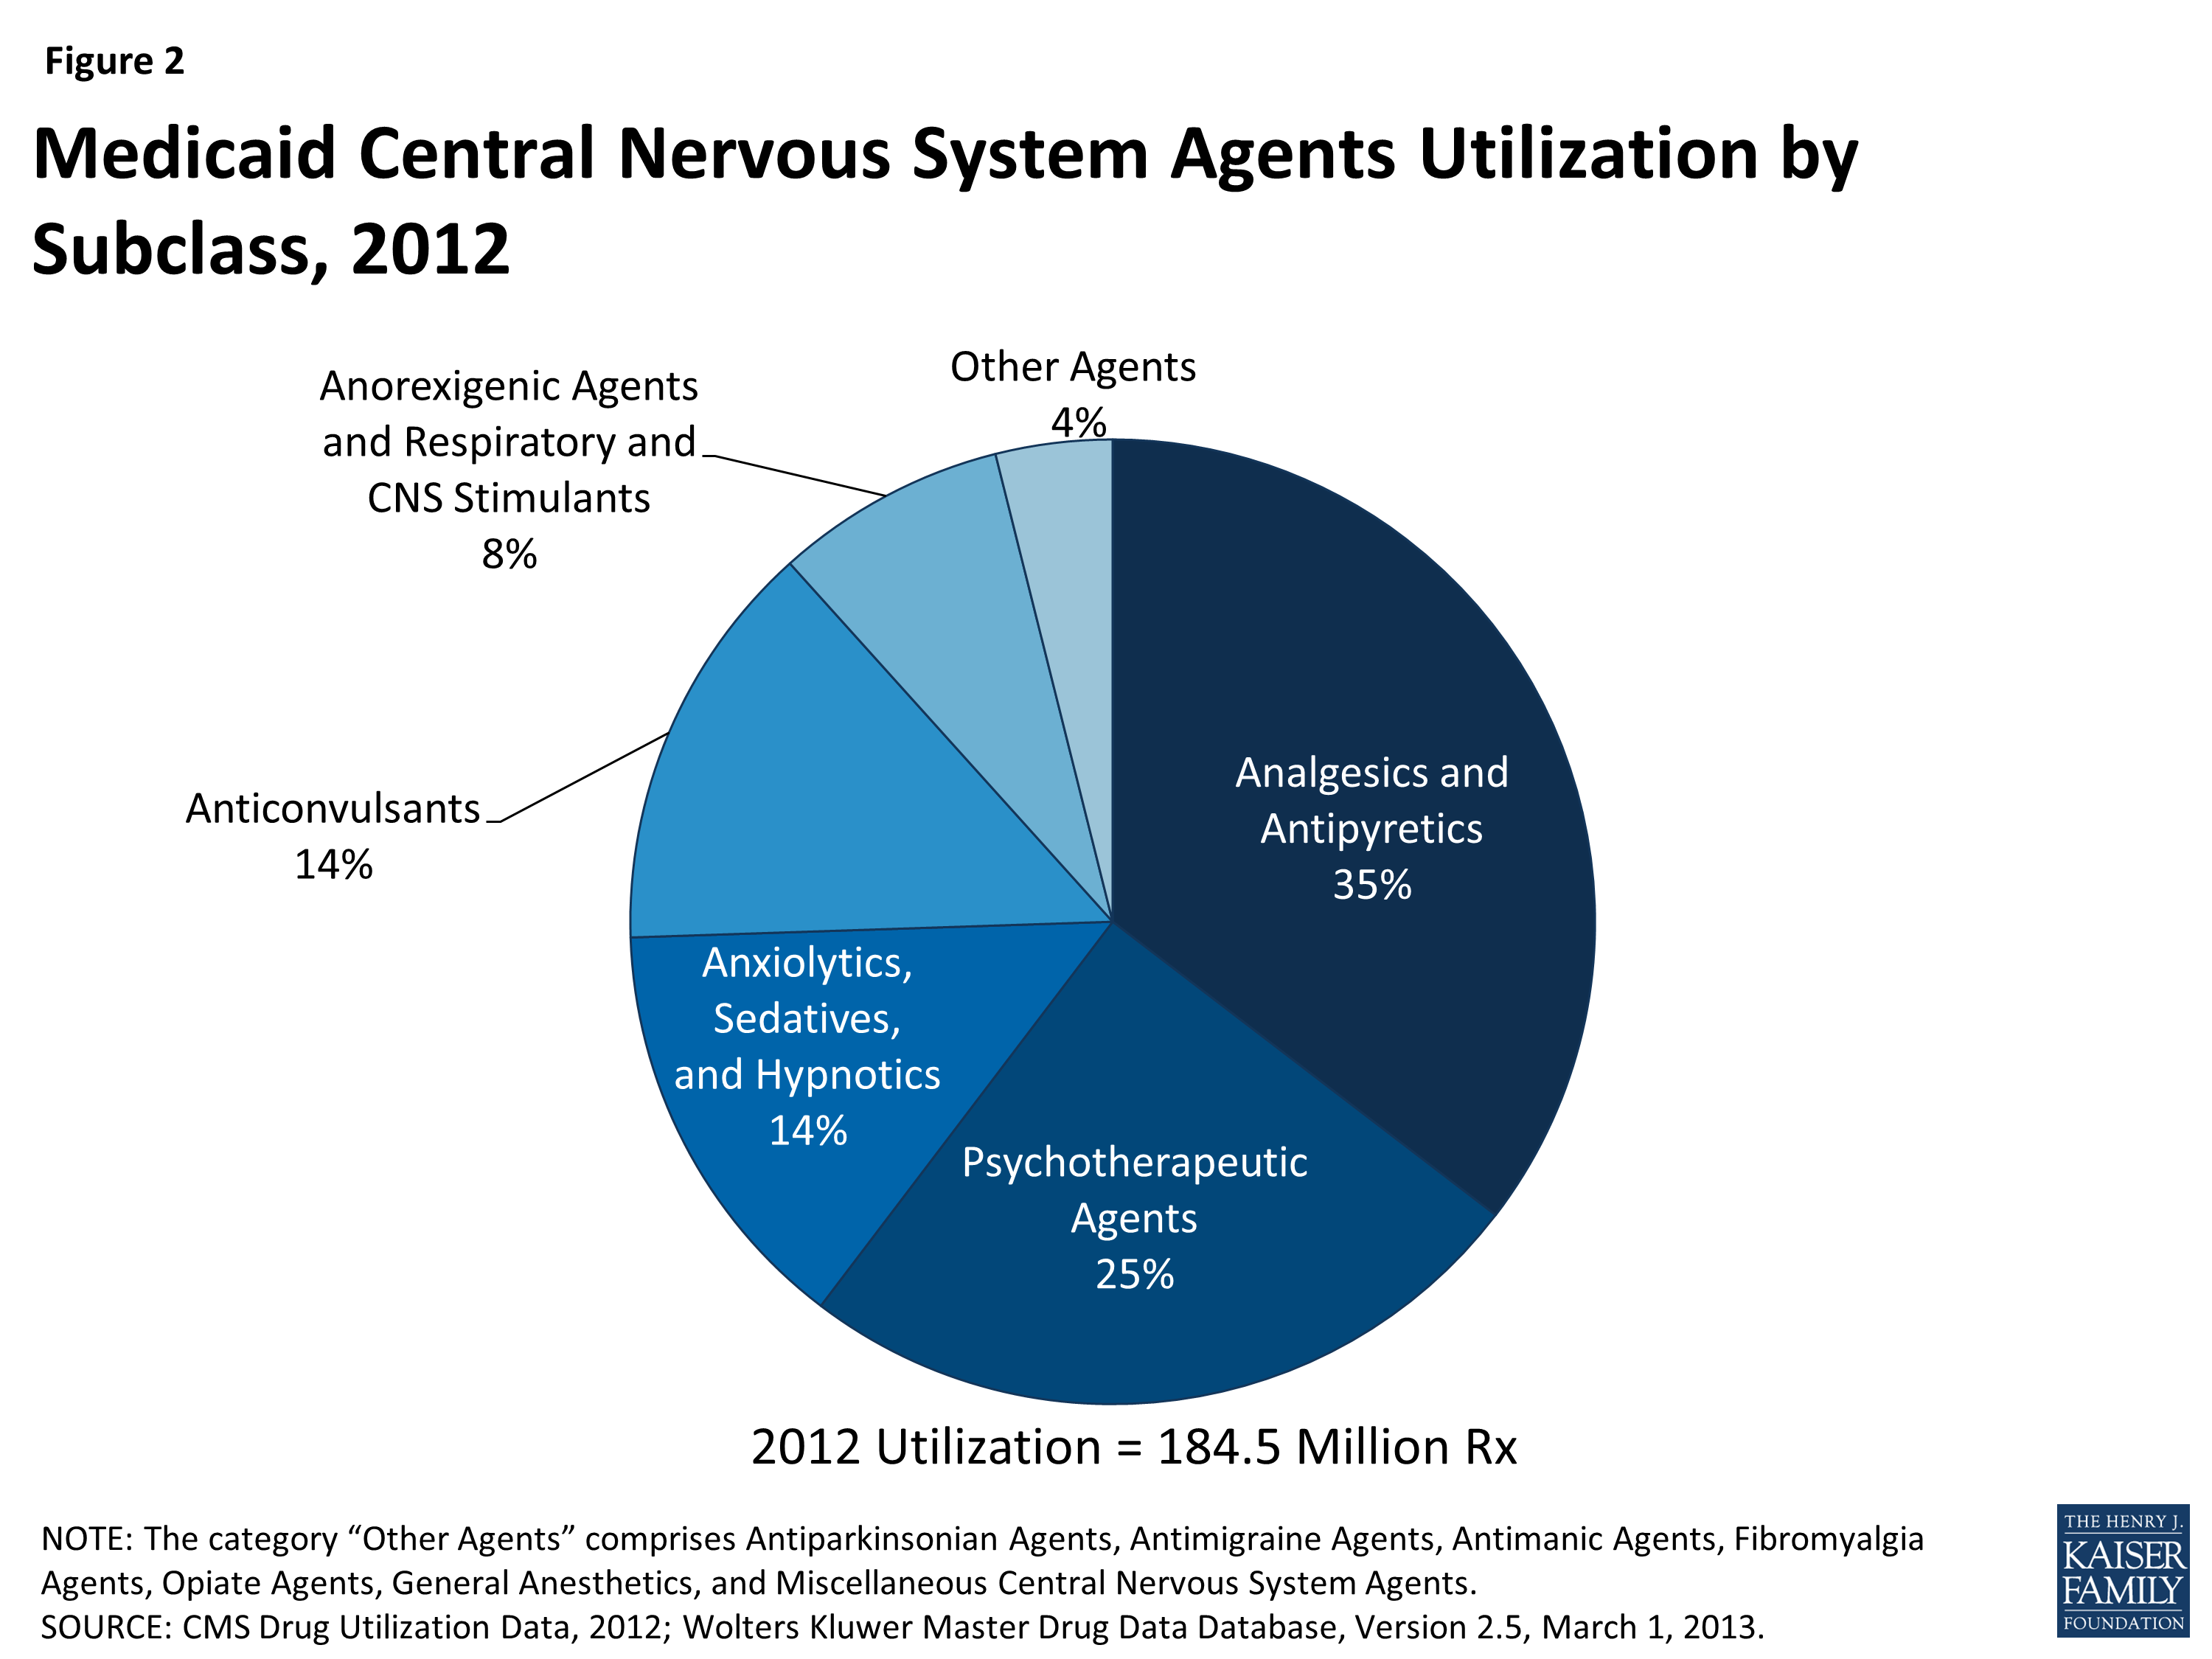
Figure 2: Medicaid Central Nervous System Agents Utilization by Subclass, 2012
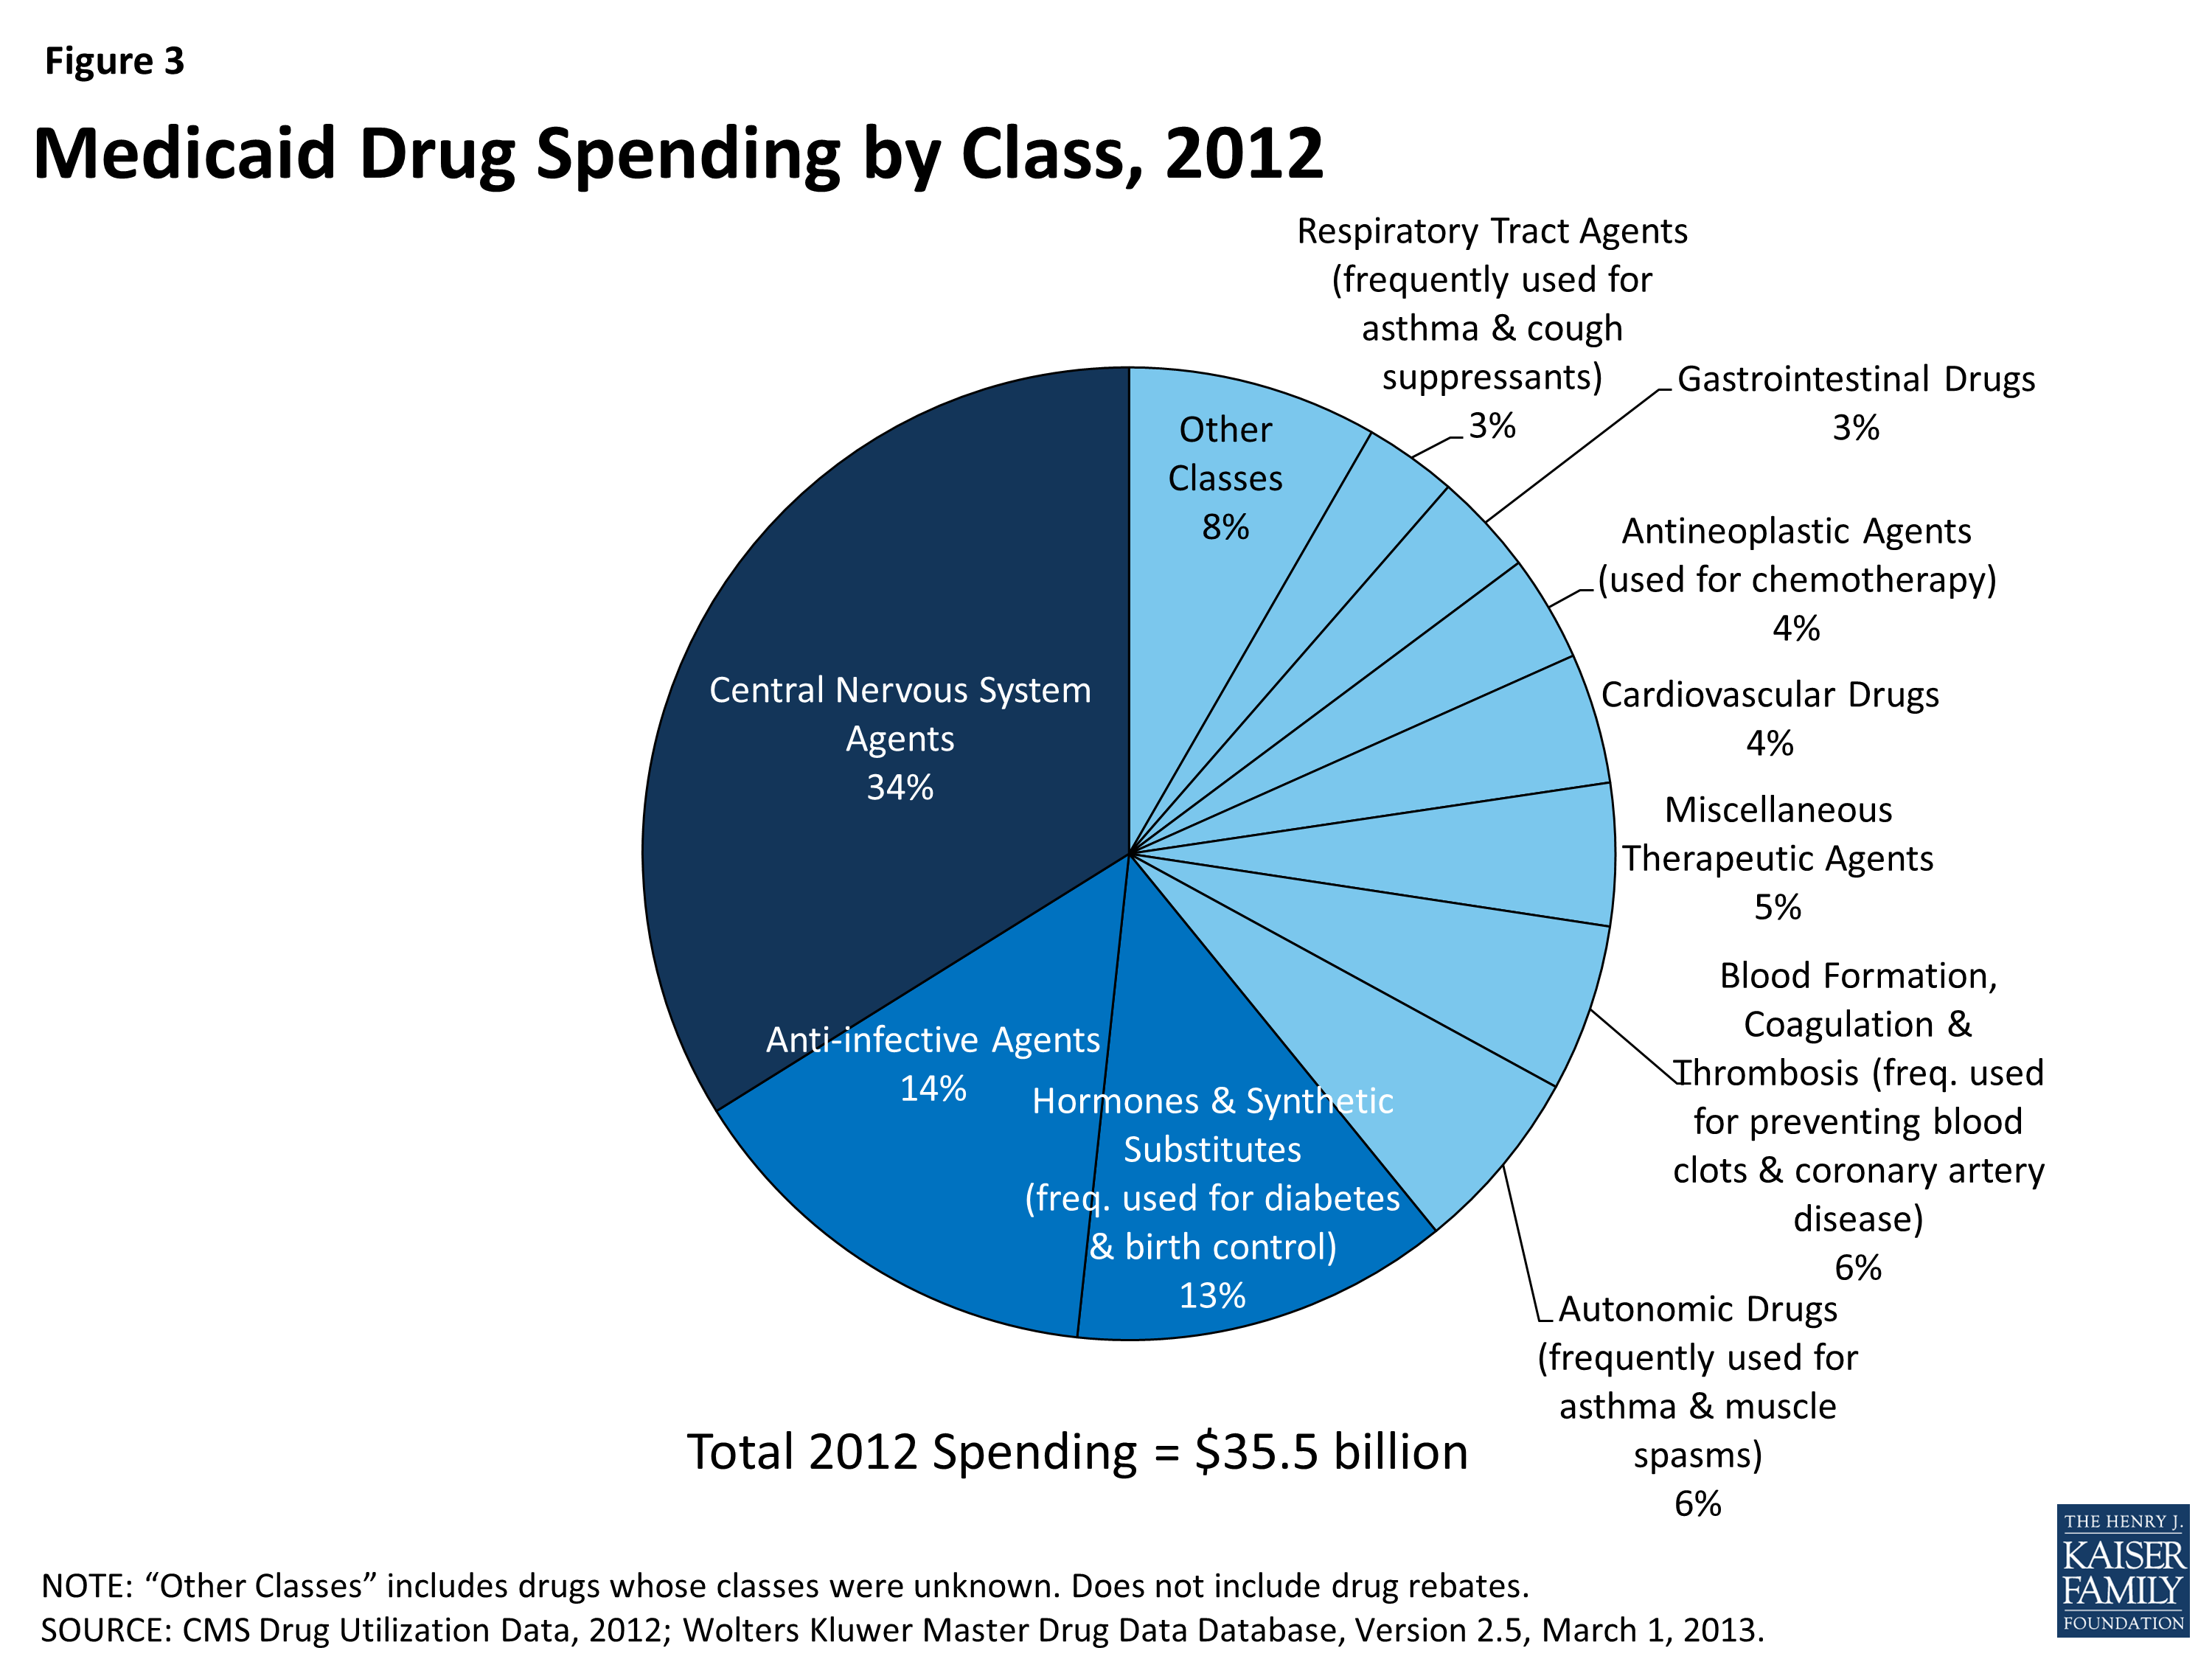
Figure 3: Medicaid Drug Spending by Class, 2012
Similarly, the high levels of use of CNS Agents is consistent with Medicaid’s position as the largest source of funding for mental health and substance abuse services in the United States, together referred to as behavioral health services.17
Other classes that account for a large number of prescriptions include Anti-Infective Agents, Cardiovascular Drugs (used to treat high blood pressure and high cholesterol), Hormones and Synthetic Substitutes (frequently used to treat diabetes and auto-immune diseases, as well as to prevent pregnancies), Autonomic Drugs (frequently used to treat asthma and muscle spasms) and Gastrointestinal Drugs (Figure 1). These classes include treatments for many different acute illnesses and chronic conditions and are not unusual to see at or near the top of lists of high-use classes in any insurance program.
Most of these high-use classes also show up at the top of the list of classes ranked by Medicaid expenditures (Figure 3), but the high expenditure list also includes small-to-moderate use classes such as Blood Formation, Coagulation & Thrombosis (used for treating and preventing blood clots); Miscellaneous Therapeutic Agents; and Antineoplastic Agents (used for chemotherapy). These classes contain large numbers of drugs used to treat a wide range of conditions, but a common theme among them is that they include relatively high percentages of biologic and specialty drugs, contributing to high average costs per prescription.
Spending and Utilization for Specialty Drugs
While there is no universally accepted definition of specialty drugs and Medicaid programs use varying definitions, products designated as specialty drugs tend to require either difficult or unusual medication delivery, or complex treatment maintenance.18 Price is also frequently considered an indicator of specialty drugs, but some argue that price alone generally should not be used to define this type of drug.19
We find that specialty drugs account for a disproportionate amount of drug spending. Between 2010 and 2012, specialty drugs accounted for 2 of total prescriptions, but they accounted for about a quarter of total Medicaid drug spending before rebates (Figure 4). Additionally, specialty drugs’ share of total Medicaid spending on drugs grew from 24 percent in 2010 to 28 percent in 2012. As shown in Figure 5, there is variation at the state level in the share of total Medicaid drug spending that specialty drugs comprise, ranging from a low of 16 percent in Kentucky to a high of 39 percent in the District of Columbia.20

Figure 4: Specialty Drug Utilization and Spending as a Share of Total Medicaid Drug Spending and Utilization, 2010-2012
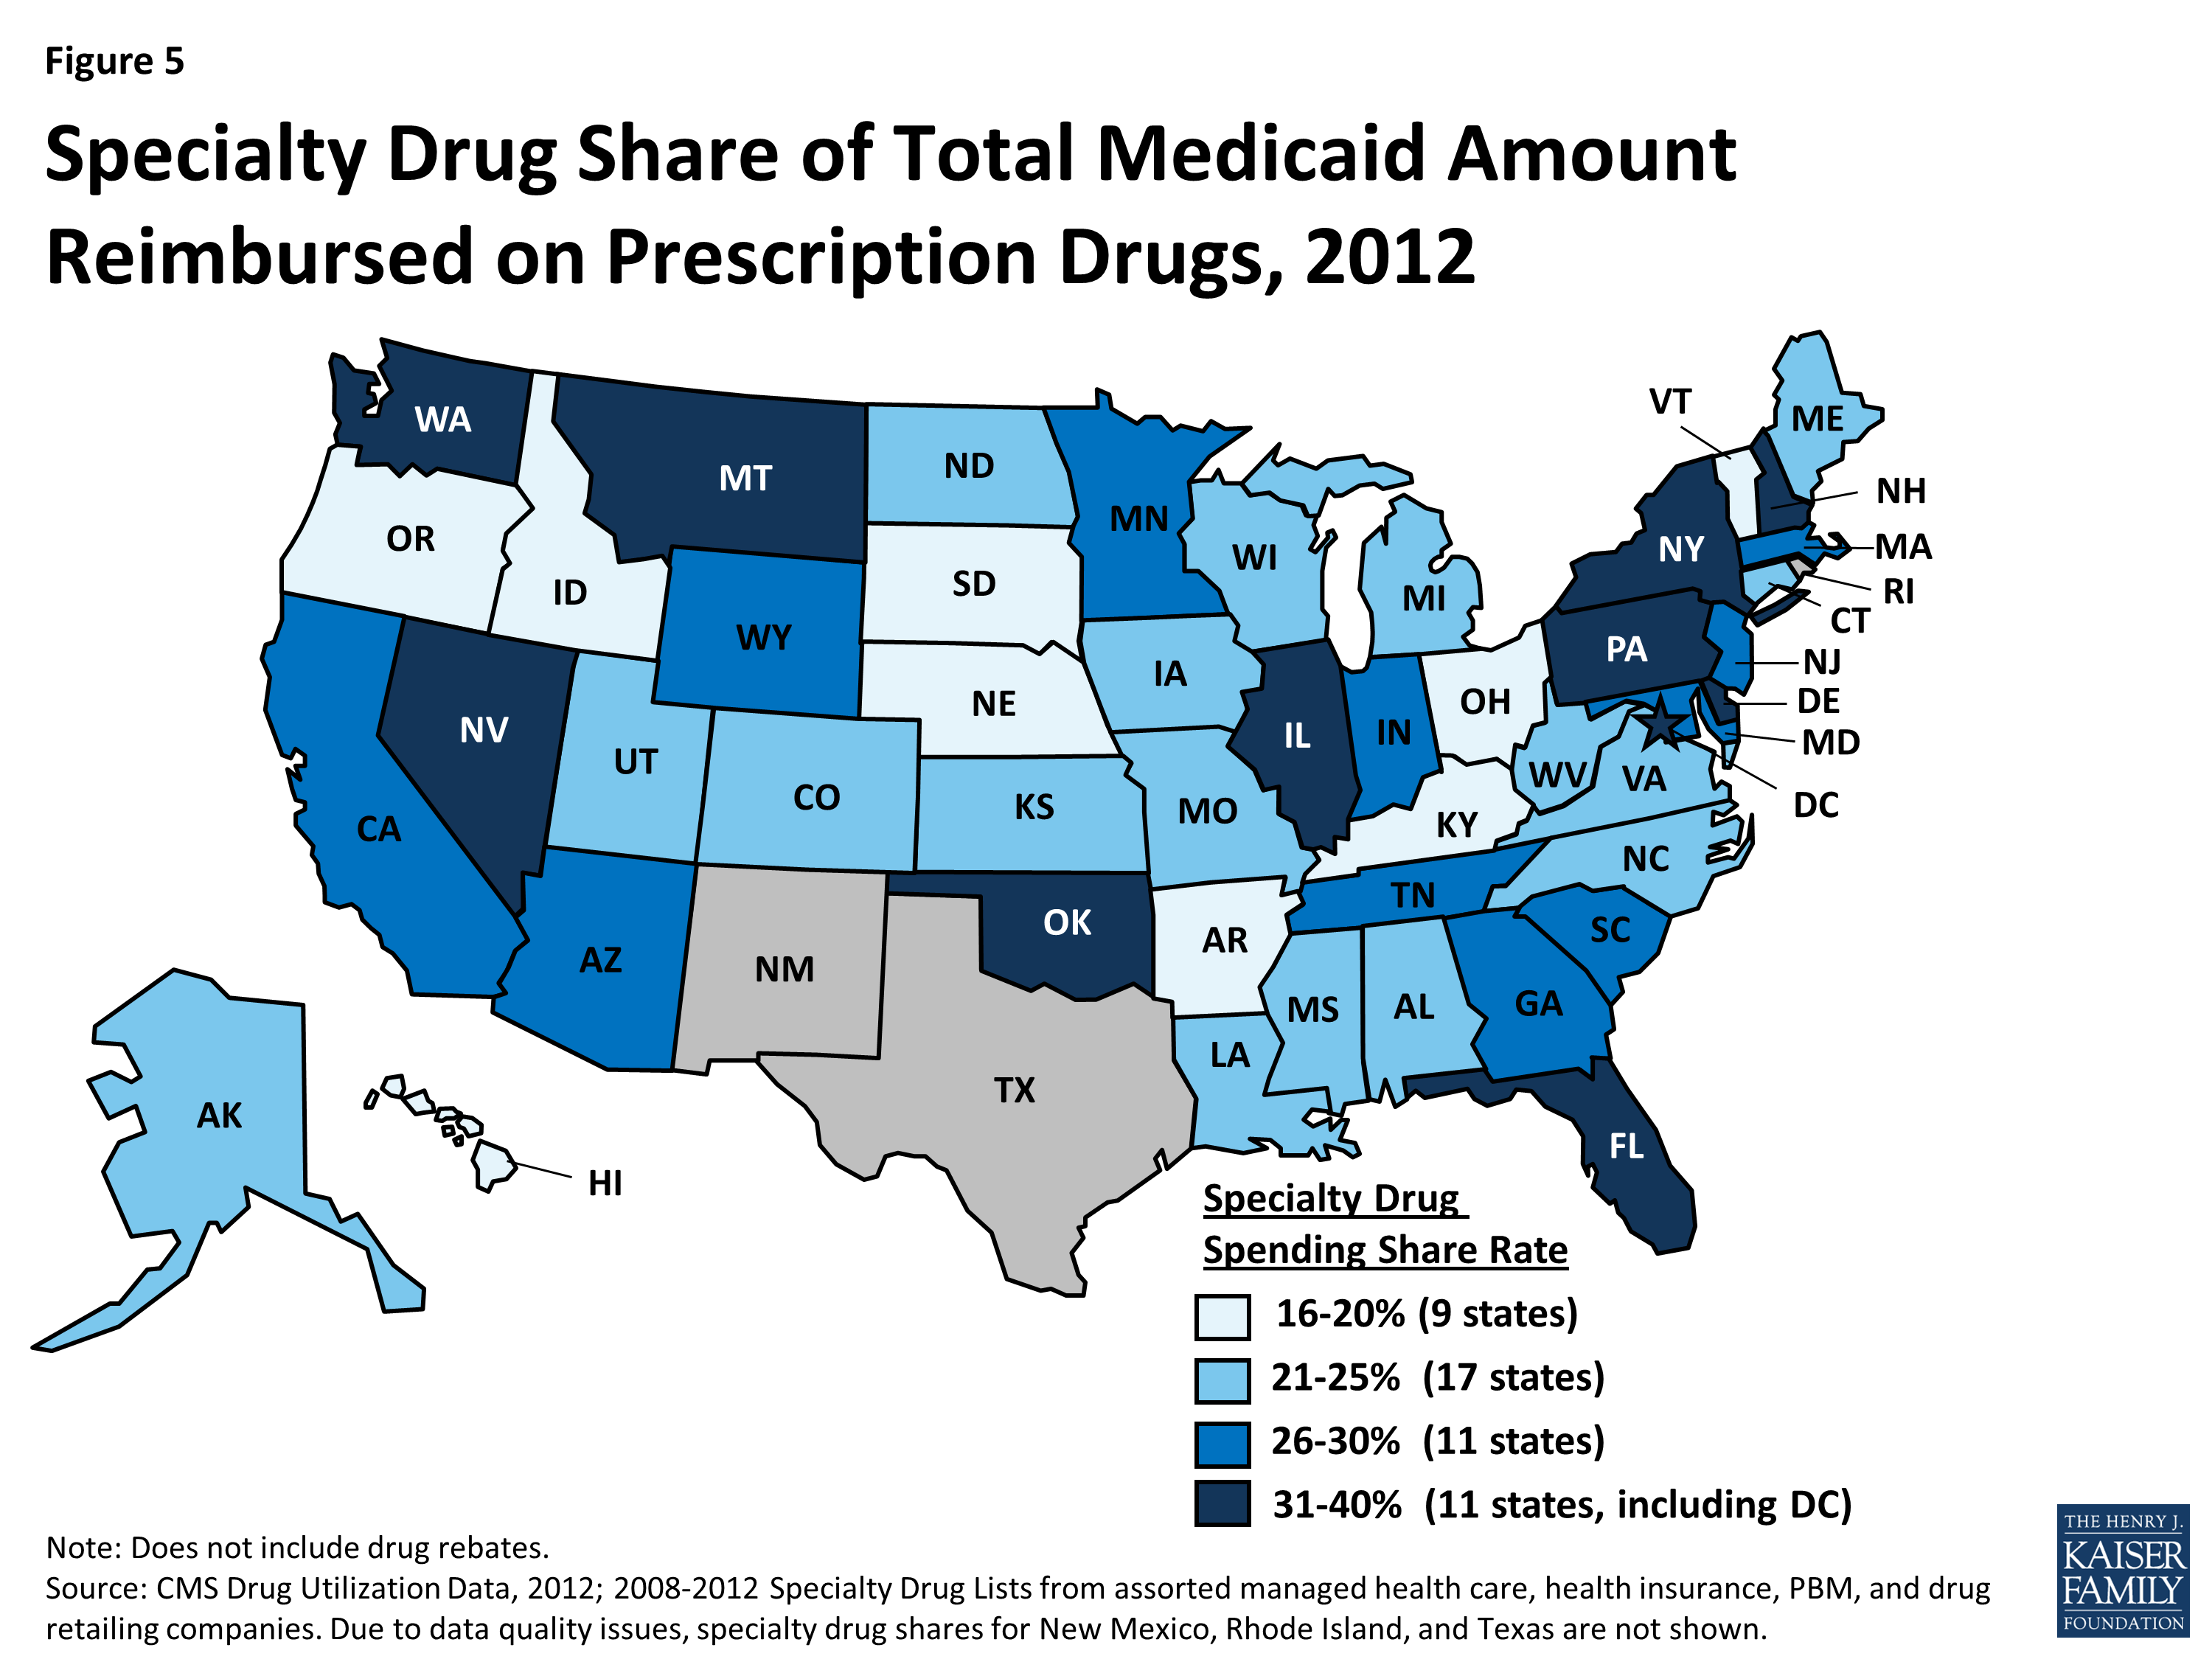
Figure 5: Specialty Drug Share of Total Medicaid Amount Reimbursed on Prescription Drugs, 2012
Spending and Utilization for Brand vs Generic Drugs
A generic drug is equivalent to a brand drug (also known as an “innovator” drug) in “dosage form, strength, route of administration, quality, performance characteristics, and intended use,” but it is often sold at a lower price.21 The generic dispensing rate of total Medicaid prescriptions has increased from 74 percent in 2010 to 80 percent in 2012. Consequently, the generic share of total Medicaid drug spending has also increased slightly from 20 percent in 2010 to 24 percent in 2012 (Figure 6). The generic share of total Medicaid drug spending varies from state to state, ranging from 13 percent in Rhode Island to 41 percent in Alaska (Figure 7). Although it is argued that dramatic savings could be achieved if all states could reach the generic dispensing rates in states such as Virginia or Alaska, it is important to remember that many factors may influence these rates. Each state has different mixes of patients by age, race, gender, disability, managed care participation, and other factors known to influence the numbers and types of prescriptions dispensed.
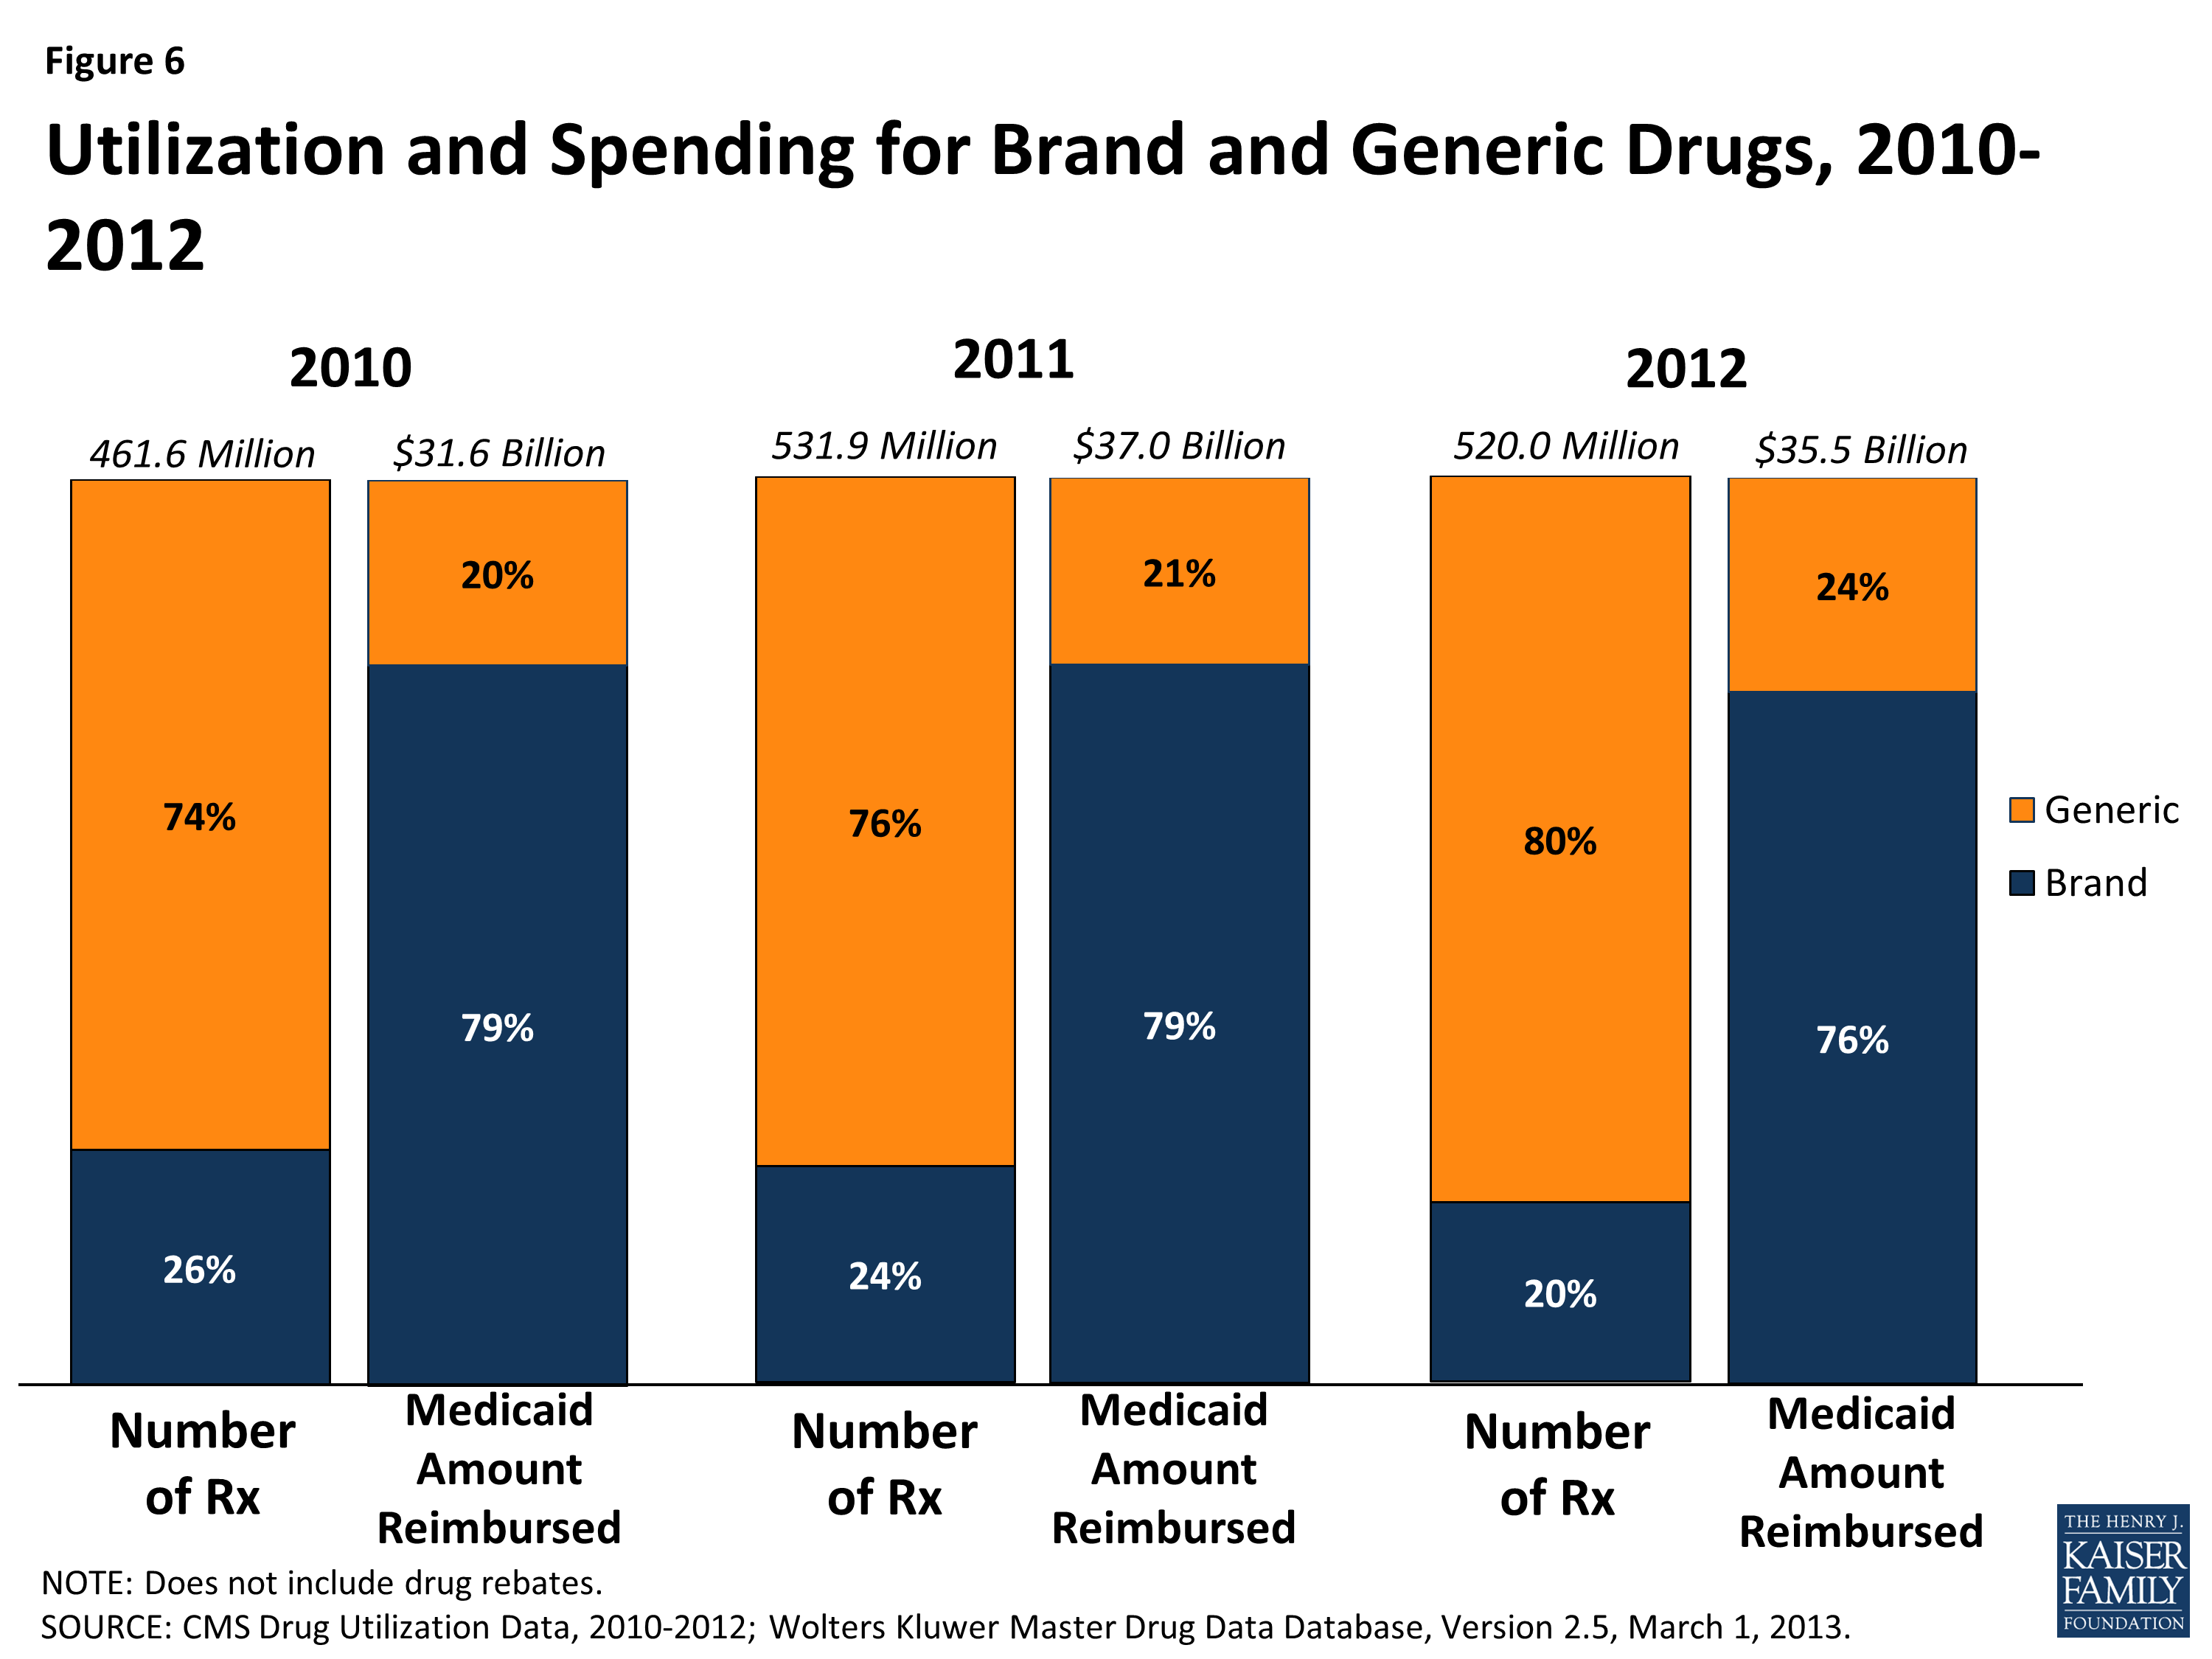
Figure 6: Utilization and Spending for Brand and Generic Drugs, 2010-2012
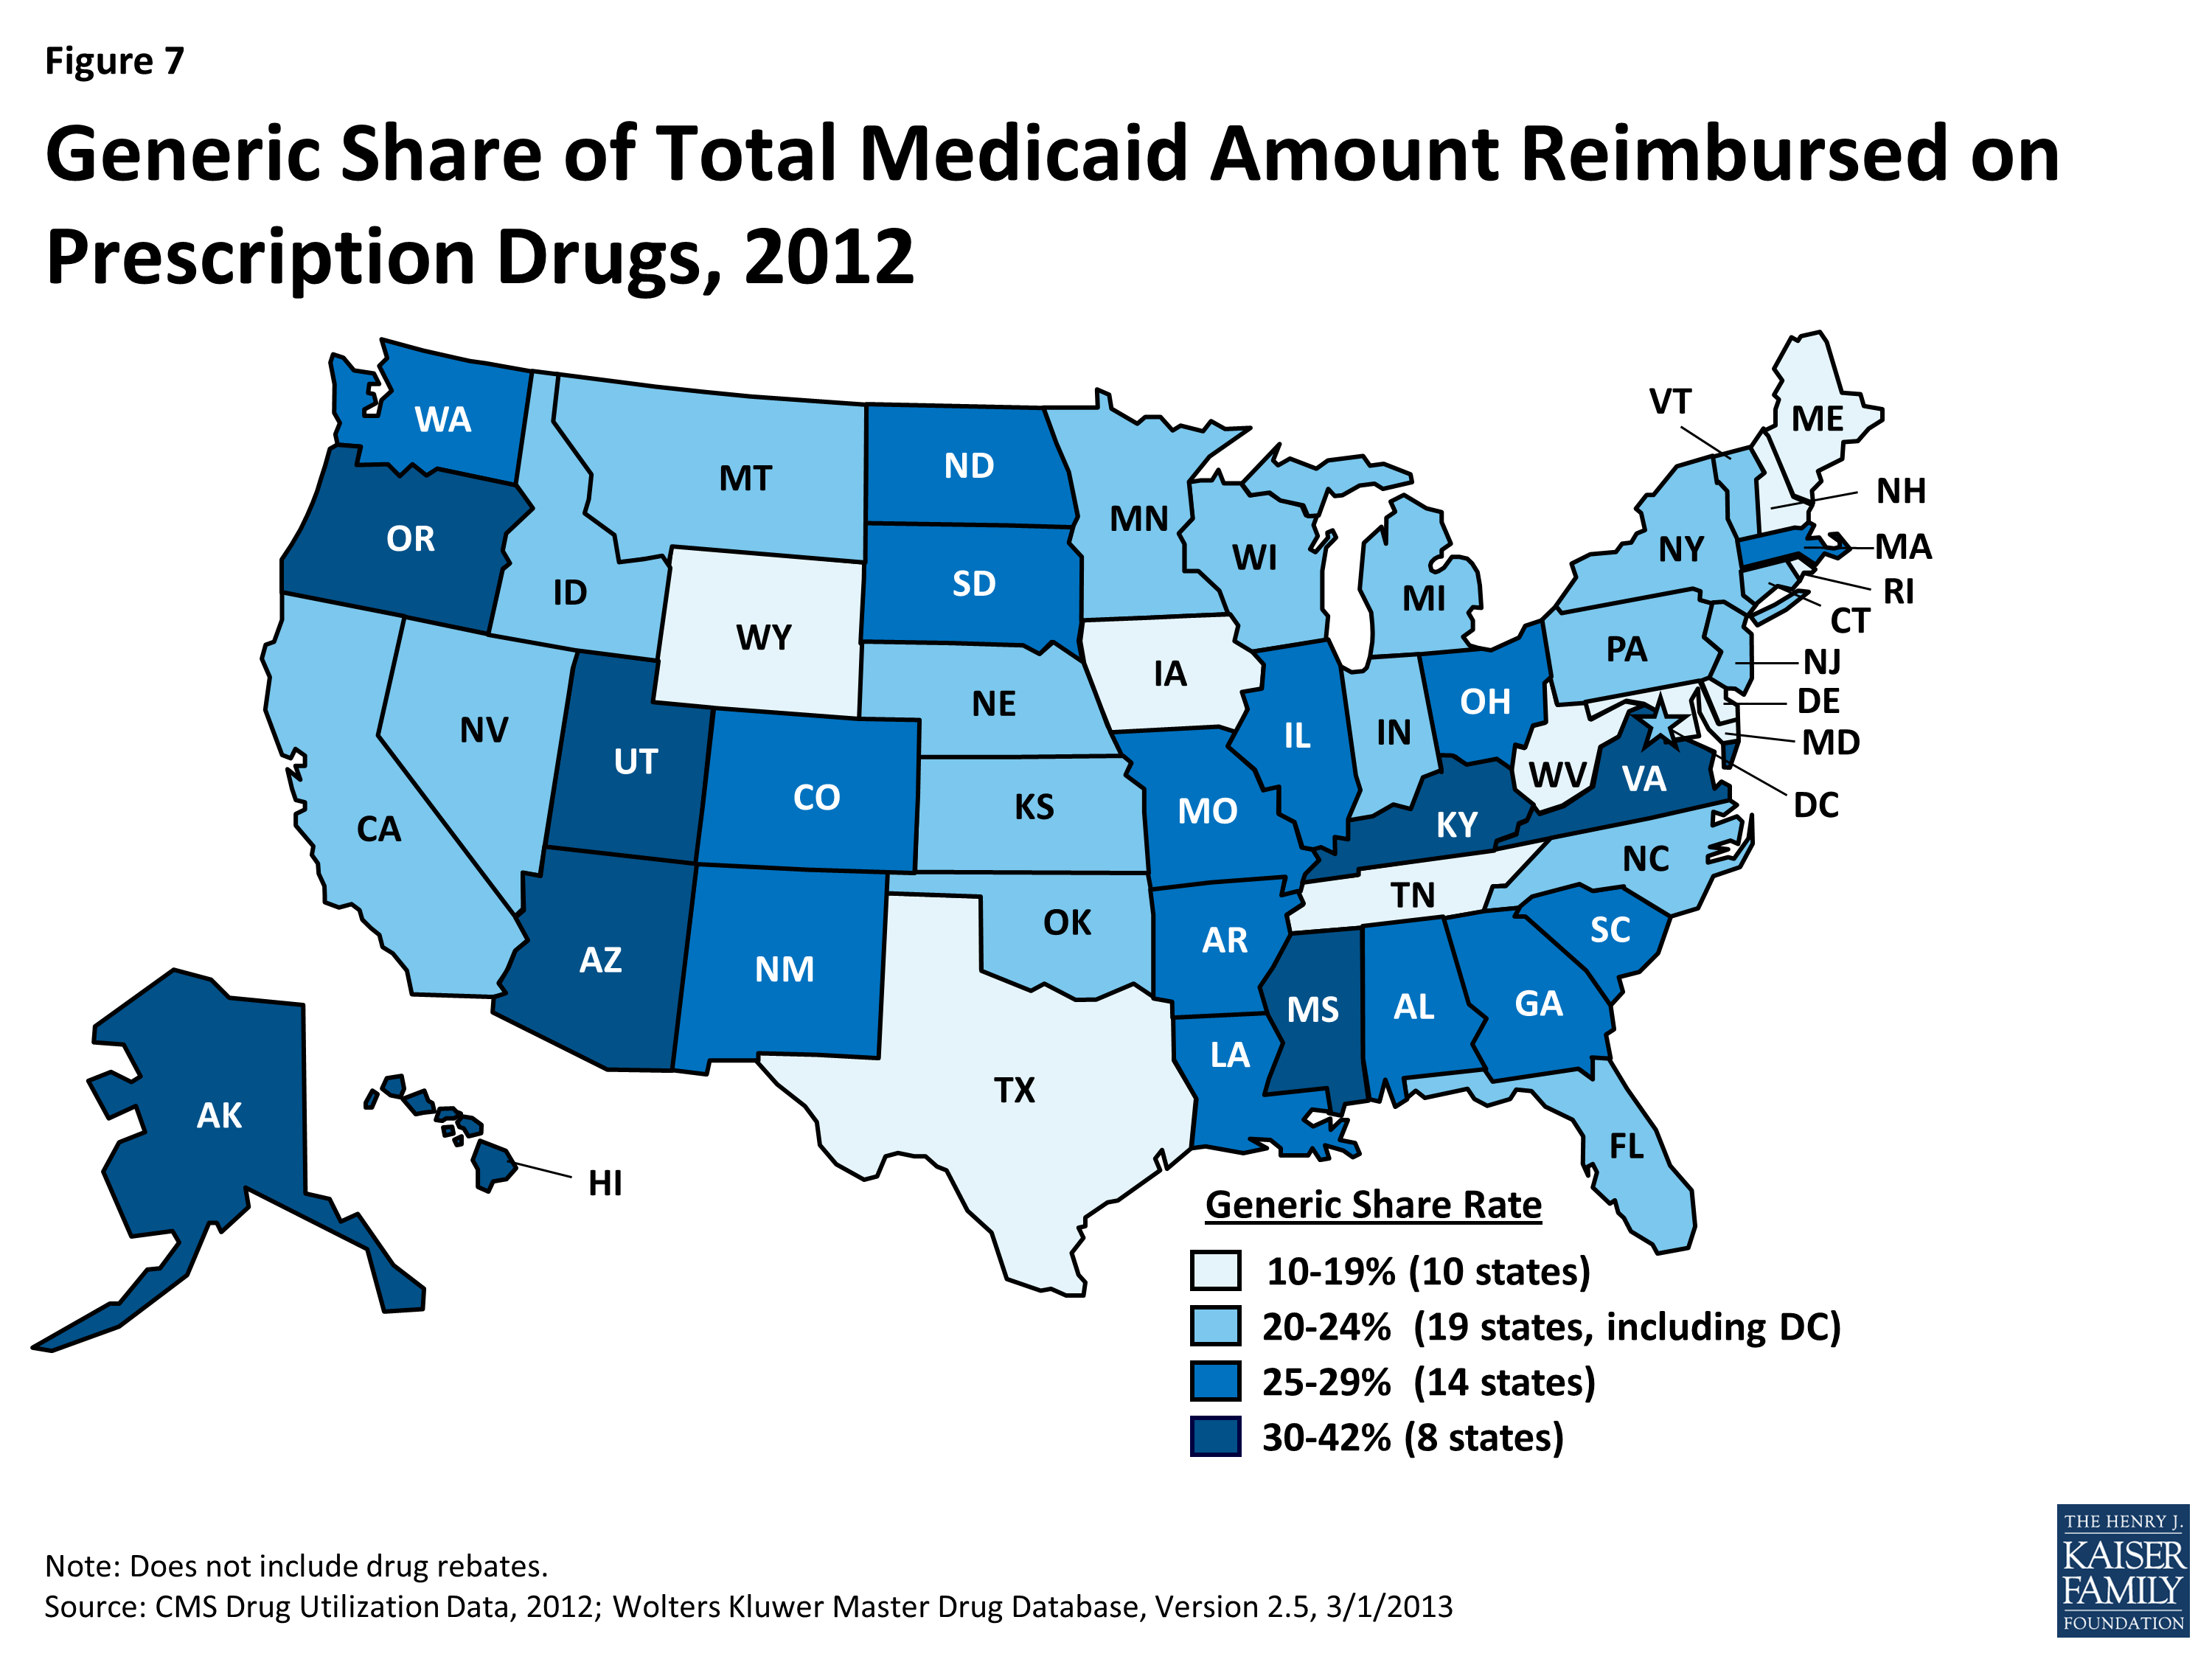
Figure 7: Generic Share of Total Medicaid Amount Reimbursed on Prescription Drugs, 2012
Discussion
Managing Medicaid prescription drug benefits is a balancing act between prices, rebates, and use. Policy makers aim to provide the necessary prescription drugs to those who need them while still being mindful of Medicaid spending and cost constraints. In recent years, states have emphasized promoting the use of generic drugs.22 These efforts take many forms including reduced (or no) cost sharing for patients when using generic drugs, higher dispensing fees or other incentives for pharmacists when dispensing generics, and physician education and feedback efforts by third-party payers and other groups (e.g., counter detailing, prescribing analyses). Economic factors played a role in encouraging more generic use, as Medicaid programs and patients sought relief from financial pressures stemming from the economic recession of 2007-2009 and the slow pace of economic recovery in its wake. Additionally, especially in 2011 and 2012, a large number of patents for blockbuster drugs expired. 23 Frequently deemed the “patent cliff,” this brought competition from lower-priced generics.
Policy makers are also vigilant of the high usage rates of certain classes of drugs. As described earlier, analgesics and antipyretics are the most commonly prescribed subclass within the Central Nervous System class of drugs. Use of opioids, which fall within this subclass, is an area of continued vigilance for Medicaid because opioids are the most commonly “diverted” drugs – that is, legally obtained, but subsequently used for illegal, and typically not medically necessary, reasons.24 Policy makers are also mindful of the high usage of behavioral health drugs, focusing on rates of off-label use; polypharmacy; appropriate dosage; use by very young children (< 6) and children in foster care; and prescribing patterns in nursing homes.25 One approach used by states has been to support evidence-based reviews to assess the extent to which drugs within a class may be interchangeable and to inform decisions about the use of particular benefit management tools (e.g., adding or removing prior authorization requirements), to support patient or provider education efforts, and other activities intended to improve the appropriateness of drug therapies.
States are increasingly looking at ways to better manage high-use, high-cost beneficiaries. Small percentages of Medicaid beneficiaries are responsible for large shares of total program expenditures in each state, and the same is true for prescription drug benefits. These individuals tend to have multiple medical and/or mental health conditions. Although there are likely to be opportunities for significant cost savings among these patients by addressing issues such as polypharmacy, and inappropriate and sometimes dangerous prescribing, the challenge is focusing efforts in ways that avoid both overuse and underuse of prescription drugs and that also take into account potential effects beyond the drug benefit. Simply targeting these beneficiaries with the intent to cut drug spending may be counter-productive if the approaches used result in higher costs in other parts of the Medicaid budget. In some cases, it may be appropriate to spend more money on prescription drugs to try to avoid more costly care in the future, such as hospitalizations.
At the same time, policy makers grapple with the very real concern that some drugs, specialty drugs, are so expensive that widespread use of them would cause fiscal problems at the state and federal level. Sovaldi is one such specialty drug, which the FDA approved in December 2013 for the treatment of Hepatitis C. Its manufacturer, Gilead Sciences, has set the list price at $1,000 a pill for Sovaldi, with total costs coming to $84,000 for a standard 12 week course of treatment.26 Sovaldi demonstrated cure rates above 90% in clinical trials without the side-effects found in other Hepatitis C treatments,27 but its high cost is a serious cause of concern for all health insurance providers, especially Medicaid. Some estimates are reporting that Medicaid plans will be covering up to 30 percent of Sovaldi patients, generating costs of at least $1 billion this year.28 In October 2014, the FDA approved Harvoni, another Hepatitis C treatment that is a fixed-dose combination tablet. It is priced comparably to Sovaldi when the latter is taken in combination with the other necessary antivirals approved as part of the treatment.29 The rapid growth of expenditures for specialty drugs is a major area of focus for federal and state policymakers.
Conclusion
Medicaid drug utilization and spending are concentrated within certain types of drugs. Specialty drugs comprise a small share of utilization, but their relatively high price tag is a cause of great concern for Medicaid pharmacy directors. Most prescriptions are for generic drugs, but brand drugs dominate spending. Individuals in different eligibility groups have very different spending patterns. The vast majority of drug prescriptions are for drugs in the Central Nervous System class. These imbalances point to many of the issues with which Medicaid pharmacy directors are grappling. Looming largest on the horizon is the financial complications of the increased use of specialty drugs, which raise issues of management of complex drug regimens and difficult questions concerning return on investment. Sovaldi and its successor Harvoni are two examples of this type of drug, and there are likely to be many more in the future. States are approaching this challenge in a variety of ways. They are also faced with the task of managing the behavioral health needs of Medicaid beneficiaries while also addressing the significant total cost for central nervous system agents and concerns about overuse of these medications. At the same time, these trends underscore the importance of policy actions long in place, such as the continued emphasis on generic utilization, and the Medicaid Drug Rebate Program.
This brief was prepared by Brian Bruen from George Washington University and Katherine Young from the Kaiser Family Foundation.
Appendices
| Table A1: Drug Spending and Utilization by Drug Class, 2010-2012 | |||||||
| Rx in Thousands | Medicaid Amount Reimbursed in Millions(not including rebates) | ||||||
| Drug Class | Typical Usage | 2010 | 2011 | 2012 | 2010 | 2011 | 2012 |
| Central Nervous System Agents | Broad category including pain relievers, antipsychotics, antidepressants | 163,198 | 187,523 | 184,543 | $11,022 | $13,048 | $12,030 |
| Anti-infective Agents | Dental, ear, respiratory, urinary tract infections | 48,778 | 58,195 | 54,253 | $3,919 | $4,854 | $5,123 |
| Cardiovascular Drugs | High blood pressure, high cholesterol | 44,886 | 51,027 | 51,989 | $1,728 | $1,864 | $1,539 |
| Hormones and Synthetic Substitutes | Diabetes, birth control, steroidal responses to auto-immune diseases | 43,271 | 50,165 | 50,728 | $3,446 | $4,218 | $4,466 |
| Autonomic Drugs | Asthma and muscle spasms | 27,791 | 33,873 | 33,674 | $1,725 | $2,154 | $2,192 |
| Gastrointestinal Drugs | Gastroesophageal reflux disease (aka heartburn), gastric ulcers | 26,490 | 30,787 | 31,281 | $1,542 | $1,597 | $1,206 |
| Skin and Mucous Membrane Preparations | Skin rashes and bacterial skin infections | 20,351 | 23,463 | 22,345 | $888 | $1,025 | $990 |
| Antihistamine Drugs | Allergy treatment and nausea suppressants | 18,070 | 20,844 | 19,549 | $270 | $262 | $211 |
| Eye, Ear, Nose & Throat Preparations | Allergy treatment and ear infections | 15,184 | 17,770 | 16,847 | $783 | $888 | $728 |
| Respiratory Tract Agents | Asthma and cough suppressants | 12,922 | 14,679 | 11,965 | $1,012 | $1,251 | $1,094 |
| Vitamins | Dietary supplements and osteoporosis | 12,752 | 14,120 | 14,082 | $251 | $242 | $184 |
| Electrolytic, Caloric, and Water Balance | High blood pressure, treatment of peripheral edema | 11,533 | 12,487 | 12,498 | $226 | $273 | $278 |
| Blood Formation, Coagulation & Thrombosis | Treatment and prevention of blood clots, coronary artery disease | 7,063 | 7,911 | 7,548 | $2,000 | $2,134 | $1,976 |
| Miscellaneous Therapeutic Agents | Osteoporosis, gout, and coronary artery disease | 4,085 | 4,342 | 4,162 | $1,232 | $1,504 | $1,682 |
| Antineoplastic Agents | Chemotherapy | 1,674 | 1,876 | 1,923 | $1,074 | $1,178 | $1,255 |
| Smooth Muscle Relaxants | Urinary incontinence | 1,465 | 1,522 | 1,431 | $114 | $118 | $106 |
| Pharmaceutical Aids | Flavored syrup vehicle, used as to create oral liquid formulations of medications, e.g. for children or the elderly | 328 | 192 | 191 | $5 | $4 | $5 |
| Devices | Used to clean surfaces prior to use/procedures, e.g. to prepare the skin before checking blood glucose/sugar | 180 | 158 | 212 | $2 | $2 | $2 |
| Local Anesthetics | Local anesthesia | 175 | 192 | 185 | $6 | $8 | $9 |
| Serums, Toxoids and Vaccines | Autoimmune disease treatment | 92 | 99 | 121 | $114 | $139 | $142 |
| Diagnostic Agents | Cardiac stress test | 75 | 121 | 128 | $9 | $13 | $19 |
| Oxytocics | Postpartum hemorrhage, labor induction | 75 | 70 | 62 | $1 | $1 | $1 |
| Heavy Metal Antagonists | Iron overload | 35 | 38 | 36 | $97 | $115 | $118 |
| Contraceptives | Contraception devices | 28 | 30 | 33 | $11 | $13 | $16 |
| Enzymes | Hunter Syndrome, Gaucher disease | 9 | 10 | 9 | $89 | $112 | $107 |
| Dental Agents | Dental caries | 9 | 12 | 10 | $0 | $0 | $0 |
| Blood Derivatives | Intravascular volume expansion | 3 | 3 | 3 | $2 | $2 | $3 |
| Disinfectants | Disinfectants | 2 | 1 | 1 | $0 | $0 | $0 |
| Gold Compounds | Rheumatoid arthritis | 0 | 0 | 0 | $0 | $0 | $0 |
| Cellular Therapy | Prostate Cancer | 0 | 0 | 0 | $0 | $0 | $1 |
| Unknown Class | 1,055 | 353 | 202 | $57 | $12 | $34 | |
| Source: CMS Drug Utilization Data, 2010-2012; Wolters Kluwer Master Drug Database, Version 2.5, 3/1/2013 | |||||||
| Table A2: Central Nervous System Agent Spending and Utilization by Subclass, 2010-2012 | |||||||
| Rx in Thousands |
Medicaid Amount Reimbursed in Millions
(not including rebates)
|
||||||
| Drug Subclass | 2010 | 2011 | 2012 | 2010 | 2011 | 2012 | |
| Analgesics and Antipyretics | 58,730 | 68,285 | 65,341 | $1,579 | $1,781 | $1,697 | |
| Anorexigenic Agents and Respiratory and CNS Stimulants | 11,366 | 13,864 | 14,322 | $1,550 | $2,062 | $2,176 | |
| Anticonvulsants | 21,842 | 24,793 | 25,553 | $1,190 | $1,322 | $1,317 | |
| Antimanic Agents | 858 | 935 | 923 | $17 | $18 | $16 | |
| Antimigraine Agents | 988 | 1,183 | 1,182 | $132 | $133 | $117 | |
| Antiparkinsonian Agents | 2,234 | 2,493 | 2,513 | $62 | $55 | $51 | |
| Anxiolytics, Sedatives, and Hypnotics | 23,960 | 26,570 | 26,093 | $374 | $387 | $345 | |
| Central Nervous System Agents, Misc | 1,575 | 2,154 | 2,348 | $264 | $392 | $474 | |
| Fibromyalgia Agents | 79 | 113 | 90 | $8 | $13 | $12 | |
| General Anesthetics | 61 | 68 | 76 | $5 | $6 | $7 | |
| Opiate Antagonists | 67 | 80 | 84 | $9 | $13 | $15 | |
| Psychotherapeutic Agents | 41,438 | 46,984 | 46,018 | $5,831 | $6,865 | $5,802 | |
| Source: CMS Drug Utilization Data, 2010-2012; Wolters Kluwer Master Drug Database, Version 2.5, 3/1/2013 | |||||||
Appendix B: Methodology
For our analysis of Medicaid drug trends, we used 2010-2013 State Drug Utilization Data merged with Wolters Kluwer Master Drug Data Base Version 2.5 (MDDB, V2.5). The State Drug Utilization Data is publicly available data used as part of the Medicaid Drug Rebate Program (MDRP). It provides data on the number of prescriptions, Medicaid spending, and cost-sharing for rebate-eligible Medicaid outpatient drugs at the National Drug Code (NDC) level. The MDDB provides pricing and product information for drug products. We used the State Drug Utilization Data available as of September 2013 and the MDDB, V2.5 from March 2013.
We merged the State Drug Utilization Data and the MDDB at the NDC-level to incorporate brand versus generic status and the American Hospital Formulary Service (AHFS) Therapeutic Class Code. We classified single-source; single-source, co-licensed; and multi-source, originator drugs all as brand drugs. Because there is no official definition of a specialty drug, we compiled a list of drugs that a variety of managed care organizations and pharmacy benefit management service organizations1 classified as specialty drugs.
We looked at the data in the 2010 to 2012 time frame. Only fee-for-service drugs were eligible for rebates through the MDRP until May 23, 2010, and as a result the State Drug Utilization Data prior to 2010 only reflected fee-for-service drugs until 2010. We used data from 2010 on, which includes both fee-for-service and managed care. There were a handful of quarters for states that had either missing or unreliable state drug utilization data between 2010 and 2012.2 For those quarters, we trended the spending and utilization data for each of the analyses by state using data for that state in the surrounding quarters.
Limitations
An important caveat is that the State Drug Utilization Data does not include rebates, which have a considerable effect on Medicaid drug spending.3 In addition to utilization data, rebates are calculated using manufacturer pricing data that is not available to the public, and as a result, it is difficult to obtain this information at the NDC-level.
Medicaid beneficiaries largely self-administer drugs they obtain in an outpatient setting, however it is necessary for physicians or other medical practitioners to administer some drugs. Although physician-administered outpatient drugs have always been included in the MDRP, a 2004 OIG report found that in 2001, only 17 states collected rebates for these drugs.4 The Deficit Reduction Act of 2005 specifically required states to collect manufacturer rebates on certain claims for physician-administered drugs, including all single-source drugs and the top 20 multiple-source (generic) drugs ranked by expenditures. States can collect rebates on other multiple-source drugs administered by physicians, and CMS encouraged them to do so. However, another survey by the U.S. Department of Health and Human Services Office of Inspector General found that about one-quarter of state Medicaid programs (13 of 49 responding) did not meet the mandated requirements as of early 2009.5 Coordination of outpatient drug benefits and physician-administered drugs covered under the medical benefit raises another set of issues for states, including choices about coverage of specific drugs under either the outpatient drug benefit or medical benefit part of the program. Many drugs that states classify as specialty drugs require a physician to administer or supervise dosing. Thus, we may not be capturing all specialty drugs in our analysis. In addition, states may be missing out on rebates for these specialty drugs.
Endnotes
Executive Summary
This report does not discuss ingredient cost reimbursement, except in the context of the Medicaid Drug Rebate Program. Ingredient cost reimbursement is discussed in great detail in B. Bruen and K. Young, “Paying for Prescribed Drugs in Medicaid: Current Policy and Upcoming Changes” Kaiser Family Foundation, May 2014. Available at https://www.kff.org/medicaid/issue-brief/paying-for-prescribed-drugs-in-medicaid-current-policy-and-upcoming-changes/.
Issue Brief
“National Health Expenditures” CMS. Available at http://www.cms.gov/Research-Statistics-Data-and-Systems/Statistics-Trends-and-Reports/NationalHealthExpendData/NationalHealthAccountsHistorical.html.
Ibid.
See V. Smith, S. Kramer, and R. Rudowitz, “Managing Medicaid Pharmacy Benefits: Current Issues and Options” Kaiser Family Foundation, September 2011. Available at https://www.kff.org/medicaid/report/managing-medicaid-pharmacy-benefits-current-issues-and-options/.
As part of the rebate program, manufacturers are required to report all covered drugs currently under their labeler code, as well the quarterly Average Manufacturer Price (AMP) for each National Drug Code (NDC). The drug rebate is calculated by statute and is based upon a lower-of formula involving AMP; what type of drug it is, including if it is a brand or a generic; the best price if it is a brand-name drug; and the Consumer Price Index-Urban. AMP is defined as the “average price paid to the manufacturer for the drug in the United States by wholesalers for drugs distributed to retail community pharmacies; and retail community pharmacies that purchase drugs directly from the manufacturer” with some exclusions (SSA Section 1927(k)(1)(A)). The NDC is a unique code that identifies each drug according to its labeler, strength, dosage form, package form, and package size. The best price is the lowest price paid by any payer.
U.S. Department of Health and Human Services- Office of Inspector General. “States Collections of Rebates for Drugs Paid Through Medicaid Managed Care Organizations” (OEI-03-11-00480), September 2012. Available at http://oig.hhs.gov/oei/reports/oei-03-11-00480.pdf.
Urban Institute estimate based on data from Medicaid Financial Management Reports (HCFA/CMS Form 64). From K. Young, L. Clemans-Cope, E. Lawton, and J. Holahan. “Medicaid Spending Growth in the Great Recession and Its Aftermath, FY 2007-2012” Kaiser Family Foundation, July 2014. Available at https://www.kff.org/medicaid/issue-brief/medicaid-spending-growth-in-the-great-recession-and-its-aftermath-fy-2007-2012/.
Kaiser Commission on Medicaid and the Uninsured and the Urban Institute estimates based on data from FY 2007 through FY 2010 MSIS. Because 2010 data were unavailable, 2009 MSIS data were used for CO, ID, MO, NC, and WV, and then adjusted to 2010 CMS-64 spending levels. MSIS drug spending represents fee-for-service spending only.
Ibid.
See Young et al.
“National Health Expenditures”
V. Smith, K. Gifford, and R. Rudowitz, “Headed for a Crunch: An Update on Medicaid Spending Coverage and Policy Heading into an Economic Downturn” Kaiser Family Foundation, September 2008; V. Smith, K. Gifford, E. Ellis, R. Rudowitz, M. Watts, C. Marks, “The Crunch Continues: Medicaid Spending, Coverage and Policy in the Midst of a Recession: Results from a 50-State Medicaid Budget Survey for State Fiscal Years 2009 and 2010” Kaiser Family Foundation, September 2009; V. Smith, K. Gifford, E. Ellis, R. Rudowitz, L. Snyder, “Hoping for Economic Recovery, Preparing for Health Reform: A Look at Medicaid Spending, Coverage and Policy Trends Results from a 50-State Medicaid Budget Survey for State Fiscal Years 2010 and 2011” Kaiser Family Foundation, September 2010; V. Smith, K. Gifford, E. Ellis, R. Rudowitz, L. Snyder, “Moving Ahead Amid Fiscal Challenges: A Look at Medicaid Spending, Coverage and Policy Trends Results from a 50-State Medicaid Budget Survey for State Fiscal Years 2011 and 2012” Kaiser Family Foundation, October 2011; V. Smith, K. Gifford, E. Ellis, R. Rudowitz, and L. Snyder, “Medicaid Today; Preparing for Tomorrow: A Look at State Medicaid Program Spending, Enrollment and Policy Trends Results from a 50-State Medicaid Budget Survey for State Fiscal Years 2012 and 2013” Kaiser Family Foundation, October 2012; V. Smith, K. Gifford, E. Ellis, R. Rudowitz, and L. Snyder, “Medicaid in a Historic Time of Transformation: Results from a 50-State Medicaid Budget Survey for State Fiscal Years 2013 and 2014” Kaiser Family Foundation, October 2013.
See Bruen and Young.
Medicaid and Children’s Health Insurance Programs: Essential Health Benefits in Alternative Benefit Plans, Eligibility Notices, Fair Hearing and Appeal Processes, and Premiums and Cost Sharing; Exchanges: Eligibility and Enrollment; Final Rule. 78 Federal Register 135, 15 July 2013, pp. 42160-42322.
See “National Health Expenditure Projections 2012-2022” Office of the Actuary in the Centers for Medicare & Medicaid Services. Available at http://www.cms.gov/Research-Statistics-Data-and-Systems/Statistics-Trends-and-Reports/NationalHealthExpendData/NationalHealthAccountsProjected.html.
American Hospital Formulary Service drug classes are from the American Society of Health-System Pharmacists (www.ahfsdruginformation.com). We accessed them through the Wolters Kluwer Master Drug Data Base (Version 2.5). See Appendix B: Methodology for more details.
As rebates at the drug level are not available to the public, we are unable to include rebates in this analysis.
U.S. Department of Health and Human Services- Substance Abuse and Mental Health Services Administration. “Medicaid Handbook: Interface with Behavioral Health Services” 2013. Available at http://store.samhsa.gov/shin/content//SMA13-4773/SMA13-4773.pdf.
D. Blaser, A. Lewtas, et al. “How to Define Specialty Pharmaceuticals – A Systematic Review” American Journal of Pharmaceutical Benefits, 2(6), 2010. See also Academy of Managed Care Pharmacy. “AMCP Format for Formulary Submission Guidelines”, version 3.1, December 2012. Available at http://www.amcp.org/practice-resources/amcp-format-formulary-submisions.pdf.
The Academy for Managed Care Pharmacy acknowledges that price is frequently a consideration in definitions used by individual organizations, but does not include price in its definition and argues that price alone should not be used to define specialty drugs.
Due to data quality issues, we have not calculated specialty drug shares in New Mexico, Rhode Island, and Texas.
“Abbreviated New Drug Application (ANDA): Generics” Available at http://www.fda.gov/Drugs/DevelopmentApprovalProcess/HowDrugsareDevelopedandApproved/
ApprovalApplications/AbbreviatedNewDrugApplicationANDAGenerics/For other methods that states use to reduce drug spending see Smith, Kramer, and Rudowitz.
CVS/Caremark. “Insights 2012” Available at http://www.cvscaremarkfyi.com/2012Insights.
U.S. Department of Health and Human Services- Centers for Medicare & Medicaid Services. “Drug Diversion in the Medicaid Program: State Strategies for Reducing Prescription Drug Diversion in Medicaid” January 2012. Available at http://www.cms.gov/Medicare-Medicaid-Coordination/Fraud-Prevention/MedicaidIntegrityProgram/downloads/drugdiversion.pdf.
See, for example, Government Accountability Office. “Children’s Mental Health: Concerns Remain about Appropriate Services for Children in Medicaid and Foster Care” December 2012. Available at http://www.gao.gov/assets/660/650716.pdf.
J. Rockoff, “Sales Soar for Pricey Hepatitis Drug Sovaldi” The Wall Street Journal, March 31, 2014. Available at http://online.wsj.com/news/articles/SB10001424052702303978304579473273033614530.
Ibid.
B. Japsen, “At $1,000 a Pill, Hepatitis C Drug Sovaldi Rattles Medicaid Programs” Forbes, April 28, 2014. Available at http://www.forbes.com/sites/brucejapsen/2014/04/28/pricey-hepatitis-pill-sovaldi-rattles-medicaid-programs/.
A. Pollak, “Harvoni, a Hepatitis C Drug From Giliead, Wins F.D.A. Approval” New York Times, October 10, 2014. Available at http://www.nytimes.com/2014/10/11/business/harvoni-a-hepatitis-c-drug-from-gilead-wins-fda-approval.html.
Appendices
We pulled formulary information from Aetna Specialty CareRx, BlueCross BlueShield of Rhode Island, CVS Caremark Specialty Pharmacy Services, Express Scripts, and Wellmark.
The state drug utilization data for the following states and quarters was either missing or unreliable: Colorado 2011Q4, Hawaii 2012Q2-Q4, Indiana 2012Q3, North Dakota 2012Q4, Texas 2012Q1 and 2012Q3, Utah 2012Q1, Virginia 2010Q2-2010Q4.
See “Medicaid Drug Rebate Program Data” Available at http://www.medicaid.gov/Medicaid-CHIP-Program-Information/By-Topics/Benefits/Prescription-Drugs/Medicaid-Drug-Rebate-Program-Data.html.
U.S. Department of Health and Human Services- Office of Inspector General. “Medicaid Rebates for Physician-Administered Drugs” (OEI-03-02-00660) September 2012. Available at http://oig.hhs.gov/oei/reports/oei-03-11-00480.pdf.
U.S. Department of Health and Human Services- Office of Inspector General. “States Collection of Medicaid Rebates for Physician-Administered Drugs” (OEI-03-09-00410) June 2011. Available at http://oig.hhs.gov/oei/reports/oei-03-09-00410.pdf. States continue to face challenges carrying out these requirements: Providers may not report all of the information needed to support rebate claims; state systems may not accurately capture relevant information or may accept claims without complete documentation; and manufactures may challenge claims because of concerns over the accuracy of claims information. For example, see Nebraska Department of Health and Human Services. “Medicaid Drug Rebate Program – National Drug Code (NDC) Reporting Requirement for Physician Administered Drugs New Quantity Limits” Provider Bulletin No. 13-63. September 5, 2013. Available at http://dhhs.ne.gov/medicaid/Documents/PB1363.pdf.