Preliminary Data on Insurer Exits and Entrants in 2017 Affordable Care Act Marketplaces
In October 2016, the Foundation issued a updated version of this analysis with a new county-level interactive map and slideshow
The following charts provide a preliminary picture of the potential effect insurer exits and entrants may have on competition and consumer choice in the Affordable Care Act (ACA) marketplaces. This analysis was done at the request of the Wall Street Journal. Our earlier analysis found that UnitedHealth’s absence from these markets would leave many parts of the country with fewer marketplace insurers, and that the number of counties with a single insurer would likely increase substantially if there were no new entrants. Similarly, our July analysis of insurer participation in 17 states with detailed, publicly available premium and participation data found that on average there would be fewer insurers participating in 2017 in these states than there had been in 2016 or 2015.
Since the time of our earlier analyses, more details have emerged on the degree to which some insurance companies, most recently Aetna and Oscar, are planning to scale back or withdrawing their participation on the marketplaces. Meanwhile other insurers, including Cigna, have noted their intent to enter into new markets or expand their offerings in their 2017 rate filings to state regulators.
Despite these new details, much is still unknown and the majority of states’ 2017 filings are either redacted or unavailable publicly. Because only premium changes, and not new entrant premiums, are posted on Healthcare.gov’s rate review site, it is also likely that more is known at this time of market exits than is known of entrants. Complete information on insurer participation and premiums across all states does not typically become public until shortly before the beginning of the open enrollment season. It is therefore likely that the complete picture of how entrants and exits are shaping these markets in 2017 will not come into focus for two more months.
Given these limitations, it is too soon to say with certainty how many marketplace insurers enrollees will have available to them when they go to shop for coverage in November. In this analysis, we start with insurers’ participation in 2016 and make adjustments for reported entrants, exits, scale-backs, and expansions. More information on our methods and limitations can be found below. We intend to update this analysis when more complete data are available.
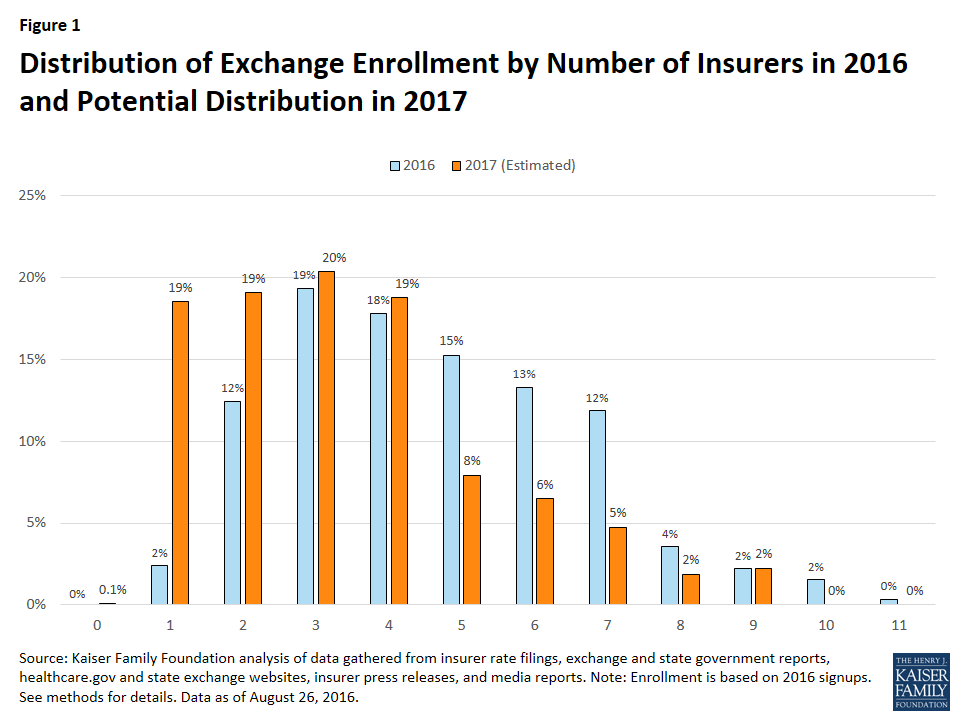
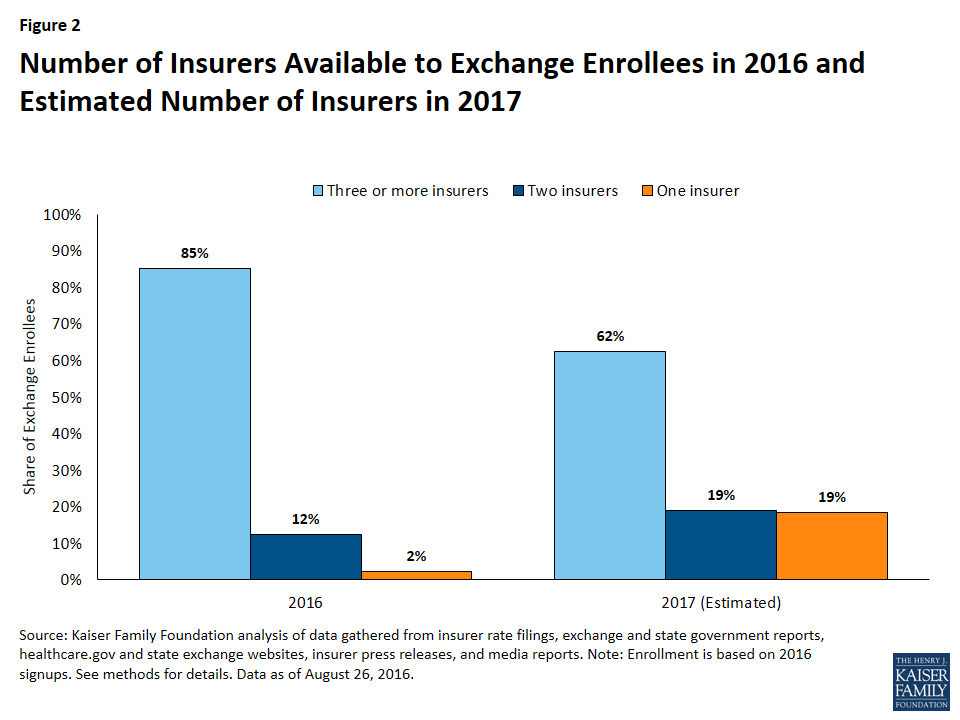
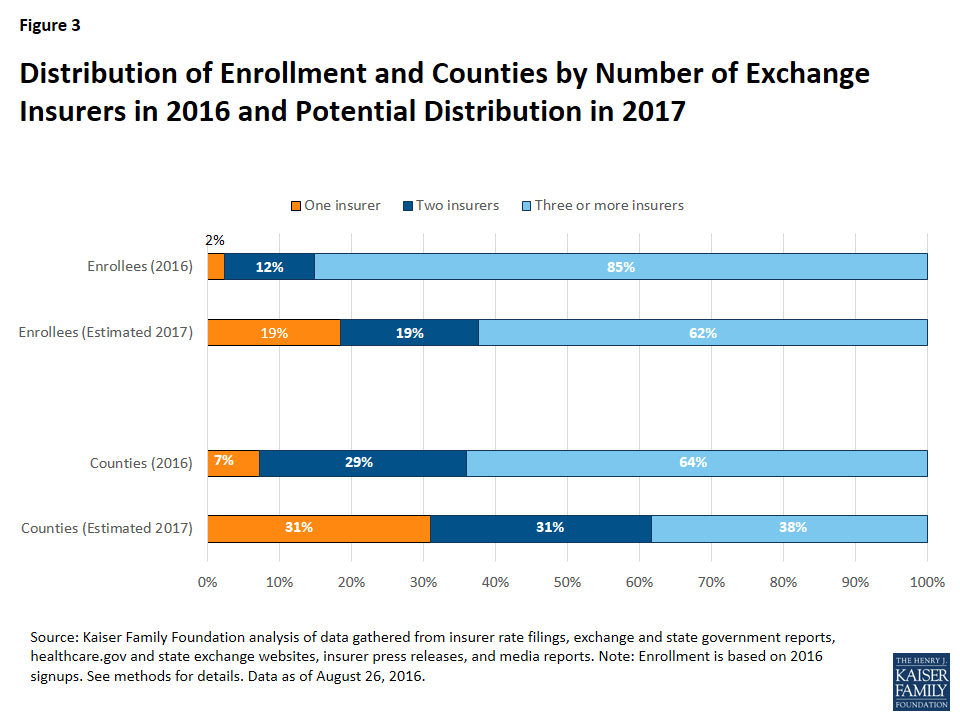
We find that most marketplace enrollees will likely continue to have a choice of three or more plans in 2017, based on what is currently known of marketplace insurer participation and changes next year. However, assuming county-level enrollment holds steady from 2016 to 2017, a smaller share of enrollees will likely have a choice of three or more insurers in 2017 than in previous years. We estimate that 62% of enrollees in 2017 will have a choice of three or more insurers, compared to 85% of enrollees in 2016.
We estimate that 2.3 million marketplace enrollees, or 19% of all enrollees, could have a choice of a single insurer in 2017, which is an increase of 2 million people compared to 2016. Going into marketplace open enrollment in 2016, about 303,000 enrollees (2%) had a single insurer option.
Similarly, we estimate that the number of counties with a single marketplace insurer is likely to increase, from 225 (7% of counties) in 2016 to 974 (31% of counties) in 2017. Approximately 6 in 10 counties could have 2 or fewer marketplace insurers in 2017. The bulk of the increase in single-insurer counties is a result of the UnitedHealth exit, as the company was often the second insurer in rural areas.
In 2016, counties with a single marketplace insurer are concentrated in a handful of states, particularly rural ones: Wyoming (where 100% of counties have one insurer), West Virginia (82%), Utah (69%), South Carolina (63%), and Nevada (59%).
Given what is known at this time of entrants and exits, four additional states are likely to have a single marketplace insurer in all counties: Alabama, Alaska, Oklahoma, and South Carolina, for a total of five states (including Wyoming, which already had one insurer in the state). Other states with significantly more single-insurer counties in 2017 will likely include Arizona (87% of counties in 2017, compared to none in 2016), Mississippi (80% vs. 0%), Missouri (85% vs. 2%), Florida (73% vs. 0%), North Carolina (90% vs. 23%), and Tennessee (60% vs. 0%). With the exception of Alaska, the states left with the most limited exchange participation as a result of 2017 market exits are likely to be in the south.
One county, Pinal County in Arizona, could be at risk of having no insurer options on the marketplace, given what is currently known of exits in the state. However, this could change as another plan that offers elsewhere in the state could expand its service area. In the figures cited in the paragraph above, Pinal County is grouped with single-insurer counties in Arizona.
Rural areas have historically had lower insurer participation, so even one exit can have a significant effect on consumer choice. About 629,000 marketplace enrollees who live in primarily rural counties will likely have a single insurer in 2017, representing 41% of all marketplace enrollees living in mostly rural counties (up from 7% in 2016). Marketplace enrollees living in some urban areas will also have less choice as a result of the exits. As many as 1.7 million enrollees who live in primarily urban counties could have a single marketplace insurer in 2017, representing 15% of all enrollees living in mostly urban counties (up from 2% in 2016).
About 7.9 million enrollees are likely to have three or more choices of marketplace insures in 2017, based on information currently available on entrants and exits. Of these enrollees with at least three choices, the vast majority (7.4 million) live in counties that are primarily urban, while 504,000 live in counties that are primarily rural. Our analysis of information currently available finds that about two out of every three enrollees in primarily urban counties (66%) will likely have a choice of at least three marketplace insurers in 2017, while one in three enrollees in primarily rural counties (33%) are likely to have a choice of three or more insurers.
The map below shows counties where we estimate there could be one or two marketplace insurers in 2017, and the 50-state tables show changes in the number of counties with one insurer from 2016 to 2017 in each state.
| Table 1: Distribution of Counties by Number of Exchange Insurers in 2016 and Potential Distribution in 2017 | ||||||||
| State | 2016 | 2017 (Estimated) | ||||||
| No Insurer | 1 Insurer | 2 Insurer | 3+ Insurer | No Insurer | 1 Insurer | 2 Insurer | 3+ Insurer | |
| AL | – | – | 60 (90%) | 7 (10%) | – | 67 (100%) | – | – |
| AK | – | – | 30 (100%) | – | – | 30 (100%) | – | – |
| AZ | – | – | 8 (53%) | 7 (47%) | 1 (7%) | 12 (80%) | 2 (13%) | – |
| AR | – | – | – | 75 (100%) | – | – | – | 75 (100%) |
| CA | – | – | 1 (2%) | 57 (98%) | – | – | 27 (47%) | 31 (53%) |
| CO | – | – | 4 (6%) | 60 (94%) | – | – | 47 (73%) | 17 (27%) |
| CT | – | – | – | 8 (100%) | – | – | 8 (100%) | – |
| DE | – | – | 3 (100%) | – | – | – | 3 (100%) | – |
| DC | – | – | 1 (100%) | – | – | – | 1 (100%) | – |
| FL | – | – | 44 (66%) | 23 (34%) | – | 49 (73%) | 8 (12%) | 10 (15%) |
| GA | – | – | 30 (19%) | 129 (81%) | – | 77 (48%) | 49 (31%) | 33 (21%) |
| HI | – | – | 5 (100%) | – | – | – | 5 (100%) | – |
| ID | – | – | – | 44 (100%) | – | – | – | 44 (100%) |
| IL | – | – | – | 102 (100%) | – | 8 (8%) | 69 (68%) | 25 (25%) |
| IN | – | – | – | 92 (100%) | – | – | 27 (29%) | 65 (71%) |
| IA | – | – | 21 (21%) | 78 (79%) | – | – | 49 (49%) | 50 (51%) |
| KS | – | – | 105 (100%) | – | – | – | 105 (100%) | – |
| KY | – | – | 66 (55%) | 54 (45%) | – | 54 (45%) | 48 (40%) | 18 (15%) |
| LA | – | – | – | 64 (100%) | – | – | 59 (92%) | 5 (8%) |
| ME | – | – | – | 16 (100%) | – | – | – | 16 (100%) |
| MD | – | – | – | 24 (100%) | – | – | – | 24 (100%) |
| MA | – | – | – | 14 (100%) | – | – | – | 14 (100%) |
| MI | – | 14 (17%) | 24 (29%) | 45 (54%) | – | 14 (17%) | 27 (33%) | 42 (51%) |
| MN | – | – | – | 87 (100%) | – | – | 26 (30%) | 61 (70%) |
| MS | – | – | 50 (61%) | 32 (39%) | – | 66 (80%) | 16 (20%) | – |
| MO | – | – | 2 (2%) | 113 (98%) | – | 98 (85%) | 13 (11%) | 4 (3%) |
| MT | – | – | – | 56 (100%) | – | – | – | 56 (100%) |
| NE | – | – | – | 93 (100%) | – | – | 2 (2%) | 91 (98%) |
| NV | – | 10 (59%) | 4 (24%) | 3 (18%) | – | 10 (59%) | 4 (24%) | 3 (18%) |
| NH | – | – | – | 10 (100%) | – | – | – | 10 (100%) |
| NJ | – | – | – | 21 (100%) | – | – | – | 21 (100%) |
| NM | – | – | – | 33 (100%) | – | – | – | 33 (100%) |
| NY | – | – | 3 (5%) | 59 (95%) | – | – | 3 (5%) | 59 (95%) |
| NC | – | 23 (23%) | 38 (38%) | 39 (39%) | – | 90 (90%) | 10 (10%) | – |
| ND | – | – | 4 (8%) | 49 (92%) | – | – | 4 (8%) | 49 (92%) |
| OH | – | – | – | 88 (100%) | – | – | 5 (6%) | 83 (94%) |
| OK | – | – | 77 (100%) | – | – | 77 (100%) | – | – |
| OR | – | – | – | 36 (100%) | – | – | – | 36 (100%) |
| PA | – | – | – | 67 (100%) | – | 5 (7%) | 34 (51%) | 28 (42%) |
| RI | – | – | – | 5 (100%) | – | – | 5 (100%) | – |
| SC | – | 29 (63%) | 15 (33%) | 2 (4%) | – | 46 (100%) | – | – |
| SD | – | – | 66 (100%) | – | – | – | 66 (100%) | – |
| TN | – | – | 57 (60%) | 38 (40%) | – | 57 (60%) | 24 (25%) | 14 (15%) |
| TX | – | 58 (23%) | 110 (43%) | 86 (34%) | – | 88 (35%) | 129 (51%) | 37 (15%) |
| UT | – | 20 (69%) | 3 (10%) | 6 (21%) | – | 20 (69%) | 2 (7%) | 7 (24%) |
| VT | – | – | 14 (100%) | – | – | – | 14 (100%) | – |
| VA | – | – | 37 (28%) | 97 (72%) | – | 29 (22%) | 38 (28%) | 67 (50%) |
| WA | – | – | 6 (15%) | 33 (85%) | – | 5 (13%) | 11 (28%) | 23 (59%) |
| WV | – | 45 (82%) | 10 (18%) | – | – | 45 (82%) | 10 (18%) | – |
| WI | – | 3 (4%) | 7 (10%) | 62 (86%) | – | 4 (6%) | 13 (18%) | 55 (76%) |
| WY | – | 23 (100%) | – | – | – | 23 (100%) | – | – |
| US | – | 225 (7%) | 905 (29%) | 2,014 (64%) | 1 (0%) | 974 (31%) | 963 (31%) | 1,206 (38%) |
| Source: Kaiser Family Foundation analysis as of August 26, 2016. | ||||||||
| Table 2: Distribution of Enrollees by Number of Exchange Insurers in 2016 and Potential Distribution in 2017 | ||||||||
| State | 2016 | 2017 (Estimated) | ||||||
| No Insurer | 1 Insurer | 2 Insurer | 3+ Insurer | No Insurer | 1 Insurer | 2 Insurer | 3+ Insurer | |
| AL | – | – | 130,000 (67%) | 65,000 (33%) | – | 195,000 (100%) | – | – |
| AK | – | – | 23,000 (100%) | – | – | 23,000 (100%) | – | – |
| AZ | – | – | 31,000 (15%) | 172,000 (85%) | 10,000 (5%) | 36,000 (18%) | 157,000 (78%) | – |
| AR | – | – | – | 74,000 (100%) | – | – | – | 74,000 (100%) |
| CA | – | – | 1,000 (0%) | 1,575,000 (100%) | – | – | 86,000 (5%) | 1,489,000 (95%) |
| CO | – | – | 8,000 (5%) | 143,000 (95%) | – | – | 30,000 (20%) | 120,000 (80%) |
| CT | – | – | – | 116,000 (100%) | – | – | 116,000 (100%) | – |
| DE | – | – | 28,000 (100%) | – | – | – | 28,000 (100%) | – |
| DC | – | – | 23,000 (100%) | – | – | – | 23,000 (100%) | – |
| FL | – | – | 268,000 (15%) | 1,475,000 (85%) | – | 352,000 (20%) | 258,000 (15%) | 1,133,000 (65%) |
| GA | – | – | 20,000 (3%) | 568,000 (97%) | – | 81,000 (14%) | 83,000 (14%) | 424,000 (72%) |
| HI | – | – | 15,000 (100%) | – | – | – | 15,000 (100%) | – |
| ID | – | – | – | 101,000 (100%) | – | – | – | 101,000 (100%) |
| IL | – | – | – | 388,000 (100%) | – | 56,000 (14%) | 99,000 (26%) | 233,000 (60%) |
| IN | – | – | – | 196,000 (100%) | – | – | 24,000 (12%) | 172,000 (88%) |
| IA | – | – | 5,000 (10%) | 50,000 (90%) | – | – | 17,000 (31%) | 38,000 (69%) |
| KS | – | – | 102,000 (100%) | – | – | – | 102,000 (100%) | – |
| KY | – | – | 31,000 (33%) | 63,000 (67%) | – | 26,000 (28%) | 32,000 (35%) | 35,000 (38%) |
| LA | – | – | – | 214,000 (100%) | – | – | 131,000 (61%) | 83,000 (39%) |
| ME | – | – | – | 84,000 (100%) | – | – | – | 84,000 (100%) |
| MD | – | – | – | 162,000 (100%) | – | – | – | 162,000 (100%) |
| MA | – | – | – | 214,000 (100%) | – | – | – | 214,000 (100%) |
| MI | – | 13,000 (4%) | 57,000 (17%) | 276,000 (80%) | – | 13,000 (4%) | 59,000 (17%) | 274,000 (79%) |
| MN | – | – | – | 84,000 (100%) | – | – | 13,000 (16%) | 70,000 (84%) |
| MS | – | – | 47,000 (43%) | 62,000 (57%) | – | 63,000 (58%) | 46,000 (42%) | – |
| MO | – | – | 4,000 (1%) | 286,000 (99%) | – | 101,000 (35%) | 136,000 (47%) | 53,000 (18%) |
| MT | – | – | – | 58,000 (100%) | – | – | – | 58,000 (100%) |
| NE | – | – | – | 88,000 (100%) | – | – | 1,000 (1%) | 87,000 (99%) |
| NV | – | 3,000 (3%) | 6,000 (7%) | 79,000 (90%) | – | 3,000 (3%) | 6,000 (7%) | 79,000 (90%) |
| NH | – | – | – | 55,000 (100%) | – | – | – | 55,000 (100%) |
| NJ | – | – | – | 289,000 (100%) | – | – | – | 289,000 (100%) |
| NM | – | – | – | 55,000 (100%) | – | – | – | 55,000 (100%) |
| NY | – | – | 2,000 (1%) | 269,000 (99%) | – | – | 2,000 (1%) | 269,000 (99%) |
| NC | – | 50,000 (8%) | 155,000 (25%) | 409,000 (67%) | – | 490,000 (80%) | 123,000 (20%) | – |
| ND | – | – | 1,000 (3%) | 21,000 (97%) | – | – | 1,000 (3%) | 21,000 (97%) |
| OH | – | – | – | 244,000 (100%) | – | – | 3,000 (1%) | 241,000 (99%) |
| OK | – | – | 145,000 (100%) | – | – | 145,000 (100%) | – | – |
| OR | – | – | – | 147,000 (100%) | – | – | – | 147,000 (100%) |
| PA | – | – | – | 439,000 (100%) | – | 173,000 (39%) | 143,000 (33%) | 124,000 (28%) |
| RI | – | – | – | 35,000 (100%) | – | – | 35,000 (100%) | – |
| SC | – | 91,000 (39%) | 116,000 (50%) | 25,000 (11%) | – | 232,000 (100%) | – | – |
| SD | – | – | 26,000 (100%) | – | – | – | 26,000 (100%) | – |
| TN | – | – | 79,000 (29%) | 190,000 (71%) | – | 79,000 (29%) | 69,000 (26%) | 121,000 (45%) |
| TX | – | 55,000 (4%) | 123,000 (9%) | 1,128,000 (86%) | – | 162,000 (12%) | 383,000 (29%) | 761,000 (58%) |
| UT | – | 34,000 (19%) | 6,000 (3%) | 136,000 (77%) | – | 34,000 (19%) | 3,000 (2%) | 139,000 (79%) |
| VT | – | – | 29,000 (100%) | – | – | – | 29,000 (100%) | – |
| VA | – | – | 73,000 (17%) | 349,000 (83%) | – | 21,000 (5%) | 91,000 (22%) | 309,000 (73%) |
| WA | – | – | 7,000 (3%) | 194,000 (97%) | – | 7,000 (3%) | 22,000 (11%) | 172,000 (86%) |
| WV | – | 26,000 (70%) | 11,000 (30%) | – | – | 26,000 (70%) | 11,000 (30%) | – |
| WI | – | 7,000 (3%) | 7,000 (3%) | 225,000 (94%) | – | 8,000 (3%) | 12,000 (5%) | 219,000 (92%) |
| WY | – | 24,000 (100%) | – | – | – | 24,000 (100%) | – | – |
| US | – | 303,000 (2%) | 1,578,000 (12%) | 10,801,000 (85%) | 10,000 (0%) | 2,349,000 (19%) | 2,417,000 (19%) | 7,906,000 (62%) |
| Source: Kaiser Family Foundation analysis as of August 26, 2016. | ||||||||
Methods and Limitations
As complete insurer participation data are not yet available for the 2017 marketplaces, we began our analysis with data on participation in 2016. We gathered these data from healthcare.gov for states with a federally run, partnership, and facilitated marketplaces. For states that run their own exchanges, we compiled 2016 insurer participation data by reviewing rate filings to state regulators and reports released by some states. We then verified county-level data in these states by searching state plan shopping tools. We grouped insurers by parent company or group affiliation, which we obtained from HHS Medical Loss Ratio public use files and supplemented with additional research. We then analyzed, at the county level, how many parent companies participate in these Marketplaces.
Using this data on 2016 insurer participation, we made adjustments based on information we could find on 2017 entrants, exits, scale-backs, and expansions. In total, we made over 600 changes at both the state and county levels. We took two different approaches, depending on the amount of information that is available in a given state:
- In the 17 states included in our 2017 premium and participation analysis published in July, 2016 we are able to account for changes in participation, including new entrants and service area expansions based on rate filings to state regulators. For example, in California, the start-up insurer Oscar had already participated in 2016 and is planning to expand to other parts of the state in 2017, according to a report by the exchange. In the 17 states in our premium analysis where detailed information is available, we also compared insurer participation in 2016 and 2017 to account for any scale-backs. For example, we found that Sentara (Optima) is scaling back its participation in many Virginia counties, while remaining in some counties. We then supplemented rate filing data with media reports when necessary. For example, Aetna had submitted filings to enter into the Indiana exchange, but reportedly no longer intends to expand into new states, so we do not include the company as a new entrant.–
- In other states not included in our July analysis, we also account for new entrants, scale-backs, and expansions where we could find this information through news coverage and press releases, and attempted to verify these reports against redacted rate filings available on Healthcare.gov. For all reported new entrants in our analysis, we attempt to verify the counties and/or regions they would service rather than assuming state-wide entry. For example, a press release indicates that Medica is entering the entire state of Kansas, while Wellcare is entering 47 counties in Iowa. In cases where a new entrant is reported to offer in a specific metro area, but where counties are not specified and no detailed filing is available, for example in the case of Cigna reportedly entering into Raleigh, NC and other cities, we treat the company as if it is entering the rating area that includes the major city.–We also attempt to account for reported scale-backs, or insurers continuing to offer in states but with a more limited service area, when information is available. In these states where detailed filings are not publicly available, we rely on what is known of insurers’ current participation and what has been reported of their future participation. For example, in Georgia, UnitedHealth Group will no longer offer plans under its subsidiary United Healthcare but reportedly will continue to offer through another subsidiary, Harken Health. Therefore, we treat UnitedHealth Group as exiting all counties in Georgia with the exception of those counties where Harken Health branded plans are currently offered.
To the extent possible, we have attempted to account for any reported entrant, exit, scale-back, or expansion in our analysis, but are limited in our ability to do so because the market is undergoing changes, data are limited, and we may not be aware of all developments even if they have been reported. The information we gathered for this analysis is still preliminary and will continue to evolve over the coming months as more information becomes public. We intend to update this analysis when more complete data are available for 2017 exchange insurer participation.–Enrollment numbers in this analysis are based on 2016 exchange signups as of the end of open enrollment (February 2016). In states using Healthcare.gov, county level enrollment is made available by The U.S. Department of Health and Human Services. In states that run their own exchanges, county-level enrollment is estimated by distributing total state enrollment by county population using data from the Missouri Census Data Center. All estimates relating to 2017 enrollment assume that enrollment at the county level holds steady from 2016 to 2017, but total enrollment will likely change as will the distribution of enrollment across counties. The percent of county population residing in rural areas was obtained from the Missouri Census Data Center. Counties where more than 50% of the population lives in rural areas are considered primarily rural and other counties are considered primarily urban.