New Analysis Indicates U.S. County Vaccination Rates Do Not Correspond to COVID-19 Impact Thus Far
An analysis of Centers for Disease Control and Prevention (CDC) COVID-19 vaccination data from 72% of all counties in the U.S. shows that counties classified as having “low” COVID-19 community transmission (cases and positive tests) levels have an average vaccination rate greater than the rate in counties with “high” community transmission levels. Additionally, counties with the lowest COVID-19 deaths per 100,000 people have an average vaccination rate greater than the rates in counties with the highest COVID-19 deaths per 100,000 people. Vaccination rates in the analysis are defined as the percent of the relevant population within a county that has been fully vaccinated.
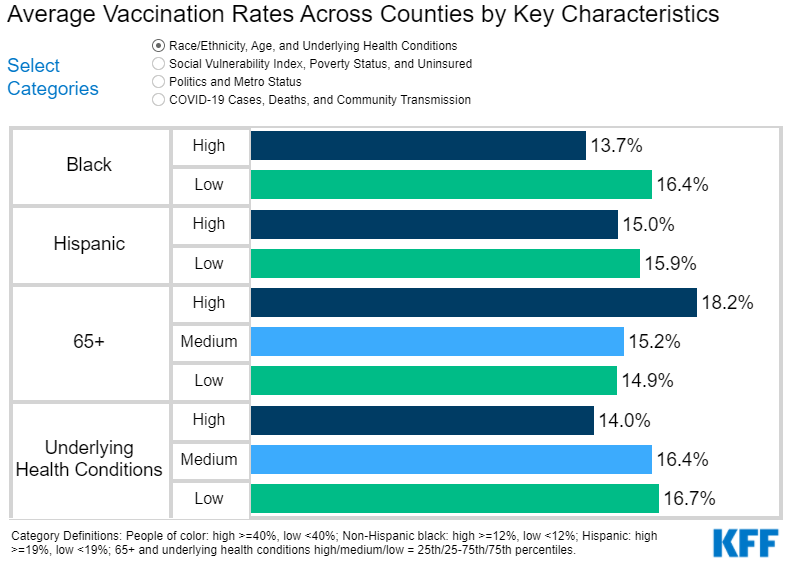
Previous analyses have shown that the pandemic has had a disproportionate impact on people of color and that Black and Hispanic people are receiving smaller shares of COVID-19 vaccinations compared to their shares of cases and deaths and to their shares of the overall population. The brief, Vaccination is Local: COVID-19 Vaccination Rates Vary by County and Key Characteristics, provides further insight into these equity issues. Counties with higher shares of Black people have a vaccination rate of 13.7% compared to 16.4% for counties with low shares of Black people. The population vaccination rate in counties with higher shares of Hispanic people is 15% versus 15.9% for counties with lower shares of Hispanic people.
The analysis also examines how county vaccination rates align with CDC prioritization recommendations and ensuing state decisions. With all states prioritizing older adults, counties with higher shares of people age 65 and older have an 18.2% vaccination rate compared to 14.9% in counties with lower shares of the population.
However, while many states are prioritizing individuals with certain high-risk medical conditions, counties with higher shares of people with certain high-risk conditions have a lower vaccination rate compared to counties with lower shares of people with these conditions (14% versus 16.7%).
Other findings from the analysis include:
- Higher county uninsured and poverty rates are associated with lower vaccination rates.
- Metro counties have lower vaccination rates for the total population than non-metro counties.
- Rates are lower in counties that voted for Donald Trump compared to those that voted for Joe Biden.