Recent Trump Administration Policies that Impact Health Coverage and Care for Immigrant Families

Published: Oct 8, 2025

Introduction

Immigrants form a growing share of the U.S. population and workforce, and as of 2024, there were over 50 million immigrants residing in the country. President Trump’s agenda has focused on restricting immigration and enhancing immigration enforcement, which research shows has negative impacts on the mental and physical health of immigrant families, including the millions of U.S. citizen children living in them, as well as broader economic effects on communities. The Trump administration and Congress also have made policy changes that further restrict access to health coverage and care for immigrant families.

This issue brief provides an overview of Trump administration and Congressional actions that are likely to impact immigrants’ access to health coverage and care, including new restrictions on eligibility for health coverage and services as well as changes in immigration enforcement and other policies. Together, these changes will likely increase uninsured rates and reduce access to care among immigrants and their children. Over the long-term, these changes may also lead to worse health outcomes and have negative impacts on the U.S. economy and workforce, given the major role immigrants play, particularly in certain industries, including health care, agriculture, and construction.

Reductions in Access to Health Coverage

The 2025 tax and budget law includes significant cuts to the Medicaid program as well as eligibility restrictions that make many lawfully present immigrants (LPIs) ineligible for Medicaid and the Children’s Health Insurance Program (CHIP), subsidized coverage through the Affordable Care Act (ACA) Marketplaces, and Medicare coverage. Under the new law (H.R.1), eligibility for Medicaid and CHIP, subsidized Marketplace coverage, and Medicare will be limited to lawful permanent residents (LPRs or “green card” holders), Cuban or Haitian entrants, and citizens of Compact of Free Association (COFA) residing in the U.S (Table 1). States can also maintain Medicaid and CHIP coverage for lawfully residing pregnant people or children covered through a state option as well as through the “From-Conception to End of Pregnancy” option, which provides coverage to low-income children regardless of their parent’s immigration status. This change will make many groups of lawfully present immigrants ineligible for coverage, including refugees, asylees, people with Temporary Protected Status (TPS), as well as individuals on work visas, among others. The law also eliminates eligibility for subsidized ACA Marketplace coverage for all lawfully present immigrants with incomes below 100% of the federal poverty level (FPL) who do not qualify for Medicaid coverage due to immigration status. The Congressional Budget Office (CBO) estimates that these coverage restrictions will result in 1.4 million LPIs becoming uninsured with $131 billion in reduced federal spending and $4.8 billion in increased federal revenues by 2034. There is no effect on coverage of undocumented immigrants, who are already ineligible for all federally funded health coverage. Some states use their own money to provide health coverage to undocumented immigrants.

Table 1: Eligibility for Lawfully Present Immigrants Under the 2025 Tax and Budget Law

The new eligibility restrictions for lawfully present immigrants have staggered implementation dates. The eligibility restrictions for Medicare became effective July 4, 2025 (the date that the 2025 tax and budget law was enacted), and current beneficiaries subject to the new restrictions will be disenrolled from coverage no later than 18 months from enactment of the legislation (January 4, 2027). Eligibility for subsidized ACA Marketplace coverage for lawfully present immigrants with incomes below 100% FPL ends January 1, 2026, while the other restrictions for subsidized ACA Marketplace coverage take effect as of January 1, 2027. The eligibility restrictions for Medicaid and CHIP go into effect October 1, 2026 (Table 2).

Implementation Dates for Health Coverage Eligibility Restrictions for Lawfully Present Immigrants Under the 2025 Tax and Budget Law

Beyond changes in the law, enhanced premium tax credits are set to expire at the end of 2025, which will make coverage unaffordable for many immigrants and likely lead to coverage losses. Without renewal of the enhanced tax credits, average premiums could rise by over 75%, and in some states, they may even double. As a result, total Marketplace enrollment is projected to fall from 22.8 million in 2025 to 18.9 million in 2026 and 15.4 million by 2030. Without enhanced subsidies, many immigrants who remain eligible could lose access to affordable coverage, particularly in states that have not expanded Medicaid to adults. 

Some states also have reduced or eliminated state-funded coverage designed to fill gaps in federally funded coverage for immigrants. Three states (California, Illinois, and Minnesota) plus D.C. have recently proposed or enacted budgets to end or limit new enrollment of adults in state-funded health coverage programs for immigrants regardless of immigration status as part of broader efforts to reduce state budget deficits.

Regulations published by the Trump Administration in June 2025 eliminated ACA Marketplace eligibility for Deferred Action for Childhood Arrivals (DACA) recipients on August 25, 2025. Under earlier policy, individuals with DACA status were not considered lawfully present for purposes of health coverage eligibility and remained ineligible for Medicaid, CHIP, and ACA Marketplace coverage despite having a deferred action status, which otherwise qualified for Marketplace coverage. These eligibility restrictions left DACA recipients ineligible for federally funded health coverage programs. The Biden administration published regulations that made DACA recipients newly eligible to purchase ACA Marketplace coverage with premium tax credits and cost sharing reductions beginning November 1, 2024. Following legal challenges, implementation of the Biden administration regulations was limited to 31 states and D.C. New regulations published by the Trump administration once again made DACA recipients in all states and D.C. ineligible for ACA Marketplace coverage. Most states will terminate coverage for enrolled DACA recipients on September 30, 2025.

The Trump administration published new guidance regarding verification of citizenship and immigration status of Medicaid enrollees, which could contribute to disenrollment due to challenges providing documentation. According to the Centers for Medicare and Medicaid Services (CMS), states will be required to separately verify the citizenship or immigration status of individuals whose status cannot be confirmed through federal databases such as the Systematic Alien Verification for Entitlements (SAVE) system based on monthly enrollment reports. Under already existing policies, in addition to meeting other eligibility requirements, lawfully present immigrants must have a “qualified non-citizen” status to be eligible for Medicaid or CHIP, and many, including most lawful permanent residents or “green card” holders, must wait five years after obtaining qualified status before they may enroll. States already are required to verify citizenship and immigration status with the Social Security Administration (SSA) and the Department of Homeland Security (DHS) SAVE system to determine eligibility for Medicaid coverage at the initial application and provide Medicaid benefits to applicants during a “reasonable opportunity period” of 90 days while their immigration status is being verified, if they otherwise meet all eligibility criteria. Although some implementation details of the new verification process announced by CMS remain unclear, it is possible that states will need to re-verify the eligibility of enrollees identified in reports and applicants may need to provide paperwork as proof of their eligible immigration status for manual verification, which could increase administrative burdens on both states and applicants or enrollees and potentially lead to coverage losses due to administrative challenges. 

Restricted Access to Health and Other Services

The Trump administration issued a policy change that expands the list of health and other service programs that certain immigrants are prohibited from accessing. On July 14, 2025, the U.S. Department of Health and Human Services (HHS) issued a notice of a policy change to update the definition of “federal public benefits” as outlined in the Personal Responsibility and Work Opportunity Reconciliation Act of 1996 (PRWORA) to add an additional 13 programs to the 31 programs considered “federal public benefits” that are restricted to individuals with a “qualified” immigration status. The notice further indicates that the updated list of federal benefits is not exhaustive, and additional programs may be added in the future. Among the 13 new programs added to the list are Head Start, the Health Center Program, and the Title X family planning program, among others (Box 1). This change bars many groups of lawfully present immigrants as well as undocumented immigrants from accessing several health care, educational, and other social services and will likely have negative impacts on the health and well-being of immigrant families. It also may create new challenges and complexities for service providers. This policy change was expected to take effect immediately upon publication of the notice in the federal register on July 14, 2025, although it provided for a 30-day comment period. However, the HHS had to delay implementation until September 11, 2025, following court orders. Further, on September 10, 2025, a District Court issued an injunction on the administration’s new policy, blocking the implementation of the policy as it relates to the Health Center Program and Head Start in 20 states and D.C.

Box 1: New Programs Considered “Federal Public Benefits” Under the 2025 Policy Change

  • Certified Community Behavioral Health Clinics
  • Community Mental Health Services Block Grant
  • Community Services Block Grant (CSBG)
  • Head Start
  • Health Center Program
  • Health Workforce Programs not otherwise previously covered (including grants, loans, scholarships, payments, and loan repayments)
  • Mental Health and Substance Use Disorder Treatment, Prevention, and Recovery Support Services Programs administered by the Substance Abuse and Mental Health Services Administration
  • Projects for Assistance in Transition from Homelessness Grant Program
  • Substance Use Prevention, Treatment, and Recovery Services Block Grant
  • Title IV-E Educational and Training Voucher Program
  • Title IV-E Kinship Guardianship Assistance Program
  • Title IV-3 Prevention Services Program
  • Title X Family Planning Program
  • List is not exhaustive and may be added to in the future

Source: U.S. Department of Health and Human Services (July 2025), “HHS Bans Illegal Aliens from Accessing its Taxpayer-Funded Programs

Enhanced Immigration Enforcement

President Trump also has increased immigration enforcement activity to support mass deportation and detention, which research shows negatively impacts the health and well-being of immigrant families. The administration has shifted enforcement actions from focusing on criminals and recent border crossers to prioritizing all of the estimated 14 million undocumented immigrants for deportation, even though many have some form of temporary deportation protections. As a result, there have been increased worries about detention and deportation among immigrants, including among naturalized citizens, and immigrant families with undocumented immigrants report that immigration-related fears have worsened their mental health and well-being. KFF survey data from March 2025 find that about a third (32%) of immigrants overall say they have experienced negative health repercussions due to worries about their own or a family member’s immigration status (Figure 1). Immigrants also reported they avoided seeking health care due to concerns about costs and fears, were fearful of accessing public programs, and were confused whether these programs can negatively impact immigration status.

About One-Third of Immigrants Say They Have Experienced Negative Health Impacts Due to Worries About Immigration Status, Rising to Four in Ten Lawfully Present Immigrants

In January 2025, the Trump administration rescinded longstanding protections that prohibited immigration enforcement action in certain areas including health care facilities, schools, and places of worship. Based on a memorandum originally issued by the Director of U.S. Immigration and Customs Enforcement (ICE) in 2011, immigration enforcement actions were prohibited from occurring in “sensitive locations” such as health care facilities, schools, and places of worship, with limited exceptions. In 2021, the Biden administration issued an updated memorandum further strengthening and expanding these protections by including disaster relief areas and other sites of essential services on the list of “sensitive locations”. Following the recission of these longstanding protections by the Trump administration, there have been reports of ICE agents showing up at hospitals. Some health care facilities have invested resources into training staff on how to comply with the new policy. Health care providers also have expressed concerns about the new policy deterring individuals in immigrant families from seeking health care. In KFF focus groups conducted with likely undocumented Hispanic immigrants, several participants talked about avoiding seeking health care due to concerns about potential enforcement risks.

Immigration-related worries may be exacerbated by the Trump administration’s actions to share Medicaid enrollee information with enforcement officials. In June 2025, there were reports of the Trump administration sharing the personal and health data of noncitizen Medicaid enrollees with the DHS for purposes of immigration enforcement despite concerns related to the violations of federal and state data privacy protections. A federal court in California issued a preliminary injunction in August 2025 that temporarily blocks the Trump administration from sharing enrollee data for the purposes of immigration enforcement in 20 states that filed a lawsuit against the administration. Breaches or sharing of Medicaid enrollees’ information for purposes other than the provision of health coverage and care pose risks for individuals and may jeopardize confidence in the security of data held by agencies. They may also exacerbate immigration-related fears, potentially leading to immigrants and their children foregoing enrollment in health coverage or seeking health care. 

Reducing Federal Language Access Resources

On March 1, 2025, President Trump signed Executive Order 14224 designating English as the official language of the United States with subsequent guidance suggesting the elimination or phasing out of some language access services. The Trump administration’s actions represent a departure from previous administrations’ policies around language access, and it is the first time in the country’s history that the U.S. has declared an official language at the federal level. Based on an accompanying fact sheet released by the administration, all services currently offered in other languages will be reviewed, and non-necessary services will be phased out. However, the Executive Order also states that federal agencies or other agencies that receive federal funding, such as hospitals and doctors’ offices, are not required to stop existing language services due to existing laws and regulations which supersede this guidance. Data from the 2023 KFF Survey of Immigrants find that about half (47%) of immigrant adults report having limited English proficiency (LEP) and that immigrant adults with LEP are more likely than their English proficient counterparts to report barriers to accessing health care and to have worse self-reported health. Reduced availability of language access resources could exacerbate the challenges immigrants with LEP already face and negatively impact their health and health care.

Global COVID-19 Tracker

Published: Oct 7, 2025

Editorial Note: The Policy Actions tracker will no longer be updated as the data source has ceased tracking government responses to COVID-19. For more information, please visit the Oxford Covid-19 Government Response Tracker.

Cases and Deaths

This tracker provides the cumulative number of confirmed COVID-19 cases and deaths, as well as the rate of daily COVID-19 cases and deaths by country, income, region, and globally. It will be updated weekly, as new data are released. As of March 7, 2023, all data on COVID-19 cases and deaths are drawn from the World Health Organization’s (WHO) Coronavirus (COVID-19) Dashboard. Prior to March 7, 2023, this tracker relied on data provided by the Johns Hopkins University (JHU) Coronavirus Resource Center’s COVID-19 Map, which ended on March 10, 2023. Please see the Methods tab for more detailed information on data sources and notes. To prevent slow load times, the tracker only contains data from the last 200 days. However, the full data set can be downloaded from our GitHub page. While the tracker provides the most recent data available, there is a two-week lag in the data reporting.

Note: The data in this tool were corrected on March 18, 2024, to clarify that they represent new cases and deaths over a full week rather than the average per day over a seven-day period.

Policy Actions

This tracker contains information on policy measures currently in place to address the COVID-19 pandemic. Policy categories currently being tracked include social distancing & closure measures, economic measures, and health systems measures. Policies are tracked at the country-, income-, and region-level. Please see the Methods tab for more detailed information on data sources and notes.

Social Distancing and Closure Measures

As countries continue to implement policies to prevent the transmission of SARS-CoV-2, the virus that causes COVID-19, these tables and charts show which social distancing and closure measures are currently in place by country.

Global COVID-19 Policy Actions

Economic Measures

The COVID-19 pandemic has placed an unprecedented strain on country economies. These tables and charts show which economic-related measures, namely income support and debt relief, are currently in place by country.

Global COVID-19 Policy Actions

Health Systems Measures

The COVID-19 pandemic continues to strain and disrupt global health systems. These tables and charts show which health systems measures are currently in place by country.

Global COVID-19 Policy Actions

Methods

Cases and Deaths

SOURCES

As of March 7, 2023, all data on COVID-19 cases and deaths are drawn from the World Health Organization’s (WHO) Coronavirus (COVID-19) Dashboard. Prior to March 7, 2023, this tracker relied on data provided by the Johns Hopkins University (JHU) Coronavirus Resource Center’s COVID-19 Map, which ends on March 10, 2023. Population data are obtained from the United Nations World Population Prospects using 2021 total population estimates. Income-level classifications are obtained from the latest World Bank Country and Lending Groups. Regional classifications are obtained from the World Health Organization.

Policy Actions

NOTES

Policy actions data include the measure that was in place for each indicator at the country-level as of the end of 2022. Policy actions data will no longer be updated as the data source has ceased tracking government responses to COVID-19. For more information, please visit the Oxford Covid-19 Government Response Tracker.

Social Distancing and Closure Measures

Under ‘Stay At Home Requirements’, exceptions for leaving the house may include anything from being able to leave for daily exercise, grocery shopping, and essential trips, to only being allowed to leave once a week, or one person may leave at a time, etc. Under ‘Workplace Closing’, partial closing includes instances in which a country recommends closing the workplace (or working from home); businesses are open but with significant COVID-19-related operational adjustments; or when workplaces require closing for only some, but not all, sectors or categories of workers. Under ‘School Closing’, partial closing includes instances in which a country has recommended school closures; all schools are open but with significant COVID-19-related operational adjustments; or some schools, but not all, are closed; full closing includes schools that are in session but operating virtually. Under ‘Restrictions On Gatherings’, partial restrictions include restrictions on gatherings of more than 10 people; full restrictions include restrictions on gatherings of 10 people or less. Under ‘International Travel Controls’, partial restrictions include screening and quarantine requirements for those entering the country. Values for ‘Cancel Public Events’ were not recodified.

Economic Measures

Under ‘Income Support’, narrow support includes instances in which a country’s government is replacing less than 50% of lost salary (or if a flat sum, it is less than 50% median salary); broad support includes instances in which a country’s government is replacing 50% or more of lost salary (or if a flat sum, it is greater than 50% median salary). Under ‘Debt/Contract Relief’, narrow support includes instances in which a country’s government is providing narrow relief, such as relief specific to one kind of contract.

Health Systems Measures

Under ‘Vaccine Eligibility’, partial availability includes availability for some or all of the following groups: key workers, non-elderly clinically vulnerable groups, and elderly groups, or for select broad groups/ages. Under ‘Facial Coverings’, recommend/partial requirement includes instances in which a country’s government recommends wearing facial coverings, requires facial coverings in some situations, and requires facial coverings when social distancing is not possible. 

SOURCES

Data on and descriptions of government measures related to COVID-19 provided by the Oxford Covid-19 Government Response Tracker (OxCGRT). For more detailed information on their data collection and methodology, please see their codebook and interpretation guide.

How Might Expiring Premium Tax Credits Impact People with HIV?

Author: Lindsey Dawson
Published: Oct 7, 2025

ACA premium tax credits, which make health insurance Marketplace plans more affordable, were first enhanced as part of the American Rescue Plan Act in 2021 and then extended by Congress through 2025. The enhanced credits have improved insurance coverage affordability for millions of people, including those with HIV. However, they are currently set to expire at the end of the year, unless Congress acts to extend them. Their extension became a major political  issue playing a role in the government shutdown.  In addition, because of the political uncertainty surrounding their extension, health insurers have proposed premium increases beyond what would otherwise be the case. The loss of the enhanced tax credits, coupled with increased premiums for some, could jeopardize coverage or health care affordability for millions. People with HIV may be particularly vulnerable, given that they are more likely to have Marketplace plans than the public overall and many also rely on the federally-funded Ryan White HIV/AIDS Program, which could be further stretched if Marketplace plans become more expensive. Moreover, loss of coverage and increased costs could lead to disruptions in care for people with HIV which could have serious implications for individual and public health. Being engaged in HIV care, including being on antiretroviral therapy, promotes optimal health outcomes including viral suppression, which in turn prevents transmission of HIV to others. This issue brief provides an overview of these potential impacts. 

People with HIV and Marketplace Coverage

A larger share of people with HIV receive coverage through the Marketplaces than the general population. As with Marketplace enrollees overall, the costs they face could rise significantly if the tax credits are not extended (detail on how the enhanced tax credits are calculated and differ from the original ACA tax credit here). For example:

  • Scenario 1: A 45-year-old enrolled in a Marketplace plan in Miami-Dade County, FL with an annual income of $38,000 (243% of the federal poverty level (FPL)), demographics similar to the HIV epidemic overall, would pay an estimated $1,699 more per year for coverage for the second lowest cost silver plan, with the monthly premium going from $117 to $259. (Additional scenarios can be run using this KFF interactive tool.)

Separately, those with incomes over 400% of the FPL (estimated at $62,600 in 2026 for a single-individual household) would face a double hit when it comes to cost increases without an extension. First, people with incomes in this range were provided with a new tax credit, limiting premium costs to 8.5% of income, which they would lose entirely without an extension. Second, without any cap on costs, they would be fully exposed to increased premiums proposed for 2026. (This differs from those in the 100%-400% FPL income group who would still receive some federal assistance, albeit at a lower level than with the enhanced credits.)

  • Scenario 2: A 45-year-old enrolled in a Marketplace plan in Miami-Dade County, FL with an annual income of $65,000 (415% of the federal poverty level (FPL)), would pay an estimated $2,027 more per year for coverage for the second lowest cost silver plan, with the monthly premium going from $460 to $629. (Additional scenarios can be run using this KFF interactive tool.) Costs would go from being caped at 8.5% of their income to consuming 11.6%

Certain state enrollees are already facing especially large hikes. Looking at the 5 states with the greatest HIV prevalence the, median and range requested premium increases for the 2026 plan year are as follows:

  • CA: 14% (7%-20%)
  • FL: 26% (19%-41%)
  • GA: 20% (9%-43%)
  • NY: 13% (10%-37%)
  • TX: 19% (3%-42%)

There are multiple potential impacts of increased premium costs for individuals with HIV paying for their own coverage. While some people may retain coverage, and be able to manage the increased costs, others could:

  • Retain coverage and struggle with the increased costs.
  • Choose a plan with less expensive premiums, but potentially higher out-of-pocket costs for items like HIV medications, labs, and provider visits.
  • Drop coverage altogether and not seek alternative access to care or coverage.
  • Drop coverage and seek support from the Ryan White Program.

AIDS Drug Assistance (ADAPs) Programs

Notably, HIV programs would also be impacted if enhanced tax credits are not extended, with the policy lapse costing them potentially tens of millions of dollars. This is especially the case for AIDS Drug Assistance Programs (ADAPs), which are part of the Ryan White HIV/AIDS Program, a federal safety net program for those with low-to-moderate incomes, reaching over half of people with HIV in the U.S. ADAPs provide HIV medications to people with HIV either directly or by purchasing insurance coverage with prescription drug benefits on their behalf and/or assisting with cost-sharing of insurance coverage. Each state/territory runs its own ADAP and programs differ in their operation and services provided. ADAPs face limited budgets and federal allocations have been fairly flat over time, making the program vulnerable to changes in the size of the population needing services as well as the cost of those services. ADAPs hit with rising premiums or increased enrollment, could be faced with modifying their programs in ways that could impede access.

Insurance purchasing became more widespread once the ACA was signed into law as historically HIV had been an uninsurable condition in the individual market. The health law meant that people with HIV could not be denied coverage or charged more for being HIV positive and that they were assured relatively coverage access to necessary medications and treatments.

Most ADAPs purchase private insurance premiums for clients (at least 42 states and DC in 20231). In total, in 2023 at least 76,365 clients were assisted with insurance assistance that included help paying for premiums across insurance markets. Among all ADAP clients, over 40,0002  were enrolled in Marketplace plans in 2023 and most received insurance support from the program. ADAPs that enroll eligible clients in Marketplace plans receive the benefit of the tax credits (currently available to those 100% of the poverty level and above) and have processes in place to work with clients on tax credit reconciliation at the end of the year. Larger shares of ADAP clients receiving premium support 3 have incomes above 100% FPL (the income level at which tax credit eligibility begins) compared to those enrolled in full-pay drug support only.

How much could the loss of enhanced tax credits cost state ADAPs?

A typical ADAP client (with an average age of 47 and in a single person family) receiving premium support could expect to see an estimated additional $1,364 in premium costs in 2026. This cost would be borne by ADAPs and vary by actual client demographics (i.e. age, income, family size and location for those over 400% FPL who would lose the entirety of their tax credit), metal level enrollment, and the number of clients the ADAP has enrolled in the Marketplaces. Different estimates can be generated using this tool.  Overall, this would likely represent a relatively small increase in ADAP budgets. However, concerns have already been raised that this policy change, as well as others that are likely to occur soon as a result of the recent reconciliation bill, could be financially challenging for ADAPs. Additionally, certain state ADAPs, such as those with high marketplace enrollment and those in non-expansion states are likely to be disproportionately impacted if enhanced tax credits. (See Methods and Limitations.)

Increased costs resulting from expiring enhanced tax credits and higher premiums, would not impact ADAPs evenly across the country. Levels of enrollment, differences in typical family income and age of clients, and type of plan enrollment would impact how these changes affect ADAP budgets, among other factors. ADAPs with smaller client enrollment or less robust insurance purchasing programs would be more sheltered and those with larger client enrollment and robust insurance assistance programs would likely to be harder hit. It is possible that ADAPs in non-Medicaid expansion states could being especially impacted. In expansion states, many clients with incomes 100-138% of the FPL would be enrolled in the Medicaid program whereas in non-expansion states, those clients would be more likely to be enrolled in ADAP insurance assistance through the ACA marketplace. For example, the share of ADAP clients enrolled in Marketplace plans (regardless of whether ADAP is assisting with costs) is much higher for Florida (31%) and Georgia (25%), high prevalence non-expansion states, than in California (15%) or Illinois (11%), high prevalence expansion states.

Additionally, as noted above, issuers are planning large premium increases for the coming year. ADAPs with clients enrolled in Marketplace plans would still have some protections from these price hikes through premium tax credits. Even if the enhanced credits expire, clients 100%-400% FPL would still have the original tax credits provided through the ACA. However, clients enrolled in off Marketplace ACA compliant plans (about 9,600 clients in 2023) and clients with incomes over 400% FPL (7% of ADAP clients with premium support or multiple types of ADAP support in 2022) would not have any buffer against these rising costs. Further, ADAPs might also face higher costs if those who had been purchasing coverage independently, find increases in premiums unaffordable and turn to the program for assistance.

Even relatively small cost increases in ADAP budgets can challenge their ability to maintain their current levels of services and some have raised questions about how they would respond to this and other future policy changes. ADAPs could respond in a number of ways, some of which could amount to limiting access to program services or generosity and/or seeking alternative resources to supplement federal funds:

  • Cost-containment strategies could include changing the eligibility for the program – for example reducing the income eligibility level – or further limiting plans in which clients can enroll. Another possible action is making ADAP formularies for clients receiving direct drug assistance less generous or introducing more utilization management techniques like prior authorization or step-therapy. ADAPs could also introduce or reduce caps on their programs (or on drug utilization) and could also create waiting lists. Waiting lists have been used in the past when program budgets have been strained but were last cleared through infusion of supplemental federal funds in 2012.
  • ADAPs faced with increased costs could try and supplement ADAP earmark funding (funding dedicated to ADAPs by Congress) with funding from other sources such as the state’s non-ADAP Ryan White fundings (Part B), funding from local county/city Ryan White Grantees (Part A), other state/local funding, maximizing generation of program income, and seeking deeper rebates from pharmaceutical companies, among other actions. However, if funding is shifted from Part B or other state or local funding (entities with already constrained budgets) to ADAPs, this could mean a reduction of other public health services.

Beyond ADAPs, grantees of other “Parts” of the Ryan White Program are also permitted to use funding to support client enrollment in health insurance, including in Marketplace plans. While this occurs less commonly among other grantees than it does with ADAPs, any other grantees currently using funding this way, would also be impacted by the above cost-increases resulting from expiration of enhanced tax credits and increases premiums for 2026.

Potential Impact of Policy Changes on HIV Care

As described above, if these changes occur, they are likely to have an impact on both individuals with HIV and the programs people with HIV rely on. Individuals could lose coverage and/or face higher costs, and might turn to Ryan White for assistance. To address funding shortfalls due to these changes, ADAPs could work to inject new funding into their programs but could also constrain existing eligibility and benefits or restrict enrollment.

Increased premiums or certain changes to ADAPs could lead to enrollees being less engaged with or fall out of HIV care and treatment. Higher out-of-pocket costs are a known deterrent to care engagement. KFF has found that over-quarter (27%) of people with HIV who are out-of-care say that at least one barrier to care has been problems with money or insurance and of those who recently missed an antiretroviral dose, nearly 10% say problems were as a barrier. Since HIV care and treatment engagement improves individual health and because viral suppression prevents transmission of HIV to others, monitoring access to services and safety net program capacity moving ahead will be important, as will assessing the potential public health impact, if people with HIV lose access to care and treatment.

Finally, while the potential expiration of tax credits is a looming  major change on the health policy horizon, there are other significant changes coming that could impact care, coverage, and programs for people with HIV. The recent budget reconciliation bill (HR1) makes a range of changes to the health system that will reduce coverage, some impacting the private market but the biggest, reshaping state Medicaid programs, the primary payer for HIV care in the U.S. These changes too could put downward pressure on ADAPs which are already operating on budgets that have remained mostly flat for decades.

Methods and Limitations

Methods: The estimated average income was generated based on income and age date from the Health Resources and Services Administration (HRSA). Ryan White HIV/AIDS Program AIDS Drug Assistance Program (ADAP) Annual Data Report 2022. Published September 2024 (Updated May 2025). The data is based on 2022 ADAP client enrollment. Age and income data was examined for ADAP clients with premium support and those getting multiple ADAP services (likely including premium support). Age and income data in the HRSA report is presented in ranges with the number of clients in each category. The range midpoints were identified within each category. For age, the estimated average age was calculated based on a weighted average of age midpoints, excluding those over 65, a group likely enrolled in Medicare. The average age used in this analysis was 47. For each income category incomes were calculated based off the range midpoints using the 2025 FPL guidelines from HHS. For the mid-point of each category for incomes above 100% FPL (those currently tax credit eligible), the increased cost of expired tax credits was assessed using the KFF calculator and then weighted based on the number of clients within the category (the weighted average estimated increases for each range are below). This analysis used the “US average”, and was based on a single person family size, representing a national average of second-lowest cost silver page weighted by plan selections. Across all income categories we estimated an average subsidy loss of $1,364. (See Table 1.)

Estimated Subsidy Losses for ADAP Clients with Premium Support or Receiving Multiple ADAP Services if Enhanced Tax Credits Are Not Extended

Limitations: There are several limitations with this estimate: While those over 65 were excluded from the average age estimates, it was not possible to exclude the incomes of those over 65 from the income calculations. It is possible Marketplace enrollees have different demographics from these estimates which include clients receiving any ADAP insurance premium (e.g. some clients receiving ADAP assistance for employer insurance). It is estimated that about 40,000 ADAP clients are enrolled in Marketplace plans (the data above is for about 60,000 clients). In particular, it is possible that these income estimates are high given that those with employer coverage are likely to have higher incomes than those with Marketplace coverage. The estimates also inlcude those receiving “multiple ADAP services” which is thought to inlcude those with premium assistance but could theoretically inlcude others. Averages could also obscure actual changes in costs.  Location of enrollment should not impact costs for most of those under 400% FPL because of the structure of the tax credits. However, the US average used for the location may be imprecise for the 7% of enrollees assisted with premiums over 400% whose costs would vary by location. As noted above, actual costs will vary by client demographics (i.e. age, income, family size and location for those over 400% FPL who would lose the entirety of their tax credit) as well as client plan metal level enrollment. Additional scenarios can be run using the KFF calculator.


  1. Data from Alabama, Montana, and West Virginia were not available. ↩︎
  2. The number of ADAP clients in Marketplace plans in unknown in full or in part in several states, including New York and Texas, states with high HIV prevalence and ADAP enrollment, so this is likely an undercount. ↩︎
  3. This is not specific to QHP enrollees includes any client getting premium support (e.g. it includes those getting assistance for employer plans or other coverage). ↩︎

What to Know About How Medicare Pays Physicians

Published: Oct 7, 2025

Issue Brief

This brief was updated on October 7, 2025 to reflect provisions in the tax and spending bill enacted in July 2025, as well as an overview of proposed changes in the 2026 Medicare Physician Fee Schedule proposed rule issued on July 14, 2025.

More than 67 million people—20% of the U.S. population—receive their health insurance coverage through the federal Medicare program. Among the most commonly used services that Medicare covers are physician services and other outpatient services covered under Medicare Part B. In 2021, 9 out of 10 beneficiaries in traditional Medicare used physician and other Part B medical services. Nearly half of the $1 trillion in gross Medicare benefit spending in 2023 (49% or $493 billion) was spent on Part B services. Medicare Part B spending accounts for 25% of all national spending for physician and clinical services.

Each year, the Centers for Medicare & Medicaid Services (CMS) updates Medicare payments for physician services and other Part B services through rulemaking, based on parameters established under law. In November 2024, CMS finalized a 2.83% decrease in the physician fee schedule conversion factor, a key aspect of physician payment rates under the Medicare program. This resulted in an average payment cut of 2.93% to physicians and other clinicians, which took effect on January 1, 2025 and remains in effect today. Congress considered but did not enact legislation to reverse the cut in Medicare physician payments in a December 2024 spending bill and in the continuing resolution that funded the government through the end of the 2025 fiscal year. The tax and spending bill enacted in July 2025 provides for a one-time 2.5% increase to physician payment rates from January 1, 2026 through December 31, 2026, but does not retroactively adjust payments to compensate for the 2025 payment cut.

Over the years, physician groups and some policymakers have raised concerns that frequent annual cuts to Medicare physician payment rates could push physicians to opt out of the Medicare program, creating potential access problems for Medicare beneficiaries. While virtually all non-pediatric physicians currently participate in Medicare, these concerns are part of a broader discussion of potential reforms to Medicare physician payments, which have also focused on issues such as the long-standing gap in compensation between primary care and specialty clinicians, the efficacy of quality-based payment incentives under the Quality Payment Program (QPP), and the influence of medical specialty groups and interests through the American Medical Association (AMA)/Specialty Society Relative Value Scale (RVS) Update Committee (RUC), which issues annual recommendations to CMS on relative payment rates at the service level. Notably, Robert Kennedy Jr., the Trump administration’s Secretary for the Department of Health and Human Services (HHS), has been critical of the RUC and has expressed ongoing interest in reducing its influence over payment rates.

In July 2025, CMS proposed updates to Medicare physician payments for 2026 as part of its annual rulemaking process. These include proposed adjustments to physician payment rates in 2026, on top of the increase in the tax and spending bill noted above, as well as several other potential changes related to physician fees. Notably, it would modify the methodology used to calculate relative payment rates at the service level, citing concerns about the accuracy and representativeness of survey data provided by the AMA and the RUC, which have historically informed these calculations. The proposed rule also includes measures to promote more flexible coverage of telehealth services, constrain spending on certain high-cost medical supplies, and expand billing options for management of behavioral health conditions in primary care settings. Further, it issues requests for information (RFIs) on several topics, such as strategies to address certain social and lifestyle factors that contribute to chronic disease, and proposes a new Ambulatory Specialty Model (ASM), a value-based payment model for outpatient chronic disease management. While these provisions have not yet been finalized, they provide some insight into the policy priorities of CMS under the Trump administration. The final rule will be issued later in 2025, and its provisions will be incorporated and discussed more fully in future updates to this brief.

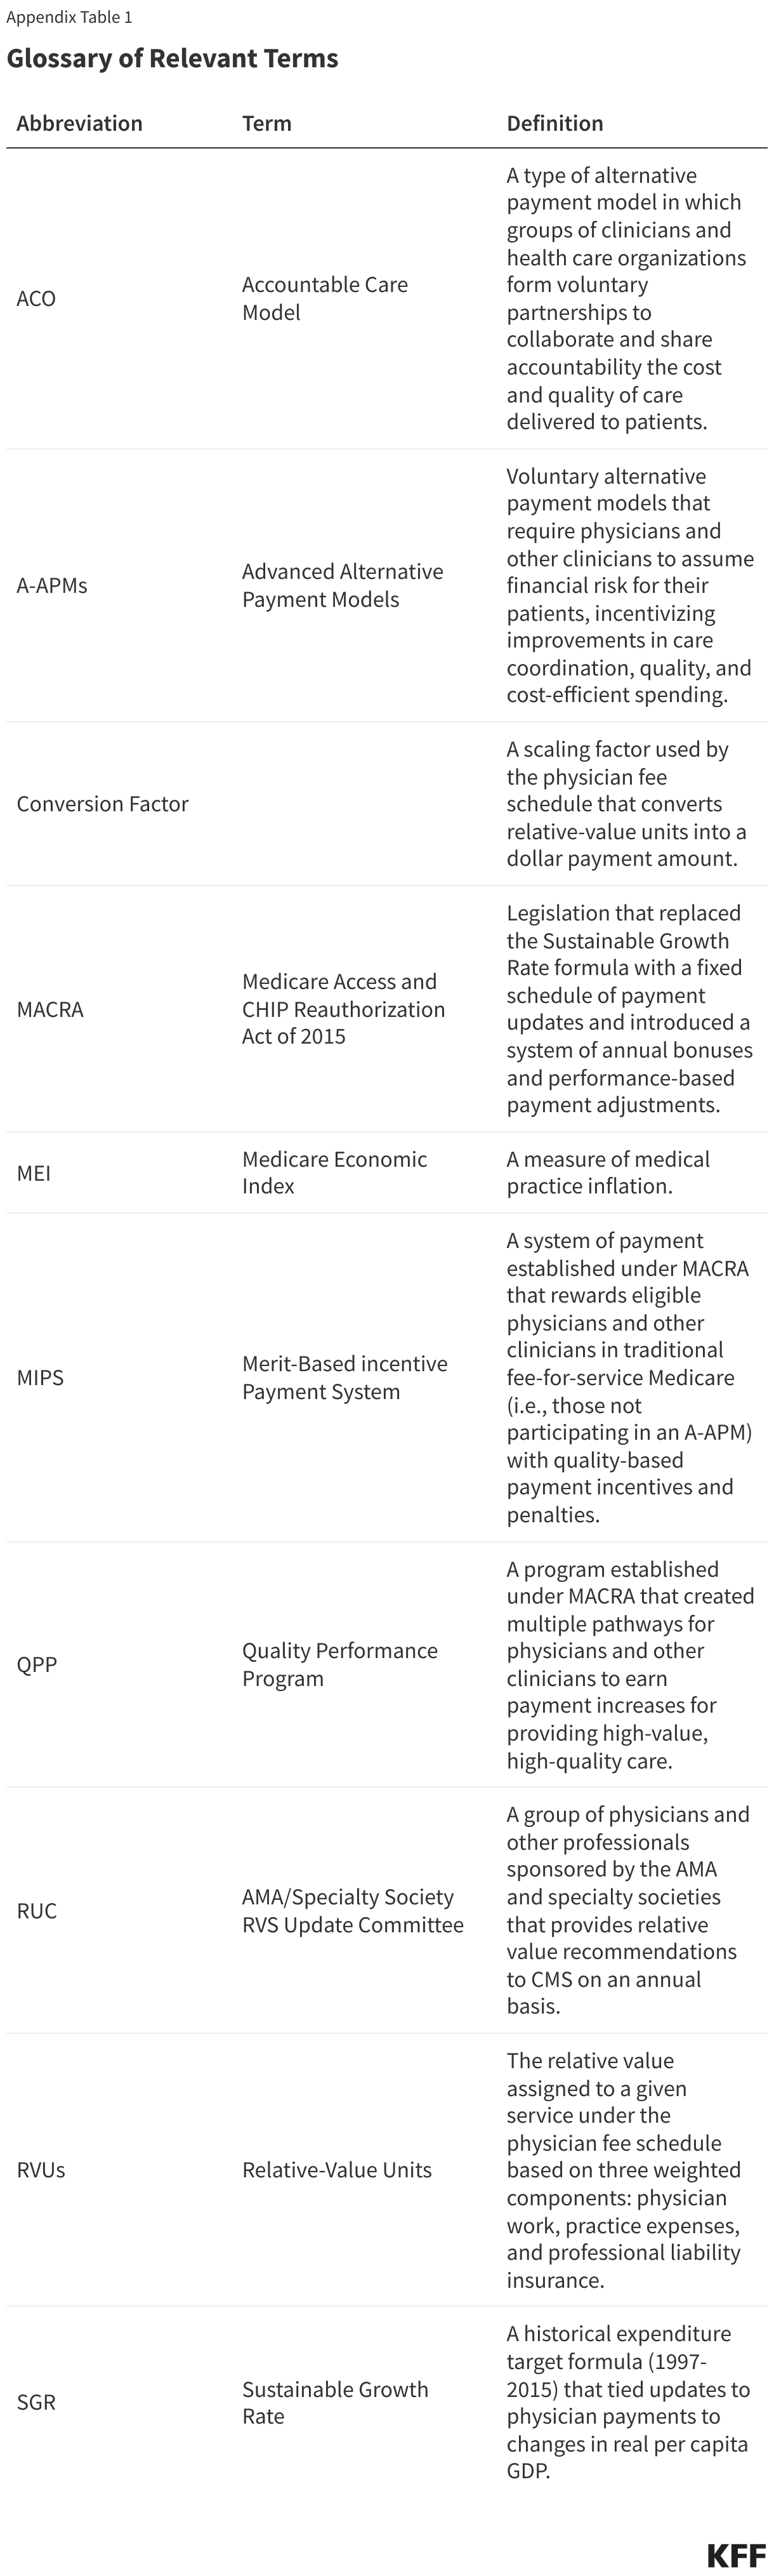
This issue brief answers key questions about how Medicare pays physicians and other clinicians, and reviews policy options under discussion to reform this payment system. The brief is focused primarily on the physician payment system used in traditional Medicare. Medicare Advantage plans have flexibility to pay providers differently and currently there is no systematic publicly-available information on how much Medicare Advantage plans pay providers. (See Appendix for a glossary of relevant programs, legislation, and terms.)

1. What is the Medicare Physician Fee Schedule?

Medicare reimburses physicians and other clinicians based on the physician fee schedule, which assigns payment rates for more than 10,000 health care services, such as office visits, diagnostic procedures, or surgical procedures. For services provided to traditional Medicare beneficiaries, Medicare typically pays the provider 80% of the fee schedule amount, while the beneficiary is responsible for a coinsurance of 20%. Physicians who participate in Medicare agree to accept this arrangement as payment in full (known as accepting “assignment”) for all Medicare covered services. Non-participating physicians receive 5% lower Medicare payments, but may accept “assignment” on a claim-by-claim basis and may choose to bill beneficiaries for larger amounts by charging additional coinsurance, up to 15% more than the Medicare-approved amount for the cost of a covered service. A third group of physicians opt out of the Medicare program altogether, and instead enter into private contracts with their Medicare patients, are not limited to charging fee schedule amounts, and do not receive any reimbursement from Medicare. Just one percent of all non-pediatric physicians opted out of the Medicare program in 2024.

Physician fee schedule rates for a given service are based on a weighted sum of three components: (1) clinician work, (2) practice expenses, and (3) professional liability insurance (also known as medical malpractice insurance). These three components are measured in terms of “relative value units” (RVUs). Together these three components represent the overall cost and effort associated with a given service, with more costly or time-intensive services receiving a higher weighted sum. Each component is adjusted to account for geographic differences in input costs, and the result is multiplied by the fee schedule conversion factor (an annually adjusted scaling factor that converts numerical RVUs into payment amounts in dollars). Fee schedule services are each associated with a unique service code, which allows clinicians to seek reimbursement for the care they provide on a service-by-service basis.

Payment rates specified under the physician fee schedule establish a baseline amount that Medicare will pay for a given service, but payments may be adjusted based on other factors, such as the site of service, the type of clinician providing the service, and whether the service was provided in a designated health professional shortage area. Physicians can also receive quality-based payment adjustments under the Quality Payment Program (QPP) (see question 7).

2. How Does Medicare Update Physician Payment Rates?

Annual updates to the physician fee schedule include statutorily-required updates to the conversion factor under the Medicare Access and CHIP Reauthorization Act of 2015 (MACRA) (see question 6), as well as other adjustments to reflect the addition of new services, changes in input costs for existing services, and other factors. Included in these adjustments are periodic changes to the RVUs assigned to fee schedule service codes, based in part on the recommendations of a multispecialty committee of physicians and other professionals, known as the AMA/Specialty Society RVS Update Committee (RUC) (see question 3).

Under current law, the projected cost of all changes to the physician fee schedule must be budget neutral. That is, the changes may not raise total Medicare spending by more than $20 million in a given year. This requirement was established by the Omnibus Budget Reconciliation Act of 1989 to address concerns that constraints on physician fees for specific services would lead to increases in service volume and growth in Medicare spending for physician services over time. The law requires CMS to adjust fee schedule spending when projected costs exceed the $20 million threshold, typically by decreasing the conversion factor relative to the statutory update called for by MACRA.

3. What is the Role of the RUC in Determining Physician Payment Rates?

The AMA/Specialty Society RVS Update Committee (RUC) is a volunteer committee of physicians and other professionals, formed by the American Medical Association (AMA) in 1991 to advise CMS on the relative weighting of service codes under the physician fee schedule, the primary mechanism used by CMS to set relative payments for physician and clinical services. The RUC is an independent body and its operations are not directly overseen by Congress or CMS. Further, because the RUC is not an official federal advisory committee, it is not bound by federal standards around transparency, membership balance, and other operating requirements applied to many similar committees. The RUC includes representatives from the AMA and other professional organizations, as well as members appointed by a range of national medical specialty societies.

Each year, CMS identifies potentially misvalued services for RUC review based on statutory criteria and public nomination. Potentially misvalued services may also be identified by the RUC itself, while new or recently revised service codes are identified by a separate AMA panel, known as the Current Procedural Terminology (CPT) Editorial Panel. The RUC then consults with various medical specialty societies, who decide which services they wish to review and develop recommendations on the clinician work, practice expenses, and other factors associated with payment for each service. A final list of recommendations for reviewed services is compiled by the RUC based on a committee vote and referred to CMS.

CMS is not required to adopt recommendations issued by the RUC, but it does so in a majority of cases. The AMA reports an average annual acceptance rate of 90% from 1993 to 2025. Over the years, MedPAC and others have raised concerns about the influence of the RUC, which is largely composed of specialty physicians with a financial stake in the recommendations they are producing, and noted several methodological issues with the data used to develop RUC recommendations (see question 8). MedPAC has called for CMS to develop internal processes to validate RUC recommendations by independent means. More recently, HHS Secretary Kennedy has raised concerns about the lack of transparency and relative lack of oversight of RUC operations by CMS, as well as the influence of the AMA in setting payment rates for physicians, which has brought renewed attention to the issue (see question 9).

4. How Have Physician Payment Rates Changed in 2025?

CMS recently finalized payment changes for 2025, which include a 2.83% decrease to the physician fee schedule conversion factor relative to 2024. This decrease reflects the following adjustments: (1) the expiration of temporary funds approved by Congress under the Consolidated Appropriations Act of 2024, which increased payments by 2.93% for all fee schedule services furnished between March 9, 2024 and December 31, 2024, (2) a 0% statutory increase for 2025 under the Medicare Access and CHIP Reauthorization Act of 2015 (MACRA), and (3) a modest 0.02% budget neutrality adjustment. The combined impact of these adjustments is a 2.93% decrease in average payments to physicians and other clinicians, which went into effect on January 1, 2025. 

As of March 2025, Congress has not passed legislation to address this payment cut. A provision to reduce (though not fully eliminate) the cut was included in an early version of the year-end Continuing Resolution (CR) filed in December 2024, similar to the temporary payment adjustments instituted by Congress in prior years, but was removed from the version signed into law. Congress also considered, but did not include, legislation in the subsequent CR enacted in March 2025, but some policymakers continue to push for a fix, which is reportedly under consideration for inclusion in an upcoming budget reconciliation bill. 

Recent changes to the physician fee schedule also include several measures designed to improve health care access and increase support for preventive services, behavioral health, and management of chronic disease. These measures are part of an ongoing effort by CMS and the Department of Health and Human Services (HHS) to strengthen primary and preventive care and address long-standing concerns about the gap in compensation between primary and specialty care physicians (see question 8). The final payment rule for 2025 introduces the following key changes: 

  • CMS has added new billing codes to the physician fee schedule intended to streamline payment for advanced primary care management. This change bundles several existing services related to care management, interprofessional consultation, and other care components into single codes, stratified by patient medical and social complexity, which may be billed on a monthly basis.
  • CMS has added new billing codes related to caregiver training for direct care services and supports, allowing clinicians to bill for time spent training caregivers on specific clinical skills such as techniques to prevent ulcer formation, wound dressing changes, and infection control, and has expanded existing billing options for trainings dedicated to caregiver behavior management and modification.
  • CMS has finalized several provisions aimed at improving beneficiary access to telehealth, such as broader coverage of audio-only services and increased flexibility in the use of telehealth for treatment of opioid use disorder (OUD). Safety planning interventions and PrEP counseling have been added to the Medicare Telehealth Services list on a permanent basis, and caregiver training services have been added on a provisional basis.
  • Many other telehealth restrictions that were in place prior to the COVID-19 pandemic have recently come back into effect, following the expiration of Medicare’s expanded telehealth coverage pursuant to the government shutdown that began on October 1, 2025. These include restrictions limiting telehealth coverage to beneficiaries in rural areas, and requiring beneficiaries to travel to an approved site, such a clinic or doctor’s office, when receiving telehealth services. However, CMS has extended certain limited flexibilities under its authority through December 2025, such as provisions that allow Rural Health Centers (RHCs) and Federally Qualified Health Centers (FQHCs) to serve as distant site providers for all covered telehealth services, and allow providers to use their currently enrolled practice location in place of their home address when providing telehealth services from home.
  • CMS has also added new billing codes for a range of other primary and behavioral health services, such as cardiovascular risk assessment and care management, use of digital mental health treatment devices, and safety planning interventions for patients at risk of suicide or overdose, among others.
  • CMS has finalized several updates to the Quality Payment Program (QPP) to improve the accuracy of quality reporting and reduce administrative burden for providers participating in the Merit-based Incentive Payment System (MIPS). (For a more detailed description of the QPP and MIPS, see question 7).

The new rules also include updates to the Medicare Shared Savings Program (MSSP), a permanent accountable care organization (ACO) program in traditional Medicare that offers financial incentives to providers for meeting savings targets and quality goals, as well as other changes related to payment for preventive vaccine administration, opioid treatment programs, evaluation and management of infectious diseases in hospital inpatient or observation settings, and a variety of other health services. 

6. How Have Medicare Payments to Physicians Changed Since the Implementation of MACRA?

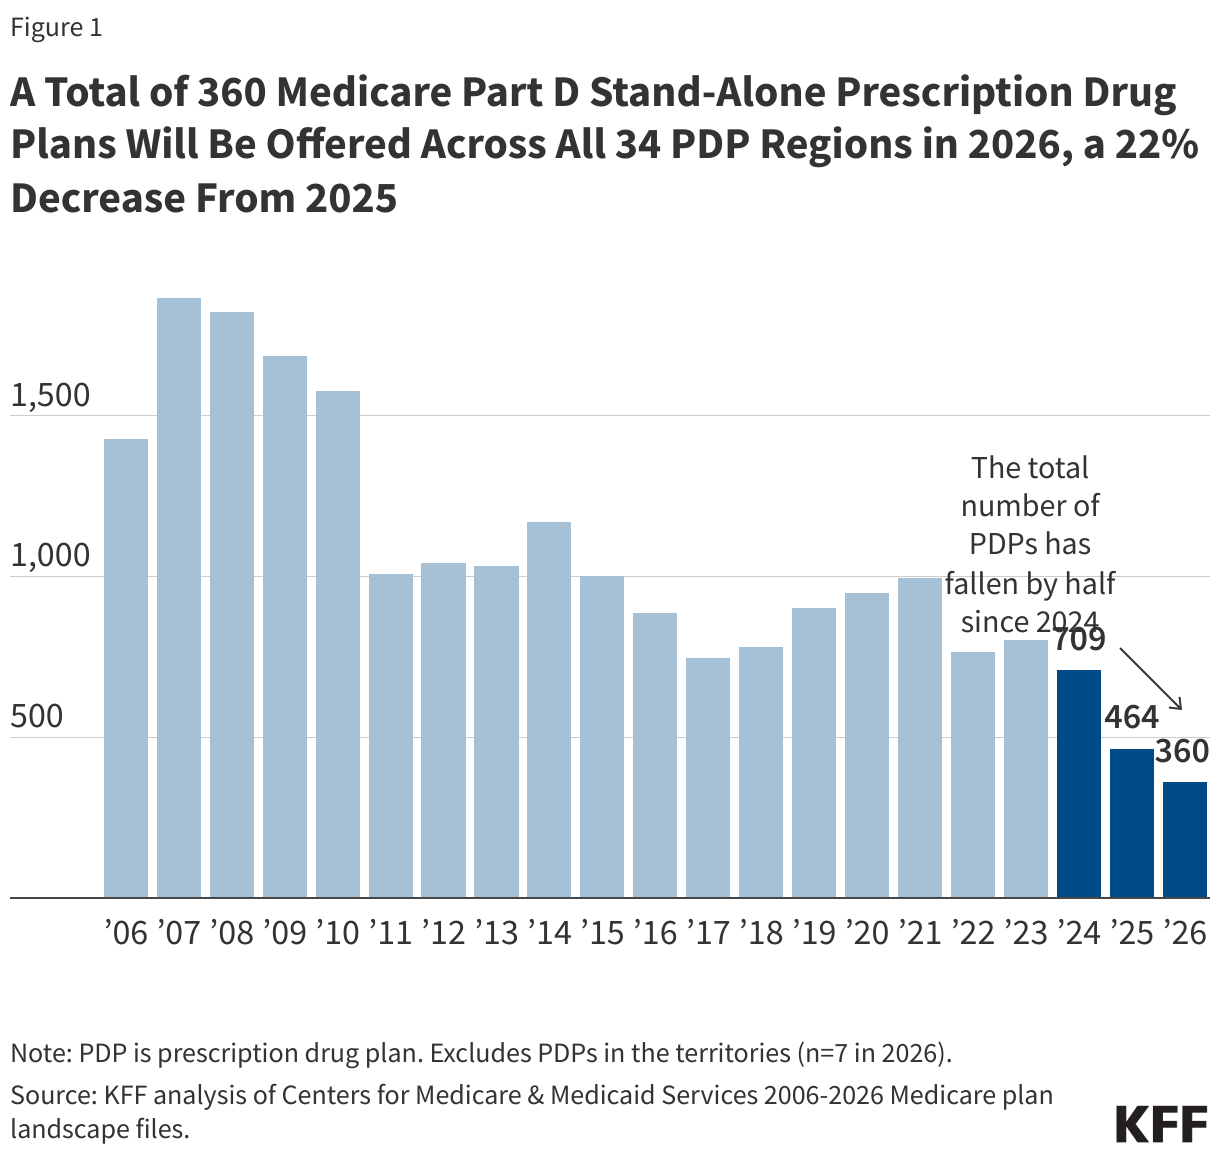
Medicare has revised its system of payment for physician services numerous times over the years (Figure 1). The current payment system was established under the Medicare Access and CHIP Reauthorization Act of 2015 (MACRA) and includes two primary components: (1) a schedule for annual, statutorily-defined updates to the conversion factor, a key determinant of payment rates under the physician fee schedule, and (2) a new system of bonus payments and quality-based payment adjustments under Quality Payment Program (QPP) (see question 7).

The physician payment system established by MACRA was intended to stabilize fluctuations in payment caused by the prior system under the Medicare Sustainable Growth Rate (SGR) formula, which set annual targets for Medicare physician spending based on growth in the gross domestic product (GDP). Under the SGR, if physician spending exceeded its target in a given year, payment rates would be cut the following year, while spending that was below the target led to increased rates. As with the current system, rates were subject to further adjustment for budget neutrality if the projected cost of all fee schedule spending was projected to increase by more than $20 million for the year.

The SGR was established by the Balanced Budget Act of 1997 to slow the growth in Medicare spending for physician services, but the formula garnered criticism, as growth in service volume and rising costs led to several years of spending on physician services that exceeded the growth target, necessitating payment cuts from 2002 onward. Between 2002 and 2015, Congress enacted 17 short-term interventions (so-called “doc-fixes”) to delay the cuts and provide temporary increases to physician payments, but did so without repealing the SGR, which resulted in accumulated deficits over time.

MACRA permanently eliminated the SGR formula, preventing a 21.2% cut in physician fees slated for 2015 and replacing it with 0% statutory increases to the conversion factor through 2025 (later raised to 0.5% from 2016-2019), followed by modest annual increases from 2026 onward. These updates are set by MACRA and do not vary based on underlying economic conditions. However, subsequent adjustments to preserve budget neutrality and supplemental payments provided by Congress may result in conversion factor updates that are higher or lower than the statutorily-required update in a given year.

Although MACRA has stabilized payments under the physician fee schedule to some degree relative to the years leading up to its enactment, rates have continued to fluctuate over the last decade. Due to strict budget neutrality requirements, CMS has limited flexibility to adjust payment rates for new or undervalued services without offsetting the costs elsewhere in the fee schedule. This often takes the form of budget neutrality adjustments to the conversion factor, such as a -10.20% adjustment in 2021 and a -2.18% adjustment in 2024. Since 2021, Congress has provided several short-term increases to fee schedule rates to boost payment during the COVID-19 pandemic and to offset budget-neutrality cuts, including a one-time 2.5% increase recently enacted for 2026.

7. How Does the Quality Payment Program (QPP) Factor Into Physician Payments?

The Quality Payment Program (QPP), which launched in 2017, was established by the Medicare Access and CHIP Reauthorization Act of 2015 (MACRA) to create financial incentives for health care providers to control costs and improve care quality. The QPP includes two distinct pathways for participation: (1) incentive payments for participants in qualified advanced alternative payment models (A-APMs) and (2) performance based payment adjustments under the Merit-based Incentive Payment System (MIPS).

A-APM Incentive Payments: Physicians and other clinicians who participate in qualified A-APMs, such as select accountable care organizations (ACOs) and others, are eligible for bonus payments if they meet certain participation thresholds. A-APMs are a type of value-based care model in which the provider bears some financial risk for the costs of care in a defined setting, such as treatment of a specific condition or primary care services for a group of beneficiaries, typically by sharing in a portion of financial savings and losses relative to a benchmark. Incentive payments to increase participation in A-APMs are part of a broader goal by CMS to have all traditional Medicare beneficiaries in some type of accountable care relationship by 2030.

Each year, A-APM clinicians qualify for bonus payments based on their participation during the Qualifying APM Participant Performance Period (January 1 – August 31) two years prior. Under MACRA, qualifying A-APM clinicians received a 5% bonus in payment years 2019 through 2024 (performance periods 2017 – 2022). Congress subsequently extended these bonus payments to include a 3.5% bonus in 2025 and a 1.88% bonus in 2026. A-APM bonus payments are scheduled to be phased out in favor of annual 0.75% increases to the conversion factor for qualifying A-APM clinicians (relative to smaller 0.25% increases for all other clinicians). These conversion factor updates will begin in 2026, and A-APM bonus payments will be fully retired in 2027.

Roughly 386,000 clinicians qualified for A-APM bonuses in 2024, based on the 2022 performance period, a nearly fourfold increase from 99,000 in 2019, the first year A-APM bonuses were available. At the same time, A-APMs are not evenly distributed throughout the country, and participation among non-physician providers and certain physician specialties remains relatively low, suggesting that additional strategies may be needed to encourage wider adoption of these models. Further, MedPAC and others have noted that the scheduled conversion factor updates for qualifying A-APM clinicians will be relatively small in the first few years after A-APM bonuses are retired, though their effects will compound over time, and have cautioned that additional incentives may be needed to prevent attrition in A-APM participation during this transition.

Merit-based Incentive Payment System (MIPS): Clinicians who do not participate in A-APMs, or do not meet the participation criteria for A-APM bonus payments, are subject to additional reporting requirements under MIPS, which adjusts payments up or down depending on a clinician’s performance on certain quality metrics. As with A-APM bonuses, payment adjustments under MIPS are based on performance two years prior. Clinicians are required to participate in MIPS if they are eligible, but many are exempt, such as those in certain specialties (e.g., podiatrists), those in their first year of Medicare participation, and those who serve a low volume of Medicare patients.

Payment adjustments under MIPS are required to be budget neutral. Adjustments are capped each year (between +9% and -9% in 2025), and savings generated from clinicians who incur negative adjustments are used to fund positive adjustments for those who qualify. Because a relatively small share of clinicians have incurred negative adjustments each year since MIPS was implemented, positive adjustments have generally been much lower than the annual cap. In 2023 for instance, roughly 600,000 clinicians received positive adjustments up to +2.34%, based on the 2021 performance year, while just 23,000 clinicians received negative adjustments down to -9%. MedPAC estimates that another 460,000 clinicians were ineligible for either an A-APM bonus or MIPS adjustment due to low Medicare patient volume or other exemption criteria.

Clinicians who participate in MIPS have traditionally selected from a large set of quality measures and other clinical metrics to report on each year. While this structure was intended to give clinicians flexibility to choose the metrics best suited to their practice, it has also been criticized by physician groups and experts for increasing the reporting burden on participants, and for making comparisons between participants less clinically meaningful and more difficult to assess. In an effort to address these concerns, CMS has introduced several more streamlined reporting options. The newest of these allows clinicians to choose from smaller, bundled subsets of reporting metrics tailored to particular specialties or medical conditions, known as MIPS Value Pathways (MVPs).

MVPs were introduced in 2023 as an optional alternative to reporting under traditional MIPS, and included a preliminary set of reporting pathways aimed at specific clinical contexts, such as primary care, treatment of heart disease, and supportive care for neurodegenerative conditions. CMS has added new MVPs each year since the option was introduced, including 6 in 2025, with the eventual goal of replacing all reporting under traditional MIPS with MVPs in future years. The purpose of this shift is to reduce administrative burden by offering providers smaller, more targeted sets of reporting metrics to choose from, as well as to allow for more clinically meaningful assessments by comparing outcomes among similar clinicians who choose to report under the same MVP. 

8. What Concerns Have Been Raised About the Physician Fee Schedule?

Criticism of the physician fee schedule has focused on four primary concerns about the way in which Medicare pays physicians and other clinicians. These include: (1) the overall adequacy of Medicare payments to cover medical practice costs and incentivize participation in the Medicare program, (2) the gap in compensation between primary and specialty care clinicians, (3) the influence of the AMA/RVS Update Committee (RUC) and medical specialty groups in determining relative payment rates for fee schedule services, and (4) the success of the Quality Payment Program (QPP) in achieving its goal of incentivizing quality improvements and cost-efficient spending.

Payment Adequacy: Over the years, physician groups and some policymakers have expressed concern that payment rates under the physician fee schedule have not kept pace with inflation in medical practice costs. Practice expenses are one component of the relative-value calculation used to determine payment rates for fee schedule services, but the requirement to preserve budget neutrality makes it difficult for CMS to increase payment for some services without also decreasing payment in other areas, such as by lowering the fee schedule conversion factor (see question 6). Statutory increases to the conversion factor under MACRA are not scheduled to begin until 2026, and do not vary based on underlying economic conditions, which may make it more challenging for some physicians to adapt to changing financial demands.

Core to these concerns is the possibility that loss of revenues could lead some physicians to opt out of the Medicare program, which could create access issues for Medicare beneficiaries. National surveys and other analyses have generally found that beneficiaries report access to physician services that is equal to, or better than, that of privately-insured individuals, with similar or smaller shares reporting delays in needed care or difficulty finding a physician who takes their insurance. A recent KFF analysis found that just 1% of all non-pediatric physicians had opted out of Medicare in 2024, suggesting that the current fee structure has not substantially discouraged participation. Moreover, MedPAC estimates that virtually all Medicare claims (99.7% in 2023) are accepted on “assignment” and paid at the standard rate (see question 1), with beneficiaries in traditional Medicare facing no more than the standard 20% coinsurance rate. At the same time, analyses by KFF and others have found that physicians in some specialties, such as psychiatry, opt out of Medicare at higher rates, which may impact access to these services over time.

Loss of revenue may also lead some physician practices to merge with (or be acquired by) larger health systems or hospitals, a process known as “vertical consolidation.” Vertical consolidation may offer certain benefits to physicians, such as greater economy of scale for practice expenses, lower administrative burden, and access to costly resources such as medical imaging equipment, and may be attractive to physicians who are otherwise struggling to meet their practice costs. While consolidation may be associated with some benefits to patients as well, such as improvements in care integration and coordination between providers, it may also lead to higher out-of-pocket costs and lower care quality by reducing market competition. Further, Medicare generally pays more for a given service provided in a hospital outpatient department than it does for the same service provided in a freestanding physician office, which can lead to increased costs for beneficiaries and higher program spending over time. Policymakers are currently exploring options to align Medicare reimbursement rates between these settings, known as “site-neutral payment reforms.” 

Primary Care Compensation: A second concern with the current payment system is that Medicare does not adequately pay for primary care services, as reflected by the gap in Medicare payments between primary and specialty care clinicians. Payments under the physician fee schedule are generally higher for clinical procedures, such as surgeries and diagnostic tests, than for non-procedural services, such as preventive care provided during an office visit. While many clinicians provide a mixture of procedural and non-procedural services, primary care clinicians often dedicate a larger share of their time to non-procedural care. Further, MedPAC has expressed concern that this imbalance encourages clinicians of all specialties to increase their use of more costly and profitable services, such as unnecessary imaging, screenings, and diagnostic tests, at the expense of high-value, but less profitable, services, such as patient education, preventive care, and coordination across care teams, which can impact the quality of patient care and lead to higher physician spending over time.

MedPAC notes that clinical procedures often see gains in efficiency due to technological improvements and other factors, which reduce the time and effort needed to provide them. If fee schedule rates are not adjusted to reflect these improvements, these services may become overvalued over time. By contrast, non-procedural services often involve more fixed time constraints, such as time spent communicating with patients or coordinating with other providers, and are unlikely to see similar gains, contributing to the gap in compensation between these service types.  

Due to budget neutrality requirements, efforts to directly increase payment for non-procedural services under the physician fee schedule in order to boost payments for primary care have often necessitated across-the-board payment cuts in the form of decreases to the fee schedule conversion factor (see question 6). Further, physicians may offset any expected reductions in revenue by increasing service volume over time, or by increasing their use of higher intensity, and more highly compensated, service codes, leaving the gap in payment rates relatively constant. These constraints make it difficult for CMS to meaningfully address differences in payment between primary and specialty care, and have led some policymakers to voice concerns that the current budget neutrality requirements are too rigid.

Role of the RUC: The American Medical Association (AMA) and the RUC play a substantial role in annual decision-making around the relative weighting of service codes under the physician fee schedule, the primary mechanism used by CMS to set relative payment rates for physician and clinical services (see question 3). While CMS is not required to adopt recommendations issued by the RUC, it does so in a majority of cases. MedPAC has raised several methodological concerns with the data used by the RUC to develop its annual reports, which are largely based on recommendations from medical specialty societies. These include a lack of transparency, as well as low response rates and total responses on the various member surveys that inform medical specialty society recommendations, which make it difficult for CMS to validate RUC recommendations by other means.

Other concerns raised about the RUC include the overrepresentation of specialty physicians on the committee, and the potential for conflicts of interest when RUC members recommend changes to relative payments for primary and specialty care services. In contrast to federal advisory committees, which are typically formed by Congress, the office of the President, or executive branch agencies, the RUC is an independent committee overseen by the AMA. For this reason, it is not held to the same operating requirements as many other similar committees, which adhere to certain criteria around transparency and membership balance. The Secretary of the Department of Health and Human Services (HHS), Robert F. Kennedy Jr., has echoed many of these concerns in recent months, and has called for bringing greater transparency to the operations of the RUC (see question 3), as well as exploring options for reducing the role the RUC plays in annual decision-making around physician payments.

To ensure that fee schedule services are not overvalued, MedPAC has recommended that CMS develop internal processes for validating RUC recommendations, such as by collecting data from clinical practices on the number of clinician hours dedicated to commonly-billed services. Pilot studies commissioned by CMS and the Department of Health and Human Services (HHS) have attempted to validate the clinician time component of small subsets of fee schedule services using methods such as analysis of electronic health records, direct observation of clinical procedures, and independently-collected physician surveys. These projects may serve as a blueprint for future work, though implementing these and similar methods on a large scale would likely require significant time and staff investment.

Role of the QPP: QPP programs such as the Merit-based Incentive Payment System (MIPS) and bonus payments for Advanced Alternative Payment Model (A-APM) clinicians are designed to create incentives for quality improvement, care coordination, and the provision of high-value services (see question 7). While the share of clinicians who qualify for A-APM bonuses has more than tripled since the QPP began (from roughly 99,000 to 386,000 in the 2017 and 2022 performance periods, respectively), some policymakers have argued that greater incentives are needed to encourage providers to take on the financial risks and high startup costs associated with these models, particularly as A-APM bonus payments are phased out in favor of relatively smaller conversion factor adjustments in the coming years.

Additionally, MedPAC has voiced concern that MIPS, the quality-based payment program for clinicians who do not participate in A-APMs, imposes too large of a reporting burden on those who participate, while at the same time offering relatively weak incentives to improve quality and control costs. As noted earlier, a large share of clinicians are exempt from the program, and because few participants receive negative adjustments, positive adjustments are relatively modest. The administrative burdens associated with MIPS may be partially addressed by the shift towards MIPS Value Pathways (MVPs) in place of traditional quality reporting, and further assessment of this option will likely take shape as the program is phased in.

9. What Policy Proposals Have Been Put Forward to Address Concerns with Medicare’s Current Physician Payment System?

In addition to recent legislation that provides a temporary 2.5% increase to physician payment rates in 2026, policymakers and others have put forward a number of strategies to revise the current Medicare physician payment system. These include measures to stabilize physician fee schedule payments from year to year, provide additional support to primary care and safety-net providers, and create stronger incentives for efficient spending, care coordination, and participation in Advanced Alternative Payment Models (A-APMs).

In 2025, MedPAC recommended a one-time inflation-based increase to physician payment rates in 2026 (equal to the projected increase in the Medicare Economic Index minus one percentage point), similar to recommendations from past years. While MedPAC has weighed the possibility of recommending annual updates for inflation, it has not done so to date, focusing instead on targeted strategies to bolster payments to primary care clinicians and safety-net providers. For instance, in light of findings that clinicians often receive lower revenue for treating low-income Medicare beneficiaries, MedPAC has recommended raising payment in these instances by 15% for claims billed by primary care clinicians and 5% for claims billed by non-primary care clinicians, to encourage clinicians to treat these populations.

MedPAC has voiced support for the goals behind the Medicare Access and CHIP Reauthorization Act of 2015 (MACRA) and the Quality Payment Program (QPP), including the financial incentives offered to A-APM participants under current law (see question 7), while also recommending changes to the design of the QPP, including the elimination of the Merit-based Incentive Payment System (MIPS). MedPAC has noted that the ongoing shift from traditional MIPS to MIPS Value Pathways (MVPs) addresses some concerns related to administrative complexity and participant comparisons, but a large share of clinicians remain exempt from MIPS reporting and incentive payments have generally remained relatively small (see question 8). In place of MIPS, MedPAC has recommended establishing a voluntary program designed to mimic the structure of A-APMs and other alternative payment models, allowing clinicians to transition into these models more gradually.

Several bills introduced in the last Congress indicate interest in strategies such raising or modifying the budget neutrality threshold, or offering separate conversion factor updates for primary and specialty care services, which would allow CMS greater flexibility to adjust payment rates to reflect evolving policy priorities without necessitating a mandatory payment cut. The Senate Finance Committee has held several hearings on physician fee schedule reform, and released a whitepaper in 2024 outlining a range of options to stabilize conversion factor updates from year to year, extend access to telehealth, and incentivize continued participation in A-APMs, among other reforms.

More recently, CMS has proposed rulemaking changes for physician payments in 2026, which include potential adjustments to the relative value calculations used to inform payment rates for fee schedule services. In particular, CMS has proposed to supplement data and recommendations from the AMA and the RUC with data from additional sources, such as the Medicare Hospital Outpatient Prospective Payment System and the Medicare Economic Index productivity adjustment, when calculating certain aspects of physician work and practice expense RVUs. While these changes have not yet been finalized, they are in keeping with goals voiced by HHS Secretary Robert Kennedy Jr. to promote independence from the RUC, and suggest that CMS has an interest in developing strategies for internal code review.

A decade after the passage of MACRA, Congress’s last major overhaul of how Medicare pays physicians, interest in broader reforms to Medicare’s physician payment system, is gaining steam. Designing payment approaches that address concerns raised by interested parties to compensate physicians adequately while restraining spending growth represents a challenge for policymakers.

This work was supported in part by Arnold Ventures. KFF maintains full editorial control over all of its policy analysis, polling, and journalism activities.

Appendix

Glossary of Relevant Terms

State and Federal Reproductive Rights and Abortion Litigation Tracker

Last updated on

The Supreme Court’s Dobbs ruling, overturning Roe v. Wade, returned the decision to restrict or protect abortion to states. In many states, abortion providers and advocates are challenging state abortion bans contending that the bans violate the state constitution or another state law. The state litigation tracker presents up-to-date information on the ongoing litigation challenging state abortion policy.

In addition, since the Dobbs decision, new questions have arisen regarding the intersection of federal and state authority when it impacts access to abortion and contraception. Litigation has been brought in federal court to resolve some of these questions. The federal litigation tracker presents up-to-date information on the litigation in federal courts that involves access to contraception and abortion.

Litigation Involving Reproductive Health and Rights in the Federal Courts, as of February 15, 2023

A Current Snapshot of the Medicare Part D Prescription Drug Benefit

Published: Oct 7, 2025

Medicare Part D is a voluntary outpatient prescription drug benefit for people with Medicare provided through private plans that contract with the federal government. Beneficiaries can choose to enroll in either a stand-alone prescription drug plan (PDP) to supplement traditional Medicare or a Medicare Advantage drug plan (MA-PD) that includes drug coverage and all other Medicare-covered benefits. This brief provides an overview of the Medicare Part D program, plan availability, enrollment, and spending and financing, based on KFF analysis of data from the Centers for Medicare & Medicaid Services (CMS) and other sources. It also provides an overview of changes to the Part D benefit based on provisions in the Inflation Reduction Act. (A separate KFF analysis provides more detail about Part D plan availability, premiums, and cost sharing.)

Takeaways

  • In 2026, beneficiaries in each state will have a choice of between 8 and 12 Medicare Part D stand-alone prescription drug plans, plus many Medicare Advantage drug plans. A total of 360 PDPs will be offered by 17 different parent organizations across the 34 PDP regions nationwide (excluding 7 PDPs in the territories), a 22% decrease in PDPs from 2025 and 2 fewer parent organizations.
  • Roughly the same number of PDPs will be available for enrollment of Part D Low-Income Subsidy (LIS) beneficiaries for no premium (“benchmark” plans) in 2026, varying from 1 to 4 PDPs across states. A total of 88 PDPs will be benchmark plans in 2026, 2 fewer than in 2025.
  • Several changes to the Medicare Part D benefit under the Inflation Reduction Act have taken effect, including a cap on out-of-pocket drug spending, which will be set at $2,100 in 2026; an increase in the share of drug costs above the cap paid for by Part D plans and drug manufacturers; and a reduction in Medicare’s share of these costs.
  • In 2025, 54.8 million of the 68.8 million Medicare beneficiaries in total are enrolled in Medicare Part D plans, including employer-only group plans; among Part D enrollees, 58% are enrolled in MA-PDs and 42% are enrolled in stand-alone PDPs. As of May 2025, 13.9 million Part D enrollees receive premium and cost-sharing assistance through the LIS program.
  • Medicare’s actuaries estimate that spending on Part D benefits (net of premiums paid by enrollees) will total $140 billion in 2026, representing 11% of total spending on all Medicare-covered benefits. Funding for Part D comes from federal government contributions (75%), beneficiary premiums (13%), and state contributions (12%).
  • Medicare’s payments to Part D plans to subsidize the cost of basic Part D benefits per enrollee are projected to account for roughly three-fourths of Medicare’s total reimbursement per enrollee in 2026, while reinsurance payments (to subsidize a portion of drug spending for enrollees with high drug costs) will equal one-fourth. This is a reversal from 2024, when reinsurance accounted for three-fourths of total reimbursement per enrollee. This change reflects the increased generosity of the standard Part D benefit with the addition of an out-of-pocket spending cap in 2025, along with the reduction in Medicare’s liability for catastrophic drug costs from 80% in 2024 to 20% for brands and 40% for generics in 2025. Part D plans and drug manufacturers now bear greater responsibility for catastrophic coverage costs.

Medicare Prescription Drug Plan Availability in 2026

In 2026, a total of 360 PDPs will be offered by 17 different parent organizations across the 34 PDP regions nationwide (excluding the territories), a 22% decrease in PDPs from 2025 (and nearly half as many as in 2024) and 2 fewer parent organizations (Figure 1). While the availability of stand-alone PDPs has been trending downward over time, the availability of Medicare Advantage drug plans has expanded in recent years, and more people in Medicare are now getting Part D drug coverage through Medicare Advantage plans.

A Total of 360 Medicare Part D Stand-Alone Prescription Drug Plans Will Be Offered Across All 34 PDP Regions in 2026, a 22% Decrease From 2025

Despite a reduction in the number of PDPs overall, beneficiaries in each state will have a choice of between 8 and 12 stand-alone PDPs offered by between 4 and 6 parent organizations in each state (Figure 2, Appendix Figure 1). In addition, beneficiaries will be able to choose from among many MA-PDs available at the county level.

The Number of Medicare Part D Stand-Alone Prescription Drug Plans in 2026 Ranges Across States from 8 to 12

Low-Income Subsidy Plan Availability in 2026

Beneficiaries with low incomes and modest assets are eligible for assistance (“extra help”) with Part D plan premiums and cost sharing. Through the Part D Low-Income Subsidy (LIS) program, additional premium and cost-sharing assistance is available for Part D enrollees with low incomes (less than 150% of poverty, or $23,475 for individuals/$31,725 for married couples in 2025) and modest assets (up to $17,600 for individuals/$35,1300 for couples in 2025). People who qualify for the LIS program pay modest copayments for prescription drugs, no drug deductible, and no premium for drug coverage in premium-free “benchmark” plans.

In 2026, roughly the same number of plans will be available for enrollment of LIS beneficiaries for no premium (benchmark plans) compared to 2025 – 88 plans (2 fewer than in 2025), but the lowest number of benchmark plans available since Part D started (Figure 3). Overall, one quarter (24%) of PDPs in 2026 are benchmark plans.

In 2026, 88 Medicare Part D Stand-Alone Drug Plans Will Be Available Without a Premium to Enrollees Receiving the Low-Income Subsidy (“Benchmark” Plans) Across the 34 PDP Regions, Only 2 Fewer Than in 2025

At the PDP region level, the number of PDP choices overall remains more robust than the number of premium-free benchmark PDPs. In 2026, the number of premium-free PDPs ranges across states from 1 plan in 2 states (Florida and Texas) to 4 plans in 15 states (Figure 4, Appendix Figure 1). LIS enrollees can select any plan offered in their area, but if they are enrolled in a non-benchmark plan, they may be required to pay some portion of their plan’s monthly premium.

The Number of Medicare Part D Benchmark Plans in 2026 Ranges Across States from 1 to 4

Changes to Part D Under the Inflation Reduction Act

The Inflation Reduction Act of 2022 contained several provisions to lower prescription drug spending by Medicare and beneficiaries, including major changes to the Medicare Part D program, which started to take effect in 2023. These changes were designed to address several concerns, including the lack of a hard cap on out-of-pocket spending for Part D enrollees; the inability of the federal government to negotiate drug prices with manufacturers; a significant increase in Medicare “reinsurance” spending for Part D enrollees with high drug costs; prices for many Part D covered drugs rising faster than the rate of inflation; and the relatively weak financial incentives faced by Part D plan sponsors to control high drug costs. Provisions in the law include:

  • Limiting the price of insulin products to no more than $35 per month in all Part D plans and makes adult vaccines covered under Part D available for free, as of 2023.
  • Requiring drug manufacturers to pay a rebate to the federal government if prices for drugs covered under Part D and Part B increase faster than the rate of inflation, with the initial period for measuring Part D drug price increases running from October 2022-September 2023.
  • Expanding eligibility for full benefits under the Part D Low-Income Subsidy program in 2024.
  • Adding a hard cap on out-of-pocket drug spending under Part D by eliminating the 5% coinsurance requirement for catastrophic coverage in 2024 and capping out-of-pocket spending at $2,000 in 2025 (increasing to $2,100 in 2026).
  • Shifting more of the responsibility for catastrophic coverage costs to Part D plans and drug manufacturers, starting in 2025.
  • Authorizing the Secretary of the Department of Health and Human Services to negotiate the price of some drugs covered under Medicare, with negotiated prices first available for 10 Part D drugs in 2026.

Part D Plan Premiums and Benefits in 2026

Premiums

The 2026 Part D base beneficiary premium – which is based on bids submitted by both PDPs and MA-PDs and is not weighted by enrollment – is $38.99, a 6% increase from 2025. Annual growth in the base beneficiary premium is capped at 6% due to a provision in the Inflation Reduction Act. Because the base premium is an average across both types of plans and reflects the cost of basic benefits only, this amount does not equal what a Part D enrollee will pay for coverage in any given Part D plan.

Because the monthly amount that Part D enrollees pay for individual Part D plans is different from the base beneficiary premium, enrollees may see their premium increase by more or less than 6%, or even decrease, if they stay in the same plan for 2026. A Part D premium stabilization demonstration for PDPs is also helping to moderate premium increases that Part D enrollees might otherwise have faced in 2026, as insurers continue to adjust to higher costs associated with the new out-of-pocket spending cap and increased liability for drug costs above the cap. The Part D premium demonstration was established in 2024 by the Biden administration ahead of the major redesign of the Part D benefit that took effect in 2025. For the first year of the demonstration, the federal government provided participating PDPs with an across-the-board monthly premium subsidy of up to $15 and limited the monthly premium increase for 2025 to $35, along with a narrowing of the risk corridors to mitigate the risk of losses for participating PDPs. For 2026, the Trump administration reduced the monthly premium subsidy from $15 to $10, raised the limit on the PDP monthly premium increase to $50, and eliminated the risk corridor component of the demonstration.

Actual monthly premiums paid by Part D enrollees in stand-alone PDPs in 2026 will vary considerably, ranging from $0 to $100 or more in most regions. In addition to the monthly premium, Part D enrollees with higher incomes ($106,000/individual; $212,000/couple) pay an income-related premium surcharge, ranging from $13.70 to $85.80 per month in 2025 (depending on income).

Most MA-PD enrollees pay no premium beyond the monthly Part B premium (although high-income MA enrollees are required to pay a premium surcharge). MA-PD sponsors can use rebate dollars from Medicare payments to lower or eliminate their Part D premiums, so the average premium for drug coverage in MA-PDs is heavily weighted by zero-premium plans. In 2025, the enrollment-weighted average monthly portion of the premium for drug coverage in MA-PDs is substantially lower than the average monthly PDP premium ($7 versus $39).

Benefits

The Part D defined standard benefit changed substantially in 2025 and now includes a cap on out-of-pocket drug spending. The benefit has three phases, including a deductible, an initial coverage phase, and catastrophic coverage. For 2026, under the standard benefit, Part D enrollees will pay a deductible of $615 (up from $590 in 2024), and will then pay 25% of their drug costs in the initial coverage phase until their out-of-pocket spending totals $2,100 (Figure 5). At that point, they qualify for catastrophic coverage and pay no additional out-of-pocket costs.

In 2026, the Medicare Part D Standard Benefit Includes a $615 Deductible and a $2,100 Cap on Out-of-Pocket Drug Spending

Part D plans must offer either the defined standard benefit or an alternative equal in value (“actuarially equivalent”) and can also provide enhanced benefits. Both basic and enhanced benefit plans vary in terms of their specific benefit design, coverage, and costs, including deductibles, cost-sharing amounts, utilization management tools (i.e., prior authorization, quantity limits, and step therapy), and which drugs are covered on their formularies. Plan formularies must include drug classes covering all disease states, and a minimum of two chemically distinct drugs in each class. Part D plans are required to cover all drugs in six “protected” classes: immunosuppressants, antidepressants, antipsychotics, anticonvulsants, antiretrovirals, and antineoplastics.

Part D plans are also required to cover all drugs that have been selected for Medicare drug price negotiation, including all dosage forms and strengths. CMS will use the annual formulary review process to ensure that all Part D plans cover all dosages and formulations of selected drugs. Negotiated prices for the first 10 drugs that were selected for negotiation will take effect for Medicare beneficiaries on January 1, 2026.

Part D and Low-Income Subsidy Enrollment in PDPs and MA-PDs

Enrollment in Medicare Part D plans is voluntary, except for beneficiaries who are eligible for both Medicare and Medicaid and certain other low-income beneficiaries who are automatically enrolled in a PDP if they do not choose a plan on their own. Beneficiaries face a penalty equal to 1% of the national average premium for each month they delay enrollment unless they have drug coverage from another source that is at least as good as standard Part D coverage (“creditable coverage”).

In 2025, 54.8 million Medicare beneficiaries are enrolled in Medicare Part D plans, including employer-only group plans; of the total, 58% are enrolled in MA-PDs and 42% are enrolled in stand-alone PDPs (Figure 6). Another 0.7 million beneficiaries are estimated to have drug coverage through employer-sponsored retiree plans where the employer receives a subsidy from the federal government equal to 28% of drug expenses between $615 and $12,650 per retiree in 2026. Several million beneficiaries are estimated to have other sources of drug coverage, including employer plans for active workers, FEHBP, TRICARE, and Veterans Affairs (VA). Around 11% of people with Medicare are estimated to lack creditable drug coverage.

Enrollment in Medicare Part D Stand-alone Prescription Drug Plans Has Declined Somewhat in Recent Years While Enrollment in Medicare Advantage Drug Plans Has Increased Steadily

Recent years have seen a growing divide in the Part D plan market between stand-alone PDPs, where the number of plans has generally been trending downward over time in conjunction with a reduction in PDP enrollment, and MA-PDs, where plan availability and enrollment have grown steadily in recent years. The widespread availability of low or zero-premium MA-PDs, while PDPs charge substantially higher premiums on average, could tilt enrollment even more towards Medicare Advantage plans in the future.

As of May 2025, 13.9 million Part D enrollees receive premium and cost-sharing assistance through the LIS program. As with overall Part D enrollment, more LIS enrollees are in MA-PDs than PDPs. Beneficiaries who are dual-eligible individuals, those enrolled in Medicare Savings Programs (QMBs, SLMBs, QIs), and those who receive Supplemental Security Income payments from Social Security automatically qualify for the additional assistance, and they are automatically enrolled in PDPs with premiums at or below the regional Low-Income Subsidy benchmark premium amount if they do not choose a plan on their own. Other beneficiaries can apply for the Low-Income Subsidy through either the Social Security Administration or Medicaid and are subject to both an income and asset test. 

Part D Spending and Financing

Part D Spending

Medicare’s actuaries estimate that spending on Part D benefits (net of premiums paid by enrollees) will total $141 billion in 2026, representing 11% of total Medicare benefits spending.

In general, Part D spending depends on several factors, including the total number of Part D enrollees, their health status and the quantity and type of drugs used, the number of high-cost enrollees (those with drug spending above the catastrophic threshold), the number of enrollees receiving the Low-Income Subsidy, the price of drugs covered by Part D and the ability of plan sponsors to negotiate discounts (rebates) with drug companies and preferred pricing arrangements with pharmacies, and to manage use (e.g., promoting use of generic drugs, prior authorization, step therapy, quantity limits, and mail order). Part D spending is also affected by the level of price discounts that the federal government negotiates under the Medicare Drug Price Negotiation Program, as well as the effect of the inflation rebate provision of the IRA on price growth for existing drugs and launch prices for new drugs.

Part D Financing

Financing for Part D comes from federal government contributions (75%), beneficiary premiums (13%), and state contributions (12%). Medicare subsidizes 74.5% of basic Part D benefit costs through a monthly capitated payment to Part D plans for each enrollee, based on an average of bids submitted by plans for their expected basic benefit costs, though this share may be higher with the Inflation Reduction Act’s 6% base beneficiary premium cap and the temporary Part D premium stabilization program in effect. Enrollee premiums for basic benefits were initially set to cover 25.5% of the cost of standard (basic) drug coverage, but with premium stabilization measures in effect, enrollees are paying a lower share of costs overall. Higher-income Part D enrollees pay a larger share of standard Part D costs, ranging from 35% to 85%, depending on income.

Payments to Plans

For 2026, Medicare’s actuaries estimate that Part D plans will receive direct subsidy payments from the federal government for the cost of basic Part D benefits (plus administrative expenses and profits) that average $1,710 per enrollee overall, $522 in reinsurance payments for very high-cost enrollees, and $1,337 in subsidy payments for enrollees receiving the LIS. Employers are expected to receive, on average, $561 in federal subsidies for retirees in employer-subsidy Part D plans. Part D plans also receive additional risk-adjusted payments based on the health status of their enrollees, and plans’ potential total losses or gains are limited by risk-sharing arrangements with the federal government (“risk corridors”).

As of 2025, Medicare’s reinsurance payments to plans for total spending incurred by Part D enrollees above the catastrophic coverage threshold subsidize 20% of brand-name drug spending and 40% of generic drug spending, down from 80% in previous years, due to a provision in the Inflation Reduction Act. With this change in effect, Medicare’s aggregate reinsurance payments to Part D plans are projected to account for 18% of total Part D spending in 2026, based on KFF analysis of data from the 2025 Medicare Trustees report. This is a substantial reduction from 2024, when reinsurance spending had grown to account for close to half of total Part D spending (46%) (Figure 7). Currently, the largest portion of total Part D spending is accounted for by direct subsidy payments to plans (59% of total spending in 2026).

Spending for Direct Subsidy Payments to Plans Now Accounts for the Largest Share of Total Medicare Part D Spending, Rather Than Reinsurance, Reflecting Changes to the Part D Benefit That Took Effect in 2025

Appendix

The Number of Medicare Part D Stand-alone Prescription Drug Plans and Benchmark Plans Has Declined Over Time

Medicare Part D Premiums Are Decreasing for Many Stand-Alone Drug Plans in a Number of States in 2026

Few Plans Are Increasing Premiums by $50, the Maximum Allowed Under the PDP Premium Stabilization Demonstration

Published: Oct 7, 2025

CMS has just released information about Medicare Part D plans for 2026, including plan availability and premiums for the coming year. As this year’s Medicare open enrollment period approaches, there’s some good news for Medicare Part D enrollees when it comes to monthly PDP premiums – lower on average, according to CMS – even as the total number of PDPs available drops yet again.

The headline of CMS’s press release emphasized stability in the Part D marketplace, but a quick review of the data shows that the total number of stand-alone drug plans available in 2026 will fall for the third year in a row, as plan sponsors scale back their PDP offerings (for example, Centene is discontinuing one of the 3 Wellcare PDP options; Health Care Service Corporation is discontinuing one of the 3 Cigna PDP options and withdrawing from several PDP regions) or exit the market entirely (as in the case of Elevance’s Anthem PDPs). Overall, there will be fewer PDPs in 2026 than in 2025 – 360 plans nationwide, down from 464 in 2025.

Firm decisions to exit the PDP market or scale back their PDP offerings in recent years have been based on evaluations about the profitability and viability of the stand-alone drug plan market, particularly for insurers with a smaller footprint, accounting for higher costs associated with a redesigned Part D benefit under the Inflation Reduction Act. The law added an out-of-pocket spending cap for Part D enrollees beginning in 2025 and shifted more of the share of high-drug cost enrollees from the federal government to the plans themselves, which increased plan liability overall. In addition, many insurers that offer both PDP and MA-PD plans have stated their interest in focusing resources on more lucrative Medicare Advantage markets.

Somewhat more unexpected than the reduction in plan availability for 2026 are the year-over-year premium changes for PDPs. A comprehensive KFF analysis will follow in the future, but it appears that substantial premium increases for PDPs across the board didn’t materialize, even as the Trump administration scaled back the level of support for additional PDP premium subsidies through the temporary Part D premium stabilization demonstration established by the Biden administration in 2024. For 2026, the federal government is providing participating PDPs with an across-the-board monthly premium subsidy of up to $10 (down from $15 in 2025) and limiting the monthly premium increase for 2026 to $50 (up from $35 in 2025) – revised parameters which, when they were announced, seemed to point in the direction of higher premiums for PDP coverage in 2026.

In fact, for all but one of the 10 PDPs that were offered nationwide in 2025 and that will continue to be offered on a national or near-national basis in 2026, Medicare Part D enrollees in a number of states will see lower monthly premiums in 2026 than in 2025. This is consistent with CMS’s projection that the average monthly PDP premium will decrease by a few dollars in 2026. Only a few national PDPs are increasing monthly premiums by $50, the maximum allowed under the premium stabilization demonstration, and PDP enrollees may have up to 6 PDPs available for $0 premium, depending on where they live.

Medicare Part D Enrollees in Many States Will See Lower Monthly Premiums for Several Stand-alone Drug Plans Available Nationwide in 2025; Only a Few National PDPs are Increasing Premiums by $50, the Maximum Allowed Under the Premium Stabilization Demonstration

Looking at premium changes for a few of the more popular plans shows a mixed picture, however, with wide variation in monthly premiums across plans and the 50 states and DC (Figure 1):

  • The monthly premium for the most popular PDP nationally, Wellcare Value Script, is increasing in more states (33, including DC) than where it is holding steady (16) or decreasing (2), and will range from $0 to $42.40 across states and DC in 2026 (Figure 2).
  • Enrollees in the second most popular PDP, Wellcare Classic, will see a premium reduction in 48 states (including DC), no change in 2, and an increase of less than $50 in 1. Monthly premiums will range from $0 to $45.70 across states and DC in 2026.
  • Enrollees in the third most popular PDP, SilverScript Choice, will face the maximum $50 increase in their monthly premium in 30 states (including DC), but a premium reduction in 20 other states. The monthly premium will vary across states and DC from $14.70 to $116.
Monthly Premiums for Medicare Part D Stand-alone Plans Available on a National or Near-National Basis in 2026 Will Vary Widely, Both Across Plans and for the Same Plan Across States

According to CMS, virtually all PDP enrollees are in plans sponsored by insurers that opted to participate in the voluntary demonstration for 2026. In the absence of this demonstration and CMS’s actions during the bidding cycle for 2026 to negotiate and even reject plan bids, PDP premium increases would likely have been larger. And with 58% of all Part D enrollees in Medicare Advantage drug plans in 2025 and 42% in stand-alone PDPs, most Part D enrollees are not likely to face premium increases of any magnitude. This is because Medicare Advantage plans can use rebate dollars from the federal government to reduce premiums for prescription drug coverage. According to CMS, Medicare Advantage drug plan premiums for 2026 are holding steady at considerably lower levels than stand-alone drug plans, on average, with many plans charging zero premium for drug coverage in 2026, as in previous years.

Even if the monthly premium for a given Part D plan isn’t increasing, or is even decreasing, premiums are only one part of the story when it comes to Part D coverage. As is commonly advised during open enrollment, Medicare beneficiaries may want to look beneath the hood to see what other Part D plan features may be changing, including what drugs are and aren’t covered on the plan’s formulary, tier placement of covered drugs, deductibles, and cost-sharing requirements. The tradeoff with a reduction in premiums is that drug coverage may be getting less generous, which could mean fewer drugs covered, higher cost-sharing requirements, or greater utilization management restrictions – or likely some combination of all three.

Medicaid Waiver Tracker: Approved and Pending Section 1115 Waivers by State

Published: Oct 7, 2025

Tracker

Section 1115 Medicaid demonstration waivers offer states an avenue to test new approaches in Medicaid that differ from what is required by federal statute, if [in the HHS Secretary’s view] the approach is likely to “promote the objectives of the Medicaid program.” They can provide states additional flexibility in how they operate their programs, beyond the considerable flexibility that is available under current law. Waivers generally reflect priorities identified by states as well as changing priorities from one presidential administration to another. Nearly all states have at least one active Section 1115 waiver and some states have multiple 1115 waivers. See the “Key Themes Maps” tab for a discussion of recent waiver trends.

This page tracks approved and pending Section 1115 waiver provisions (including expansions and restrictions) related to eligibility, benefits, and social determinants of health and other delivery system reforms, once such waivers are posted to the state waivers list on Medicaid.gov. For more information on inclusion criteria and on each provision, as well as a list of acronyms, see the Definitions tab.

Medicaid Watch

Policy research, polling and news about the Medicaid financing debate.

Landscape of Approved and Pending Section 1115 Waivers


Waivers with Eligibility Changes

(back to top)

Section 1115 Eligibility Changes - Expanded Eligibility Groups

Waivers with Benefit Changes

(back to top)

Section 1115 Benefit Changes - Expansions

Waivers with SDOH & Other DSR Changes

(back to top)

Section 1115 SDOH Provisions

All Approved Waivers by Topic

(back to top)

Approved Section 1115 Medicaid Waivers

All Pending Waivers by Topic

(back to top)

Pending Section 1115 Medicaid Waivers

Work Requirements

The 2025 budget reconciliation legislation requires states to condition Medicaid eligibility for adults in the ACA Medicaid expansion group on meeting work requirements starting January 1, 2027, but states have the option to implement requirements sooner using an 1115 waiver.

Prior to the passage of the federal reconciliation legislation and since the start of the second Trump administration, some states have shown renewed interest in pursuing work requirement policies through 1115 waivers. However, some states may no longer be moving forward with proposed 1115 waivers due to the passage of federal work requirements. Montana is the only state that has submitted a waiver since the passage of the 2025 budget reconciliation legislation. It is not clear how CMS will treat pending 1115 waivers that seek to implement early and deviate from federal requirements specified in the law.

The first Trump administration encouraged and approved 1115 demonstration waivers that conditioned Medicaid coverage on meeting work requirements which were subsequently rescinded by the Biden administration or withdrawn by states. Currently, Georgia is the only state with a Medicaid work requirement waiver in place following litigation over the Biden administration’s attempt to stop it.

The map below identifies approved (Georgia) and pending work requirement waivers (submitted to CMS since the start of the second Trump administration). The table below the map provides more detailed state waiver information.

For more information on Medicaid work requirements, see additional KFF resources:

  • An overview of the work requirement provisions in the 2025 budget reconciliation legislation, including key operational & implementation questions (2025)
  • Analyses of the work status and characteristics of Medicaid enrollees (2025)
  • A short brief highlighting five key facts about Medicaid work requirements, including what the research shows about the impact of work requirements (2025)
  • A detailed history of Medicaid work requirements (2022)
Section 1115 Approved and Pending Work Requirement Waivers

The table below provides more detailed state waiver information for waivers that are approved and pending at the federal level, as well as activity at the state-level once a waiver proposal has been released for state-level “public comment.” This table also lists states with legislative activity involving work requirements, once a bill has passed out of committee (typically the first step of the legislative process). Some states require state legislative action before Section 1115 waiver requests can be submitted by the state Medicaid agency to CMS for federal approval and others do not.

Key States with Work Requirement Waiver Activity

Key Themes Maps

Section 1115 waivers generally reflect priorities identified by states as well as changing priorities from one presidential administration to another.  Key Biden administration 1115 initiatives included waivers addressing enrollee health-related social needs (HRSN), pre-release coverage for individuals who are incarcerated, and multi-year continuous eligibility for children.

In March 2025, the Trump administration rescinded HRSN guidance issued by the Biden administration. CMS indicates this does not nullify existing HRSN 1115 approvals but going forward they will consider HRSN / SDOH requests on a case-by-case basis. In April 2025, the Trump administration announced it would be phasing out federal funding for “Designated State Health Programs” (DSHP) in waivers. In July 2025, the Trump administration released guidance indicating it will not approve (new) or extend (existing) continuous eligibility waivers for children or adults. CMS also announced in July it would be phasing out initiatives to strengthen the Medicaid workforce for primary care, behavioral health, dental, and home and community based services (not depicted in maps below).

This page tracks pending and approved waivers in key areas of recent state activity and will track Trump administration action in these areas going forward. Hover over individual states to display waiver expiration dates.

Social Determinants of Health

Social determinants of health (SDOH) are the conditions in which people are born, grow, live, work and age. SDOH include but are not limited to housing, food, education, employment, healthy behaviors, transportation, and personal safety. In 2022, CMS (under the Biden administration) announced a demonstration waiver opportunity to expand the tools available to states to address enrollee “health-related social needs” (or “HRSN”) including housing instability, homelessness, and nutrition insecurity, building on CMS’s 2021 guidance. In 2023, CMS issued a detailed Medicaid and CHIP HRSN Framework accompanied by an Informational Bulletin, which were updated in 2024.

In March 2025, the Trump administration rescinded the Biden administration HRSN guidance. CMS indicates this does not nullify existing HRSN approvals but going forward they will consider HRSN / SDOH requests on a case-by-case basis.

The “HRSN Waivers” map below identifies states with approval under the Biden administration HRSN framework. The “All SDOH Waivers” map identifies SDOH-related 1115 waivers more broadly, including those that pre-date or were approved outside of the HRSN framework. For more detailed waiver information, refer to KFF’s Medicaid Waiver Tracker (“SDOH” table) and HRSN waiver watch  (March 2024).

Section 1115 Waivers: Social Determinants of Health (SDOH)

Medicaid Pre-release Coverage for Individuals Who Are Incarcerated

In April 2023, the Biden administration released guidance encouraging states to apply for a new Section 1115 demonstration opportunity to test transition-related strategies to support community reentry for people who are incarcerated. This demonstration allows states a partial waiver of the inmate exclusion policy, which prohibits Medicaid from paying for services provided during incarceration (except for inpatient services). Reentry services aim to improve care transitions and increase continuity of health coverage, reduce disruptions in care, improve health outcomes, and reduce recidivism rates. The Biden administration approved 19 state waivers to facilitate reentry for individuals who are incarcerated. The map below identifies states with approved and pending waivers to provide pre-release services to Medicaid-eligible individuals who are incarcerated.  Medicaid pre-release waivers have been pursued by both Republican and Democratic governors. For more information, refer to KFF’s Medicaid Waiver Tracker (“Eligibility Changes” table) and related pre-release waiver watch (August 2024).

Section 1115 Waivers: Medicaid Pre-release Coverage for Individuals Who Are Incarcerated

Multi-year Continuous Eligibility for Children

The Consolidated Appropriations Act, 2023 required all states to implement 12-month continuous eligibility for children beginning on January 1, 2024. The Biden administration approved 9 waivers that allow states to provide multi-year continuous eligibility for children (e.g., from birth to age six). Continuous eligibility has been shown to reduce Medicaid disenrollment and “churn” rates (rates of individuals temporarily losing Medicaid coverage and then re-enrolling within a short period of time).

In July 2025, the Trump administration released guidance indicating it will not approve (new) or extend (existing) continuous eligibility waivers for children or adults. The map below displays states with waiver approval to provide multi-year continuous eligibility for children.  For more information, refer to KFF’s Medicaid Waiver Tracker (“Eligibility Changes” table) and related continuous eligibility waiver watch (February 2024).

Section 1115 Waivers: Multi-year Continuous Eligibility for Children

Definitions

Section 1115 Waiver Tracker: Key Definitions and Notes

Related Resources

Recent Developments

General/Overview Resource

Eligibility and Enrollment Expansions

Eligibility and Enrollment Restrictions

Work Requirements:

Other:

Benefit Expansions

Benefit Restrictions, Copays, and Healthy Behaviors

Social Determinants of Health

Delivery System Reform

How Does the Quality of the U.S. Health System Compare to Other Countries?

Published: Oct 6, 2025

This chart collection compares the United States and other similarly large and wealthy nations across various measures of care quality to show how the U.S. stacks up against its peers and how that has changed over time.

Generally, the U.S. performs worse in long-term health outcomes measures (such as life expectancy), certain treatment outcomes (such as maternal mortality and congestive heart failure hospital admissions), some patient safety measures (such as obstetric trauma with instrument), and health system capacity (such as rate of general practitioners). The U.S. performs similarly to or better than peer nations in other measures of treatment outcomes (such as mortality rates within 30 days of acute hospital treatment) and some patient safety measures (such as post-operative complications).

The chart collection is part of the Peterson-KFF Health System Tracker, an online information hub dedicated to monitoring and assessing the performance of the U.S. health system.

A Look at Variation in Medicaid Spending Per Enrollee by Group and Across States

Published: Oct 6, 2025

Editorial Note

Originally published in August 2024, this data note was updated on October 6, 2025 with data from 2023, the most current Medicaid data available at the time of this analysis.

Medicaid is the primary program providing comprehensive health and long-term care coverage to approximately one in five low-income Americans. States administer Medicaid programs within broad federal rules, but have flexibility in designing programs, which creates variation in spending and enrollment as well as spending per enrollee across eligibility groups and states.

Over the coming years, state Medicaid programs may see significant reductions to their Medicaid enrollment and spending, resulting in changes to their spending per enrollee, across eligibility groups due to the recently enacted budget reconciliation package once called the “One Big, Beautiful Bill,” signed by President Trump on July 4th. The new law is estimated by the Congressional Budget Office (CBO) to cut federal Medicaid spending by $911 billion – or 14% of federal Medicaid spending – over the next ten years and increase the uninsured rate by 10 million, with some of the increase attributed to individuals losing Medicaid coverage. Provisions in the new law will have different effects on Medicaid spending and enrollment across the states. For example, over half of the reductions in federal spending (associated with most of the projected enrollment declines) stem from policies that only would affect states that have expanded Medicaid under the Affordable Care Act (ACA). How states respond to reductions in federal funding will impact the amount of spending reductions and the distribution of enrollment losses, which will affect Medicaid’s spending per enrollee. 

This data note provides an overview of total Medicaid (state and federal shares) spending per enrollee for full-benefit Medicaid enrollees by eligibility group and state in 2023. Data from 2023 are the most current Medicaid data available at the time of this analysis. Full-benefit Medicaid enrollees are those that qualify for a full range of Medicaid services such as doctor’s visits, hospitalizations, prescription drugs, and home health services. A small number of total enrollees (8% of all enrollees in 2023) qualify for only a limited set of Medicaid benefits such as family planning or treatment of an emergency medical condition and are not included in this analysis. References to Medicaid enrollees in this data note refer to full-benefit enrollees. See methods for more details. Detailed state-level data are also available on State Health Facts.

National Medicaid spending per enrollee is $7,909, though that varies widely by eligibility group (Figure 1). 

Overall, children account for 35% of full-benefit enrollment, but 15% of the spending, while adults ages 65 and older and people eligible because of a disability account for 19% of enrollment but 51% of the spending (data not shown). The disproportionate spending on certain eligibility groups stems from variation in spending per enrollee across the eligibility groups. Spending per enrollee is highest for people with disabilities ($20,950), and older adults ($20,194) (Figure 1). Those groups have per-enrollee spending approximately six times higher than child enrollees ($3,321), which have the lowest spending of any eligibility group (Figure 1). Differences in spending per enrollee reflect differences in health care needs and utilization. For example, older adults and people eligible on the basis of disability tend to have higher rates of chronic conditionsmore complex health care needs and are more likely to utilize long-term care (LTC) than other enrollees. Most older adults and people with disabilities enrolled in Medicaid are also dually eligible for Medicare. For dual-eligible individuals, Medicare is the primary payer for acute care services while Medicaid pays for services that Medicare does not, including vision, dental, and most LTC. Medicaid spending per enrollee accounts for less than half of all spending for full-benefit dual-eligible individuals that are 65 and older.

National Medicaid Spending Per Enrollee Is $7,909, Though That Varies Widely by Eligibility Group

Flexibility for states to determine eligibility levels, benefits, and provider payments in the Medicaid program leads to wide variation in per-enrollee spending across states (Figure 2).

Other factors contributing to variation in per-enrollee spending include variation in state populations and demographics, ability and effort to raise revenue, and variation in health care costs and markets. Across states, Medicaid spending per enrollee ranges from $4,780 to $12,295, with a median spending of $7,909 (Figure 2). Alabama, Florida, Georgia, and Nevada report some of the lowest spending per enrollee, while Washington, D.C., Minnesota, Pennsylvania, and North Dakota report the highest spending per enrollee. Approximately one in seven states have spending greater than $10,000 per enrollee (Figure 2).

Medicaid Spending Per Enrollee Ranges From Under $5,000 to Over $12,000

Within each eligibility group, there is also considerable variation in spending per enrollee across states (Figure 3).

People with disabilities have the widest variation across states for per-enrollee spending, ranging from $5,040 in Florida to $57,900 in Minnesota (Figure 3). States have considerable flexibility to decide the populations and services covered for long-term care (LTC), which drives large variation in per-enrollee spending for older adults and people with disabilities, who are more likely to use LTC. In contrast, per-enrollee spending for children ranges from $2,227 in Alabama to $5,457 in Alaska (Figure 3). All states must provide comprehensive coverage for children through the Early Periodic Screening Diagnosis and Treatment (EPSDT), which contributes to somewhat less variation in per-enrollee spending for children.

Many—but not all—states that have relatively high or low overall per-enrollee spending tend to see those same patterns across eligibility groups in the state (Figure 3). Some states with the lowest overall per-enrollee spending (e.g. Alabama, Oklahoma) fall among the states with the lowest per-enrollee spending for most eligibility groups (Figure 3). Others, such as Florida and Nevada are more mixed across eligibility groups. For example, Florida, has low per-enrollee spending across all eligibility groups except for children, where it has one of the highest per-enrollee spending. Similarly, some states with the highest overall per-enrollee spending (e.g. Washington, D.C., Delaware) fall among the states with the highest per-enrollee spending for all eligibility groups. However, states like Pennsylvania and Massachusetts are less consistently high across all eligibility groups (Figure 3).

Medicaid Spending Per Senior Enrollee Ranges From Under $10,000 to Over $34,000

Even within a given state and eligibility group, there is wide variation in spending (Table 1). For example, among people with disabilities in Virginia, 25% have spending less than $12,506 and 5% have spending more than $130,130 – ten times higher (Table 1). Additionally, 25% of seniors in Colorado have spending less than $1,817, and 25% have spending sixteen times greater ($29,406) (Table 1). Despite the generally lower costs for non-disabled adult and child enrollees, the variation in spending for these eligibility groups is wide in Ohio, Vermont, and Idaho as well.

Within a State and Eligibility Group There is Wide Variation in Spending Per Enrollee

Per-enrollee spending in states that expanded Medicaid is higher for all eligibility groups than in non-expansion states (Figure 4).

Expansion states spend on average $8,444 per enrollee – nearly $1,000 more per enrollee when compared to non-expansion states, which spend $7,591 per enrollee (Figure 4). During debate over the reconciliation bill, some argued that the 90% match rate for expansion adults encourages expansion states to prioritize services for expansion adults of those of other populations—children, parents, people with disabilities, and older adults. However, across all non-expansion eligibility groups, average per-enrollee spending is higher in expansion states than in non-expansion states. For instance, expansion states have an average spending of $29,259 per enrollee eligible based on disability, while non-expansion states spend on average $19,289 per enrollee in the same eligibility group. Similarly, expansion states spend $22,350 per older adult enrollee compared to $18,288 for non-expansion states (Figure 4). These differences in spending may reflect state policy choices about benefits and eligibility, in addition to payment rates, regional variation in health care costs, and state demographics.

Per-Enrollee Spending in States That Expanded Medicaid Is Higher for All Eligibility Groups Than in Non-Expansion States


Methods

Data: The KFF State Health Facts on spending per full-benefit enrollee use the T-MSIS Research Identifiable Demographic-Eligibility and Claims Files (T-MSIS data). This data note is based on State Health Facts data from CY 2023.

Overview of methods: KFF defined full-benefit enrollees as those who are enrolled in Medicaid for at least 1 month with full-benefits or those who received at least one month of benefits through an alternative package of benchmark equivalent coverage. They may have not actually used any services during this period, but they are reported as enrolled in the program and are eligible to receive services. References to dual-eligible enrollees do not include Medicare Savings Program (MSP) enrollees due to the restriction of data to full-benefit enrollees only.

Spending: Spending was calculated by summing the total spending of all claims per full-benefit enrollee in the T-MSIS claims files.