The Kaiser Family Foundation/Washington Post Survey on Political Rallygoing and Activism
Overview
This partnership survey from The Washington Post and the Kaiser Family Foundation examines the public’s involvement in protests, rallies, marches, demonstrations, or campaign events with a focus on causes or issues that motivate the rallygoers to take action. The survey, one of the most extensive studies of political rallygoers and protesters in more than a decade, examines views of present-day activism, the public’s confidence and trust in societal and political institutions, and takes a prospective look at preference for and involvement in the 2018 midterm elections. This survey also assesses the public’s views on the limits of first amendment rights, as well as their views looking back on the political and social movements 50 years ago.
This survey is the 32nd in a series of surveys dating back to 1995 that have been conducted as a part of The Washington Post/Kaiser Family Foundation Survey Project.
Read The Washington Post’s reporting:
About half of Americans support single-payer health care
In hindsight, Americans are more critical of demonstrators today than protesters 50 years ago
Poll: 53 percent of Americans say it’s ‘never appropriate’ to kneel during the national anthem
Findings
The 2016 presidential campaign season and the first year of Donald Trump’s presidency brought increased attention to political activism with media images of large campaign rallies and protests and marches across the country. In order to understand the public’s views of activism and gauge how widespread this activity was, the Washington Post and the Kaiser Family Foundation conducted a representative survey of adults in the United States. The survey explored the public’s attitudes of protests and rallies, particularly in light of 2018 being 50 years after 1968 – a year fraught with protests over the Vietnam War and assassinations – and included a special focus on those who say they have attended a protest or rally in the past two years, exploring what’s driving them off the couch and out of the house. The Washington Post’s articles featuring the survey data can be found here. In addition, some of the key findings are summarized below.
A Spectrum of Political Activism
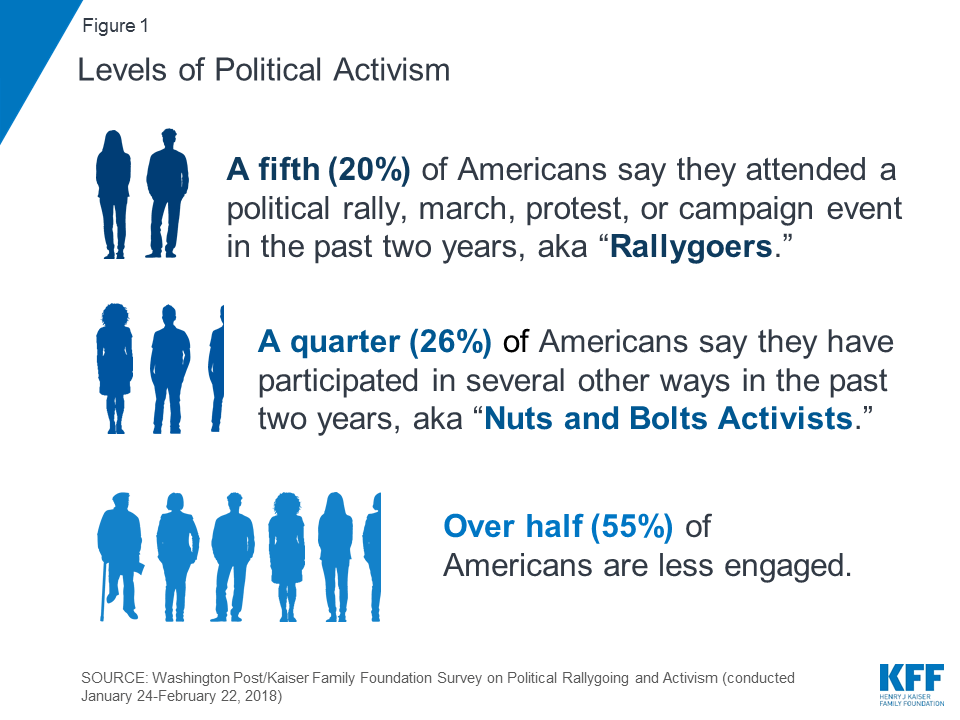
Overall, a fifth of the public say they have attended a political rally, speech, or campaign event or an organized protest, march, or demonstration since 2016, referred to here as rallygoers. Others have participated in different types of activism, including 26 percent – referred to here as “nuts and bolts activists” – who say that in the past two years they have worked or volunteered for a political party, candidate, or campaign, or a group that tries to influence government policy on issues they care about, or that they have done at least three of the following other types of activism: contacted an elected official, donated money, signed petitions, boycotted, or wore clothing about an issue or candidate they care about. Over half of the public (55 percent) are less engaged, either because they report participating only in one or two political activities in the past two years (26 percent) or because they’re not active in any of these specific ways (29 percent).
Looking more specifically at the types of political activities the public may have engaged in during the past two years, similar shares of rallygoers and nuts and bolts activists say they have signed petitions, contacted elected officials, and bought or boycotted a product or service. Those who are less engaged are less likely to have done each of these activities.
| Table 1: Types of Political Activities | |||
| Percent who say they participated in the following activities in the past two years: | Political rally-goers (20%) | Nuts and bolts activists (26%)* | Less Engaged (55%)* |
| Types of activities | |||
| Attended rally, speech, campaign event | 84% | 0% | 0% |
| Attended protest, march, demonstration | 60 | 0 | 0 |
| Signed petition | 81 | 82 | 24 |
| Contacted elected official | 75 | 73 | 12 |
| Poster/bumper sticker/clothing/button | 70 | 56 | 10 |
| Bought or boycotted product or service | 68 | 69 | 18 |
| Contributed money | 62 | 54 | 5 |
| Worked or volunteered for party/campaign | 38 | 13 | 0 |
| Worked or volunteered for group trying to influence government policy | 37 | 25 | 0 |
| *By definition, nuts and bolts activists and the less engaged have not attended a rally, speech, campaign event or protest, march or demonstration, and the less engaged have not worked or volunteered for a party or campaign or group | |||
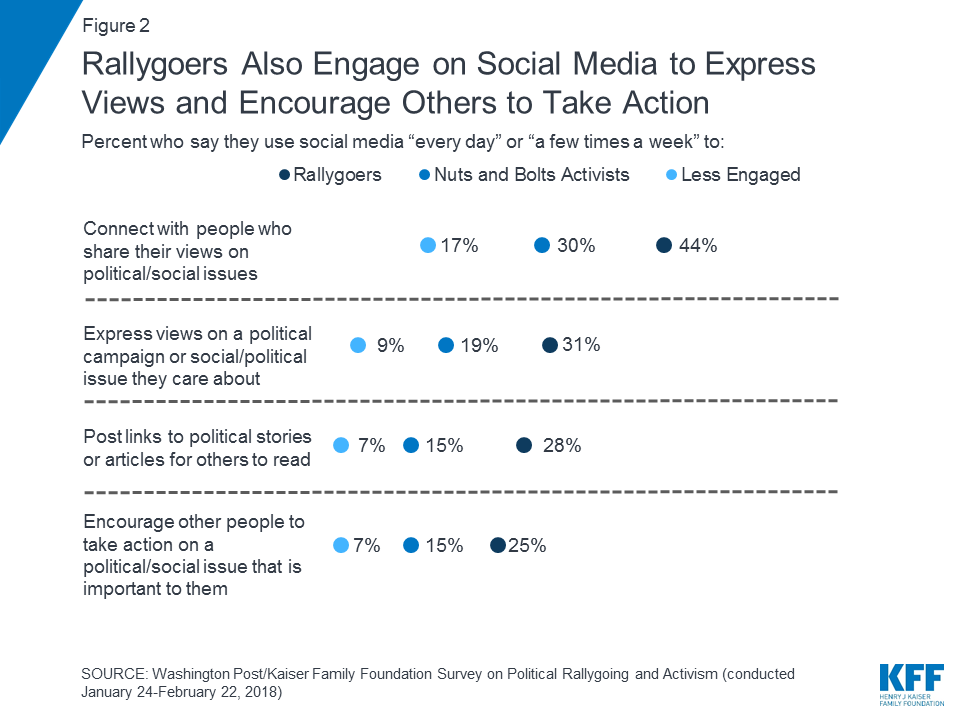
Social media is another way that the public engages in politics and policy. Rallygoers are more likely than nuts and bolts activists to say they are using social media at least a few times a week to connect with people who share their views on political or social issues, express their views on political campaigns or social issues, and post links to political stories or articles for other to read. To a lesser extent, nuts and bolts activists also report engaging in these activities, but still more than those who are less engaged.
Who are the Rallygoers and Nuts and Bolts Activists?
Generally, people getting out of the house and those active in other ways are disproportionately more educated and report higher incomes than those who are less engaged. Rallygoers are slightly younger than nuts and bolts activists, but the share of younger adults is similar to those who are less engaged. There are no differences across rallygoers, nuts and bolts activists and the less engaged in the share who are male or female.

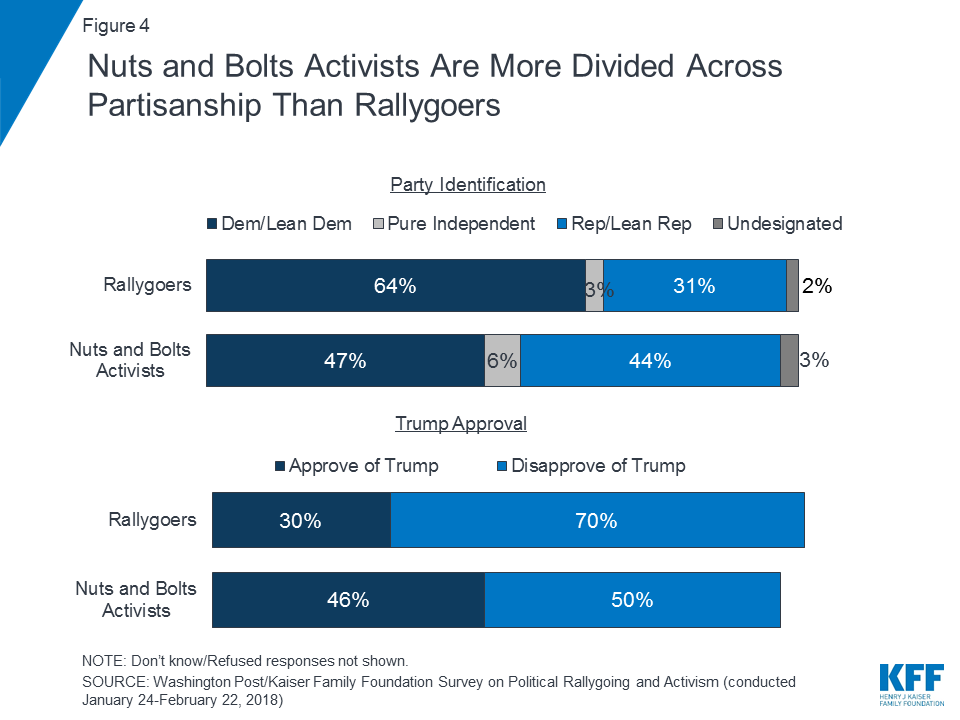
Rallygoers are much more likely to be Democratic and disapprove of President Trump than nuts and bolts activists. Overall, 64 percent of rallygoers identify as Democrats (40 percent) or lean Democratic (24 percent) and 70 percent disapprove of President Trump. Still, some rallygoers are Republican (20 percent) or lean Republican (11 percent) and approve of President Trump (30 percent). The nuts and bolts activists are a more politically divided group, with similar shares identifying as Democrats or Republicans and split in their views of President Trump.
2018 Midterms
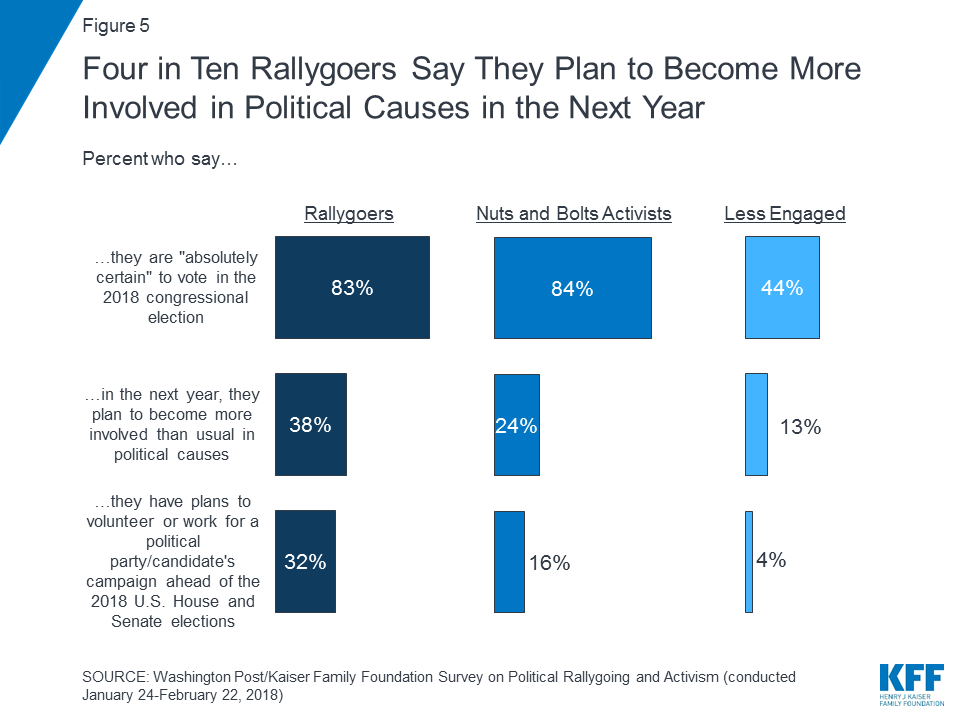
In terms of how this political activism will play into the 2018 midterm elections, similar shares of rallygoers (83 percent) and nuts and bolts activists (84 percent) say they are “absolutely certain” they will vote in the 2018 congressional election, while less than half of those less engaged (44 percent) say the same. But, rallygoers are more likely to say that they plan to become more involved in political causes or work or volunteer for a political campaign or candidate this year. For example, a third of rallygoers (32 percent) intend to volunteer or work for a political party or campaign ahead of the 2018 election – two times the share of nuts and bolts activists (16 percent).
What’s Getting Rallygoers Out of the House?
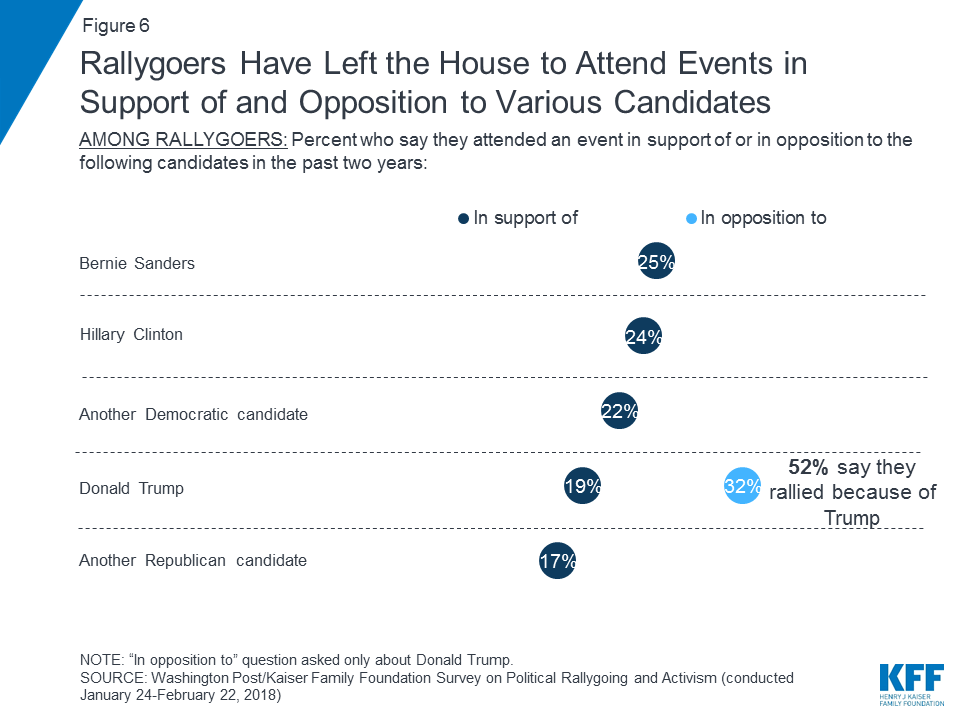
President Trump was a key motivator for many rallygoers. About half of rallygoers (52 percent), or 10 percent of the public overall, say they attended a rally or protest in support of Donald Trump (19 percent) or in opposition to him (32 percent).
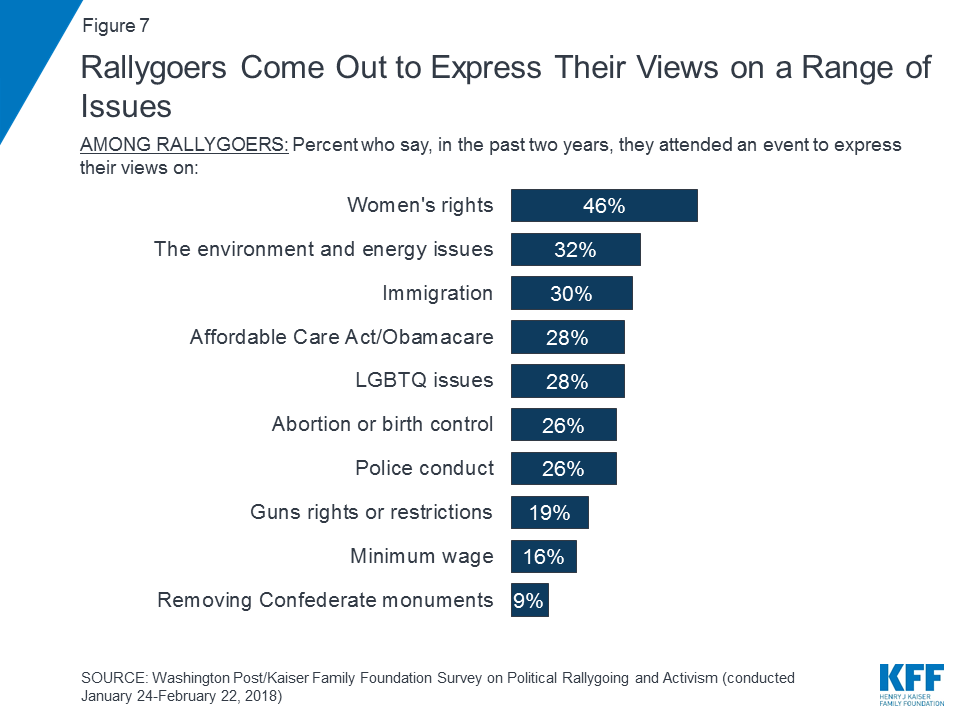
Another key motivator were social and political issues. For example, 46 percent of rallygoers say they came out to express their views in support of women’s rights. In addition, roughly 3 in 10 say issues like the environment or energy (32 percent), immigration (30 percent), the Affordable Care Act (28 percent), or LGBTQ issues (28 percent) brought them out to express their views. It’s important to note, the survey was conducted in January and February, before the marches on gun violence after the Parkland, Florida high school shooting and protests and rallies about increased U.S. border enforcement measures.
Overwhelmingly people came out on the liberal side of the issues asked about. More than half only came out on the liberal side of these issues or for liberal candidates, while about 2 in 10 only came out on the conservative side. In addition, rallygoers are not driven by just one issue: 95 percent of rallygoers report attending an event to express their views on at least two issues or campaigns.
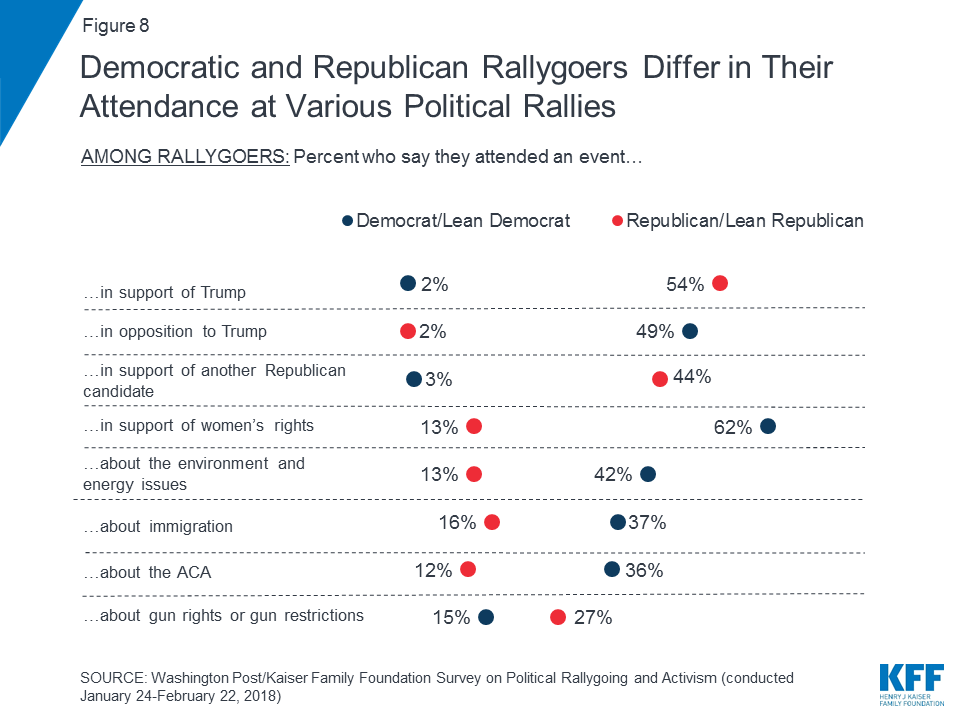
Not surprisingly, there are differences in the types of issues that are motivating rallygoers on opposite ends of the political spectrum. Republicans and Republican leaners turned out to support Trump (54 percent), while Democrats and Democratic leaners showed up to oppose him (49 percent). Republicans and Republican leaners were also motivated by other Republican candidates (44 percent). Democrats were more likely to show up for issues such as women’s rights, the environment, immigration, and the ACA, but Republicans and independents who lean Republican are more likely than Democrats or those that lean Democratic to have attended an event about gun issues in the past two years (27 percent vs. 15 percent).
Are Rallygoers More or Less Active Than in the Past?
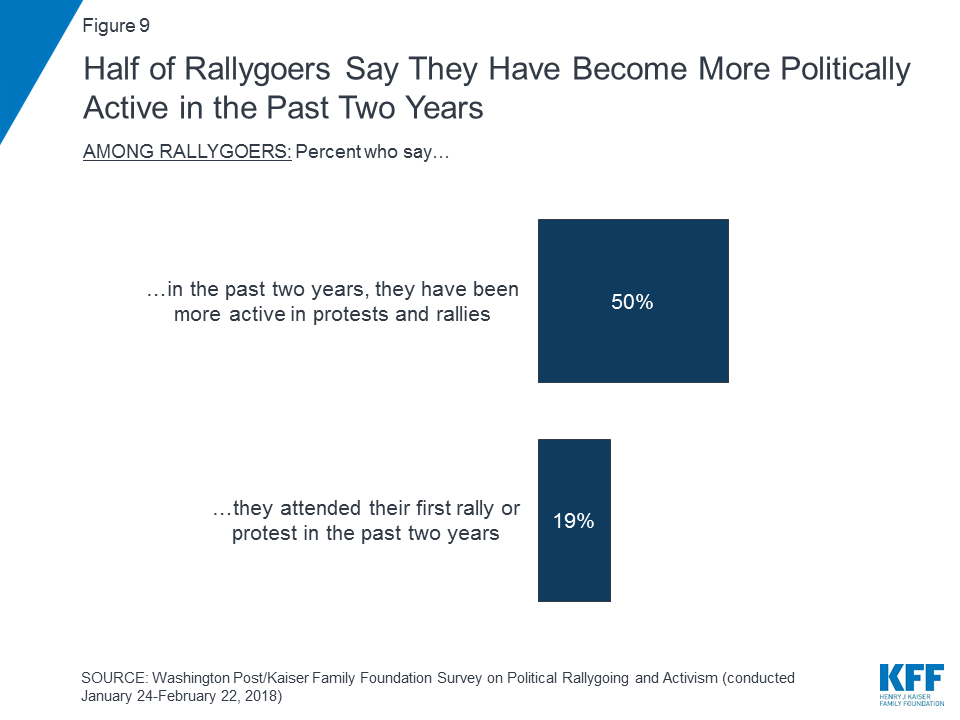
Half of all rallygoers say they have become more active in attending events in the past two years, compared with 17 percent who say they have become less active and 33 percent who say they have been just as active. Rallygoers who say they are more active recently are much more likely than others to say they went to an event opposing Trump in the past two years (47 percent vs. 18 percent). For 19 percent of rallygoers, their first protest or rally was in the past two years, reflecting an increase in activity during and after the 2016 election.
Health Care Activism
As noted above, the Affordable Care Act (ACA) was one of several issues bringing rallygoers out, with 28 percent of rallygoers saying they attended an event to express their views on the ACA, most of whom (24 percent) say they were expressing views in support of the law. Democratic rallygoers are more likely to say they came out about the ACA than Republican rallygoers (39 percent vs. 10 percent). Rallygoers turning out about the ACA are more likely than those turning out for other causes to identify as Democrats, be 50 or older, and are somewhat more likely to have higher incomes.
| Table 2: Demographic Characteristics of Rallygoers that Attended a Rally or Event to Express Views on The ACA | ||
| Among Rallygoers | ||
| Attended rally or event to express views on the ACA | Attended rally or event to express views on other issues | |
| Party | ||
| Democrat | 56% | 33% |
| Independent | 33 | 37 |
| Republican | 7 | 25 |
| Age | ||
| 18-29 | 15 | 28 |
| 30-49 | 31 | 33 |
| 50-64 | 33 | 22 |
| 65+ | 22 | 17 |
| Income | ||
| <$50,000 | 32 | 37 |
| $50,000- <$75,000 | 14 | 17 |
| $75,000 or more | 52 | 42 |
Those coming out to express their views on the ACA are a particularly motivated group of rallygoers.1 They are much more likely than rallygoers who came out to express their views on other topics to say they will be active in the midterms. For example, 54 percent say they plan to become more involved than usual in political causes in the next year and 53 percent say they plan to volunteer or work for a political party or a candidate’s campaign ahead of the 2018 midterm election.

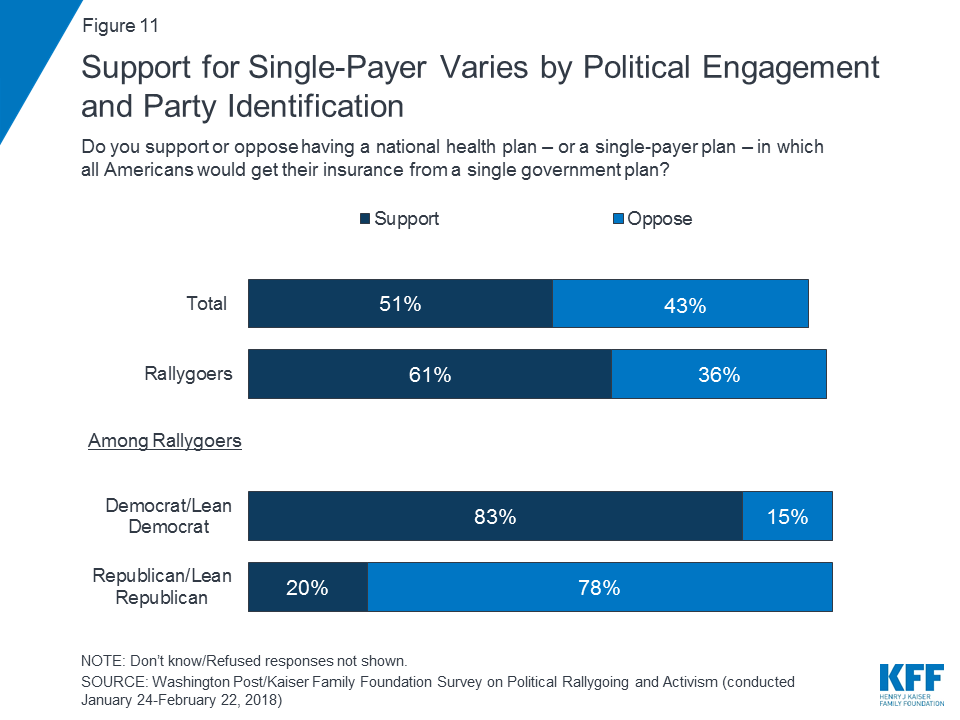
Much of the activism around health in 2016 and 2017 focused on the ACA due to the debate about the future of the law throughout the 2016 election and the 2017 debate about repealing and replacing the law. However, now in the lead-up to the 2018 midterms, there has been more discussion in Democratic campaigns of a single-payer plan, in which all Americans would get their health insurance from a single government plan. Overall, about half of the public supports a single-payer plan, whereas 43 percent oppose it. More rallygoers are supportive of single-payer, due in part to their Democratic leanings, as 83 percent of Democratic or Democratic leaning rallygoers support a single-payer plan. While the public is open to the idea of single-payer, other Kaiser polling has shown that views can change once supporters are presented with counter arguments.2
The Public’s Attitudes About Protests and Rallies and the People Who Participate
Views of How Protesters Have Changed
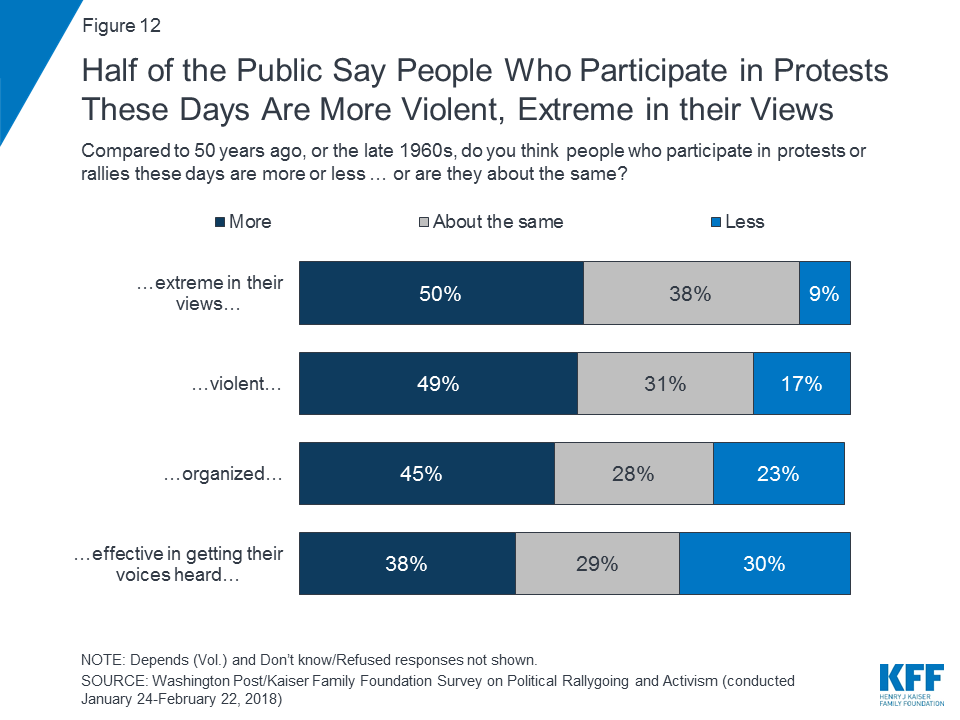
Fifty years after the tumultuous late 1960s, a time characterized by the civil rights movement, protests of the Vietnam War, and assassinations, the public more often feels that people who participate in rallies and protests today have become more extreme in their views, violent, organized, and effective in getting their voices heard, rather than less or about the same. For example, 49 percent of the public says that compared to the late 1960s, people who participate in protests or rallies these days are more violent, whereas 17 percent says they are less violent and 31 percent says they’re about the same.
Interestingly, older adults (65 or older) who lived through the 1960s are somewhat more likely to say things are more violent now (64 percent) and that protesters now are more extreme in their views (56 percent).
Limits to the First Amendment
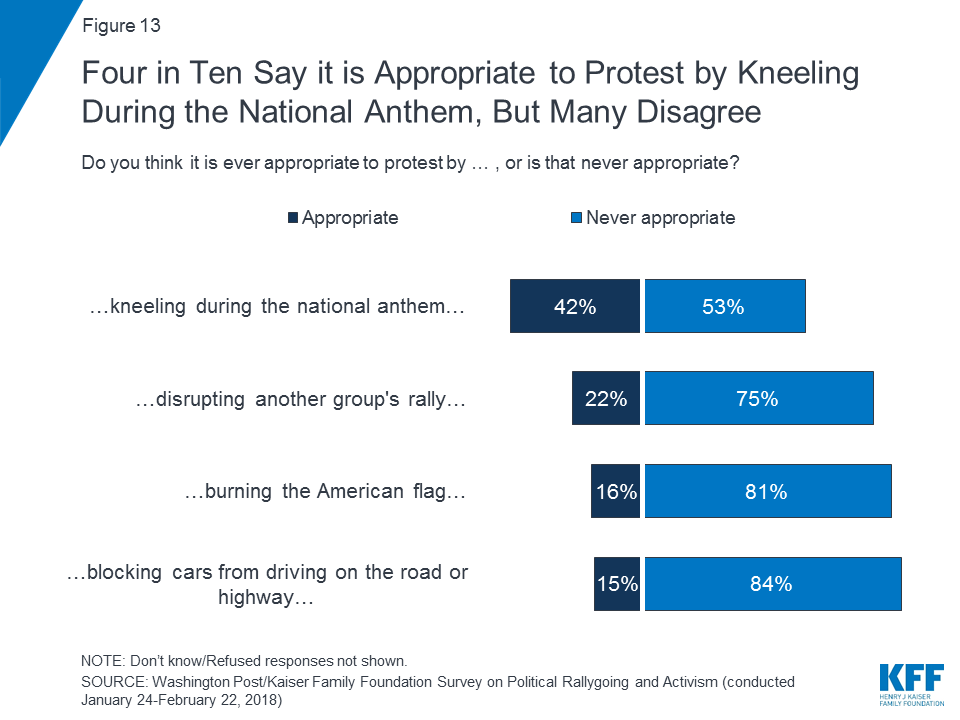
Majorities of the public feel it is never appropriate to protest by blocking cars from driving on the road or highway (84 percent), burning the American flag (81 percent), disrupting another group’s rally (75 percent), or kneeling during the national anthem (53 percent). Republicans are more likely to say various actions are never appropriate than Democrats, but still majorities of Democrats agree, with the exception of kneeling during the national anthem, where 66 percent of Democrats say it is appropriate.
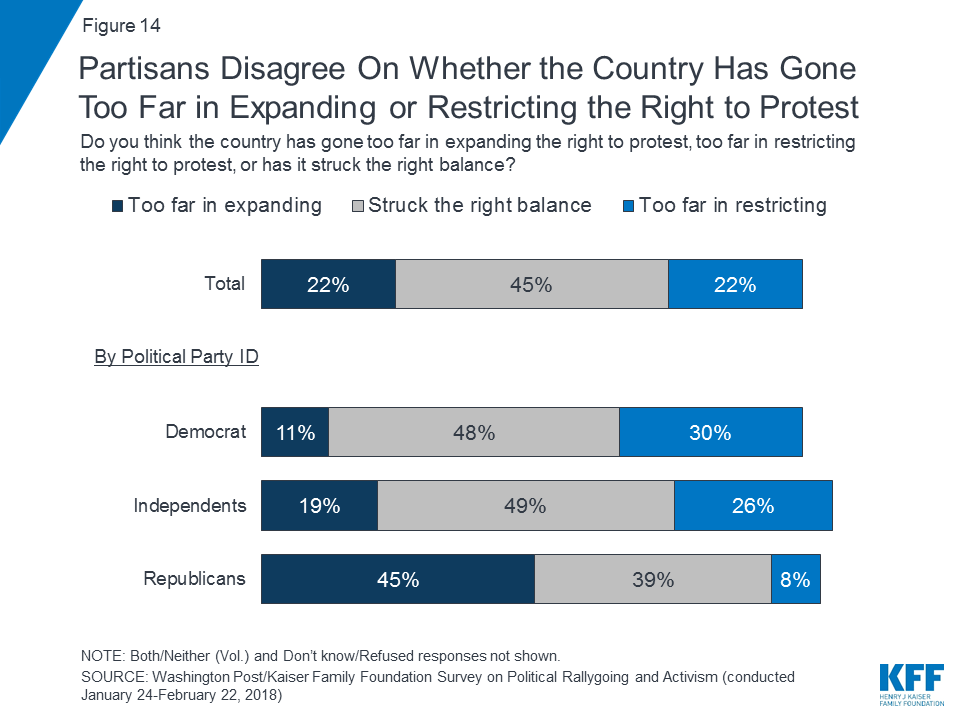
Much of the public feels the country has struck the right balance in terms of allowing or restricting protests, while 22 percent say it’s gone too far in expanding the right to protest and the same share (22 percent) say it has gone too far in restricting the right to protest. Rallygoers are more likely to think the country has gone too far in restricting the right to protest rather than too far in expanding the right to protest (29 percent vs. 13 percent), while most (51 percent) say the country has struck the right balance. Views vary by party with Republicans (45 percent) more likely to say the country has gone too far in expanding the right to protest than Democrats (11 percent) or independents (19 percent).
A slim majority of the public feels that even those they may disagree with have a right to protest peacefully: 54 percent say people should have the right to demonstrate peacefully in support of Nazis and white supremacy, compared to 42 percent who say this should be banned. Among rallygoers, 66 percent feel they should have a right to demonstrate peacefully. Most Democrats (54 percent) feel these types of demonstrations should be banned, while six in ten Republicans and independents feel they have the right to demonstrate peacefully.

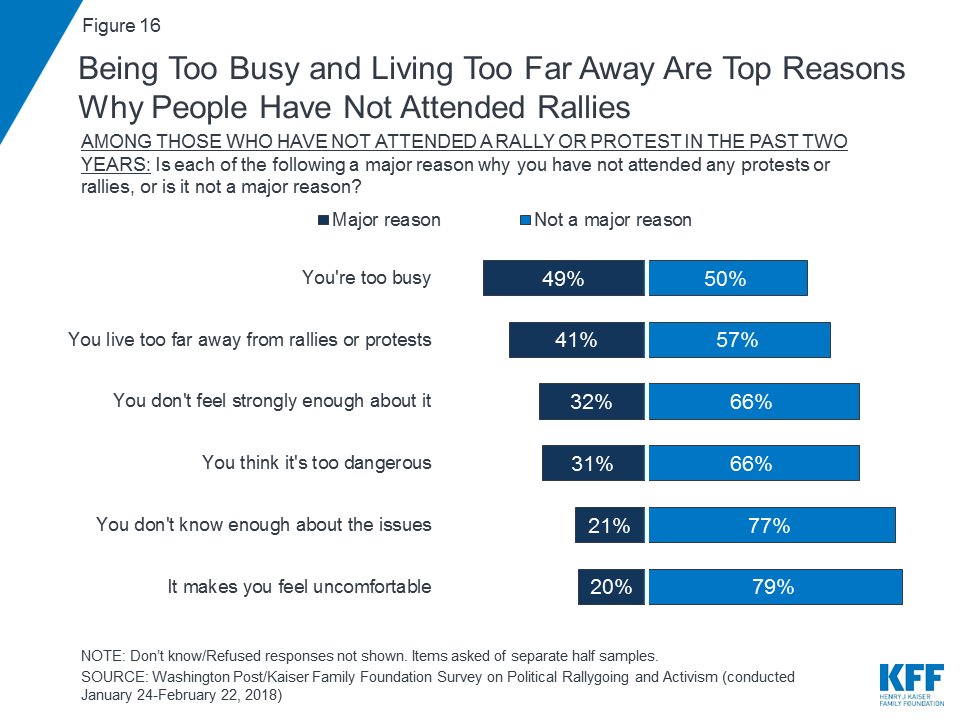
Reasons Some are Staying Home
Many of those who aren’t getting out of the house to go to rallies and protests say it’s because they’re too busy (49 percent) or they live too far away (41 percent). Some report reasons such as they don’t feel strongly enough about it (32 percent) or they don’t know enough about the issues (21 percent), and those who are not engaged at all are much more likely to say those are major reasons they don’t participate.
Methodology
The Washington Post/Kaiser Family Foundation Survey Project is a partnership combining survey research and reporting to better inform the public. The Post-Kaiser Survey on Political Rallygoing and Activism, the 32nd in this series, was conducted by telephone Jan. 24 – Feb. 22, 2018, among a random representative sample of 1,850 adults age 18 and older living in the United States. The survey includes an oversample of those who report that in the past two years they attended 1) a political rally, speech, or campaign event, or 2) an organized protest, march, or demonstration of any kind. This group is referred to here as “rallygoers.” Interviews were administered in English and Spanish, combining random samples of both landline (n=713) and cellular telephones (n=1,137).
Sampling, data collection, weighting and tabulation were managed by SSRS in close collaboration with The Washington Post and Kaiser Family Foundation researchers.
The sample plan consisted of two main elements:
- Cell and Landline Phone Random Digit Dialing (RDD) (n=1,347). The dual frame landline and cellular phone sample was generated by Marketing Systems Group (MSG) and Survey Sampling International (SSI) using RDD procedures. To randomly select a household member for the landline samples, respondents were selected by asking for the youngest or oldest adult male or female currently at home based on a random rotation. If no one of that gender was available, interviewers asked to speak with the youngest or oldest adult of the opposite gender. For the cell phone sample, interviews were conducted with the adult who answered the phone. For the oversample, some respondents contacted through RDD landline and cellular sampling were only interviewed if they qualified as a rallygoer.
- Pre-screened Respondents Previously Completing Interviews on the SSRS Omnibus Survey (n=503). Weekly, RDD landline and cellular phone surveys of the general public were used to identify respondents who qualified as rallygoers. Individuals who had previously indicated on the SSRS omnibus survey that they fit the eligibility criteria for this group were re-contacted and re-screened for this survey.
A multi-stage weighting process was applied to ensure an accurate representation of the national adult population. The first stage of weighting involved corrections for sample design, including accounting for non-response for the re-contact sample. The second weighting stage was conducted separately for those who qualified as rallygoers and all other adults. There are no known administrative data available for creating demographic weighting parameters for rallygoers as defined by this survey. Therefore, demographic benchmarks were derived by compiling a sample of all respondents interviewed on the SSRS Omnibus survey between Nov. 21, 2017 and Feb. 2, 2018 (N=10,350). This sample was weighted to match the national adult population based on the 2017 U.S. Census Current Population Survey March Supplement and the early 2017 National Health Interview Survey parameters for age, gender, education, race/ethnicity, region, marital status, phone status, and population density. Then, this sample was filtered for respondents who qualify as rallygoers (N=2,152) and those who do not (8,198) and the weighted demographics of these groups were used as post-stratification weighting parameters for each group in the total sample (including age by gender, education, race/ethnicity, region, population density, marital status, phone status, rallygoer status. In the final weighting stage, each group (rallygoers and all others) was weighted to reflect its actual share in the U.S. adult population.
All sampling error margins and tests of statistical significance have been adjusted to account for the survey’s design effect, which is 1.8 for results based on the full sample. The design effect is a factor representing the survey’s deviation from a simple random sample, and takes into account decreases in precision due to sample design and weighting procedures. Sample sizes and margin of sampling errors for key groups are shown below; other subgroups are available by request. Note that sampling error is only one of many potential sources of error in this or any other public opinion poll. All statistical tests of significance account for the effect of weighting.
| Group | N (unweighted) | Margin of sampling error (percentage points) |
| Total | 1,850 | ±3 |
| Rallygoers | 832 | ±4 |
| Non-rallygoers (NET) | 1,018 | ±3.5 |
| Nuts and Bolts activists | 377 | ±6 |
| Pinch Hitters | 334 | ±6.5 |
| Not engaged | 307 | ±6.5 |
This questionnaire was administered with the exact questions in the exact order as appears in this document. If a question was asked of a reduced base of the sample, a parenthetical preceding the question identifies the group asked.
The Washington Post and the Kaiser Family Foundation each contributed financing for the survey, and representatives of each organization worked together to develop the survey questionnaire and analyze the results. Each organization bears the sole responsibility for the work that appears under its name. The project team from the Kaiser Family Foundation included: Mollyann Brodie, Ph.D., Bianca DiJulio, and Cailey Muñana. The project team from The Washington Post included: Scott Clement and Emily Guskin. Both The Washington Post and the Kaiser Family Foundation public opinion and survey research are charter members of the Transparency Initiative of the American Association for Public Opinion Research.
Endnotes
- Axios, The left is getting more active on health care, April, 12, 2018. https://www.axios.com/left-getting-more-active-health-care-900e91b6-6872-44c2-87d0-db4b0af6f7a2.html ↩︎
- L Hamel, B Wu, M Brodie, Data Note: Modestly Strong but Malleable Support for Single-Payer Health Care, June 2017. https://modern.kff.org/health-reform/poll-finding/data-note-modestly-strong-but-malleable-support-for-single-payer-health-care/. ↩︎