Survey of Americans on Race
Overview
This Kaiser Family Foundation/CNN survey on race in America provides insights into the public’s views of complicated issues surrounding race, including the experience of racism and discrimination in the daily lives of Black and Hispanic Americans, institutional discrimination and individual bias, and the role of both government and individuals in creating a path forward. As the nation grapples with these issues, it is an important time to hear the voices and perspectives of Americans across the country to better understand how the general public and those of different racial and ethnic backgrounds feel about the issue.
Report: Survey of Americans on Race
Read/Watch CNN’s Coverage
- CNN’s “Race and Reality” Project
- Is racism on the rise? More in U.S. say it’s a ‘big problem,’ CNN/KFF poll find
- Race and Reality in America: Five Key Findings
- Poll: 49% of Americans say racism is a ‘big problem’ (video)
- 4 Ways We Can Display Hidden Biases in Everyday Life
- Video: Race and Reality in America
- Why Blacks Believe in the American Dream More Than Whites
- “I Still Believe in the American Dream” Photo Essay
- The Black-White Economic Divide in 5 Charts
- Race and Reality: The scourge of segregation
- Working While Brown: What Discrimination Looks Like Now
- Love in the face of racism: Being an interracial family
- Who will you blame once Obama’s gone?
- The steep cost of incarceration on women of color
- Poll: 1 in 5 Blacks report ‘unfair’ dealings with police in last month
Executive Summary
In the last couple of years, several incidents in which African Americans were mistreated or in some cases killed by police have sparked renewed public attention to the issue of race relations in America. To better understand the current status of the issue, the Kaiser Family Foundation and CNN surveyed the U.S. public to gauge their views of race in America and personal experiences with discrimination or racism, with a focus on the views and experiences of Black and Hispanic people in America. Racism continues to be a reality for Blacks and Hispanics who report being denied jobs and housing because of their race, or being the victim of unfair treatment in public places like while shopping, dining out, or in dealings with police. Nearly half of Blacks report fearing for their life at some time because of their race. In light of these experiences, there are stark differences in how Blacks, Hispanics and Whites perceive the problem, as well as their attitudes about who is responsible for improving race relations, and views of the criminal justice system’s treatment of Blacks and Hispanics. Recent events have set inequities in the criminal justice system on this national stage and the survey explores views on the underlying reasons for recent protests and support for the Black Lives Matter movement.
Racial Discrimination, Bias, and Privilege
- A third of Black Americans say they have been victims of racial discrimination at some point in their lives, denying them opportunities in housing or employment, and more than 4 in 10 (45 percent) say they have at some point been afraid their life was in danger because of their race. In addition, more than half of Blacks (53 percent), including two-thirds (67 percent) of younger Blacks ages 18-34, say they have been treated unfairly because of their race in the past month alone.
- Hispanic Americans also experience racial bias – about a quarter (26 percent) say they’ve been discriminated against, 2 in 10 (20 percent) say they have been afraid their life was in danger, and more than a third (36 percent) say they’ve been treated unfairly in the past month because of their race.
- More than half of Blacks (54 percent), including about 7 in 10 who say they have experienced recent unfair treatment due to their race, say their race has been a disadvantage in their life rather than an advantage, while majorities of Whites (61 percent) and Hispanics (56 percent) feel their race has been an advantage.
- In part reflecting the demographic makeup of the American public but also demonstrating persistent social and community segregation across the country, Whites are about half as likely as Blacks and Hispanics to say that the people in their neighborhood or the people they socialize with are mostly of a different race as them (37 percent versus 70 percent and 72 percent, respectively).
Inequities in the Criminal Justice System and Recent Unrest
- More than 8 in ten Blacks (86 percent) and seven in ten Hispanics (68 percent) say that that the criminal justice system favors Whites over people of their own race, while Whites are more divided on whether the system treats minorities and Whites equally or not.
- More than half of Black Americans (55 percent) report some connection to the prison system – either because they have been incarcerated themselves or know a close friend or family member who has been, compared to 39 percent of Hispanics and 36 percent of Whites.
- Incidents of Blacks being assaulted or killed by White police officers produced a wave of protests across America, and Black Americans say that major reasons for these recent protests include a sense of “anger over the treatment of African Americans by police” (84 percent), a “desire for Blacks to feel like they are being treated fairly” (81 percent), “the way government officials handled these incidents” (73 percent), and “poverty and lack of opportunities in some neighborhoods” (61 percent). While majorities of Whites and Hispanics also say each factor was a reason for protests, they are generally less likely than Blacks to say that each was a major reason.
- These incidents have spurred the civil rights movement, Black Lives Matter, and overall, 35 percent of the public identifies as a supporter of the cause, 49 percent do not, and 16 percent say they haven’t heard of it or aren’t sure. Among Blacks, the share saying they support the Black Lives Matter movement jumps to 58 percent.
Perceptions of the Problem
- Across different racial or ethnic groups as well as those living in urban and rural settings, a majority of Americans (64 percent) feel that racial tensions have increased in the past 10 years in the country overall, but fewer (23 percent) say they feel tensions have increased within their local communities.
- Many (49 percent) say racism is a big problem in the country, including two-thirds of Blacks (66 percent) and Hispanics (64 percent) and a minority of Whites (43 percent). The share of Americans overall who say racism is a big problem has increased somewhat from two decades ago (49 percent from 41 percent), and compared to 2001, more Americans today say there is a lot of discrimination against Blacks and Hispanics.
- Black and Hispanic Americans are about evenly split about what is the bigger problem — discrimination that is historically built into society and institutions or individuals’ own beliefs and prejudices. White Americans, on the other hand, are more likely to say that individual bias is the bigger problem.
- More than 8 in 10 people in the U.S. feel that it is the responsibility of individuals’ themselves to improve race relations, rather than federal or local government or the media. However, most say it is the federal government’s responsibility to ensure equal schools and treatment by the criminal justice system, while the public is more divided on whether the federal government should help ensure income equality.
- As a way to make up for the harm caused by slavery, just over half of Black Americans (52 percent) say the government should make cash payments – known as reparations – to descendants of slaves; Whites are overwhelmingly opposed to the idea (89 percent).
- Moving toward the 2016 presidential election, there is little consensus about whether the issue of race has gotten too much (37 percent), too little (19 percent), or the right amount (39 percent) of attention in the campaigns. In terms of how the political parties represent the interests of racial minorities, most Americans – Blacks and Whites alike – say the Democratic Party has become more representative of the interests and needs of members of minority groups over the past few years, while the Republican Party has become less so.
Current Situations and Barriers to Advancement
- When it comes to how the average Black or Hispanic is doing on income, education or housing compared to the average White person, many say they are worse off than the average White person.
- Blacks most often point to past and present discrimination (69 percent) and lack of jobs (64 percent) as major reasons for some of the problems facing Black Americans today, and Hispanics most often say lack of educational opportunities (62 percent) and lack of jobs (61 percent) are major reasons for issues facing Hispanic Americans. Whites are generally less likely to say each of these is a major reasons for problems facing Blacks and Hispanics.
Changes Over Time
- Over time, there have been modest changes in the public’s perception of racism, their views on the role of the federal government in alleviating differences between groups and what barriers remain when compared to a Kaiser Family Foundation/Washington Post/Harvard School of Public Health Survey on race in American conducted in 1995 with many of the same questions.
- Compared to 1995, the public is now somewhat more inclined to say it is the federal government’s responsibility to ensure income equality across races, however, slightly fewer Americans see ensuring equal schools or treatment by the criminal justice system as the government’s responsibility.
- In terms of how the average African American or Hispanic American is faring compared to the average White person, there are some signs of increased optimism. Blacks are less likely to now say the average African American is worse off in terms of income than they were in 1995 (71 percent versus 84 percent) and Hispanics are less likely now than in 1995 to say Hispanics are worse off than the average White person in terms of income and housing.
Key Findings
Section 1: Racial Discrimination, Bias, and Privilege
Racial discrimination and unfair treatment is a reality reported by considerable shares of Black and Hispanic Americans. A third of Blacks (35 percent) and about a quarter of Hispanics (26 percent) say they have experienced certain types of racial discrimination, such as being denied a job or housing, or being prevented from voting, compared to about 1 in 10 (11 percent) Whites. In addition, more than 4 in 10 Blacks (45 percent) say they have at some point been afraid their life was in danger because of their racial or ethnic background, compared to 27 percent of Whites and 20 percent of Hispanics.
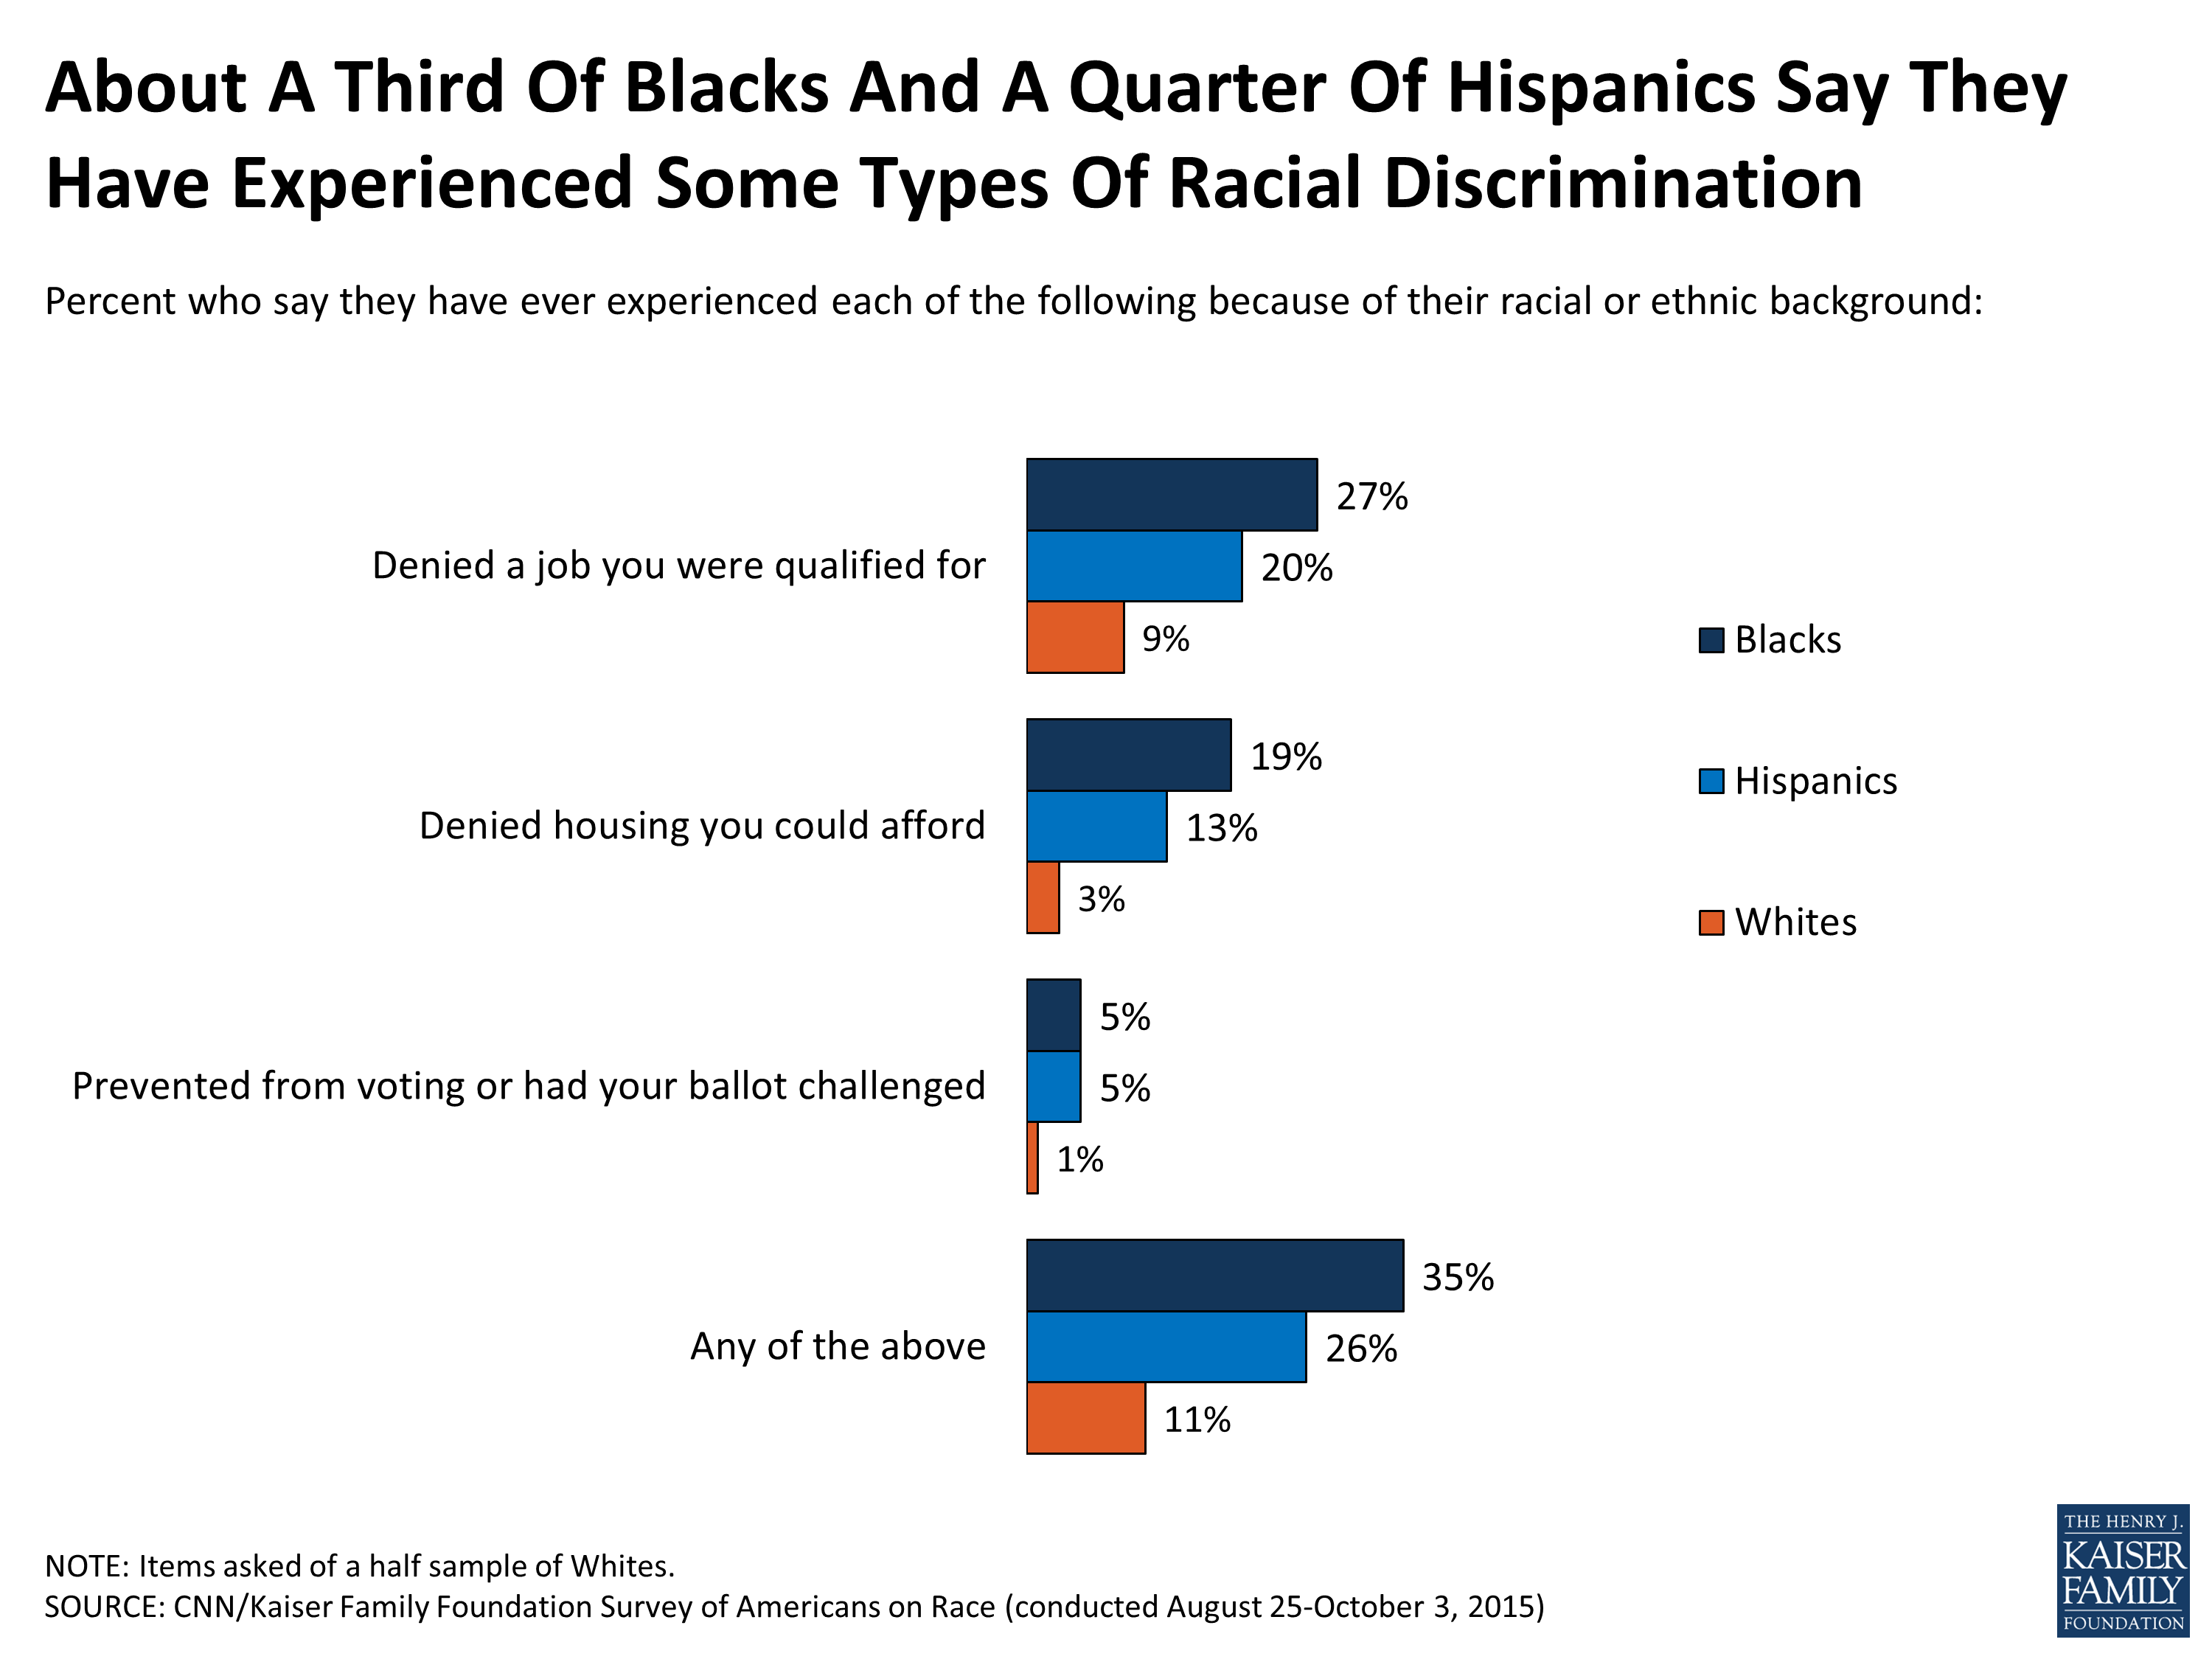
Figure 1
Not only do many Black and Hispanic people in America say they’ve faced discrimination at some point in their lives, many report experiencing bias and unfair treatment on a more regular basis. Strikingly, more than half of Blacks (53 percent) report that they have experienced unfair treatment in the past 30 days because of their race at places such as their work, in stores, at restaurants, while getting health care, or in dealings with police. Over a third of Hispanics (36 percent) report having these experiences recently, compared to 15 percent of Whites. Within each racial group, there are few differences by income, with the exception that lower income Hispanics (household earnings of less than $50,000 per year) are much more likely to say they have experienced unfair treatment recently than their higher income counterparts (42 percent versus 27 percent).
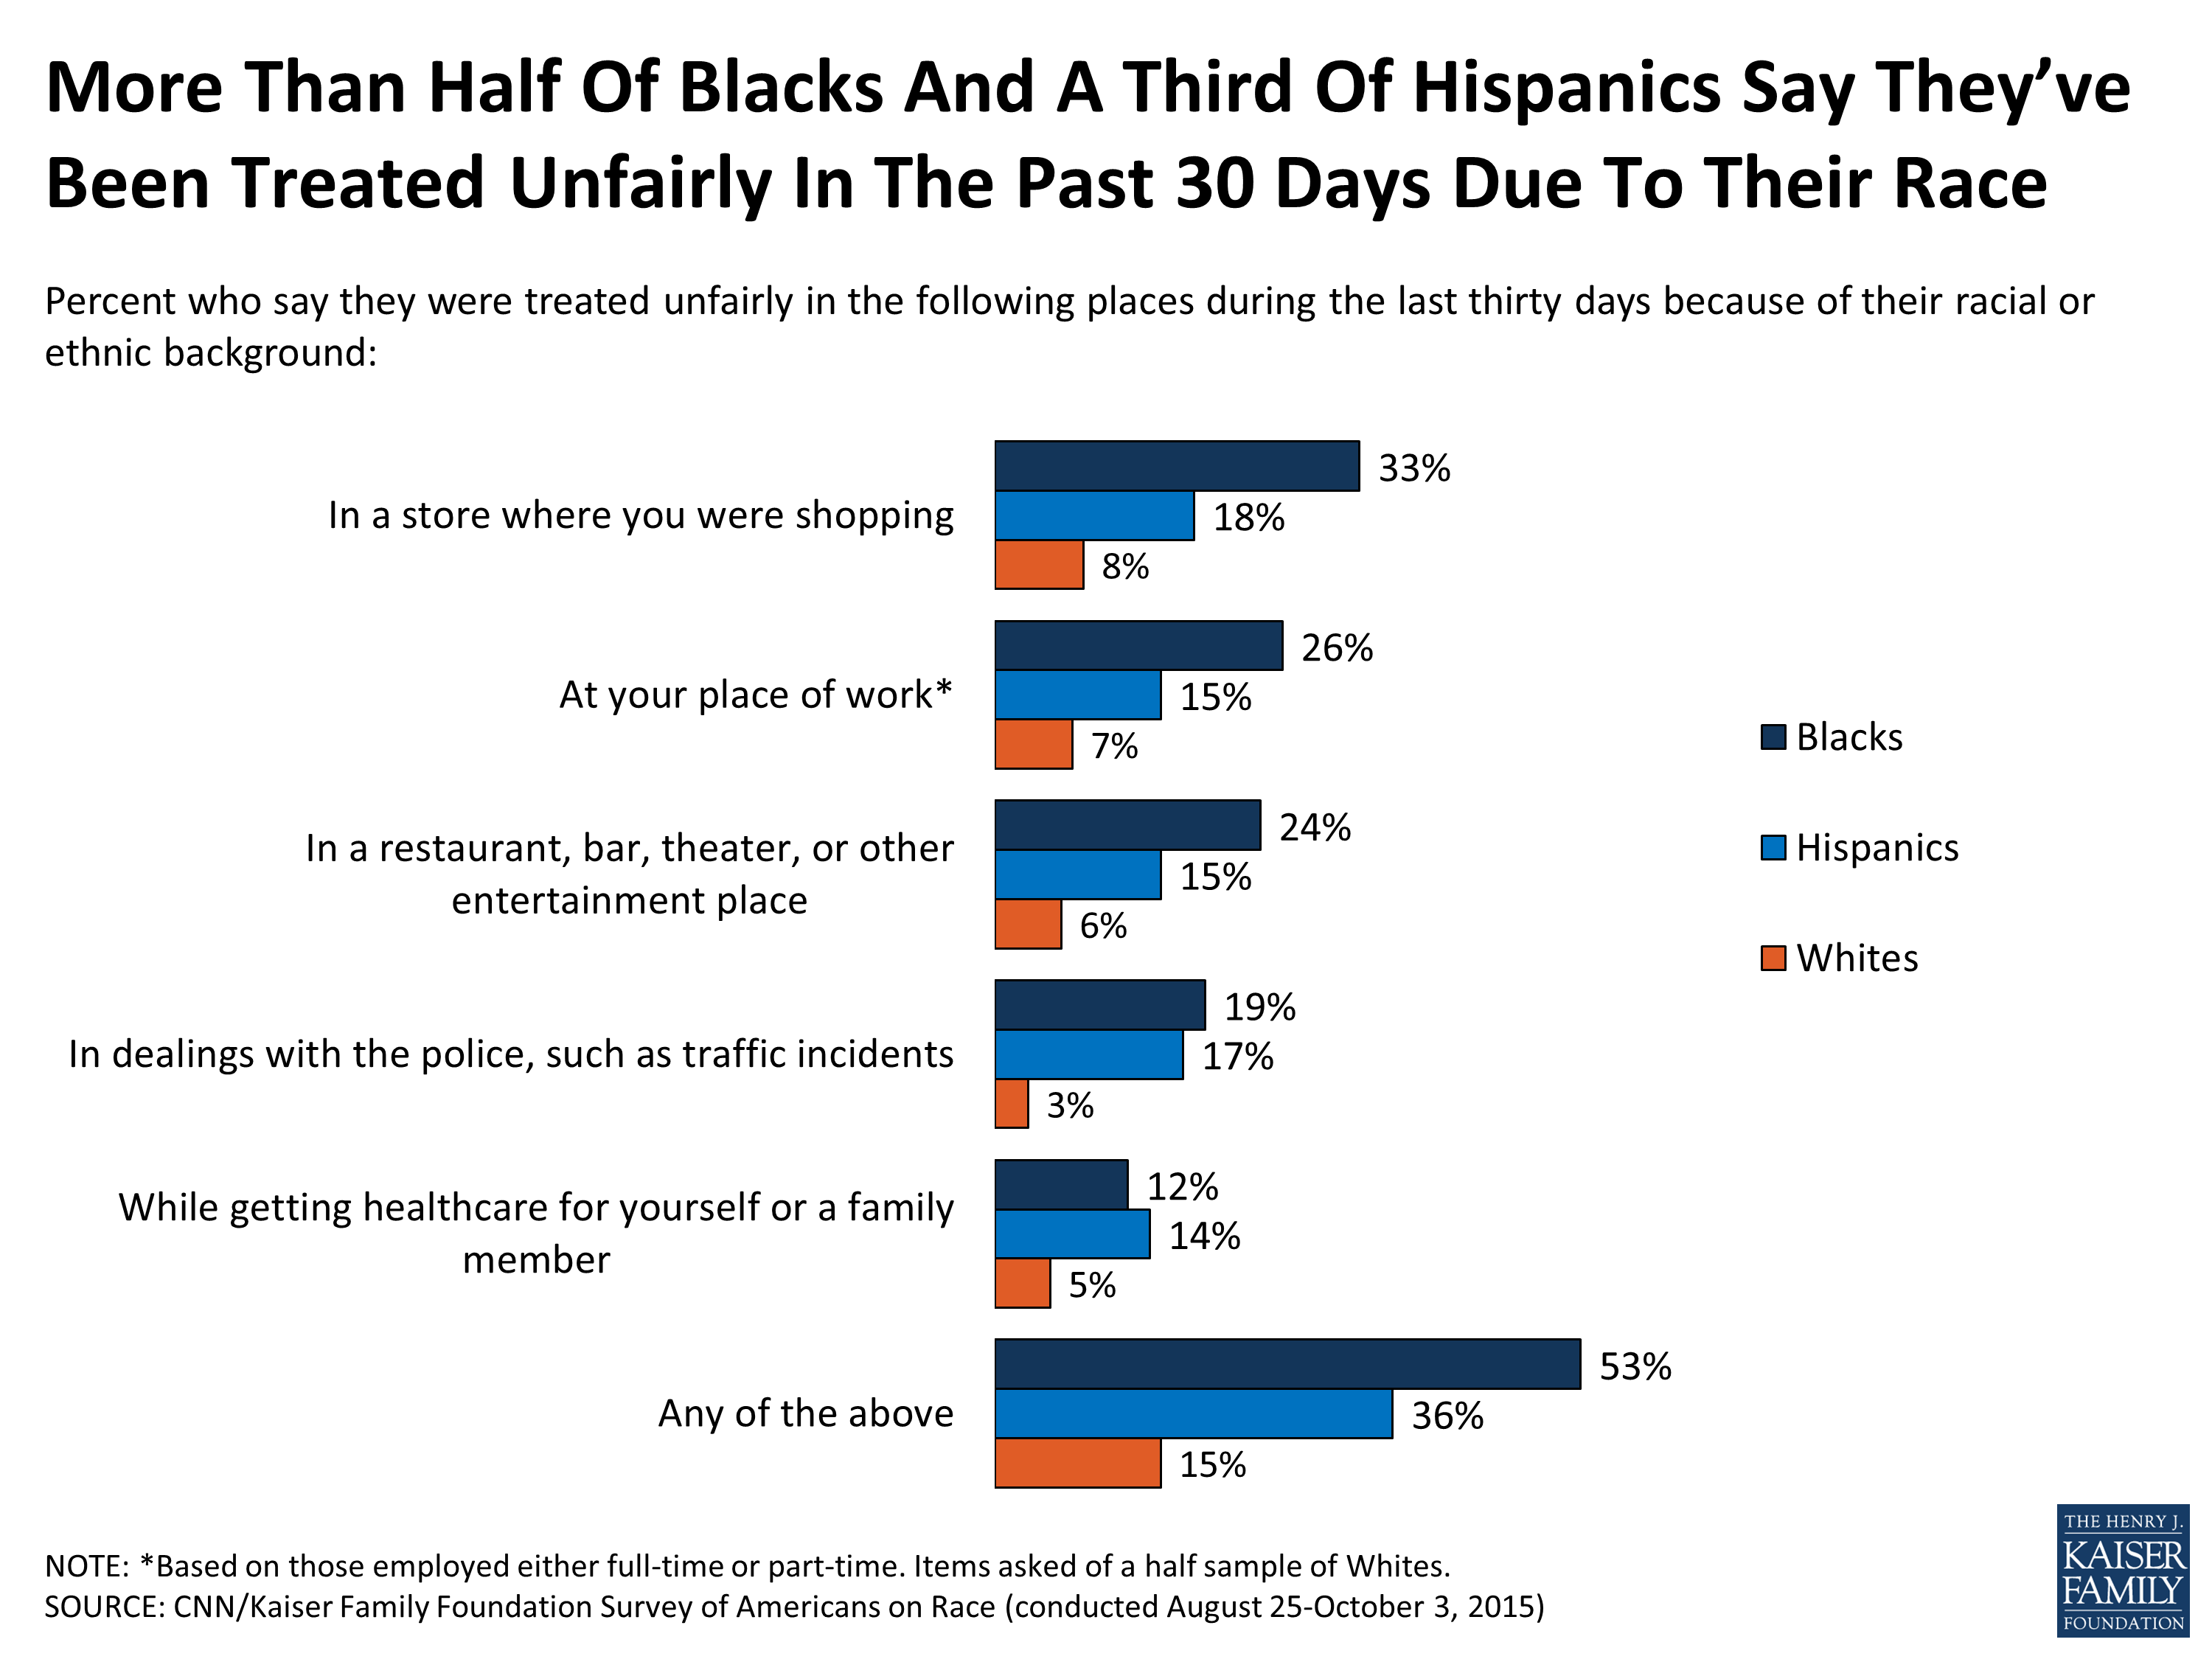
Figure 2
Among Blacks, there are some significant differences by age in reports of some types of discrimination or recent unfair treatment. Two-thirds of Blacks ages 18-34 (67 percent) and half of Blacks ages 35-64 (50 percent) say they have experienced any unfair treatment because of their race in the past 30 days, much higher than the quarter (26 percent) of Black seniors who say the same. In addition, roughly half of Blacks under 65 years old say they have felt their life was in danger because of their race, compared to about a quarter of those 65 or older. However, across generations, similar shares of Blacks report being discriminated against in terms of housing, employment, or at the ballot box.
| Younger Blacks Much More Likely to Report Being Afraid for Life or Recent Unfair Treatment due to Race or Ethnic Background | |||
| Black Americans, Ages 18-34 |
Black Americans, Ages 35-64 |
Black Americans, Ages 65 or Older |
|
| TYPES OF DISCRIMINATION | |||
| Because of their racial or ethnic background, percent who say they have ever been… | |||
| Denied housing they could afford | 17% | 22% | 12% |
| Denied a job they were qualified for | 22% | 31% | 23% |
| Prevented from voting or had their ballot challenged | 3% | 4% | 4% |
| Experienced any of the above types of discrimination | 29% | 41% | 30% |
| Afraid their life was in danger | 53% | 44% | 24% |
| RECENT UNFAIR TREATMENT | |||
| Because of their racial or ethnic background, percent who say they have, in the past 30 days, been treated unfairly … | |||
| In a store where they were shopping | 40% | 33% | 13% |
| In a restaurant, bar, theater, or other entertainment place | 30% | 25% | 7% |
| In dealings with police, such as traffic incidents | 23% | 20% | 7% |
| While getting healthcare for themselves or a family member | 8% | 15% | 10% |
| Experienced any of the above types of unfair treatment in the past 30 days* | 67% | 50% | 26% |
| *Includes those who are employed who say they have been treated unfairly at their place of work, however the sample size is insufficient to show by age. | |||
In addition to the stark differences in personal experiences related to race, there is still segregation and lack of diversity among certain social and residential communities. Although in part a function of being a demographic majority, Whites are more isolated from people of other races, while Blacks and Hispanics are members of more diverse communities. Nearly four in 10 Whites (37 percent) say the people in their neighborhood or the people they socialize with are mostly of a different race; nearly half the share of Hispanics (72 percent) and Blacks (70 percent) who say they live near or socialize mostly with those of other races. Higher income Blacks and lower income Whites are more likely than their counterparts to say they are living in or socializing with more diverse communities.

Figure 3
Although roughly 7 in 10 Blacks and Hispanics say both the news and entertainment media portrays people of their racial or ethnic background accurately at least some of the time, both groups are more likely than Whites to say they are rarely portrayed accurately. For example, about 3 in 10 (31 percent) of Blacks and a quarter of Hispanics (24 percent) say they are rarely or never portrayed in the news media accurately, compared to 14 percent of Whites.
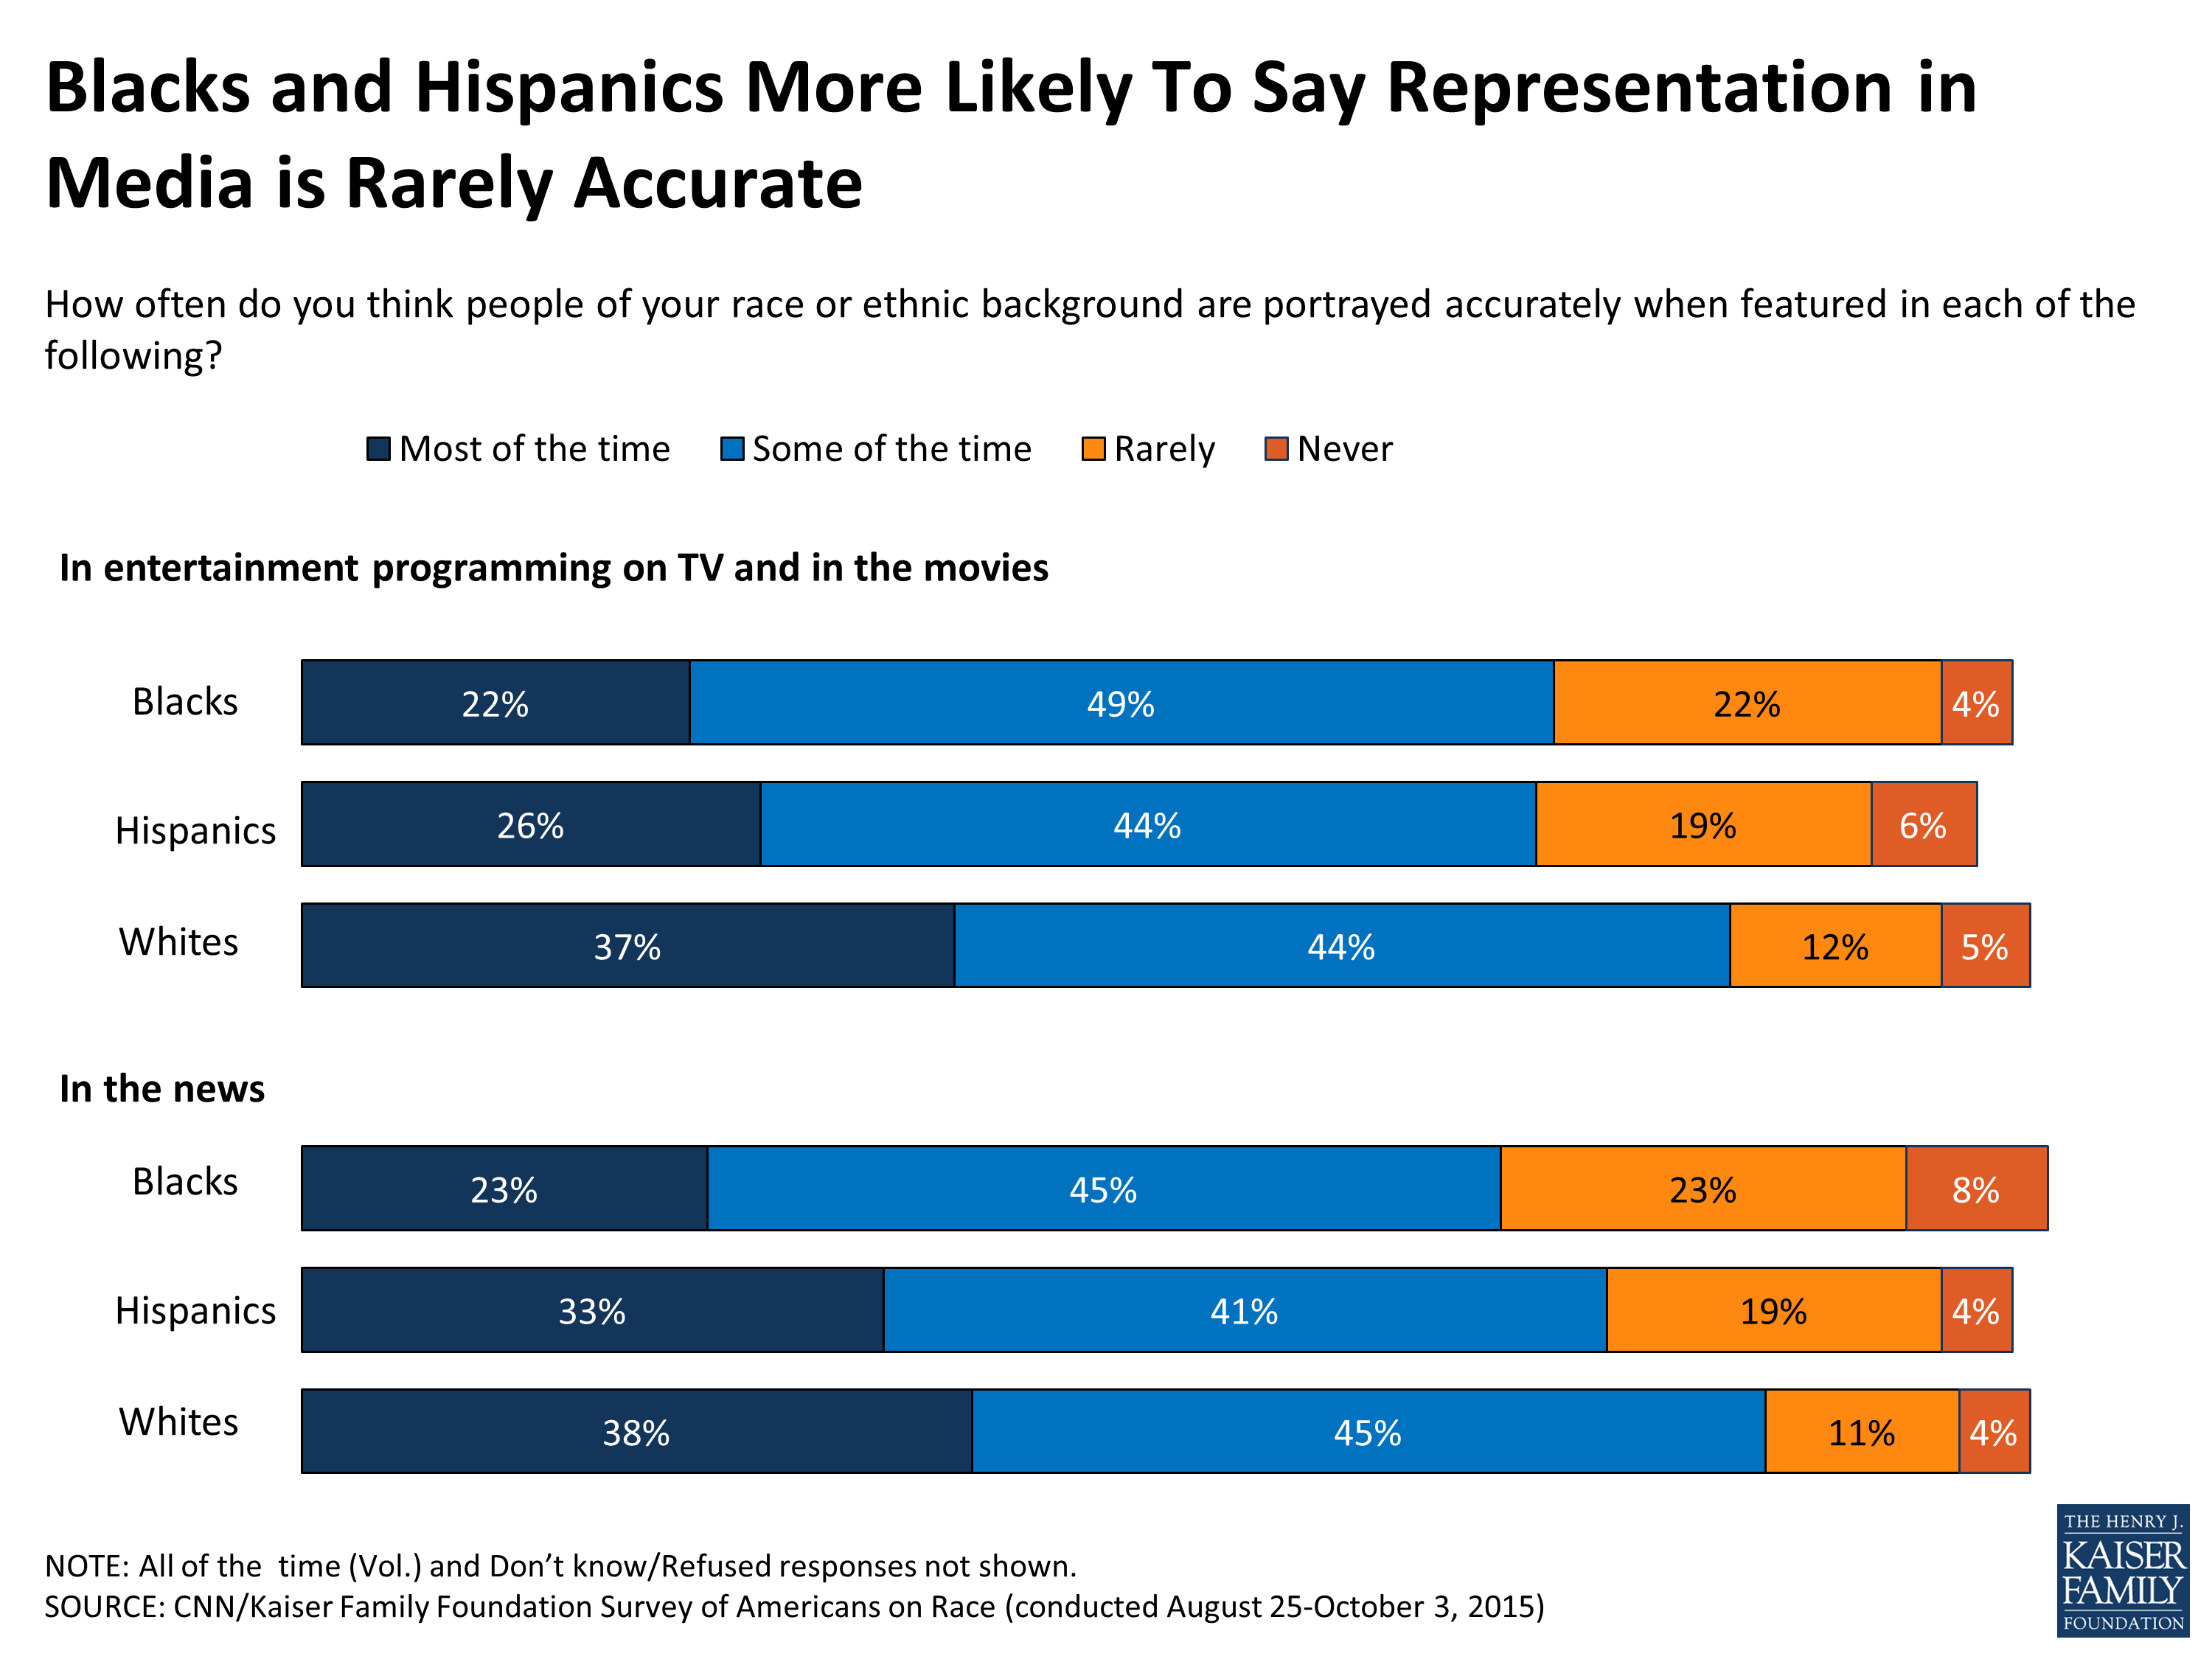
Figure 4
More generally, over half of Blacks (54 percent), including about 7 in 10 (69 percent) of Blacks who say they have experienced recent unfair treatment due to their race, feel that their race has been a disadvantage in their life. However, most Whites (61 percent) feel their race has been an advantage for them, suggesting that many do understand the social and economic benefit of being White, sometimes called White Privilege. Like Whites, most Hispanics (56 percent) feel that their race has been an advantage in their life.
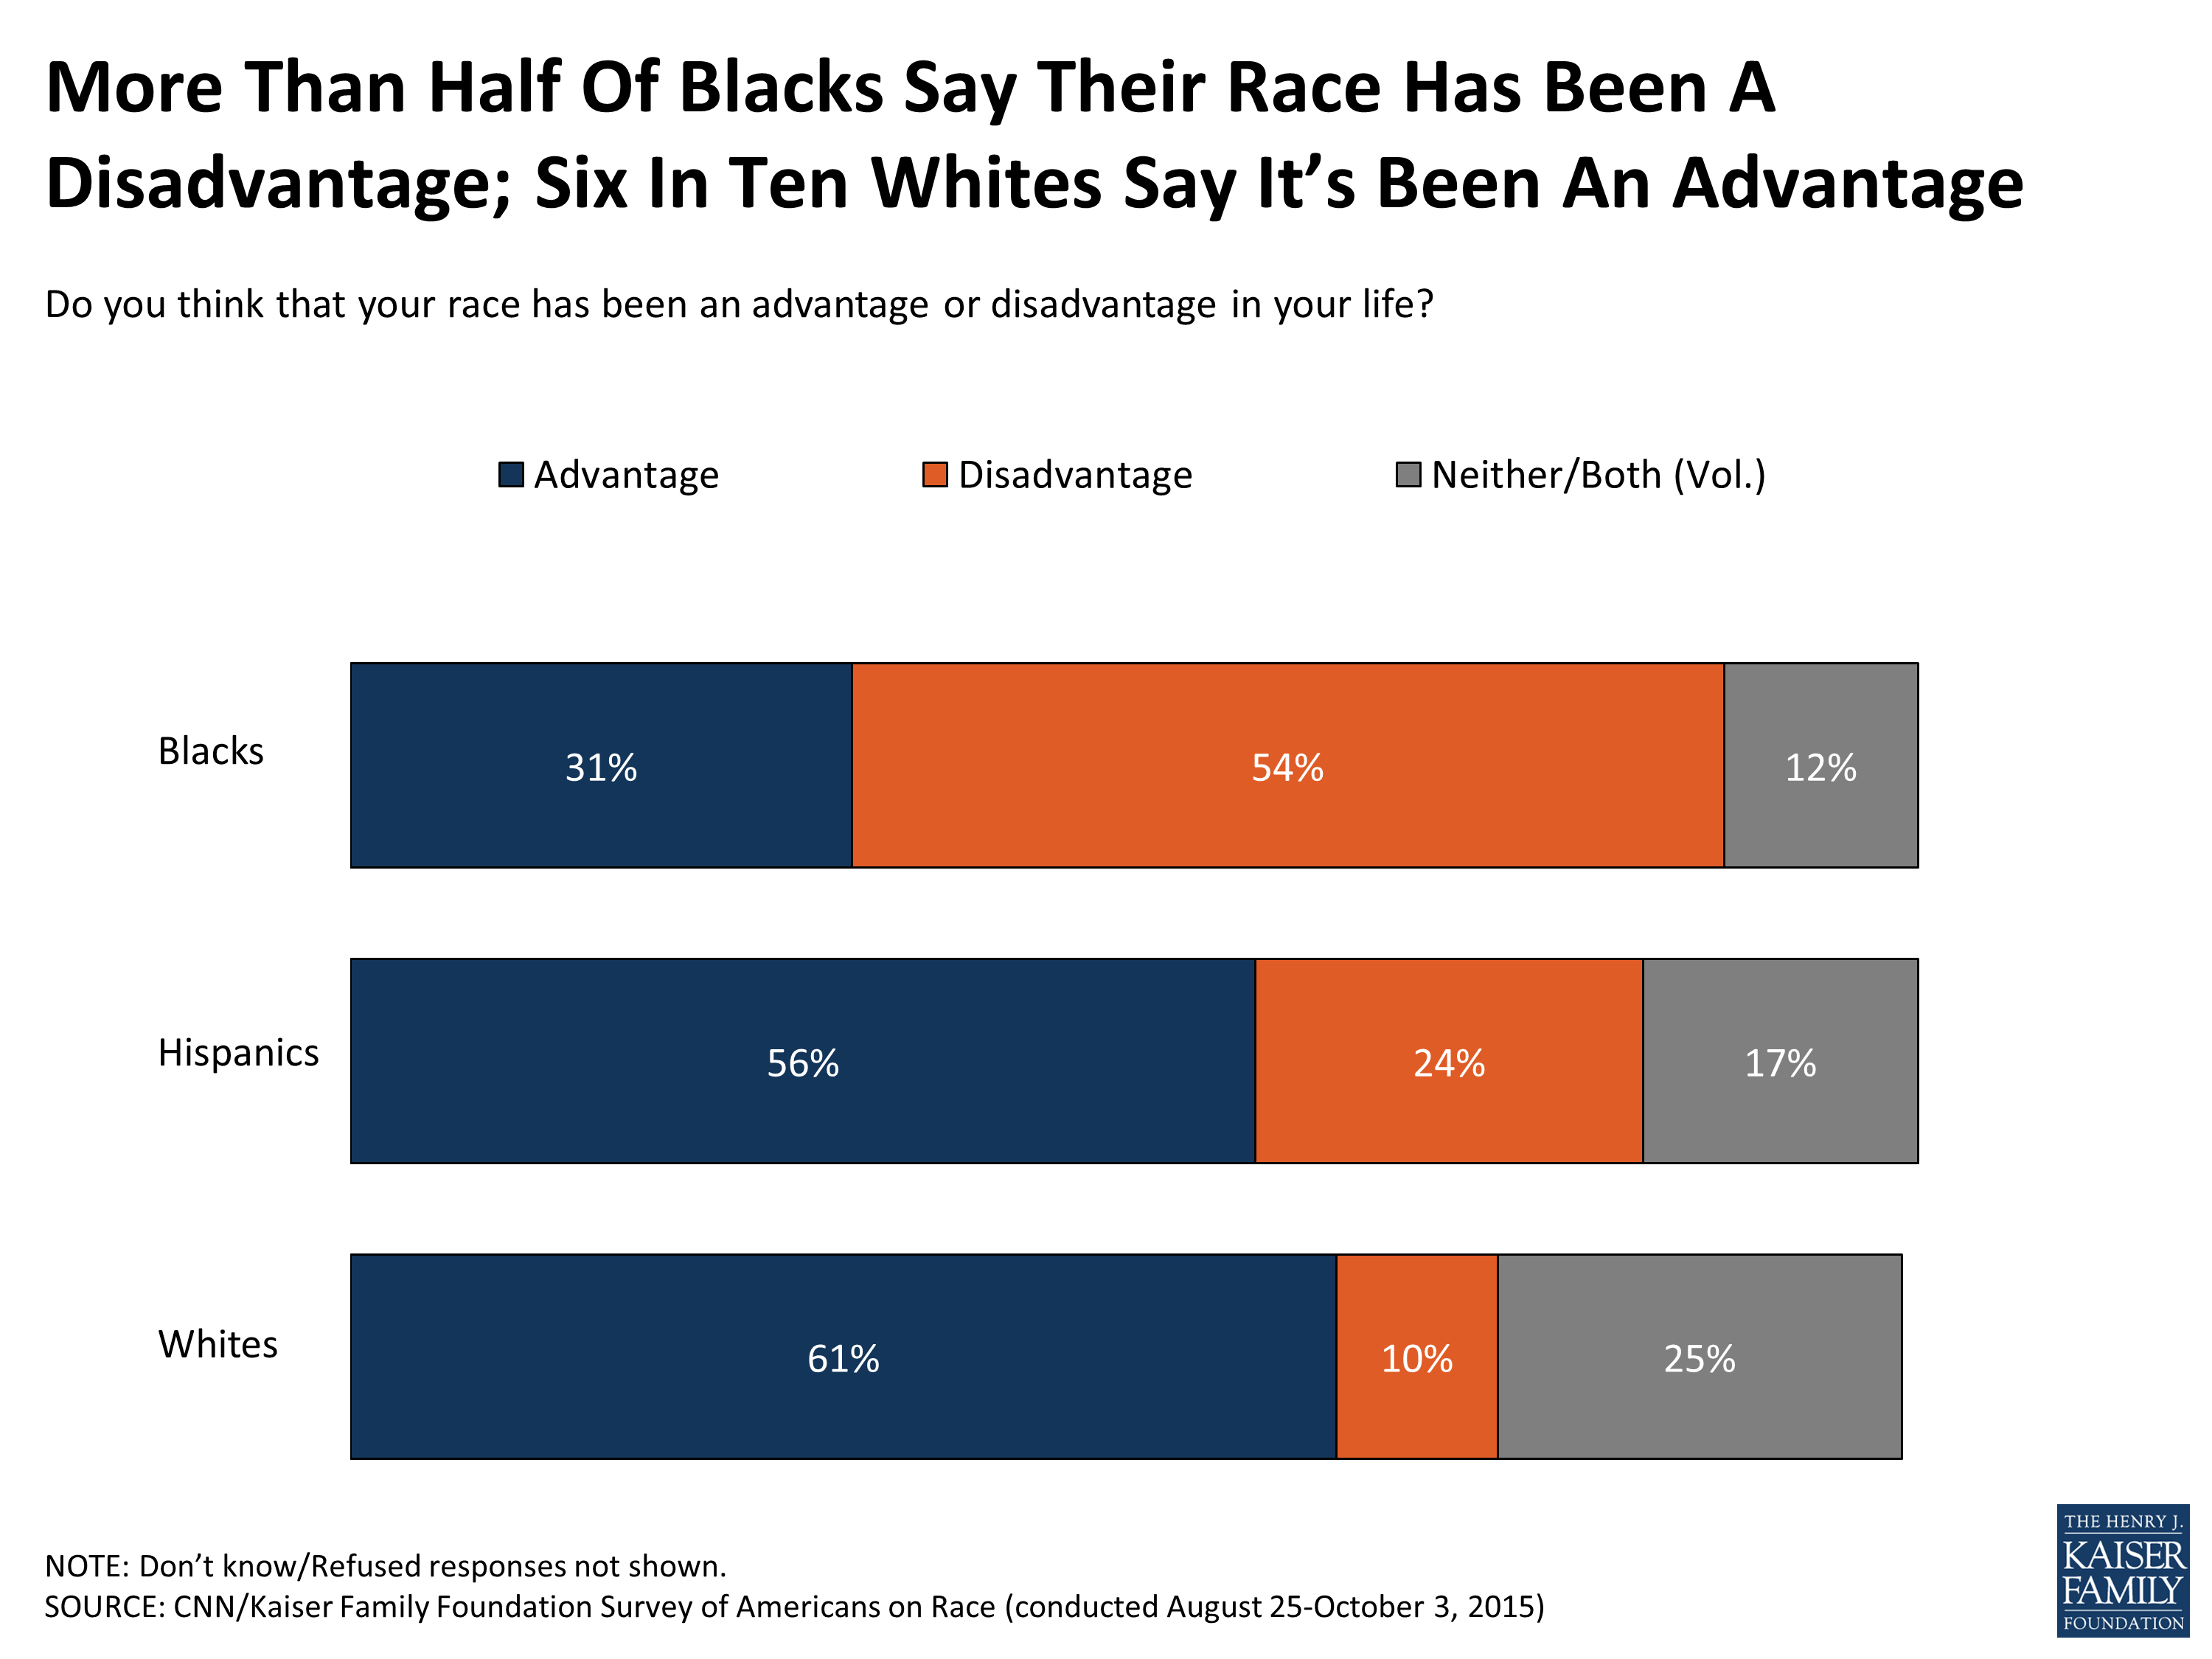
Figure 5
Majorities of Black (66 percent) and Hispanic Americans (55 percent) say that most Whites today have benefited from such discrimination. On the other hand, while many Whites recognize that their race has been an advantage in their life, nearly two-thirds (65 percent) deny that most Whites as a whole have benefited from discrimination against minorities.
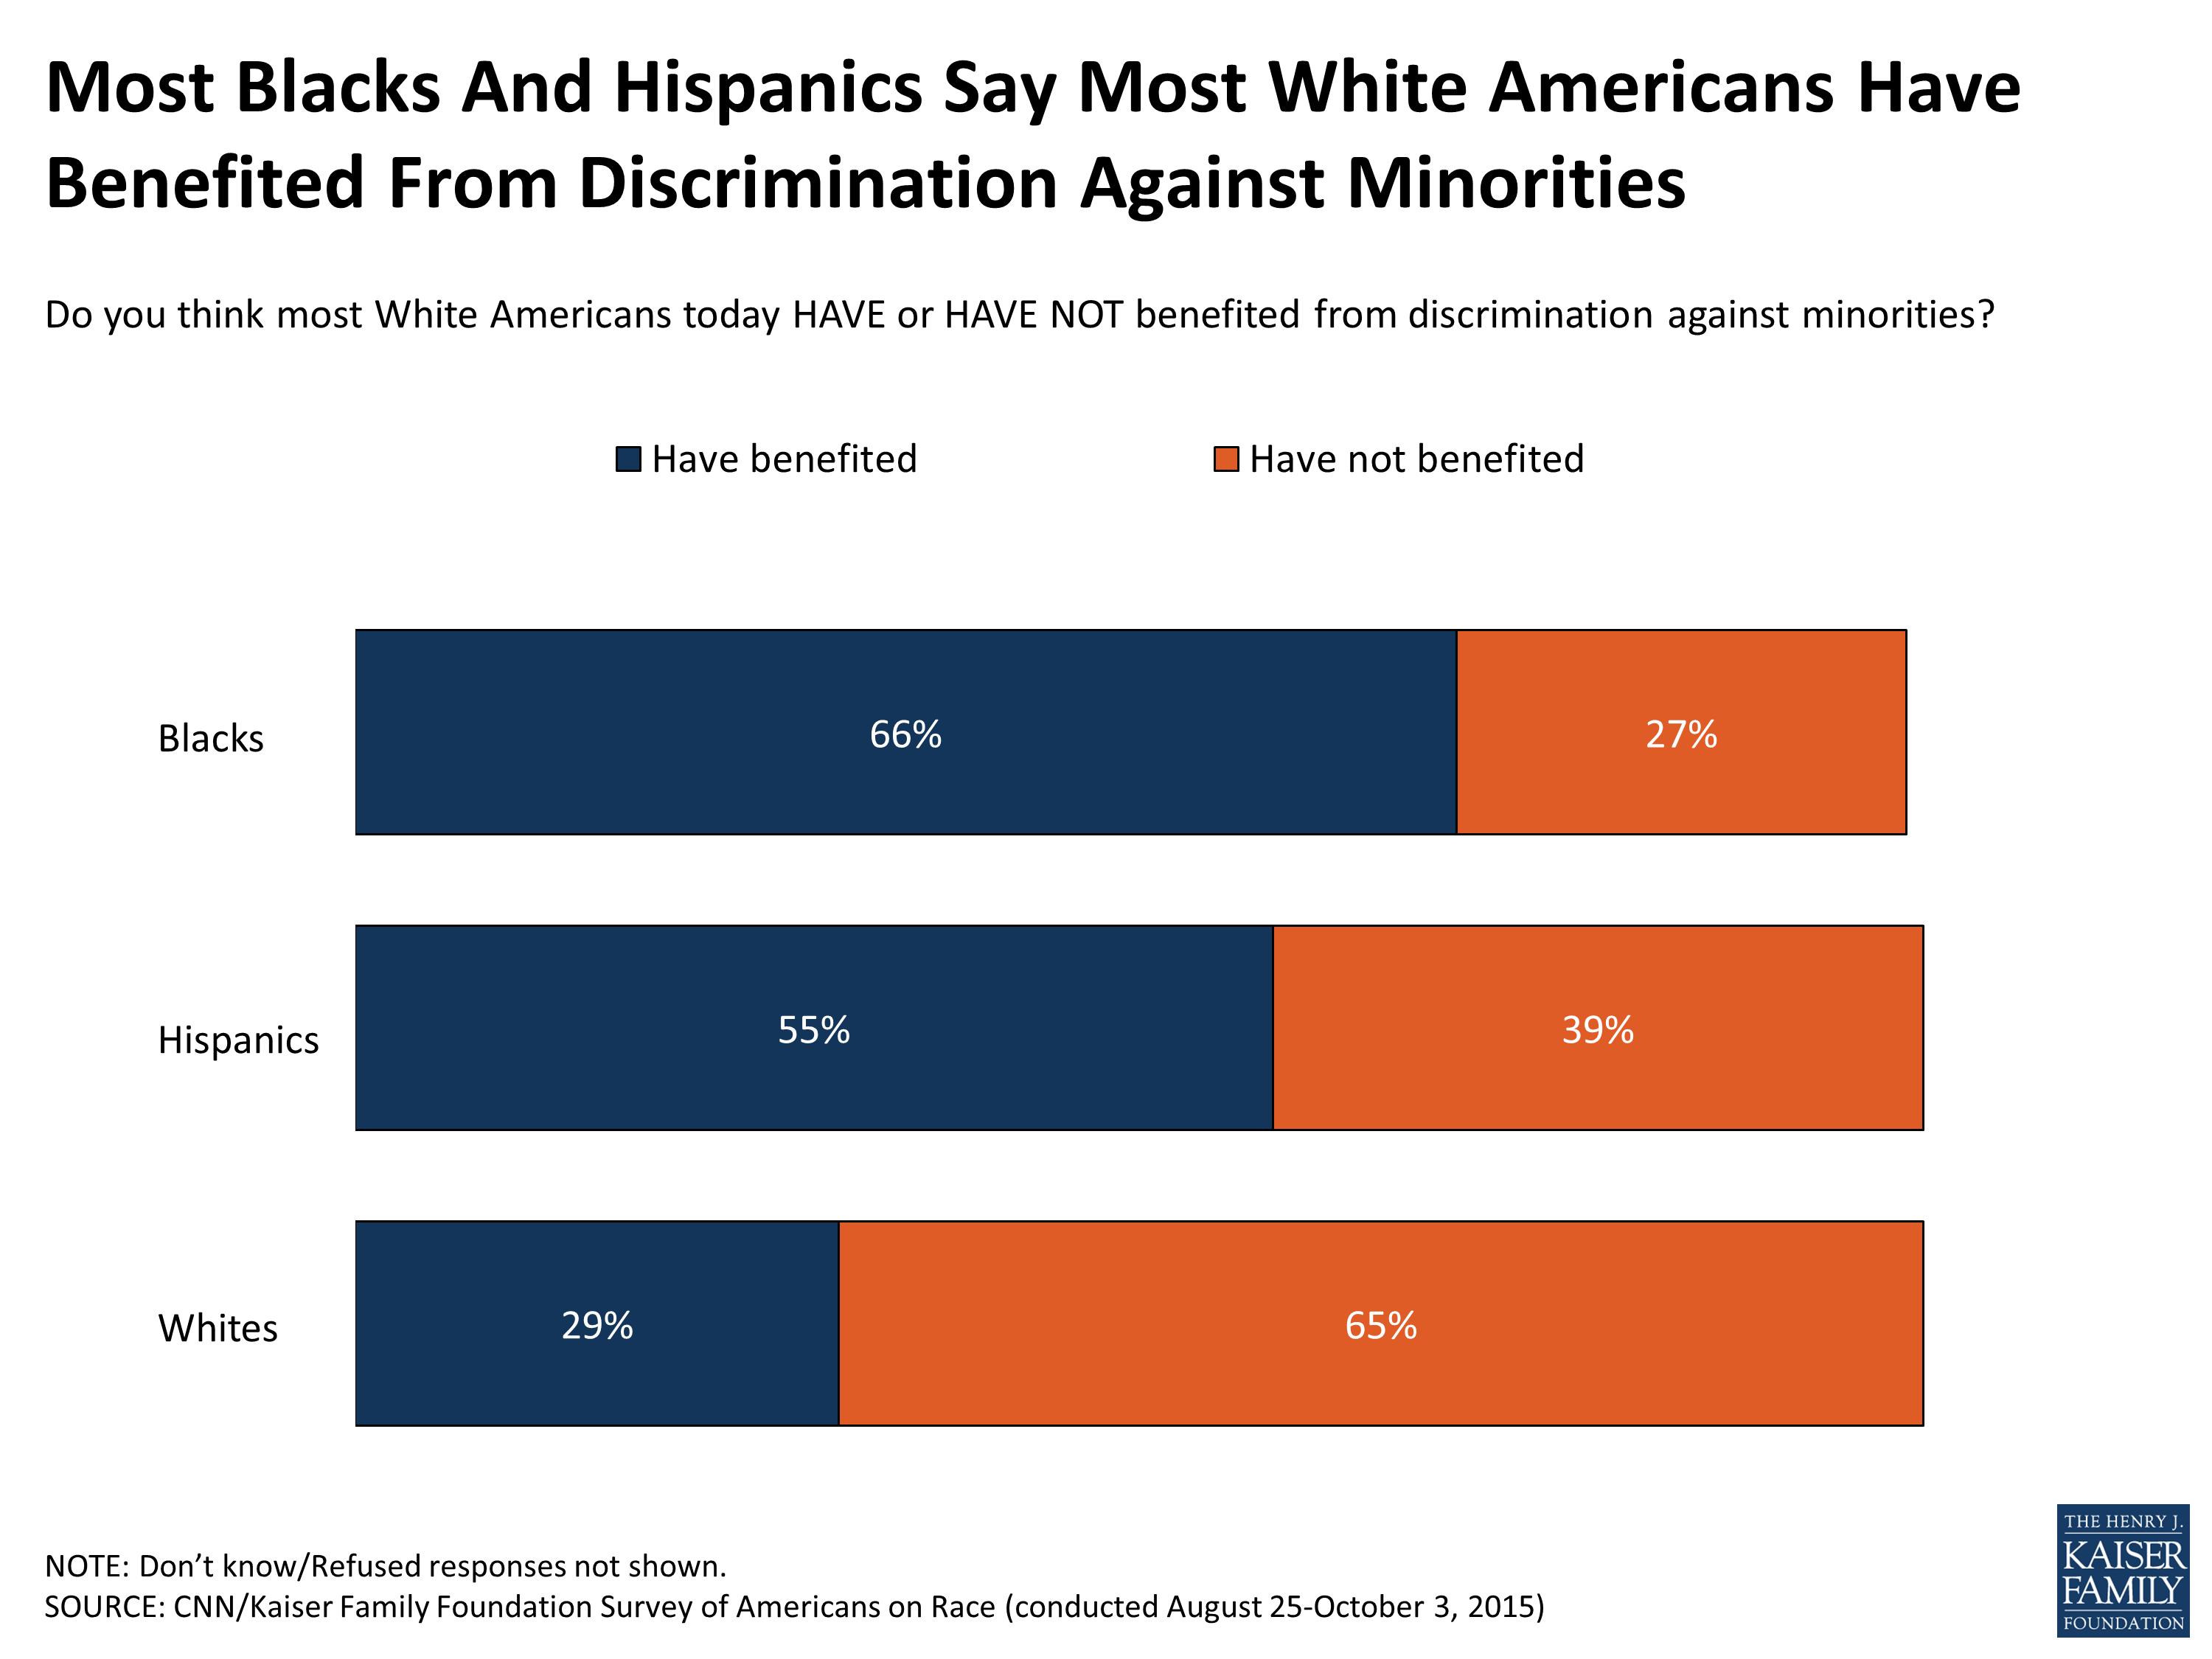
Figure 6
Section 2: Inequities in the Criminal Justice System and Recent Unrest
Many Black and Hispanic people in America say the U.S. criminal justice system is stacked against them. Over 8 in 10 Blacks (86 percent), including 83 percent of Black men, say the criminal justice system favors Whites over Blacks and two-thirds (66 percent) of Hispanics agree. Results are very similar when asking whether the system favors Whites over Hispanics – 68 percent of Hispanics say it does, and 81 percent of Blacks say the same. Whites on the other hand are more divided on whether the criminal justice system favors people of their race over each minority group. Some of these perceptions likely come from personal experience – as noted above, nearly one in five Hispanics and Blacks say they have been unfairly treated by police in the past 30 days, compared to just 3 percent of Whites.
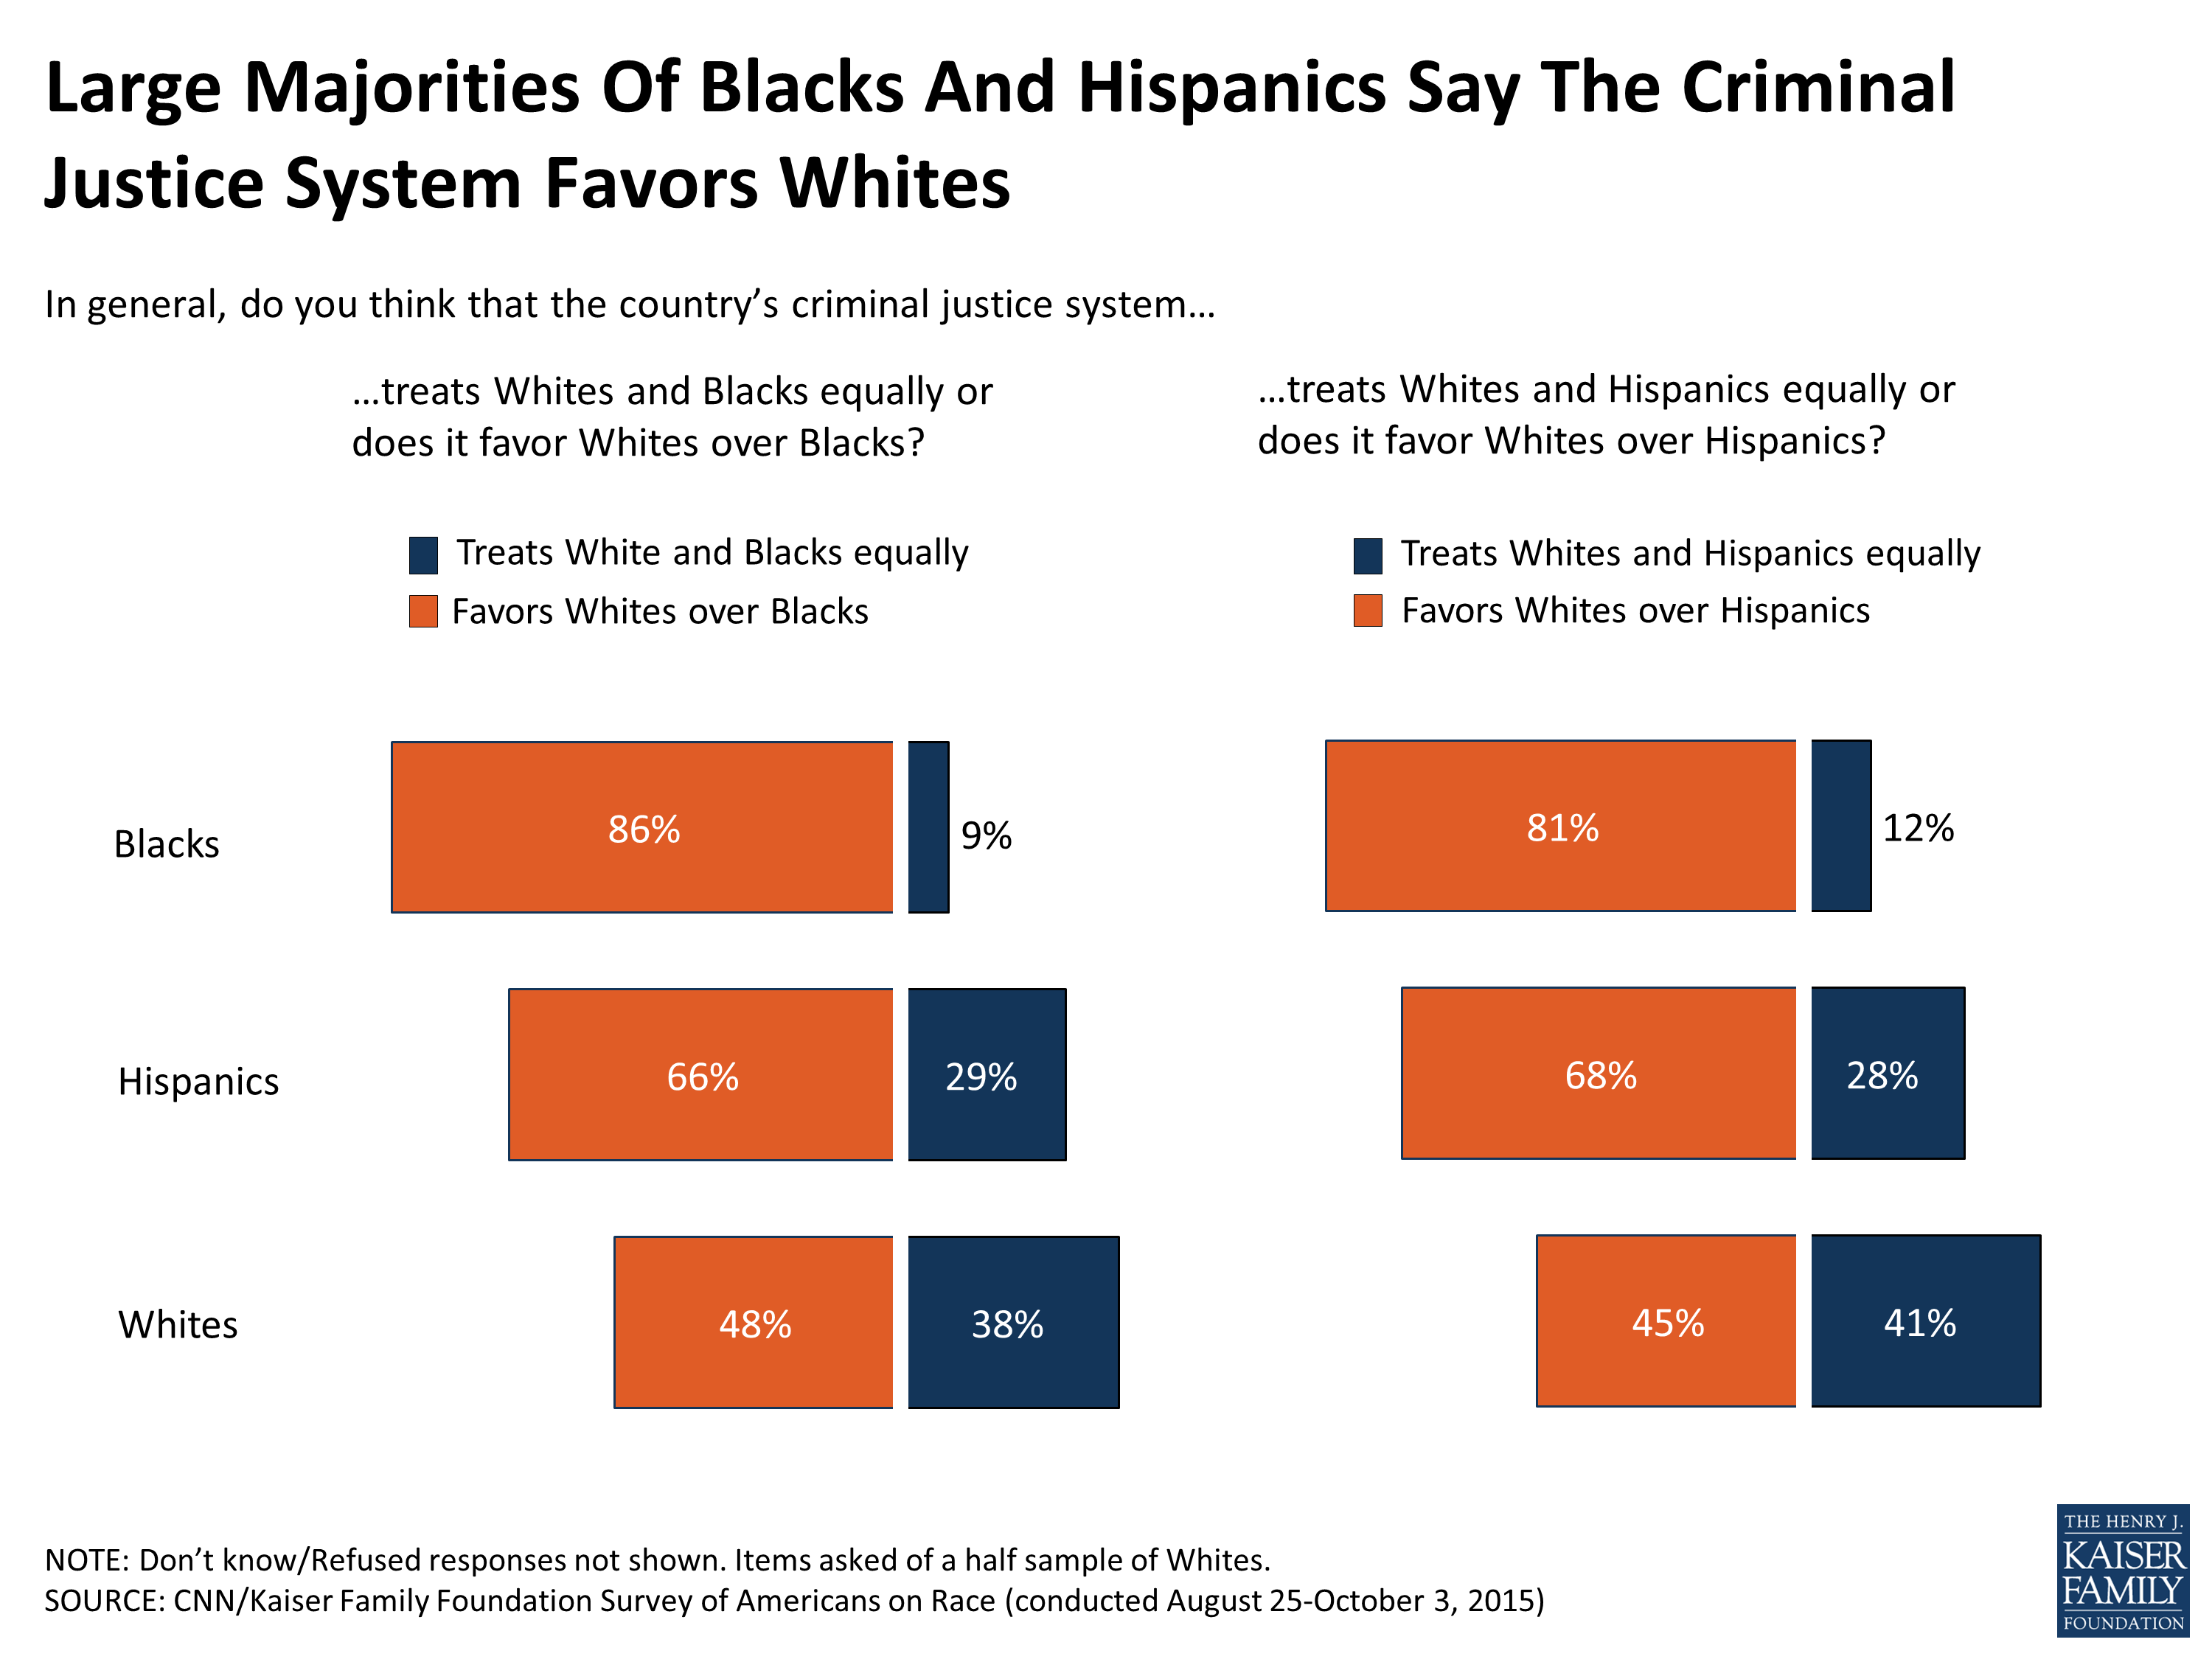
Figure 7
Blacks disproportionately bear the burden of a personal connection to the prison system as more than half of Black Americans (55 percent) say that they, or close friends or family, have been incarcerated. Black Americans living in urban areas are more likely to report a connection to the prison system (60 percent), but still nearly half of suburban and rural Blacks say the same (48 percent). Smaller, but still substantial shares of Hispanics (39 percent) and Whites (36 percent) report such a connection.
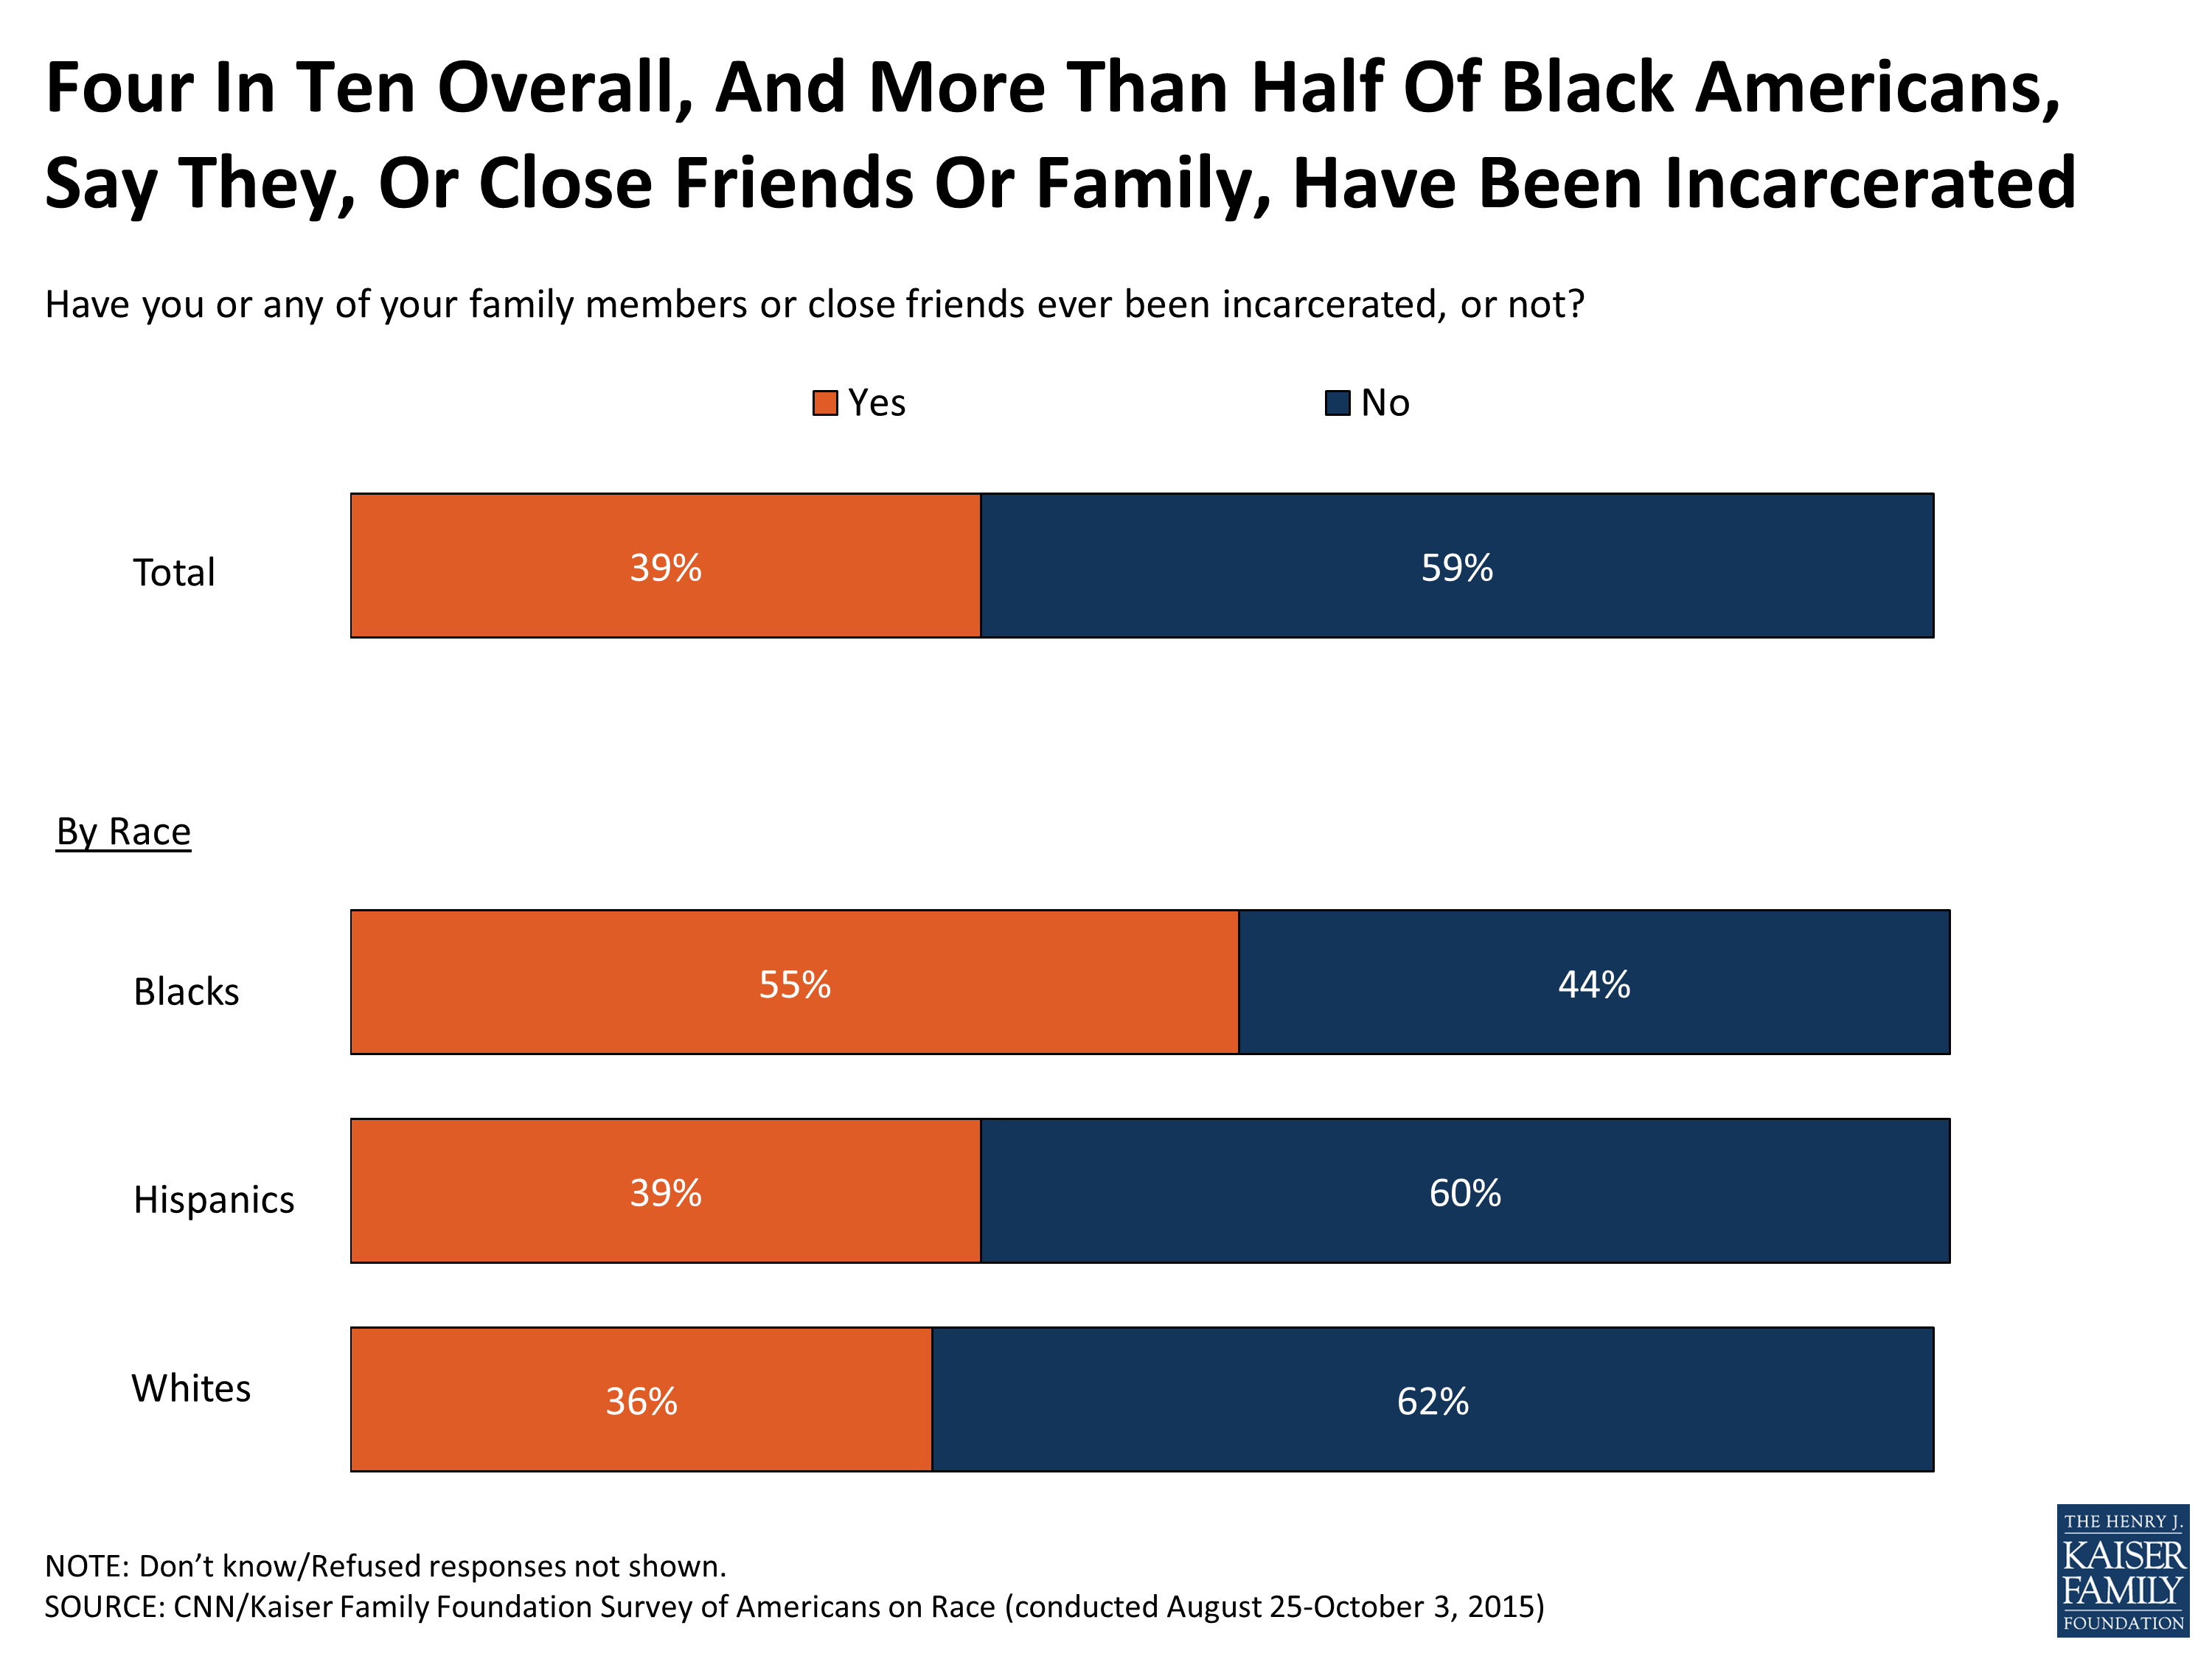
Figure 8
Looking at the demographic profile of those who either have been incarcerated themselves or have family members or close friends who have been, they are more likely to be younger, Black, lower income, have not completed college or say they are of a lower social class.
| Demographics of Those with Ties to Prison System | |||
| Among those who say they or a close friend/family member has been incarcerated | Among those who say they or a close friend/family member has NOT been incarcerated* | ||
| Race/Ethnicity | Hispanics | 15% | 15% |
| Whites | 60 | 68 | |
| Blacks | 16 | 9 | |
| Other | 9 | 8 | |
| Household Income | Less than $50,000 | 50 | 38 |
| $50,000 or more | 40 | 43 | |
| Don’t know/refused | 10 | 19 | |
| Reported Social Class | Lower/Lower-middle class | 47 | 32 |
| Middle class | 41 | 48 | |
| Upper/Upper-middle class | 11 | 19 | |
| Age | 18-34 | 33 | 25 |
| 35-64 | 53 | 51 | |
| 65+ | 12 | 24 | |
| Education | High School or Less | 45 | 40 |
| Some College | 30 | 26 | |
| College Grad or more | 25 | 33 | |
| Note: People who are currently incarcerated are not included in the survey sample, and therefore, are not reflected in the estimates above.
* Includes those who say they don’t know and those who refused to answer. |
|||
Recent incidents of police violence towards Black Americans have generated protests and civil unrest in cities across America. When asked about different reasons underlying these protests, large majorities of Black Americans say that “anger over the treatment of African Americans by police” (84 percent) and a “desire for Blacks to feel like they are being treated fairly” (81 percent) are major reasons for recent protests. More than 7 in 10 Blacks (73 percent) say that “the way government officials handled these incidents” was a major reason, and about six in ten (61 percent) cite “poverty and lack of opportunities in some neighborhoods.”
While majorities of Whites and Hispanics also say each factor was a major reason for protests, they are generally less likely than Blacks to identify each as a major reason, with the exception that the same share of Blacks and Hispanics (61 percent each) say poverty or lack of opportunities in some neighborhoods was a major reason for the protests – higher than the 51 percent of Whites who feel this is a major reason for the protests.
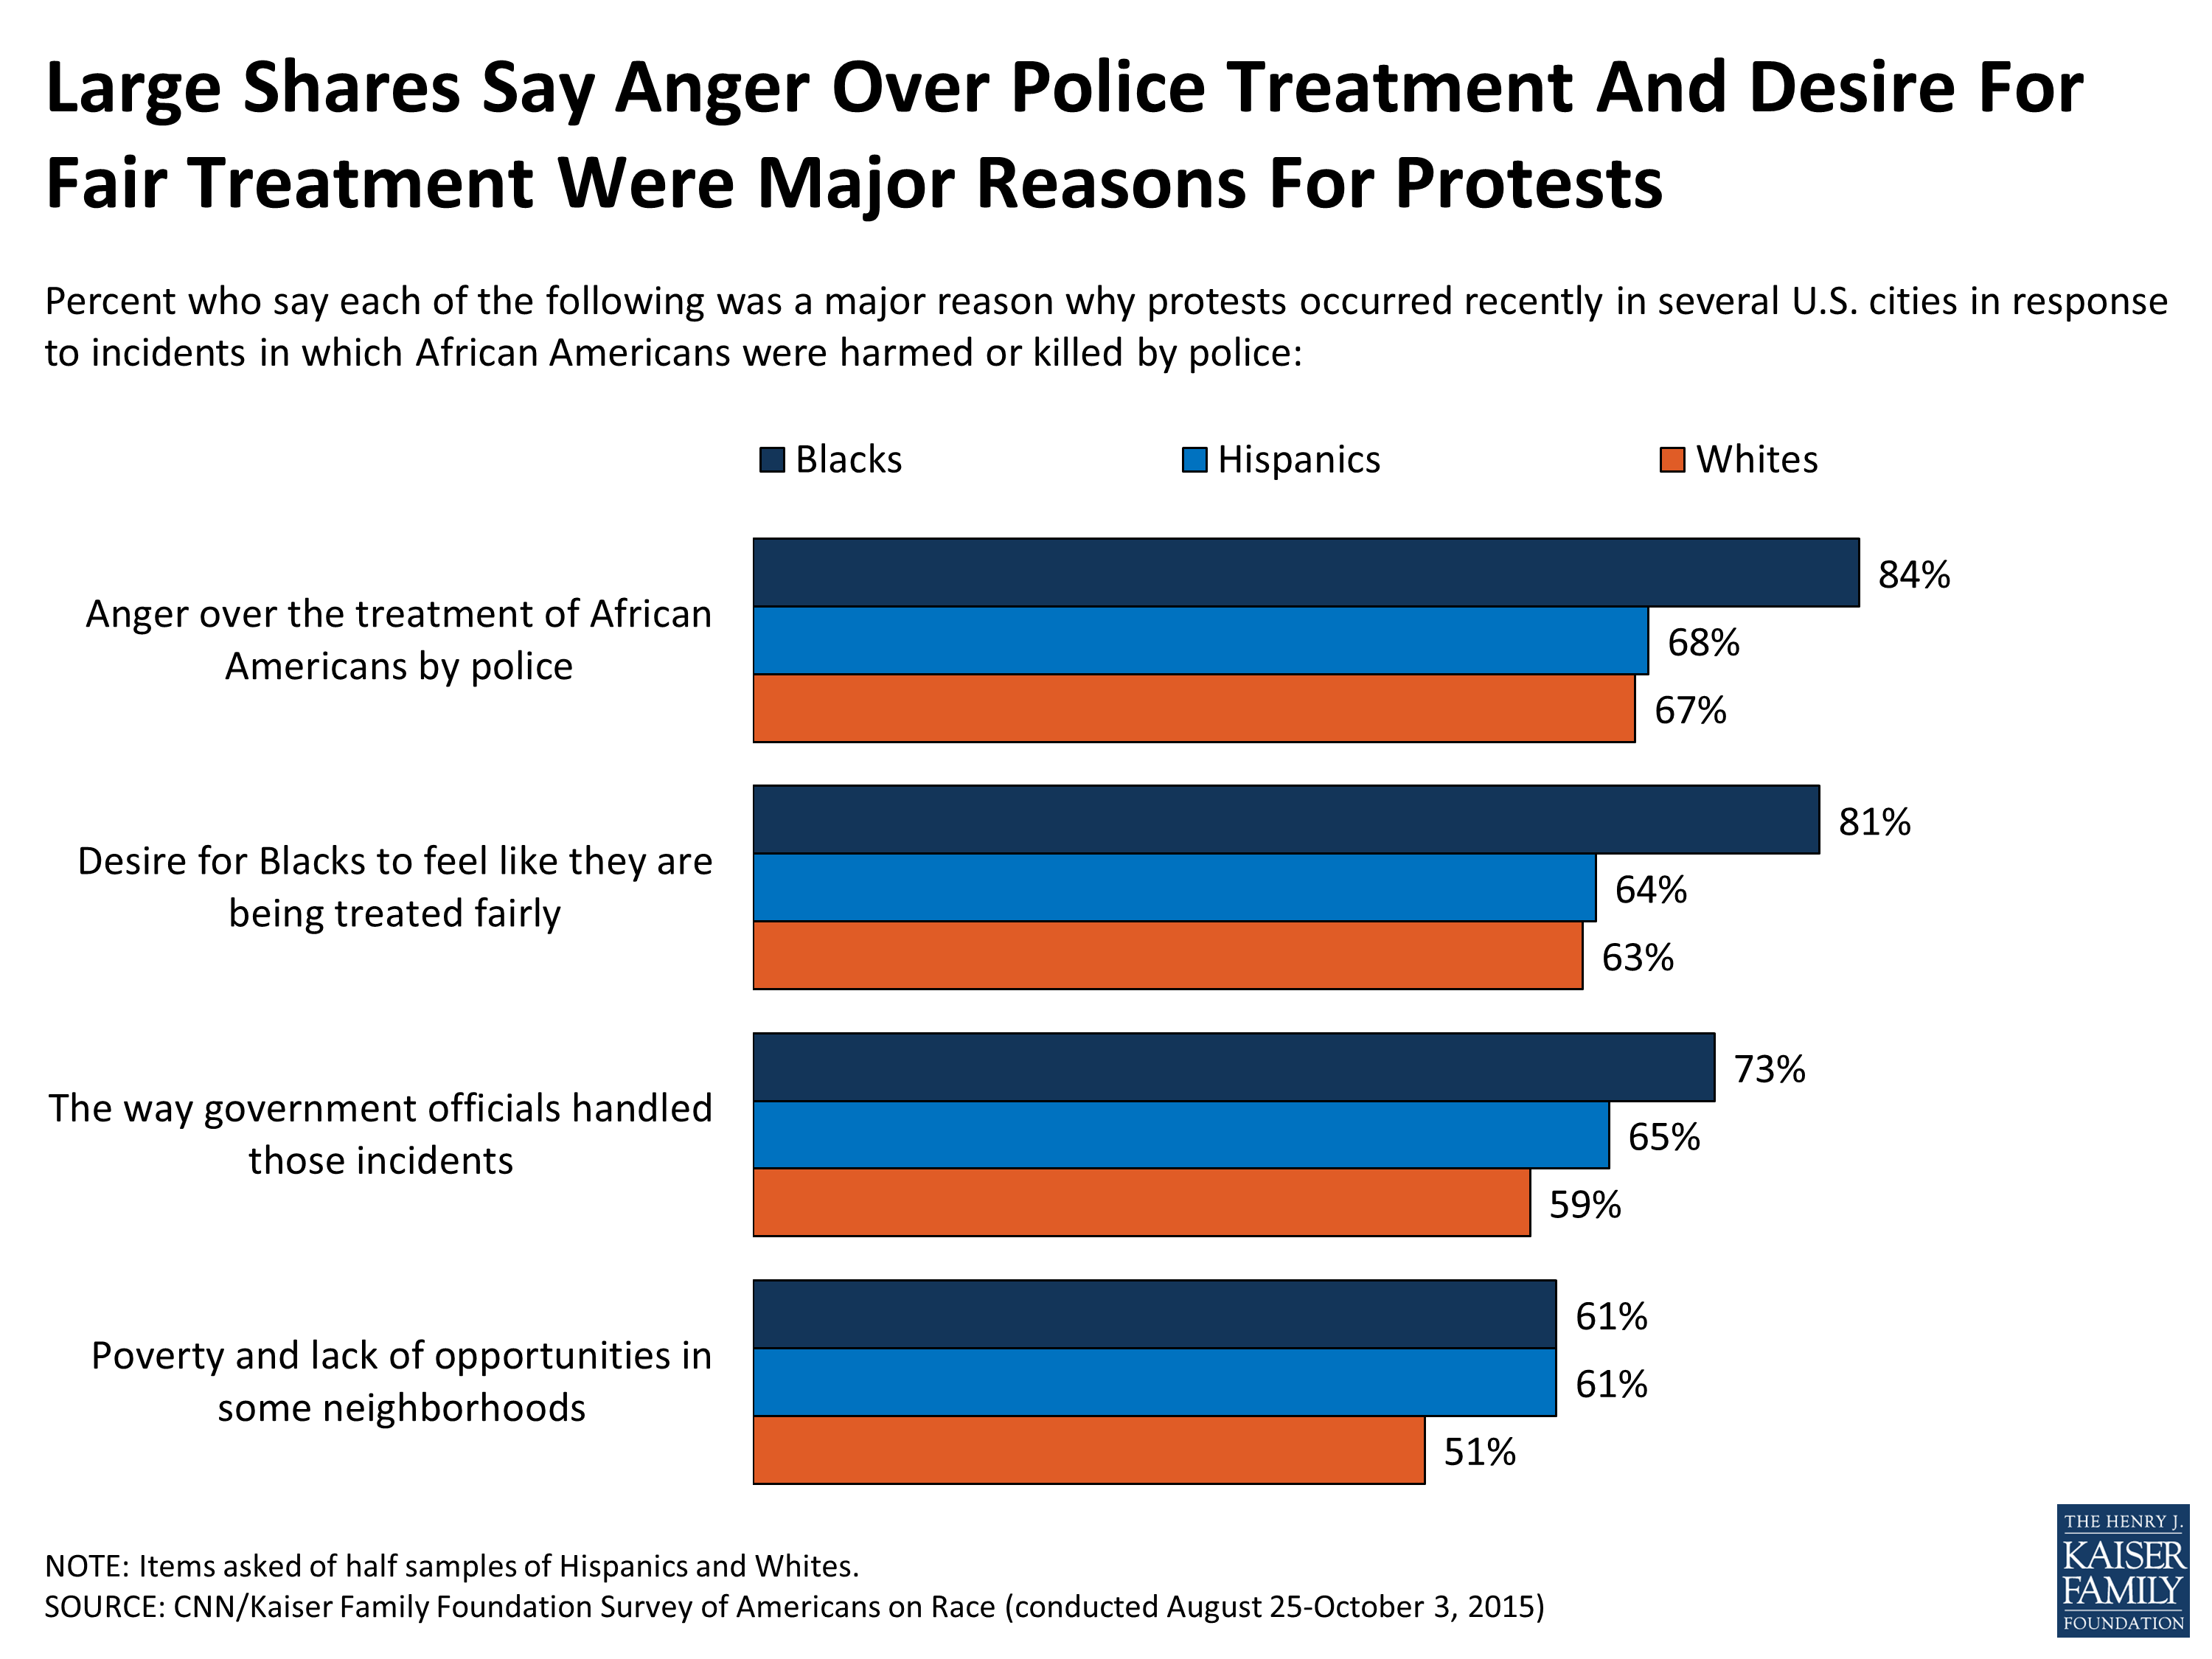
Figure 9
Many recent incidents of police violence towards African Americans have been caught on camera, allowing a rare opportunity for Americans across the country to witness these situations and draw their own conclusions about the use of force. Some have argued that these tapes provide an often-absent level of police accountability. When asked how much of a role an incident being videotaped plays in whether or not an officer is charged with a crime, a large majority of Blacks (72 percent) say it plays a major role; a view shared by majorities of Hispanics (87 percent) and Whites (80 percent) as well. Seven in 10 Blacks also say the race of the officer involved plays a major role (70 percent), followed by nearly 6 in 10 Blacks (58 percent) who say the race of the prosecutor handling the case plays a major role. Six in 10 or more Hispanics also report these two factors play a major role, however considerably smaller shares of Whites say the same.
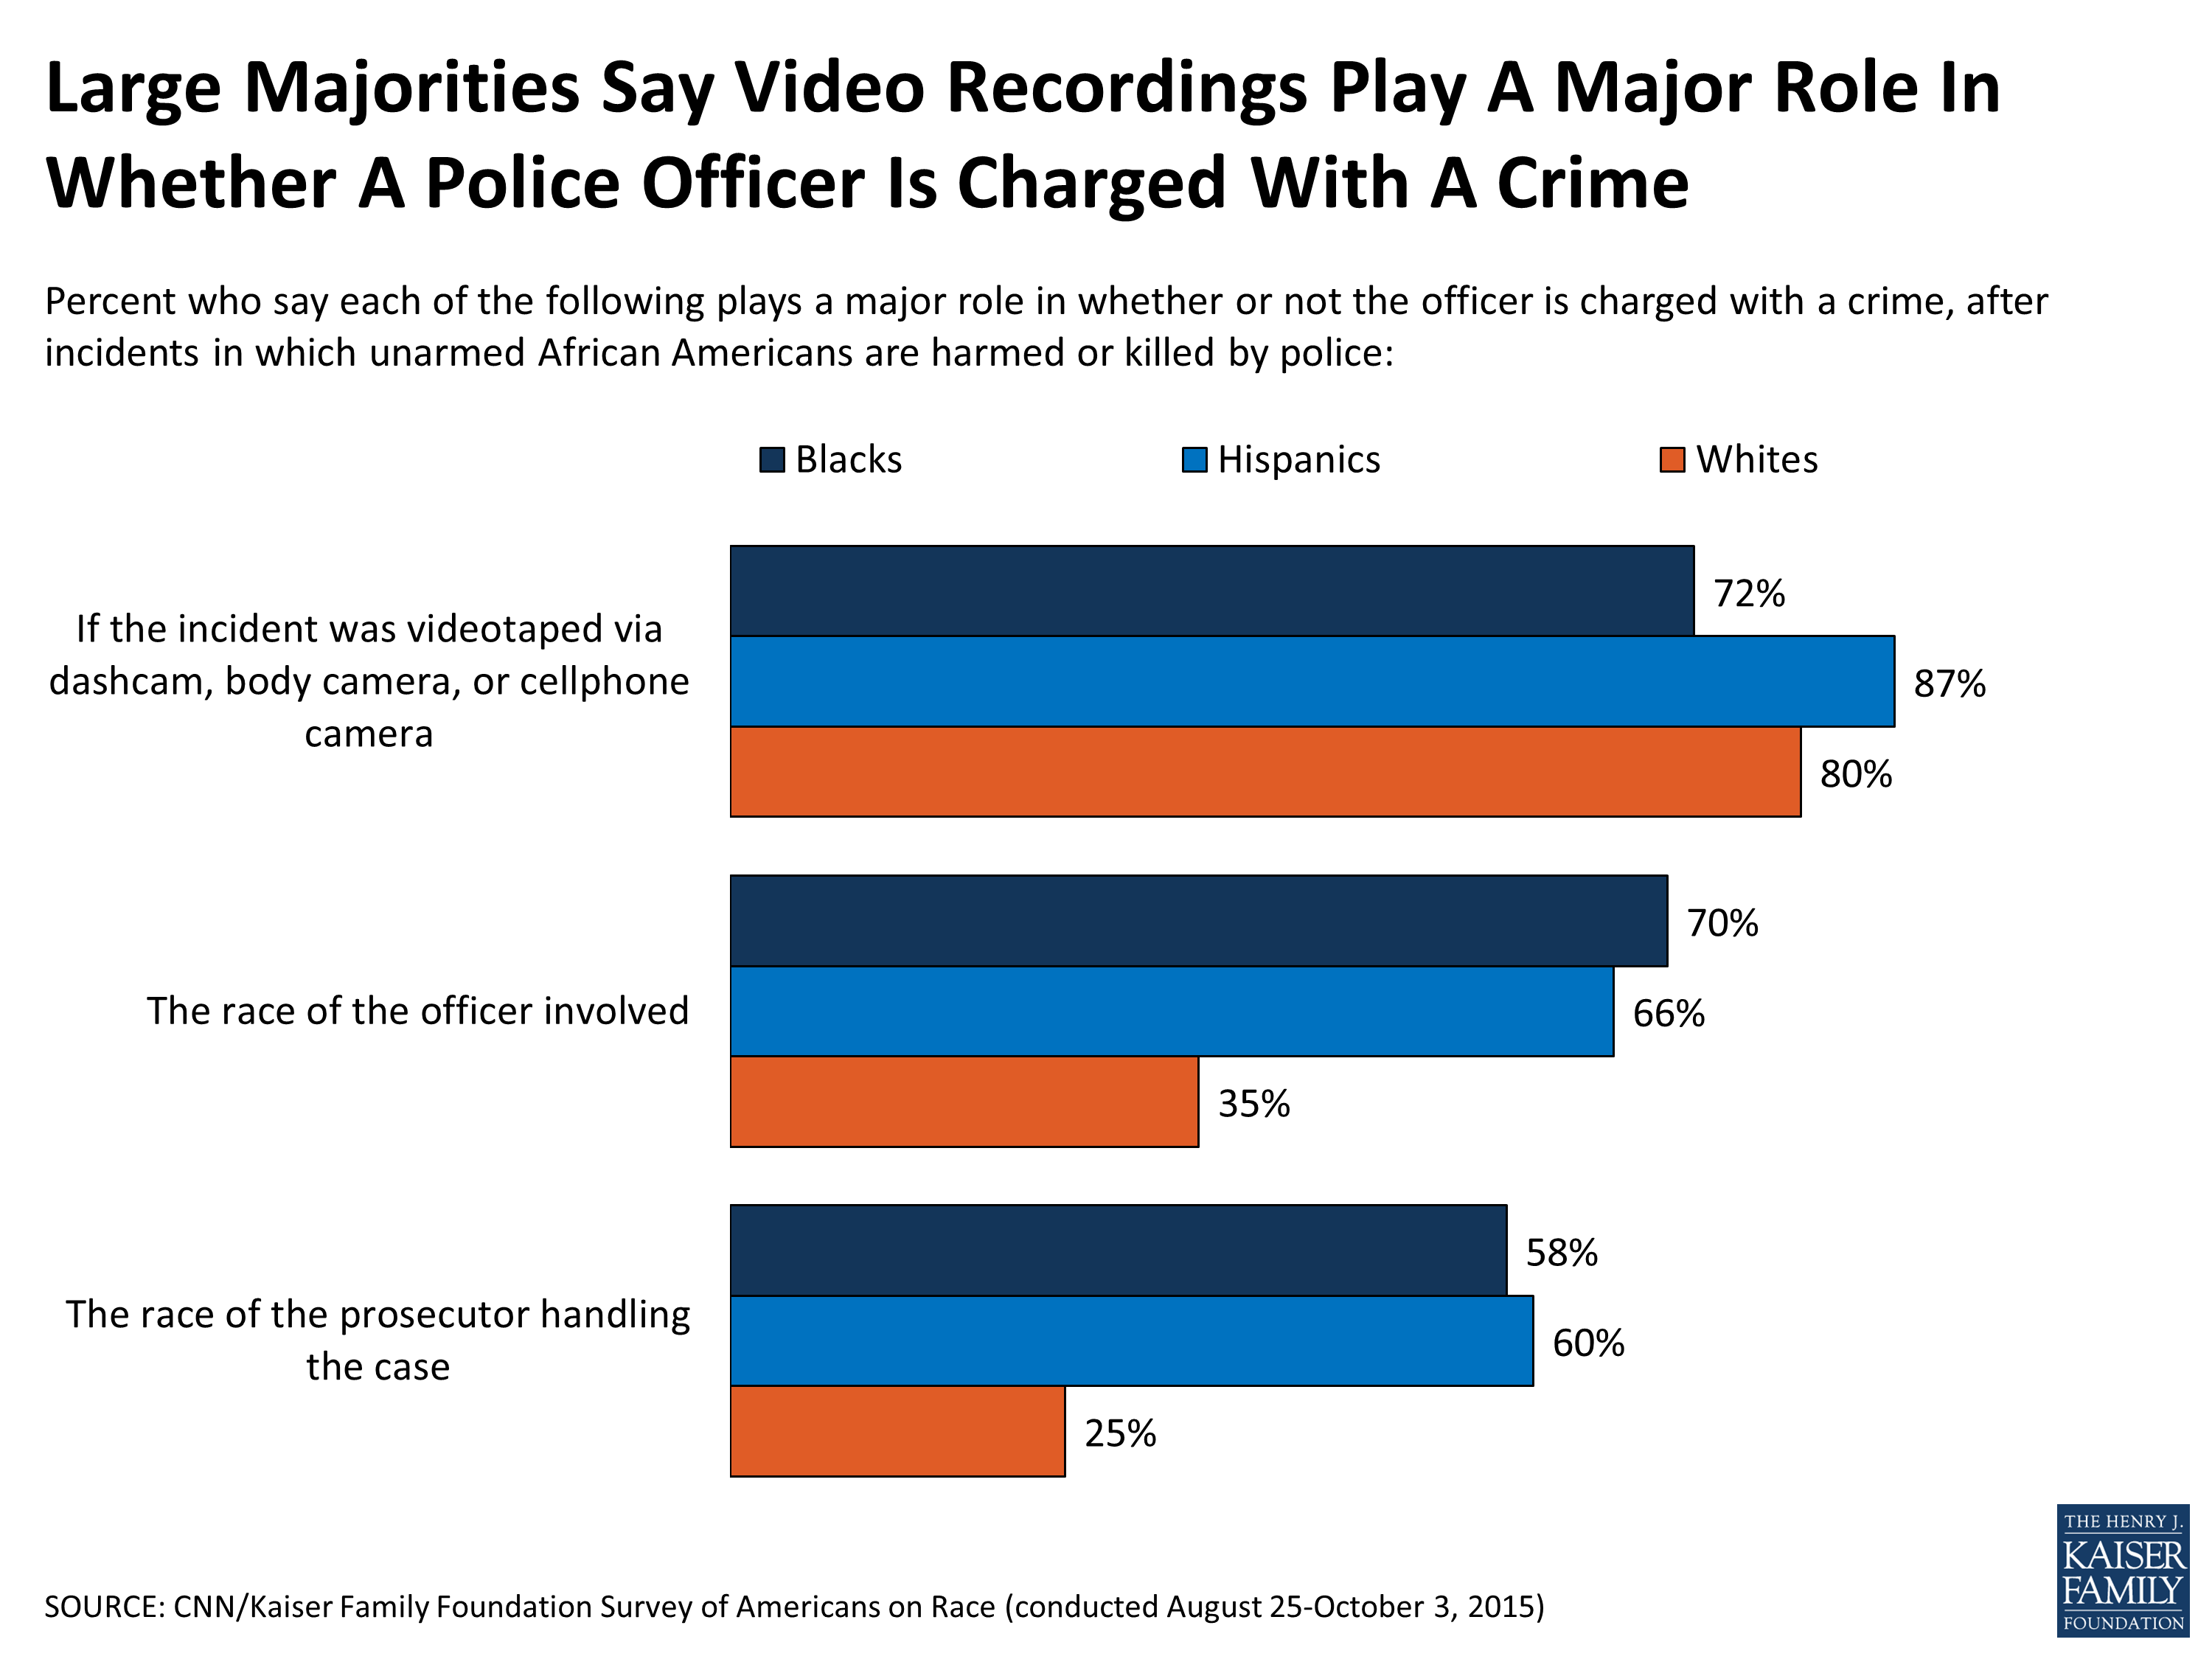
Figure 10
One outcome of these episodes over the past few years has been the establishment of the Black Lives Matter (BLM) movement. More than half of Blacks say they are supporters of Black Lives Matter (58 percent), including 13 percent who say they have attended a BLM event, protest or gathering in the past year. Among the general public overall, support is less wide-spread with 35 percent saying they support the movement, including 32 percent of Whites and 28 percent of Hispanics saying they support the cause, and few (4 percent overall) saying they have attended a BLM event in the past year.
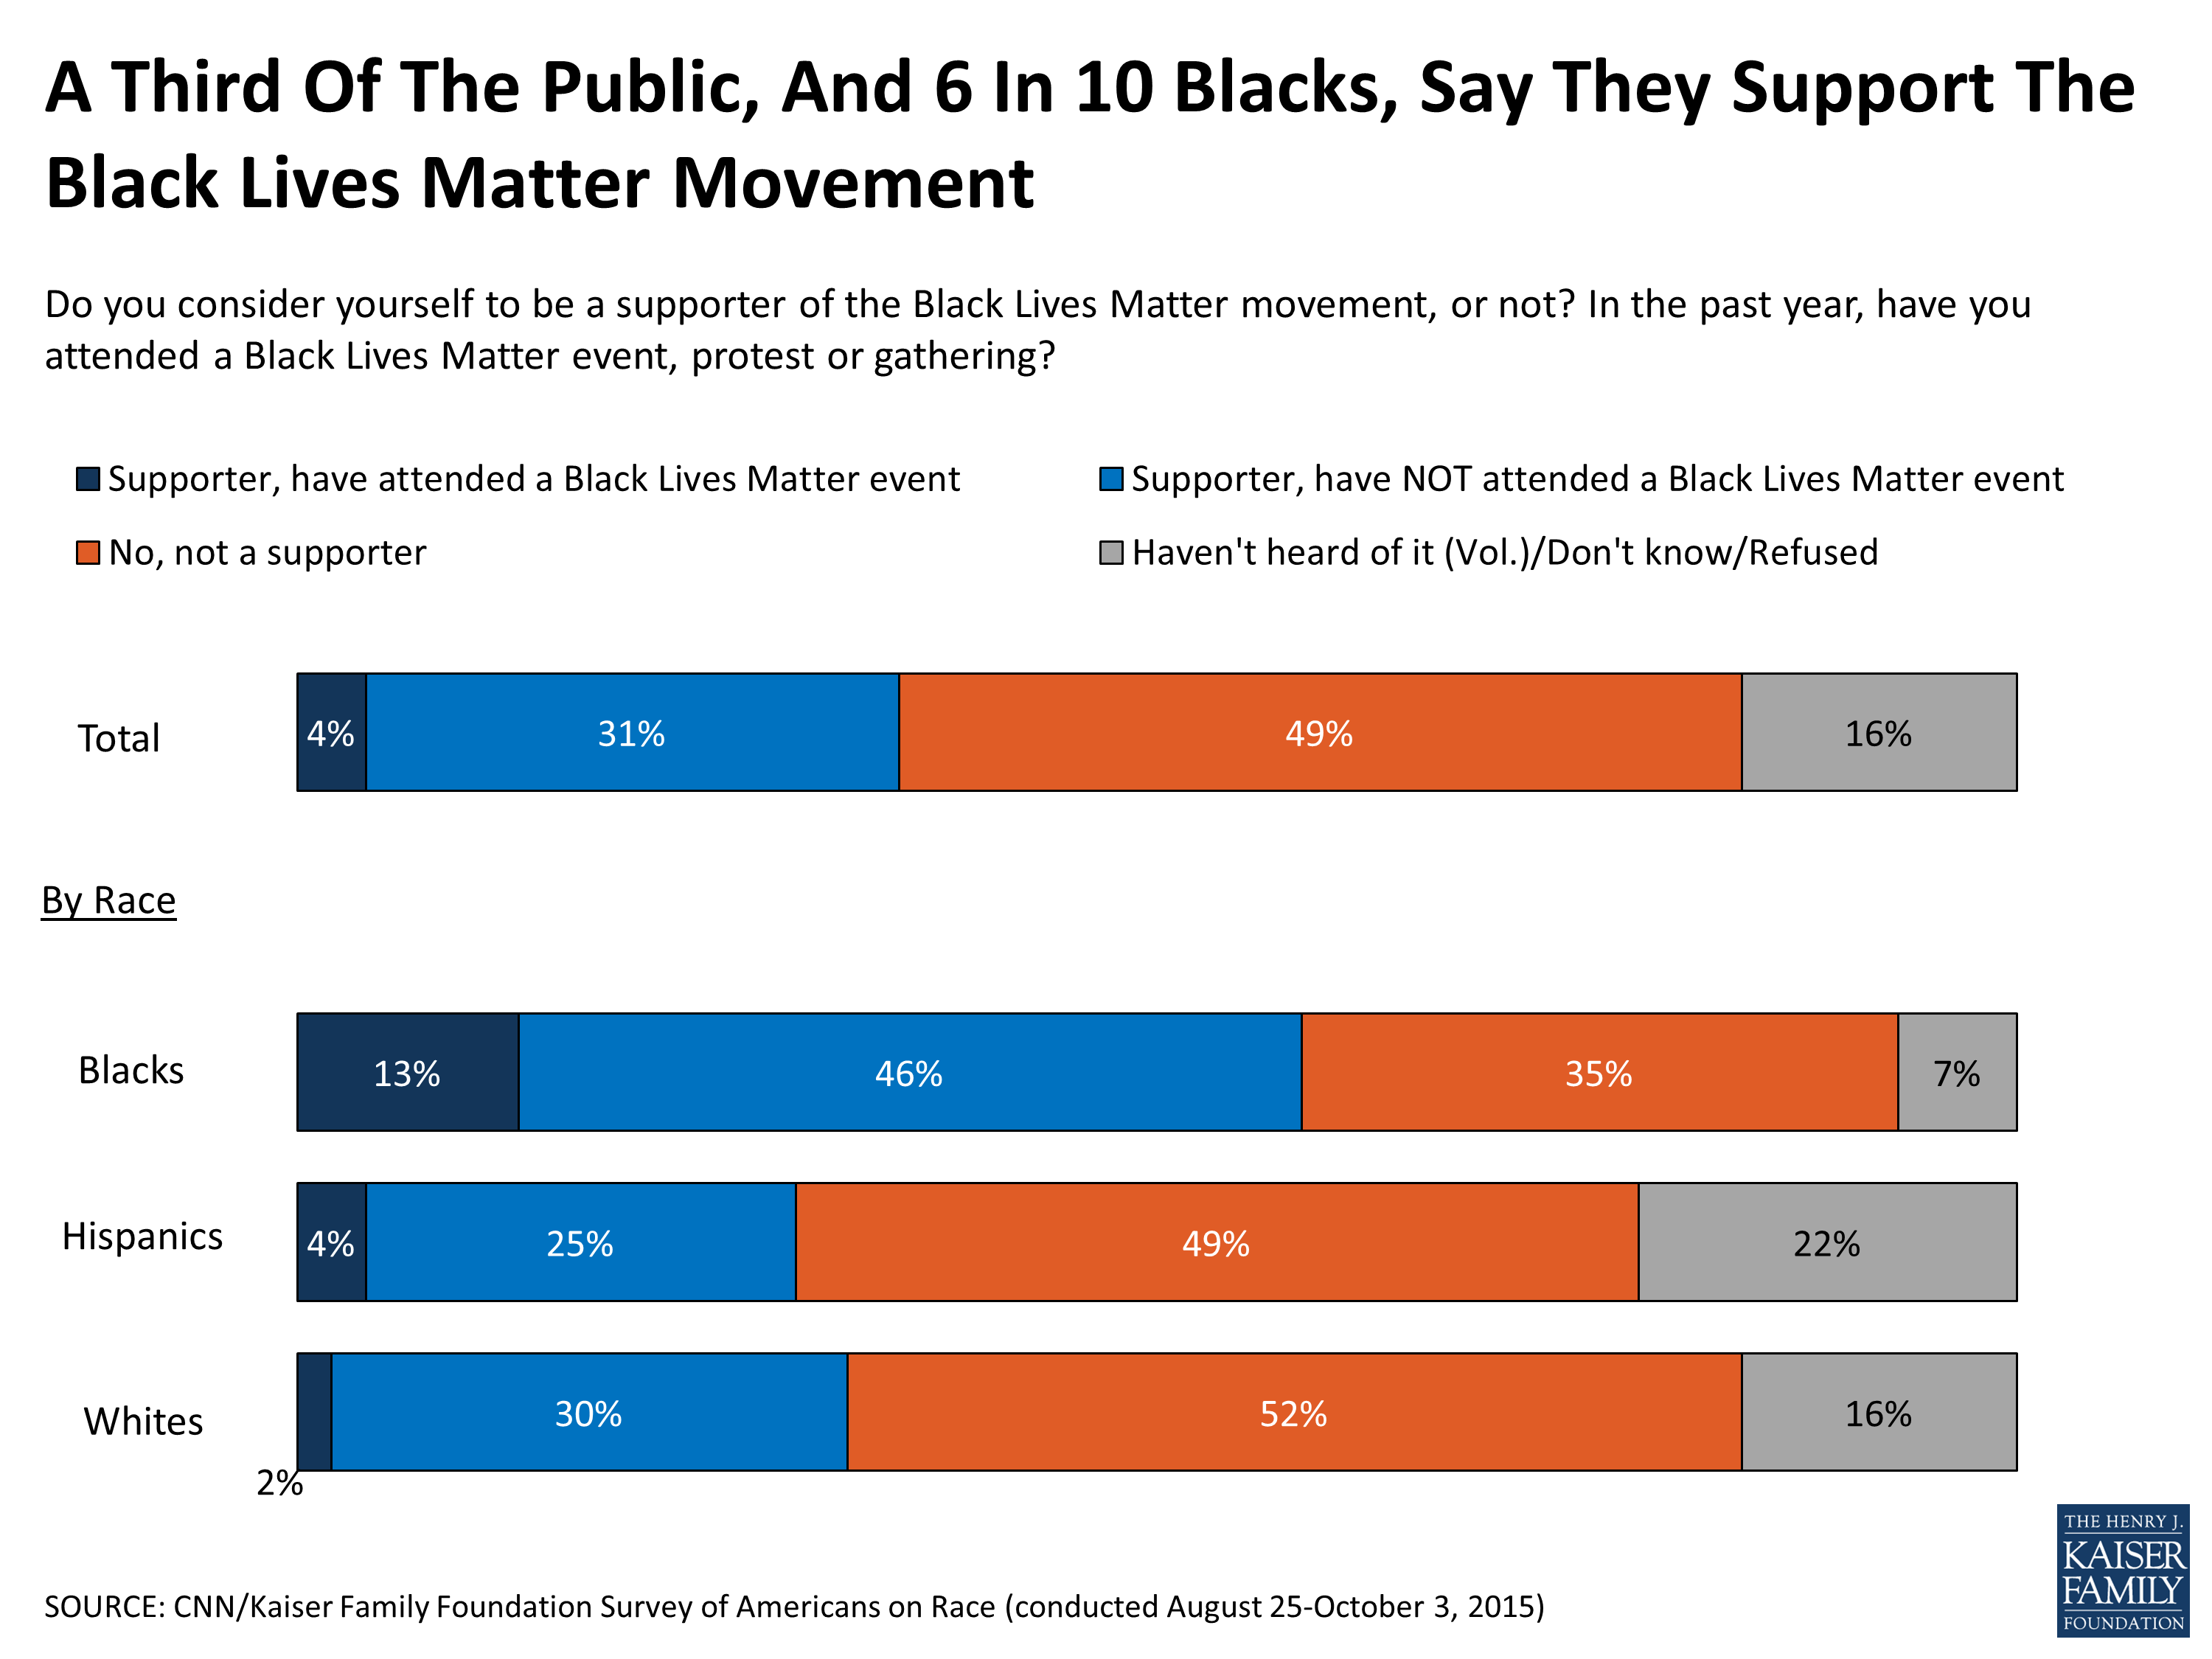
Figure 11
There are some key demographic differences between supporters of the Black Lives Matter movement and those who don’t support the movement, either because they say they are not a supporter or because they haven’t heard of it or just aren’t sure. BLM supporters are more likely to be Black, Democrat, and younger and less likely to have lower levels of education, or identify as Republican, independent, and politically conservative.
| Demographics of Black Lives Matter Supporters | ||||
| Support (35%) |
Not support
BLM (49%)
|
Haven’t heard
of it/
Don’t know/
Refused
(16%)
|
||
| Race/Ethnicity | Hispanics | 12% | 15% | 21% |
| Whites | 58 | 69 | 66 | |
| Blacks | 19 | 8 | 5 | |
| Other | 10 | 8 | 8 | |
| Household Income | Less than $50,000 | 48 | 39 | 43 |
| $50,000 or more | 40 | 47 | 32 | |
| Don’t know/refused | 12 | 14 | 25 | |
| Age | 18-34 | 40 | 23 | 17 |
| 35-64 | 46 | 55 | 57 | |
| 65+ | 13 | 21 | 26 | |
| Education | High School or Less | 37 | 44 | 46 |
| Some College | 31 | 26 | 25 | |
| College Grad or more | 32 | 29 | 28 | |
| Party Identification | Republican | 11 | 27 | 22 |
| Independent | 26 | 42 | 39 | |
| Democrat | 51 | 22 | 24 | |
| Political Ideology | Liberal | 36 | 18 | 24 |
| Moderate | 37 | 35 | 33 | |
| Conservative | 22 | 43 | 34 | |
Section 3: Perceptions of the Problem
Across the country, Americans feel that racial tensions are increasing on a national level, but at a more local level, Americans feel tensions are remaining the same. More than half of Americans – Blacks, Hispanics, Whites, rural and urban alike – say racial tensions have increased in the country over the past decade, while roughly a quarter say that tensions have stayed about the same. Compared to a similar survey conducted in 1995 – a time when the nation had just witnessed the Million Man March as well as the Rodney King riots a few years prior in 1992 – Whites today are more likely to say that racial tensions in the country have increased over the past 10 years (67 percent versus 45 percent in 1995), while the shares of Blacks and Hispanics who say tensions have increased have largely held steady, after dipping in 2001, a time void of major, nation-wide race-related events.
In contrast to perceptions of racial tensions nationwide, when it comes to sensing racial tension within their own community, most people (57 percent) say it has stayed about the same over the past 10 years. While most of those in urban areas1 also say tensions have stayed the same over the past decade, they are slightly more likely to say tensions have increased than those in non-urban areas (28 percent versus 20 percent). In addition, Blacks and Hispanics are more likely than Whites to say they these tensions have increased within their own communities – about 3 in 10 Hispanics (31 percent) and Blacks (27 percent) feel that racial tensions within their community are picking up, compared to about 2 in 10 Whites (21 percent).
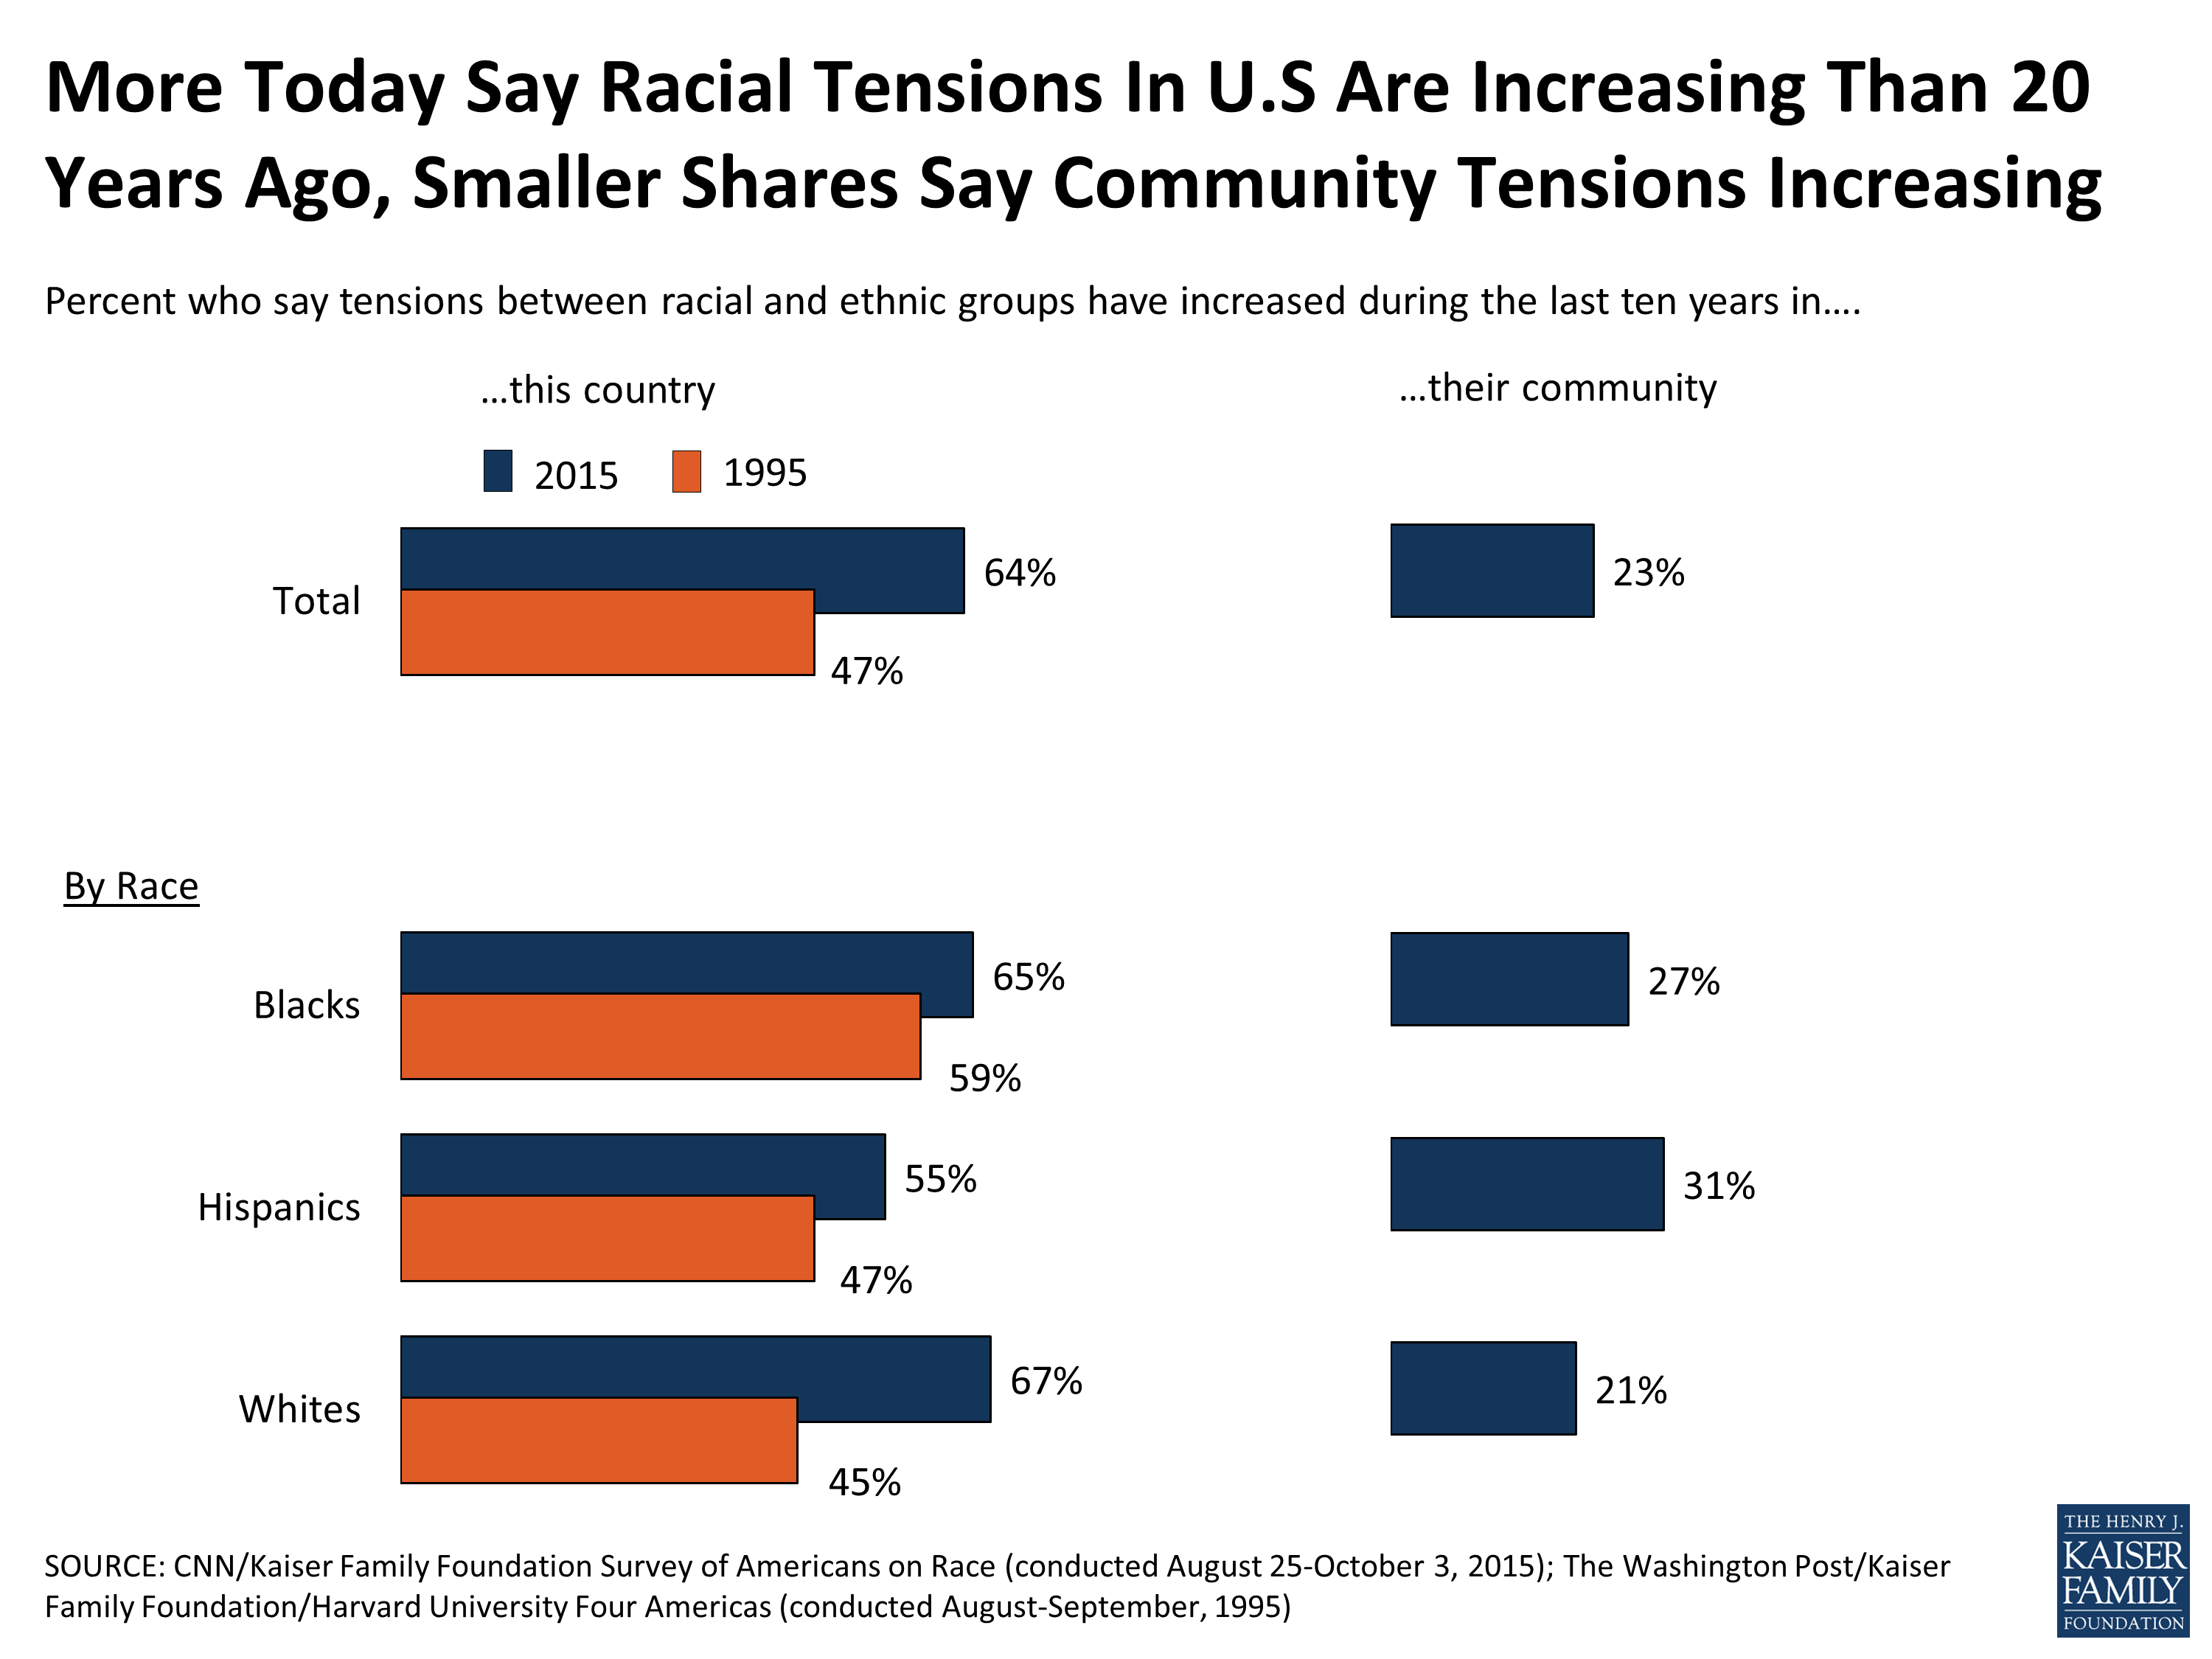
Figure 12
Perceptions of the scope of the problem also differ by race. Blacks (66 percent) and Hispanics (64 percent) are much more likely than Whites (43 percent) to say that racism is a big problem. Overall, about half of Americans (49 percent) say racism is a big problem in society today, and another third (33 percent) say it is somewhat of a problem, while just 16 percent say it is a small problem or not a problem at all. The share of Americans who say racism is a big problem has increased somewhat from a survey conducted 20 years ago when about 4 in 10 (41 percent) of Americans thought racism was a big problem. The views of Whites and Blacks haven’t changed much compared to 20 years ago, however, Hispanics are much more likely to now say racism is a big problem than they were in 1995 (64 percent in 2015 versus 46 percent in 1995).
Although the share of Americans who say racism is a big problem has seen modest increases compared to 1995, there is a much larger increase when compared to 2011 when just 28 percent of the public held this view. This seems to reflect the fact that when tensions are more visible and highlighted in the news, Americans are more likely to report increasing tensions in surveys. In 2011, Americans’ attention was likely on other domestic and international events, such as the Fukushima nuclear power plant crisis, protests and uprisings throughout many Middle Eastern and northern African countries, also known as the Arab Spring, and the Occupy Wall Street movement.
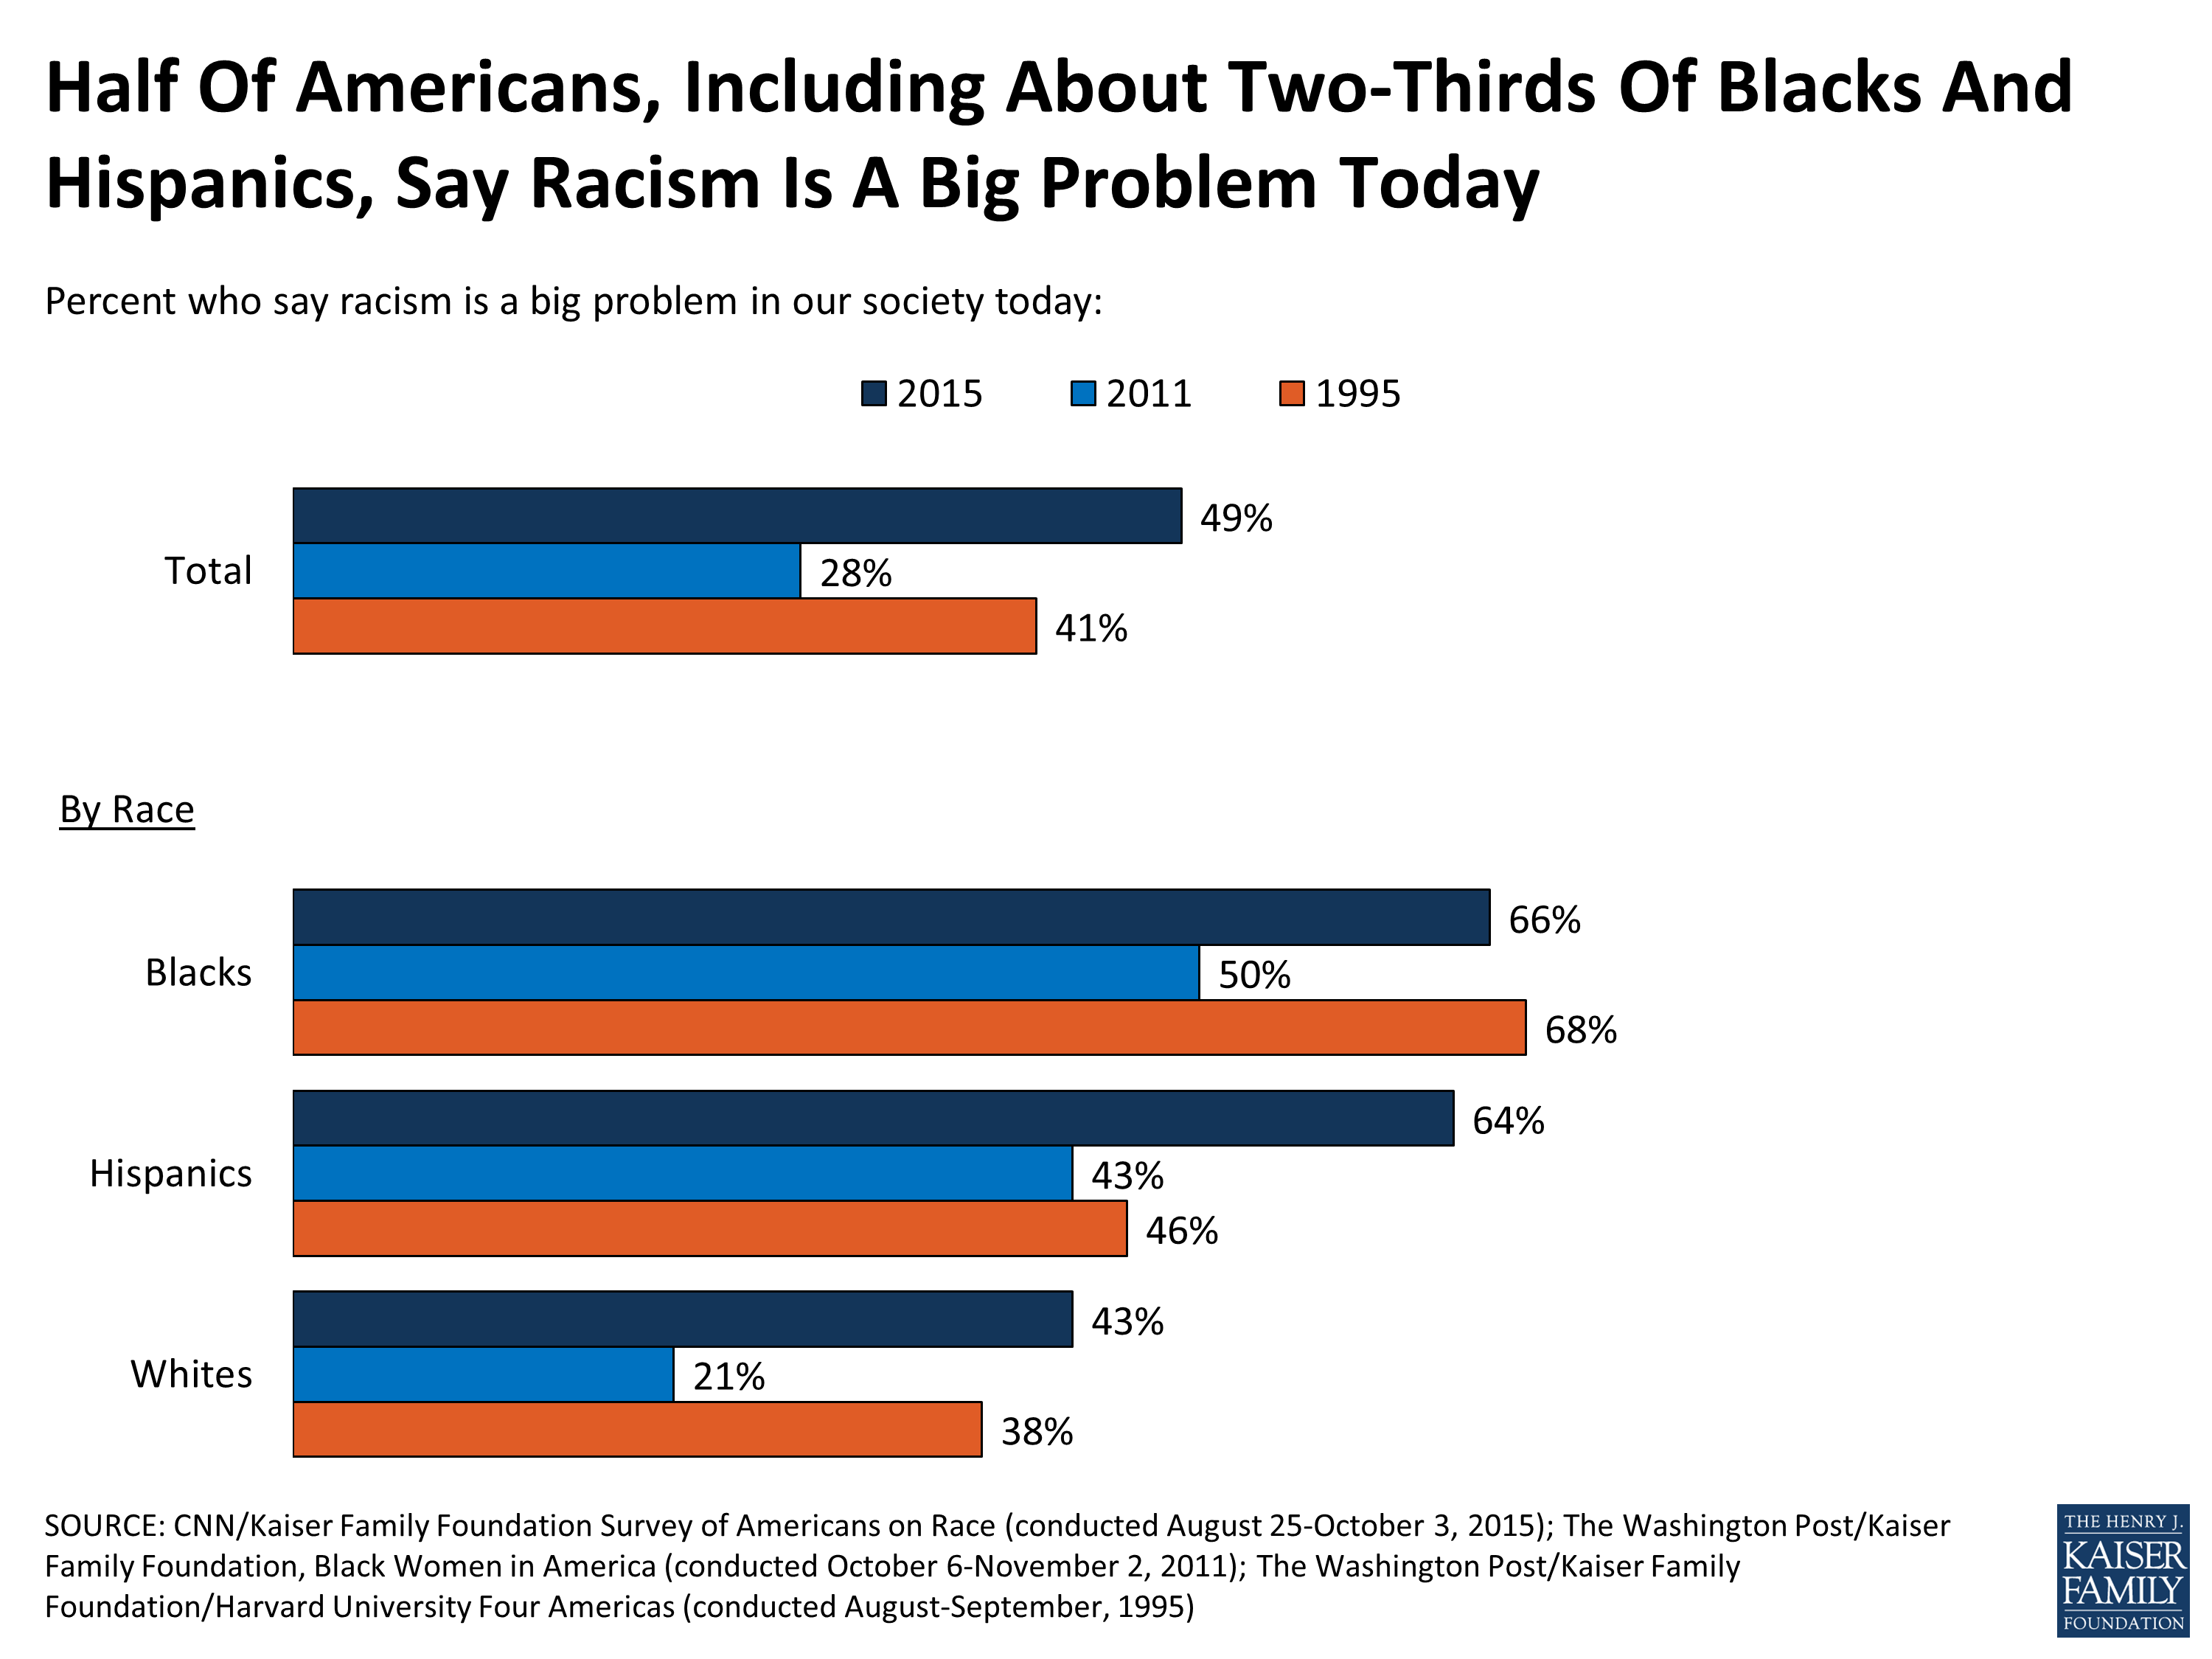
Figure 13
Given the frequency in which Blacks report recent unfair treatment related to their race as noted above, it is perhaps not surprising that fully two-thirds (66 percent) of Blacks say African Americans face a lot of discrimination in society today. In addition, 4 in 10 Hispanics say there is a lot of discrimination against Hispanics today. While more than 7 in 10 Whites say that Blacks (75 percent) and Hispanics (71 percent) face at least some discrimination, they are less likely than Blacks or Hispanics themselves to say there is a lot of discrimination against either group. Whites believe they are subject to some discrimination too – nearly half of Whites (47 percent) say there is at least some discrimination against Whites.
Views of how much discrimination Blacks and Hispanics face have increased significantly over time. The share saying Blacks experience a lot of discrimination has increased since 2001, particularly among Blacks themselves – from 48 percent in 2001 to 66 percent in 2015. Among Hispanics, the shares saying Hispanic Americans face a lot of discrimination went from 28 percent in 2001 to 40 percent in 2015. While much smaller shares overall, Whites are also now more likely to say Blacks or Hispanics face a lot of discrimination than they were in 2001, perhaps a sign of modest increases in awareness of the experiences of others.
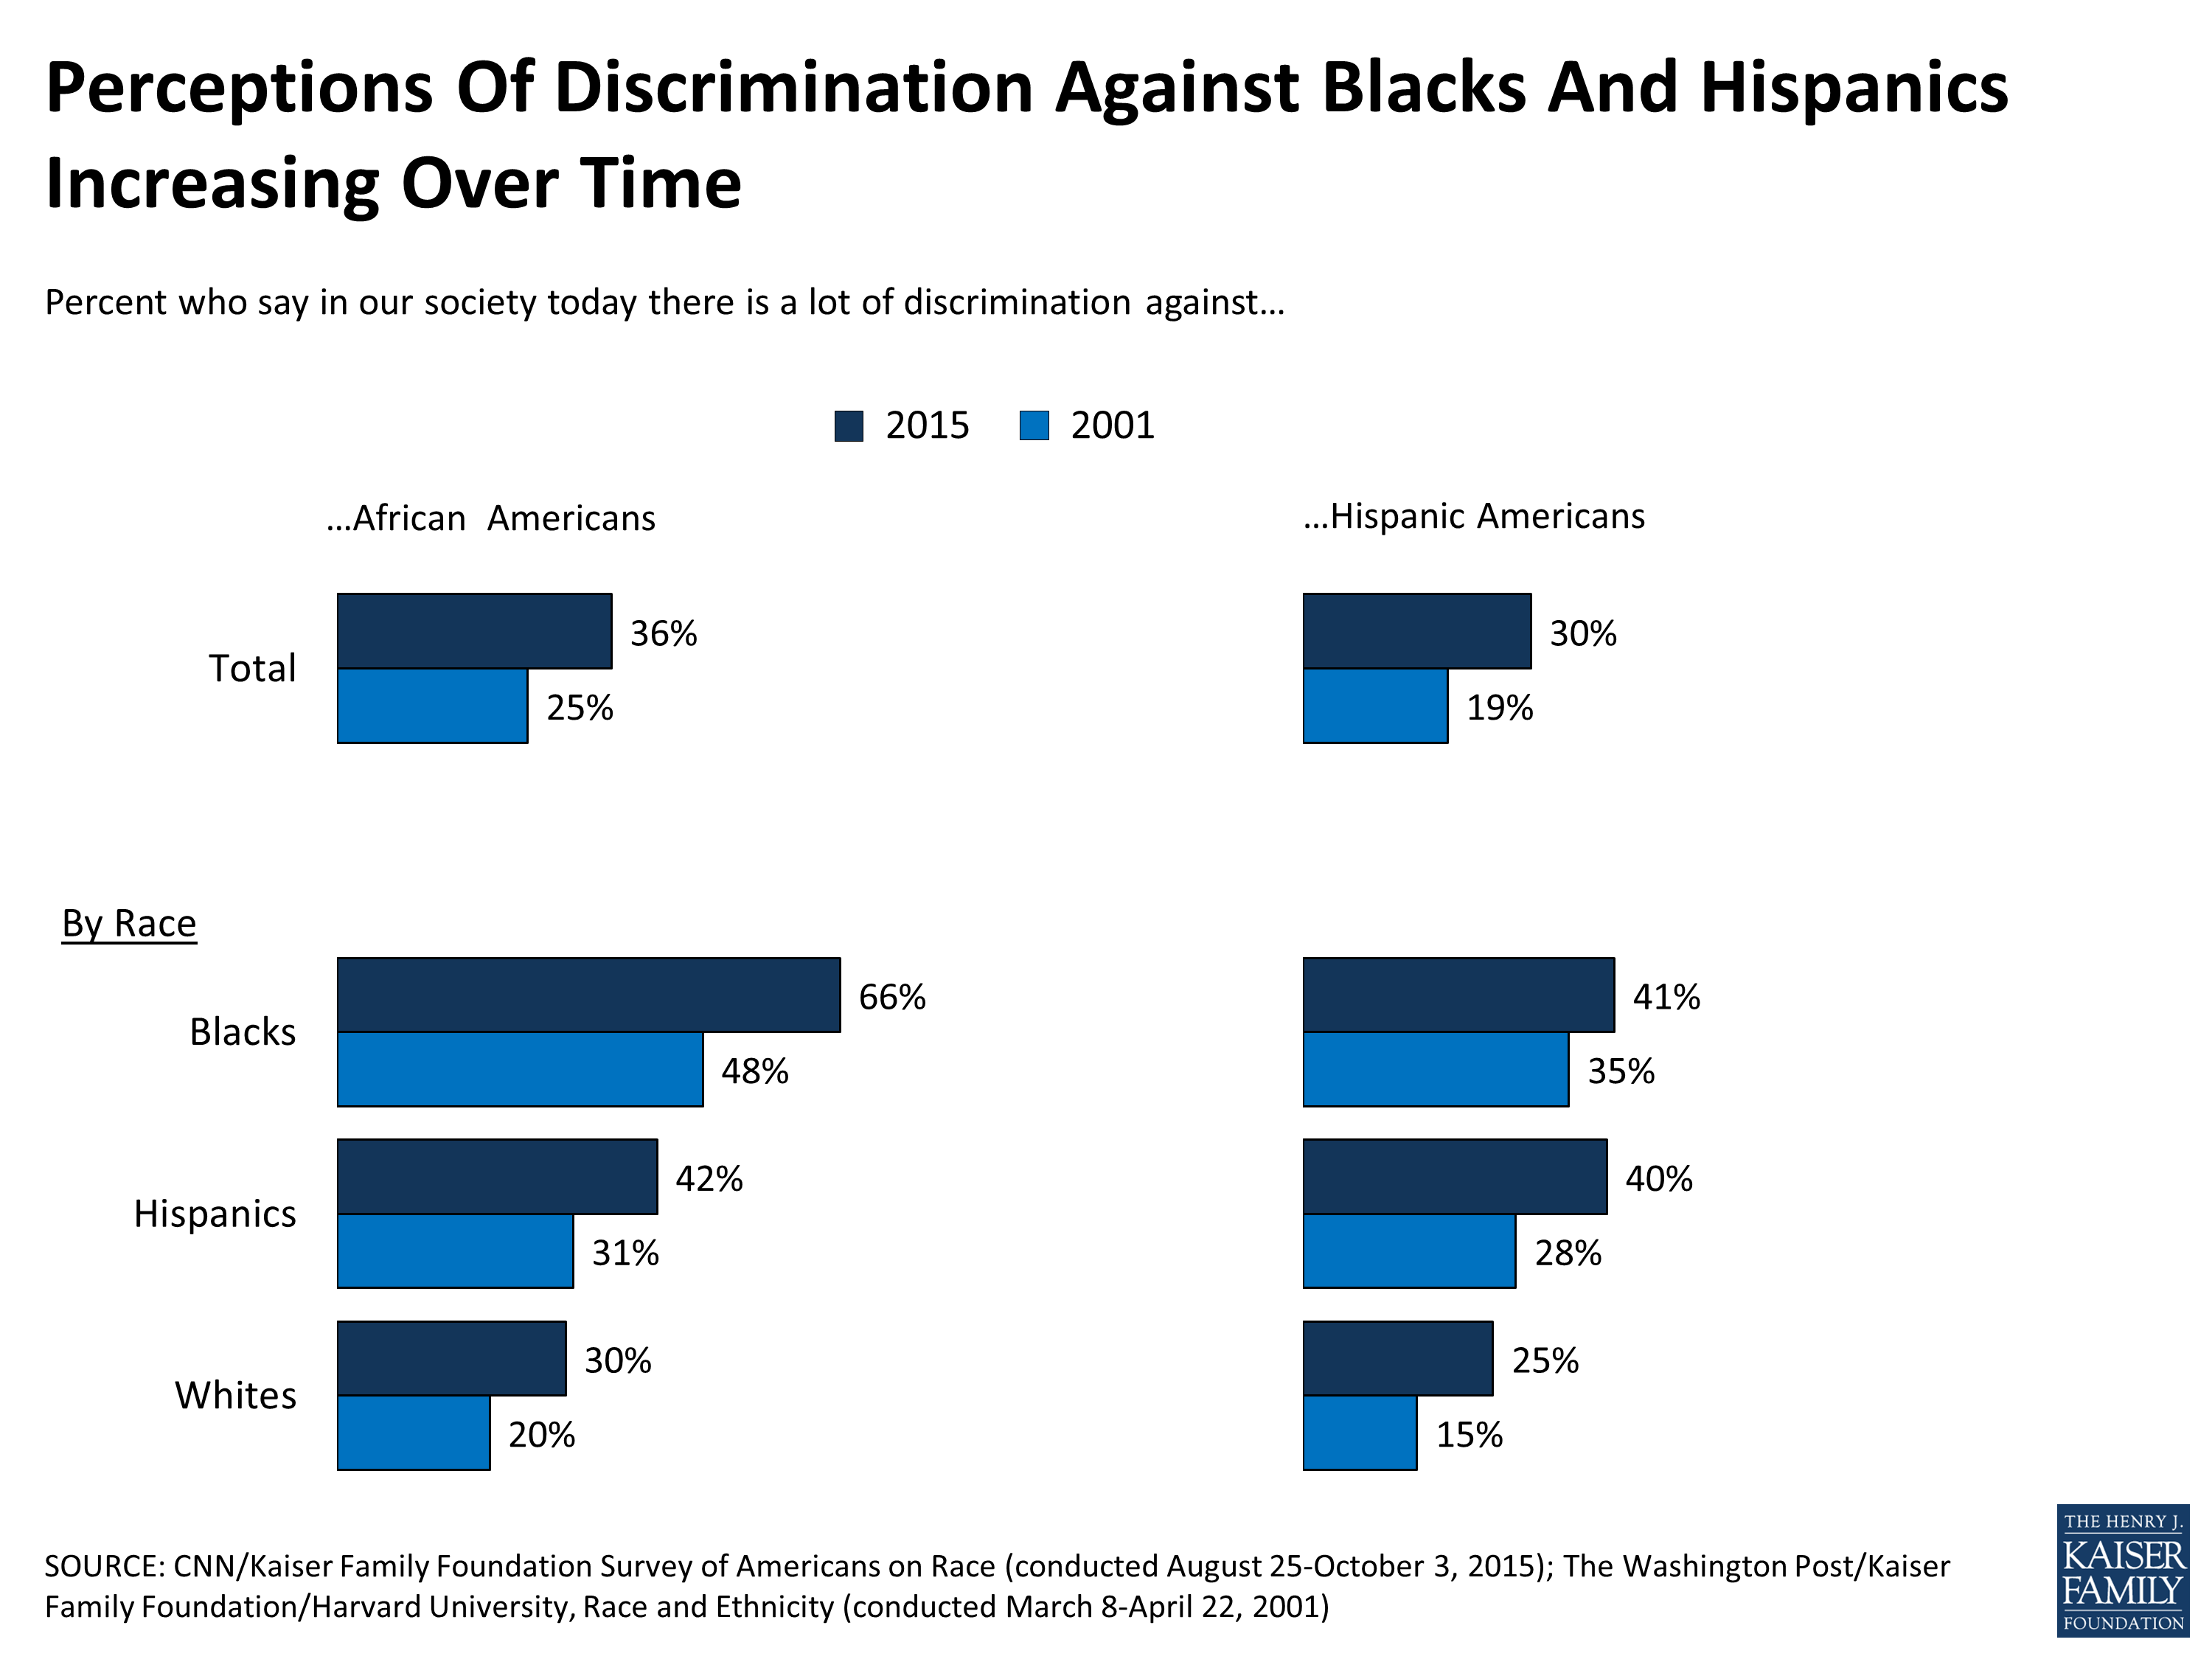
Figure 14
What’s Driving Discrimination and Who’s Responsible for Improving it
Experts often point to two particular challenges when discussing the problem of racism – institutional racism, that is, discrimination that is historically built into our society and institutions, and individual racism, meaning individuals’ own beliefs and prejudices that cause them to treat those of other races poorly. When asked which is the bigger problem in America today, about 6 in 10 Americans (59 percent) say that prejudice on an individual level is a bigger problem than institutional discrimination. However, while a majority of Whites point to individuals’ own behavior over institutional discrimination as the bigger problem (63 percent versus 29 percent), Blacks and Hispanics are divided.
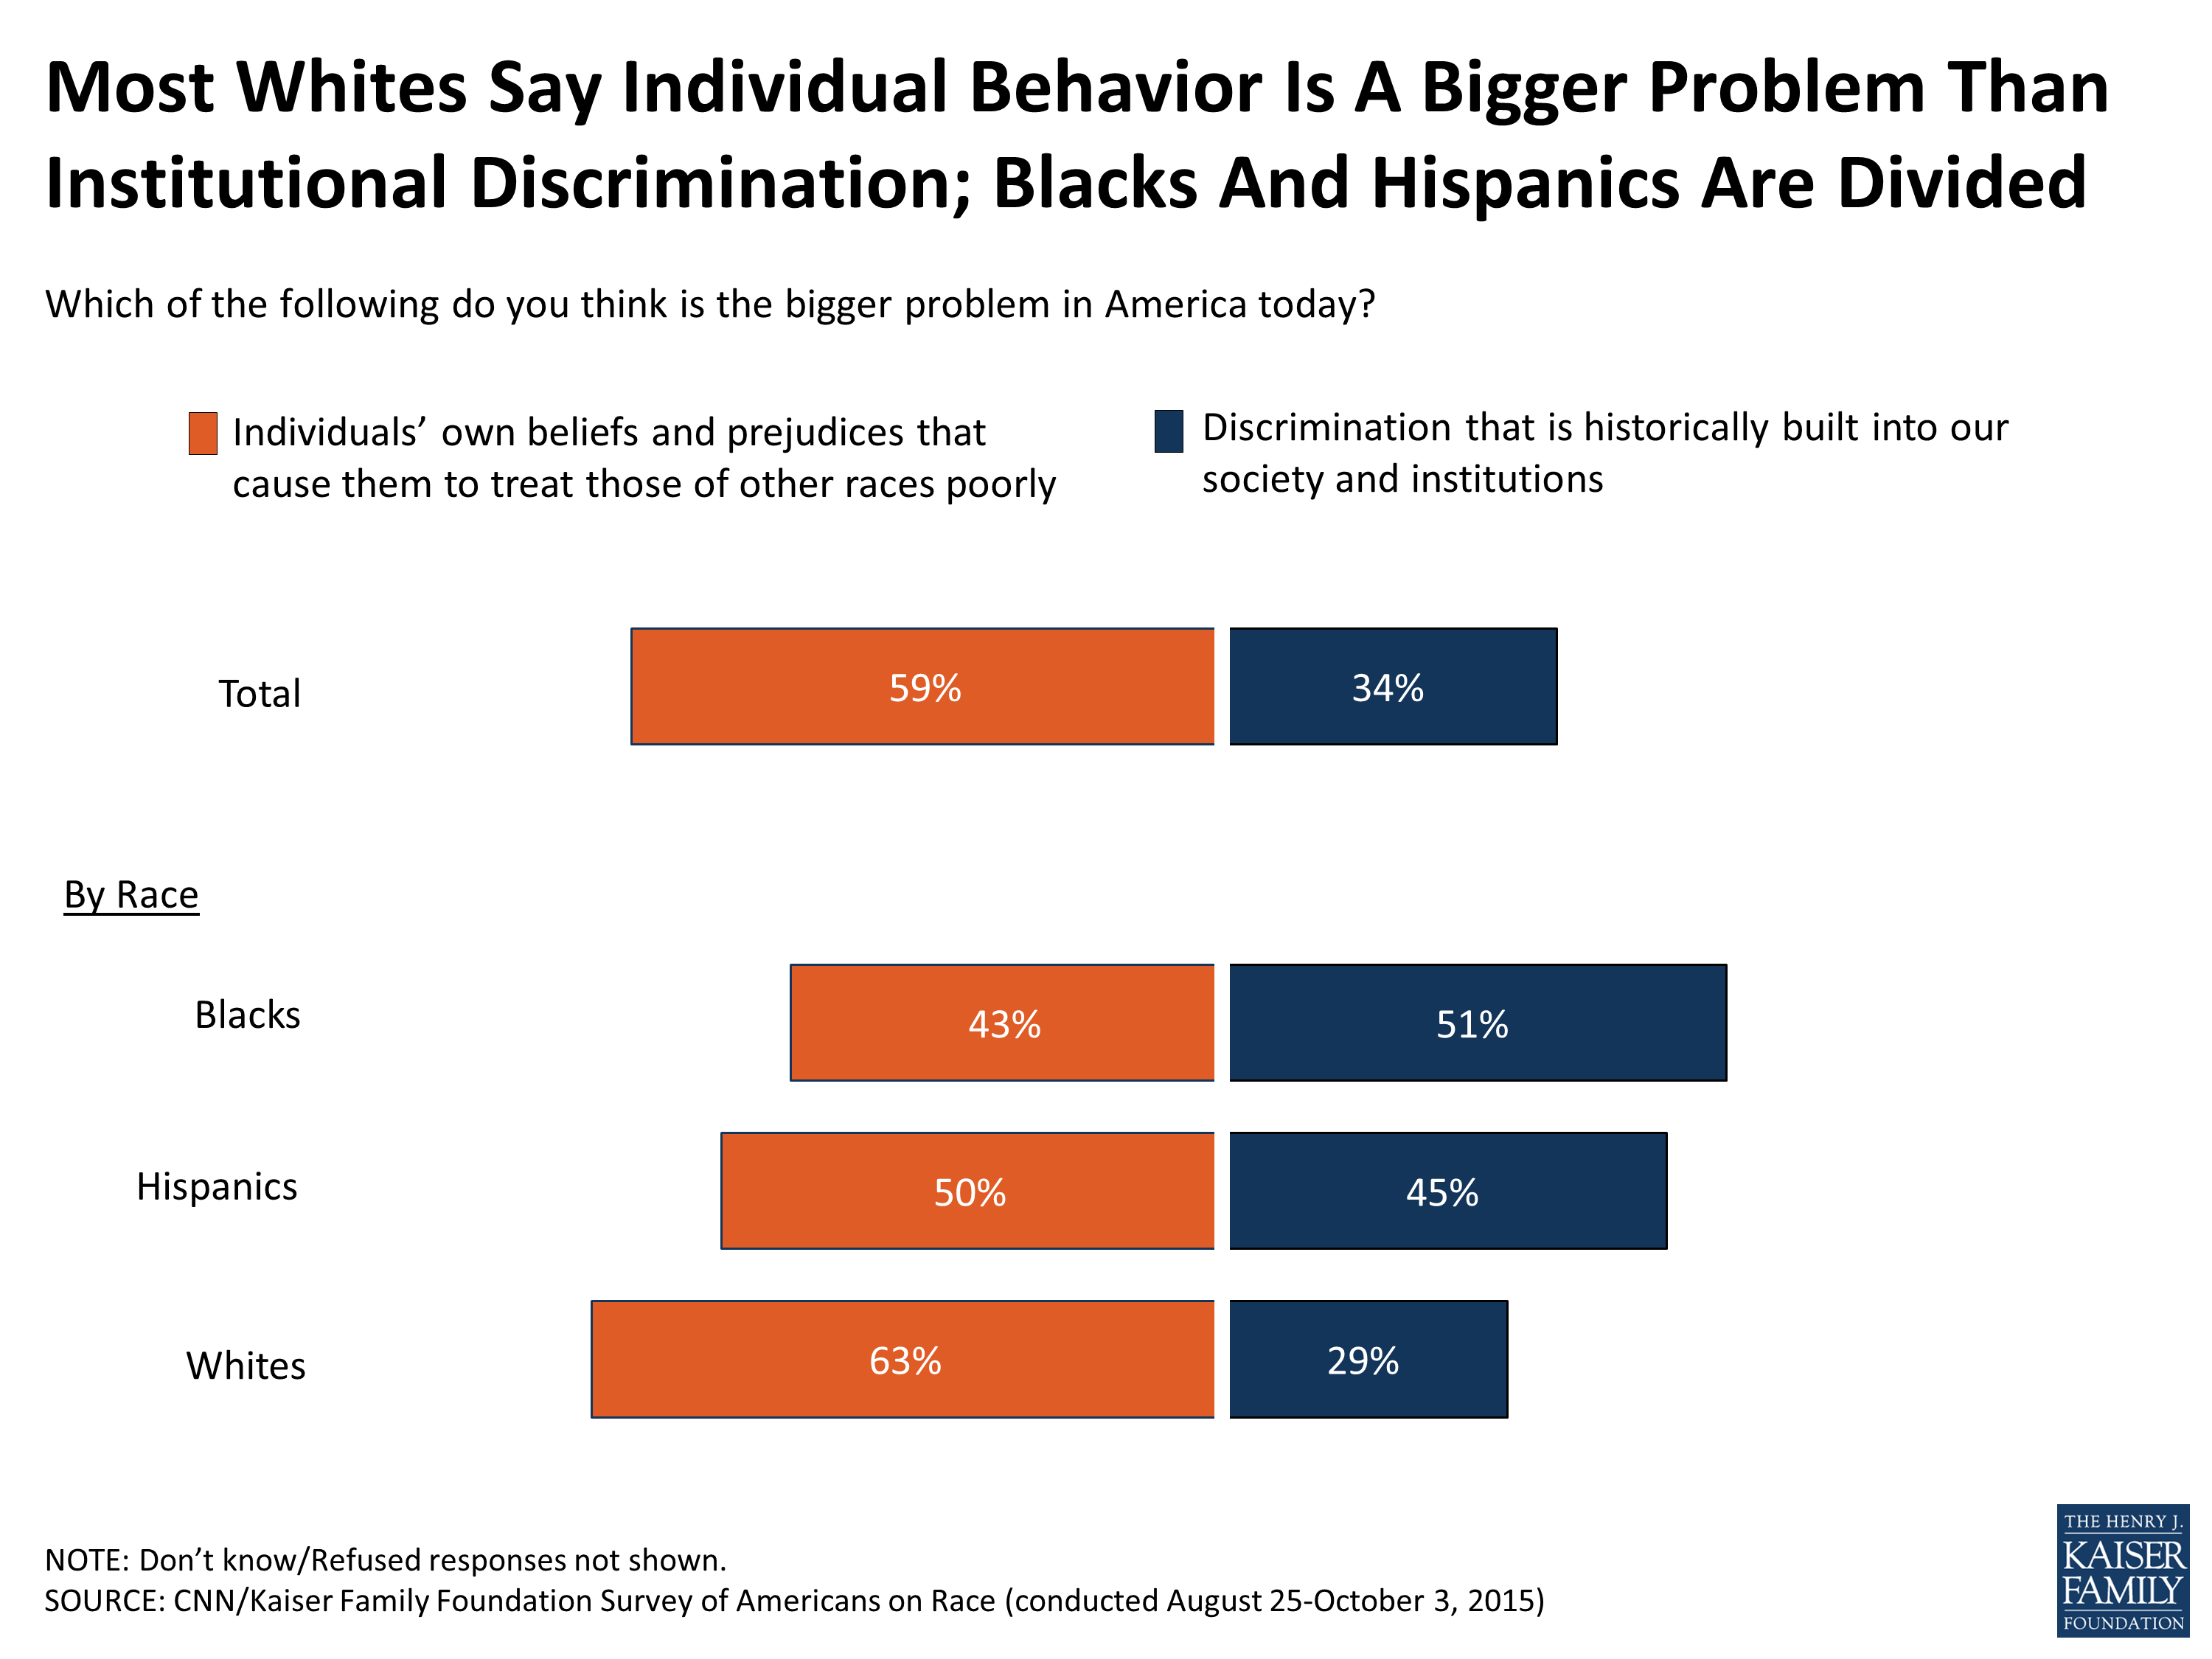
Figure 15
Echoing the majority view that the bigger problem is in individuals personal beliefs and prejudices, more than 8 in 10 (85 percent) Americans see individuals themselves playing a major role in improving race relations in the U.S., higher than the shares that say other groups should play a major role such as their local governments (54 percent), the federal government (50 percent), or the news media (50 percent). With the exception of individual responsibility, Whites are much less likely than Blacks and Hispanics to say that local government, federal government or the news media should play a major role in improving race relations, and are more likely to say that role should be minor or that they should play no role at all.
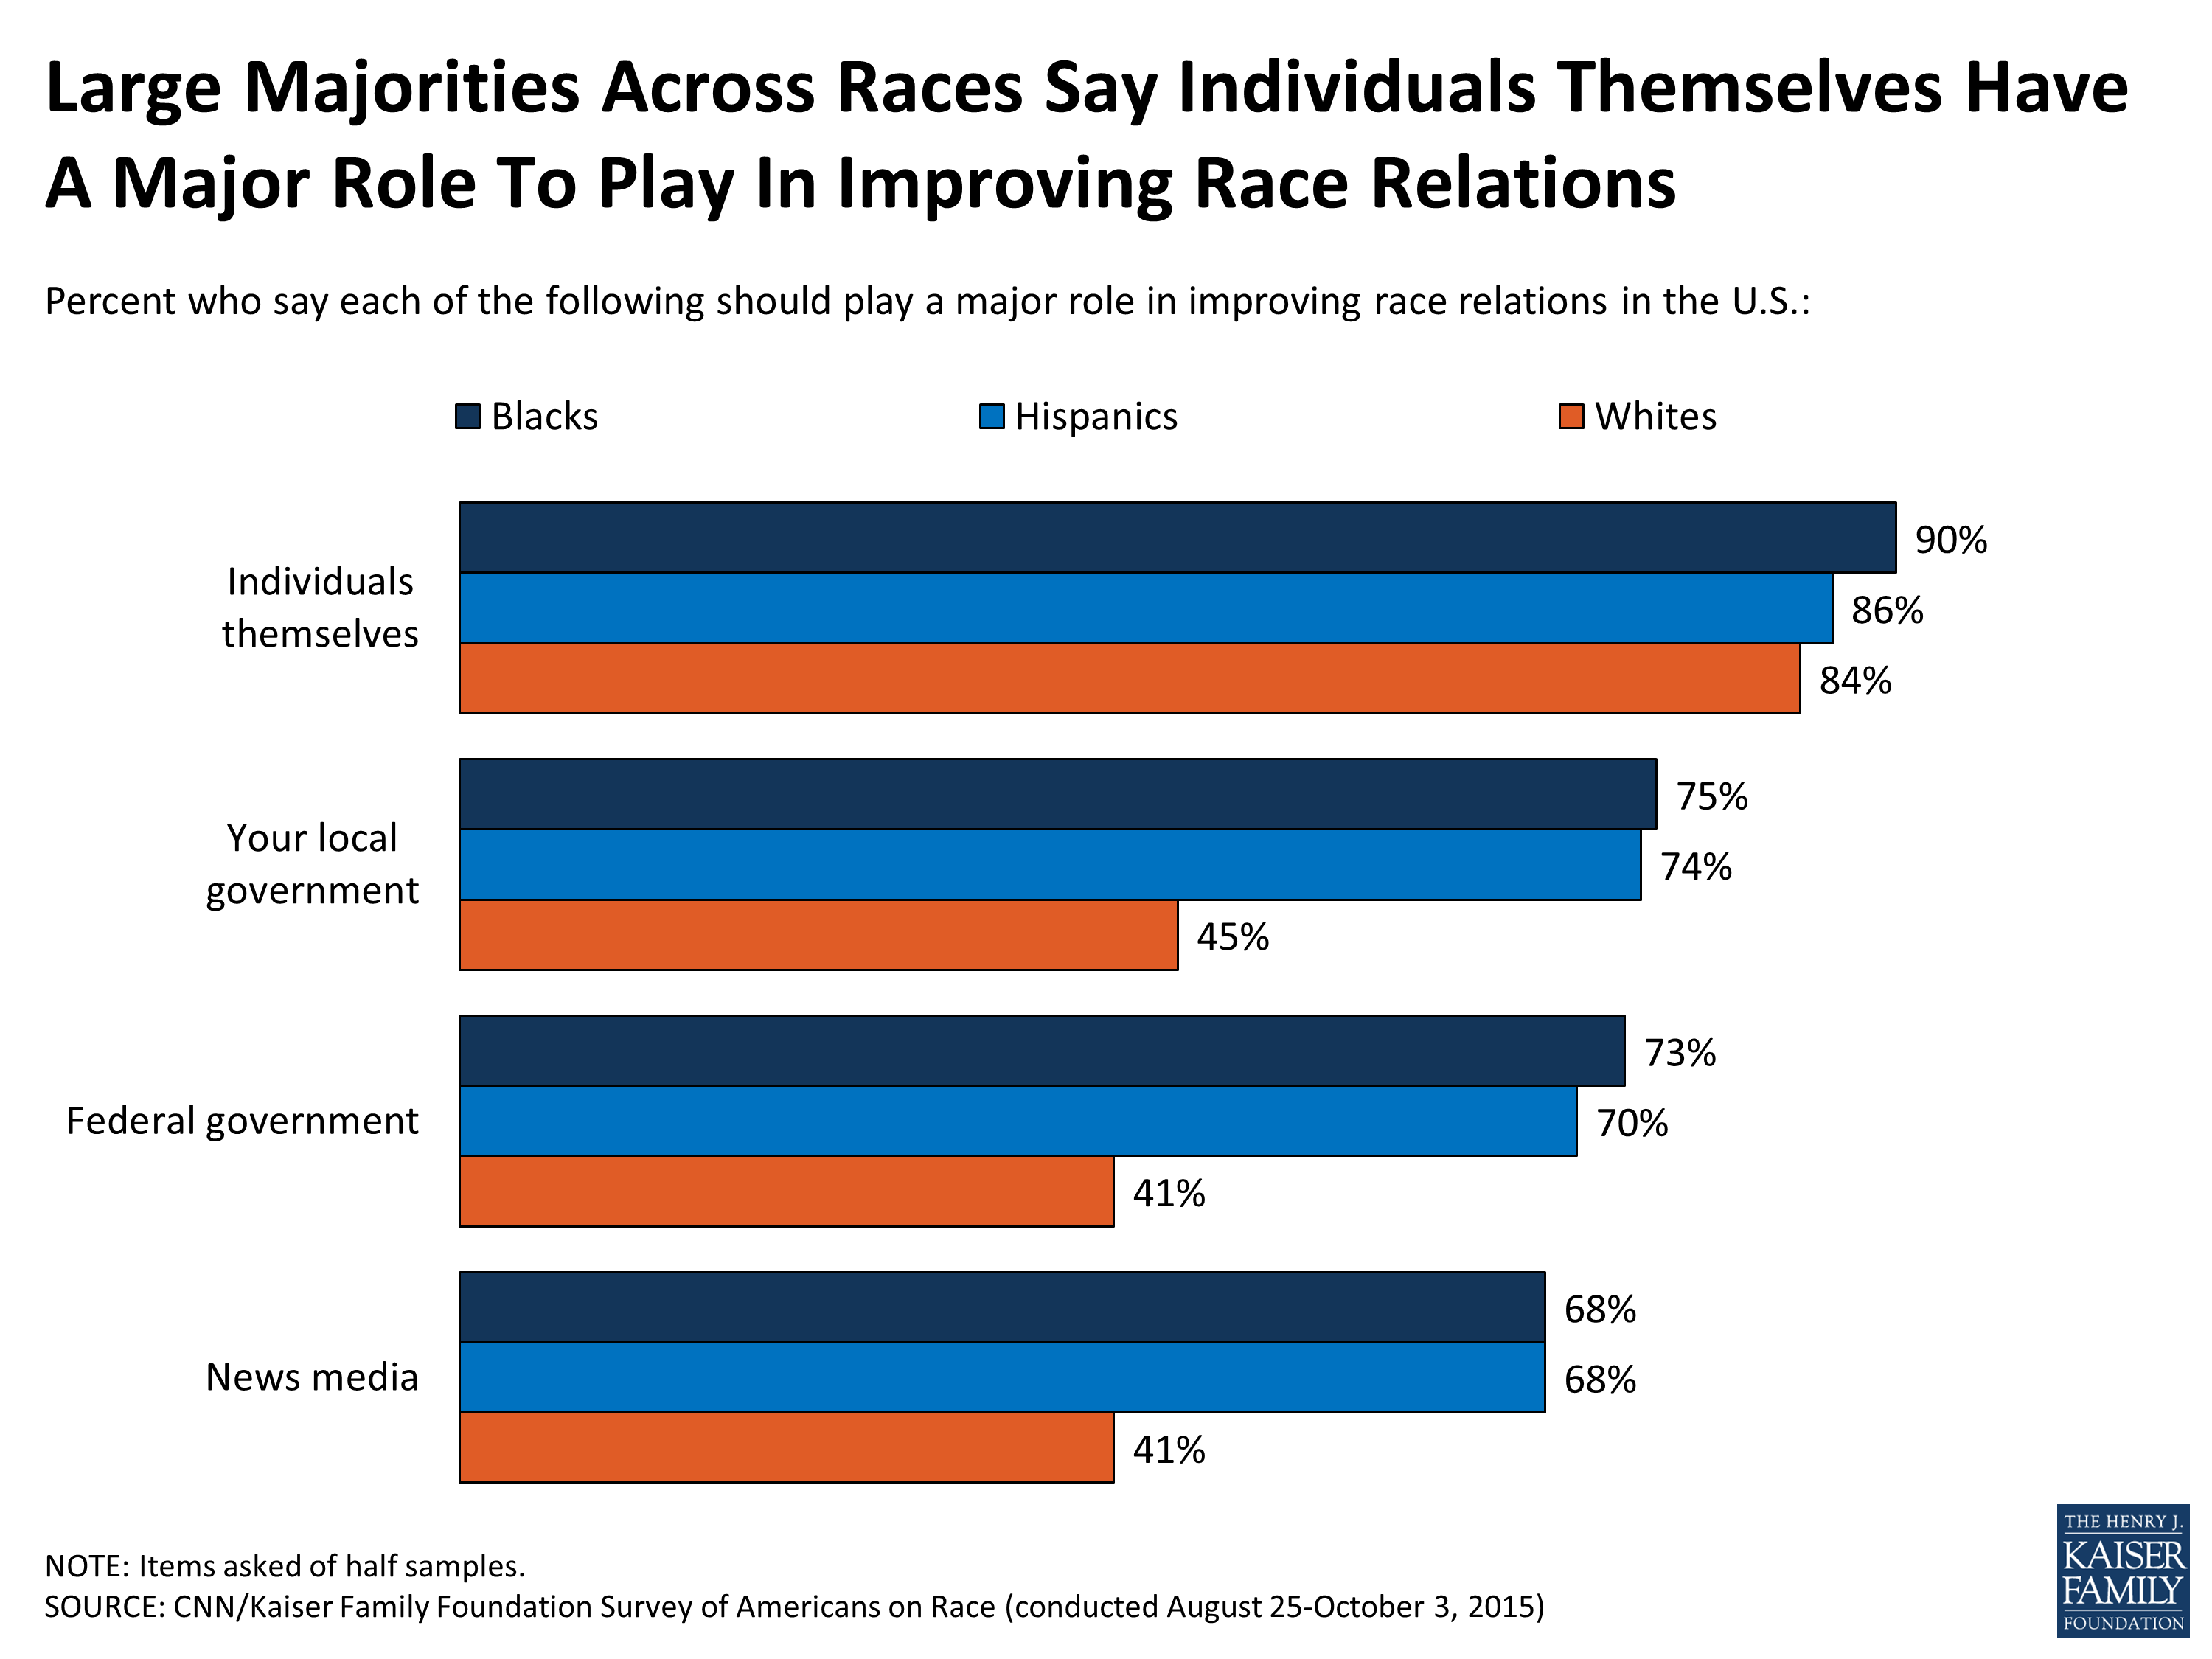
Figure 16
Moreover, while half of Americans say the federal government should play a major role in improving race relations, majorities say it is the government’s responsibility to make sure members of minority groups have schools of equal quality and equal treatment by the courts and police, including roughly 6 in 10 Whites and 8 in 10 Blacks and Hispanics. However, when it comes to whether or not the federal government is responsible for ensuring that minorities have equal incomes to Whites, the public is divided (47 percent say it is versus 49 percent who say it is not). There are distinct differences by race on this issue, as more than 6 in 10 Blacks (67 percent) and Hispanics (63 percent) say it is the responsibility of the federal government to ensure income equality, while nearly as many Whites say it is not (57 percent).
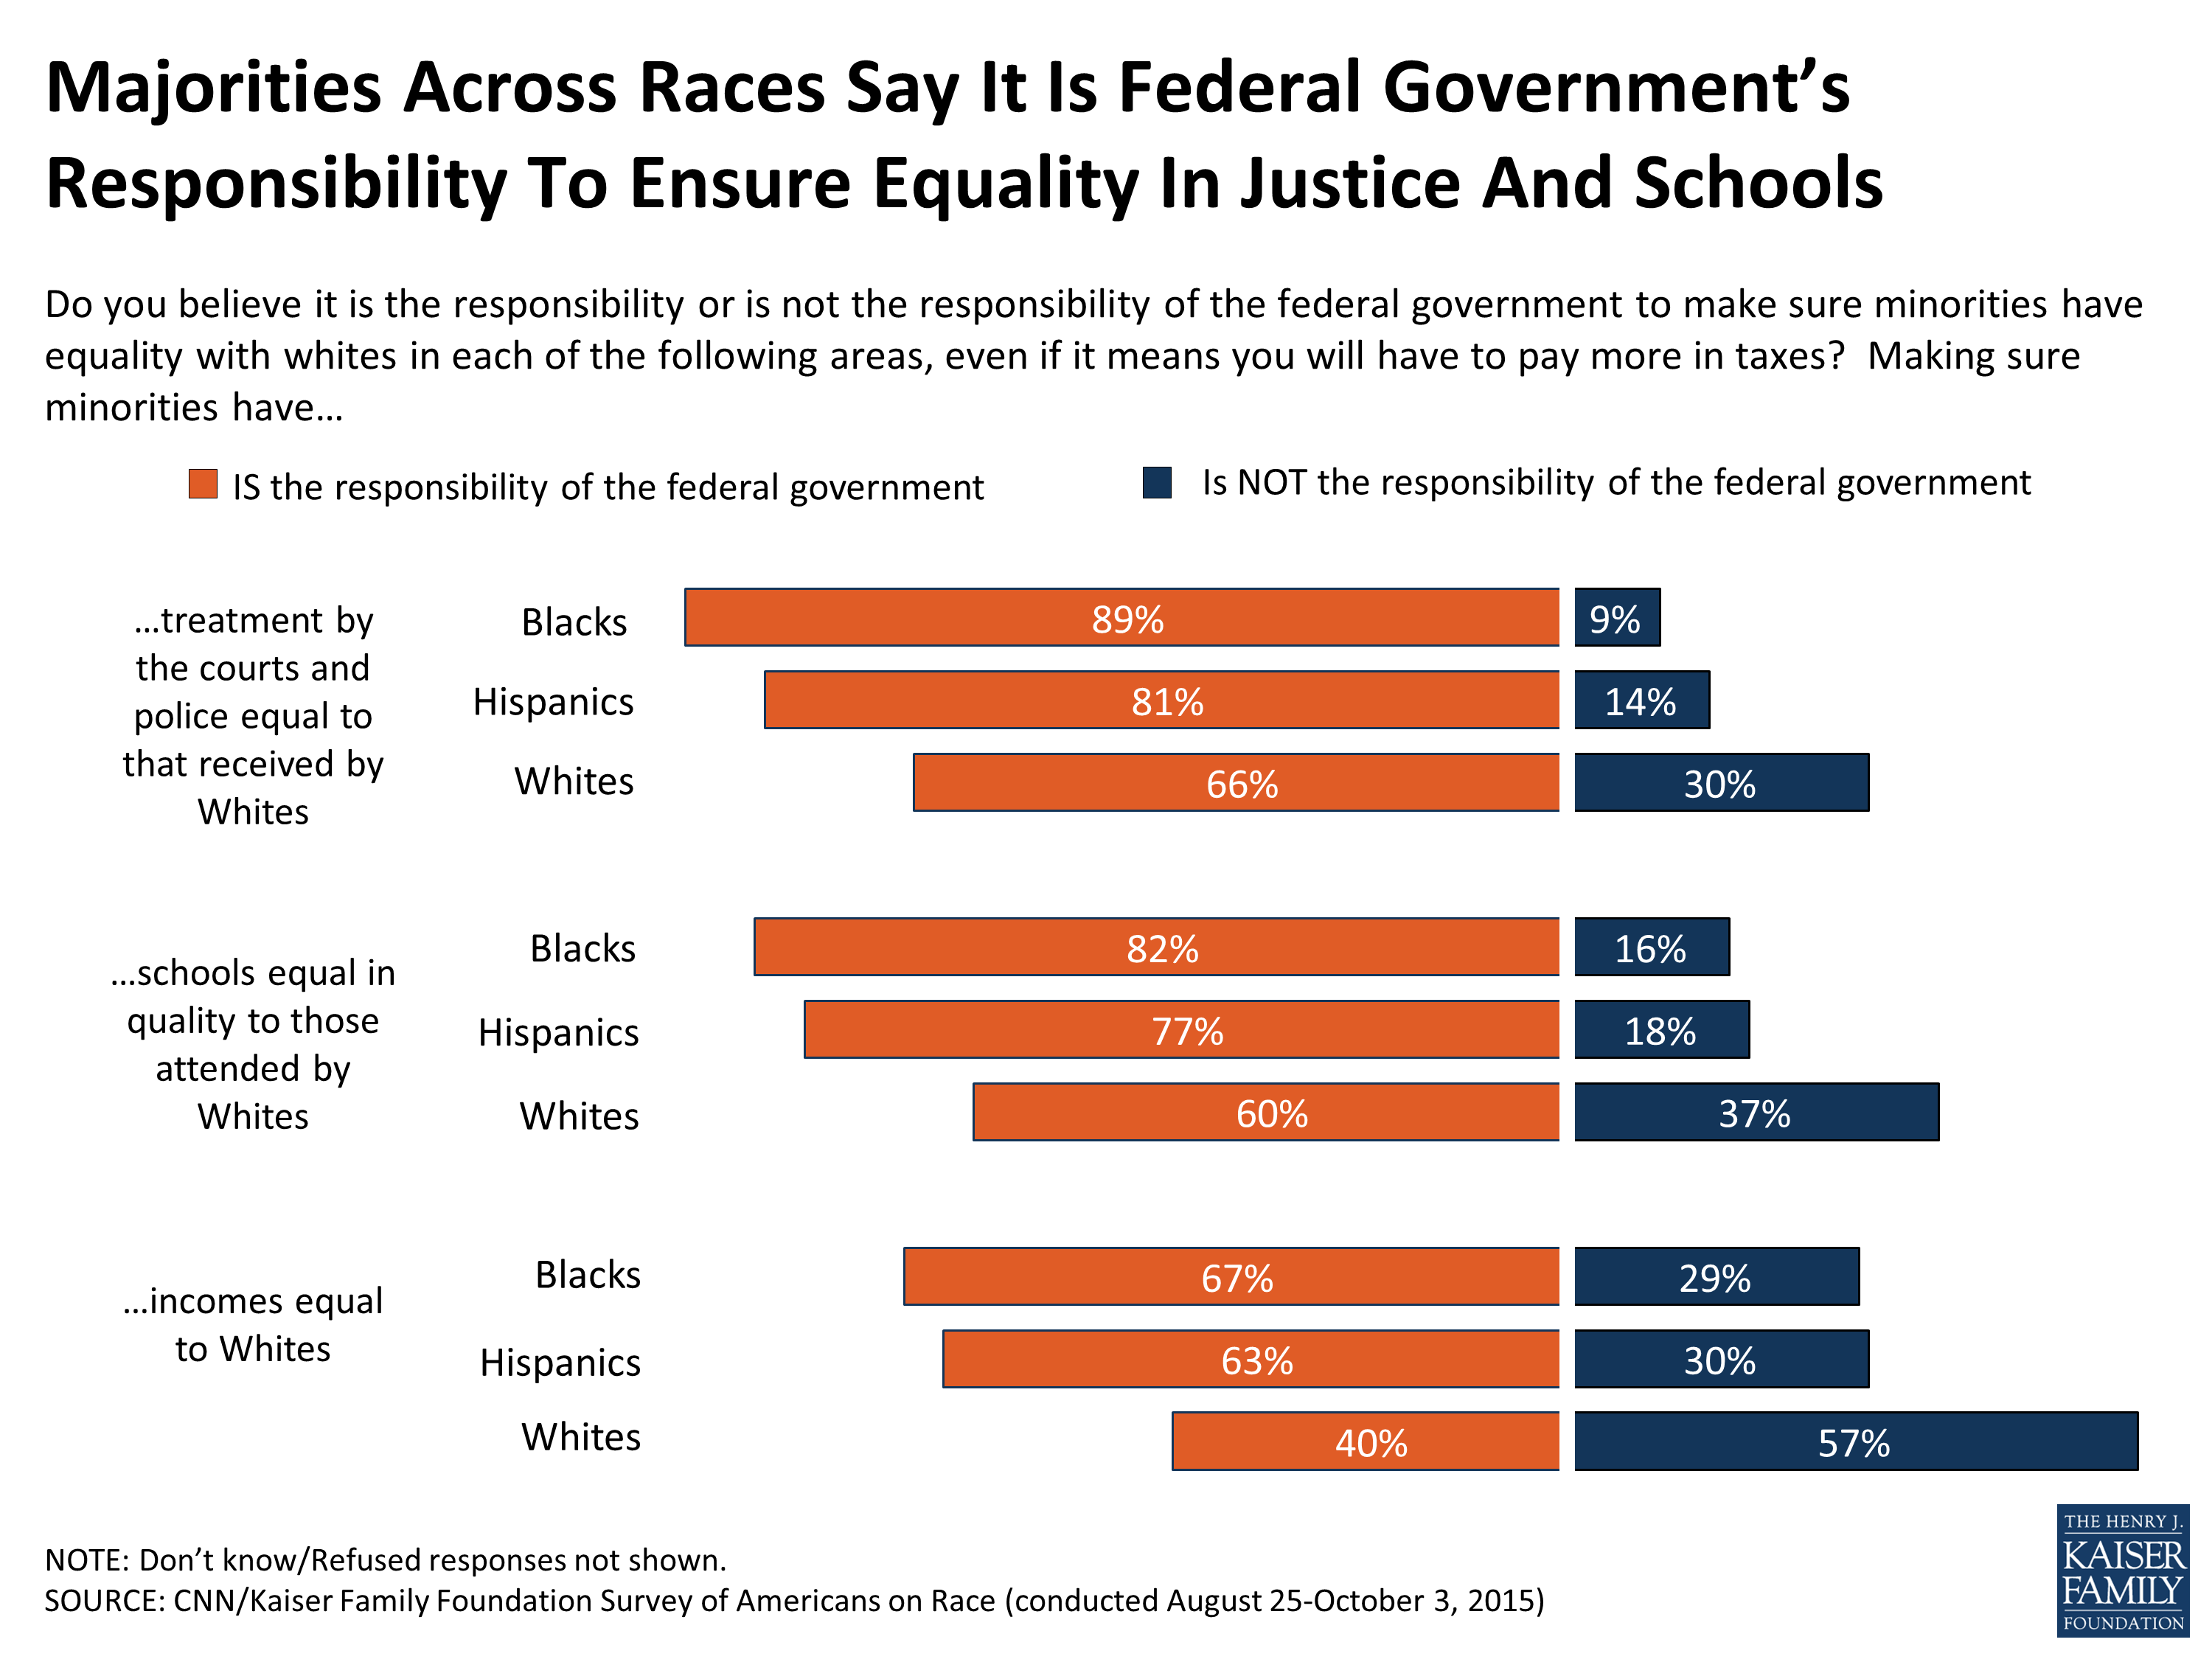
Figure 17
Cash reparations – cash payments to Black Americans who are descendants of slaves – are one way some have suggested the government can help make up for the harm caused by slavery. More than half of Black Americans (52 percent) say the government should make such cash payments, while White Americans are overwhelmingly opposed to the idea (89 percent) and few support it (8 percent).
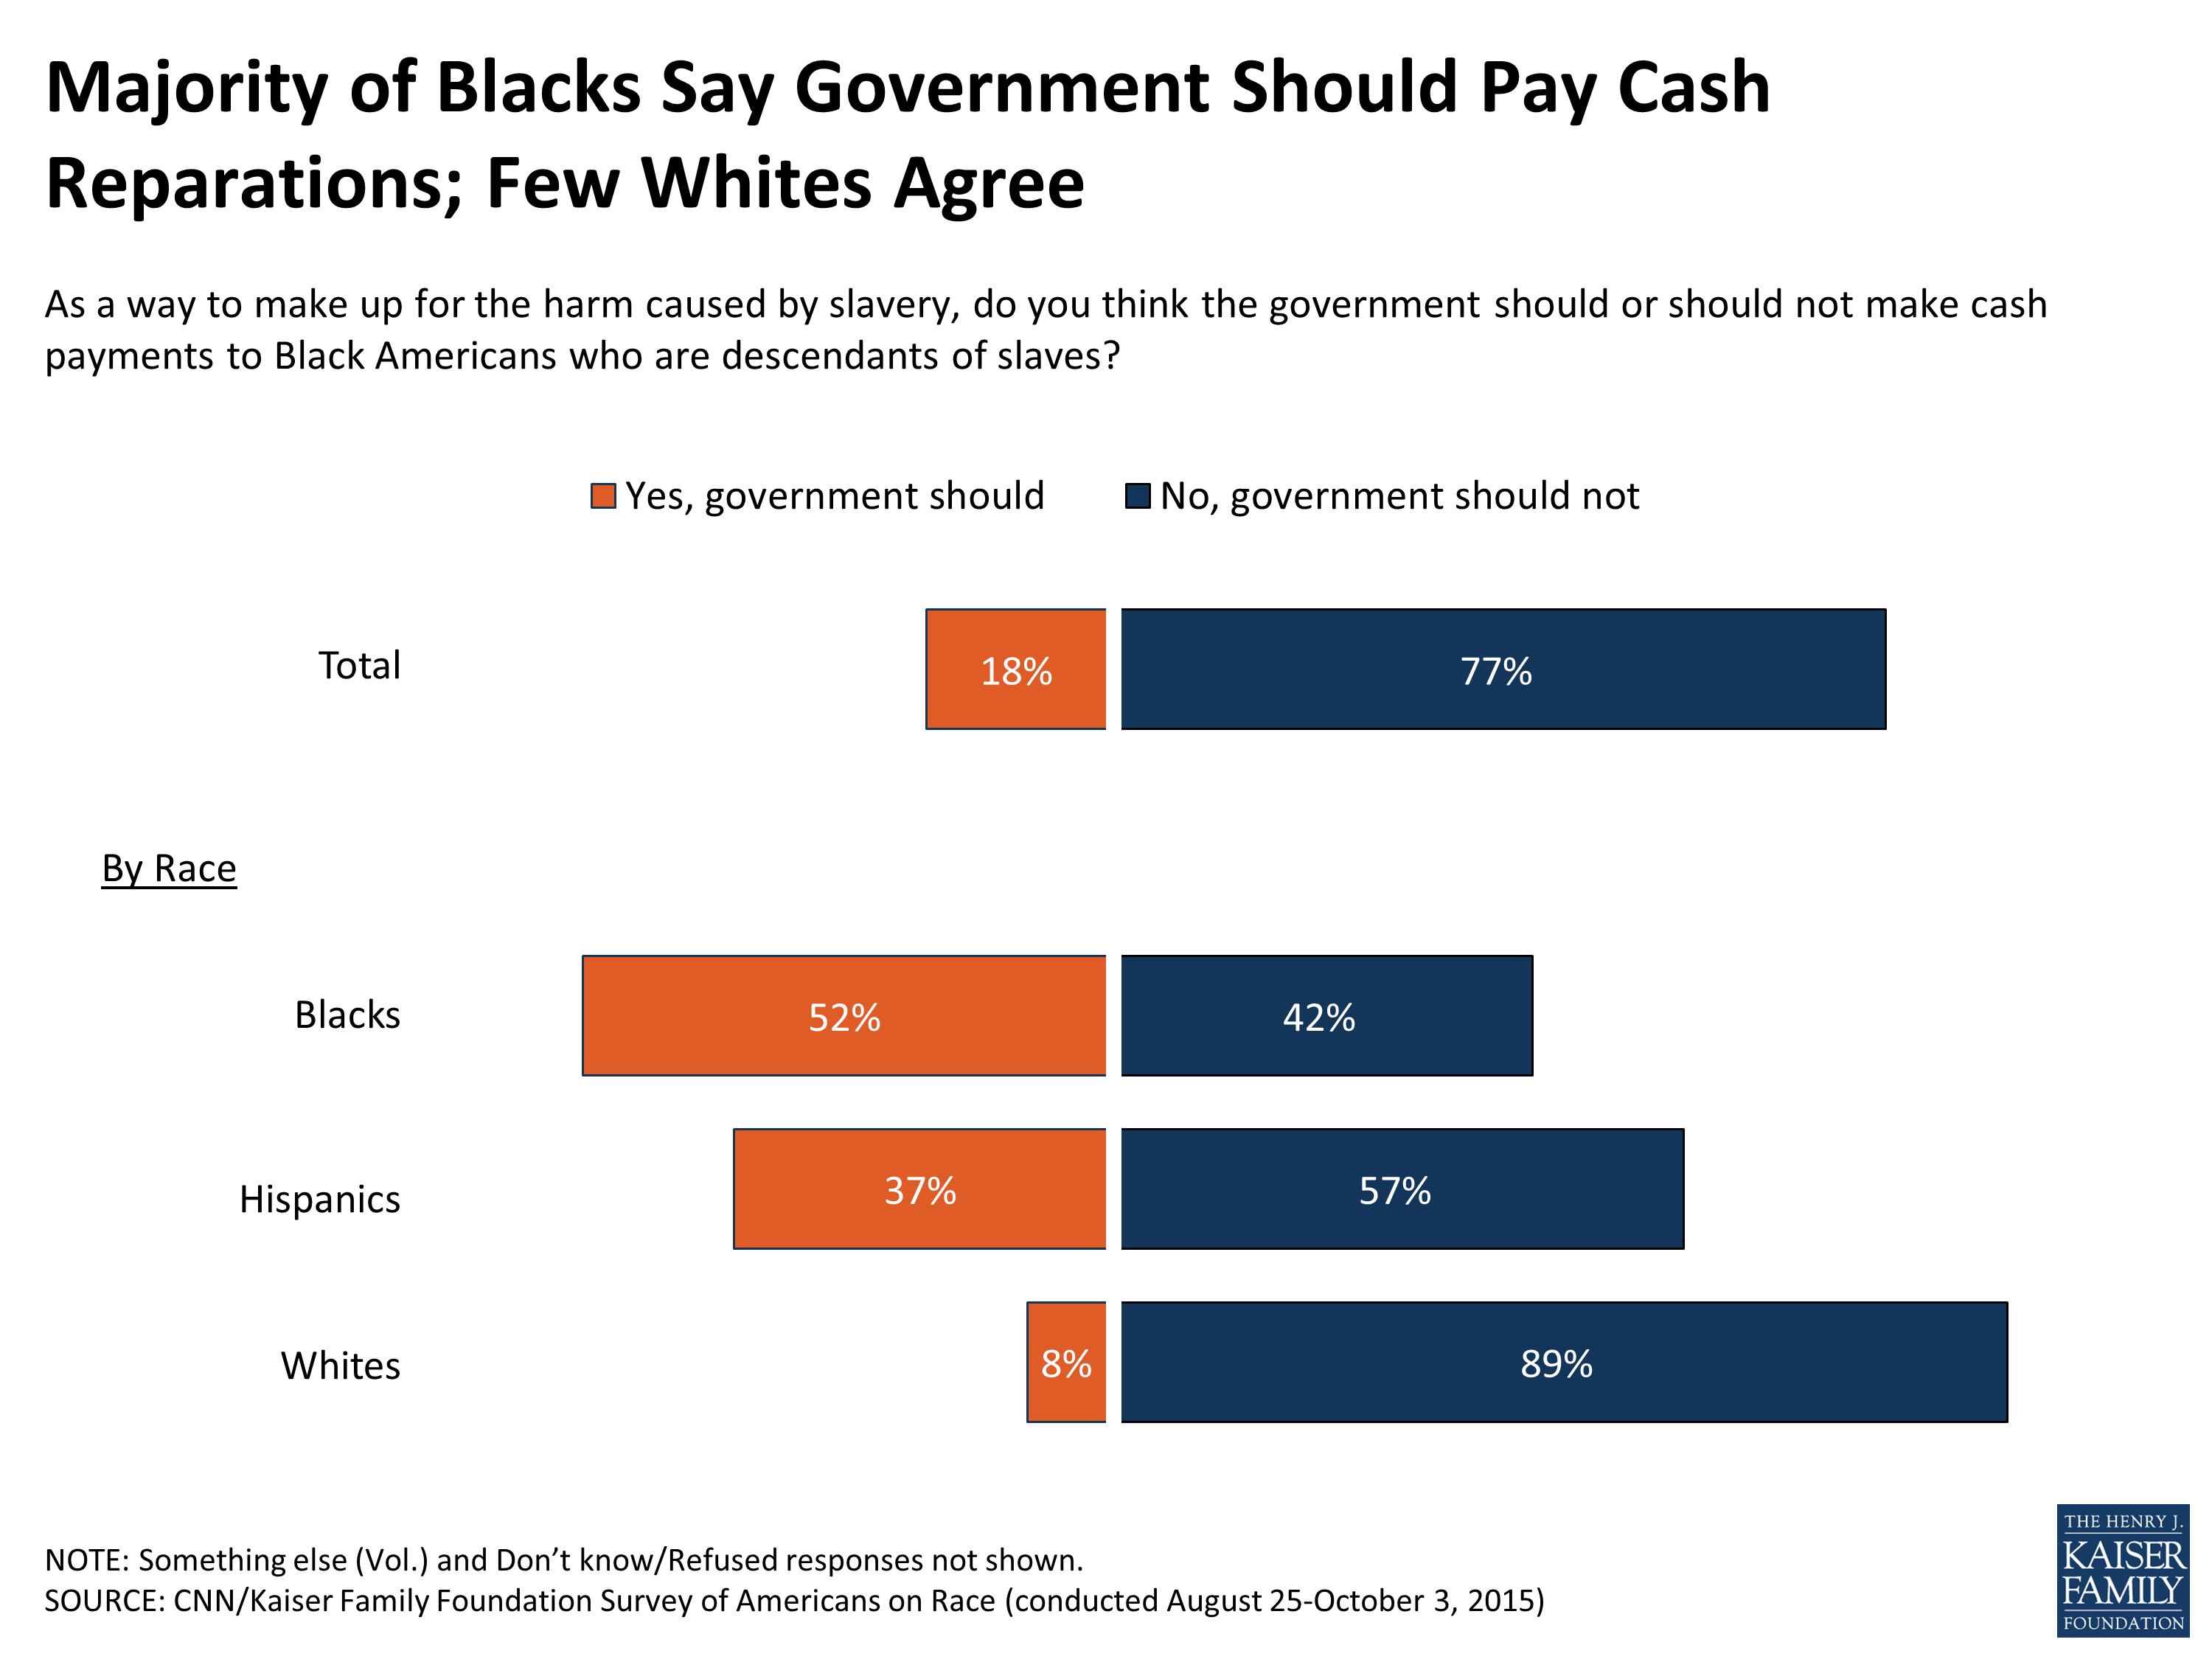
Figure 18
Political Representation and Presidential Election Campaigns
Looking forward to the 2016 presidential election and who will head the federal government moving forward, there is little consensus about whether the campaigns so far are dedicating too much or too little attention to issues of race. Black Americans are fairly divided across the board, with roughly a third saying the issue has gotten too much (35 percent), too little (34 percent), or the right amount of attention (28 percent). Nearly half of Hispanics (48 percent) say the issue has gotten too much attention in the presidential campaigns, while roughly four in ten Whites (43 percent) say the amount of attention is about right.
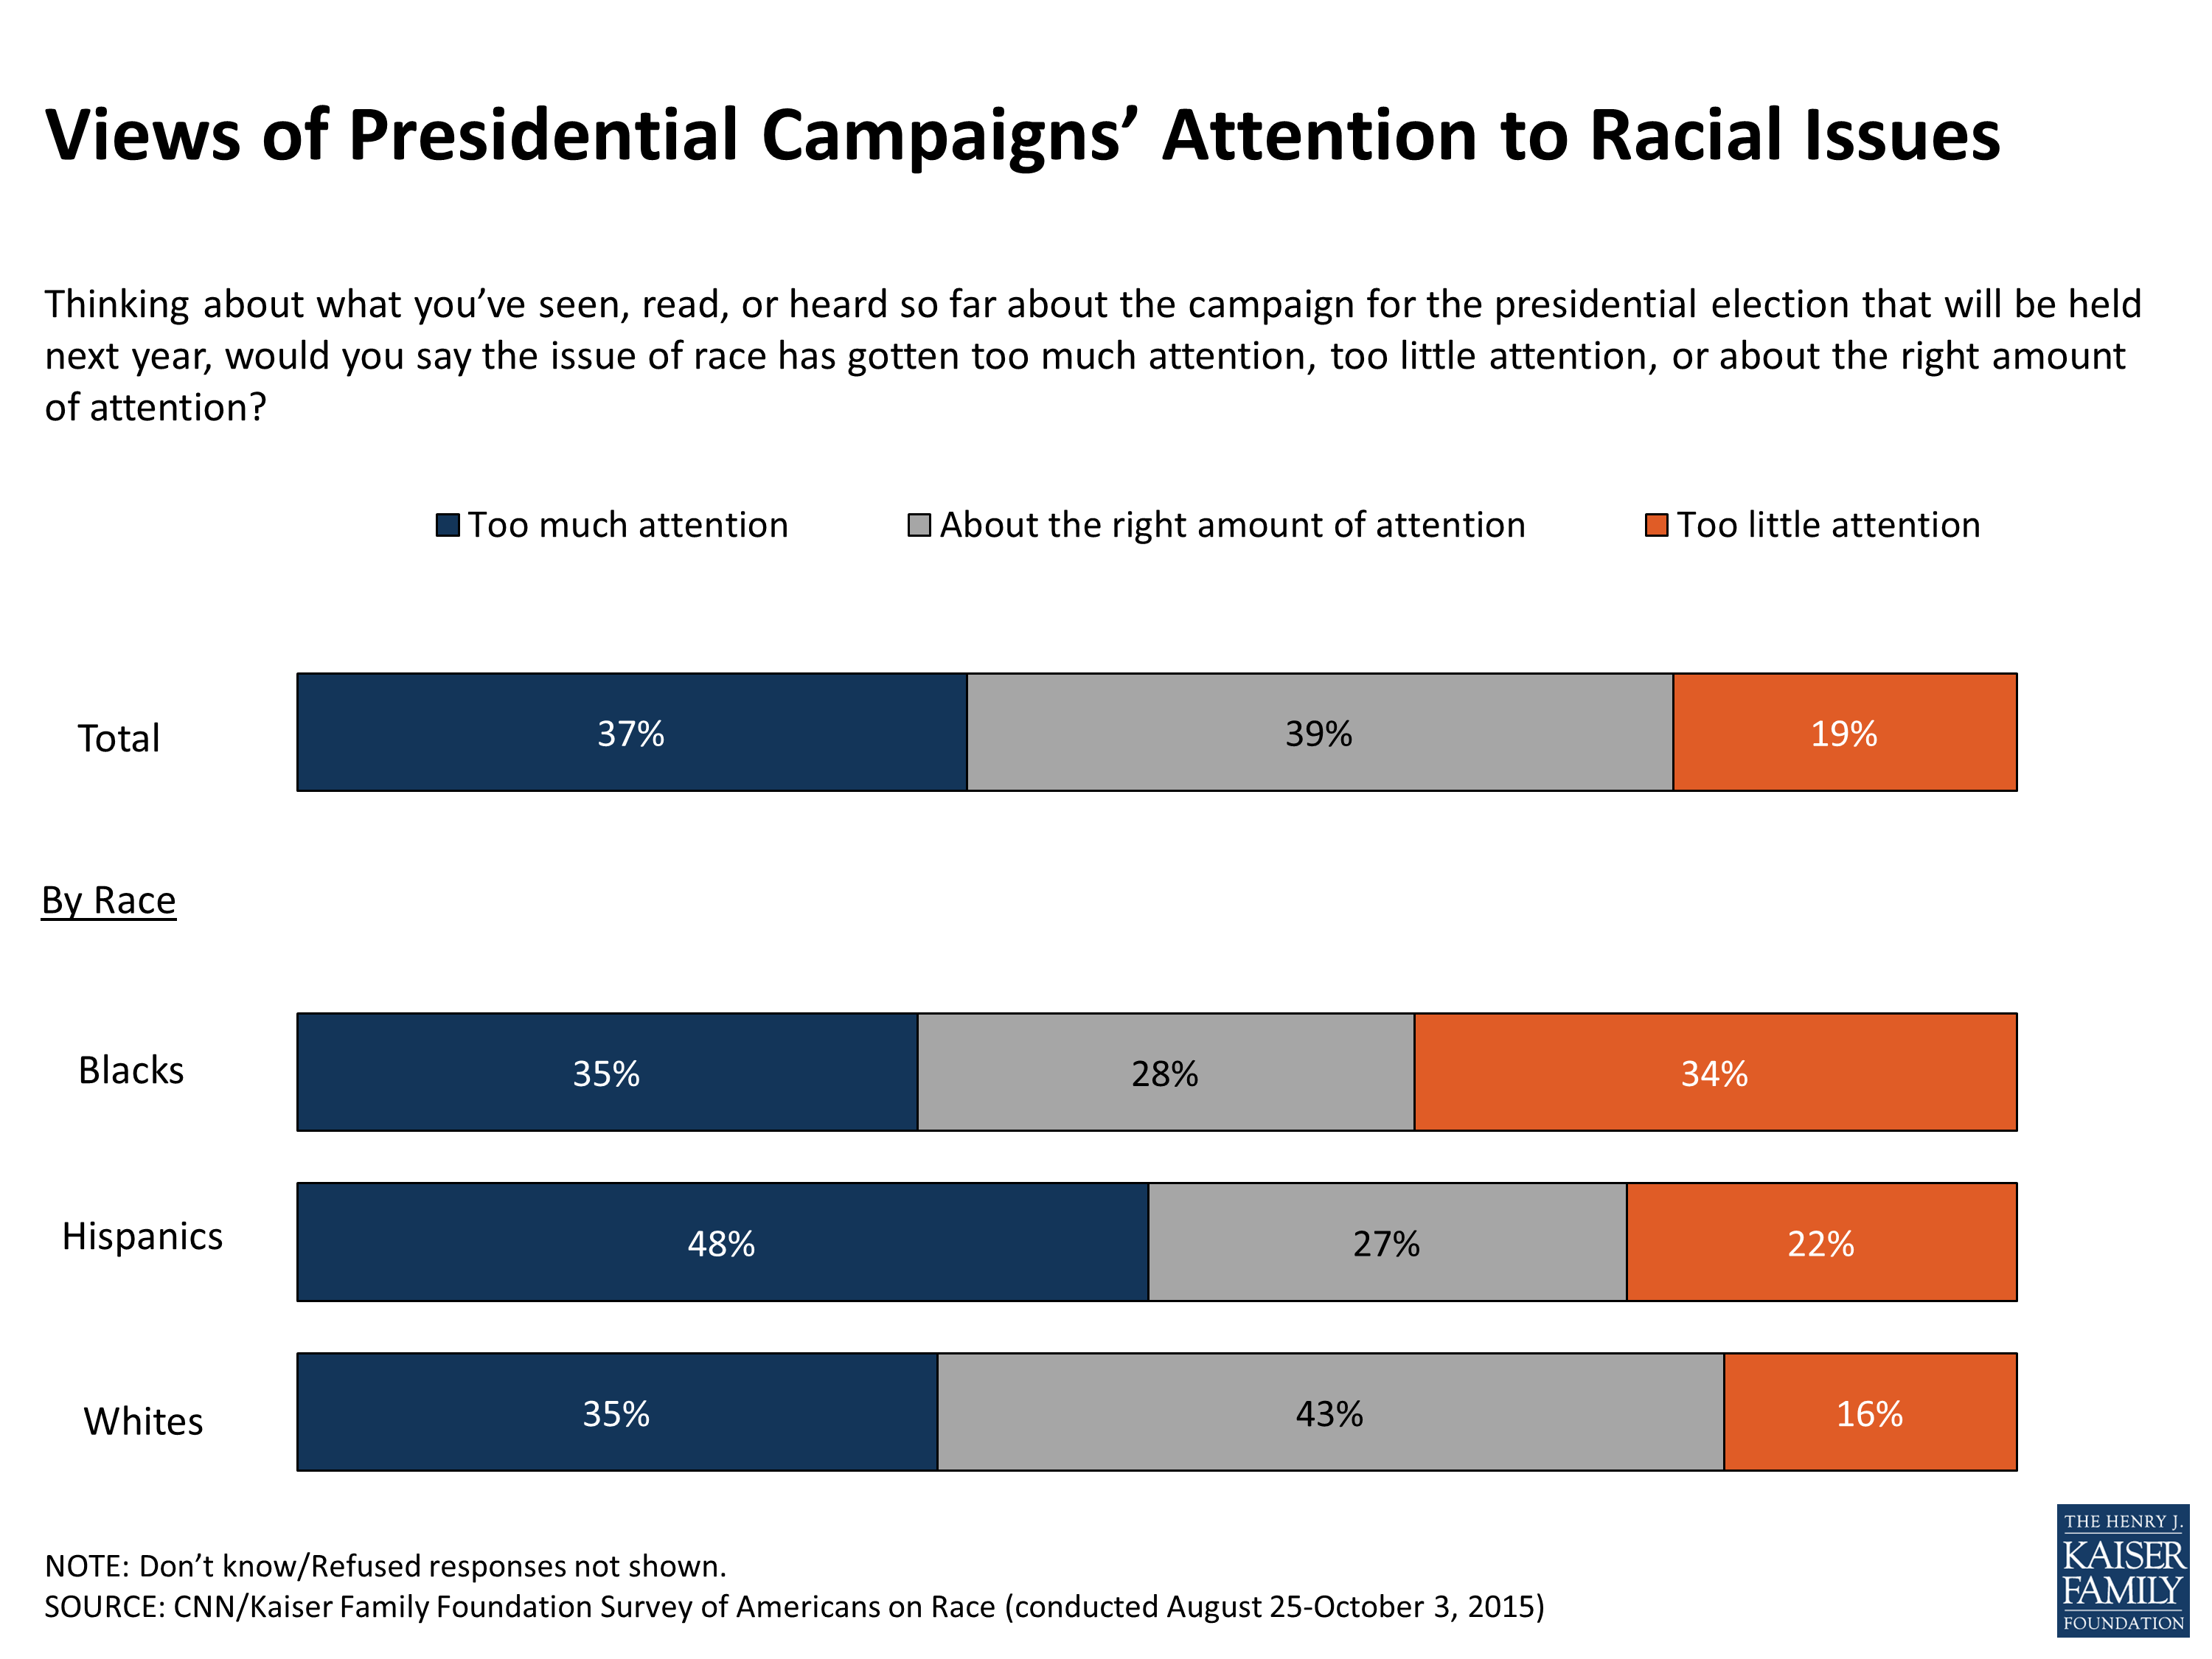
Figure 19
More generally, a majority of the public says that the Democratic Party has become more representative of the interests of racial minorities in recent years, while the Republican Party is becoming less so. This is one place where White and Black Americans agree – 56 percent of Blacks and 51 percent of Whites say the Democratic Party has become more representative in the past few years. Though when it comes to the Republican Party, fully two-thirds of Black Americans (67 percent) and about half of White Americans (52 percent) say the Party has become less representative of the needs of racial minority groups. Although Hispanic Americans are roughly split regarding the Democratic Party – 48 percent say it has become more representative, while 41 percent say the opposite – nearly six in ten say that the Republican Party has become less representative of the needs of racial minority groups (59 percent).
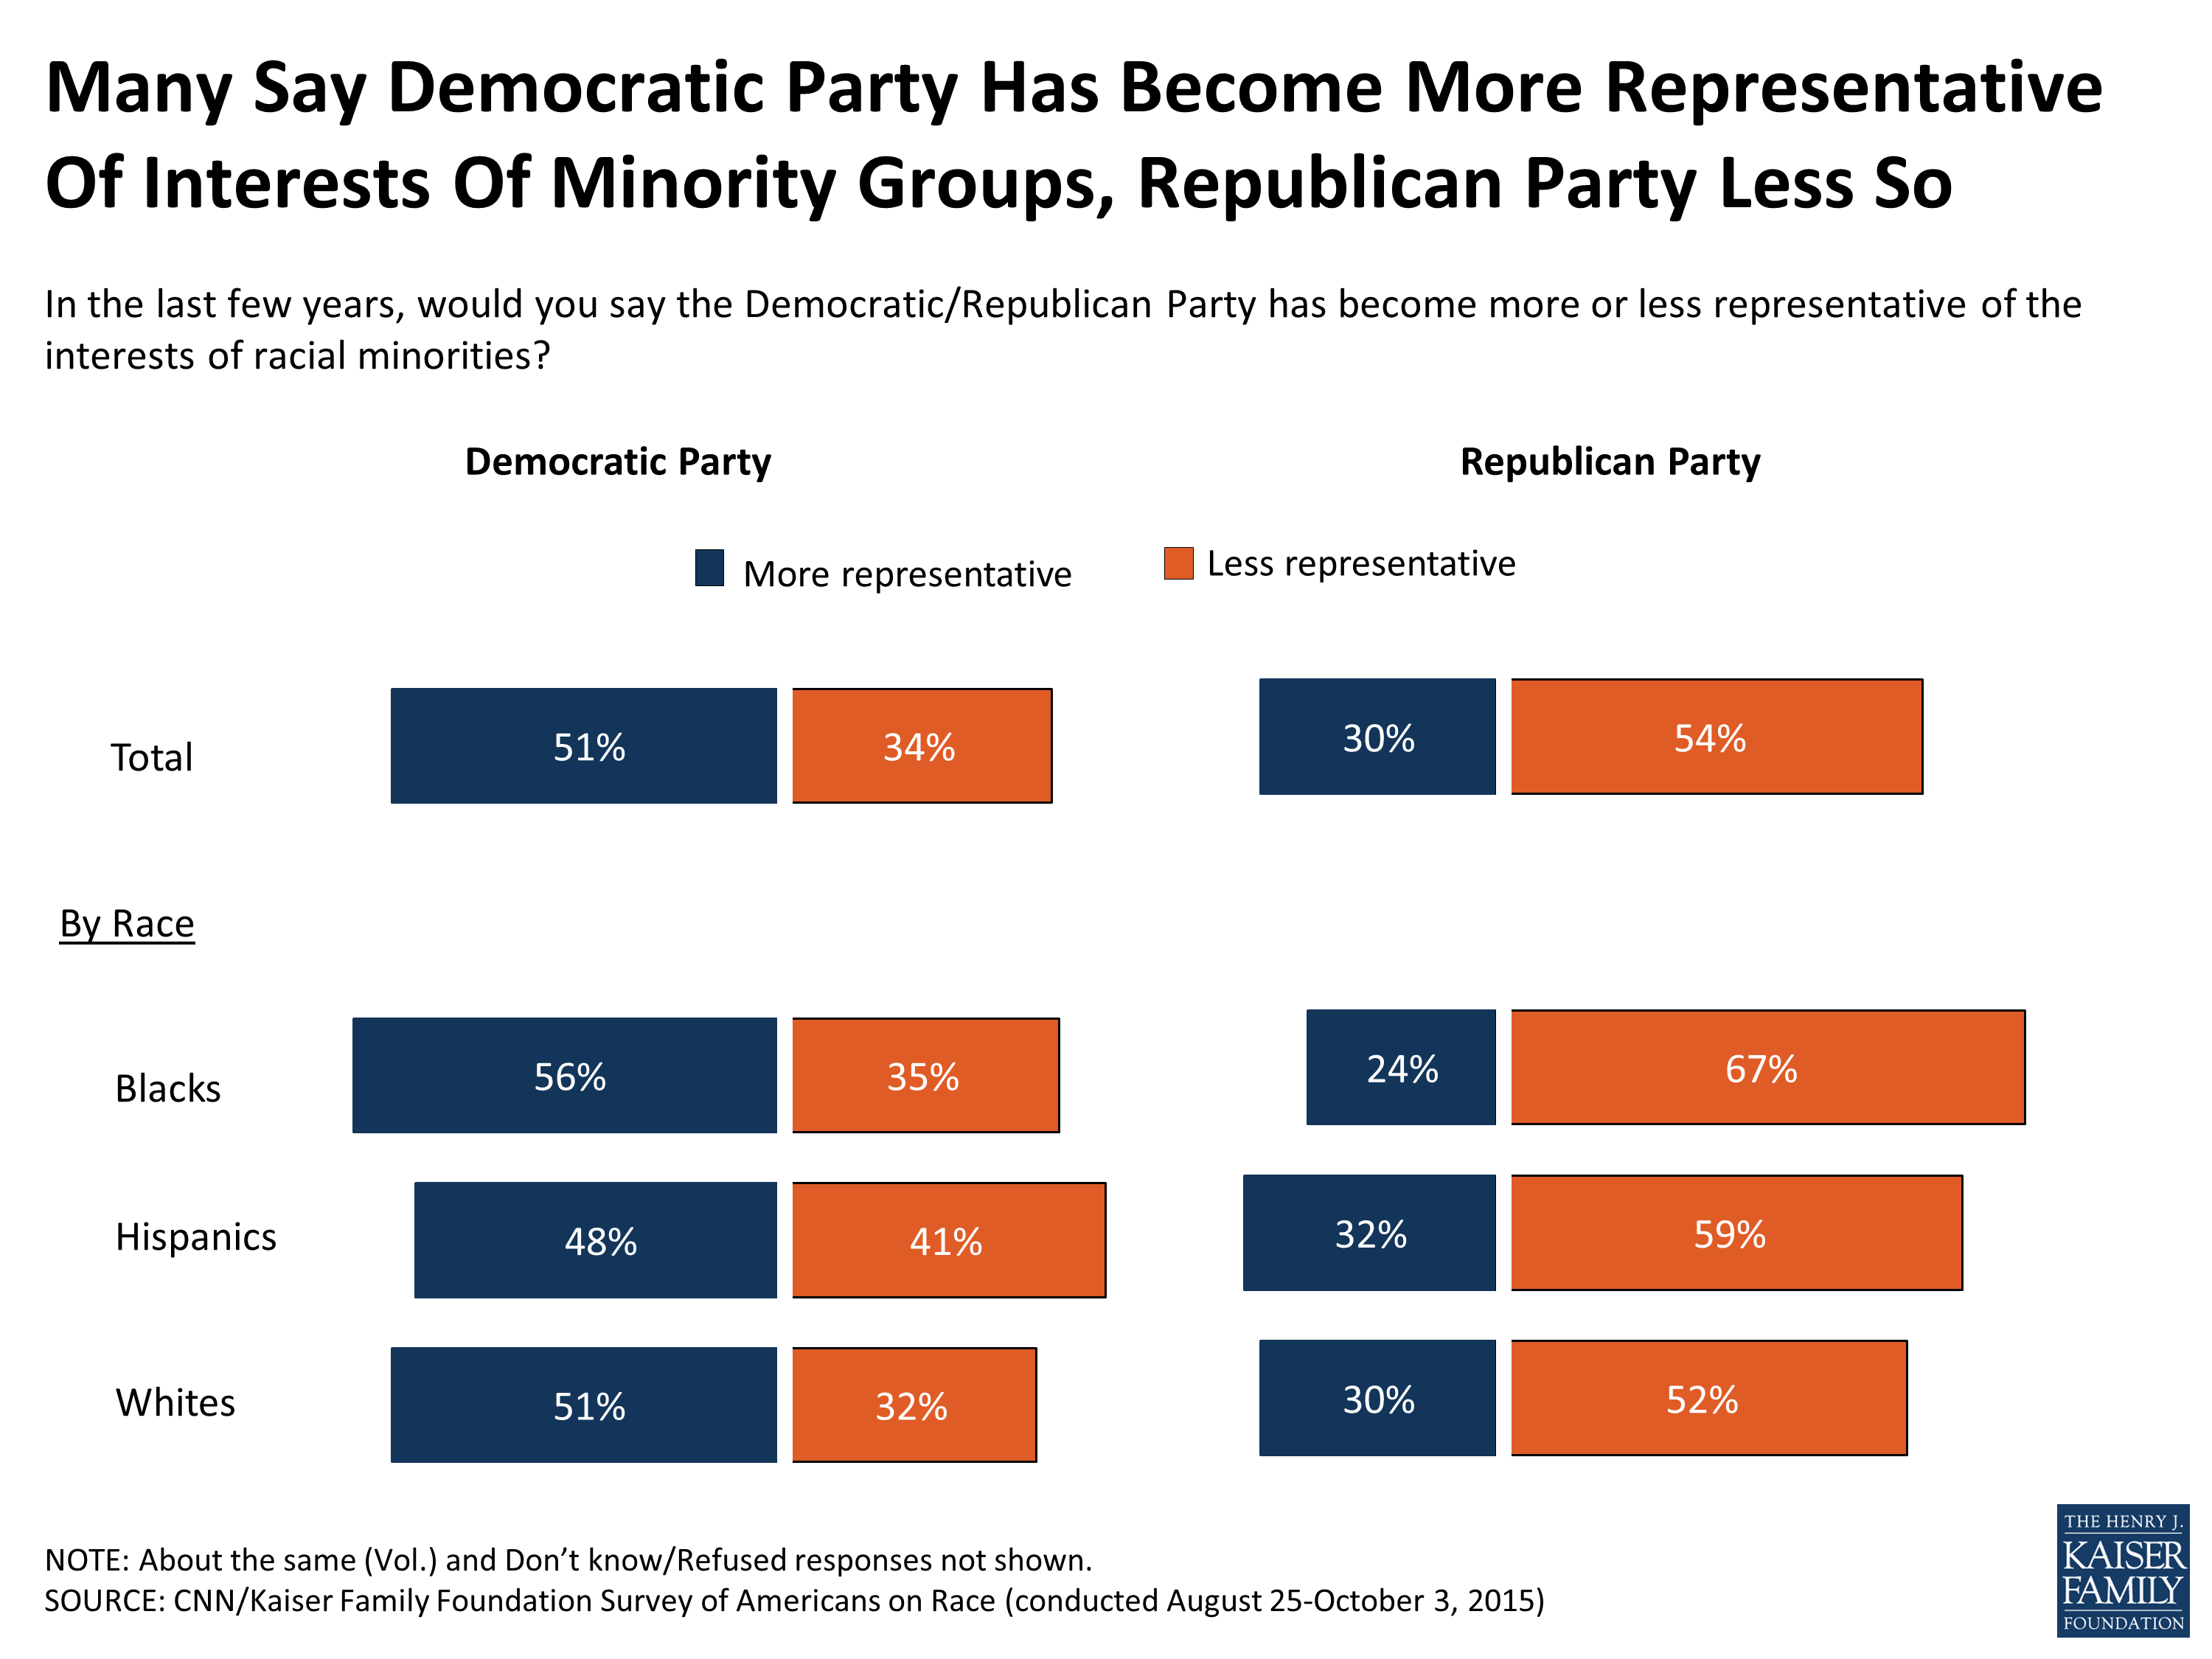
Figure 20
Section 4: Current Situations and Barriers to Advancement
Perceptions of Current Economic Circumstances
While most (65 percent) Americans say they are at least somewhat satisfied with their personal financial situation, about half of blacks (51 percent) say they are dissatisfied, compared to about 3 in 10 Whites and Hispanics (31 percent each). However, Black Americans are more likely to say that achieving the American Dream is easier for them than it was for their parents (55 percent say it is easier and 36 percent say it is harder), while Whites are more likely to say it’s harder (56 percent say harder and 35 percent say easier). Hispanics are divided with 52 percent saying it is easier now to achieve the American dream than it was for their parents and 42 percent saying it is harder.
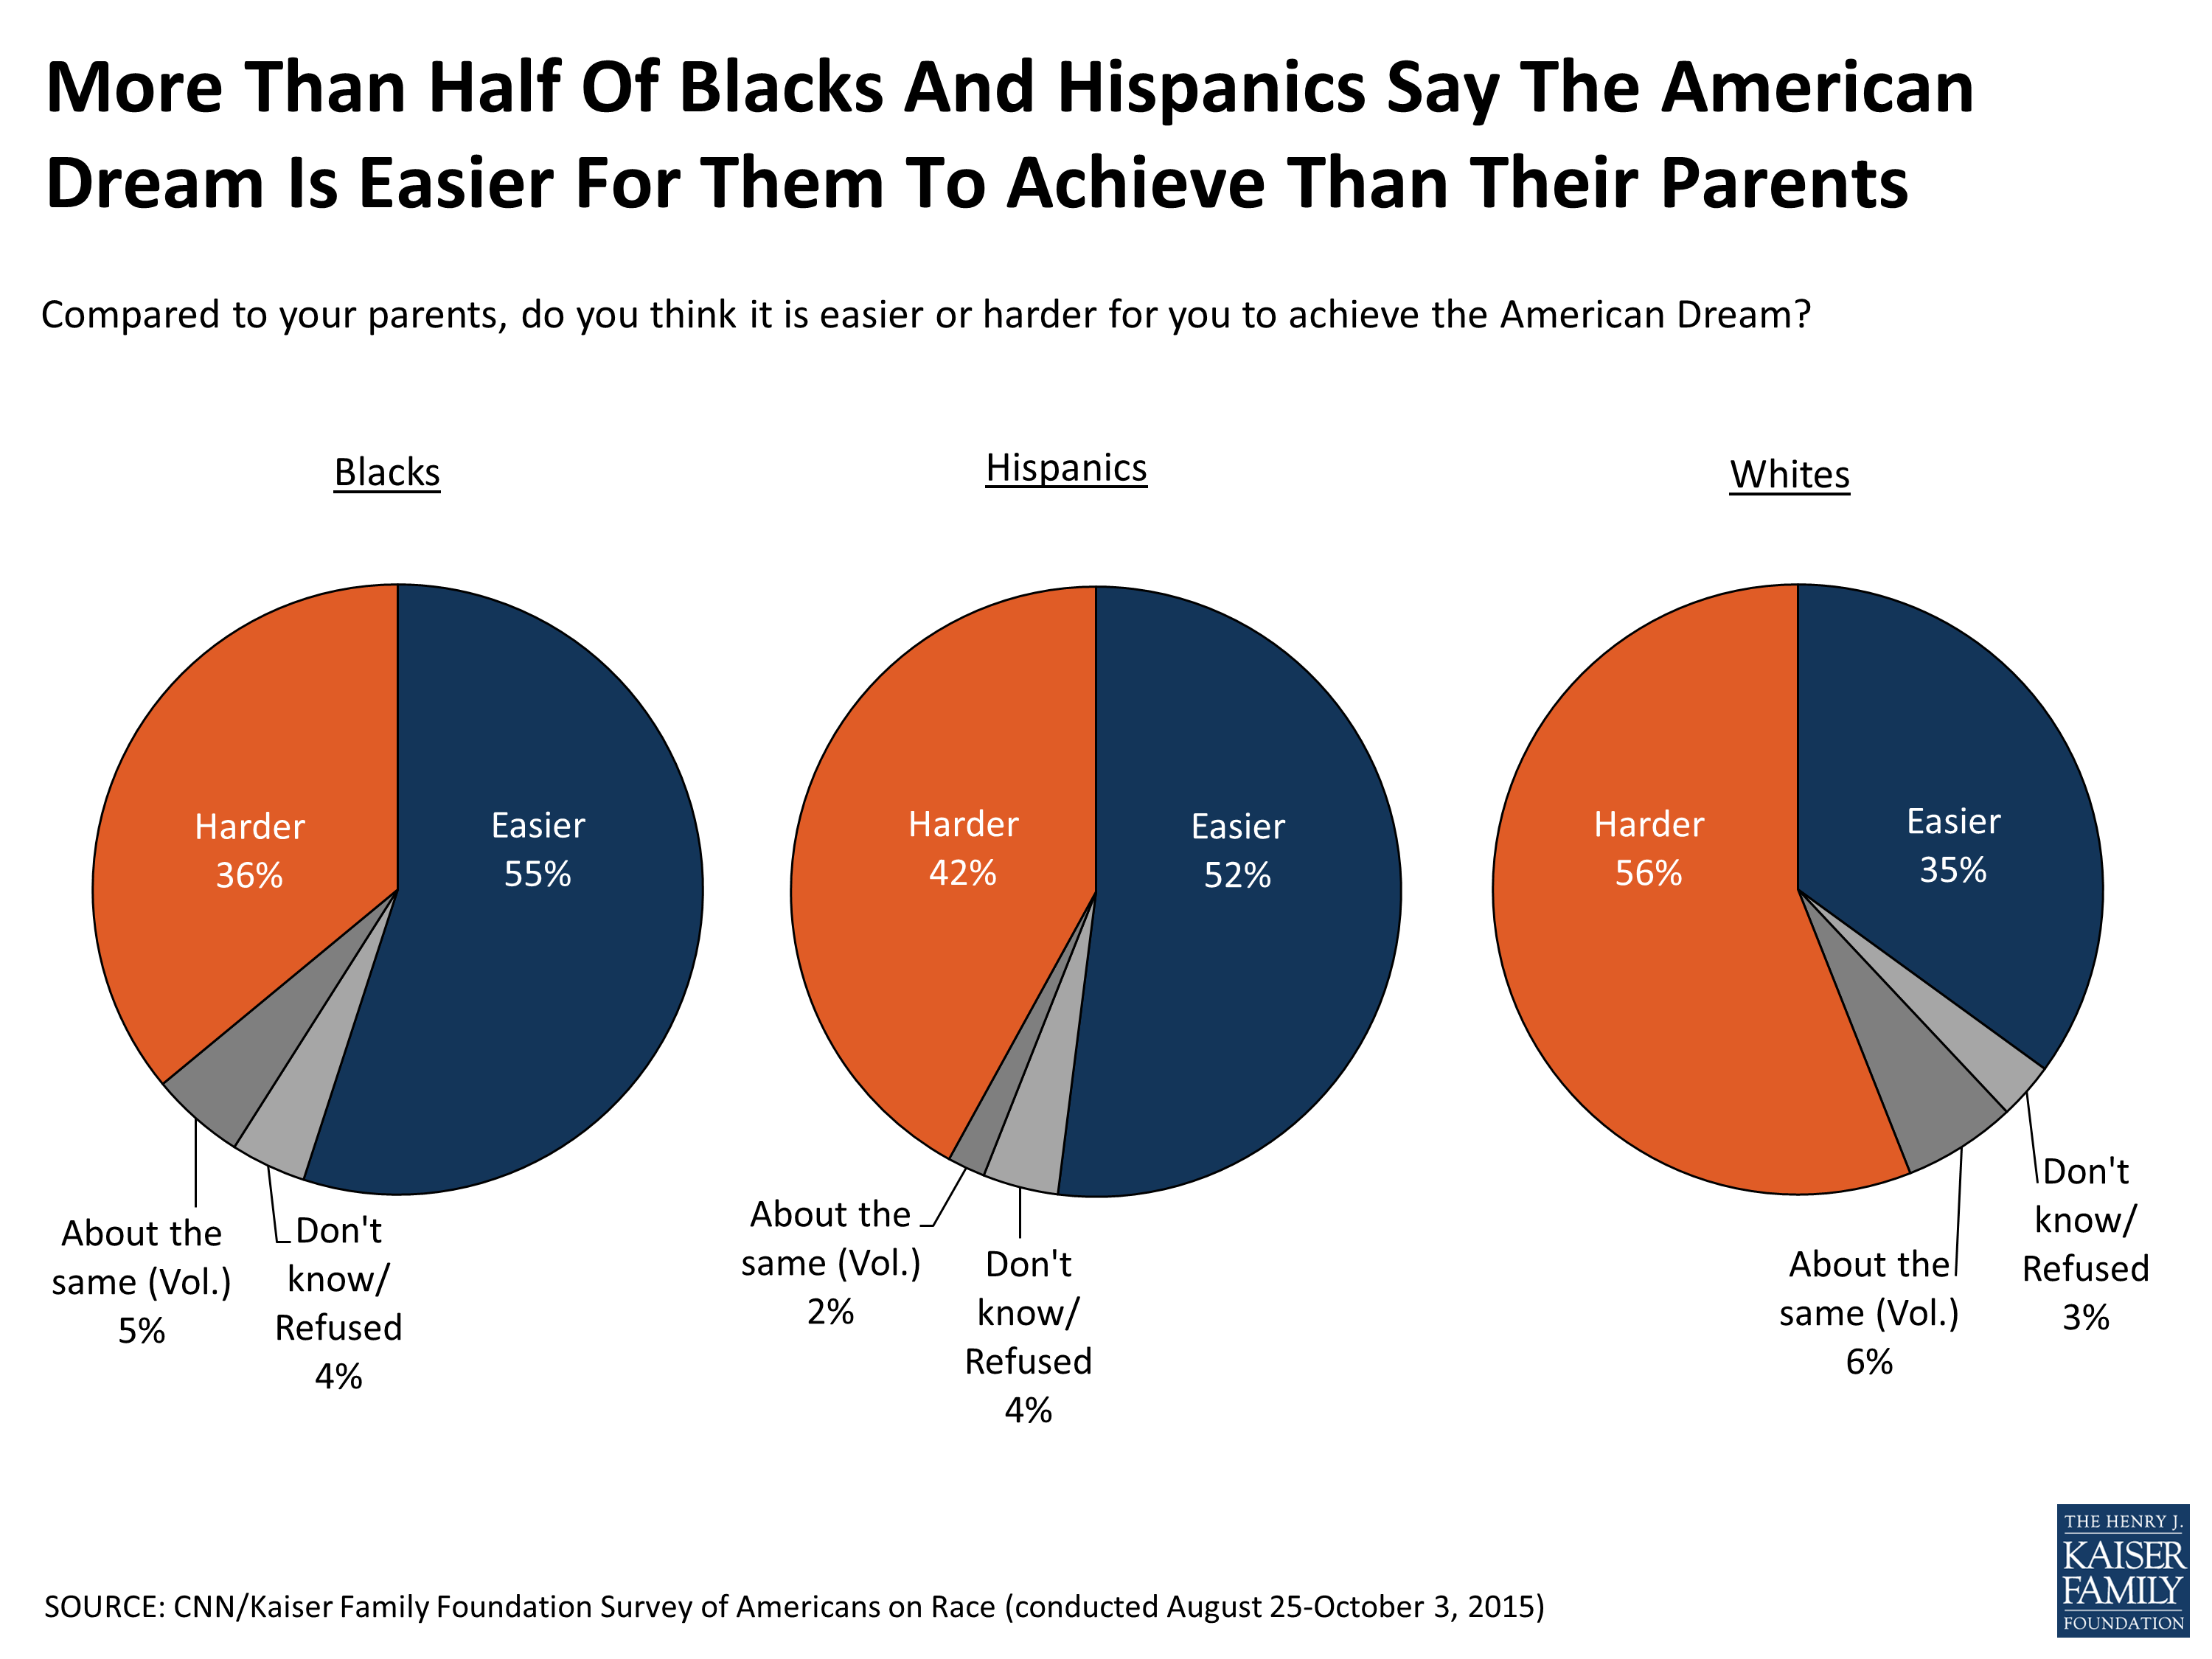
Figure 21
Blacks and Whites tend to disagree when it comes to perceptions of how the average African American fares compared to the average White person in terms of income, education, and housing. About seven in ten Blacks (71 percent) say that the average Black person is worse off than the average White person in terms of income, including nearly half (46 percent) who say that they are a lot worse off. Half of White people (50 percent) acknowledge that the average Black person is worse off than Whites in terms of income, but at the same time nearly four in ten Whites (38 percent) say Blacks are just as well off, while just 17 percent of Blacks say circumstances are about the same. Similar trends apply to education and housing. On these measures, roughly 6 in 10 Blacks feel they are worse off on average than Whites, but Whites are more likely than Blacks to say their circumstances are similar.
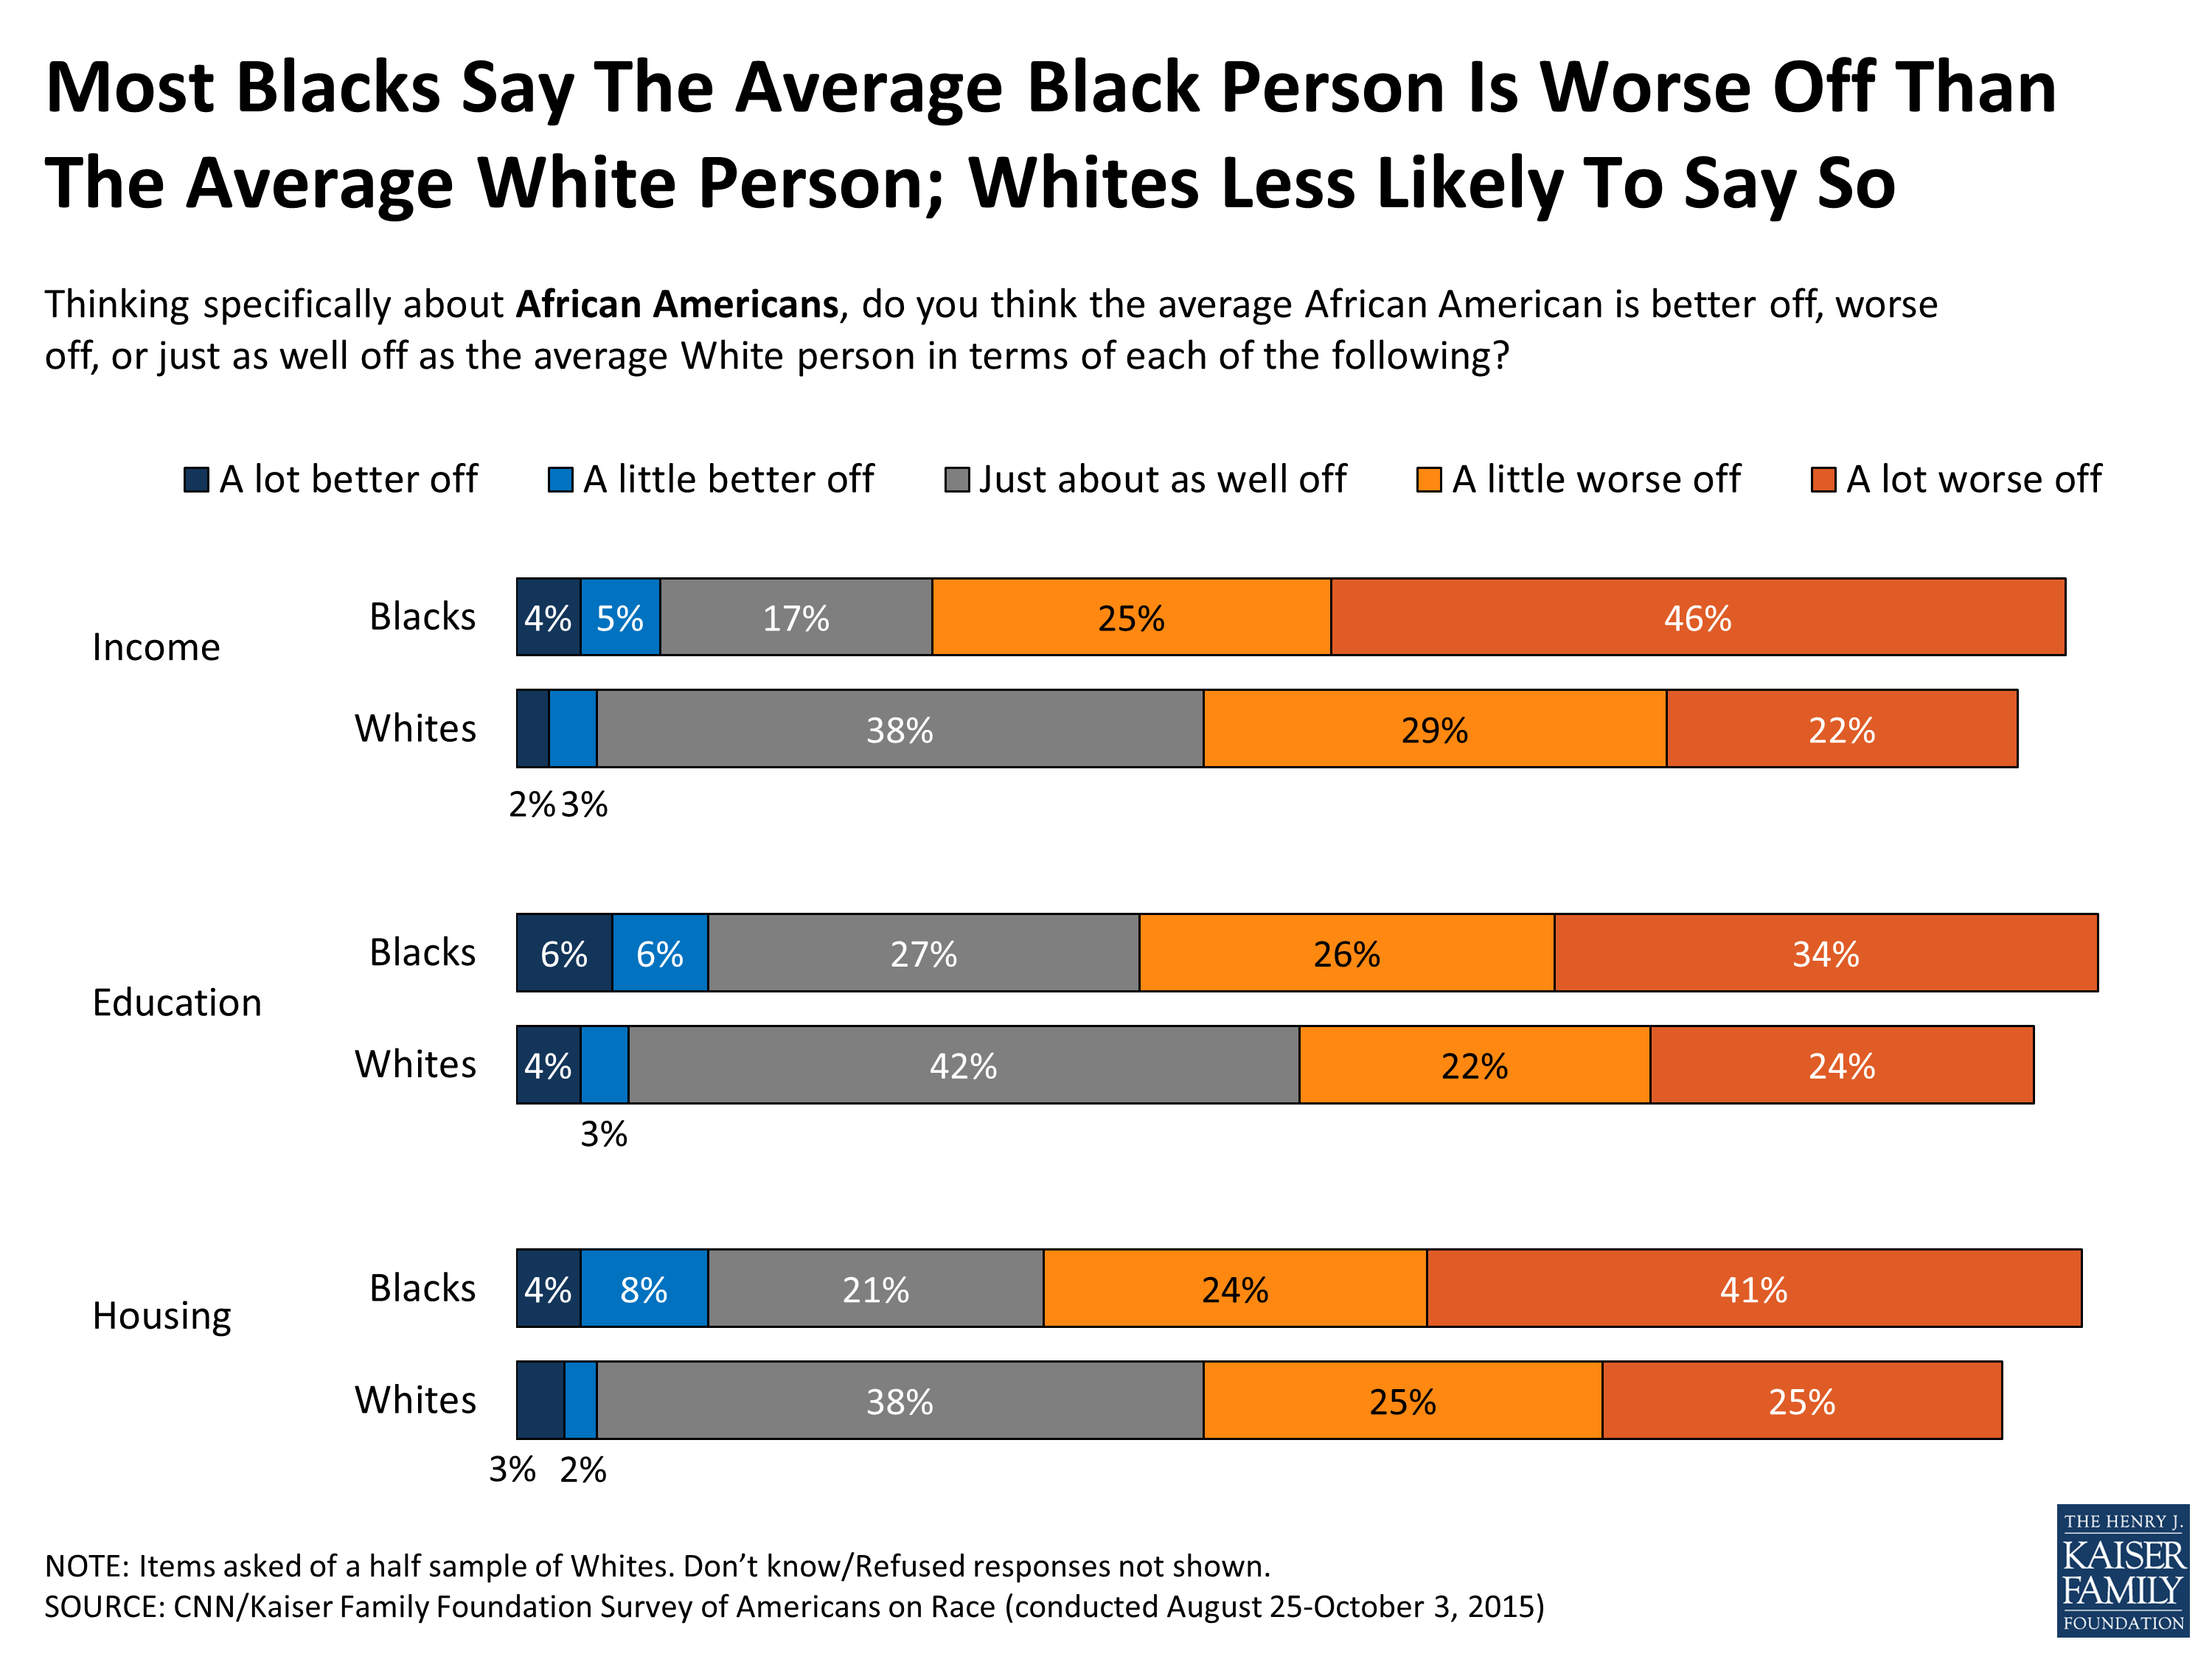
Figure 22
Interestingly, when it comes to how the average Hispanic person fares compared to the average White person, there are fewer differences in opinion by race. Similar shares of Whites and Hispanics say that the average Hispanic is worse off in terms of income, education and housing. In addition, about equal shares say they are just as well off on all three measures.
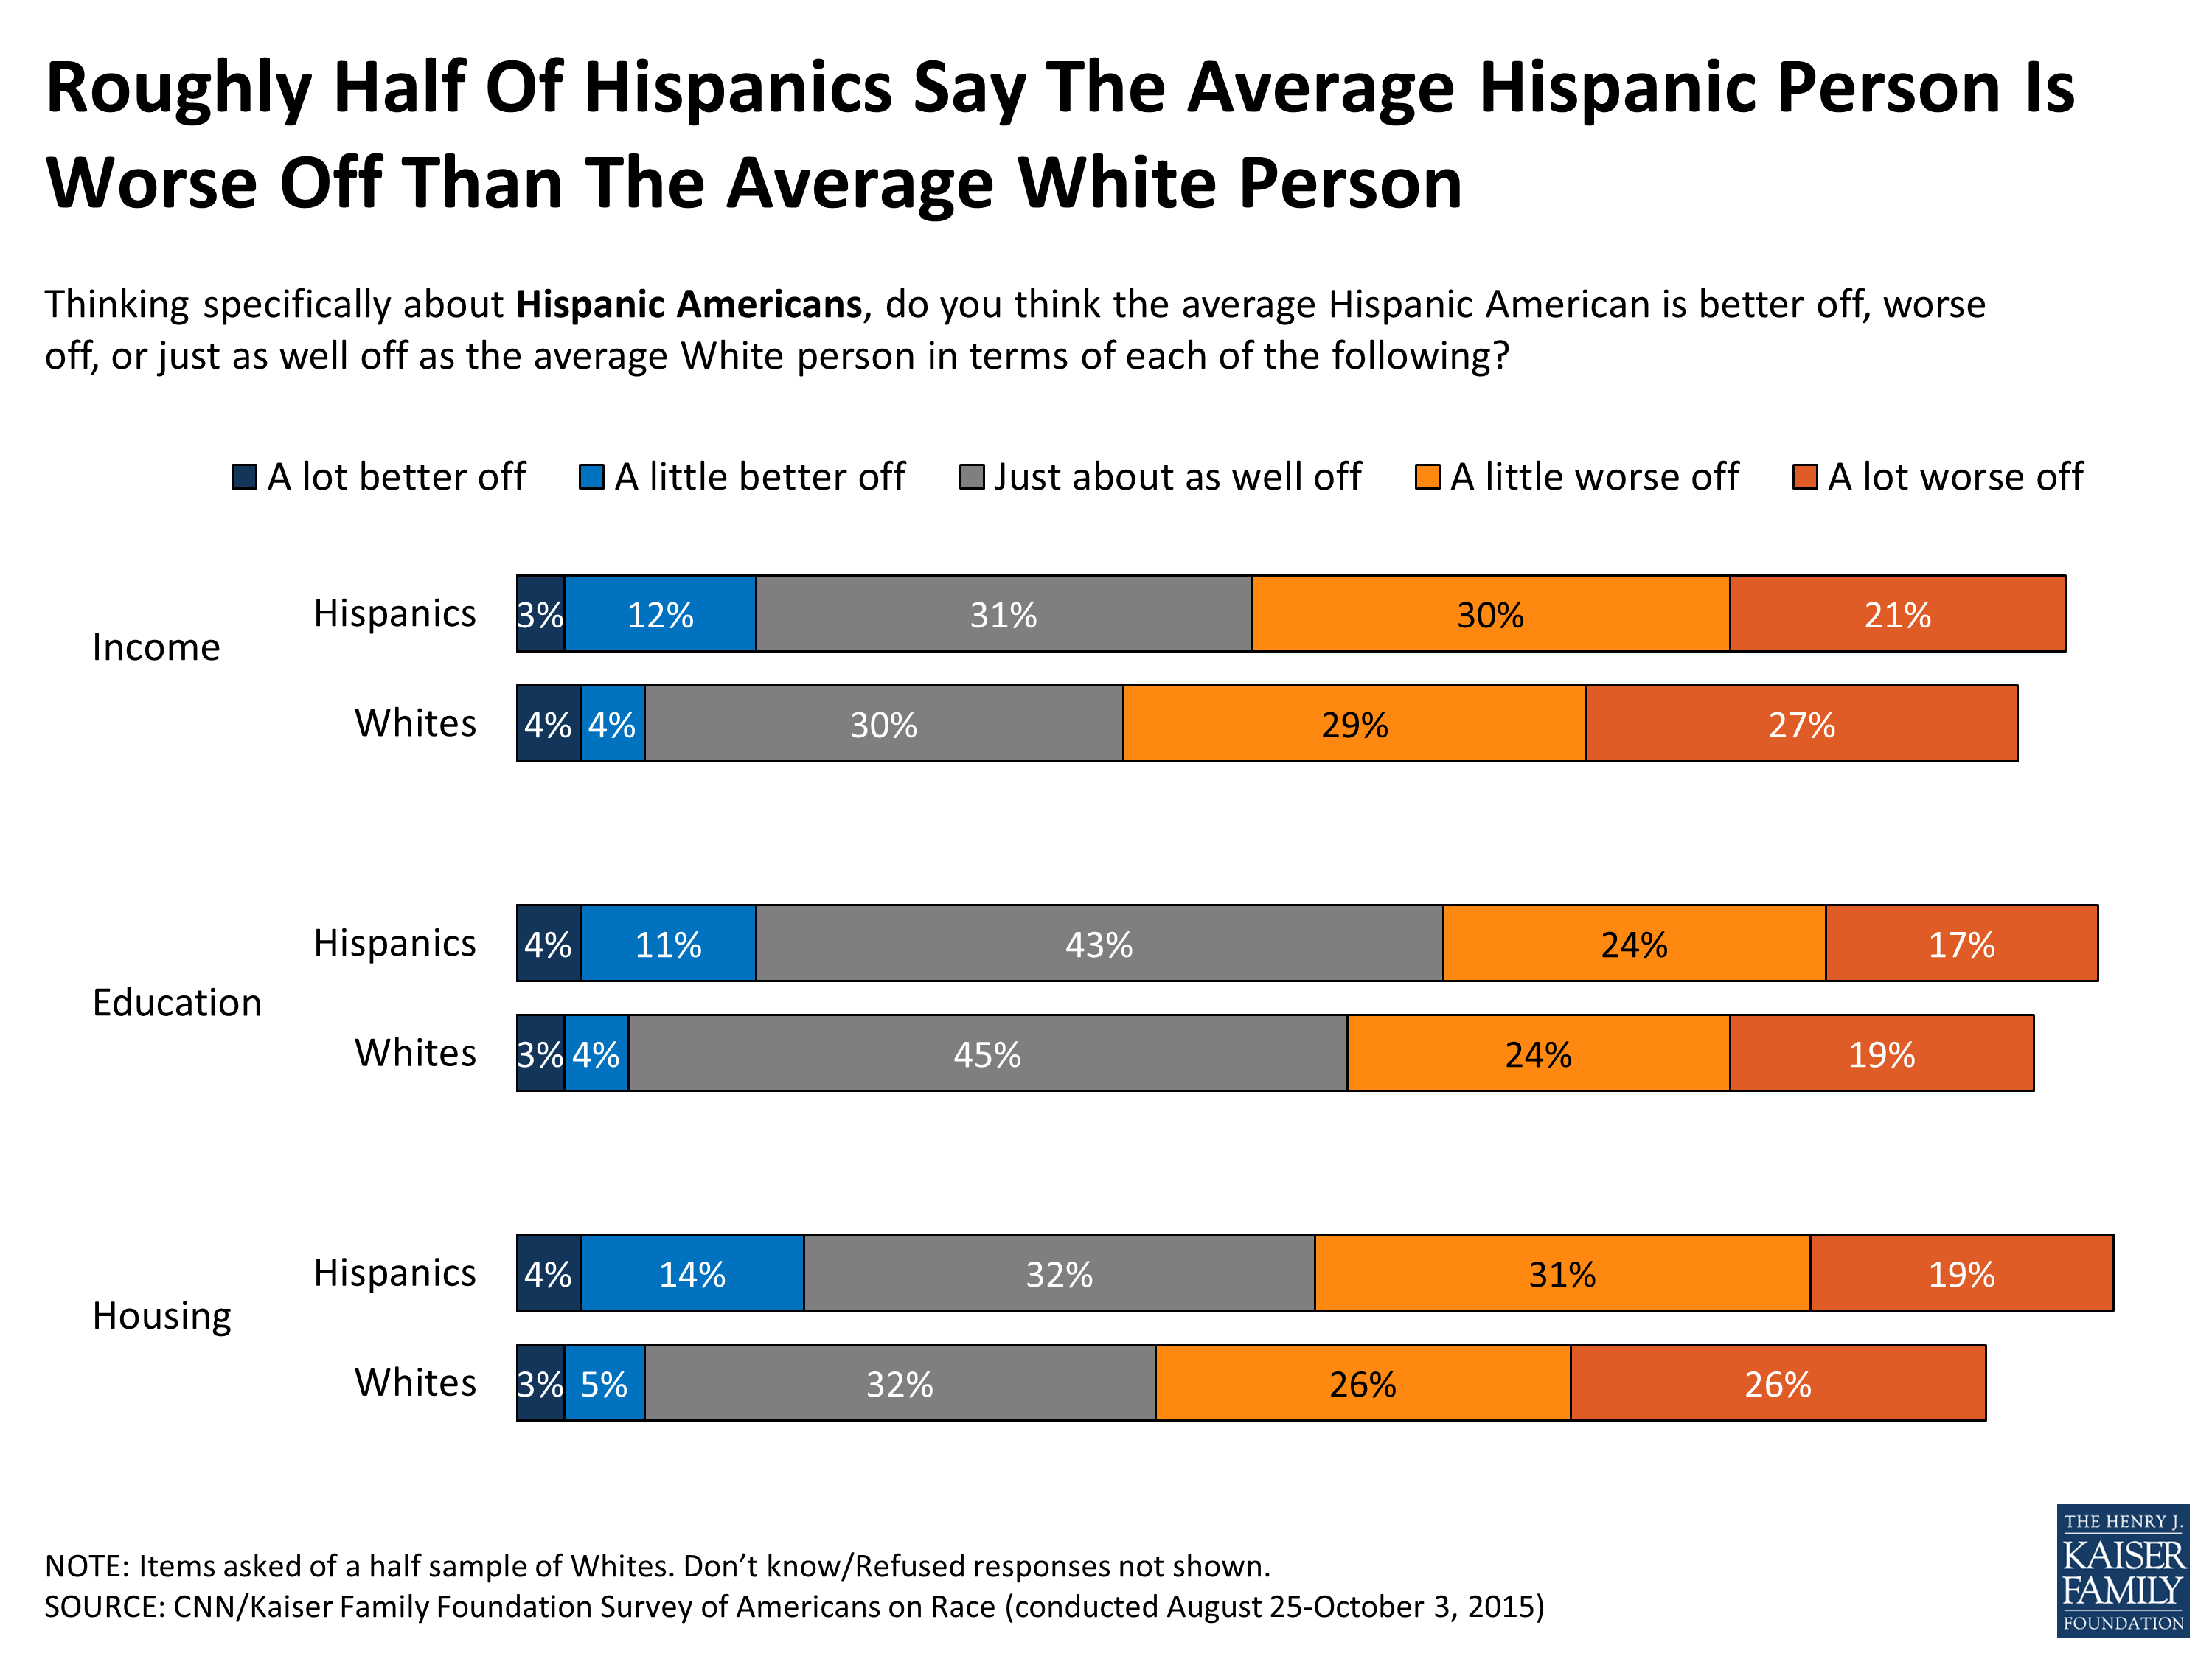
Figure 23
Views of Factors Holding Blacks and Hispanics Back
When asked whether certain factors were reasons for the economic and social problems facing African Americans today, roughly two-thirds of Black Americans say that past and present discrimination (69 percent) and lack of jobs (64 percent) are major reasons for these problems. About six in ten of Blacks say the breakup of the African American family (61 percent) and 55 percent of Blacks say lack of educational opportunities are major reasons. Fewer, but still a sizeable share (42 percent), say that lack of motivation and unwillingness to work hard is a major reason. While about half of White Americans (51 percent) agree with Blacks that the breakup of the African American family is a major reason for the problems facing the Black community, Whites are much less likely to say past and present discrimination, lack of jobs, and lack of educational opportunities are major factors.
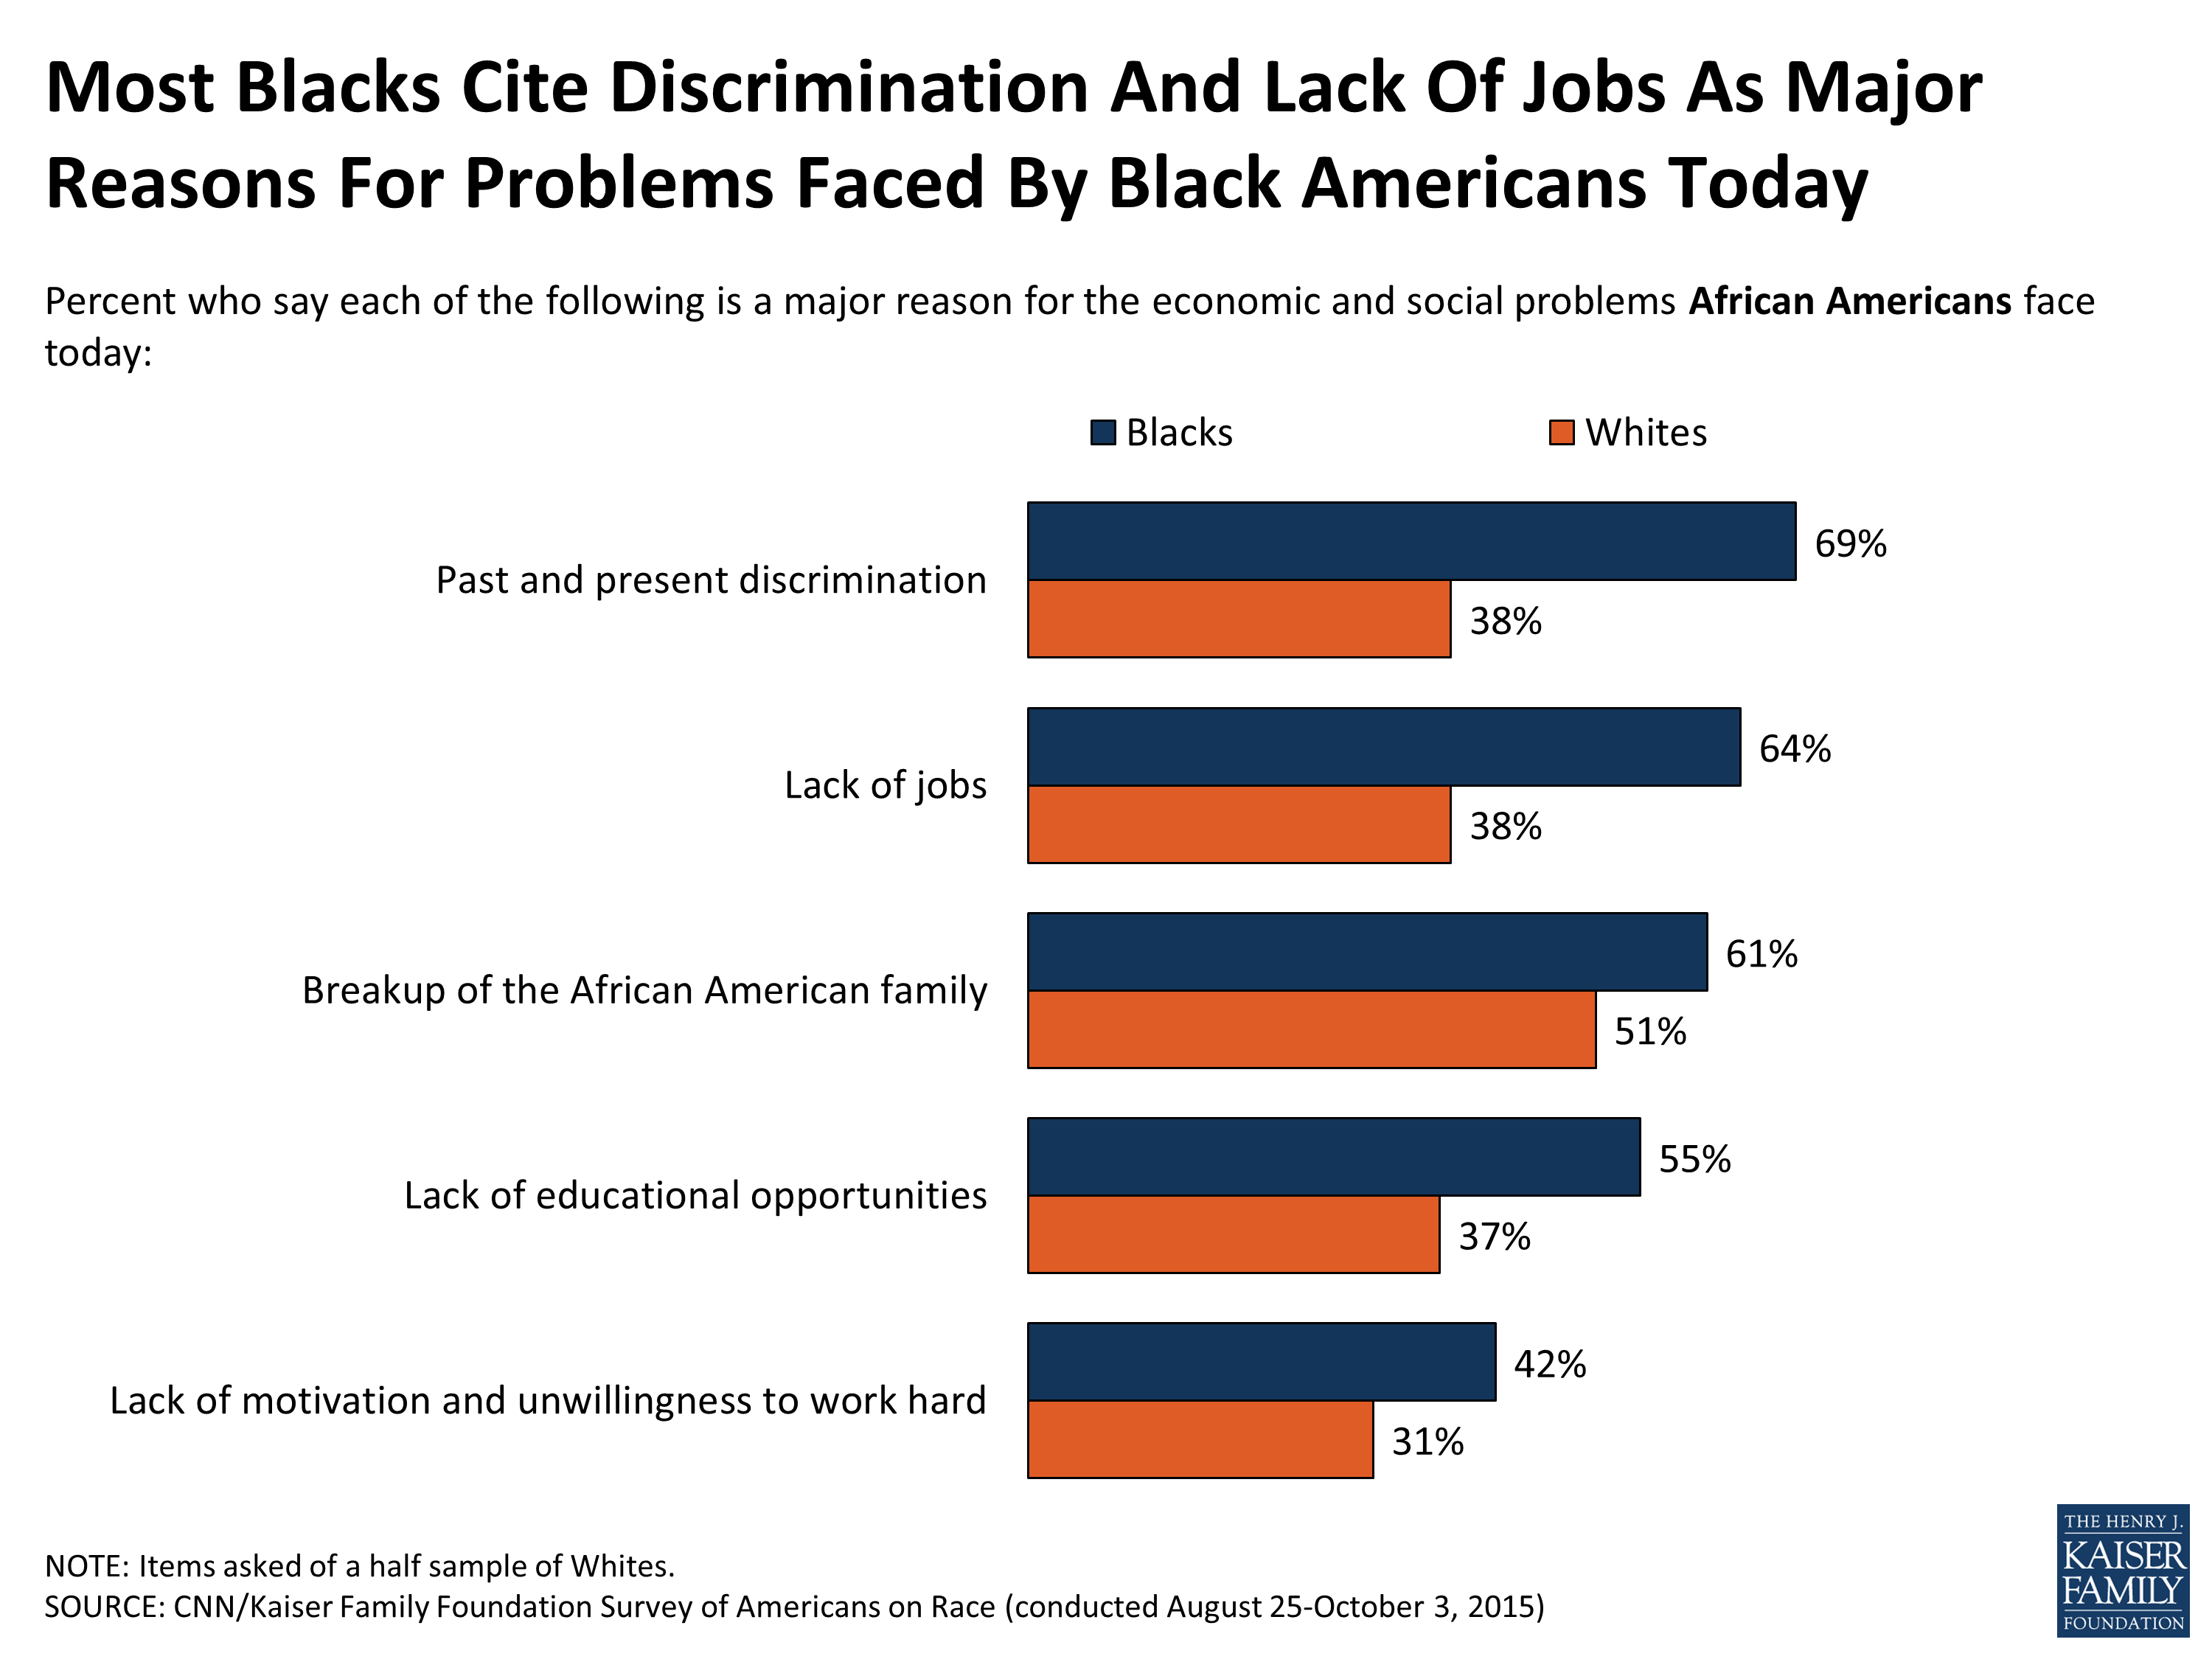
Figure 24
On reasons for the social and economic problems that the Hispanic community faces today, roughly six in ten Hispanic Americans say that lack of educational opportunities (62 percent), lack of jobs (61 percent), language problems (58 percent), past and present discrimination (57 percent), and the breakup of the Hispanic American family (56 percent) are major reasons. Like Hispanics, a majority of Whites say language problems are a major reason for problems facing the Hispanic community, whereas for the other factors, half as many Whites as Hispanics consider them major reasons. Over 4 in 10 Hispanics (43 percent) say that lack of motivation and unwillingness to work hard is a major reason for problems in their community, compared to only 13 percent of White Americans who share the same view.
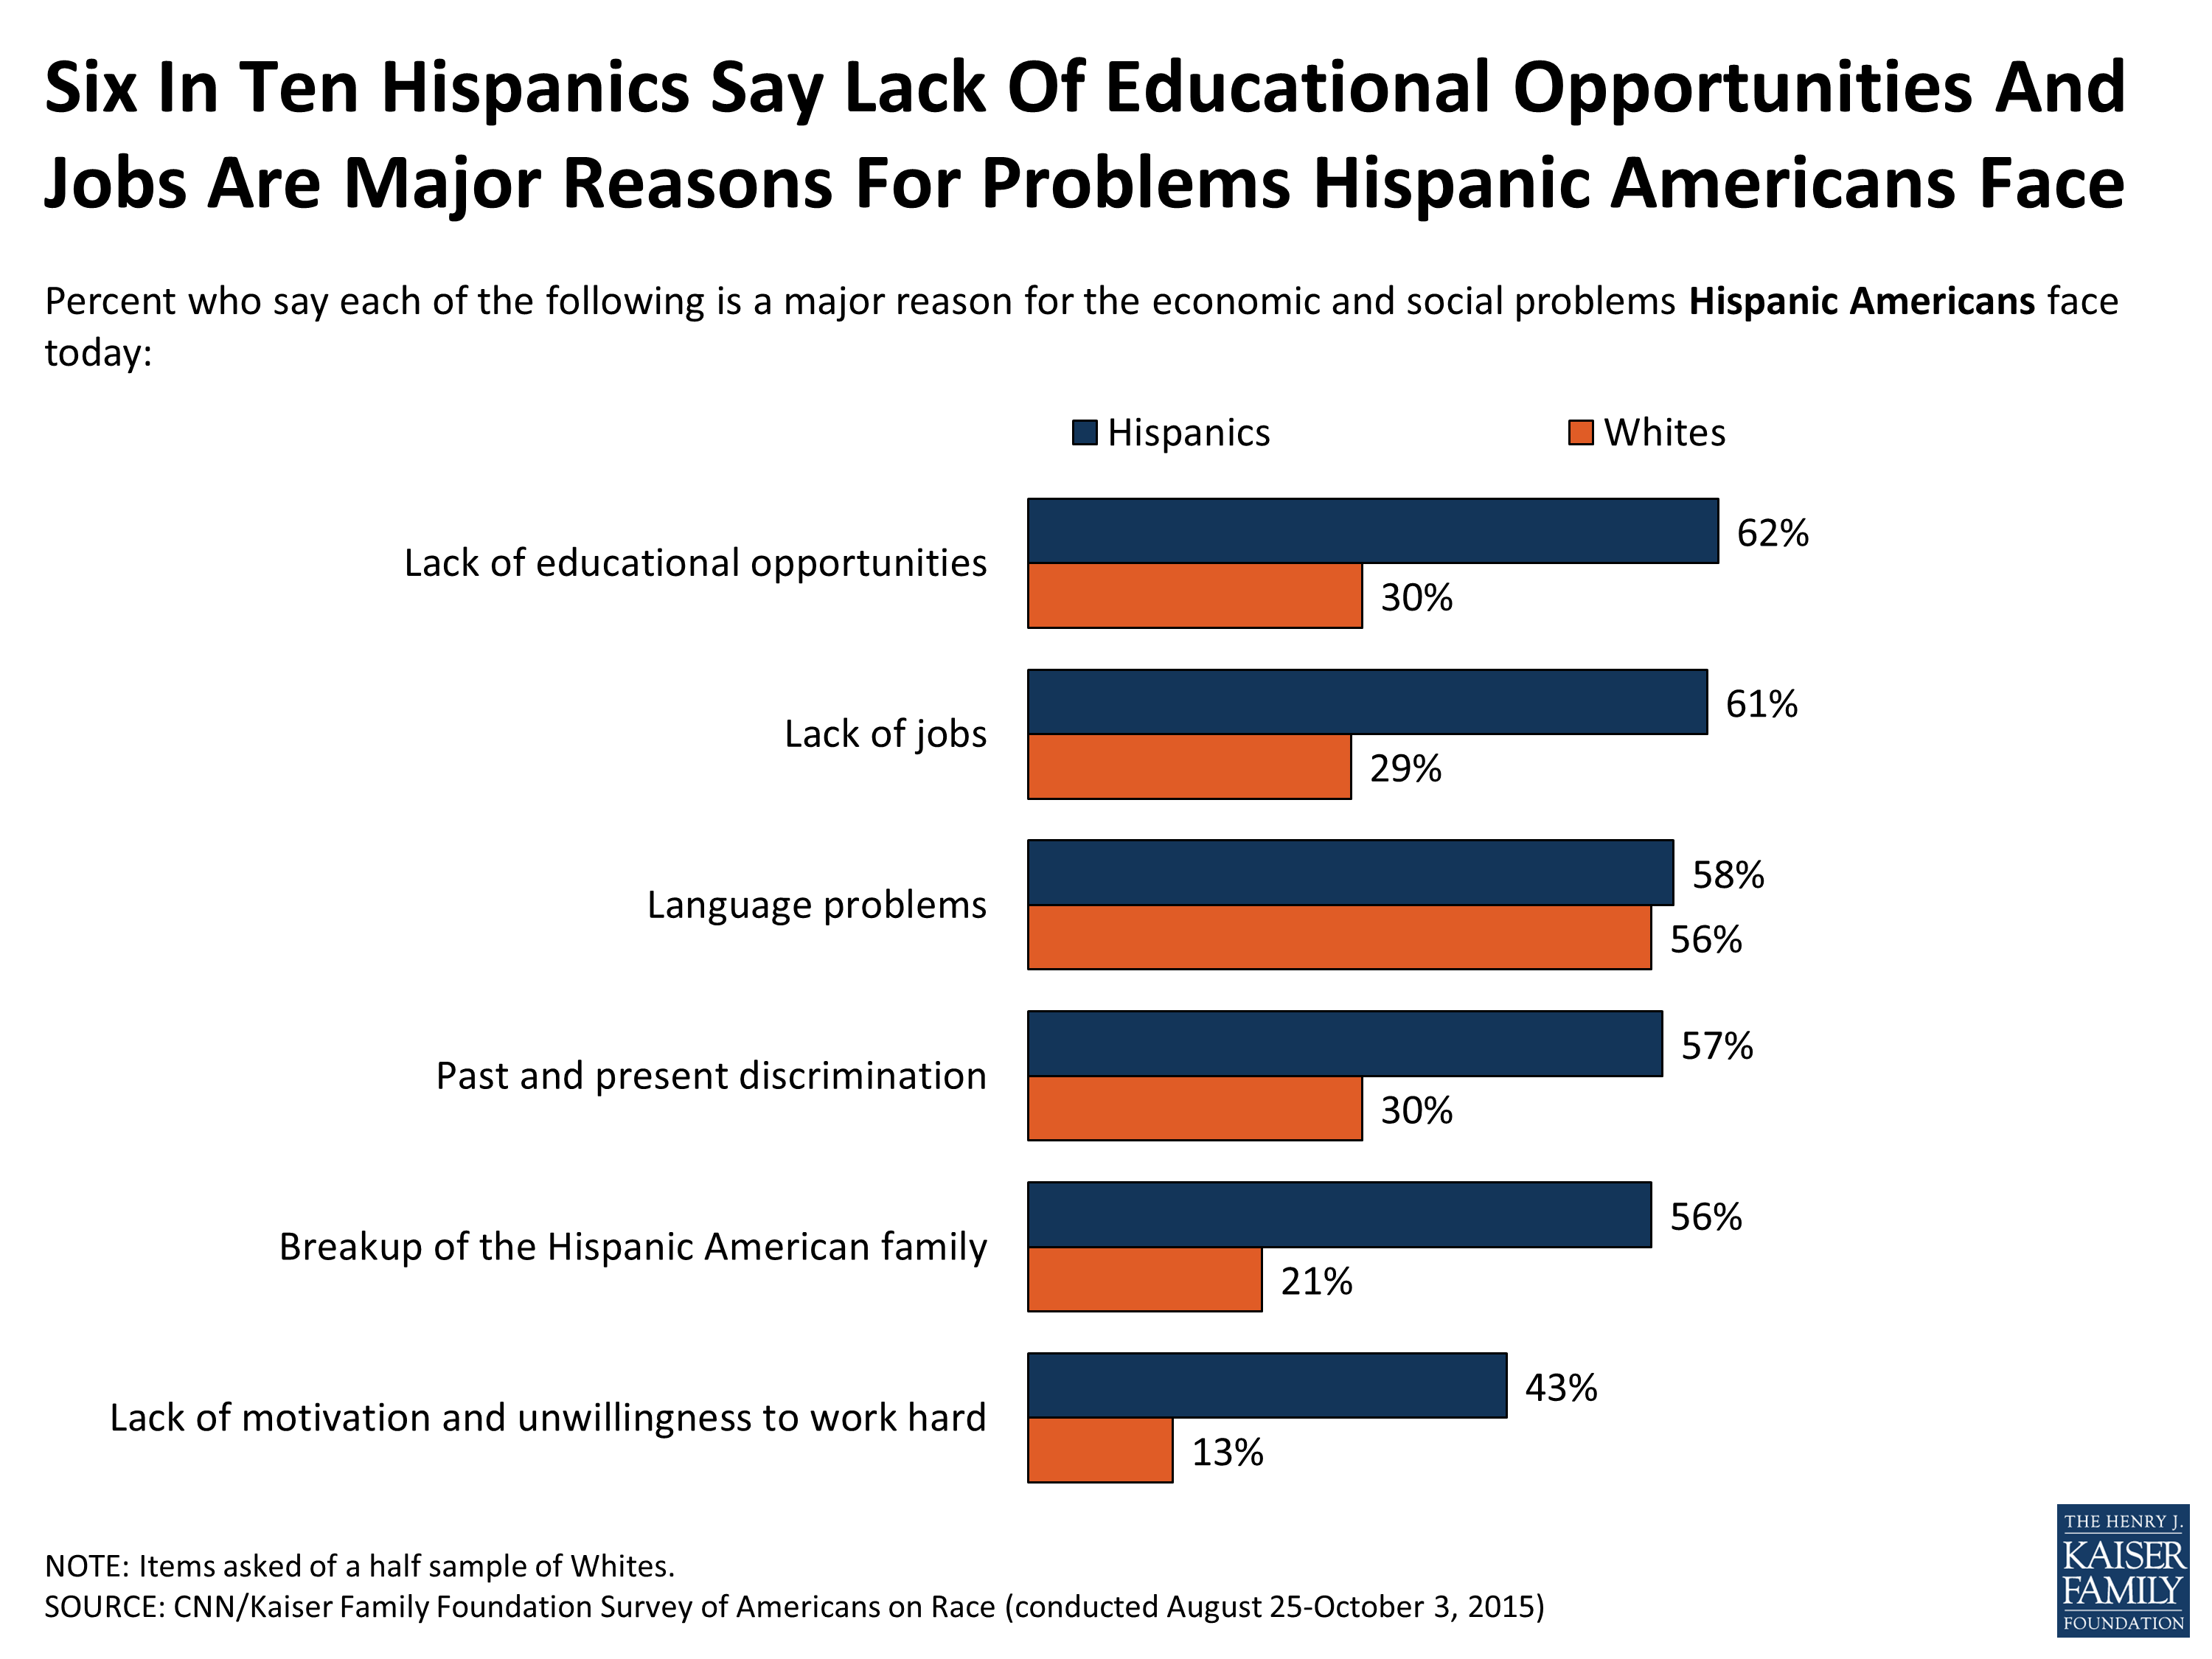
Figure 25
Some see affirmative action as a way to moderate some of the institutional barriers and discrimination facing members of minority groups. However, nearly 8 in 10 Americans (78 percent) say that hiring, promotion, and college admission should be based strictly on merit and qualifications other than race or ethnicity, while one in five (18 percent) say that because diversity benefits our country economically and socially, race and ethnicity should be a factor in such decisions. Whites (80 percent) are somewhat more likely to say advancement should be based on merit than Blacks (74 percent) and Hispanics (73 percent), but still large shares of Blacks and Hispanics say the same. There is more support for considering race in these decisions among Blacks and Whites with college degrees when compared to their less educated peers (Whites 27 percent versus 12 percent; Blacks 39 percent versus 15 percent). There are no significant differences by education level among Hispanics.
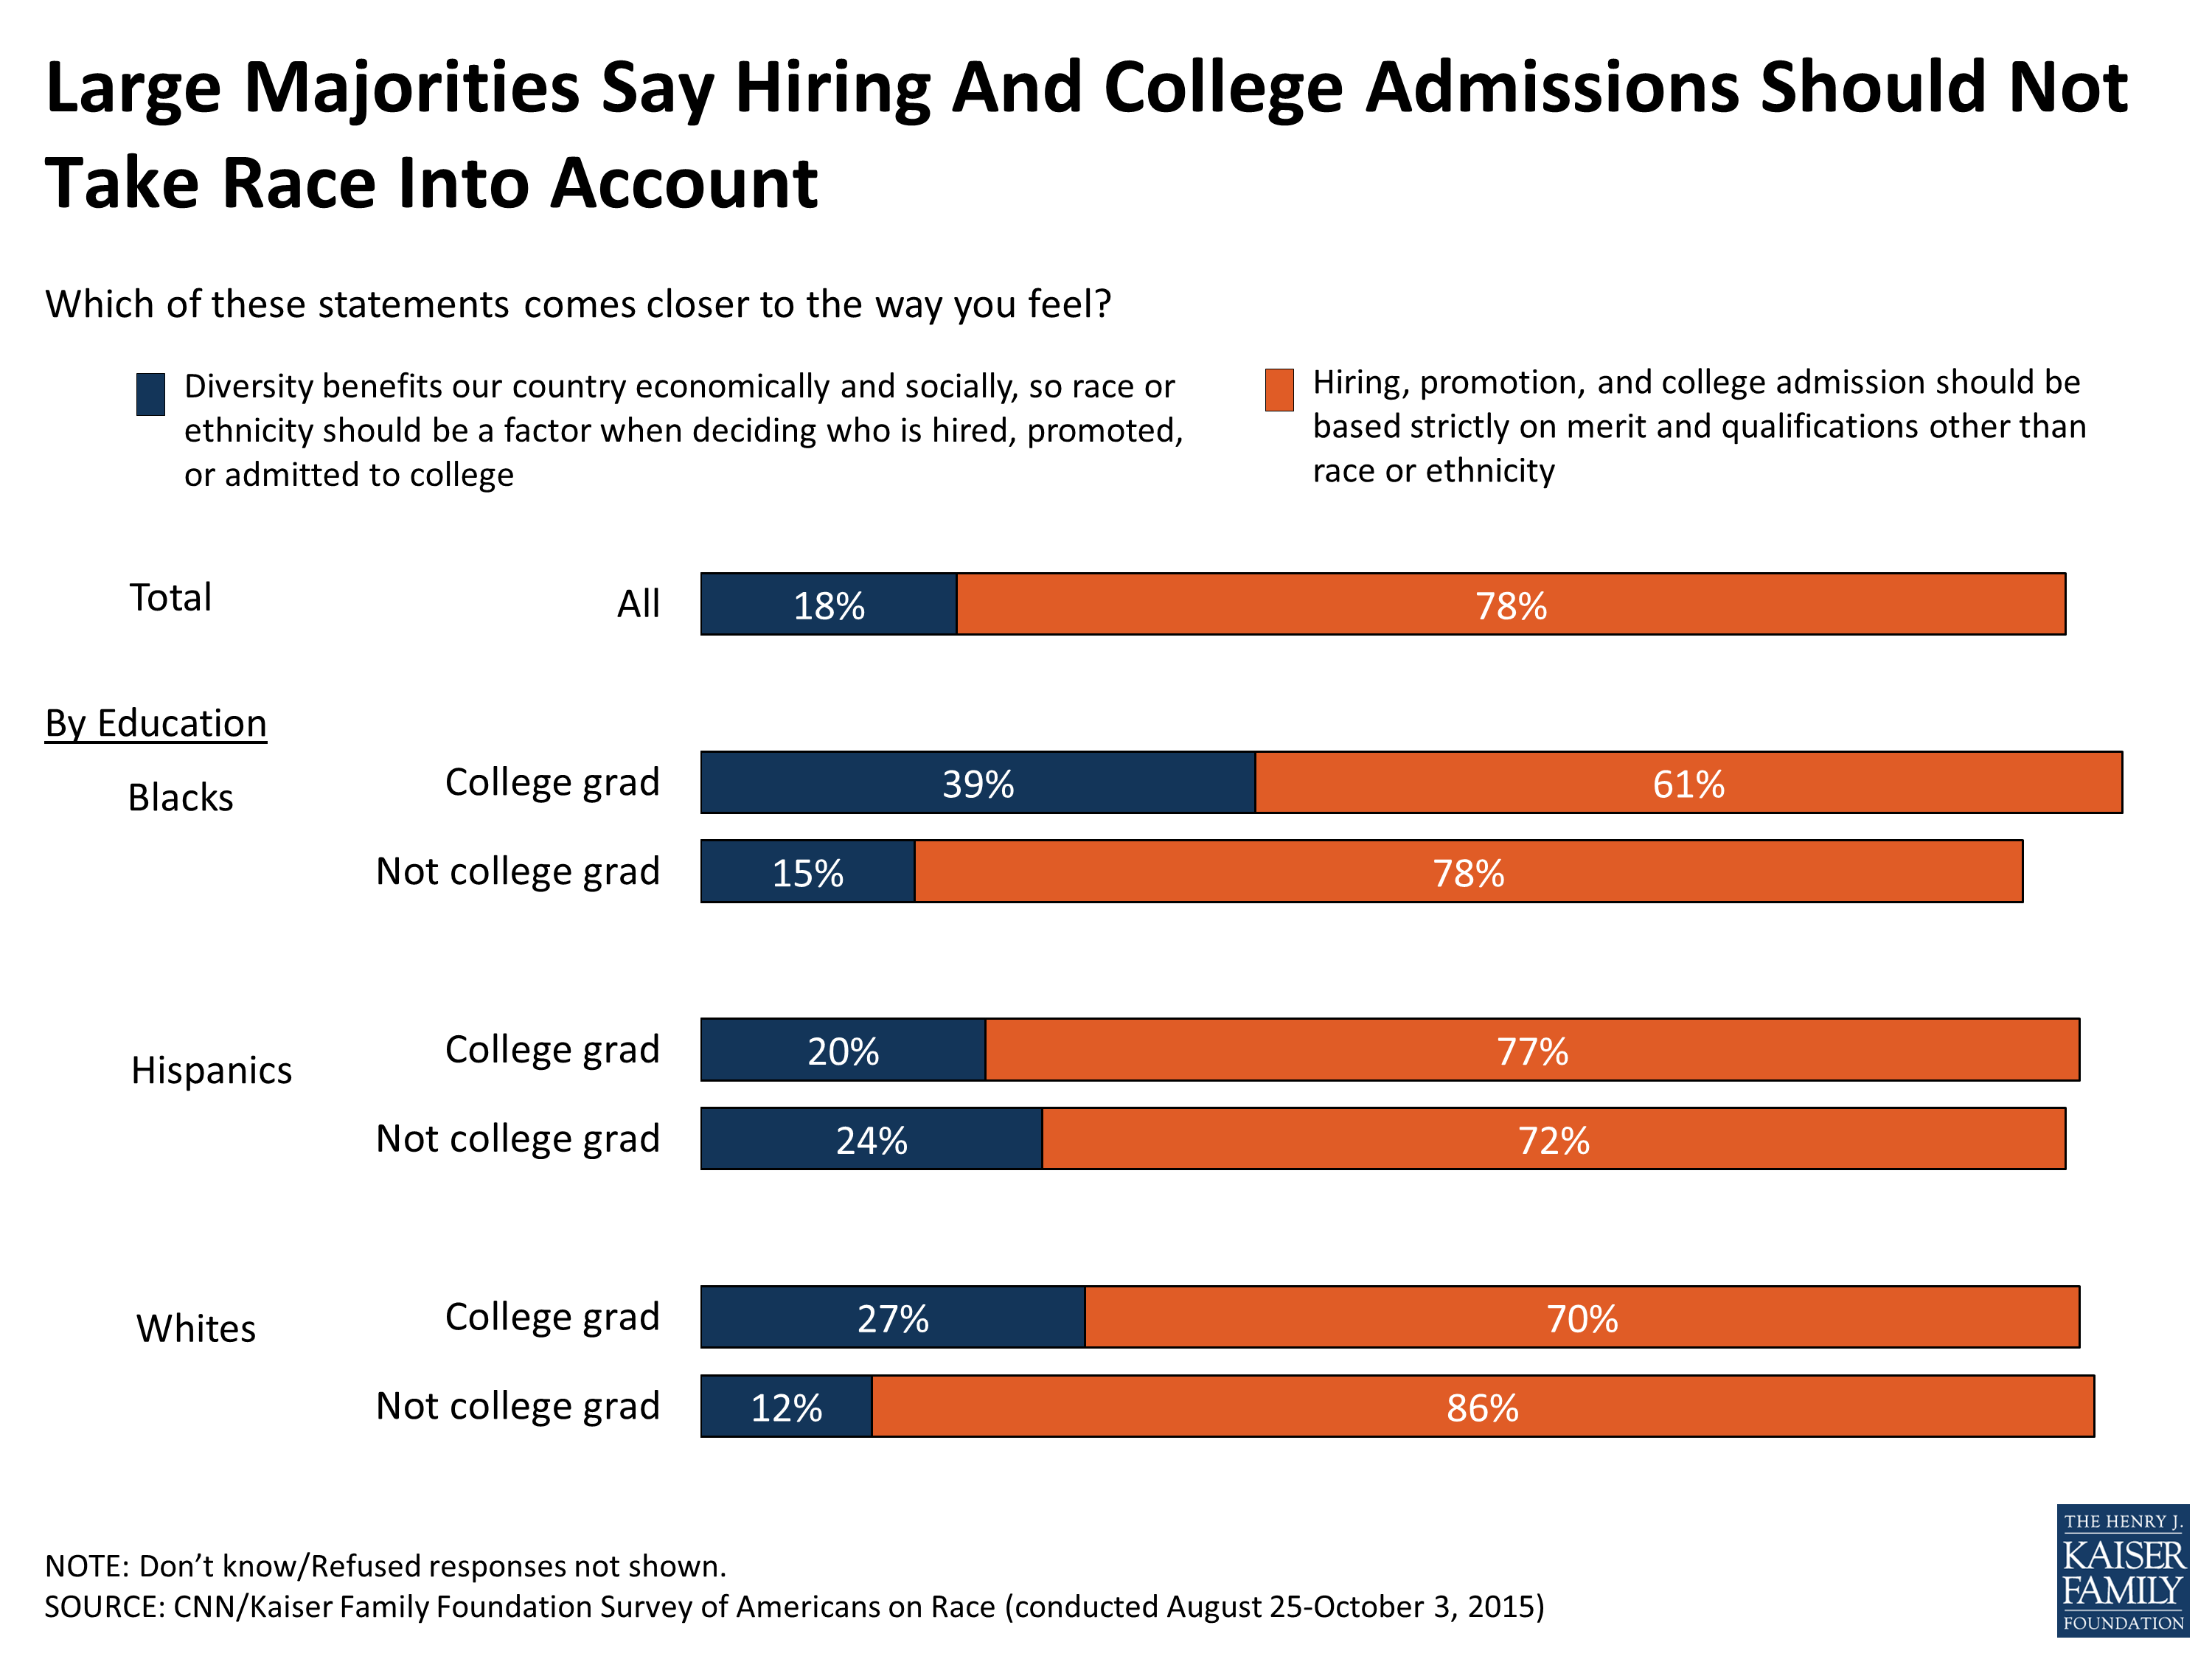
Figure 26
Section 5: Changes Over Time
Many of the same questions reported here were included in a Kaiser Family Foundation/Washington Post/Harvard School of Public Health Survey on race in American in 1995. While there have been increases in the shares saying racism is a big problem or that racial tensions have increased in the past 10 years, overall, there have been modest changes in the public’s views on a number of other measures. For example, when it comes to the role the federal government should have in ensuring equality in income, education, and criminal justice, compared to 20 years ago, the public is somewhat more likely to now say it is the responsibility of the federal government to make sure minorities have incomes equal to Whites (47 percent, up from 39 percent in 1995). In contrast, slightly fewer Americans overall say it is the government’s responsibility to make sure people of minority groups have schools equal in quality to those attended by Whites (65 percent, down from 72 percent in 1995) and treatment by the courts and police equal to that received by Whites (71 percent, down from 77 percent in 1995).
There have also been modest changes in the public’s perceptions of how the average African American or Hispanic American is faring compared to the average White person in terms of income and housing. Blacks are less likely to now say the average African American is worse off in terms of income than they were in 1995 (71 percent versus 84 percent), but otherwise, responses are fairly similar over time for Blacks and Whites. On how the average Hispanic American is faring compared to the average White American, Hispanics are generally less likely now than in 1995 to say Hispanics are worse off than the average White person in terms of income and housing.
| Changes Over Time In Views Of How Average African American or Hispanic American Is Faring Compared To The Average White Person On Income, Education, and Housing | ||
| 1995 | 2015 | |
| Percent who say the average African American is worse off than the average White person in terms of each of the following. | ||
| Income | ||
| Whites | 56% | 50% |
| Blacks | 84% | 71% |
| Education | ||
| Whites | 41% | 46% |
| Blacks | 68% | 59% |
| Housing | ||
| Whites | 52% | 50% |
| Blacks | 74% | 65% |
| Percent who say the average Hispanic American is worse off than the average White person in terms of each of the following. | ||
| Income | ||
| Whites | 64% | 56% |
| Hispanics | 74% | 51% |
| Education | ||
| Whites | 52% | 44% |
| Hispanics | 55% | 41% |
| Housing | ||
| Whites | 61% | 52% |
| Hispanics | 64% | 49% |
Finally, views on what some see as reasons for the economic and social problems facing African Americans or Hispanic Americans have changed somewhat in the past 20 years. Fewer Blacks today say major reasons for the social and economic problems facing Black Americans include educational opportunities (55 percent in 2015 compared to 67 percent in 1995) and lack of jobs (64 percent in 2015 compared to 74 percent in 1995). On factors related to the problems facing Hispanic Americans, views among Hispanics have not changed substantially compared to 20 years ago. However, perceptions have changed among Whites who are now less likely than they were in 1995 to say the following are major reasons for problems facing Hispanic Americans: lack of educational opportunities is (30 percent versus 46 percent), lack of motivation and unwillingness to work hard (13 percent versus 25 percent), and lack of jobs (29 percent versus 42 percent).
Additionally, despite discussion of affirmative action in the courts and elsewhere over the past 20 years, there has been little change in the public’s views of affirmative action over time. Compared to 1995, Whites are slightly more likely today to say that race should be considered in advancement decisions (17 percent, up from 12 percent in 1995), while Blacks are somewhat less likely to say race should be considered (20 percent, down from 28 percent in 1995).
Conclusion
Conclusion
In the wake of recent incidents of police violence towards African Americans, the launching of the national civil rights movement known as Black Lives Matter, and the ever-present issue of race in the ramping up presidential campaigns, it’s an important time to hear the voices and perspectives of Americans across the country to better understand how the general public and those of different racial and ethnic backgrounds feel about the issue. This Kaiser Family Foundation/CNN survey provides insights into the public’s views of complicated issues surrounding race, including the experience of racism and discrimination in the daily lives of Black and Hispanic Americans, institutional discrimination and individual bias, and the role of both government and individuals in creating a path forward.
More than half of Black Americans and a third of Hispanic Americans say they’ve been treated unfairly because of their race or ethnicity in the past month alone, and some report being victims of racial discrimination that denied them opportunities in housing or in the workplace. At a time when more than half of Black Americans report some personal connection with the prison system, the vast majority say the criminal justice system as a whole favors Whites over Blacks. Meanwhile, White Americans are less likely than Black Americans to see racism as a big problem in this country, and more likely to say that individual behavior and bias is a bigger problem than institutional discrimination. Although there is some evidence that Whites are increasingly aware of the problem, still, fewer Whites than Blacks say that past and present discrimination and a lack of jobs and educational opportunities are reasons for the problems facing Black and Hispanic Americans today. The Black Lives Matter movement has emerged in part because of this disconnect; increasing awareness of the issue and advocating for equal treatment and protection under the law. Looking forward, society as a whole continues to face many challenges addressing institutional and individual racism, and trends over time indicate mixed progress in the past 20 years, particularly when considering that two-thirds of younger Blacks report recent unfair treatment because of their race.
Methodology
The CNN/Kaiser Family Foundation Survey of Americans on Race was conducted August 25-October 3, 2015, among a nationally representative, probability-based random digit dial telephone sample of 1,951 adults ages 18 and older, living in the United States, including Alaska and Hawaii (Note: persons without a telephone could not be included in the random selection process). Computer-assisted telephone interviews conducted by landline (715) and cell phone (1,236, including 771 who had no landline telephone) were carried out in English and Spanish by SSRS. CNN and the Kaiser Family Foundation both contributed financing for the survey, and teams from both organizations worked together to develop the survey questionnaire and analyze the data. Each organization is responsible for its content.
To ensure there were enough respondents to capture the views and experiences of Black and Hispanic Americans, the full sample includes additional interviews with randomly selected African Americans and Hispanic Americans (commonly referred to as an “oversample”), for a total of 500 Black and 501 Hispanic respondents, although results for all groups have been adjusted to reflect their actual national distribution (See weighting description below). To oversample Blacks and Hispanics, the sample plan consisted of three elements: 1) general population respondents were reached by random digit dialing landline telephones or cell phones (1401 total, including 215 Blacks, 236 Hispanics); 2) respondents were reached by RDD landline or cell phone, and interviewed only if they were Black (186) or Hispanic (187); 3) prescreened respondents were reached by calling back phone numbers where respondents previously interviewed indicated that a person answering that number was either Black (100) or Hispanic (77). Both the RDD landline and cell phone samples were designed to target areas with high incidences of Black and Hispanics, and all phone numbers matched to a directory listing with a Hispanic surname were defined as a separate sampling group and oversampled. Both the RDD landline and cell phone samples were provided by Marketing Systems Group (MSG).
A multi-stage weighting process was applied to ensure an accurate representation of the national adult population. The first stage of weighting involved corrections for sample design, including a correction for the oversampling of telephone exchanges known to have higher incidences of Blacks and Hispanics, the likelihood of non-response for the re-contacted sample, and an adjustment to account for the fact that respondents with both a landline and cell phone have a higher probability of selection. The second weighting stage was conducted for each racial group separately, weighting to match estimates for the national population using data from the Census Bureau’s 2014 March supplement of the Current Population Survey (CPS), and a distribution of phone use was estimated based on the CDC’s National Health Interview Survey (NHIS). The weighting parameters used were age and gender, race/ethnicity, education, marital status, census region, population density of the respondents’ county, and telephone use. The sample of Hispanic respondents was weighted by nativity and national family heritage (Mexican, Puerto Rican, Cuban, and all other countries). Each group was weighted to reflect the population distribution of race among the U.S. adult population. All statistical tests of significance account for the effect of weighting.
The margin of sampling error including the design effect for the full sample is plus or minus 3 percentage points; for results based on African American and Hispanics it is plus or minus 6 percentage points. Numbers of respondents and margins of sampling error for key subgroups are shown in the table below. For items based on half samples, including half samples of only Whites or half samples of those of races other than Black or Hispanic, the MOSE for the total is +/- 4 percentage points and the MOSE for Whites is +/- 6 percentage points. For half samples of Blacks or Hispanics, the MOSE is typically +/- 8 percentage points for each group. For results based on other subgroups, the margin of sampling error may be higher. Sample sizes and margins of sampling error for other subgroups are available by request. Note that sampling error is only one of many potential sources of error in this or any other public opinion poll. Kaiser Family Foundation public opinion and survey research is a charter member of the Transparency Initiative of the American Association for Public Opinion Research.
| Group | N (unweighted) | M.O.S.E. |
| Total | 1,951 | ±3 percentage points |
| White, non-Hispanic | 772 | ±4 percentage points |
| Black, non-Hispanic | 501 | ±6 percentage points |
| Hispanic | 500 | ±6 percentage points |
The full CNN/KFF poll results are representative of the U.S. adult population, including people of all races. The reported results focus on the total sample, reflective of all adult people in the U.S., as well as Whites, Blacks, and Hispanics. While the responses for some smaller groups of the US population, for example, Asian-Americans and people of mixed race, are counted in the “total” poll responses, because adults in this poll were sampled randomly, the number of respondents who identify as Asian or as mixed race was fewer than 100, and therefore too small to report separately. With fewer than 100 respondents, the margin of sampling error around any poll result would be so large that the result would be unreliable and potentially misleading.
Endnotes
Key Findings
Section 3: Perceptions of the Problem
Those in urban areas include those living within the main city in an area of America that has a population of 50,000 or more. Because this definition is fairly broad, it is possible that the views of those living in urban areas in major metropolitan cities in the U.S. or those living in the heart of urban settings across the nation would be different than the views reported here.