Medicare Part D in 2016 and Trends over Time
Executive Summary
Summary
Since 2006, Medicare beneficiaries have had access to prescription drug coverage offered by private plans, either stand-alone prescription drug plans (PDPs) or Medicare Advantage drug plans (MA-PD plans). Medicare drug plans (also referred to as Part D plans) receive payments from the government to provide Medicare-subsidized drug coverage to enrolled beneficiaries, who pay a monthly premium that varies by plan. The law that established Part D defined a standard drug benefit, but nearly all Part D plan sponsors offer plans with alternative designs that are equal in value, and plans may also offer an enhanced benefit. Part D plans also must meet certain other requirements, but vary in terms of premiums, benefit design, gap coverage, formularies, and pharmacy networks.
This chart collection presents findings on the Medicare Part D marketplace in 2016 and trends since 2006:
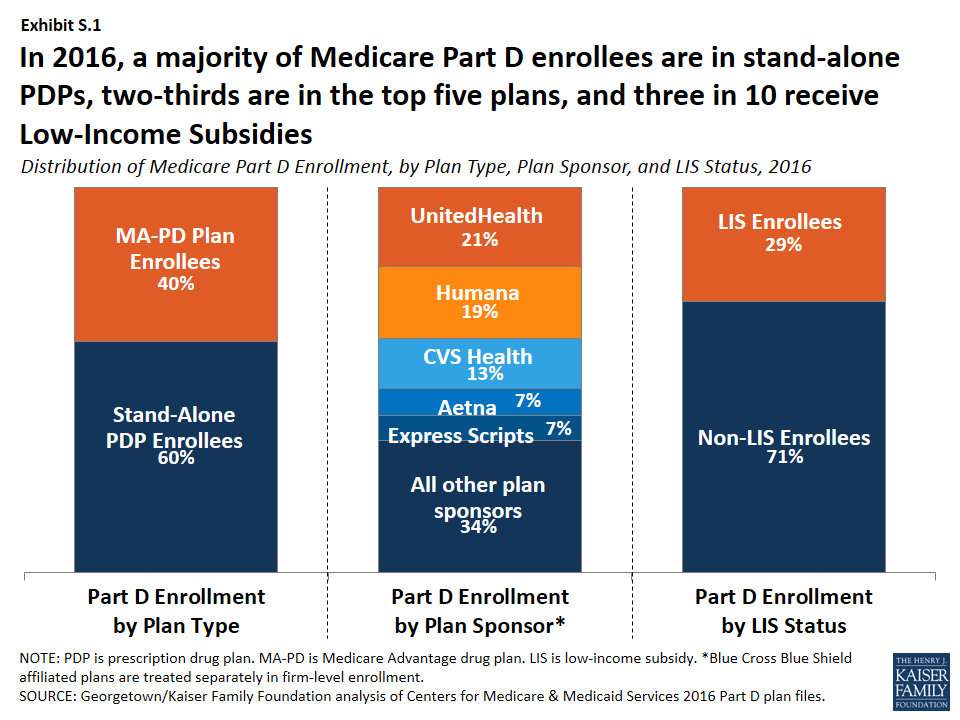
- Nearly 41 million of the 57 million people on Medicare (71 percent) are enrolled in a Part D plan in 2016; most (60 percent) are in PDPs, but a rising share (40 percent in 2016, up from 28 percent in 2006) are in MA-PD plans (Exhibit S.1). More than half of Part D enrollees are in enhanced plans.

Exhibit S.1: Distribution of Medicare Part D Enrollment, by Plan Type, Plan Sponsor, and LIS Status, 2016
- Nearly three in 10 Part D enrollees (29 percent, or about 12 million enrollees) are receiving extra help through the Part D Low-Income Subsidy (LIS) program that pays their drug plan premiums (if they enroll in a benchmark plan) and reduces their cost sharing.
- Three firms—UnitedHealth, Humana, and CVS Health—account for over half (53 percent) of all Part D enrollment in 2016; if the Humana-Aetna merger goes through, the combined firm would account for 26 percent of Part D enrollment nationwide, without divestitures.
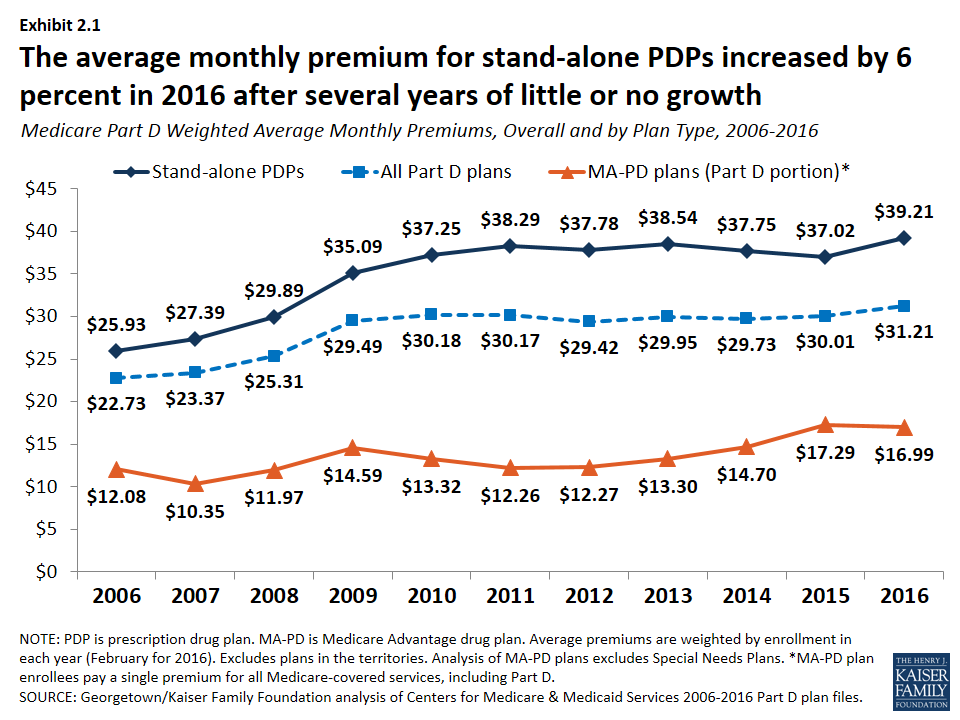
- After several years of relatively low growth, average monthly PDP premiums increased by 6 percent in 2016 to $39.21 per month. However, monthly premiums for two of the most popular PDPs (AARP Rx Preferred and Humana Enhanced) increased by more than 20 percent in 2016. Premiums vary widely across regions and across plans, even among those of the same benefit type (basic or enhanced).
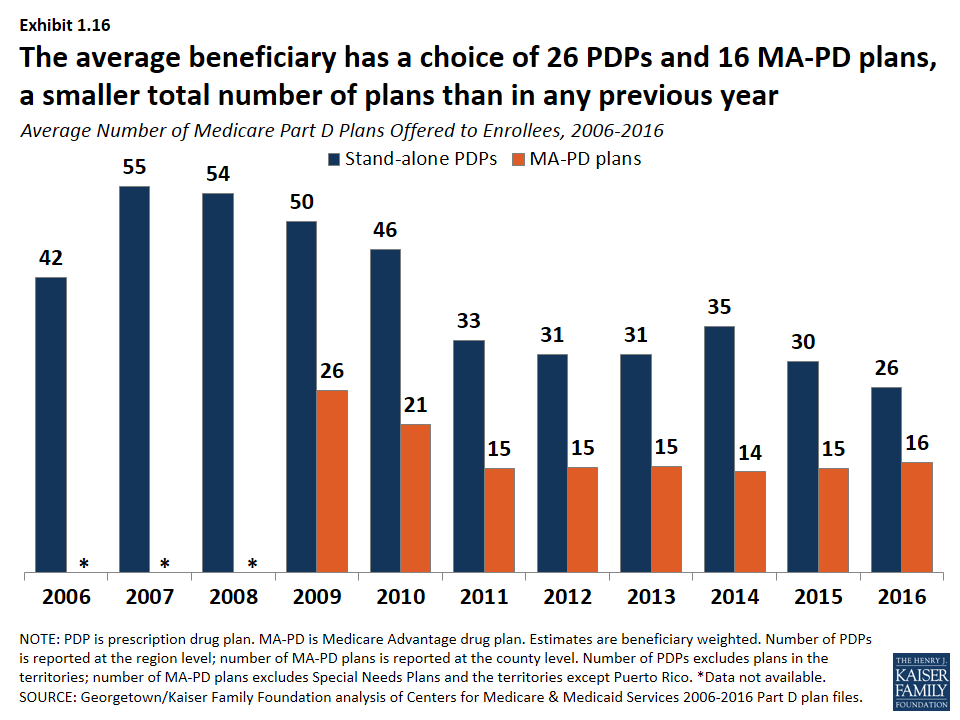
- The average Medicare beneficiary has a choice of 26 PDPs and 16 MA-PD plans in 2016; by contrast, the average Part D enrollee receiving the LIS has a choice of seven premium-free benchmark PDPs, fewer than in any year since 2006.
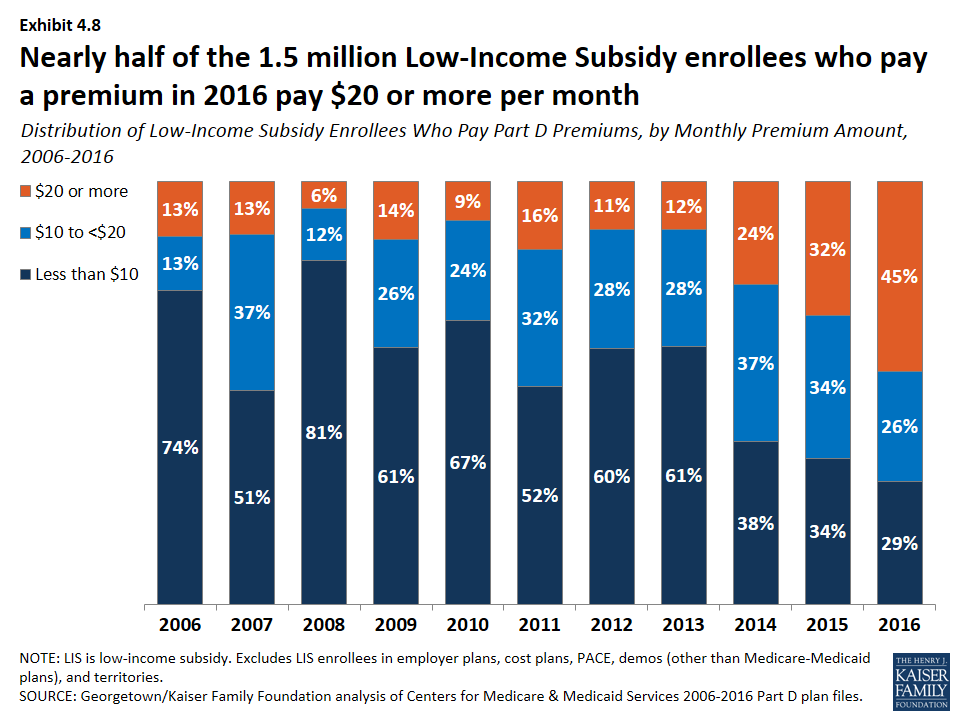
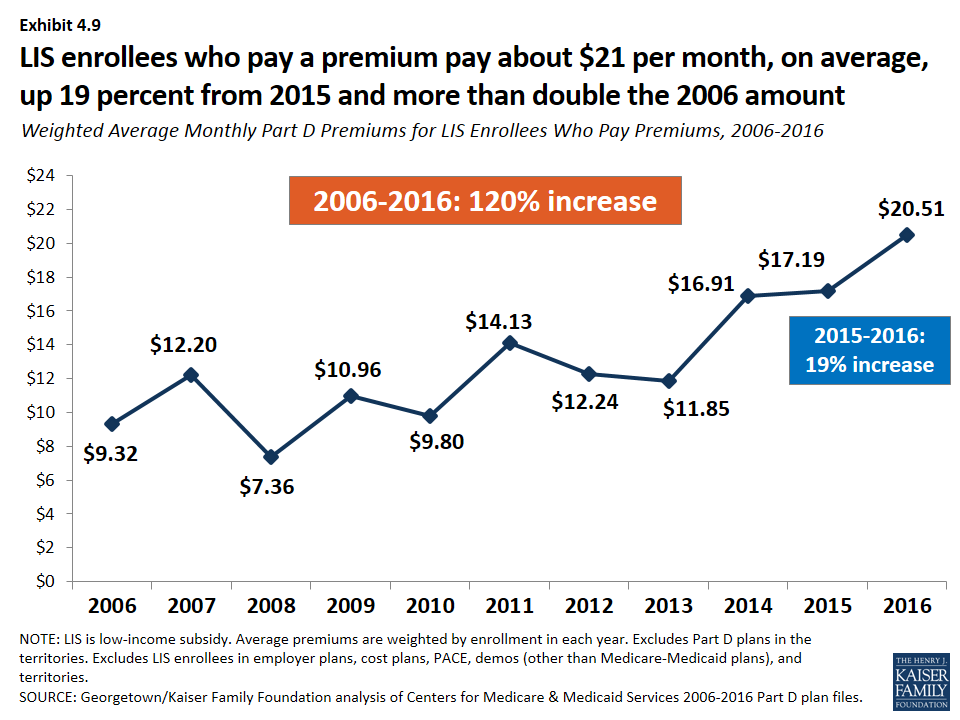
- One in eight Part D enrollees who receive the LIS—1.5 million beneficiaries—pay a monthly premium for Part D coverage, averaging $21 per month, even though premium-free PDPs are available in all regions; 45 percent of these 1.5 million enrollees pay $20 or more per month.
- Almost all Part D enrollees are in plans with five cost-sharing tiers: two generic tiers, two brand tiers, and a specialty tier. PDPs typically charge coinsurance rather than copayments for brand-name drugs, and the use of tiered pharmacy networks is now the norm in PDPs. These trends have cost implications for beneficiaries, with greater unpredictably in out-of-pocket costs associated with coinsurance rates, but also the potential for savings if beneficiaries use drugs on preferred tiers or obtained from preferred cost-sharing pharmacies.
Key Findings
Section 1: Part D Enrollment and Plan Availability
Since 2006, the share of Medicare beneficiaries enrolled in a Part D plan has increased from 52 percent to 71 percent of all eligible Medicare beneficiaries.
- Nearly 41 million Medicare beneficiaries, or 71 percent of all Medicare beneficiaries nationwide, are enrolled in Part D plans, including plans open to everyone and employer-only plans designed solely for retirees of a former employer (Exhibit 1.1). The percent of Medicare beneficiaries with Part D coverage in 2016 varies by state, from 56 percent in Alaska to 89 percent in North Dakota (Exhibit 1.2).
- More than half (60 percent) of Part D enrollees are in PDPs, but enrollment in MA-PD plans has increased over time as a share of total Part D enrollment, from 28 percent in 2006 to 40 percent in 2016, roughly in line with overall growth in Medicare Advantage enrollment (Exhibit 1.3). In five states (Arizona, California, Florida, Hawaii, and Oregon), MA-PD plan enrollees account for over half of all Part D enrollees (Exhibit 1.4).
- In 2016, 6.6 million Medicare beneficiaries are enrolled in employer-only Part D plans (Exhibit 1.5). This number has grown rapidly since a change in the tax status of the federal retiree drug subsidy (RDS), which is available to employers that provide drug benefits directly to their retirees, took effect in the 2013 tax year. Only 1.9 million beneficiaries (down from 7.2 million in 2006) have drug coverage from employers that receive the RDS.
In 2016, three Part D sponsors account for more than half of all Part D enrollees.
- UnitedHealth, Humana, and CVS Health have enrolled half (52 percent) of all participants in Part D (Exhibit 1.6). This level of market concentration has increased modestly since 2006, but more so among PDPs. UnitedHealth and Humana have had large market shares since the program began, while enrollment in CVS Health has grown through acquisition of other plan sponsors (Exhibit 1.7).
- If the acquisition of Humana by Aetna is approved, the combined firm would account for 26 percent of total Part D enrollment in 2016 nationwide, without divestitures. But in seven regions, the combined firm would have between 40 percent and 50 percent of total Part D enrollment. This acquisition, along with the proposed acquisition of Cigna by Anthem, would increase market concentration. Two thirds of all regions (23 of 34) would be considered highly concentrated, based on the Herfindahl index, with respect to PDP enrollees who are not receiving Low-Income Subsidies (LIS), up from 10 of 34 regions today (Exhibit 1.8). The market for LIS enrollment would also become highly concentrated in more regions (15 post-acquisitions versus four today).
- The vast majority of PDP enrollees are in plans sponsored by firms participating in all or most all regions of the country (Exhibit 1.9). Firms offering plans in one or a few regions play a relatively small role in the program. MA-PD plans sponsored by local firms play a much larger role in that Part D market segment. Nationally, Blue Cross Blue Shield plans comprise 7 percent of PDP enrollment and 17 percent of MA-PD plan enrollment.
- The ten largest sponsors of Part D plans account for 80 percent of all enrollment (Exhibit 1.10), and have varying shares of enrollees in PDPs versus MA-PD plans (Exhibit 1.11). UnitedHealth, by itself, has maintained the top position for all 10 years of the program, and in 2016 provides coverage to more than one in five PDP and MA-PD plan enrollees, but CVS Health has the most PDP enrollees for the first time in 2016. At the individual plan level, SilverScript Choice PDP has the most enrollees in 2016, a position previously held by AARP MedicareRx Preferred PDP (Exhibit 1.12). Since 2006, PDP enrollment has grown substantially in some of the largest plan sponsors; in others, enrollment growth has been relatively flat (Exhibit 1.13).
- SilverScript Choice PDP has the most LIS PDP enrollees (Exhibit 1.14), while AARP MedicareRx Preferred PDP has the most non-LIS PDP enrollees (Exhibit 1.15).
The average Medicare beneficiary has a choice of 26 PDPs and 16 MA-PD plans in 2016.
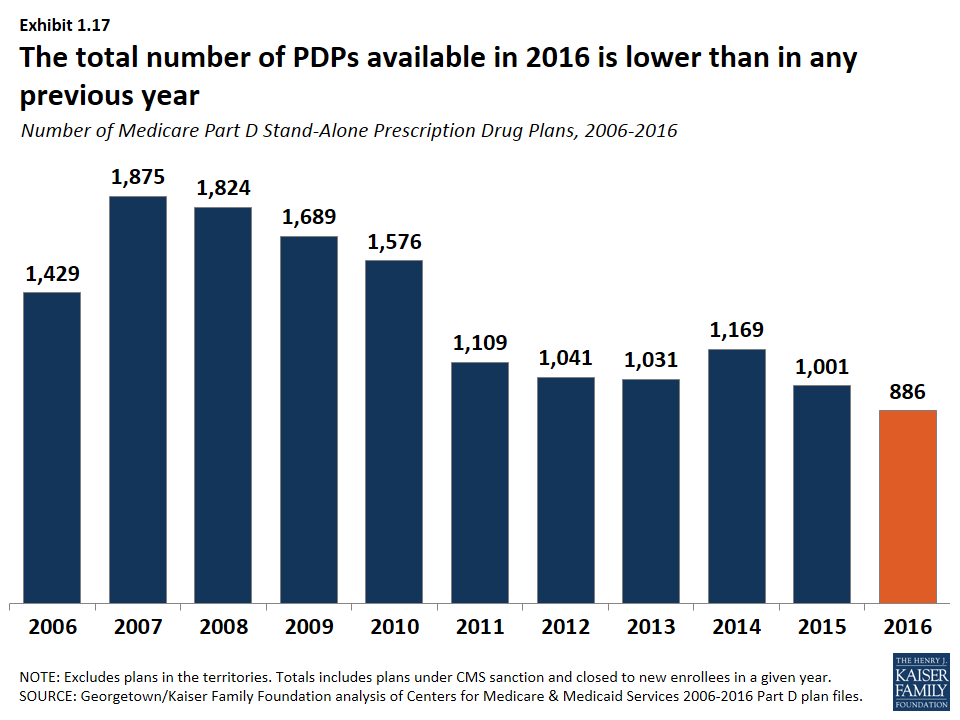
- The average number of PDPs available to people on Medicare has dropped from a high of 55 plans in 2007 to 26 plans in 2016, which are offered by 13 different firms (Exhibit 1.16). The number of MA-PD plans per beneficiary in 2016 increased slightly from 2015, from 15 to 16 plans. The total number of stand-alone PDPs available in 2016—886 PDPs—is lower than in any previous year (Exhibit 1.17).
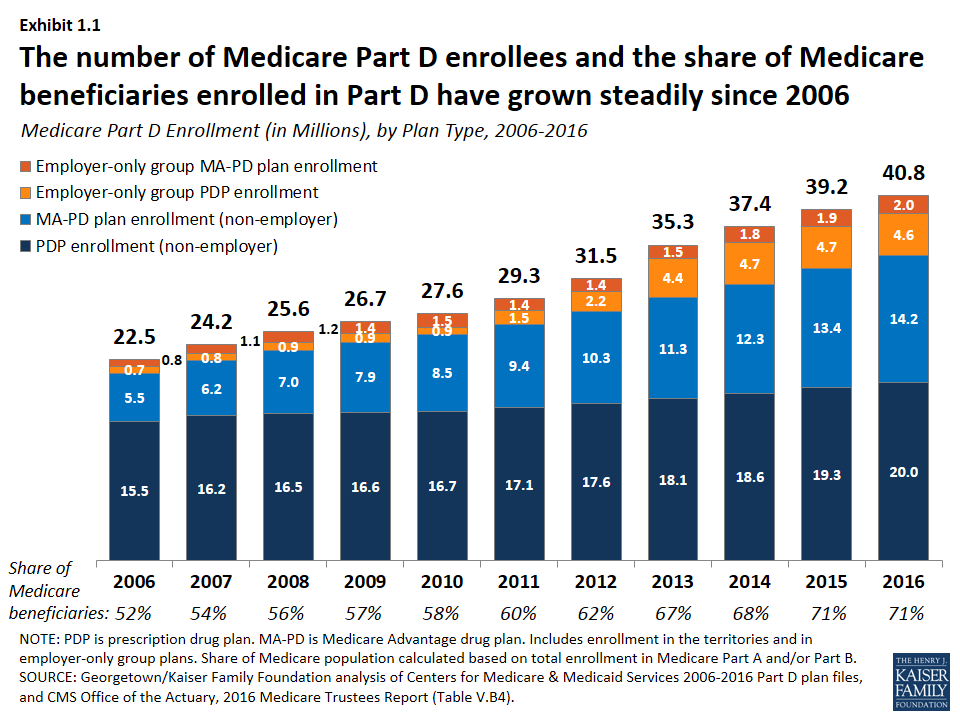
Medicare Part D Enrollment (in Millions), by Plan Type, 2006-2016
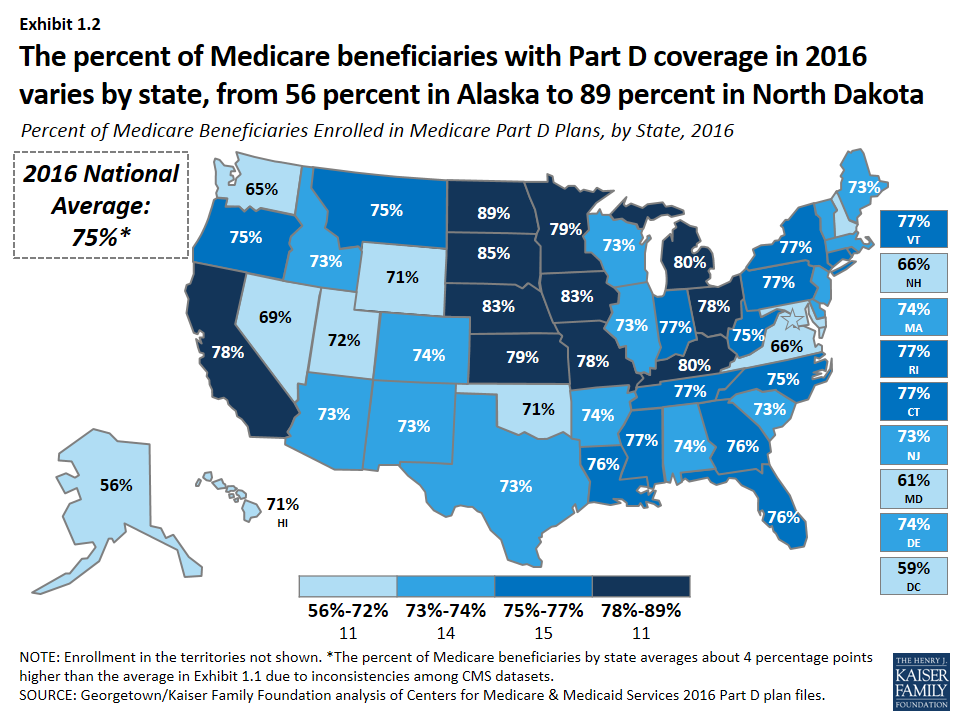
Percent of Medicare Beneficiaries Enrolled in Medicare Part D Plans, by State, 2016
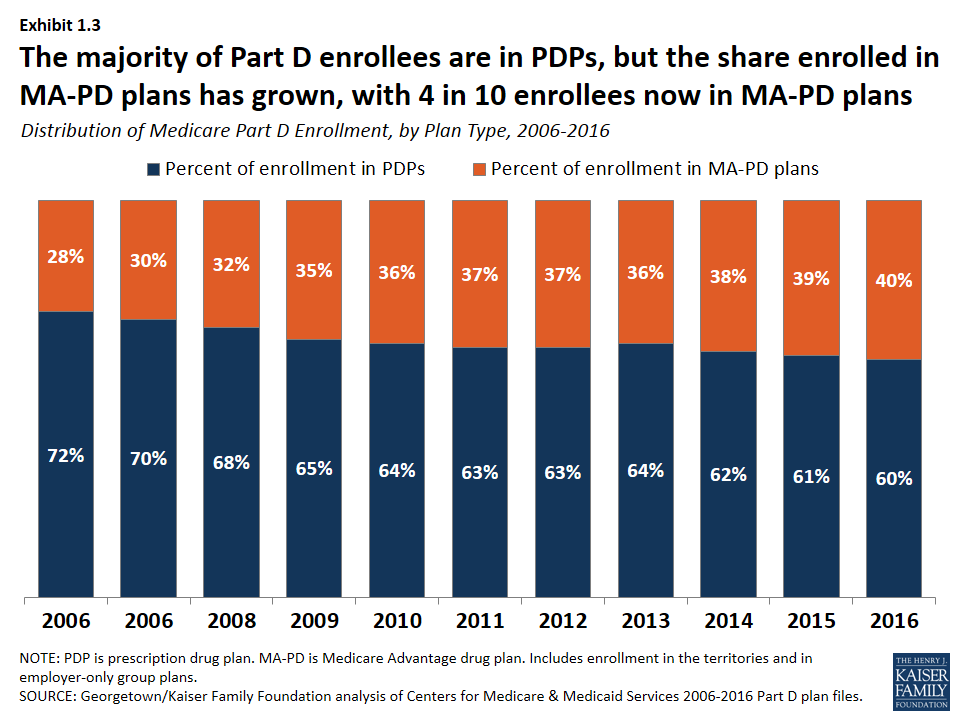
Distribution of Medicare Part D Enrollment, by Plan Type, 2006-2016

Percent of Medicare Part D Enrollees in Stand-Alone PDPs, by State, 2016
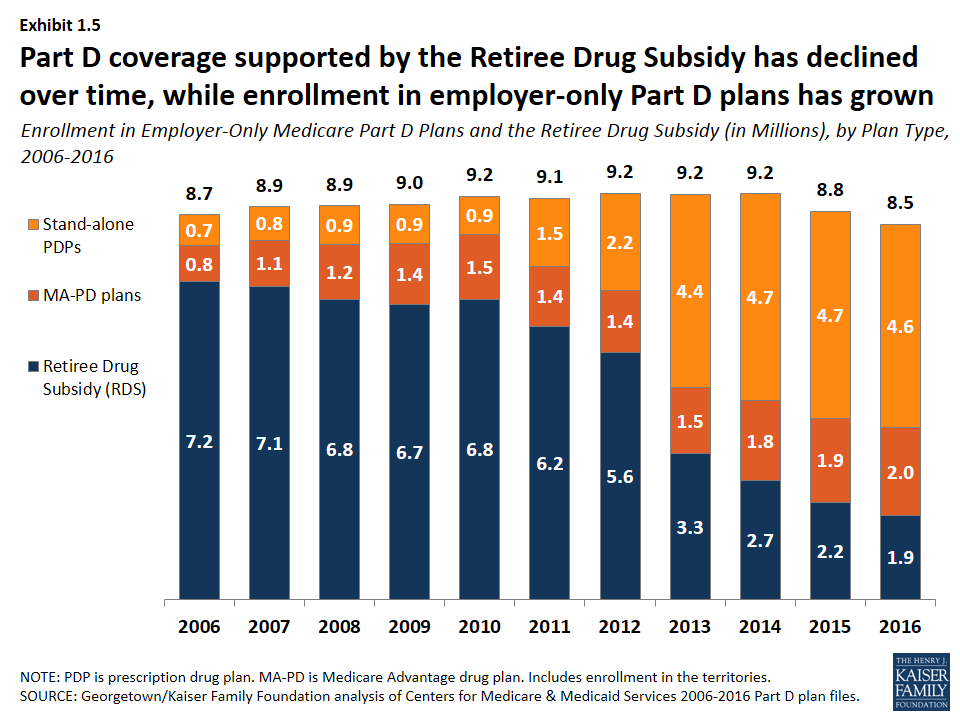
Enrollment in Employer-Only Medicare Part D Plans and the Retiree Drug Subsidy (in Millions), by Plan Type, 2006-2016
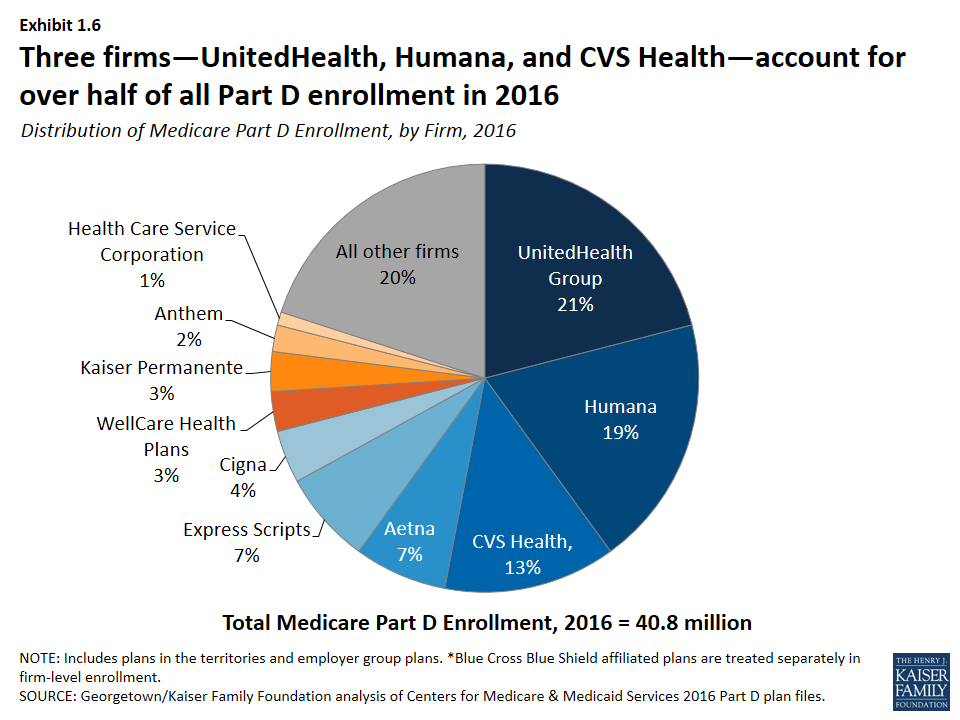
Distribution of Medicare Part D Enrollment, by Firm, 2016
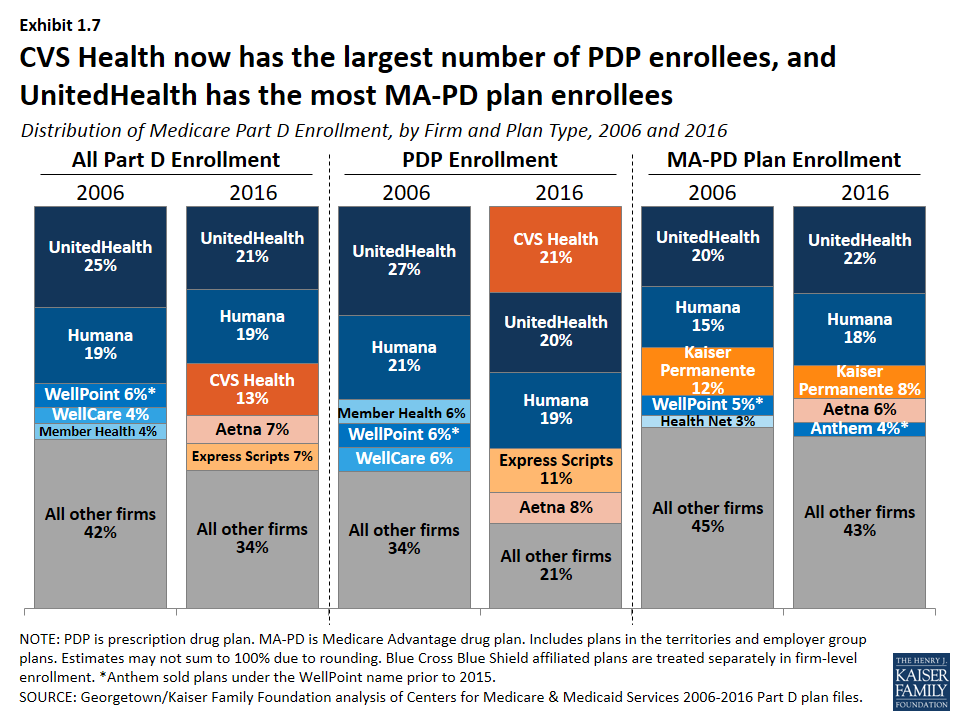
Distribution of Medicare Part D Enrollment, by Firm and Plan Type, 2006 and 2016
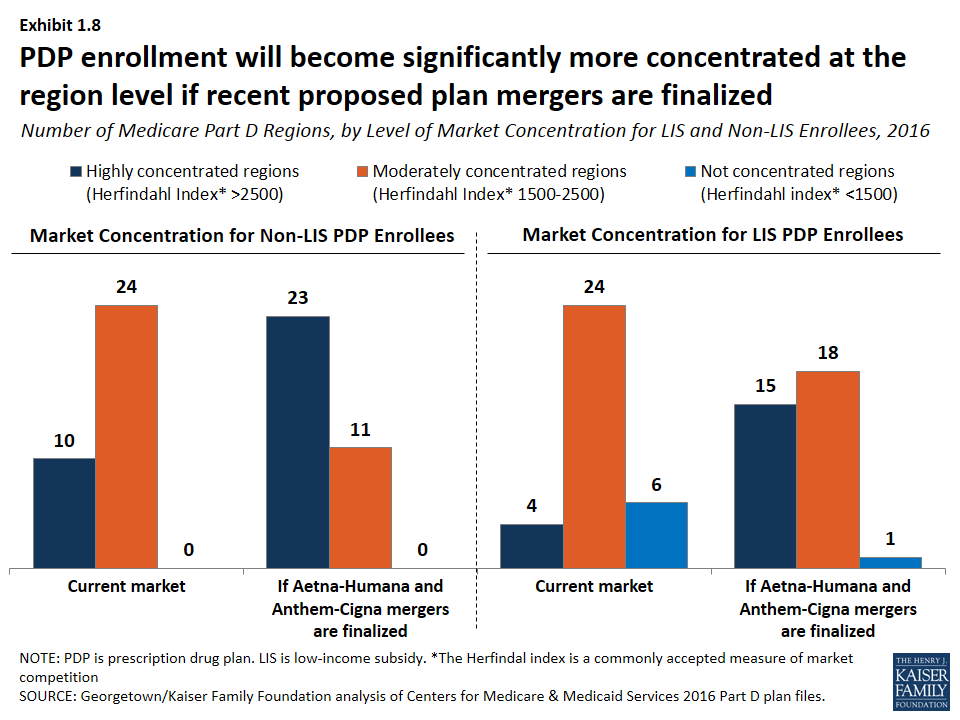
Number of Medicare Part D Regions, by Level of Market Concentration for LIS and Non-LIS Enrollees, 2016
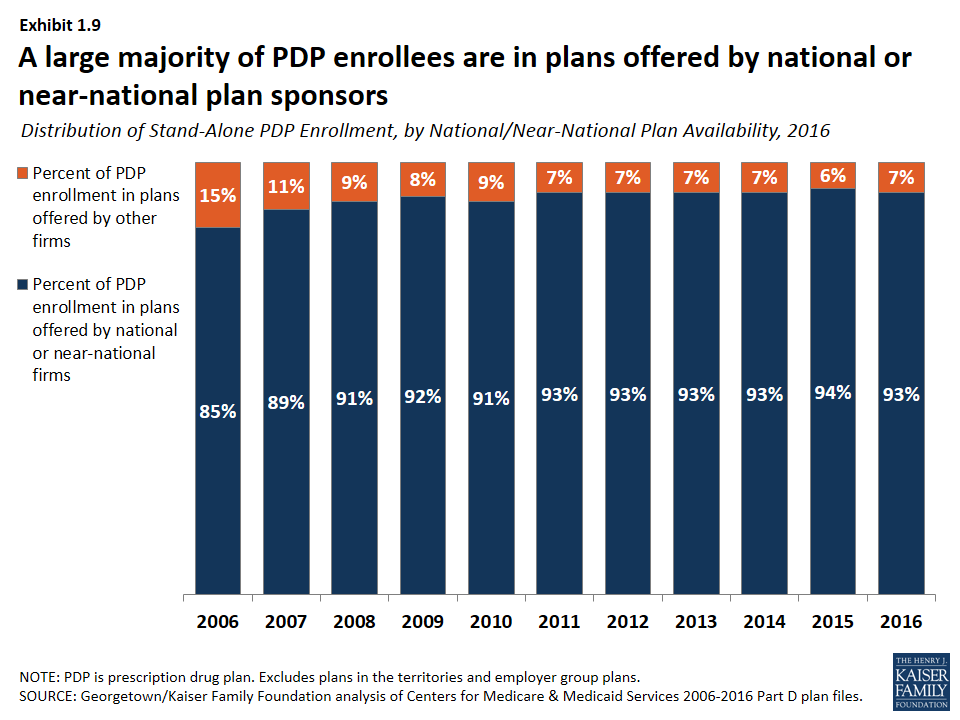
Distribution of Stand-Alone PDP Enrollment, by National/Near-National Plan Availability, 2016
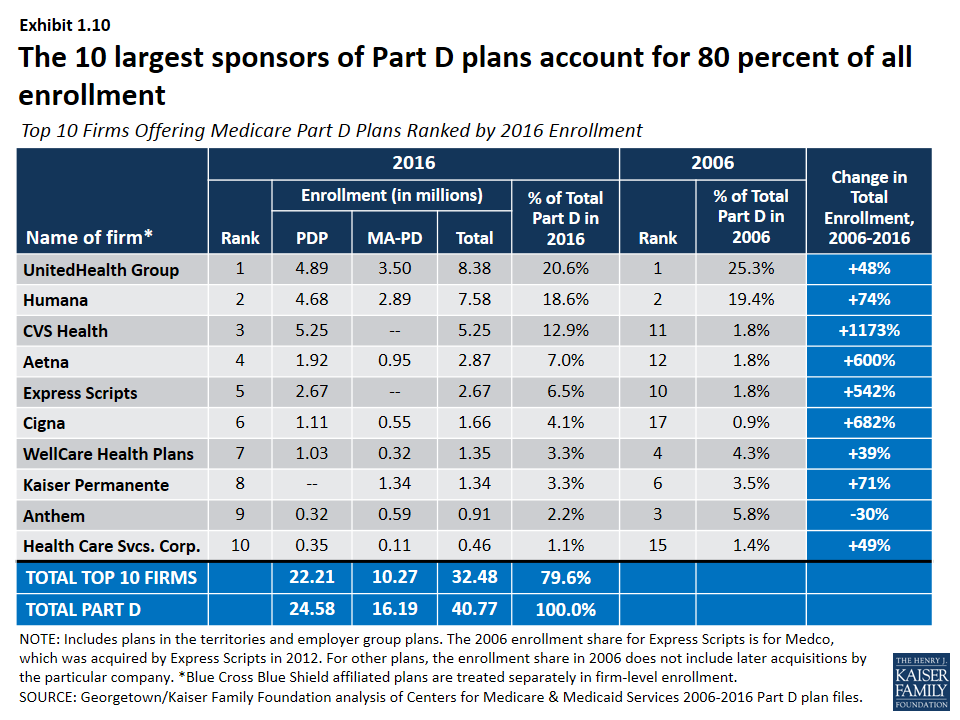
Top 10 Firms Offering Medicare Part D Plans Ranked by 2016 Enrollment
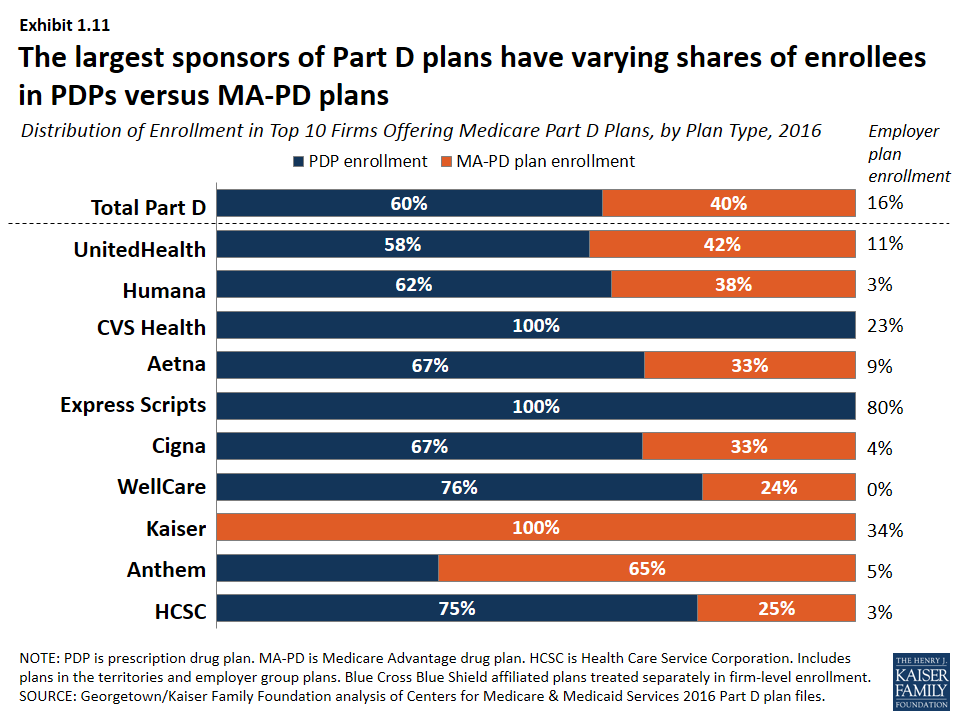
Distribution of Enrollment in Top 10 Firms Offering Medicare Part D Plans, by Plan Type, 2016
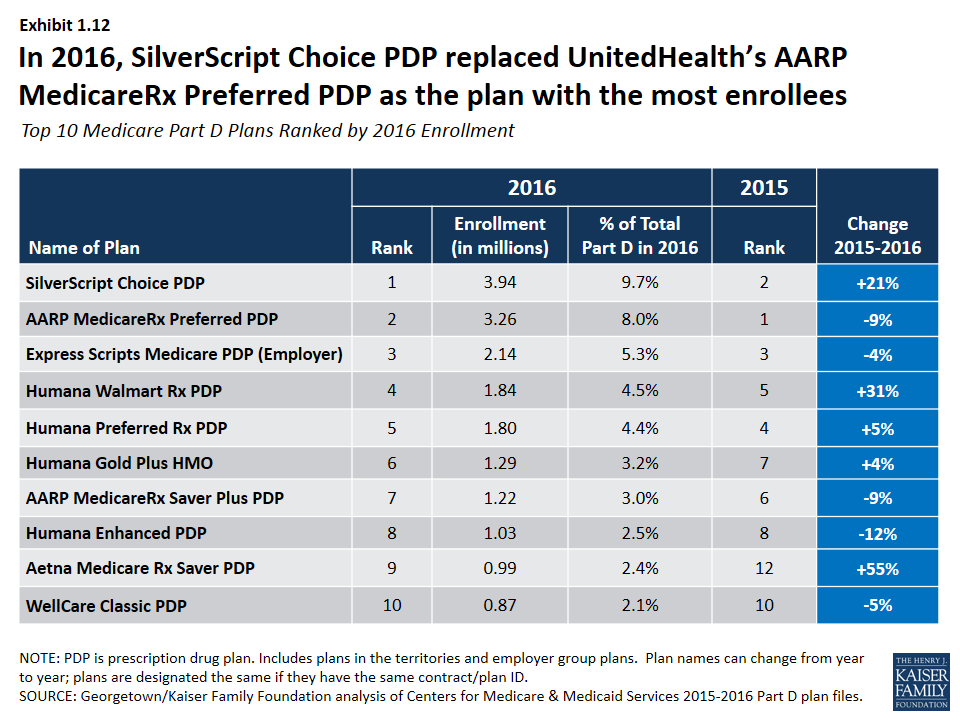
Top 10 Medicare Part D Plans Ranked by 2016 Enrollment
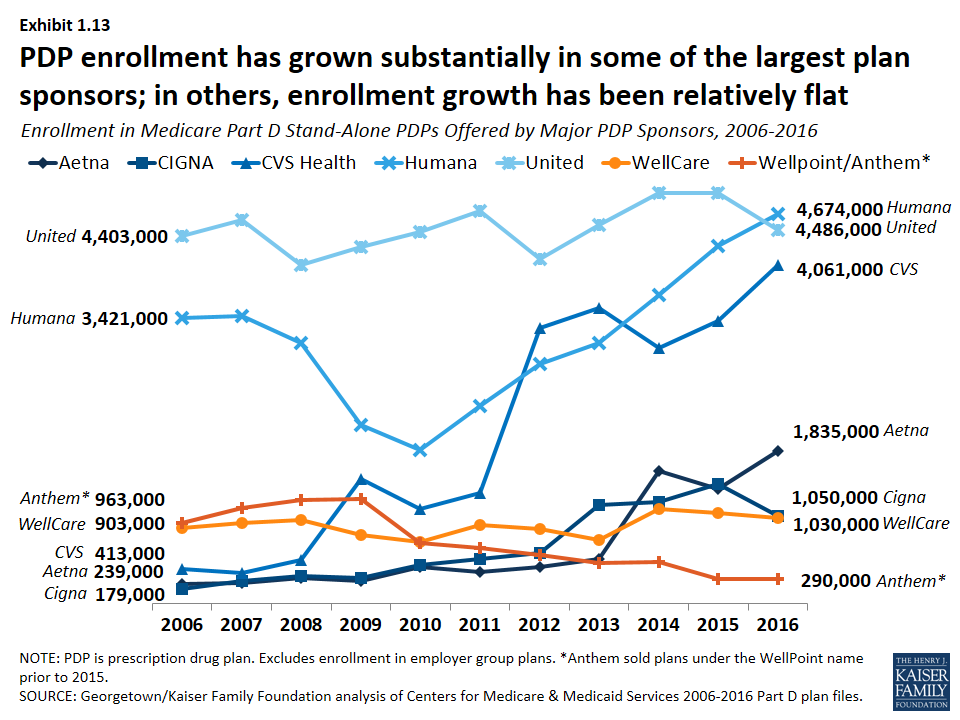
Enrollment in Medicare Part D Stand-Alone PDPs Offered by Major PDP Sponsors, 2006-2016
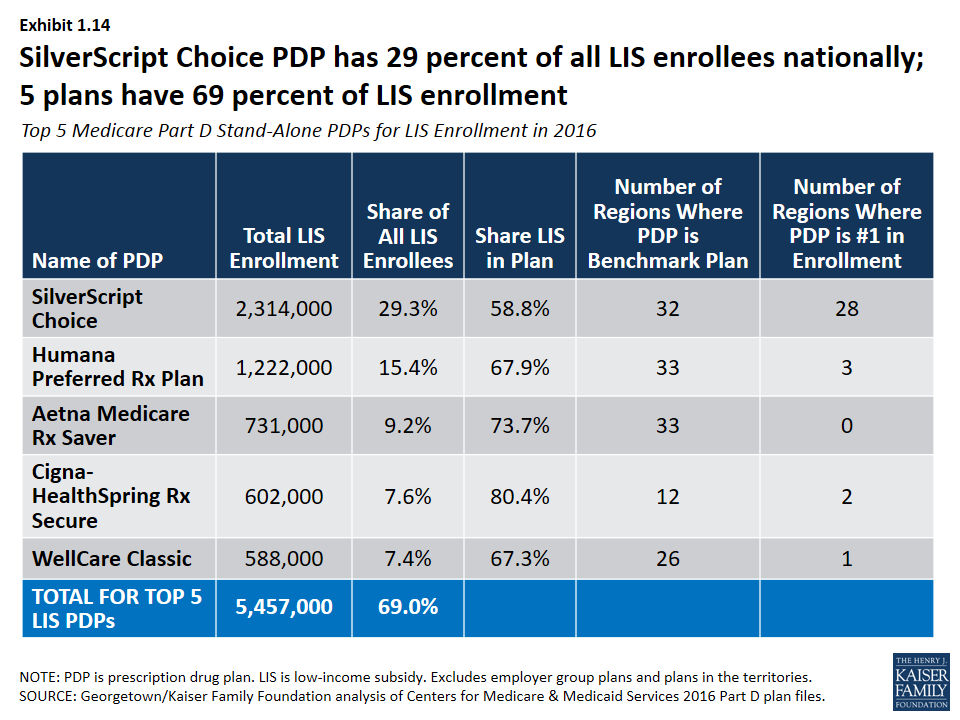
Top 5 Medicare Part D Stand-Alone PDPs for LIS Enrollment in 2016
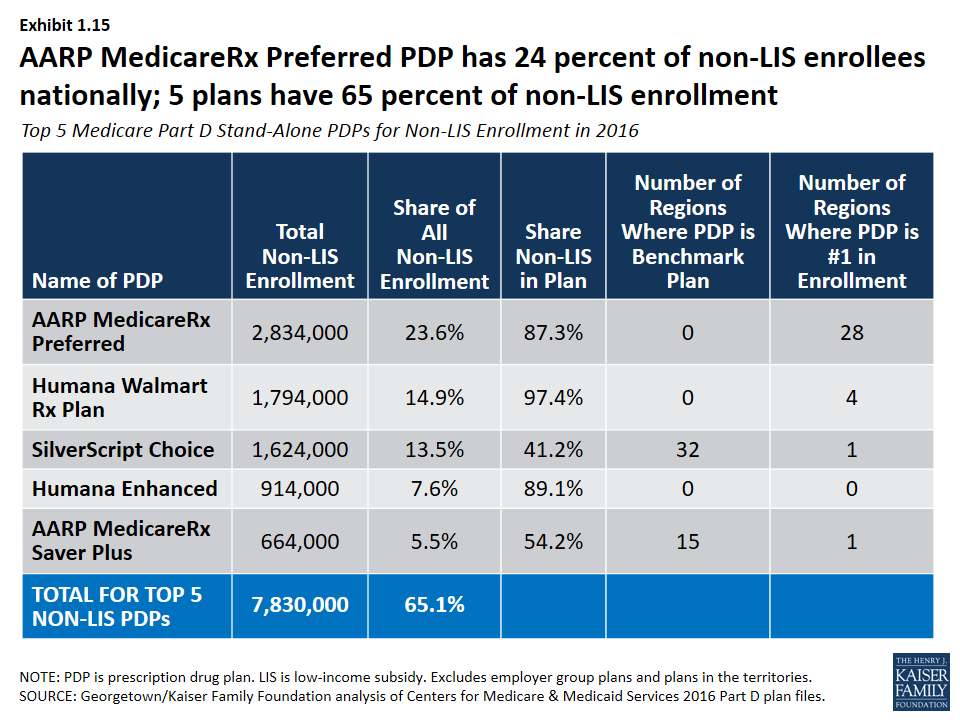
Top 5 Medicare Part D Stand-Alone PDPs for Non-LIS Enrollment in 2016
Average Number of Medicare Part D Plans Offered to Enrollees, 2006-2016
Number of Medicare Part D Stand-Alone Prescription Drug Plans, 2006-2016
Section 2: Part D Premiums
Average monthly PDP premiums rose in 2016 after being essentially flat since 2010; MA-PD plan premiums for Part D coverage only have risen modestly in the past few years.
- PDP enrollees are in plans with an average monthly premium of $39.21 in 2016, up by 6 percent from 2015 (Exhibit 2.1). MA-PD plan enrollees are in plans with an average monthly premium of $16.99 for Part D benefits, a lower amount due in part to the ability of firms offering MA-PD plans to use rebate dollars from Medicare payments for benefits covered under Parts A and B to lower their Part D premiums. The combined average Part D premium for PDP and MA-PD plan enrollees is $31.21 in 2016.
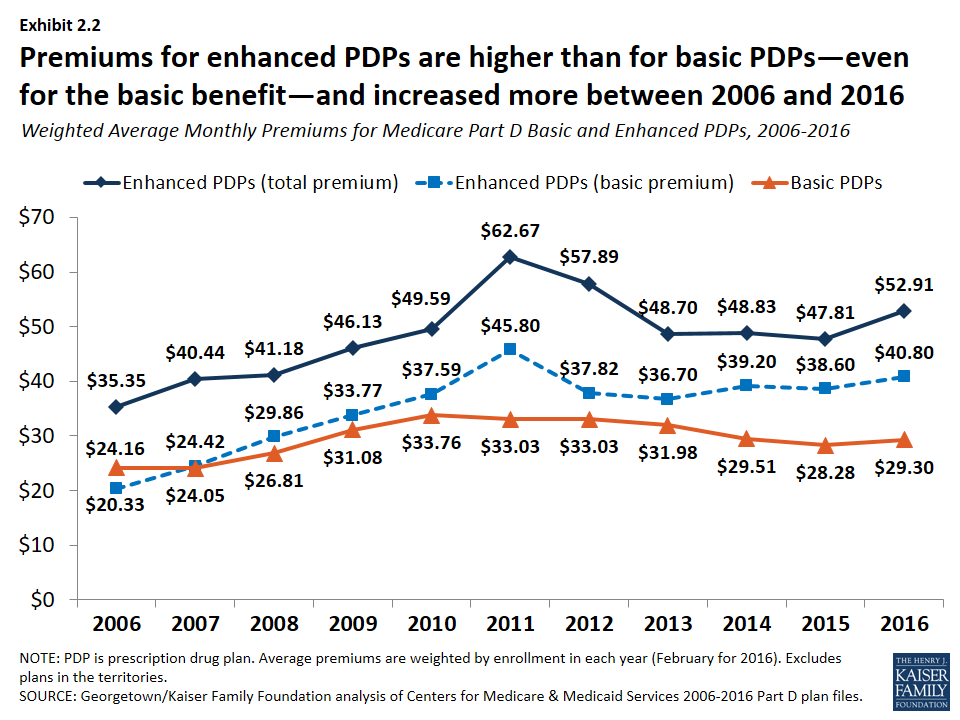
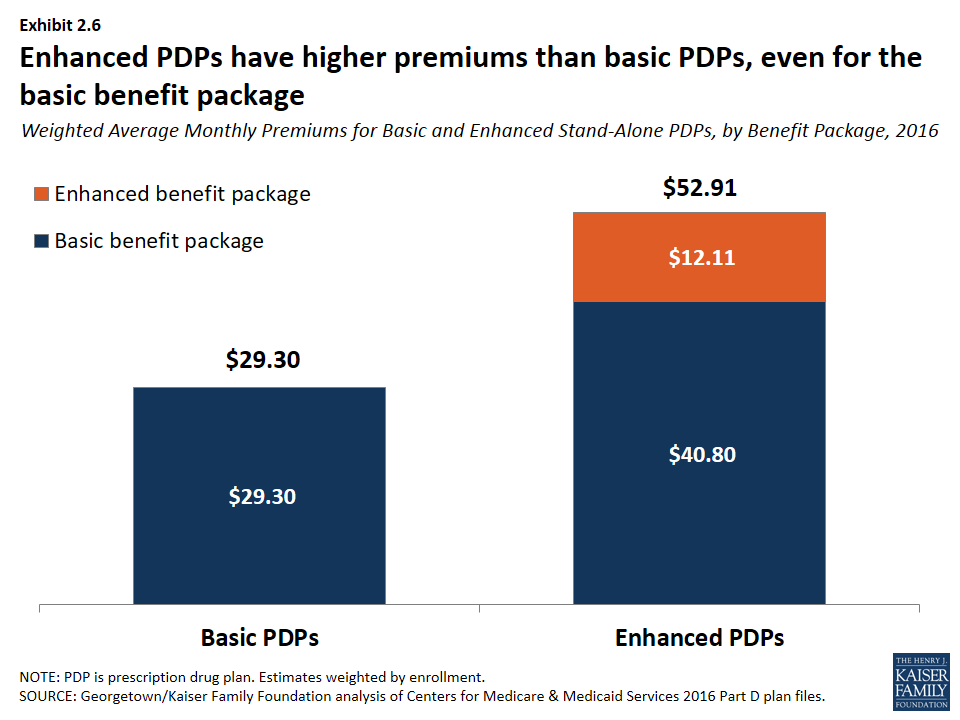
- Premiums for enhanced PDPs grew more rapidly than premiums for basic plans from 2015 to 2016 (11 percent versus 4 percent) (Exhibit 2.2).
- In 2016, just over half of MA-PD plan enrollees are in plans that charge no monthly premium for Part D coverage. Nearly half of PDP enrollees are in plans that charge less than $30 per month, but one in five are in plans charging at least $60 (Exhibit 2.3).
Premiums for some of the most popular plans increased in 2016, while for others, premiums fell.
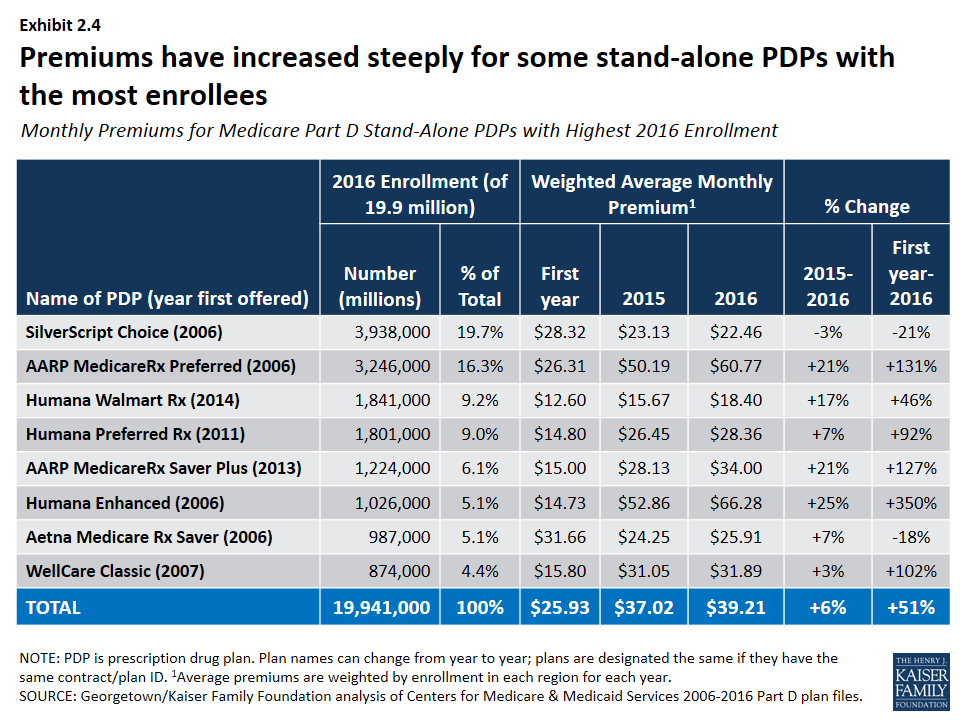
- Monthly premiums for three of the six largest PDPs (AARP MedicareRx Preferred, AARP MedicareRx Saver Plus, and Humana Enhanced) increased premiums by at least 20 percent in 2016 over 2015 levels (Exhibit 2.4); (Exhibit 2.5). By contrast, SilverScript Choice lowered its premium by 3 percent. Some PDPs have entered the market and gained enrollment by charging low premiums, but increased premiums substantially in later years.
Premiums vary widely across plans, even among those offering an equivalent benefit type.
- PDPs offering the basic Part D benefit have an average monthly premium of $29.30 in 2016, while PDPs offering enhanced benefits have a higher average monthly premium of $52.91. The portion of the premium for enhanced plans that is attributable to the basic benefit is about 40 percent higher than the average premium for basic plans, suggesting that some of the difference may be attributable to health differences of enrollees in enhanced plans not captured by risk adjusters (Exhibit 2.6).
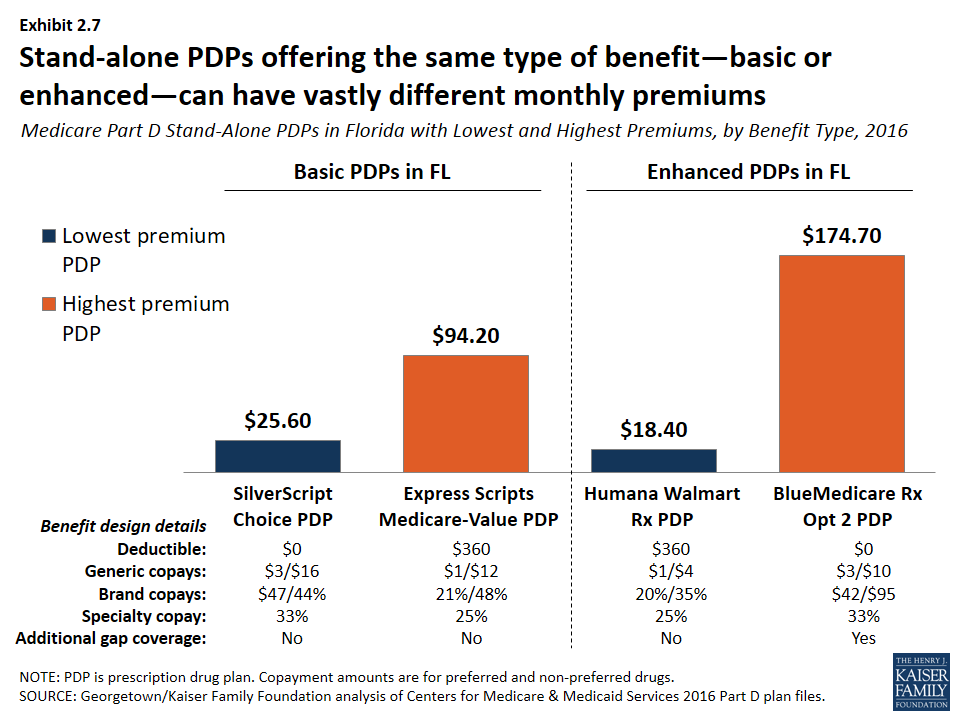
- Premiums vary widely for basic-benefit PDPs, ranging from $11.40 (SilverScript Choice in Arkansas) to $139.70 (Transamerica MedicareRx Classic in Illinois). Premiums for enhanced PDPs also vary widely, from $18.40 for the Humana Walmart Rx PDP, available in all 34 regions, to $174.40 for the BlueMedicare Rx-Option 2 PDP, only available in Florida. Even within any given region, stand-alone PDPs offering the same type of benefit—basic or enhanced—can have vastly different monthly premiums (Exhibit 2.7).
- MA-PD plan monthly premiums for Part D benefits also vary considerably, although MA-PD plan enrollees typically see a total premium that combines the cost of their medical and drug benefits. About half of MA-PD plan enrollees are in plans with a $0 drug premium, but premiums range as high as $78.80 for a plan offering the basic benefit and $139.10 for a plan with an enhanced benefit. Weighted average Part D premiums for the firms with the most MA-PD plan enrollees range from about $5 per month (Aetna and Cigna) to about $20 per month (Anthem) (Exhibit 2.8).
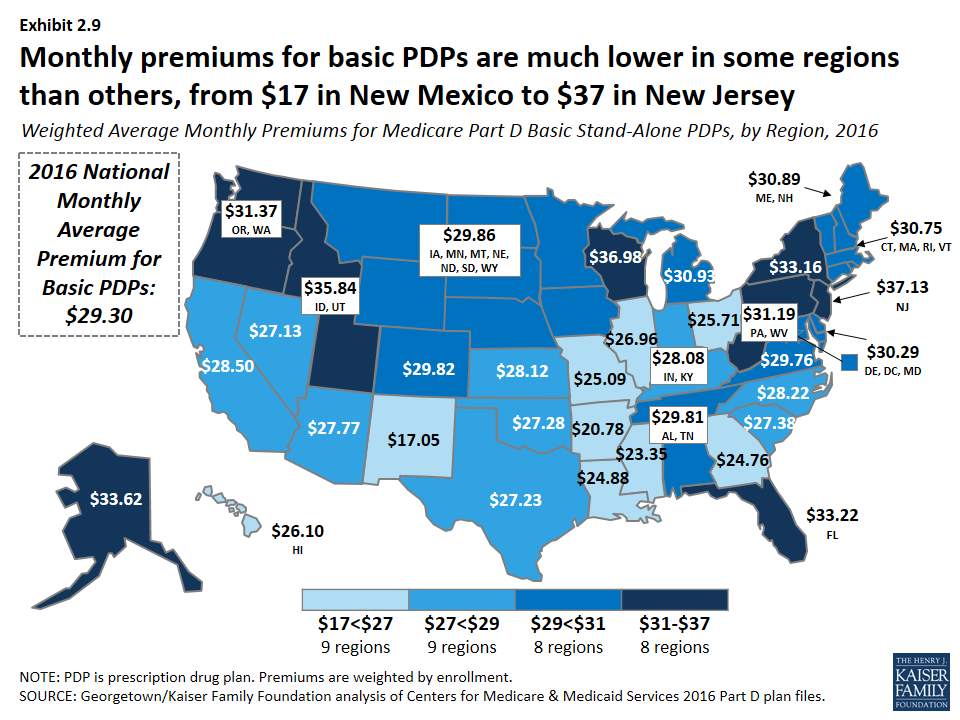
Premiums vary widely across geographic regions.
- The average monthly premium for PDPs offering the basic benefit is $17.05 in New Mexico, but it is more than twice that amount ($37.13) in New Jersey (Exhibit 2.9).
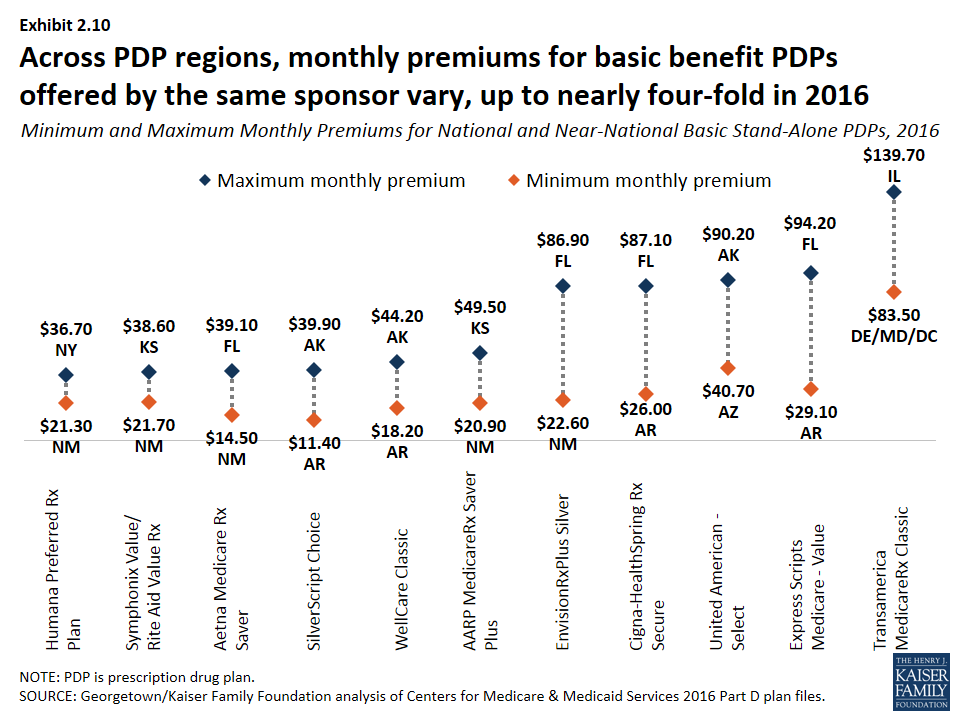
- For the identical plan offered by the same sponsor, monthly premiums vary across regions by as much as nearly four-fold (Exhibit 2.10). For example, premiums for SilverScript Choice, the PDP with the most enrollees nationally, range from $11.40 in Arkansas to more than three times that amount ($39.90) in Alaska.
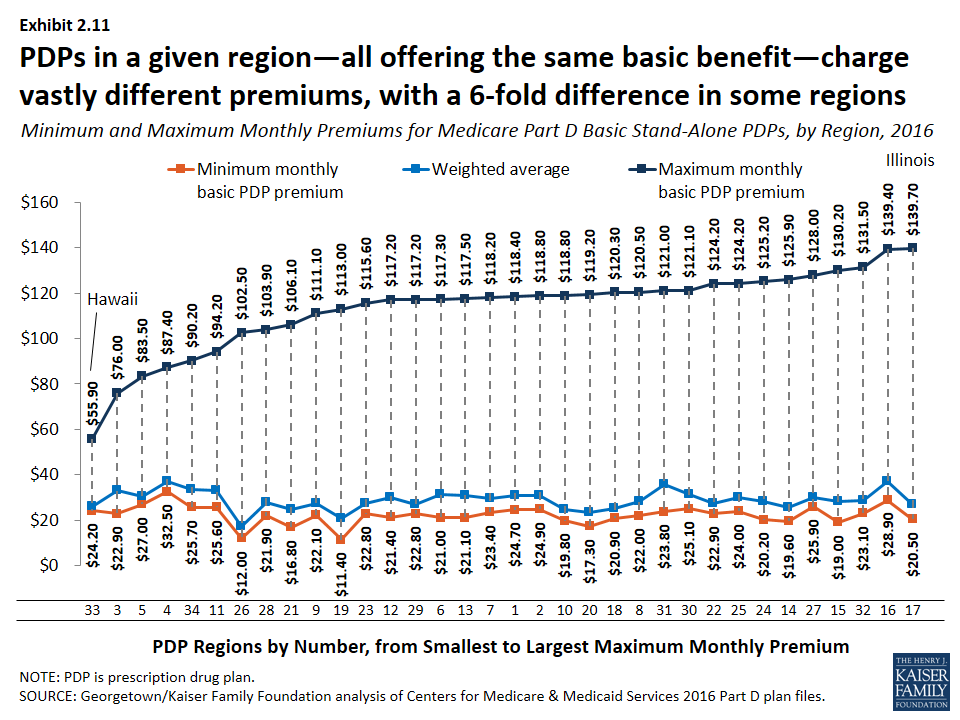
- In most regions, the range of premiums for PDPs offering the basic benefit is substantial (Exhibit 2.11). In Illinois, for example, the highest basic PDP premium is $139.70, almost seven times higher than the lowest basic PDP premium of $20.50. These differences are exaggerated by high premiums for the Transamerica MedicareRx Classic PDPs, which has no more than 0.2 percent of enrollment in any of the 30 regions where it is offered.
Medicare Part D Weighted Average Monthly Premiums, Overall and by Plan Type, 2006-2016
Weighted Average Monthly Premiums for Medicare Part D Basic and Enhanced PDPs, 2006-2016

Distribution of Medicare Part D Enrollment, by Plan Type and Monthly Part D Premium Amount, 2016
Monthly Premiums for Medicare Part D Stand-Alone PDPs with Highest 2016 Enrollment
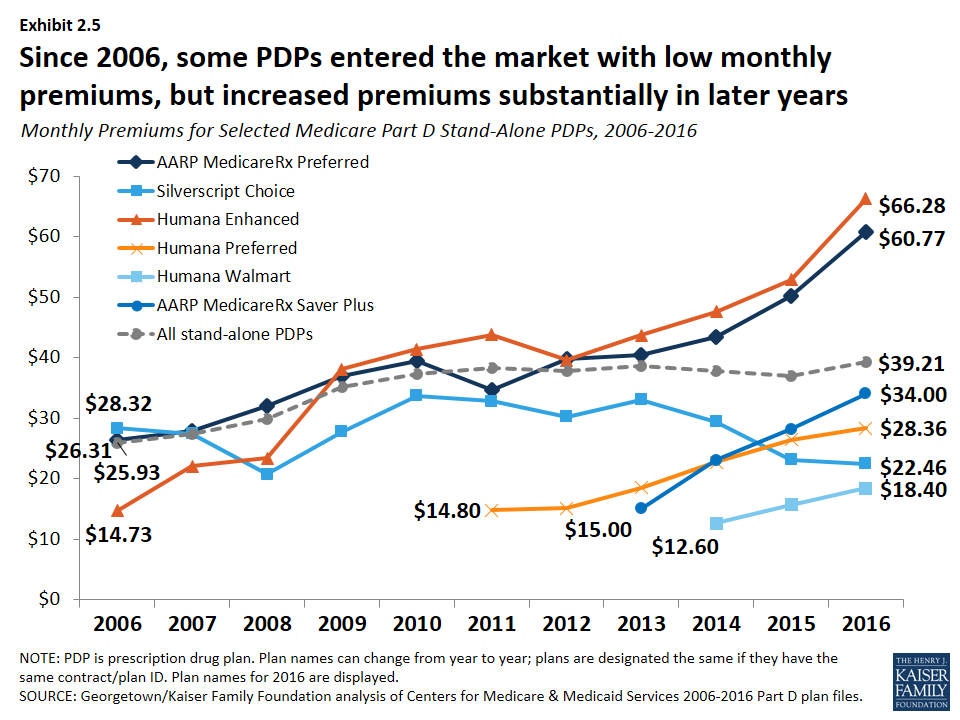
Monthly Premiums for Selected Medicare Part D Stand-Alone PDPs, 2006-2016
Weighted Average Monthly Premiums for Basic and Enhanced Stand-Alone PDPs, by Benefit Package, 2016
Medicare Part D Stand-Alone PDPs in Florida with Lowest and Highest Premiums, by Benefit Type, 2016
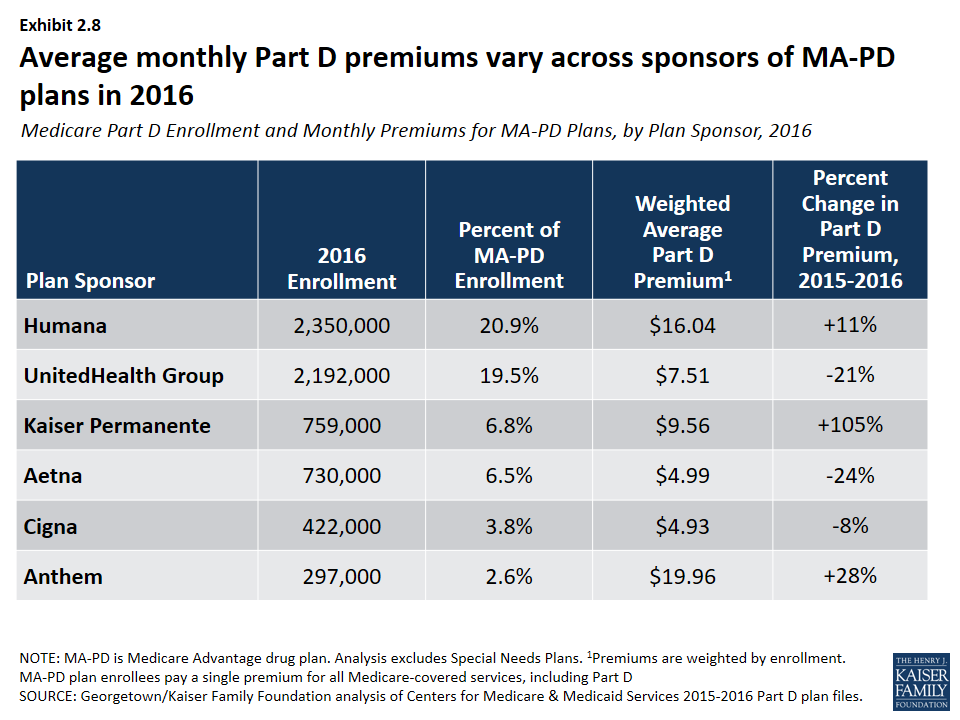
Medicare Part D Enrollment and Monthly Premiums for MA-PD Plans, by Plan Sponsor, 2016
Weighted Average Monthly Premiums for Medicare Part D Basic Stand-Alone PDPs, by Region, 2016
Minimum and Maximum Monthly Premiums for National and Near-National Basic Stand-Alone PDPs, 2016
Minimum and Maximum Monthly Premiums for Medicare Part D Basic Stand-Alone PDPs, by Region, 2016
Section 3: Part D Benefit Design and Cost Sharing
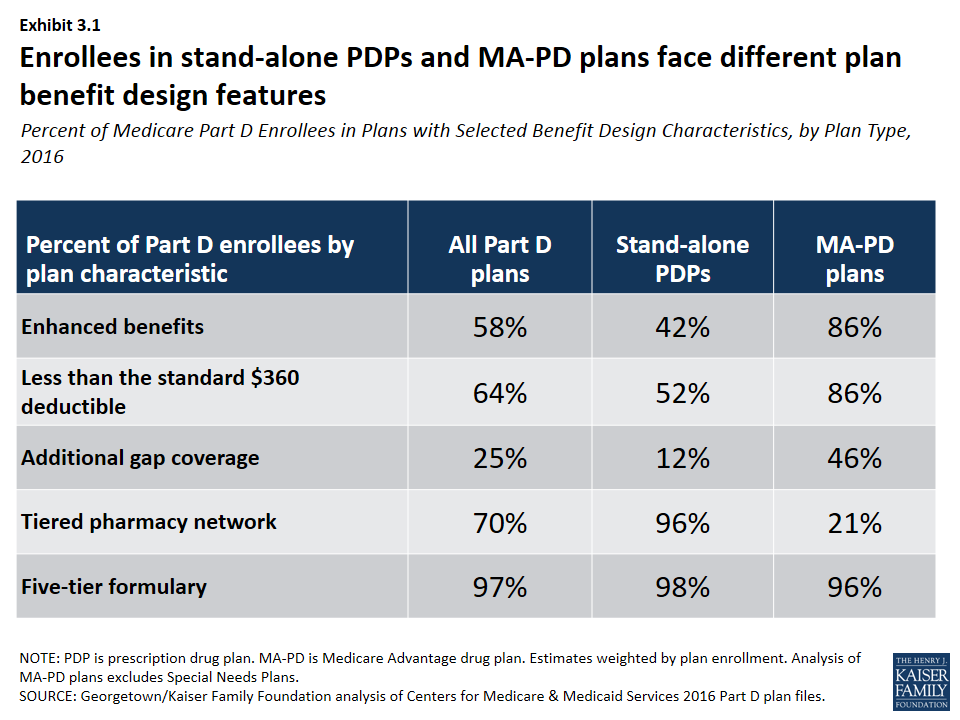
Stand-alone PDPs and MA-PD plans differ along several key characteristics related to benefit design.
- The majority of PDP and MA-PD plan enrollees are in plans with five-tier formularies, tiered pharmacy networks, enhanced benefits, no additional gap coverage, and deductibles below the standard amount of $360. However, a much larger share of MA-PD plan enrollees are in enhanced plans with deductibles less than $360. More PDP enrollees are in plans with tiered pharmacy networks (Exhibit 3.1).
Over half of PDP enrollees are in PDPs offering the basic benefit in 2016.
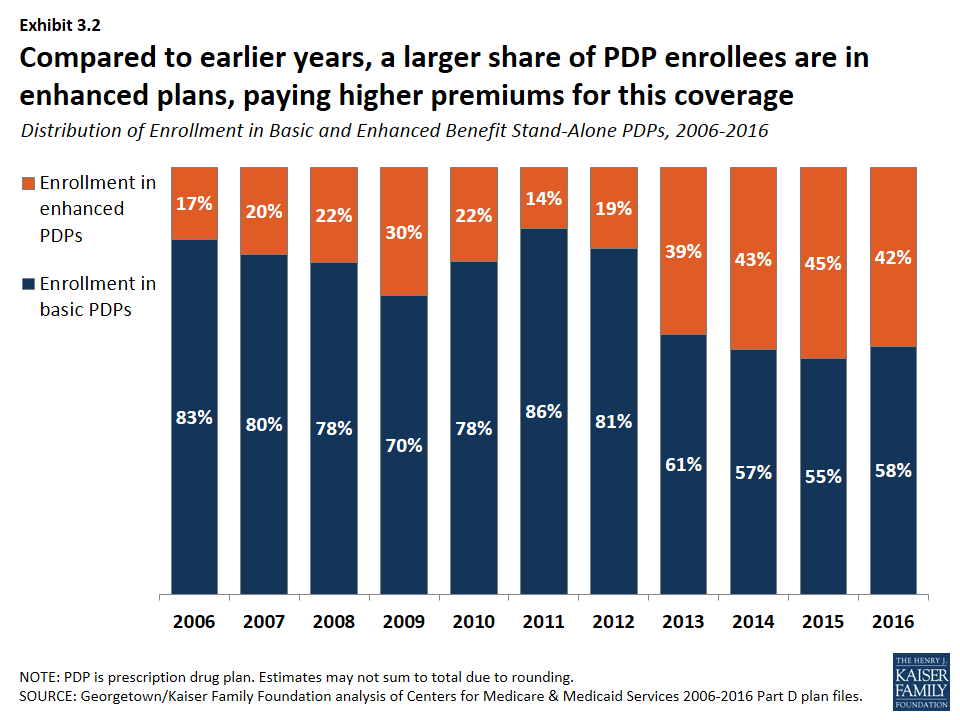
- In 2016, 58 percent of PDP enrollees—but only 14 percent of MA-PD plan enrollees—are in plans offering the basic (rather than enhanced) benefit, a sizeable reduction from 83 percent of PDP enrollees in basic-benefit plans in 2006 (Exhibit 3.2).
In 2016, about half of all enrollees in PDPs or MA-PD plans are in plans that waive the Part D deductible.
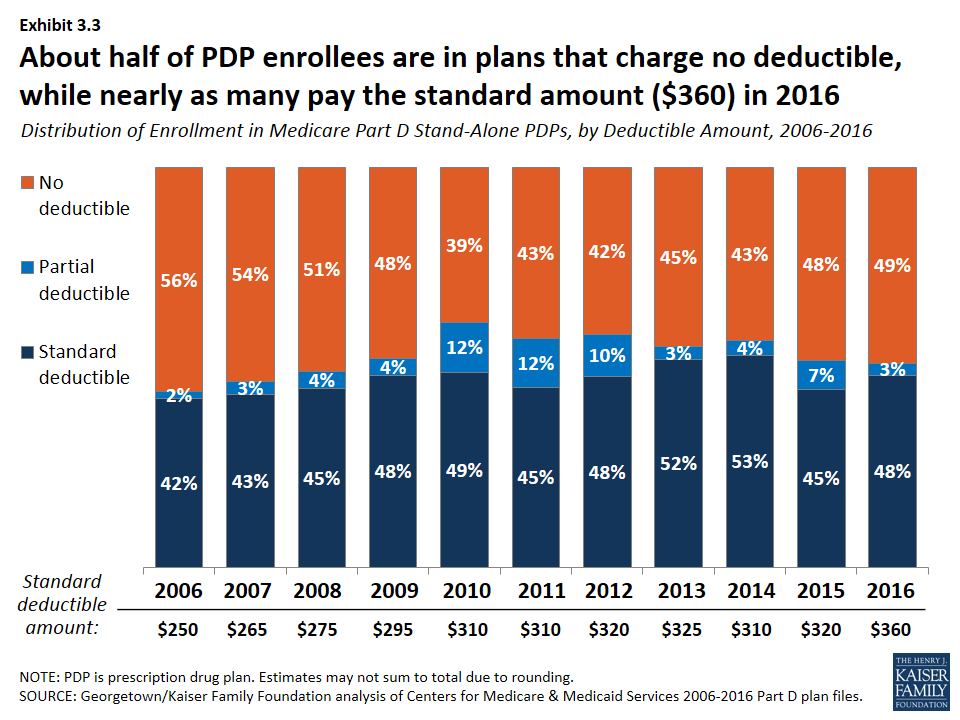
- About 48 percent of PDP enrollees are in plans charging the full standard deductible ($360) in 2016, and 3 percent of PDP enrollees are in plans with a deductible that is smaller than the standard amount (Exhibit 3.3). The shares among MA-PD plan enrollees are 14 percent and 37 percent, respectively (Exhibit 3.4).
In 2016, nearly all plans use five cost-sharing tiers: preferred and non-preferred generic drugs, preferred and non-preferred brand drugs, and specialty drugs.
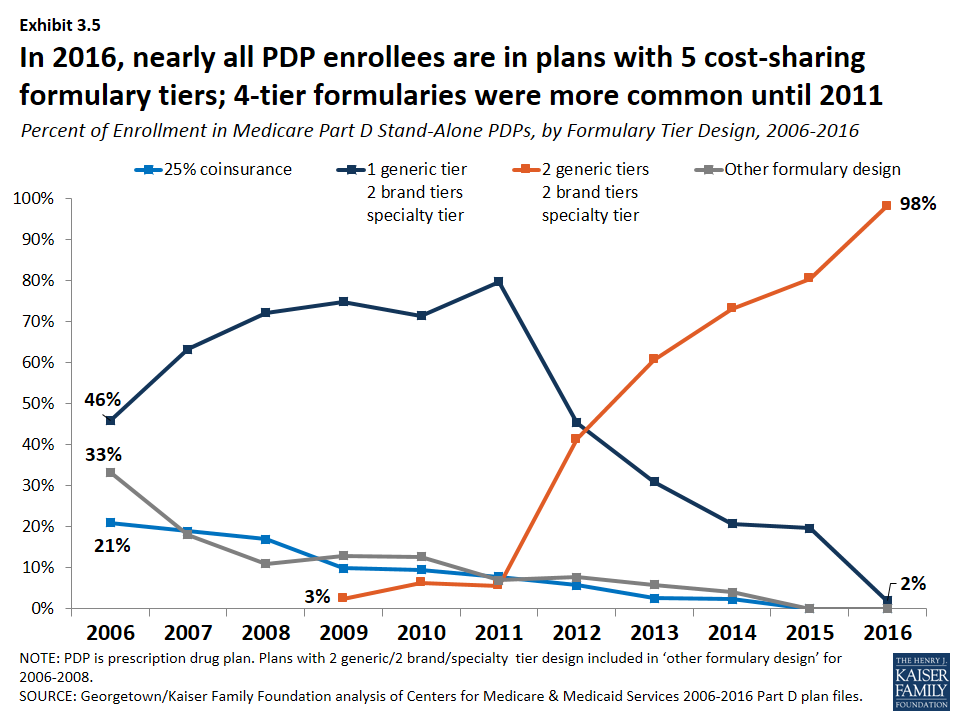
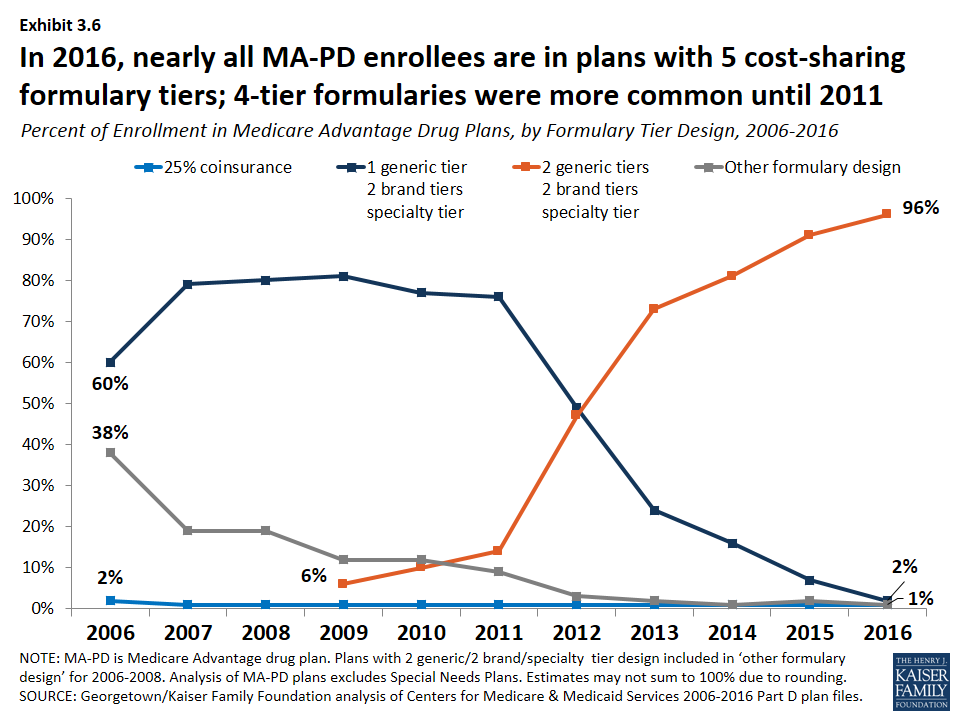
- The vast majority of all Part D enrollees (98 percent of PDP enrollees and 96 percent of MA-PD plan enrollees) are in plans that use five cost-sharing tiers for their formularies, a design that gained popularity starting in 2012 (Exhibit 3.5); (Exhibit 3.6). In 2006, most enrollees were in plans with only three or four tiers.
Cost sharing for generic drugs is lower in 2016 than in 2006 for those drugs now placed on preferred generic tiers.
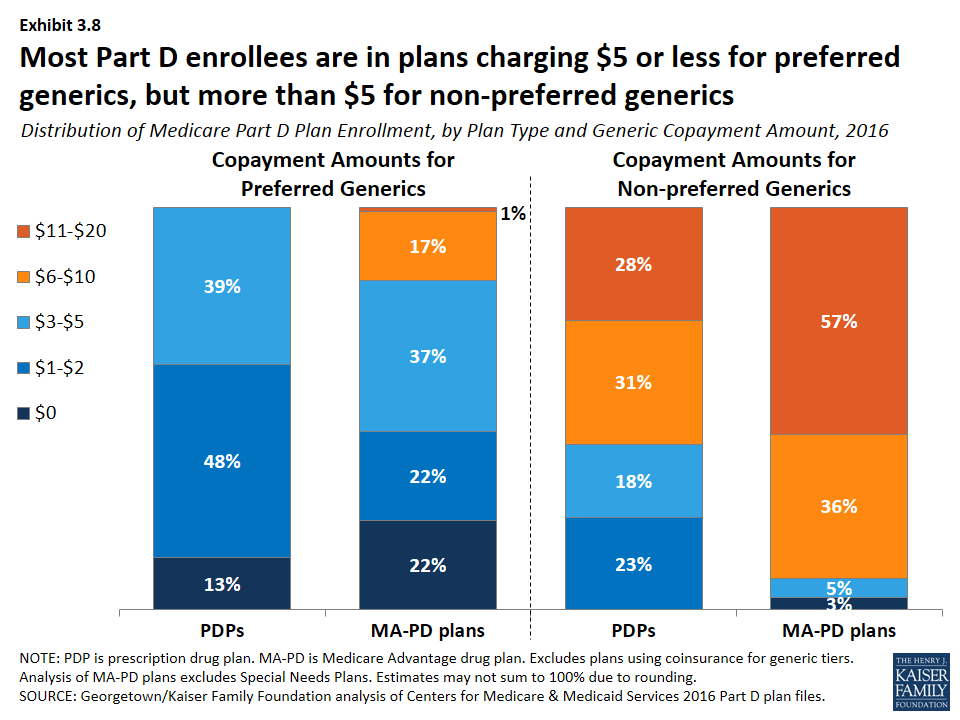
- Median cost sharing for preferred generics is $1 for PDPs and $3 for MA-PD plans in 2016, down from $5 in 2006 (Exhibit 3.7). For drugs on the non-preferred generic tier—a tier that became common in 2012—median cost sharing is $7 for PDPs and $12 for MA-PD plans. In 2016, 13 percent of PDP enrollees and 22 percent of MA-PD plan enrollees are in plans that charge $0 copayment for preferred generics (Exhibit 3.8).
- Unlike Part D plans, most employer plans do not use two generic tiers. Median cost sharing in 2015 for employer plans was $10 for the single generic tier, well above median copayments for generics in Part D.
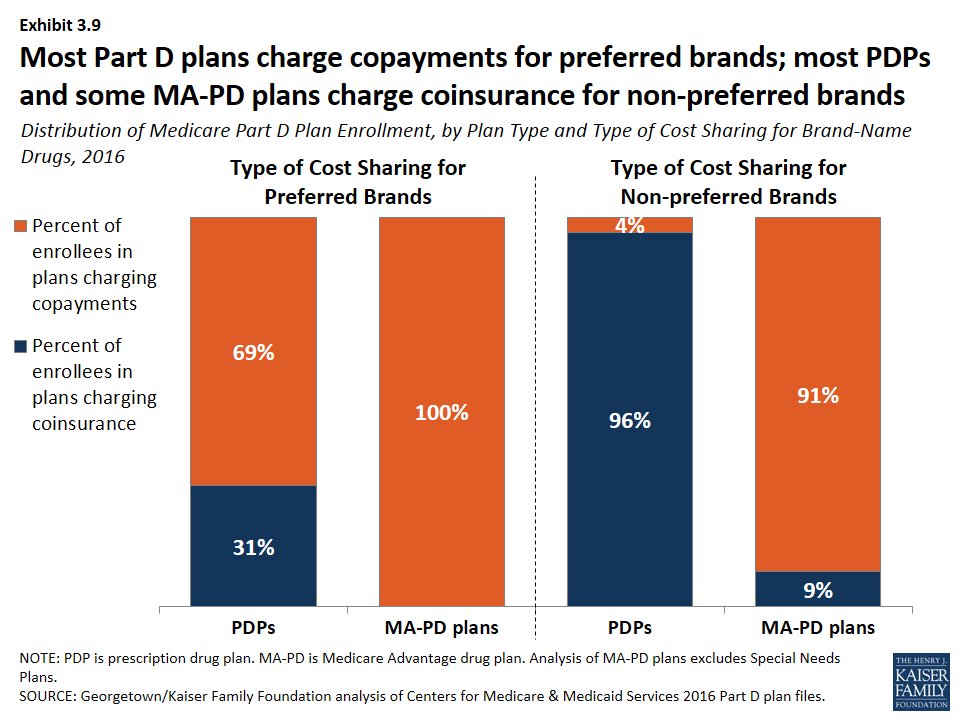
Cost sharing for PDP enrollees for brand-name drugs increasingly takes the form of coinsurance instead of copayments.
- In 2016, many PDP enrollees are in plans that charge coinsurance instead of copayments: 31 percent of enrollees now face coinsurance for preferred brand drugs and 96 percent do so for non-preferred brand drugs (Exhibit 3.9). By contrast, nearly all PDPs and MA-PD plans charge copayments for generic tiers, and most MA-PD plans use copayments for all tiers except the specialty tier.
Cost sharing for brand-name drugs has been relatively stable in recent years, but is much higher in 2016 than in 2006.
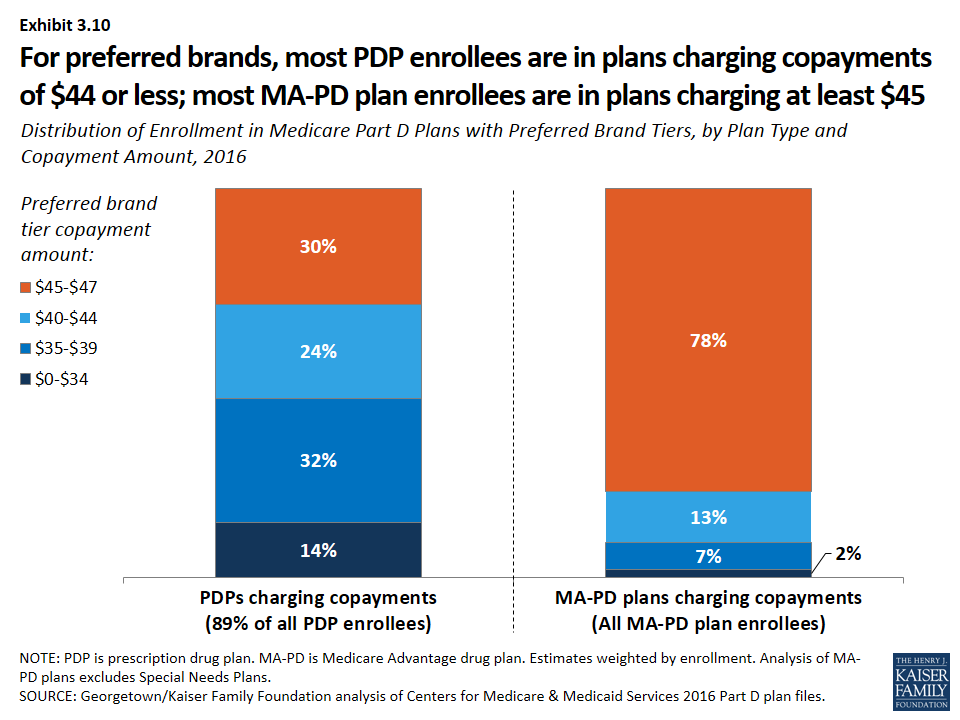
- Median cost sharing for preferred brands increased between 2006 and 2016 by about 46 percent ($28 to $41) for PDP enrollees and by nearly 70 percent ($27 to $45) for MA-PD plan enrollees. For PDP enrollees who face coinsurance for preferred brands, the median coinsurance rate is 20 percent. Copayments for brand-name drugs in Part D are higher than those typically charged by large employer plans.
- Among PDP enrollees in plans that use copayments for preferred brands, a majority (70 percent) are in plans charging between $29 and $44, while most MA-PD plan enrollees (78 percent) are in plans charging at least $45 for preferred brands (Exhibit 3.10).
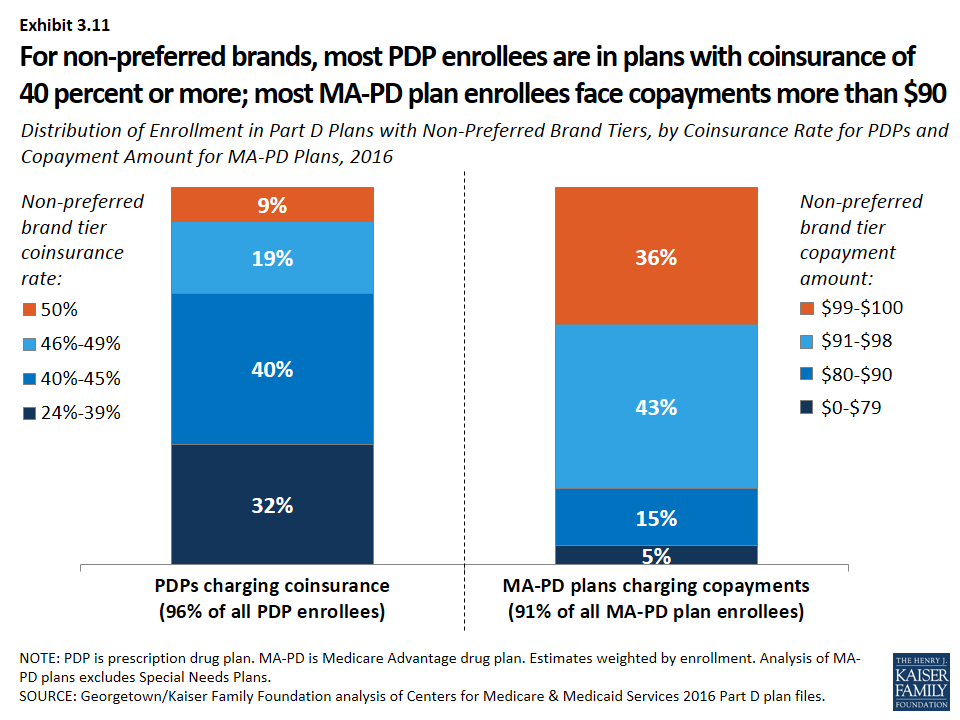
- For non-preferred brands, most PDP enrollees are in plans charging coinsurance of 40 percent or more; most MA-PD plan enrollees are in plans charging copayments more than $90 (Exhibit 3.11). For PDP enrollees, the median coinsurance rate for non-preferred brands is 40 percent, while for MA-PD plan enrollees, the median copayment amount is $95.
Nearly all Part D plans use specialty tiers for high-cost drugs and charge coinsurance of 25 percent to 33 percent during the benefit’s initial coverage period.
- Nearly half of PDP enrollees (49 percent) and more than 4 in 10 MA-PD plan enrollees (43 percent) are in plans that charge the maximum 33 percent coinsurance rate for specialty drugs, defined by CMS as those that cost at least $600 per month (Exhibit 3.12). Between 2015 and 2016, the share of MA-PD plan enrollees facing 33 percent specialty tier coinsurance declined. Only those plans that waive some or all of the standard deductible are permitted to set specialty tier coinsurance above 25 percent.
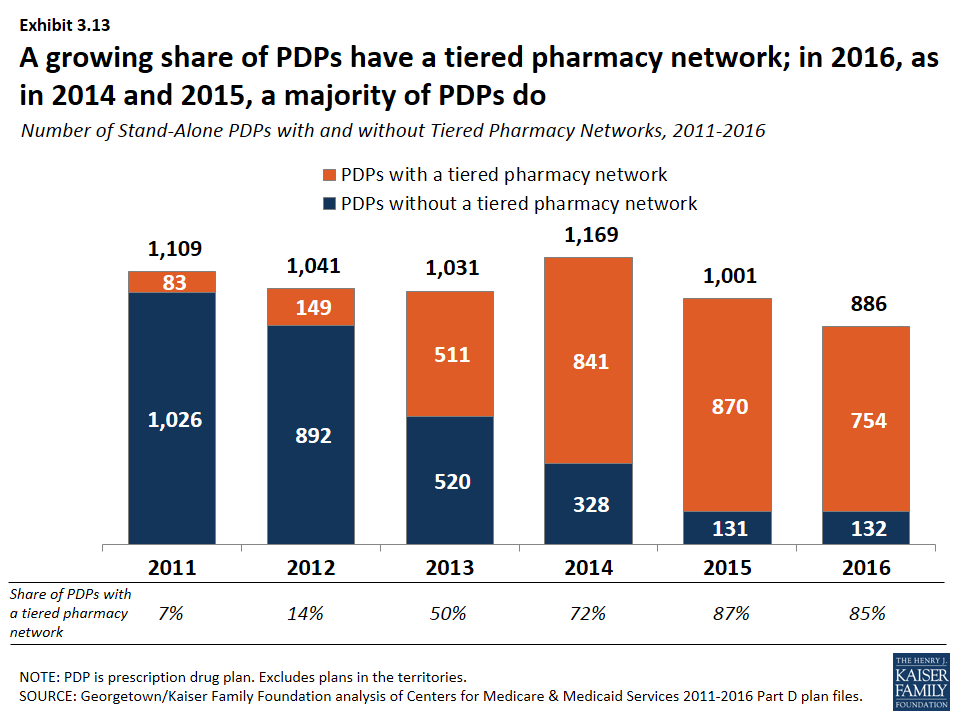
The use of tiered pharmacy networks has grown rapidly in recent years and is now the norm in PDPs.
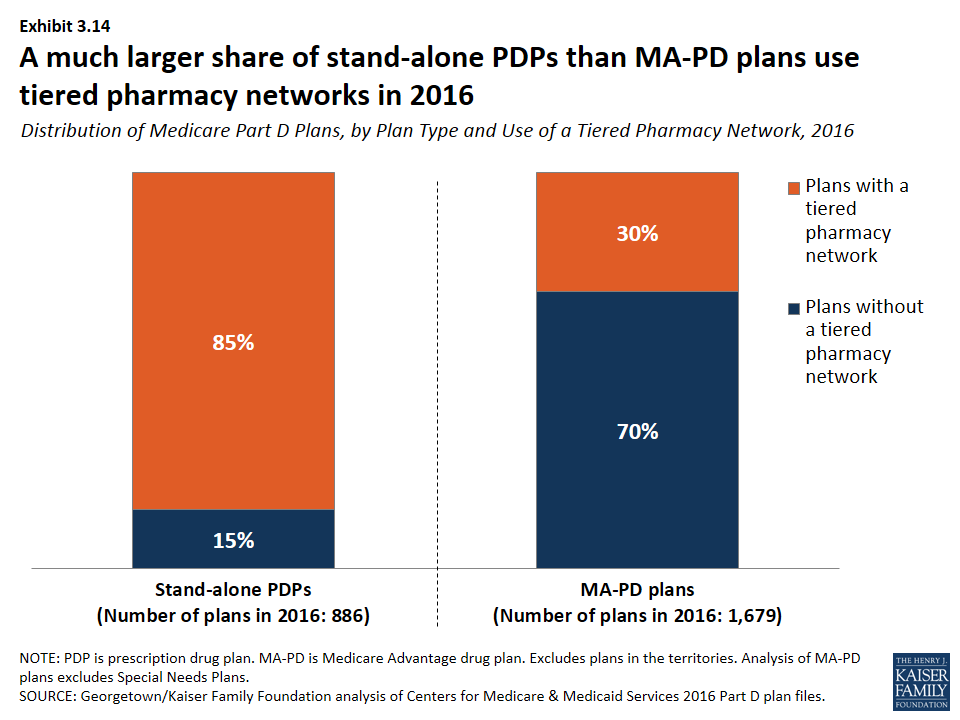
- The share of stand-alone PDPs with tiered pharmacy networks grew from 7 percent in 2011 to 85 percent in 2016 (Exhibit 3.13). These plans have 96 percent of PDP enrollees. By contrast, only 30 percent of MA-PD plans, with 21 percent of MA-PD plan enrollees, use tiered pharmacy networks (Exhibit 3.14).
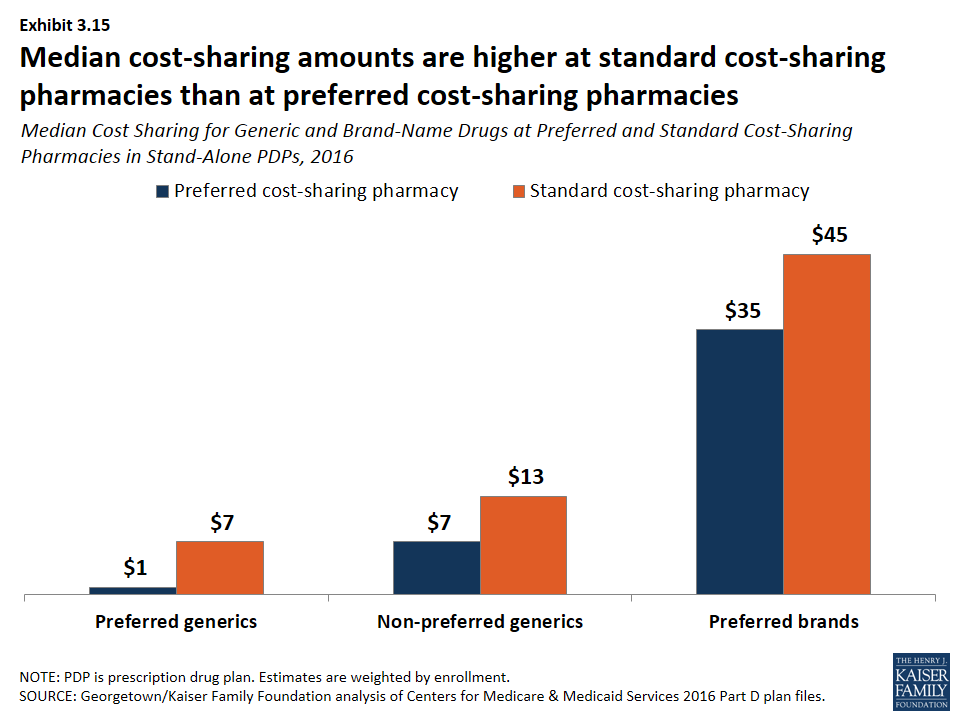
- Non-LIS enrollees in plans with tiered pharmacy networks pay lower cost sharing in pharmacies offering preferred cost sharing and higher cost sharing in other pharmacies (Exhibit 3.15). The largest differences are for preferred generic drugs: a median copayment of $1 at pharmacies offering preferred cost sharing versus $7 at other pharmacies ($7 versus $13 for non-preferred generic drugs). Differences are more modest for preferred brand drugs: $35 versus $45 for PDPs using copays and 25 percent versus 35 percent for PDPs using coinsurance.
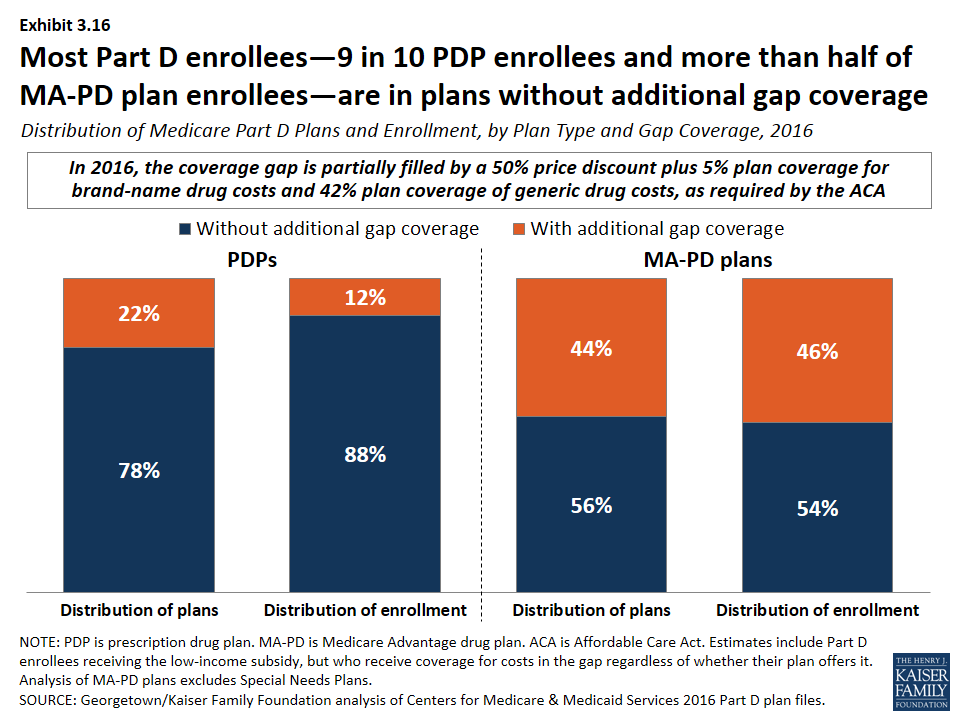
Most Part D enrollees are in plans without additional gap coverage beyond what is provided in the standard benefit as the coverage gap is being phased out.
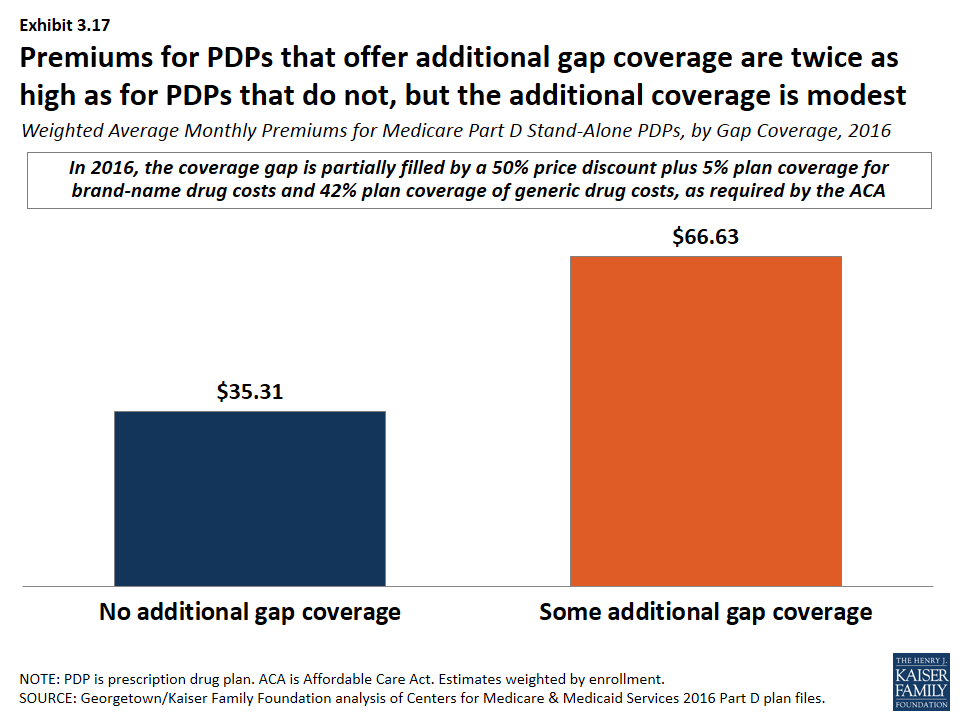
- In 2016, 88 percent of PDP enrollees and 54 percent of MA-PD plans enrollees are in plans without additional gap coverage (Exhibit 3.16). Although CMS no longer reports on the share of formulary drugs for which additional gap coverage is provided, gap coverage typically applies only to generic drugs and at most a small share of brand drugs, based on data from earlier years.
- Monthly premiums for PDPs that offer additional gap coverage are twice the premium amount for PDPs that lack additional coverage, despite the modest additional gap coverage offered in these PDPs (Exhibit 3.17).
Percent of Medicare Part D Enrollees in Plans with Selected Benefit Design Characteristics, by Plan Type, 2016
Distribution of Enrollment in Basic and Enhanced Benefit Stand-Alone PDPs, 2006-2016
Distribution of Enrollment in Medicare Part D Stand-Alone PDPs, by Deductible Amount, 2006-2016

Distribution of Enrollment in Medicare Part D Plans, by Plan Type and Deductible Amount, 2015-2016
Percent of Enrollment in Medicare Part D Stand-Alone PDPs, by Formulary Tier Design, 2006-2016
Percent of Enrollment in Medicare Advantage Drug Plans, by Formulary Tier Design, 2006-2016

Median Cost Sharing for Medicare Part D Plans, 2006-2016, and Employer-Sponsored Plans, 2015
Distribution of Medicare Part D Plan Enrollment, by Plan Type and Generic Copayment Amount, 2016
Distribution of Medicare Part D Plan Enrollment, by Plan Type and Type of Cost Sharing for Brand-Name Drugs, 2016
Distribution of Enrollment in Medicare Part D Plans with Preferred Brand Tiers, by Plan Type and Copayment Amount, 2016
Distribution of Enrollment in Part D Plans with Non-Preferred Brand Tiers, by Coinsurance Rate for PDPs and Copayment Amount for MA-PD Plans, 2016

Distribution of Enrollment in Medicare Part D Plans with Specialty Tiers, by Plan Type and Coinsurance Rate, Selected Years
Number of Stand-Alone PDPs with and without Tiered Pharmacy Networks, 2011-2016
Distribution of Medicare Part D Plans, by Plan Type and Use of a Tiered Pharmacy Network, 2016
Median Cost Sharing for Generic and Brand-Name Drugs at Preferred and Standard Cost-Sharing Pharmacies in Stand-Alone PDPs, 2016
Distribution of Medicare Part D Plans and Enrollment, by Plan Type and Gap Coverage, 2016
Weighted Average Monthly Premiums for Medicare Part D Stand-Alone PDPs, by Gap Coverage, 2016
Section 4: The Low-Income Subsidy Program
Nearly three in 10 Part D enrollees receive additional financial subsidies for Part D coverage through the Low-Income Subsidy program.
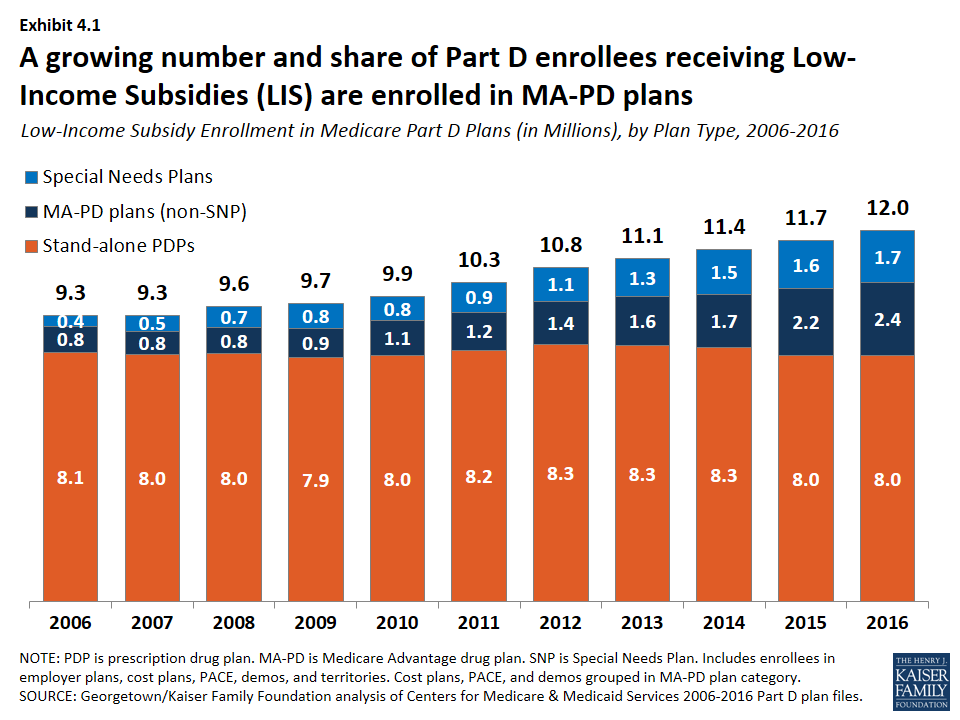
- About 12 million Part D enrollees (29 percent of all Part D enrollees) receive additional subsidies through the Low-Income Subsidy (LIS) program (also called “extra help”) (Exhibit 4.1). The LIS pays Part D premiums for eligible beneficiaries, as long as they enroll in PDPs designated as benchmark plans, and also reduces cost sharing.
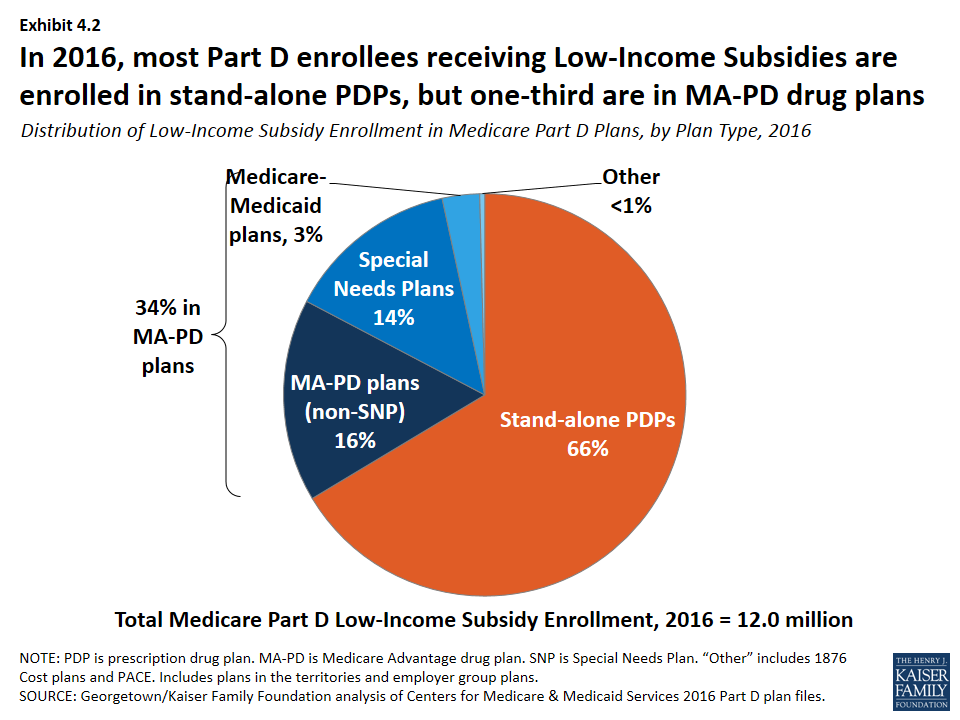
- About two-thirds of LIS enrollees (66 percent, or 8 million) are enrolled in stand-alone PDPs; others are in standard MA-PD plans, Special Needs Plans (SNPs), Medicare-Medicaid plans participating in financial alignment demonstrations, cost plans, or PACE plans (Exhibit 4.2). PDP LIS enrollment has been relatively constant since the program began, but MA-PD plan enrollment (including enrollment in SNPs) has more than tripled since 2006.
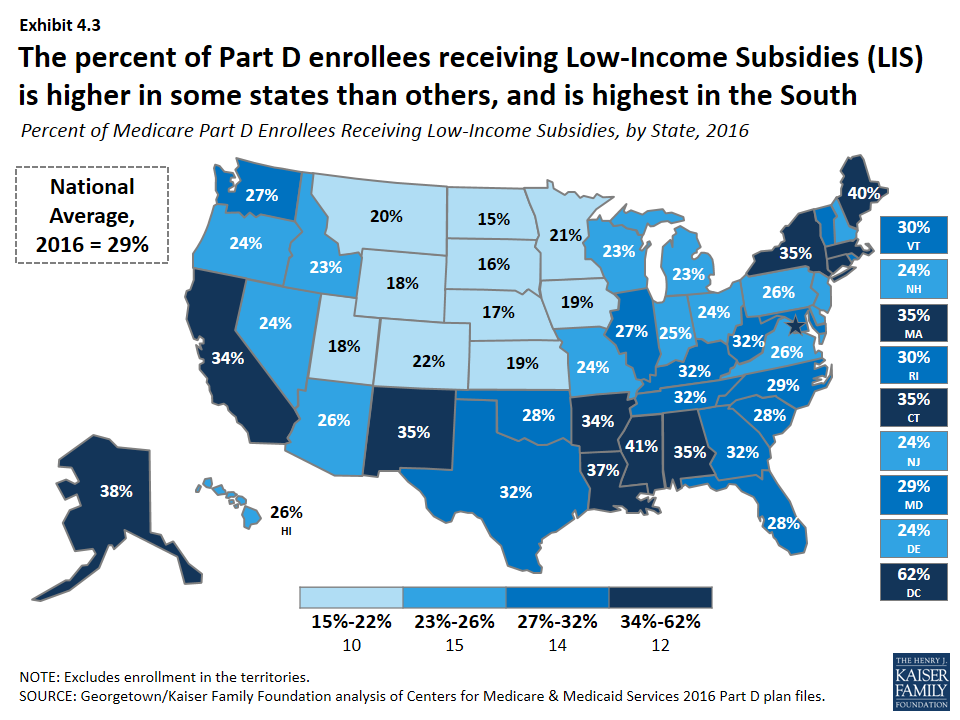
- The percent of Part D enrollees receiving LIS is higher in some states than others, and tends to be higher in southern states than in other regions of the country (Exhibit 4.3).
- In three states (Arizona, Florida, and Hawaii), more than half of LIS enrollees are in some type of MA-PD plan (Exhibit 4.4). In six states, more than 95 percent of LIS enrollees are in PDPs.
Fewer PDPs qualify as benchmark plans in 2016, compared to any previous year.
- In 2016, 226 PDPs nationwide (about one-fourth of plans) qualify as benchmark plans; that is, plans that are available to beneficiaries receiving the LIS for no monthly premium (Exhibit 4.5). This represents a 20 percent reduction in benchmark plans since 2015. In 2016, the average LIS beneficiary has a choice of seven benchmark plans, fewer than any previous year. About one-fourth of benchmark PDPs in 2016 qualify through a policy that allows plans to waive a premium of up to $2 per month.
- Benchmark plan availability ranges by region in 2016 (Exhibit 4.6). LIS beneficiaries have a choice of 10 benchmark plans in three regions (Arizona, Idaho/Utah, and Pennsylvania/West Virginia), but just two benchmark plans in Hawaii and three in Florida.
Some LIS beneficiaries pay premiums, even though they are eligible for premium-free Part D coverage; of the 1.5 million LIS enrollees paying premiums, close to half pay $20 or more per month.
- In 2016, about 13 percent of all LIS beneficiaries (1.5 million) pay a premium because they are not enrolled in benchmark plans (Exhibit 4.7). CMS reassigns some beneficiaries to a zero-premium PDP during open enrollment if their previous PDP loses benchmark status and charges a premium. But these LIS enrollees are not reassigned by CMS because they have actively selected the plan they are in, whether it is a PDP or an MA-PD plan.
- The number of LIS beneficiaries paying premiums is currently lower than in 2009 and 2010, at least partly because of the policy that allows plans to waive premiums up to $2 per month.
- In 2016, 71 percent of the 1.5 million LIS enrollees who pay a premium for Part D coverage pay $10 or more per month (Exhibit 4.8). Almost half (45 percent) of the 1.5 million LIS enrollees who pay a premium pay $20 or more a month for their Part D coverage.
- On average, the 1.5 million LIS beneficiaries paying Part D premiums in 2016 pay $20.51 per month ($246 per year) (Exhibit 4.9). This amount is up 19 percent from 2015 and is more than double the amount in 2006.
Low-Income Subsidy Enrollment in Medicare Part D Plans (in Millions), by Plan Type, 2006-2016
Distribution of Low-Income Subsidy Enrollment in Medicare Part D Plans, by Plan Type, 2016
Percent of Medicare Part D Enrollees Receiving Low-Income Subsidies, by State, 2016
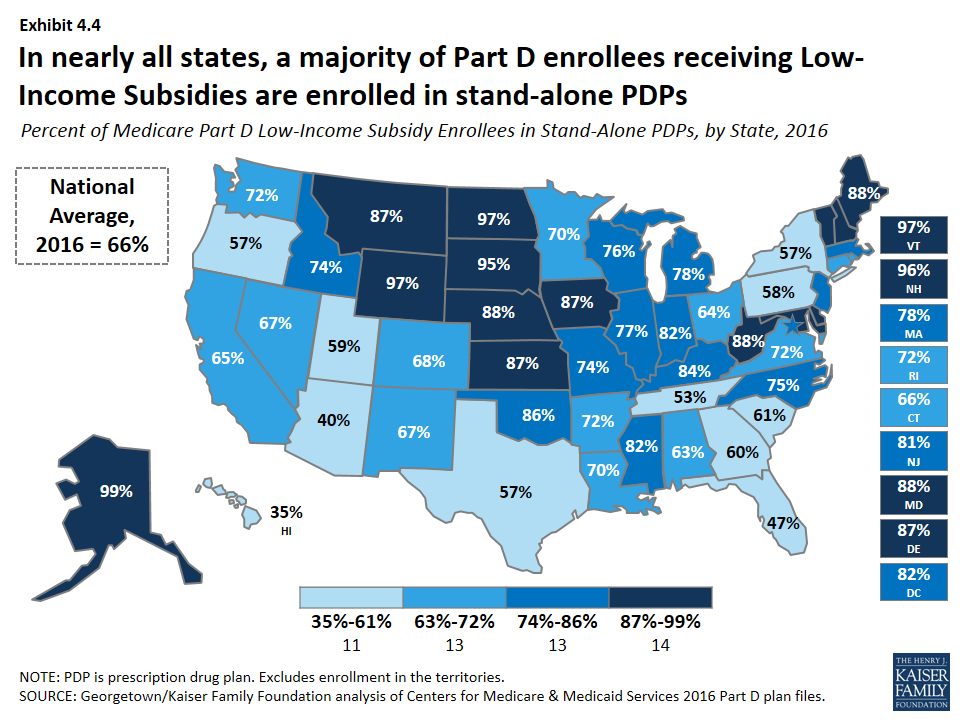
Percent of Medicare Part D Low-Income Subsidy Enrollees in Stand-Alone PDPs, by State, 2016
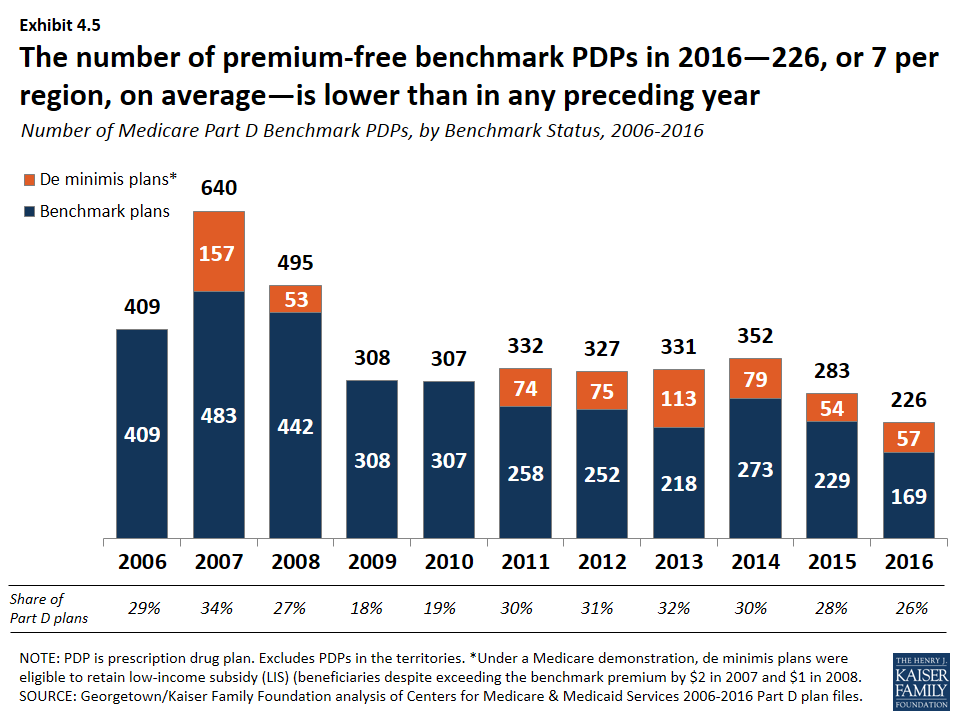
Number of Medicare Part D Benchmark PDPs, by Benchmark Status, 2006-2016
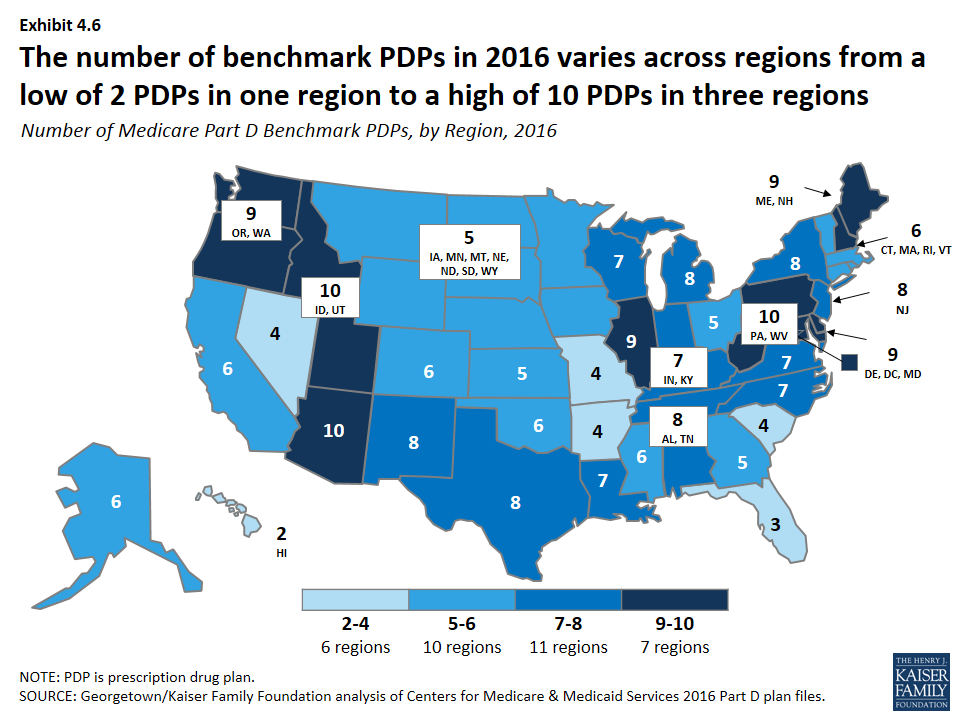
Number of Medicare Part D Benchmark PDPs, by Region, 2016
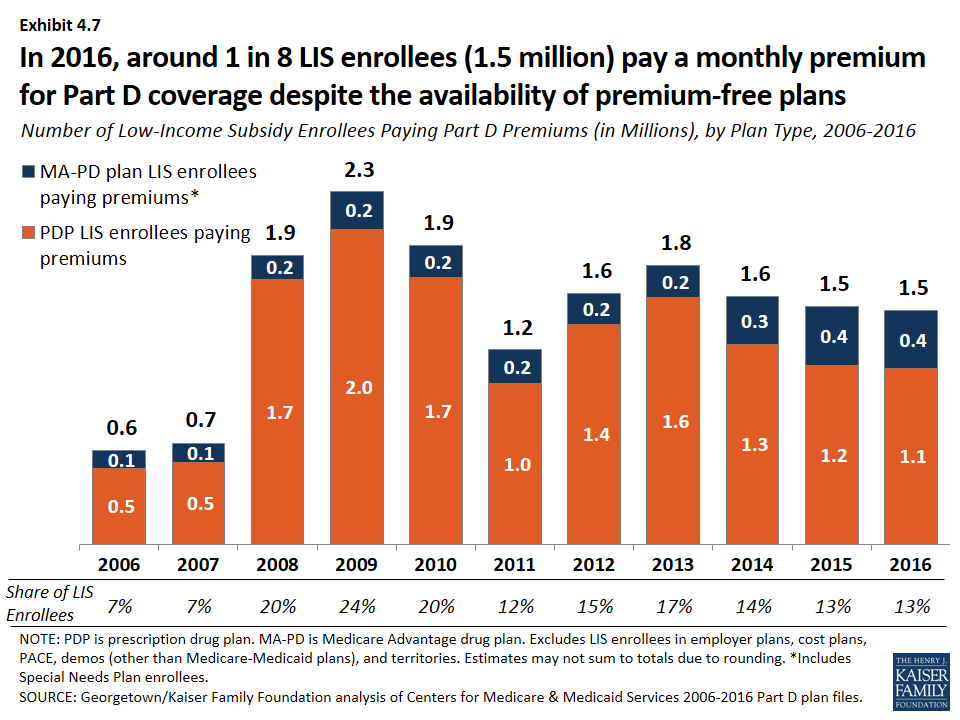
Number of Low-Income Subsidy Enrollees Paying Part D Premiums (in Millions), by Plan Type, 2006-2016
Distribution of Low-Income Subsidy Enrollees Who Pay Part D Premiums, by Monthly Premium Amount, 2006-2016
Weighted Average Monthly Part D Premiums for LIS Enrollees Who Pay Premiums, 2006-2016
Section 5: Part D Plan Performance Ratings
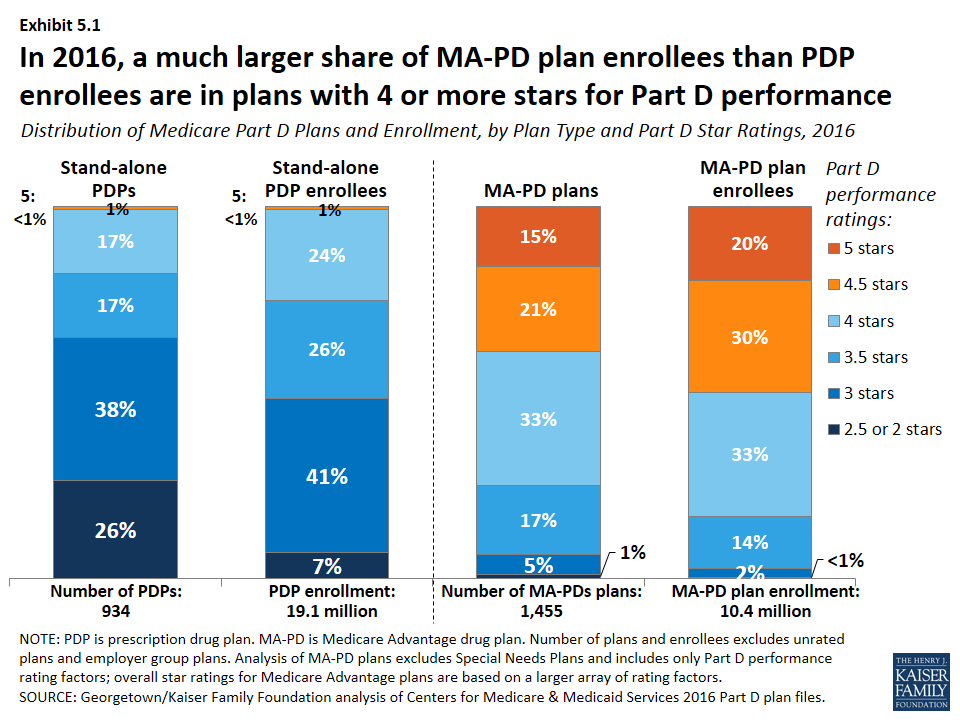
In 2016, a much larger share of MA-PD plan enrollees than PDP enrollees are in plans with 4 or more stars out of a possible 5 stars for the rating factors based on their Part D performance.
- Less than one in five PDPs (18 percent) are rated with 4 or more stars in 2016; one-fourth of all PDP enrollees are in these plans (Exhibit 5.1). By contrast, 69 percent of MA-PD plans, with 83 percent of MA-PD plan enrollees, have 4 or more stars for the rating factors based on their Part D performance. Medicare Advantage plans receive higher payments if they receive at least 4 stars for their performance providing all Medicare-covered services, including Part D, where applicable. Stand-alone PDPs have no direct financial incentives connected to their star ratings.
- In 2016, one in four PDPs (26 percent), with 7 percent of PDP enrollees, are rated 2.5 or fewer stars. By contrast, only 1 percent of MA-PD plans, with less than 1 percent of enrollees, have 2.5 or fewer stars for their Part D performance in 2016. Plans with ratings this low for three consecutive years are flagged by CMS as “low-performing plans” and are at risk for having their contracts canceled, though CMS has not yet exercised the option of canceling contracts.
- About 20 percent of MA-PD plan enrollees are in 5-star drug plans in 2016, as measured by their Part D performance ratings alone. By contrast, only 2 PDPs with 21,000 enrollees, both offered by WPS Health Insurance in Wisconsin, are rated with 5 stars in 2016.
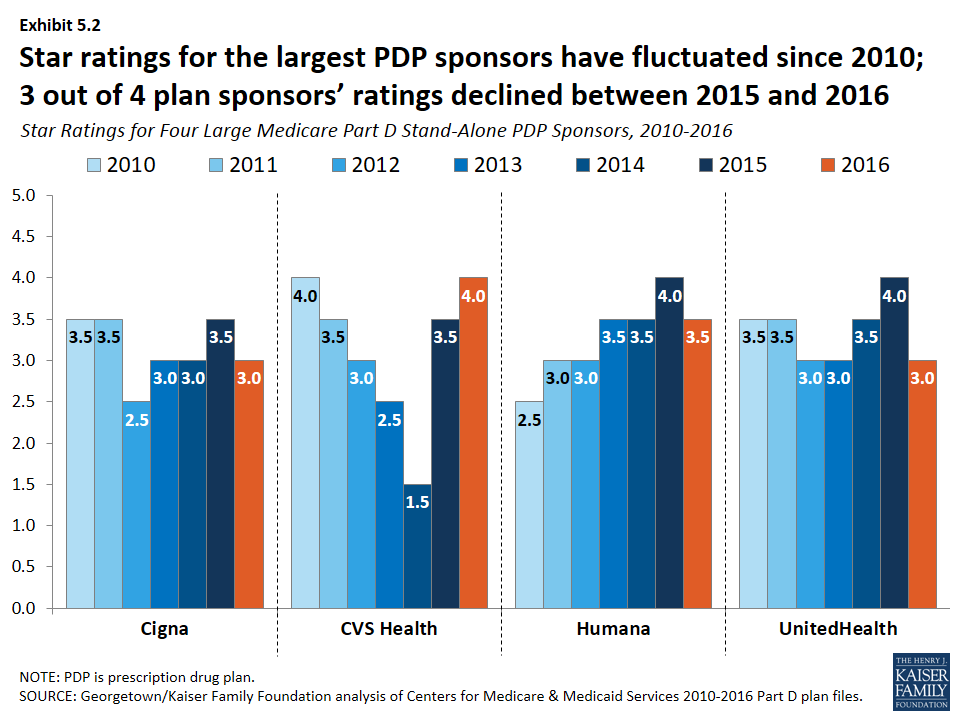
In terms of both national averages and the performance of the leading plan sponsors, ratings have fluctuated annually.
- In the years between 2010 and 2016, plans offered by CVS Health have received as few as 1.5 stars and as many as 4 stars, while the ratings for Humana’s plans have ranged from 2.5 to 4 stars (Exhibit 5.2). Changes are made each year to star rating component measures and to the cut points on each measure; these factors may influence the year-to-year variability in ratings. This variability limits the value of ratings to CMS in assessing plan performance and to consumers in selecting plans.
- The average PDP plan rating, weighted by enrollment, declined from 3.7 stars in 2015 to 3.3 stars in 2016, but is closer to the averages in 2013 (3.1 stars) and 2014 (3.0 stars) (Exhibit 5.3). The average PDP plan rating has fluctuated up and down since 2011, in contrast to the trend in the average MA-PD plan rating for the rating factors based on their Part D performance, even though both types of plans are scored on the same Part D performance factors.
Distribution of Medicare Part D Plans and Enrollment, by Plan Type and Part D Star Ratings, 2016
Star Ratings for Four Large Medicare Part D Stand-Alone PDP Sponsors, 2010-2016
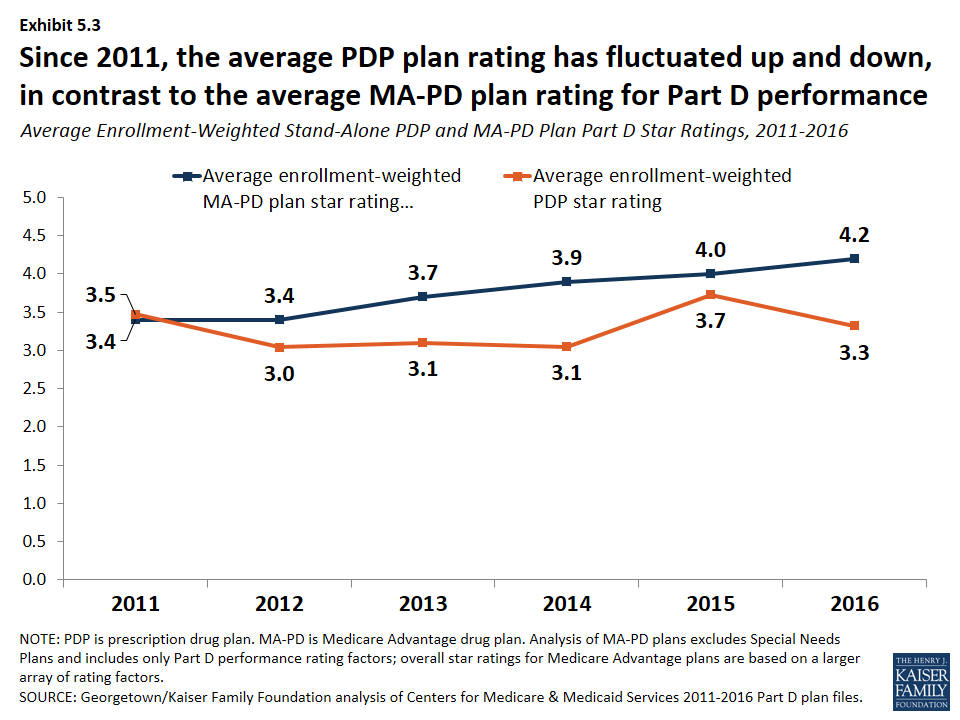
Average Enrollment-Weighted Stand-Alone PDP and MA-PD Plan Part D Star Ratings, 2011-2016
Methodology
This chart collection presents an analysis of the Medicare Part D 2016 marketplace and trends since 2006, prepared by Jack Hoadley, Health Policy Institute, Georgetown University; and Juliette Cubanski and Tricia Neuman, Kaiser Family Foundation. Anthony Damico, an independent consultant, provided data analysis on the average number of Medicare Advantage drug plans per beneficiary.
Data on Part D plan availability, enrollment, and premiums were collected primarily from a set of data files released by the Centers for Medicare & Medicaid Services (CMS) on a regular basis:
- Part D plan landscape files, released each fall prior to the annual enrollment period. These files include basic plan characteristics, such as plan names, premiums, deductibles, gap coverage, and benchmark plan status.
- Part D plan premium files, released each fall. These files include more detail on plan characteristics, including premiums charged to LIS beneficiaries, the portions of the premiums allocated to the basic and enhanced benefits, and the separate drug premiums for MA-PD plans.
- Part D plan crosswalk files, released each fall. These files identify which plans are matched up when a plan sponsor changes its plan offerings from one year to the next.
- Part D enrollment files, released on a monthly basis. These files include total enrollment by plan. We use February 2016 enrollment counts for enrollment-based analysis in this report. Enrollment files suppress totals for plans with 10 or fewer enrollees. We impute a value of five enrollees for these plans.
- Part D Low-Income Subsidy enrollment files, released each spring (in March for 2016). These files include total enrollment counts for LIS enrollees. There are small differences, most likely due to different dates and underlying files, between total enrollment counts in the LIS enrollment files and those in the general enrollment files. As with the other enrollment files, we impute a value of five enrollees for amounts suppressed for plans with 10 or fewer enrollees.
- Medicare plan benefit package files, released each fall. These files supply detailed information on the benefits offered by plans, including cost-sharing amounts for each formulary tier, tier labels, and the different cost-sharing amounts for standard and preferred cost-sharing pharmacies, where applicable.
- Medicare county-level enrollment files, released on a monthly basis. These files are used to create total counts at the state level. Because they are different than the plan-level enrollment files, national totals for these files are not identical to totals in other exhibits. We impute values of one beneficiary for all plan/county combination where values of 10 or fewer beneficiaries are suppressed.
Due to methodological differences, some numbers for MA-PD plans in this analysis differ from those in a May 2016 Kaiser Family Foundation report, Medicare Advantage 2016 Spotlight: Enrollment Market Update. Methodological differences include:
- How Blue Cross Blue Shield (BCBS) affiliates are treated: this analysis treats BCBS-affiliated firms separately; the Medicare Advantage Spotlight combines BCBS-affiliated firms [excluding Anthem).
- How plans in the territories are treated: this analysis does not include data for plans in the territories, including Puerto Rico; the Medicare Advantage Spotlight includes Puerto Rico but excludes other territories.
- Which month is used for enrollment counts: this analysis uses February for Part D enrollment; the Medicare Advantage Spotlight uses March enrollment files.
- How plans with small enrollment counts that are suppressed in CMS files are treated: this analysis imputes a value of five enrollees for total enrollment in such plans; the Medicare Advantage Spotlight excludes plans with small enrollment counts in estimates that are plan-enrollment weighted.