Health Coverage and Care in the South in 2014 and Beyond
Introduction
Over 115 million individuals live in the American South today, and together, they make up over a third of the U.S. population. The South, as defined by the U.S. Census Bureau, includes 17 states, stretching from Oklahoma, Texas, and Arkansas on the West to the Atlantic Ocean on the East, and northward to Delaware, Maryland, Kentucky, and West Virginia (Figure 1). This brief provides an overview of health coverage and care in the South today and the potential impact of the Affordable Care Act (ACA) health coverage expansions. It includes key findings in several areas including the following:
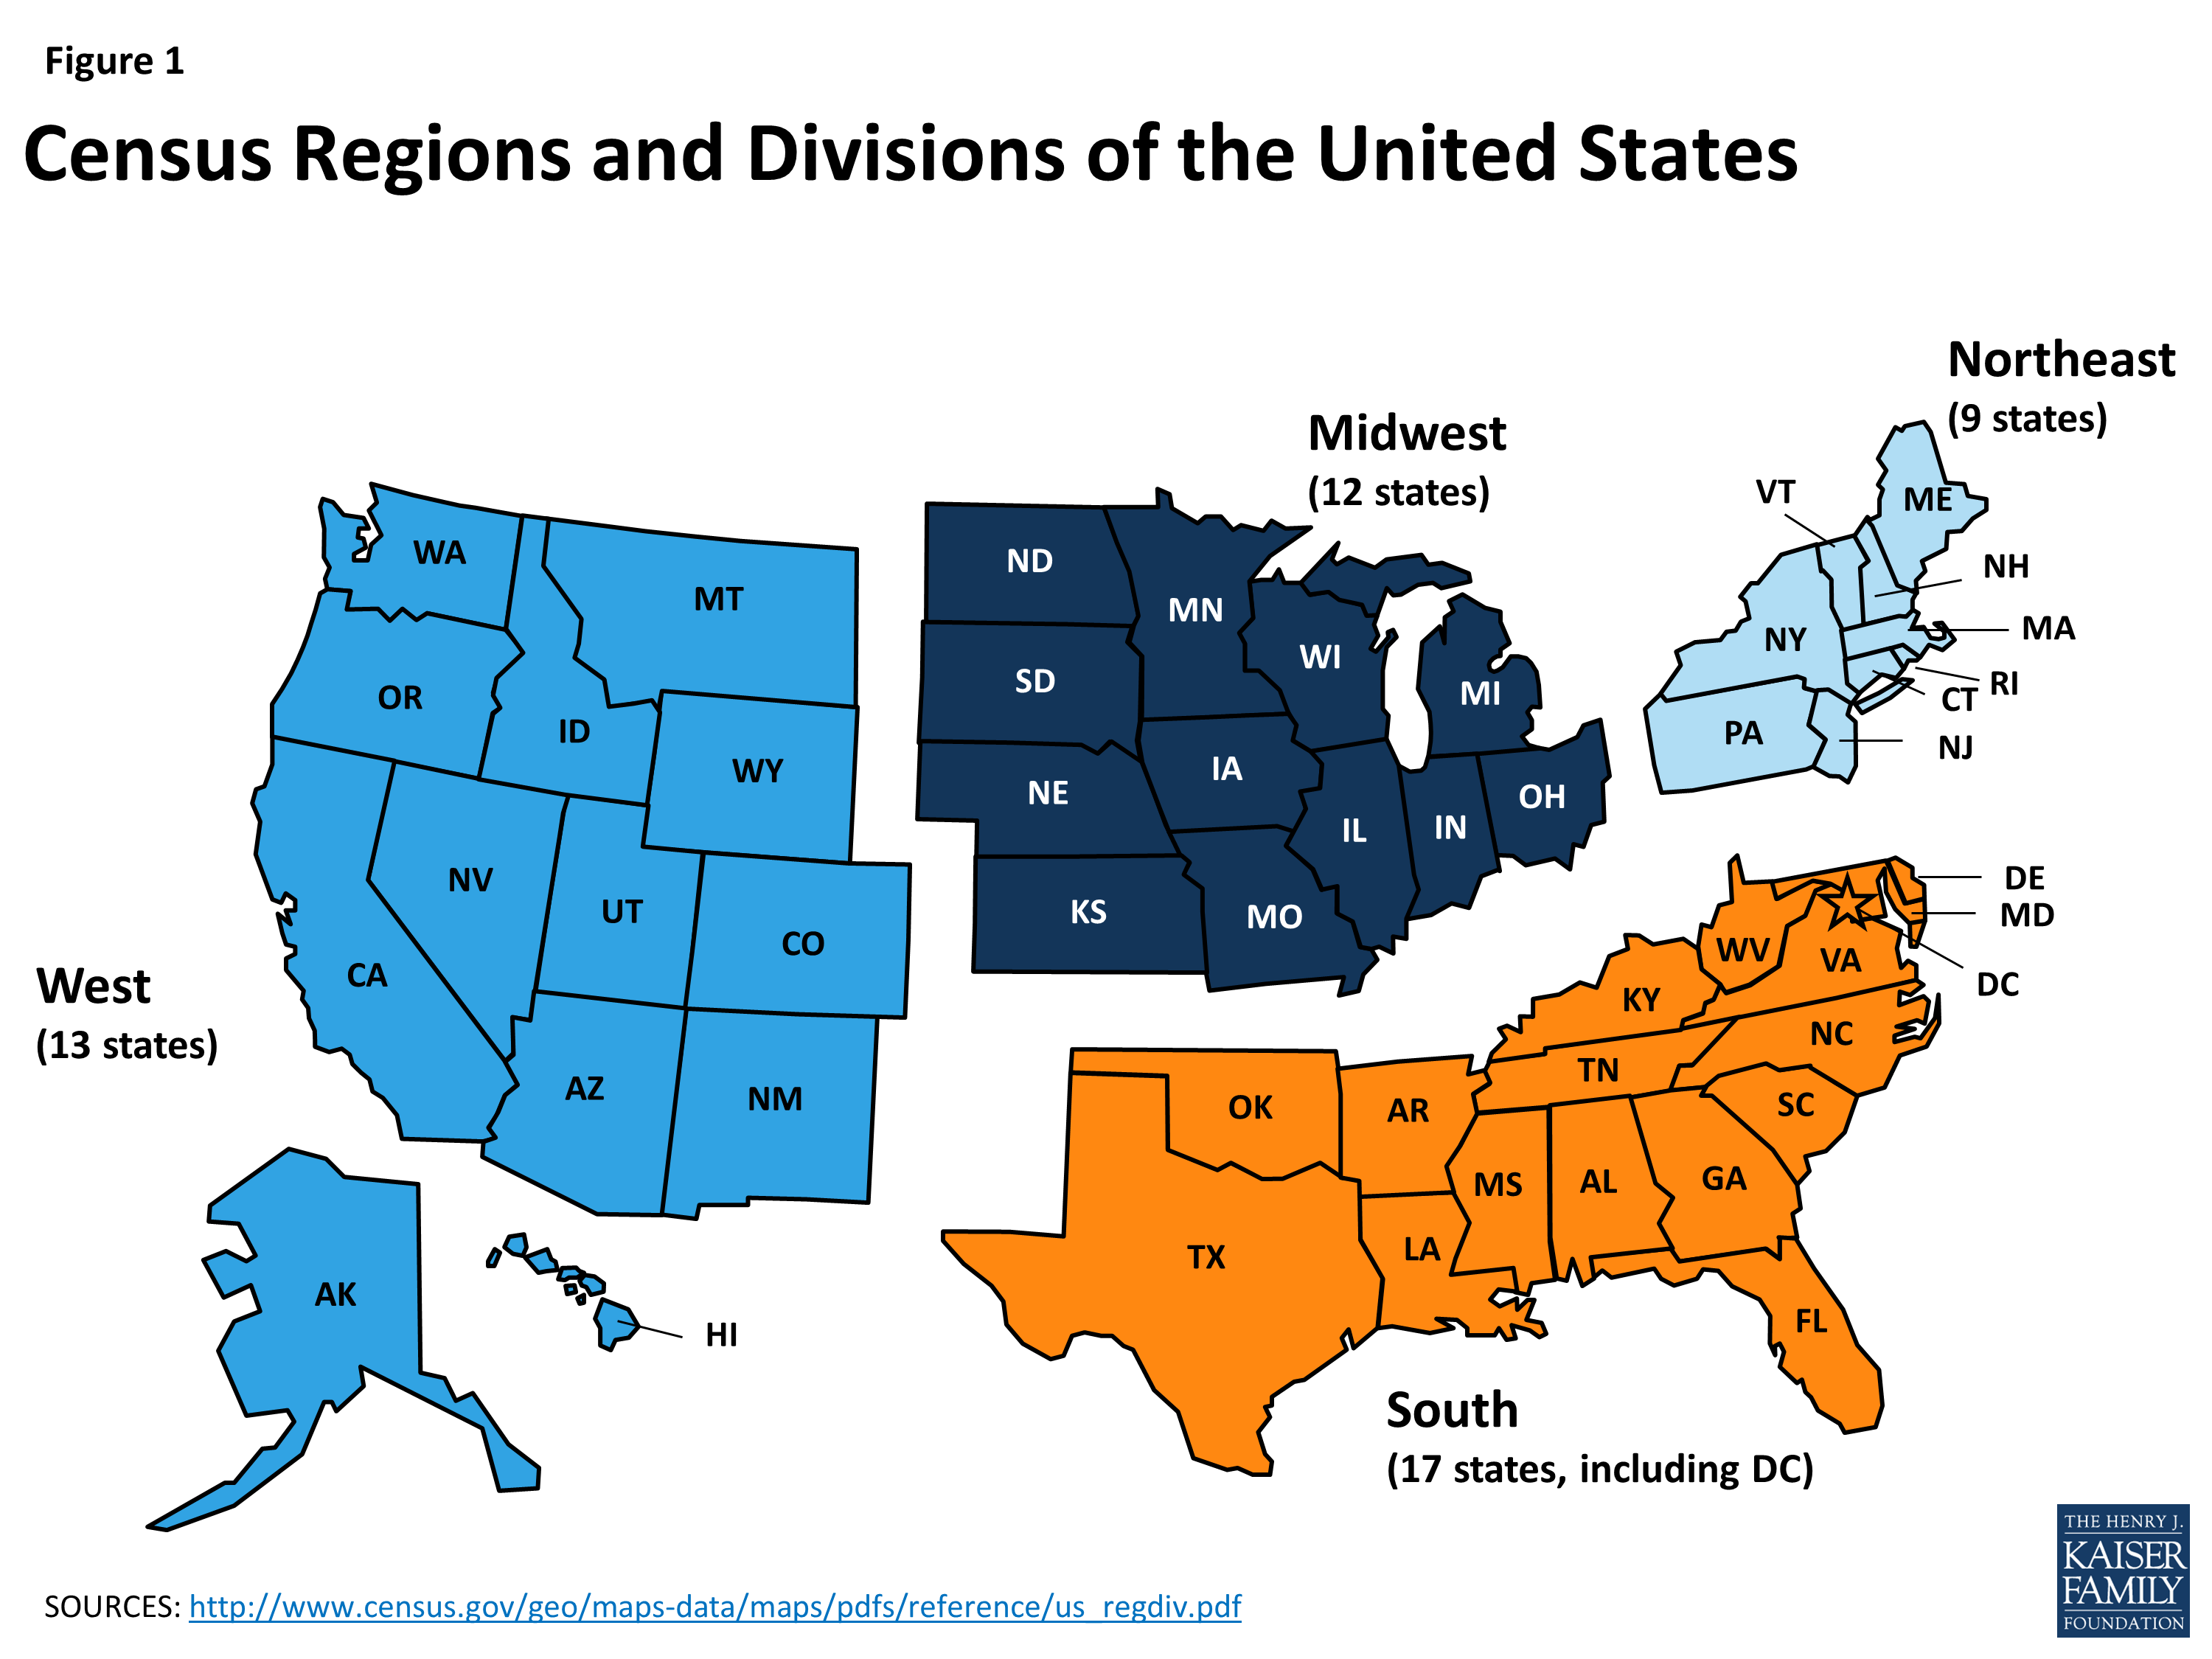
Figure 1: Census Regions and Divisions of the United States
Demographics. The southern population is large and growing rapidly. The region’s population is racially and ethnically diverse and also diverse across a number of factors including citizenship status, age, urban-rural composition, and income. Southerners are significantly more likely than those in the Northeast and Midwest to be poor, and the South includes states with some of the highest poverty rates.
Health Coverage and Care Today. The South has faced longstanding disparities in health coverage, health status, and health care relative to the rest of the United States. Compared to those in other regions, Southerners are more likely to be uninsured, less likely to have access to needed health services, and more likely to experience a number of chronic health conditions such as diabetes and heart disease.
The Impact of the ACA Coverage Expansions. The ACA has the potential to extend health coverage to many uninsured Southerners through an expansion of Medicaid and the creation of new Health Insurance Marketplaces with tax credit subsidies. However, most southern states are not moving forward with the Medicaid expansion, and many poor uninsured Southerners will not gain a new coverage option and may remain uninsured. Even with these gaps in coverage, millions of uninsured Southerners are now eligible for coverage, and effective outreach and enrollment efforts are key for ensuring that they are enrolled.
Translating Coverage to Care: Delivery Systems and the Safety Net. Improving health outcomes in the long-term will take more than expanding coverage. It will be important to ensure that insured individuals as well as Southerners who remain uninsured are connected to care. Ongoing development of provider capacity and delivery system innovation in the South will be important for addressing health care needs and challenges.
Issue Brief
Profile of the Southern Population Today
As of 2012, 115 million individuals lived in the 17 southern states, accounting for over a third (37%) of US residents nationally (Figure 2). Over half (56%) of the southern population resides in just four states – Texas, Florida, Georgia, and North Carolina. These four most populous southern states also include more than a fifth (21%) of the total US population.1 The southern population is growing rapidly, largely due to high domestic and international migration to the South. The Census Bureau estimates that over half (52%) of the increase in the U.S. population by 2030 will be a result of population growth in the South.2
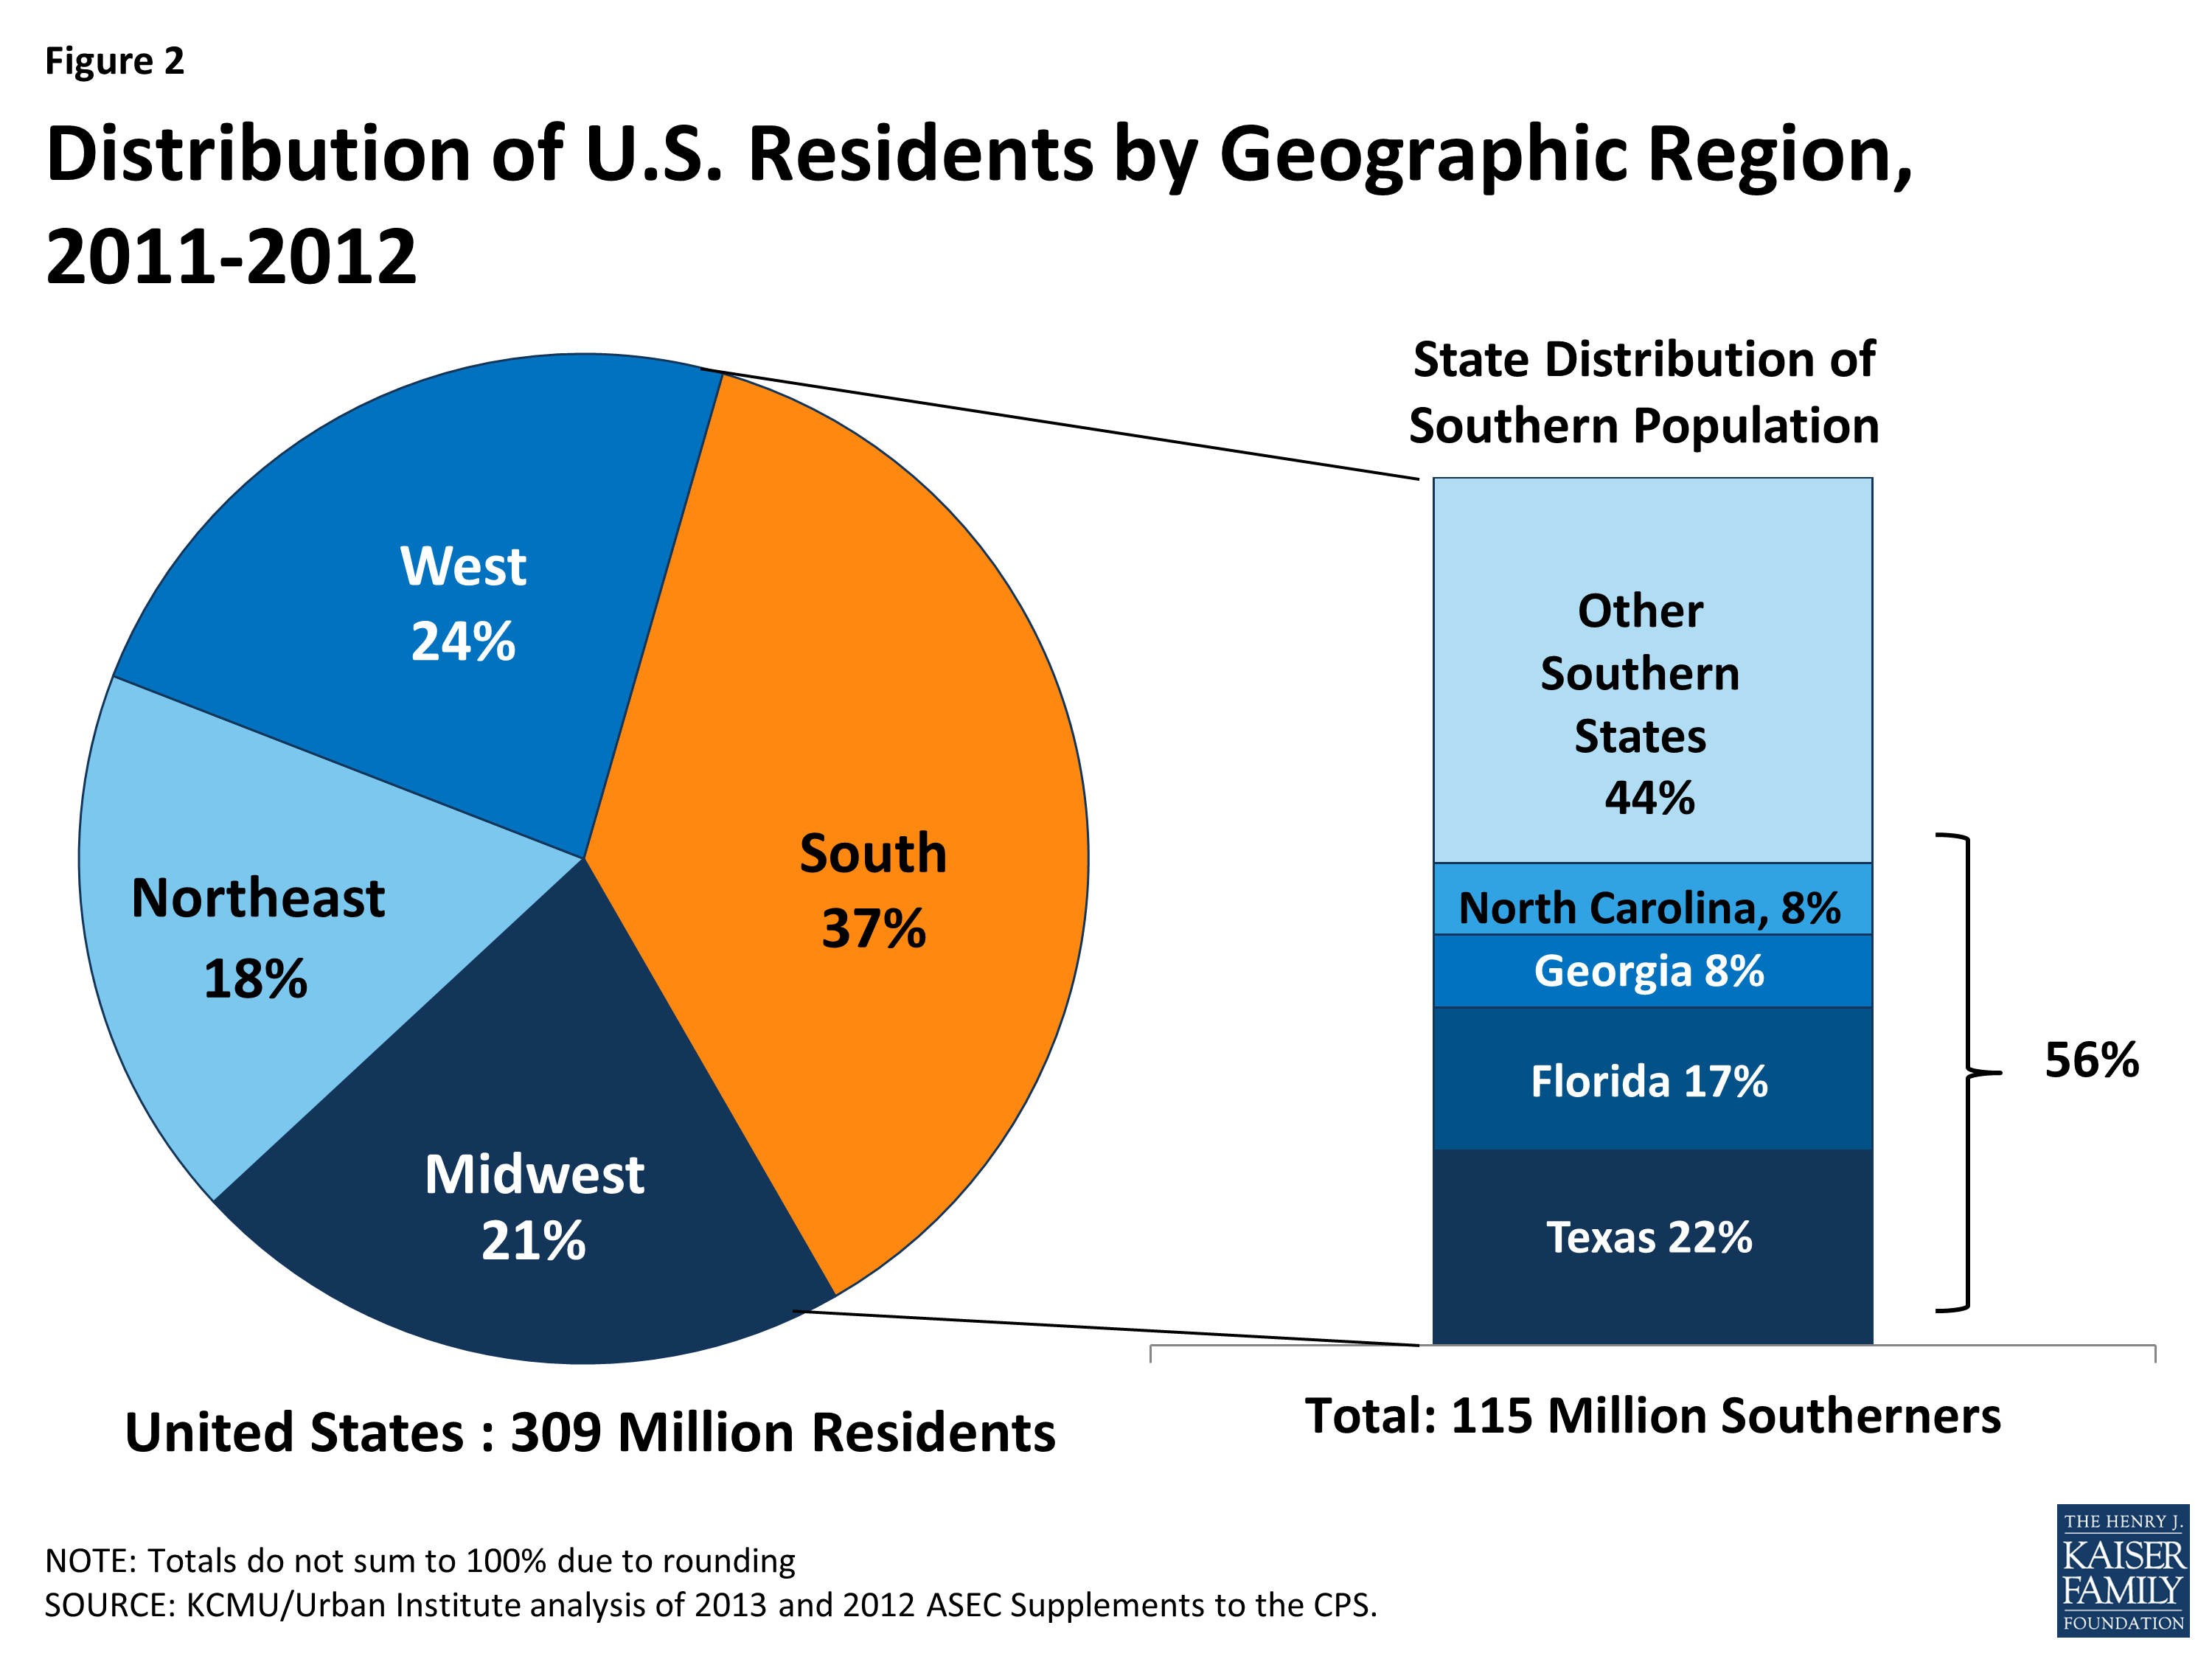
Figure 2: Distribution of U.S. Residents by Geographic Region, 2011-2012
The southern population is racially and ethnically diverse. People of color make up 41% of the total southern population (Figure 3). However, the share of the population who are people of color varies across southern states from less than 15% in Arkansas and West Virginia to over half of residents in the District of Columbia and Texas (see Appendix Table 1).
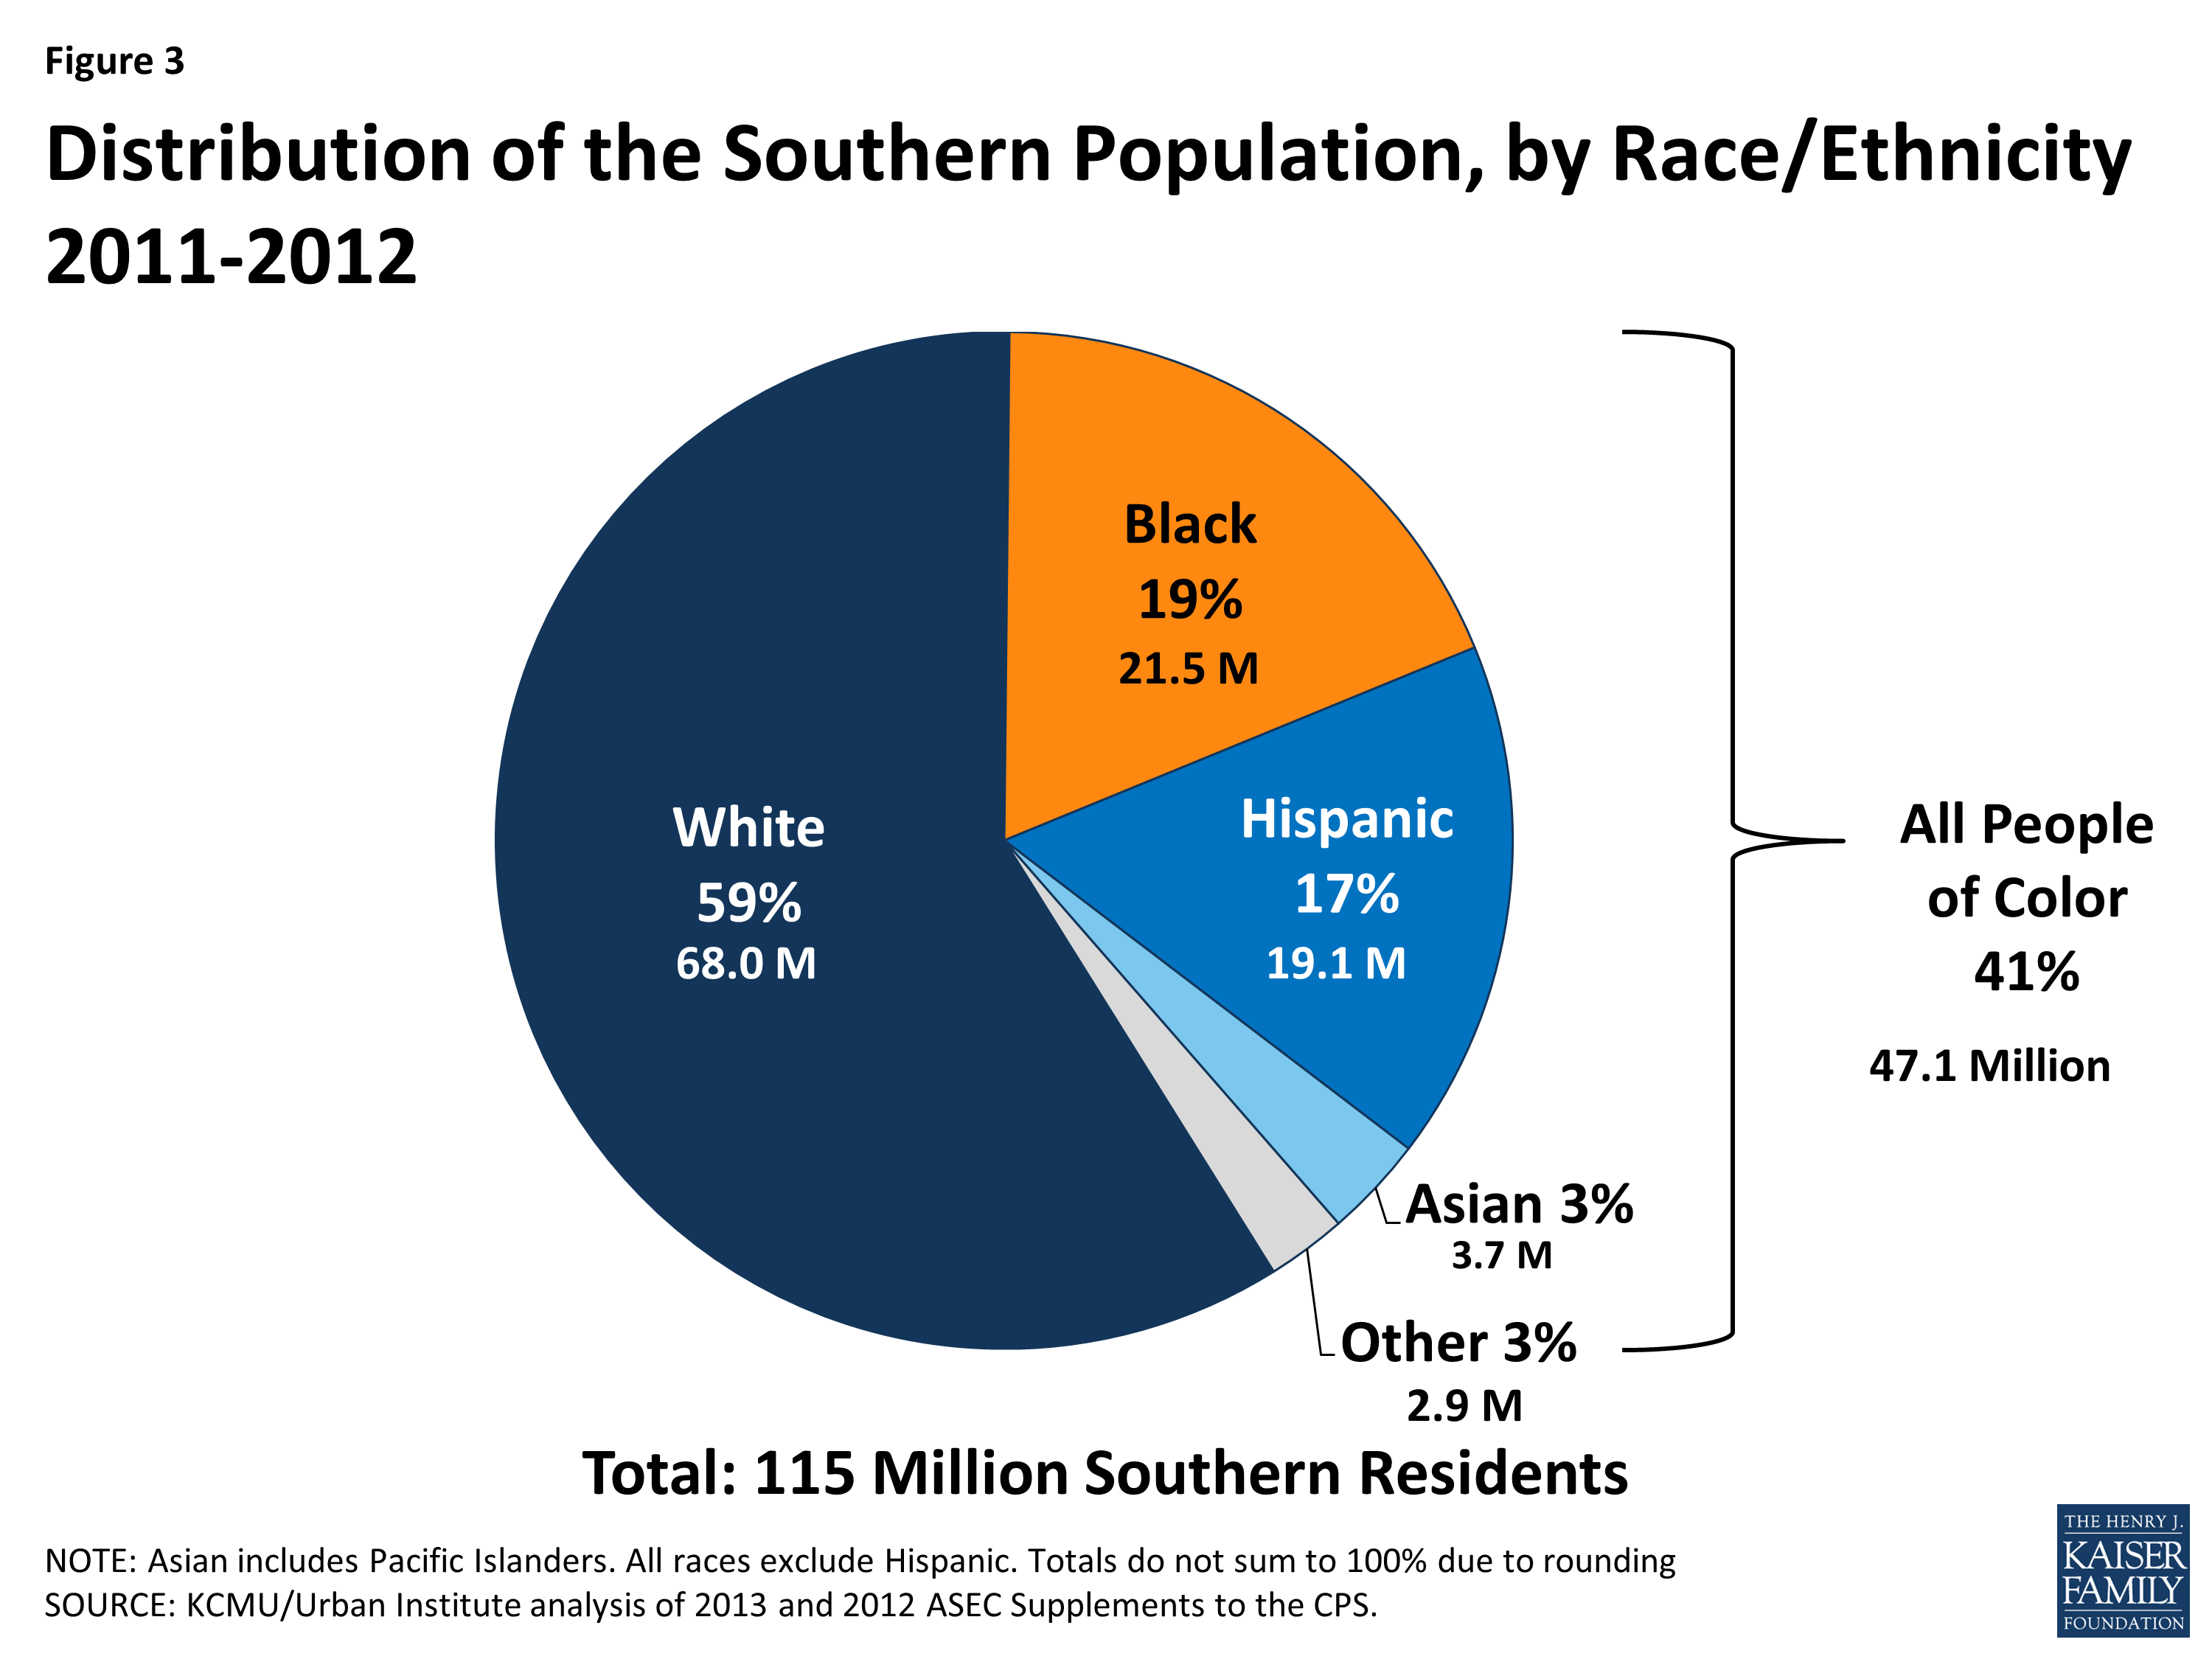
Figure 3: Distribution of the Southern Population, by Race/Ethnicity 2011-2012
Moreover, more than four in ten (41%) of all people of color reside in the South. However, the share of people residing in the South varies across racial and ethnic groups, with nearly six in ten Blacks residing in the South (58%) compared to about one in five Asians and Pacific Islanders (22%) (Figure 4).
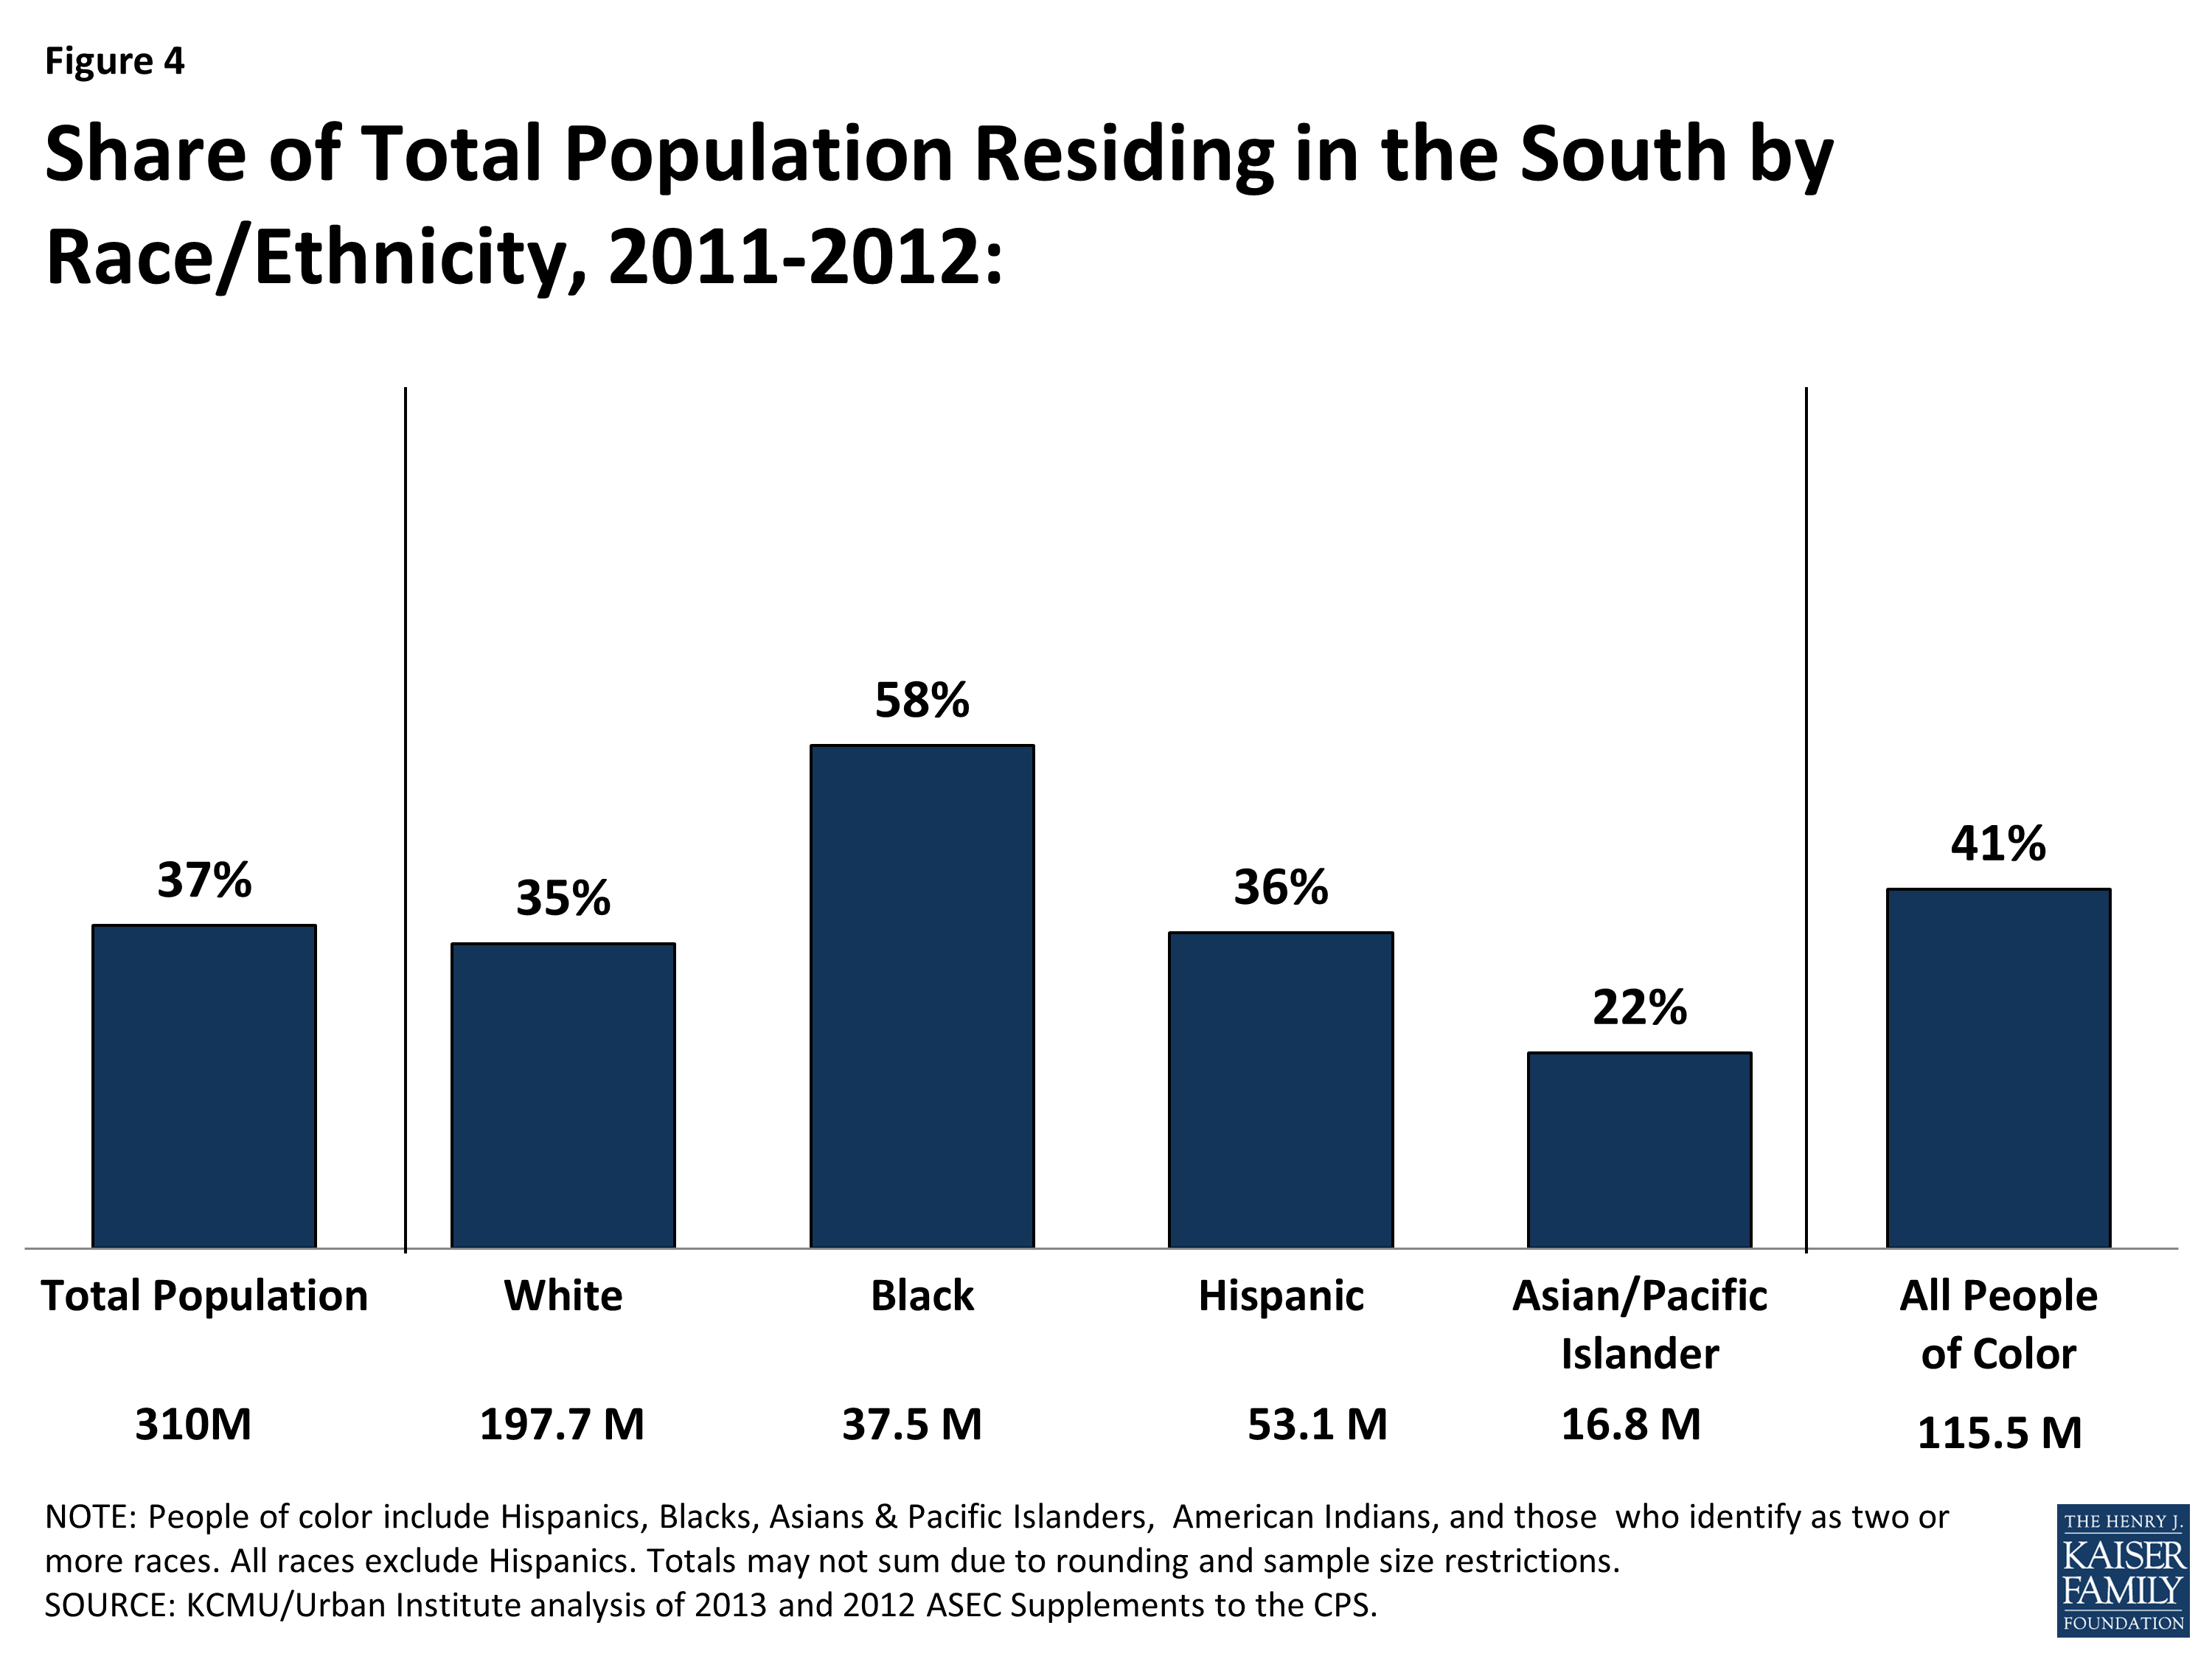
Figure 4: Share of Total Population Residing in the South by Race/Ethnicity, 2011-2012
The southern population is also diverse across a number of other characteristics, including citizenship status, age, educational attainment, and urban-rural composition. Similar to other regions, the large majority (89%) of Southerners are U.S.-born citizens, while about one in ten (11%) are immigrants, who include both naturalized citizens and non-citizens. The age distribution of the southern population is similar to that of other regions as well. About one-quarter (26%) of the region’s residents are children and 14% are elderly individuals. Young adults aged 19-34 account for 21% of the population. While the large majority (89%) of Southerners live in metropolitan settings, Southerners are more likely than those in the Northeast and West to live in a rural area (see Appendix Table 2).
Overall, three-quarters (77%) of nonelderly individuals in the South live in a household with at least one full-time worker. The majority of southern workers (62%) are in blue-collar jobs, most commonly in the service, trade, health services, and manufacturing industries.3 More than 15% of all workers have jobs in services, arts, or entertainment, and almost 14% of workers are in wholesale or retail trade.4 One in four workers in the South (25%) are employed by small firms or businesses with fewer than 50 employees, and 9% of Southern workers are self-employed (Figure 5). These work patterns in the South are similar to those of the general US population and other regions. 5
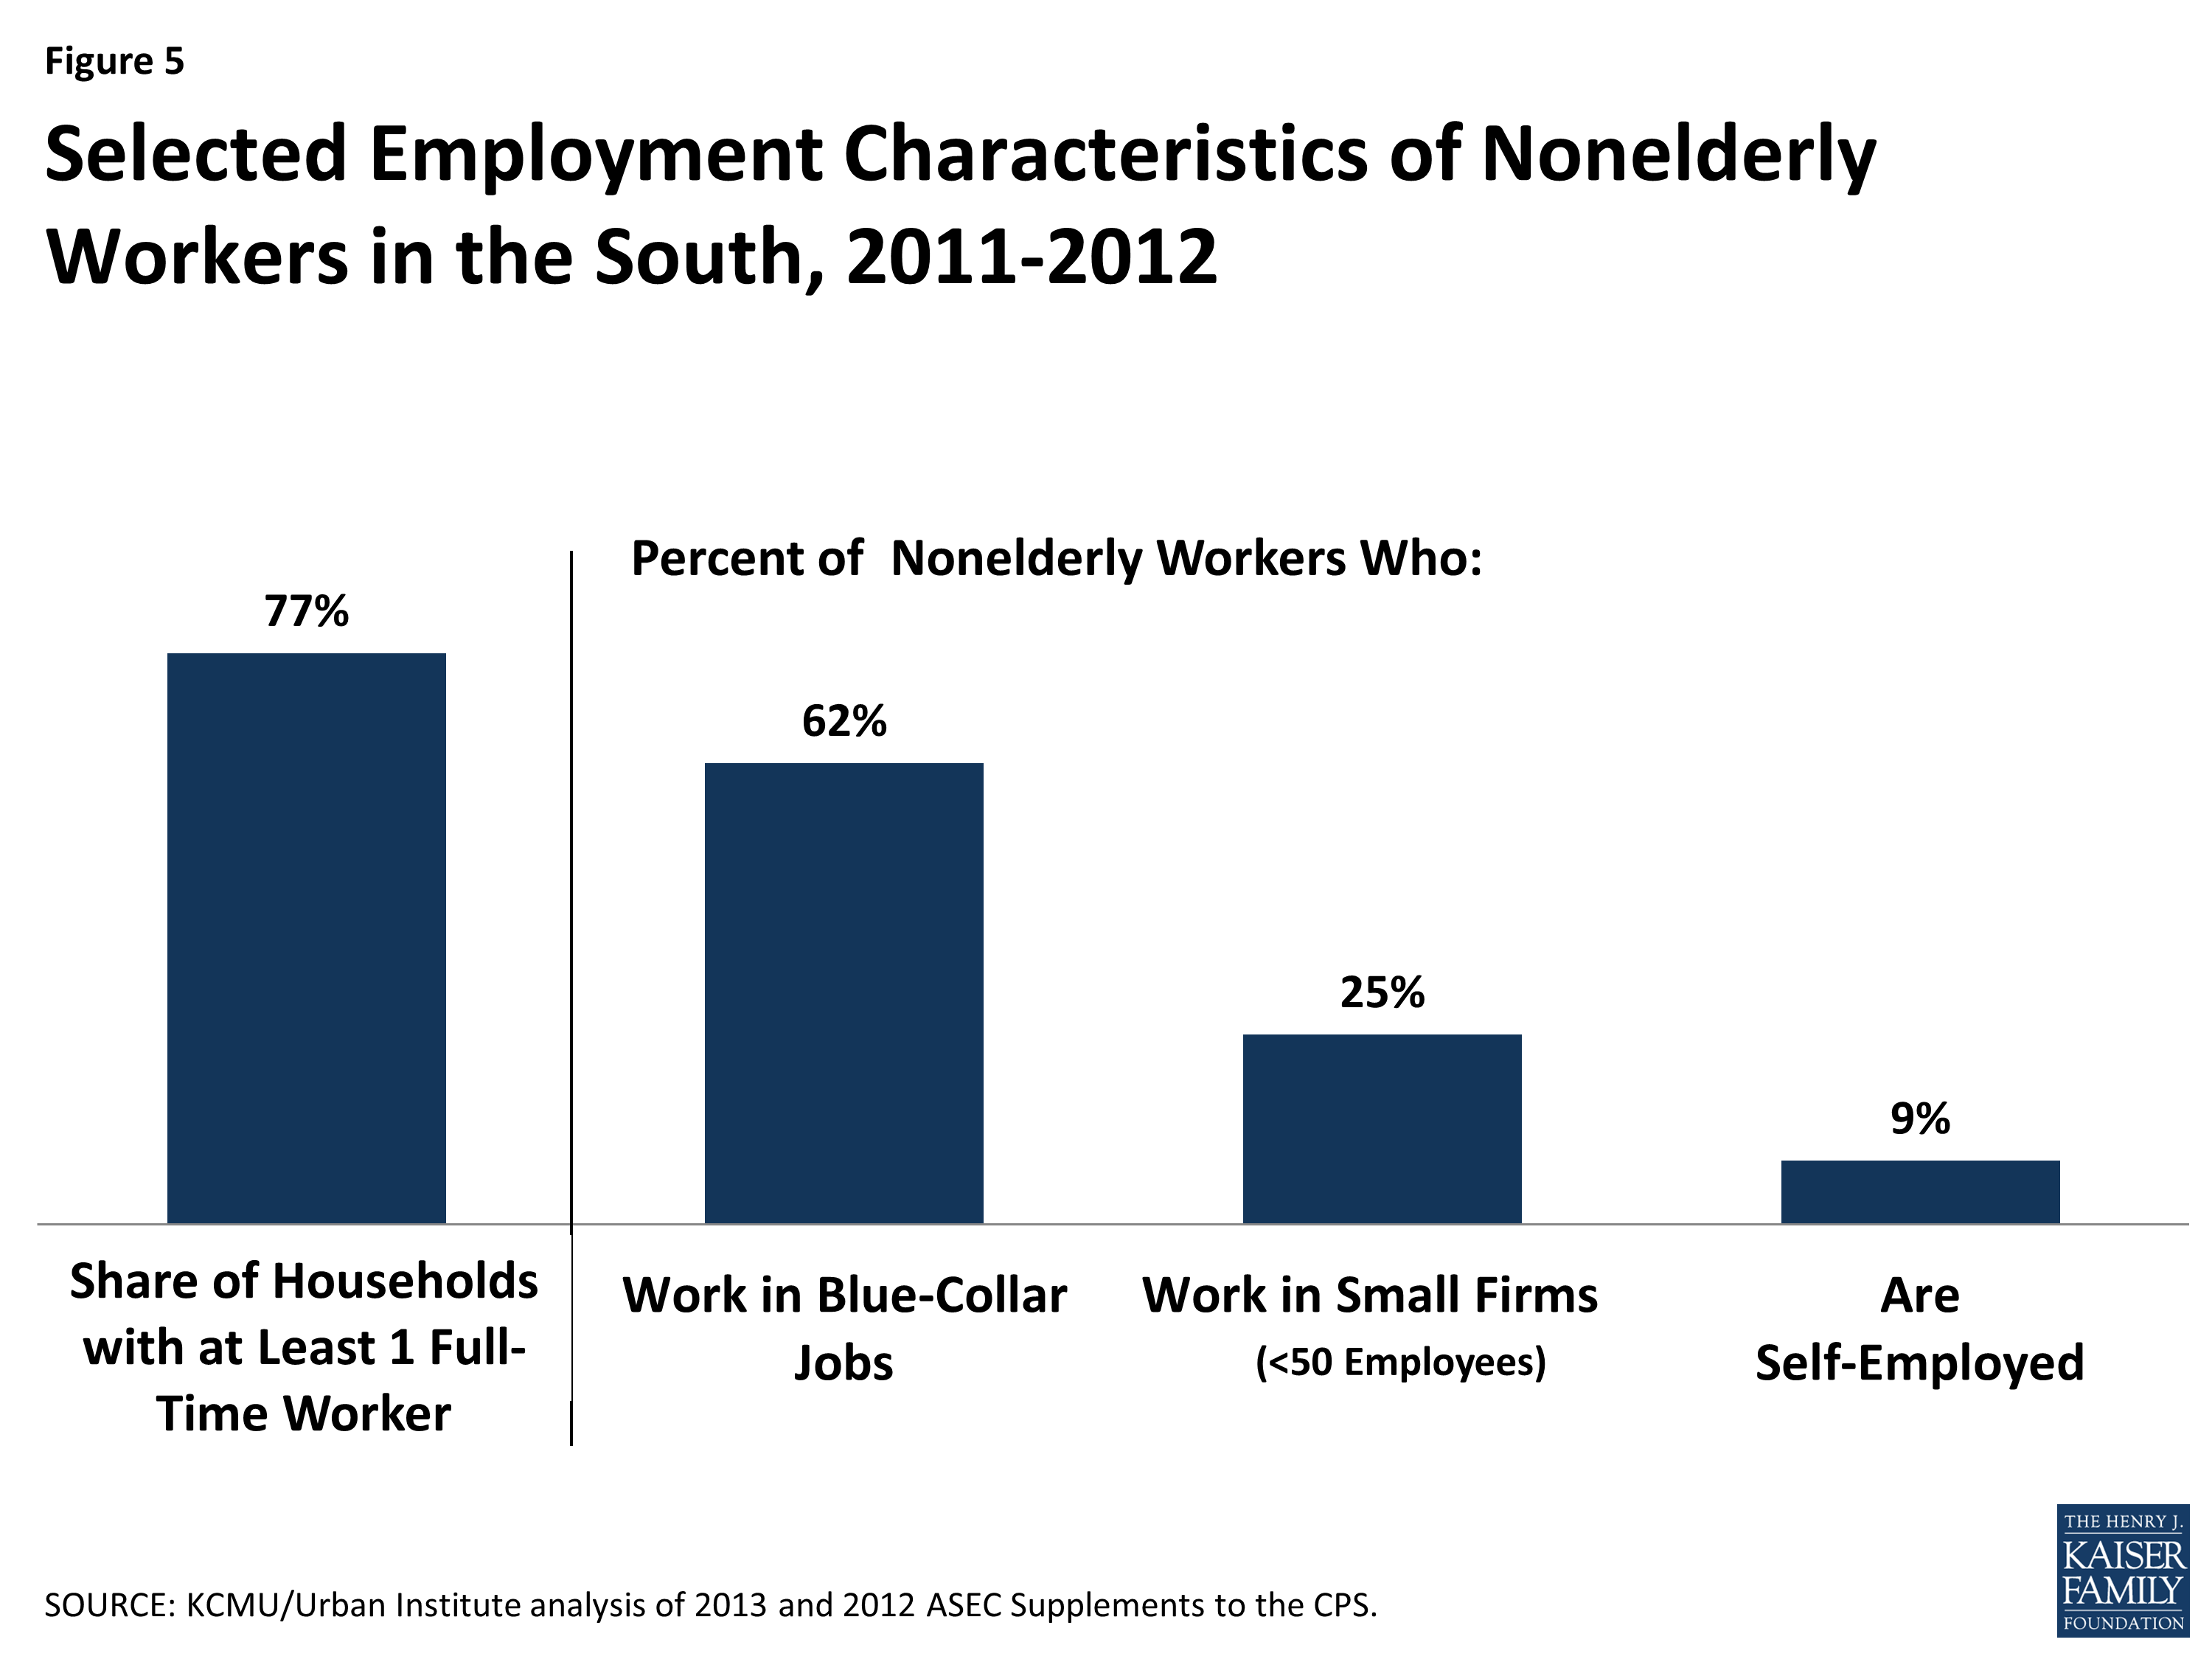
Figure 5: Selected Employment Characteristics of Nonelderly Workers in the South, 2011-2012
The South includes states with some of the nation’s highest poverty rates. Overall, the poverty rate for the South is not significantly different from the nation’s poverty rate, with just over one in five nonelderly southern residents (22%) living in a poor household.6 However, Southerners are significantly more likely than those in the Northeast and Midwest to be poor.7 Further, poverty rates vary widely across the southern states, and the region includes several states, including Louisiana, Mississippi, Arkansas, and the District of Columbia, that have among the highest rates of poverty in the nation (Table 2).
| Table 2: Number and Share of Nonelderly Southern Population Living in a Poor Household by State, 2011-2012 | ||
| State | Number Below Poverty | Percent Below Poverty |
| United States | 56,626,000 | 21% |
| South | 22,293,000 | 22% |
| Louisiana | 1,086,000 | 28% |
| Mississippi | 698,000 | 28% |
| Arkansas | 646,000 | 26% |
| District of Columbia | 137,000 | 25% |
| South Carolina | 952,000 | 24% |
| Alabama | 985,000 | 24% |
| Georgia | 2,028,000 | 24% |
| Kentucky | 879,000 | 24% |
| Tennessee | 1,262,000 | 23% |
| Texas | 5,363,000 | 23% |
| West Virginia | 345,000 | 22% |
| Florida | 3,431,000 | 22% |
| North Carolina | 1,772,000 | 22% |
| Oklahoma | 682,000 | 21% |
| Delaware | 155,000 | 20% |
| Virginia | 1,097,000 | 16% |
| Maryland | 776,000 | 15% |
| SOURCE: KCMU/Urban Institute analysis of 2013 and 2012 ASEC Supplements to the CPS. | ||
Health Coverage and Care in the South Today
Southerners are less likely to have private coverage and more likely to be uninsured compared to individuals in the Northeast and Midwest. The low rate of private coverage among nonelderly Southerners likely reflects the fact that a large share of southern adults work in low-wage, blue collar jobs or small firms that often do not offer health coverage, and private coverage on the individual market has historically been unaffordable for many families. As a result of their lower rate of private coverage, nonelderly Southerners are more likely than those in the Northeast and Midwest to be uninsured, with more than one in five (21%) lacking coverage (Figure 6). In particular, Texas and Florida have some of the highest uninsured rates in the country at 27% and 25%, respectively (see Appendix Tables 3 and 4). Moreover, the majority of uninsured individuals in the South live in Texas, Florida, and Georgia, which together account for two-thirds (65%) of all nonelderly uninsured Southerners and 44% of the uninsured nationwide.1
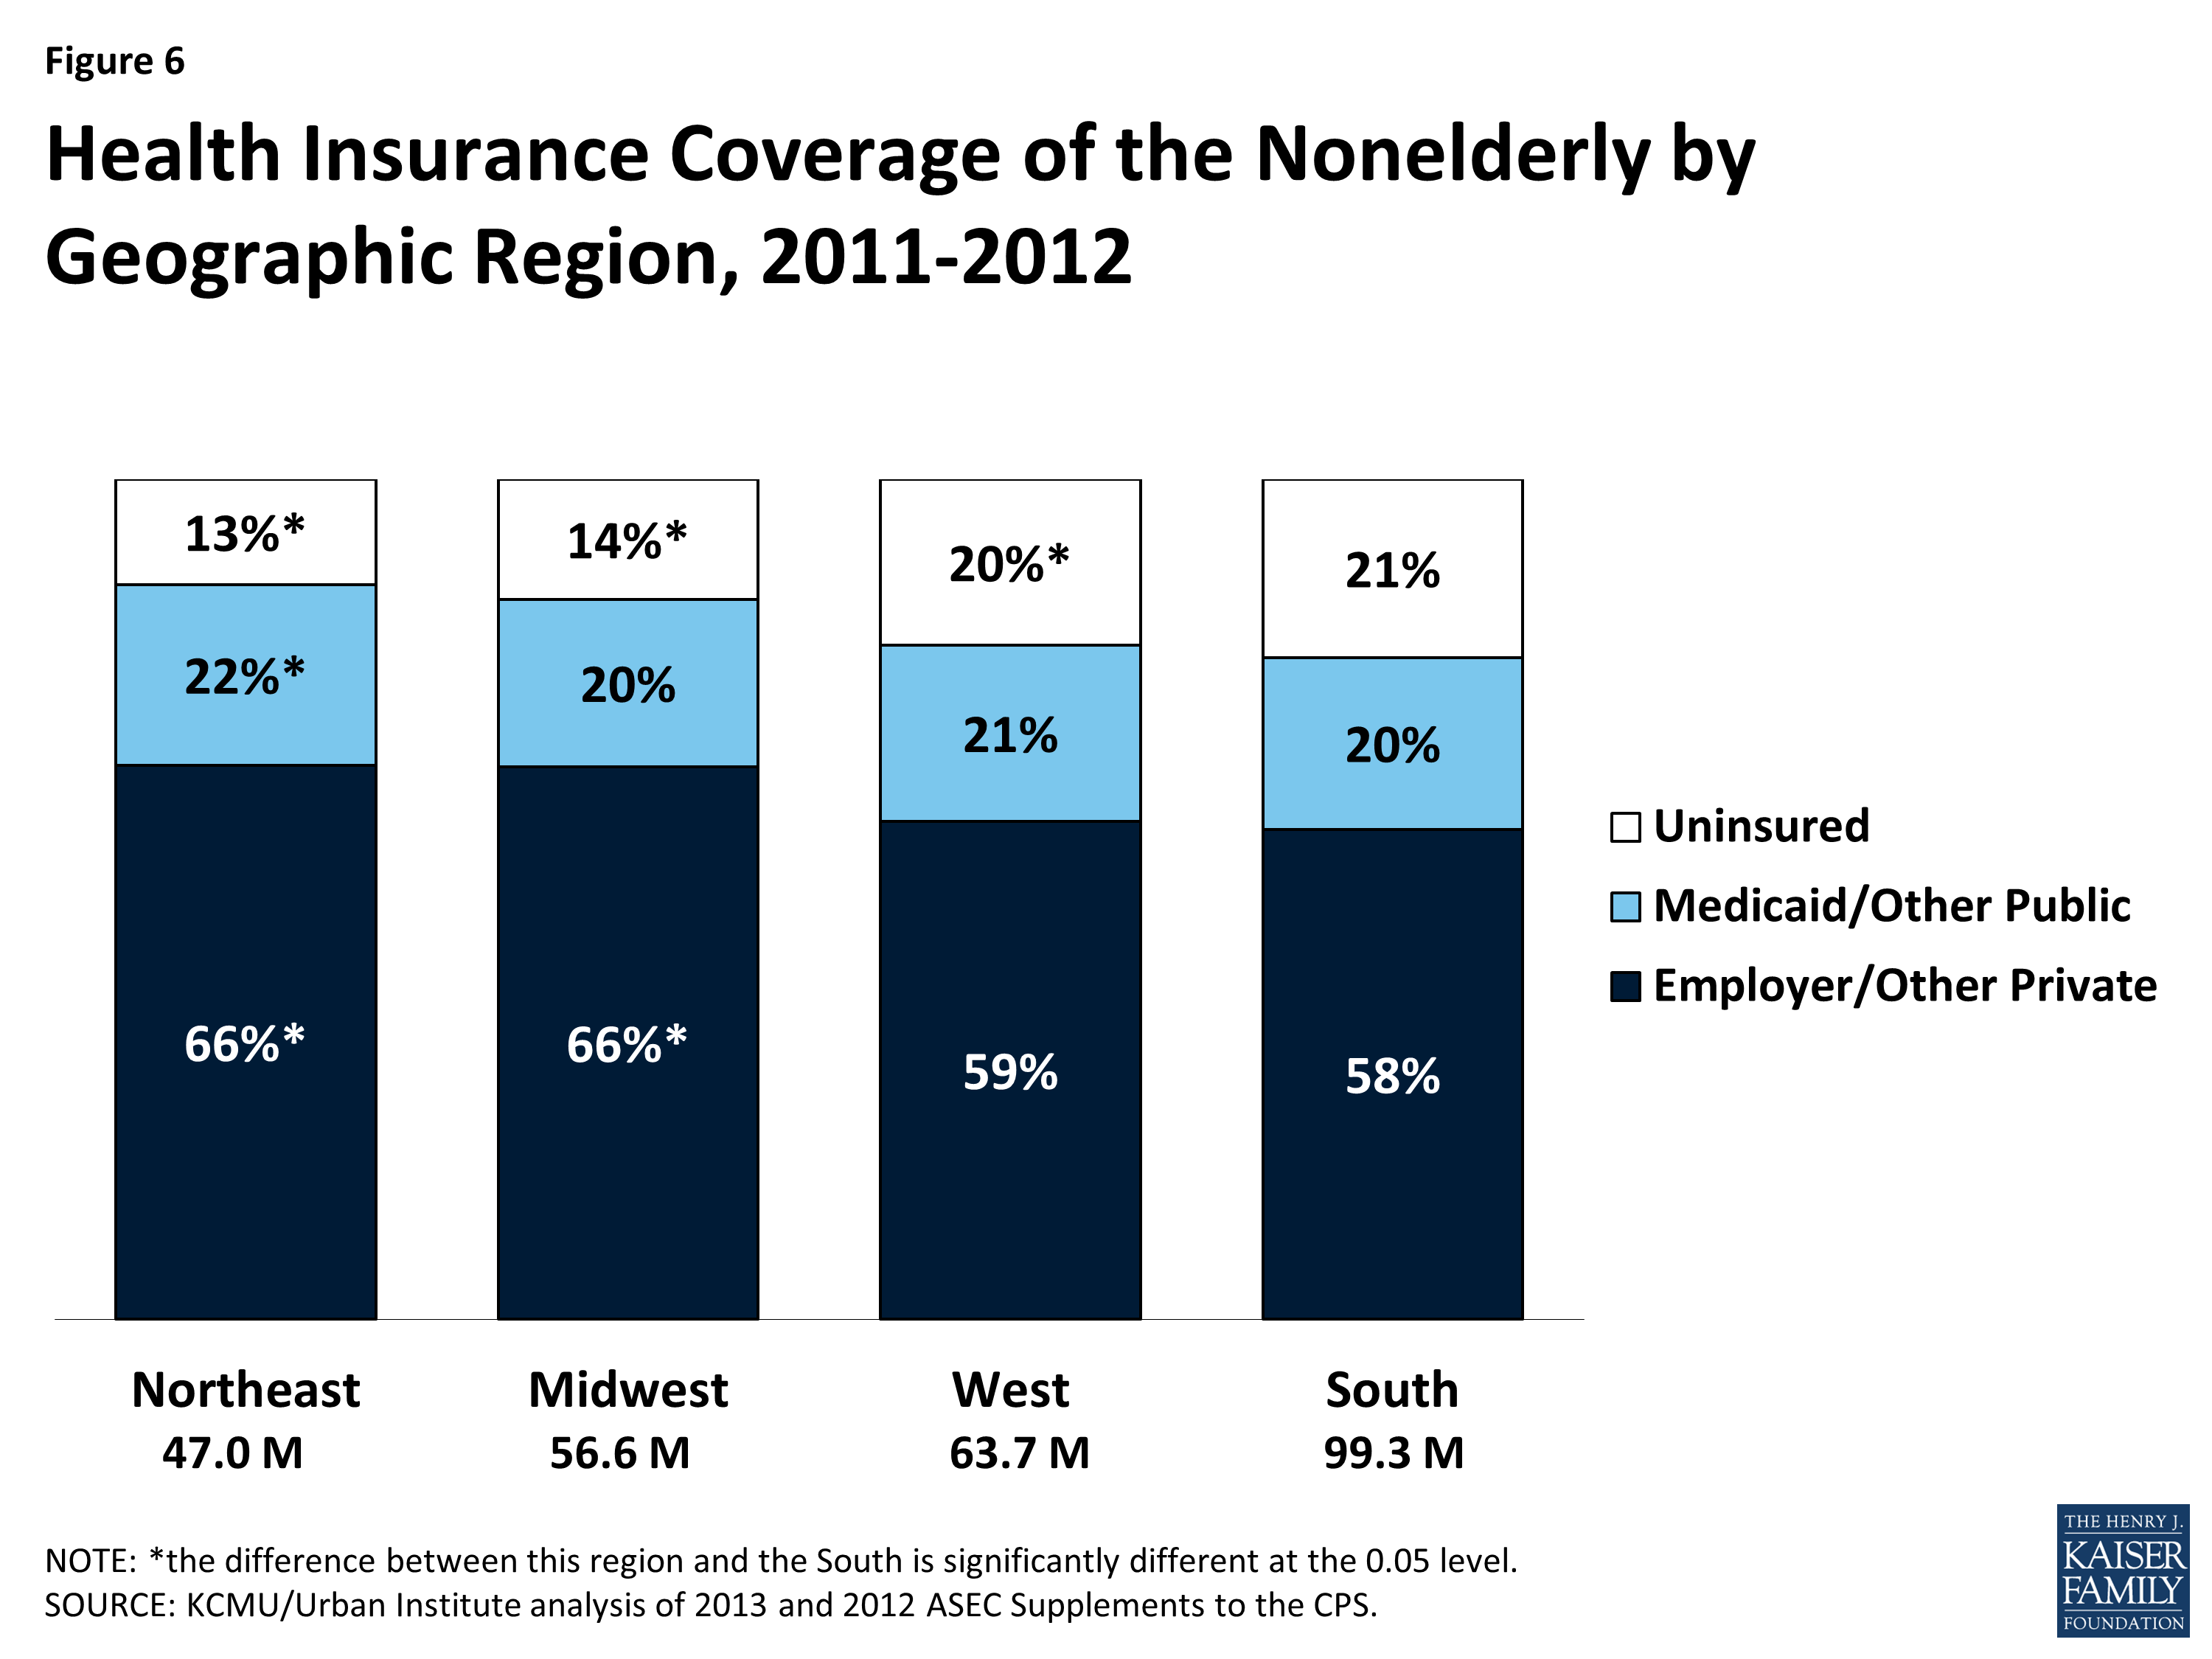
Figure 6: Health Insurance Coverage of the Nonelderly by Geographic Region, 2011-2012
People of color make up the majority of uninsured people in the South (58%), although more than four in ten uninsured Southerners (42%) are White (Figure 7). Nearly one-third of uninsured Southerners are Black, and about one in five are Hispanic.
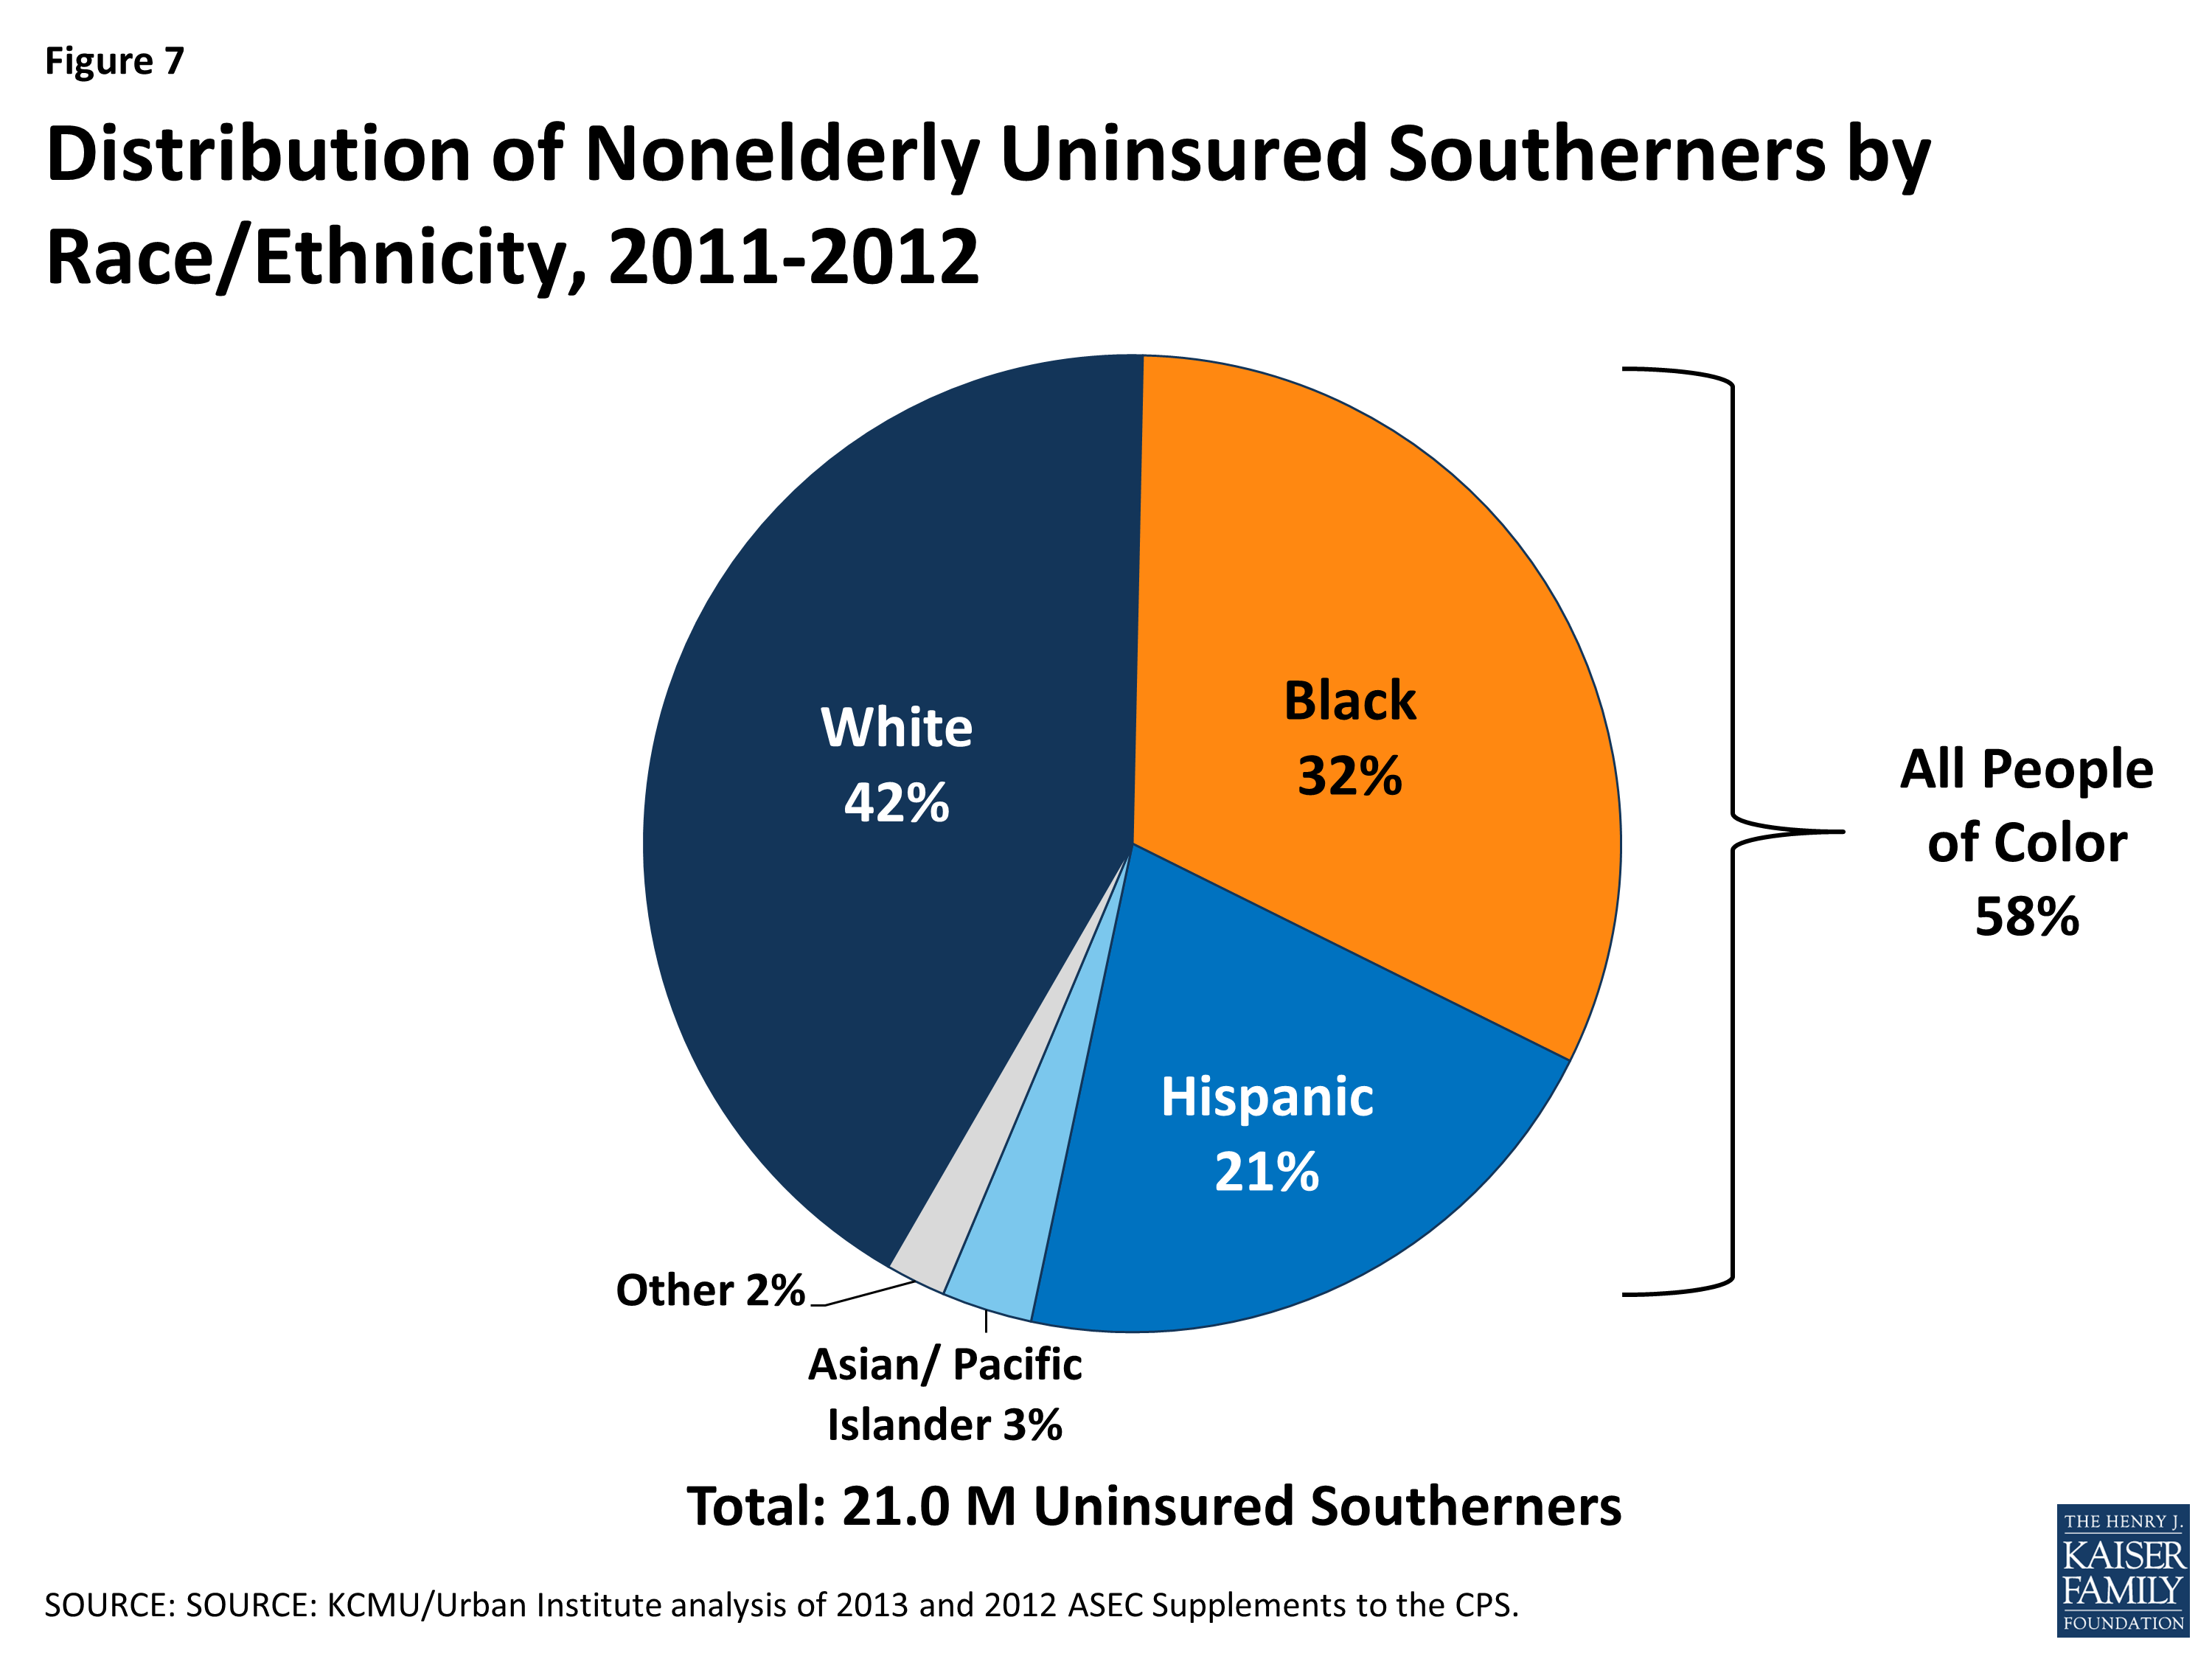
Figure 7: Distribution of Nonelderly Uninsured Southerners by Race/Ethnicity, 2011-2012
As in other regions, most uninsured Southerners are low-income working adults (Figure 8). Four in ten uninsured Southerners have income below the poverty limit ($11,670 for an individual in 2014), and nine in ten have income below 400% of poverty ($46,680 for an individual). Most uninsured Southerners are also in working families. Nearly two-thirds (65%) are in households with at least one full-time worker. Moreover, a large majority (84%) of nonelderly uninsured individuals in the South are adults. Over half (57%) are adults without dependent children, and about a quarter (27%) are parents. Children account for 16% of the uninsured in the region. These coverage patterns reflect the fact that states have significantly expanded Medicaid and CHIP eligibility for children, helping to fill their gap in private coverage, while Medicaid eligibility for adults has historically been very limited in most states.
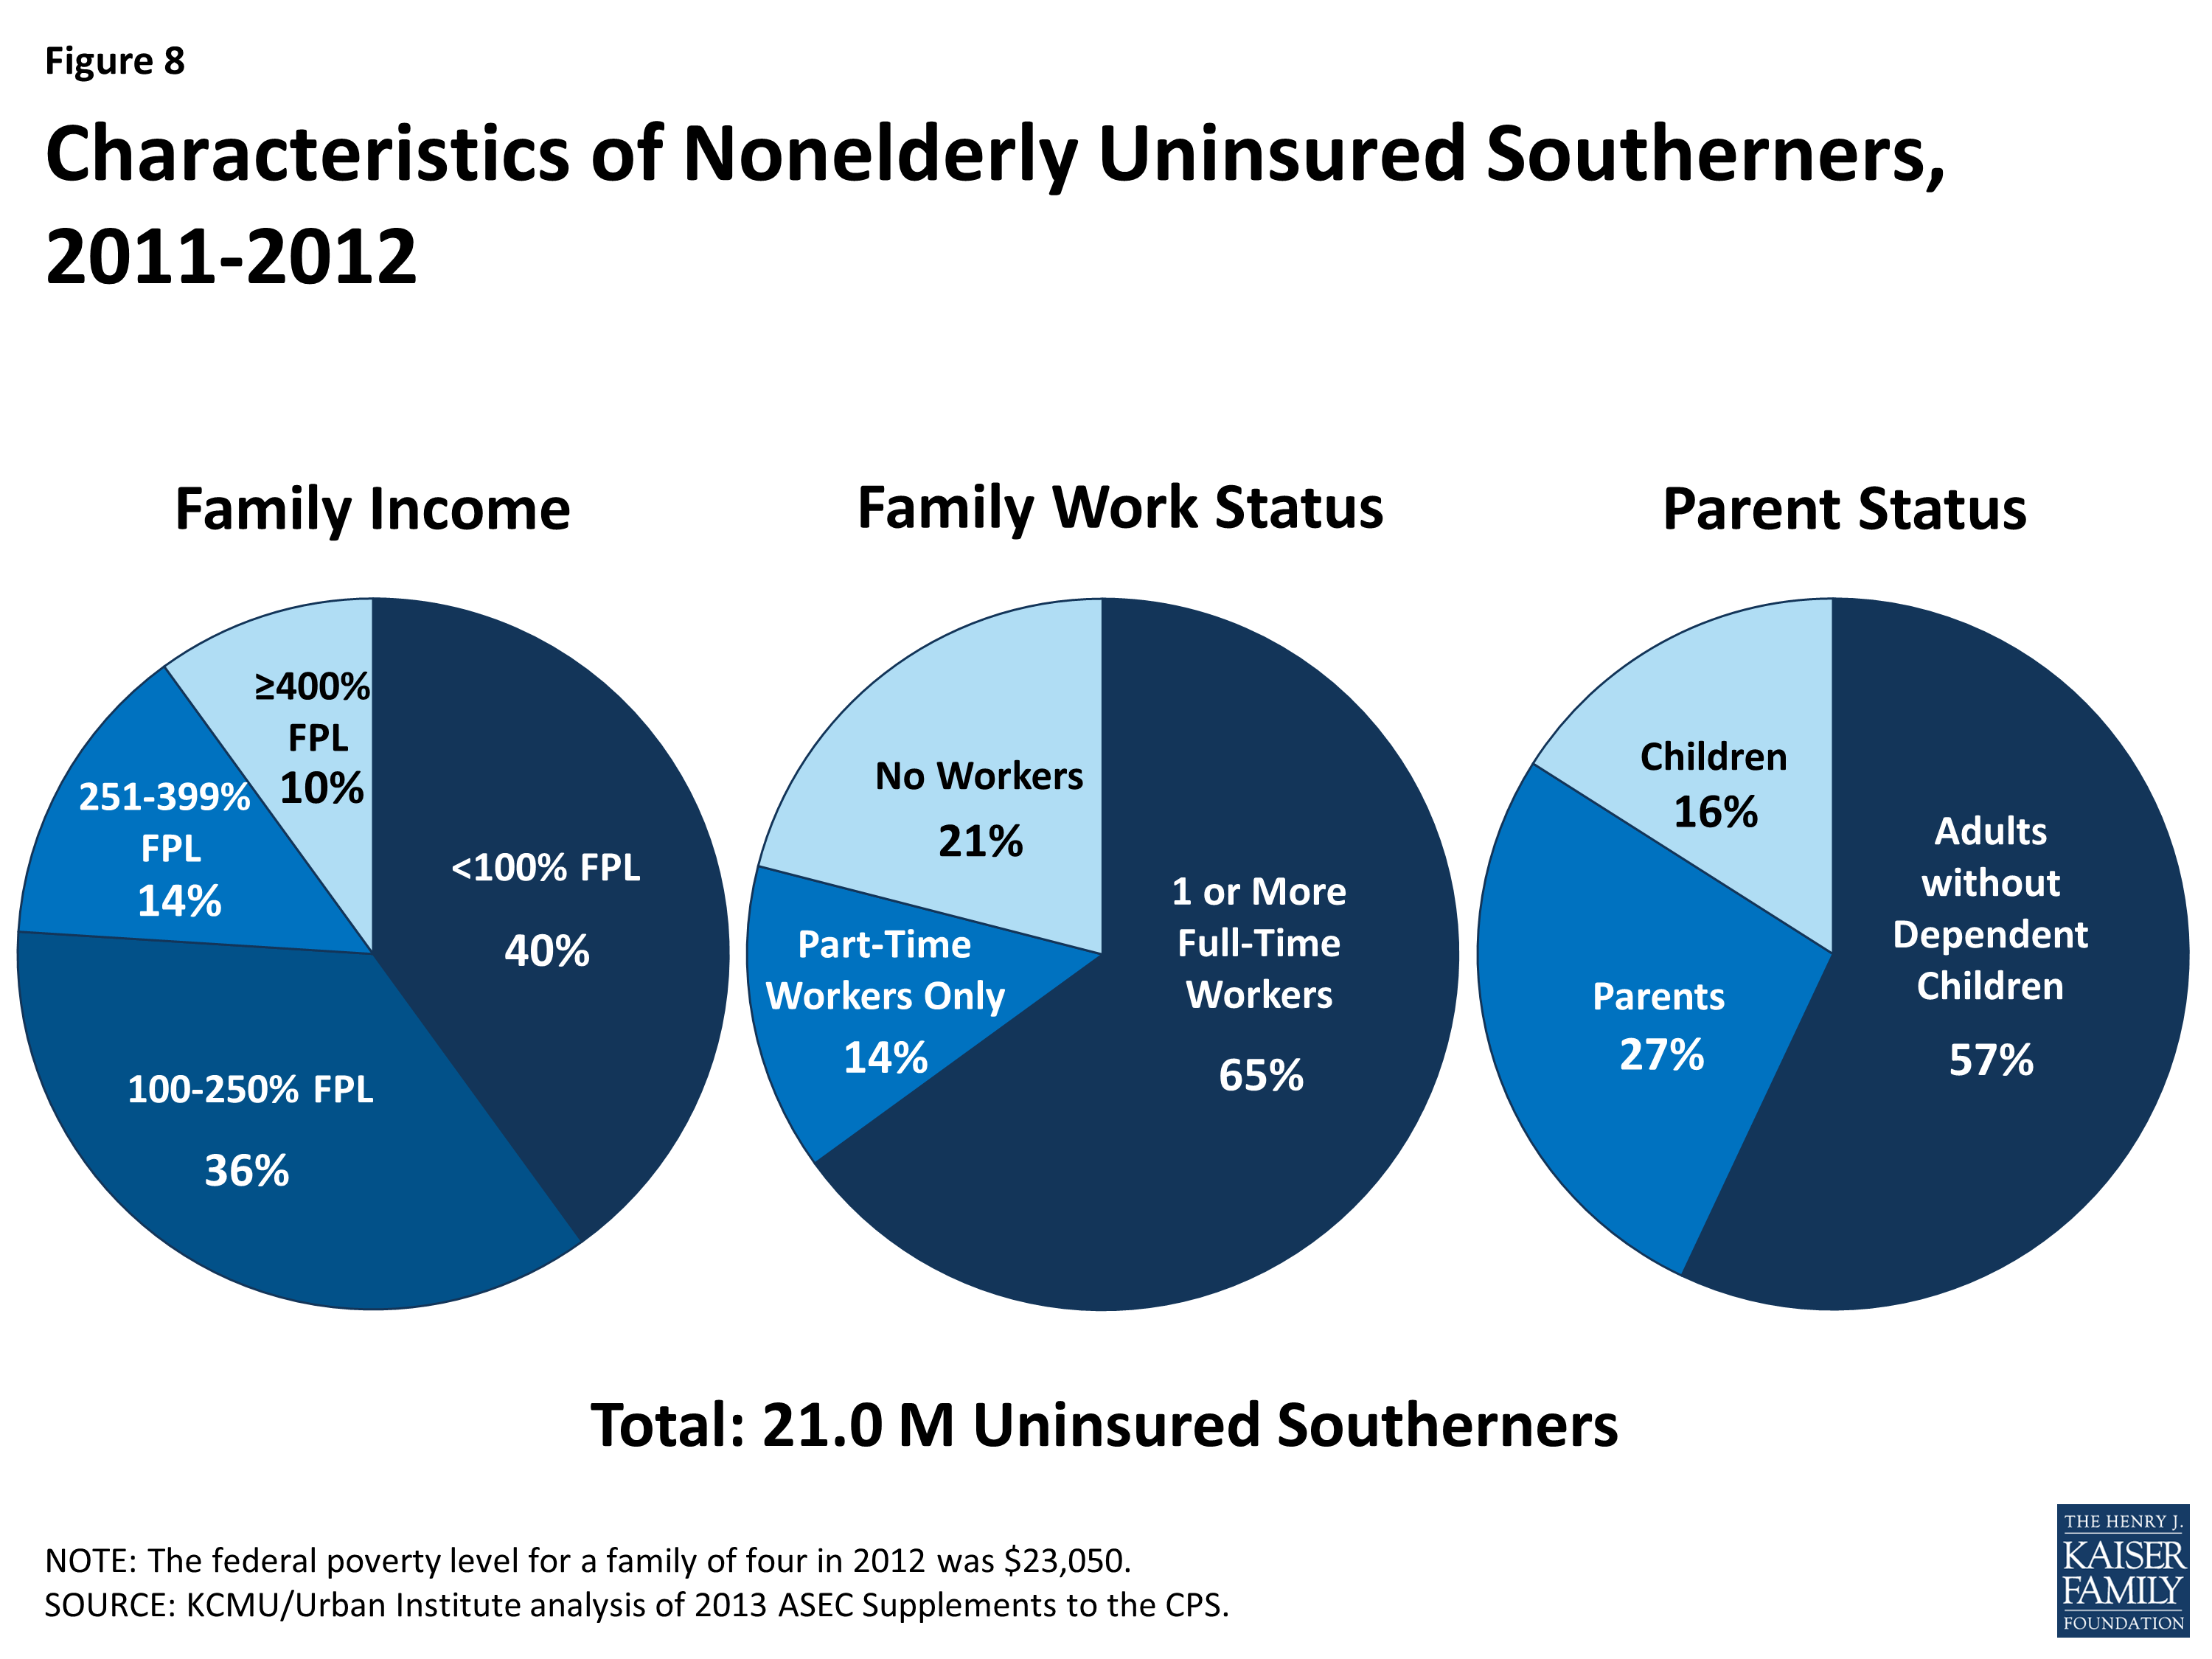
Figure 8: Characteristics of Nonelderly Uninsured Southerners, 2011-2012
Reflecting their limited coverage rates, adults in the South are more likely than those in other regions to report difficulty accessing needed health care services. Nearly one-quarter of Southerners report that they do not have a usual source of care, which is significantly higher than the share of adults without a usual source of care in the Midwest and Northeast. Compared to adults in other regions, particularly the Northeast, Southerners are also more likely to report having postponed seeking care or gone without needed care or drugs due to cost (Figure 9).
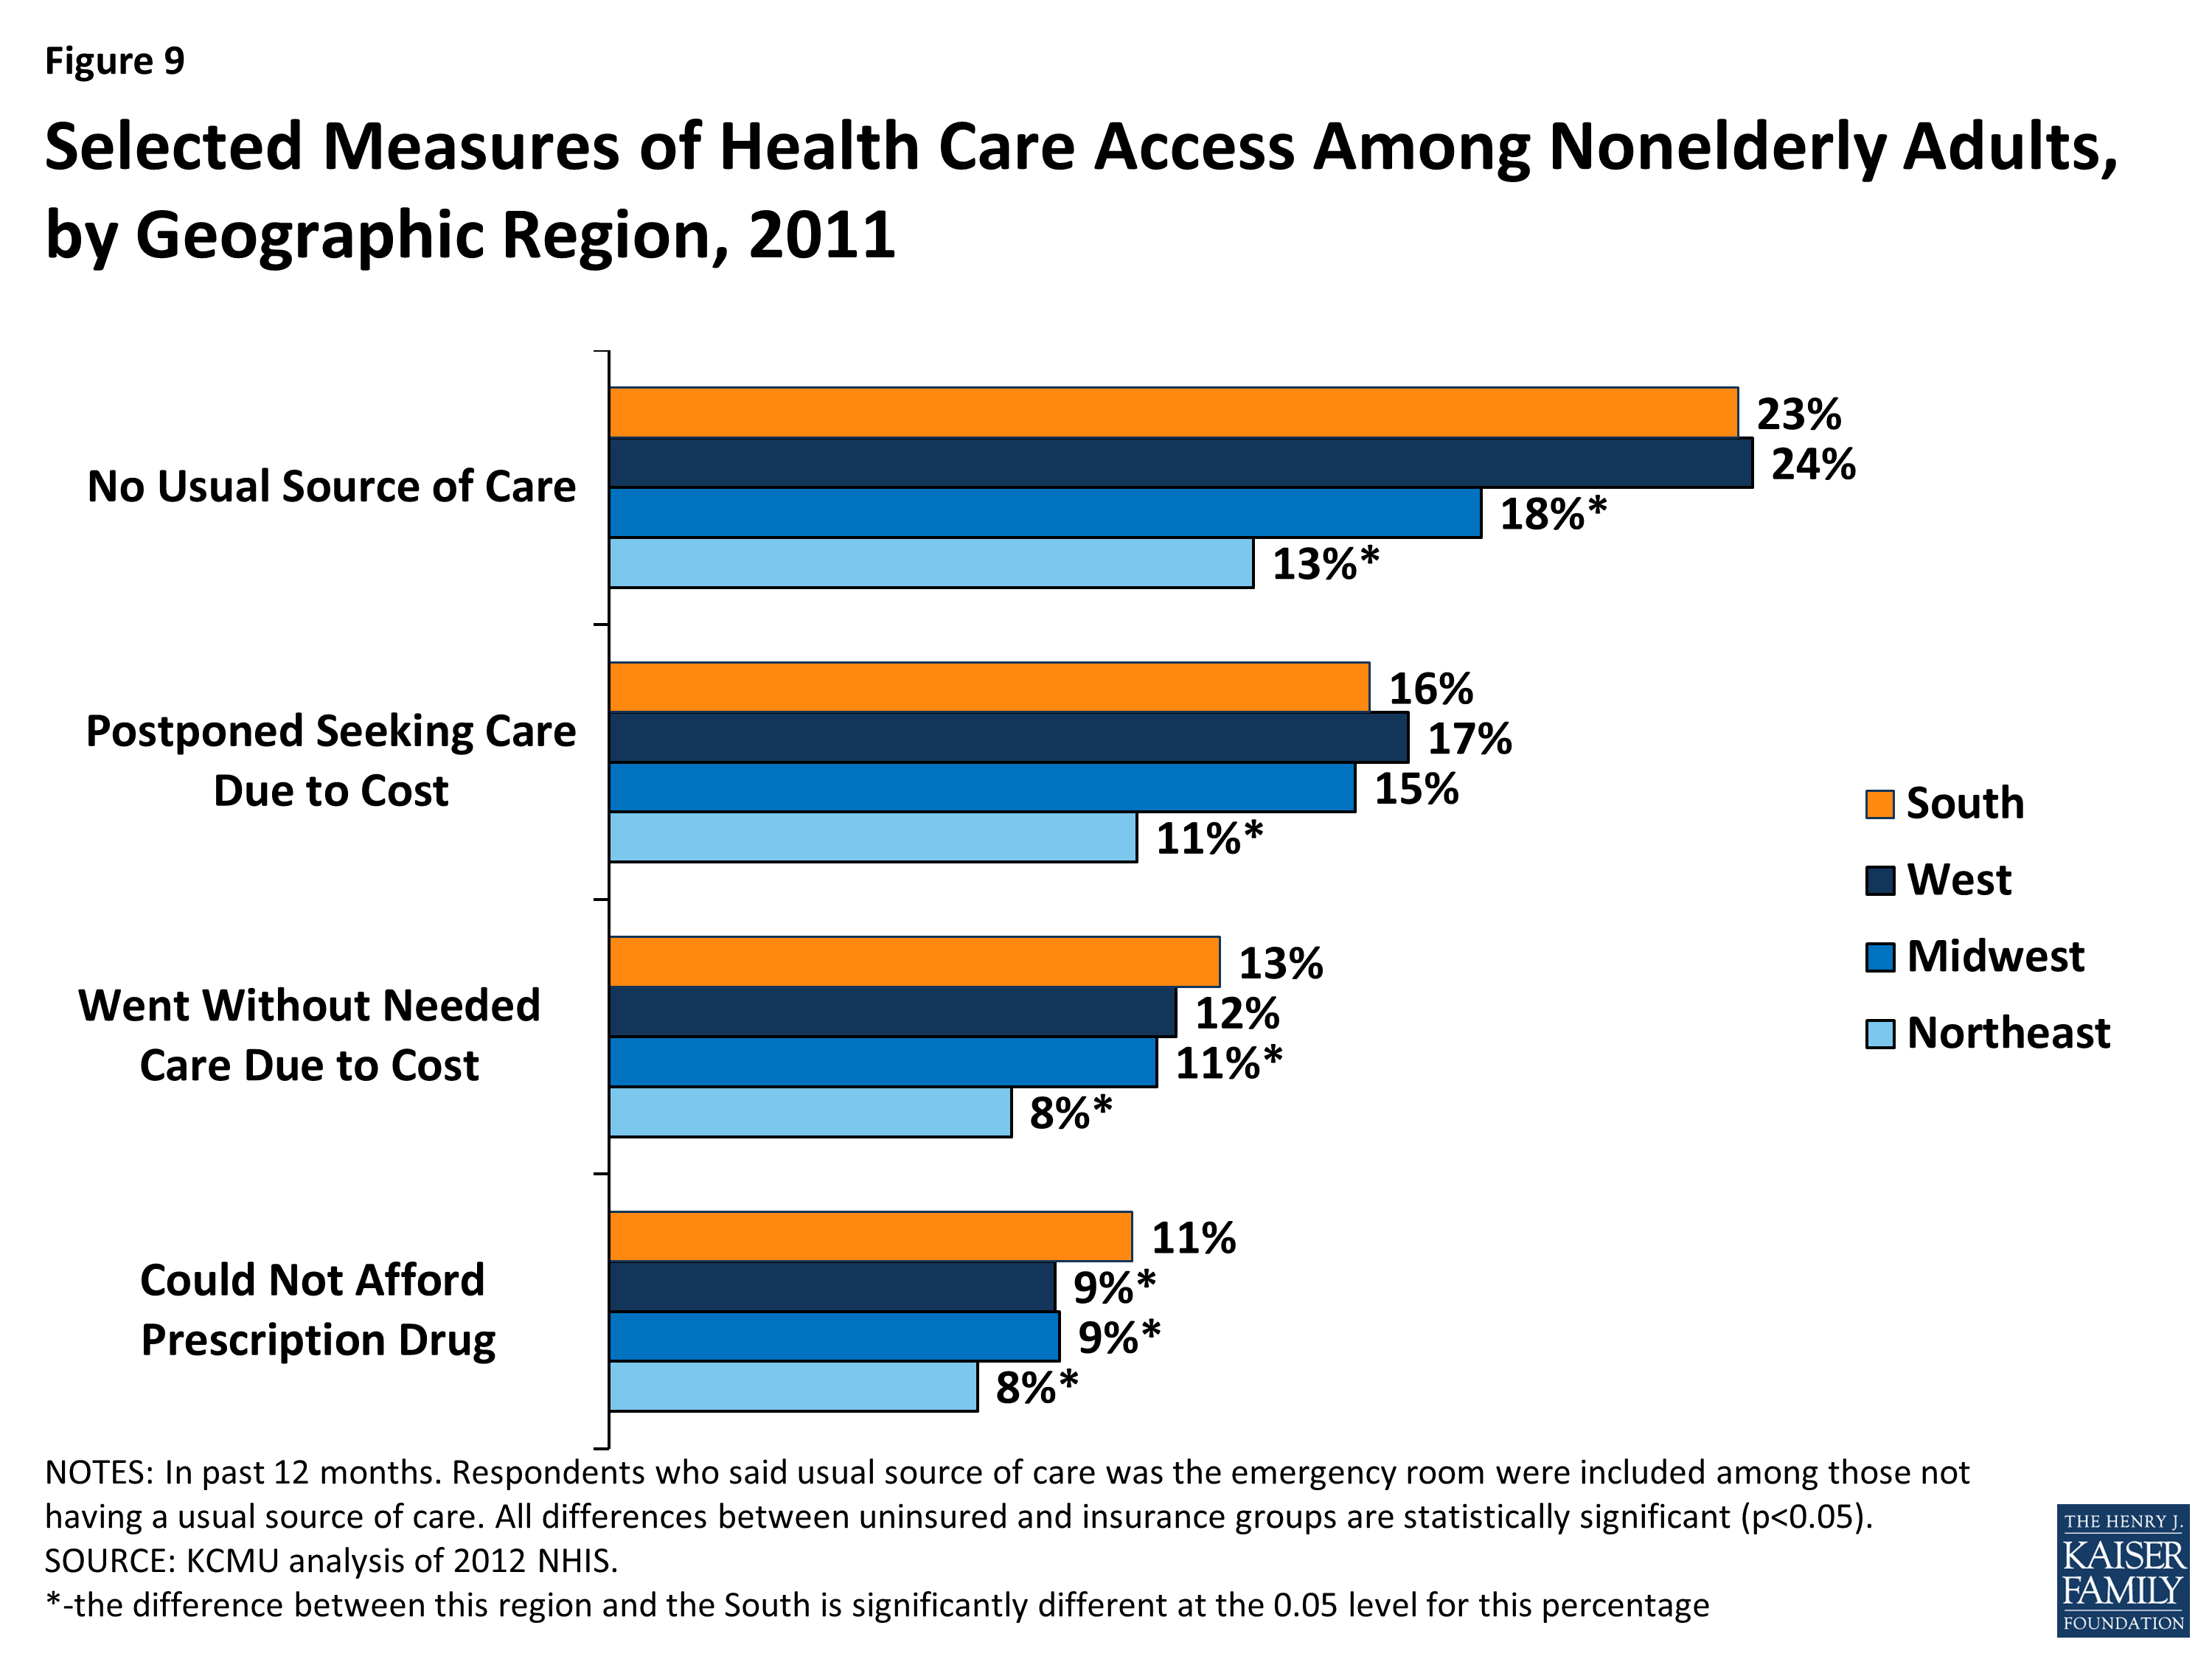
Figure 9: Characteristics of Nonelderly Uninsured Southerners, 2011-2012
Access to health coverage and care is important for Southerners, especially given the high prevalence of chronic health conditions in the South. Most of the states with the highest rates of diabetes are in the South (Figure 10). Similarly, the South includes states with the highest heart disease death rates, infant mortality rates, and cancer death rates in the country.2 Adults in the South are also significantly more likely than those in the Northeast and West to be overweight or obese.3 While a broad array of factors contributes to the relatively high chronic disease rates and poor health outcomes in the South, a key step in addressing these disparities is to ensure that individuals have health coverage that enables them to access preventive and primary care and ongoing treatment and services to meet their health needs.
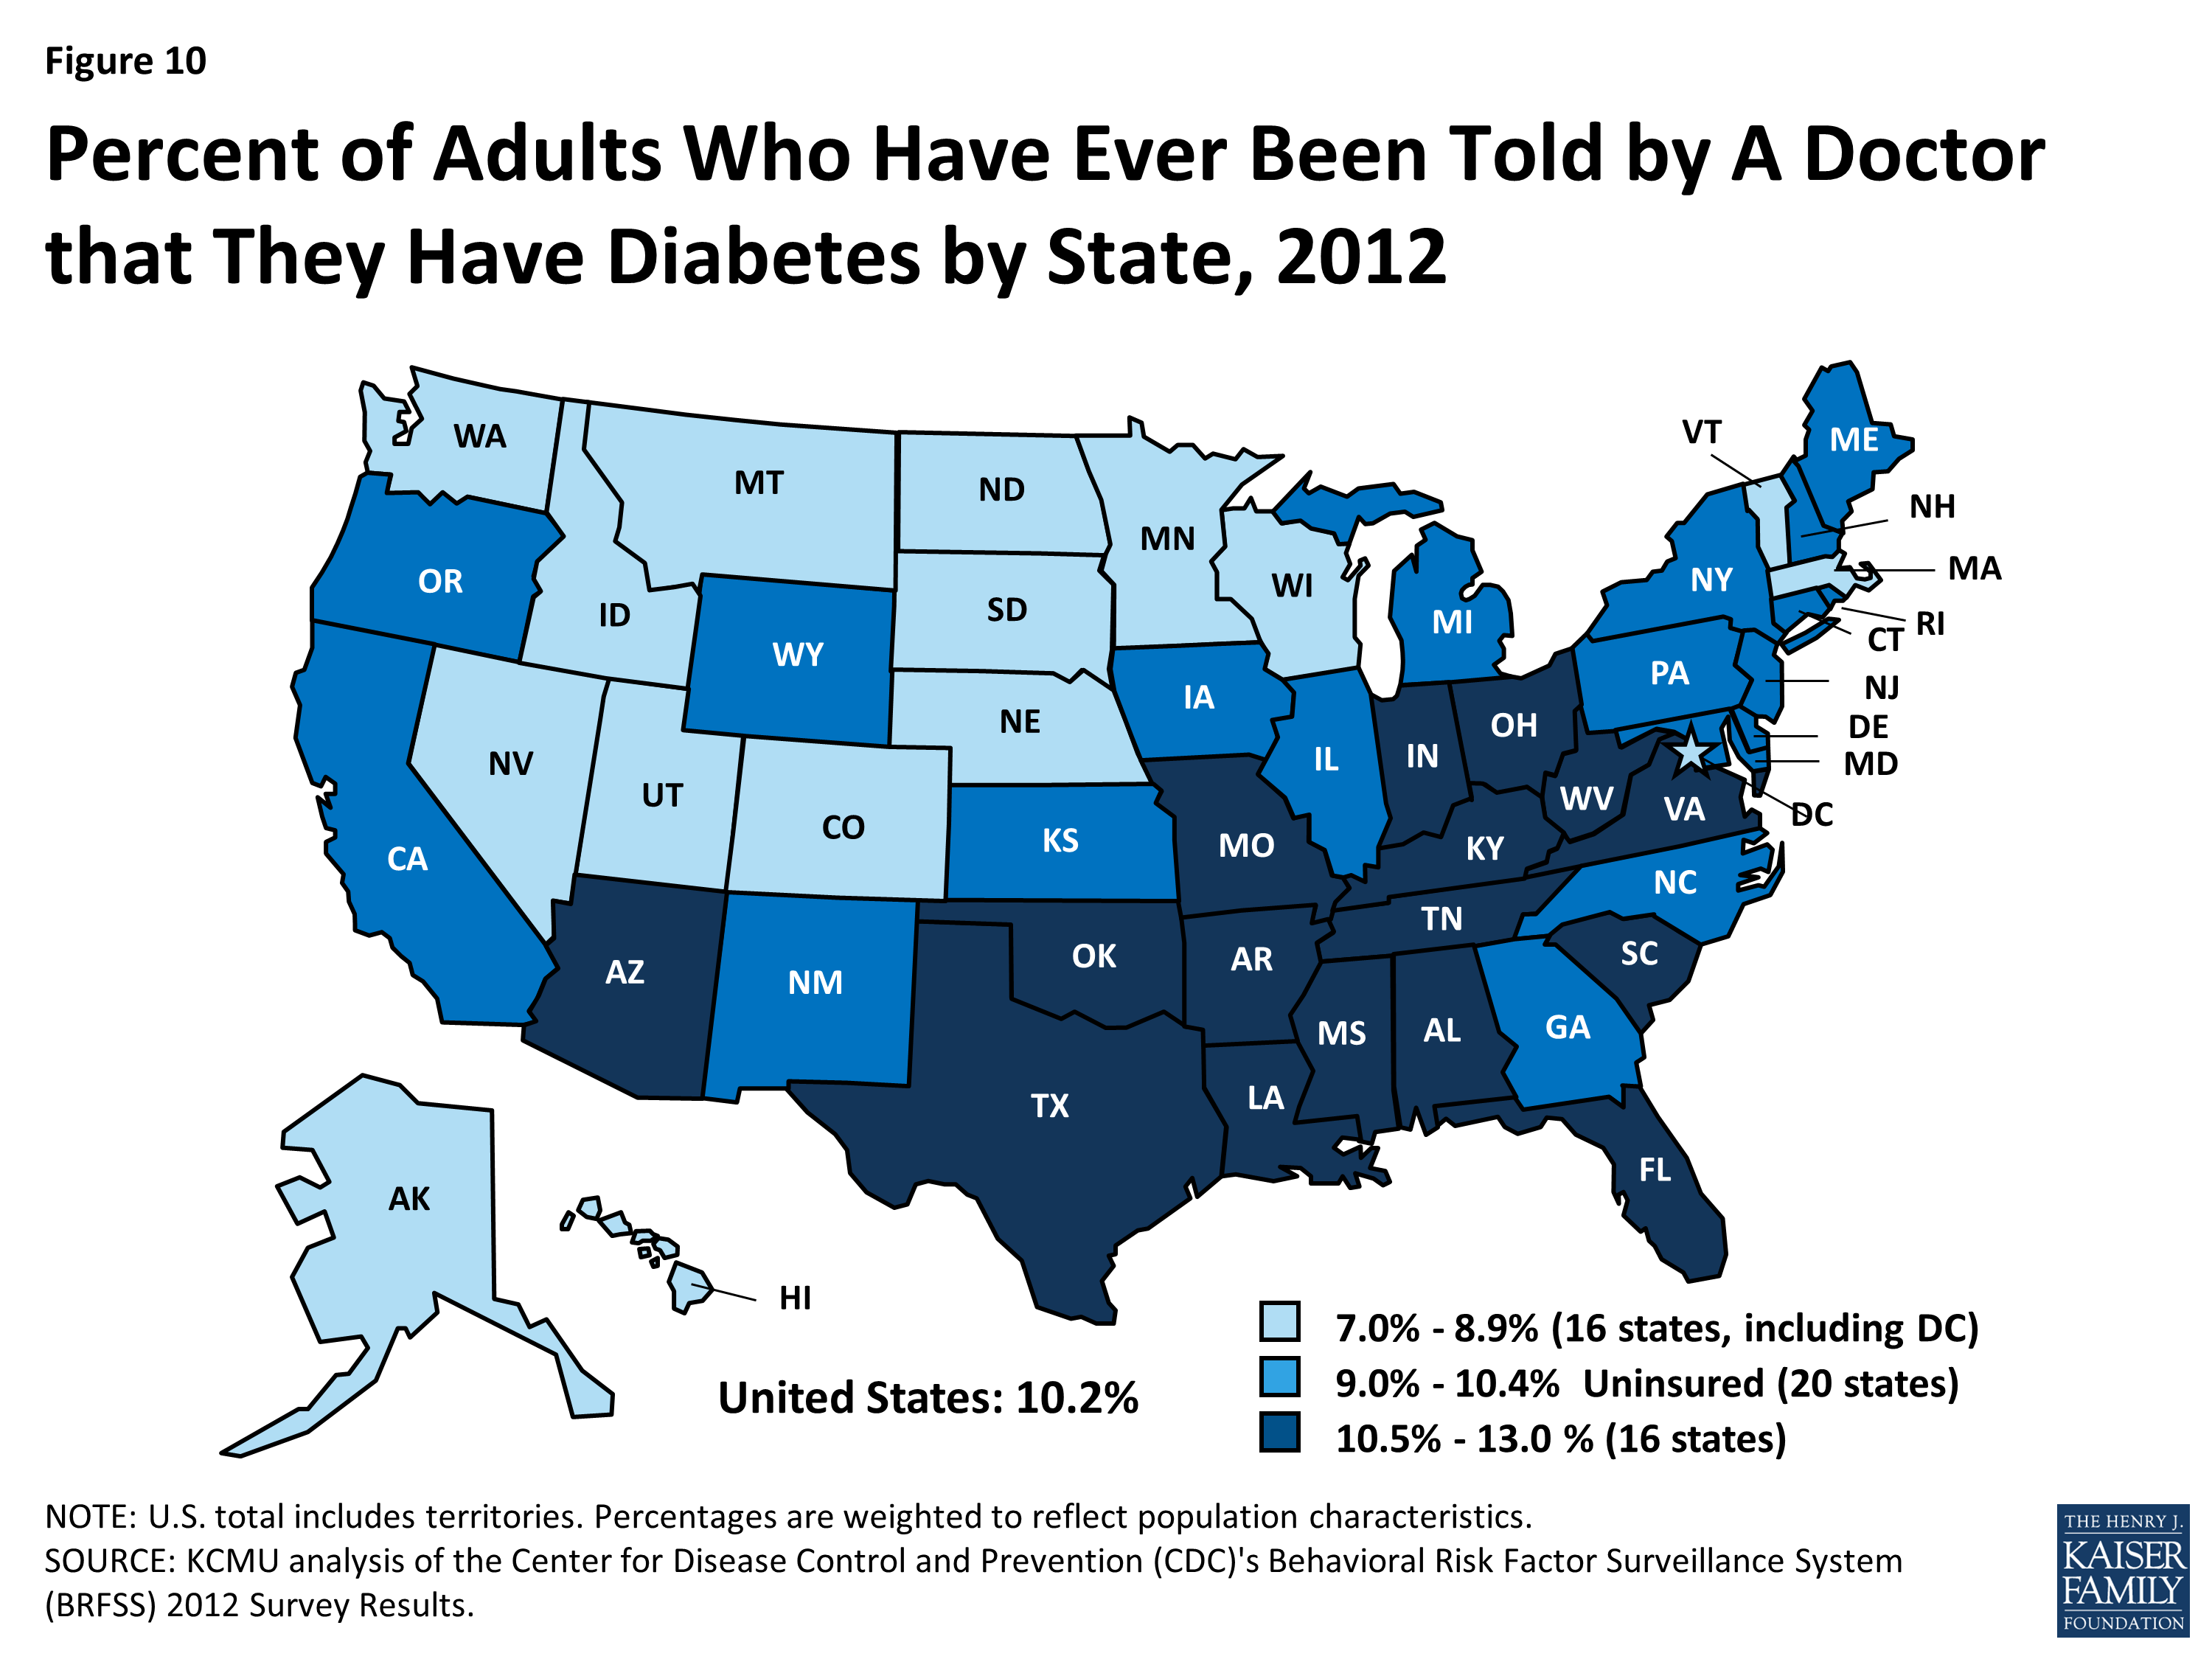
Figure 10: Percent of Adults Who Have Ever Been Told by A Doctor that They Have Diabetes by State, 2012
Health Coverage in the South in 2014
The Impact of the Affordable Care Act Coverage Expansions
A key goal of the ACA is to reduce the number of uninsured individuals through the creation of new coverage options that will allow individuals to access needed health care services. The ACA established a continuum of new coverage options including an expansion of Medicaid eligibility to nearly all adults with incomes at or below 138% FPL ($16,105 for an individual or $27,310 for a family of three in 2014) and the creation of Health Insurance Marketplaces with premium tax credit subsidies to help individuals with incomes up to 400% FPL ($46,680 for an individual or $79,160 for a family of three in 2014) purchase coverage. The ACA also includes provisions designed to provide consumers a streamlined, coordinated enrollment experience across health coverage programs. The combined effects of the coverage expansions, streamlined enrollment system, and broad outreach and enrollment efforts are expected to bring many uninsured individuals into coverage.
The majority of southern states (11 of 17) are relying on the Federally-facilitated Marketplace in 2014, although three (DC, KY, and MD) elected to establish their own State-based Marketplaces. Three additional southern states (AR, DE, and WV) are operating a Marketplace in partnership with the federal government (Figure 11). Marketplace enrollment varies across the southern states. As of April 19, 2014, after the initial annual open enrollment period, nearly 3.5 million Southerners had enrolled health coverage through a Marketplace– about 27% of the potential Marketplace population in the region.1 However, enrollment varied significantly by state, from 16% of the eligible population in Oklahoma to 39% of potential enrollees in Florida (Figure 12).
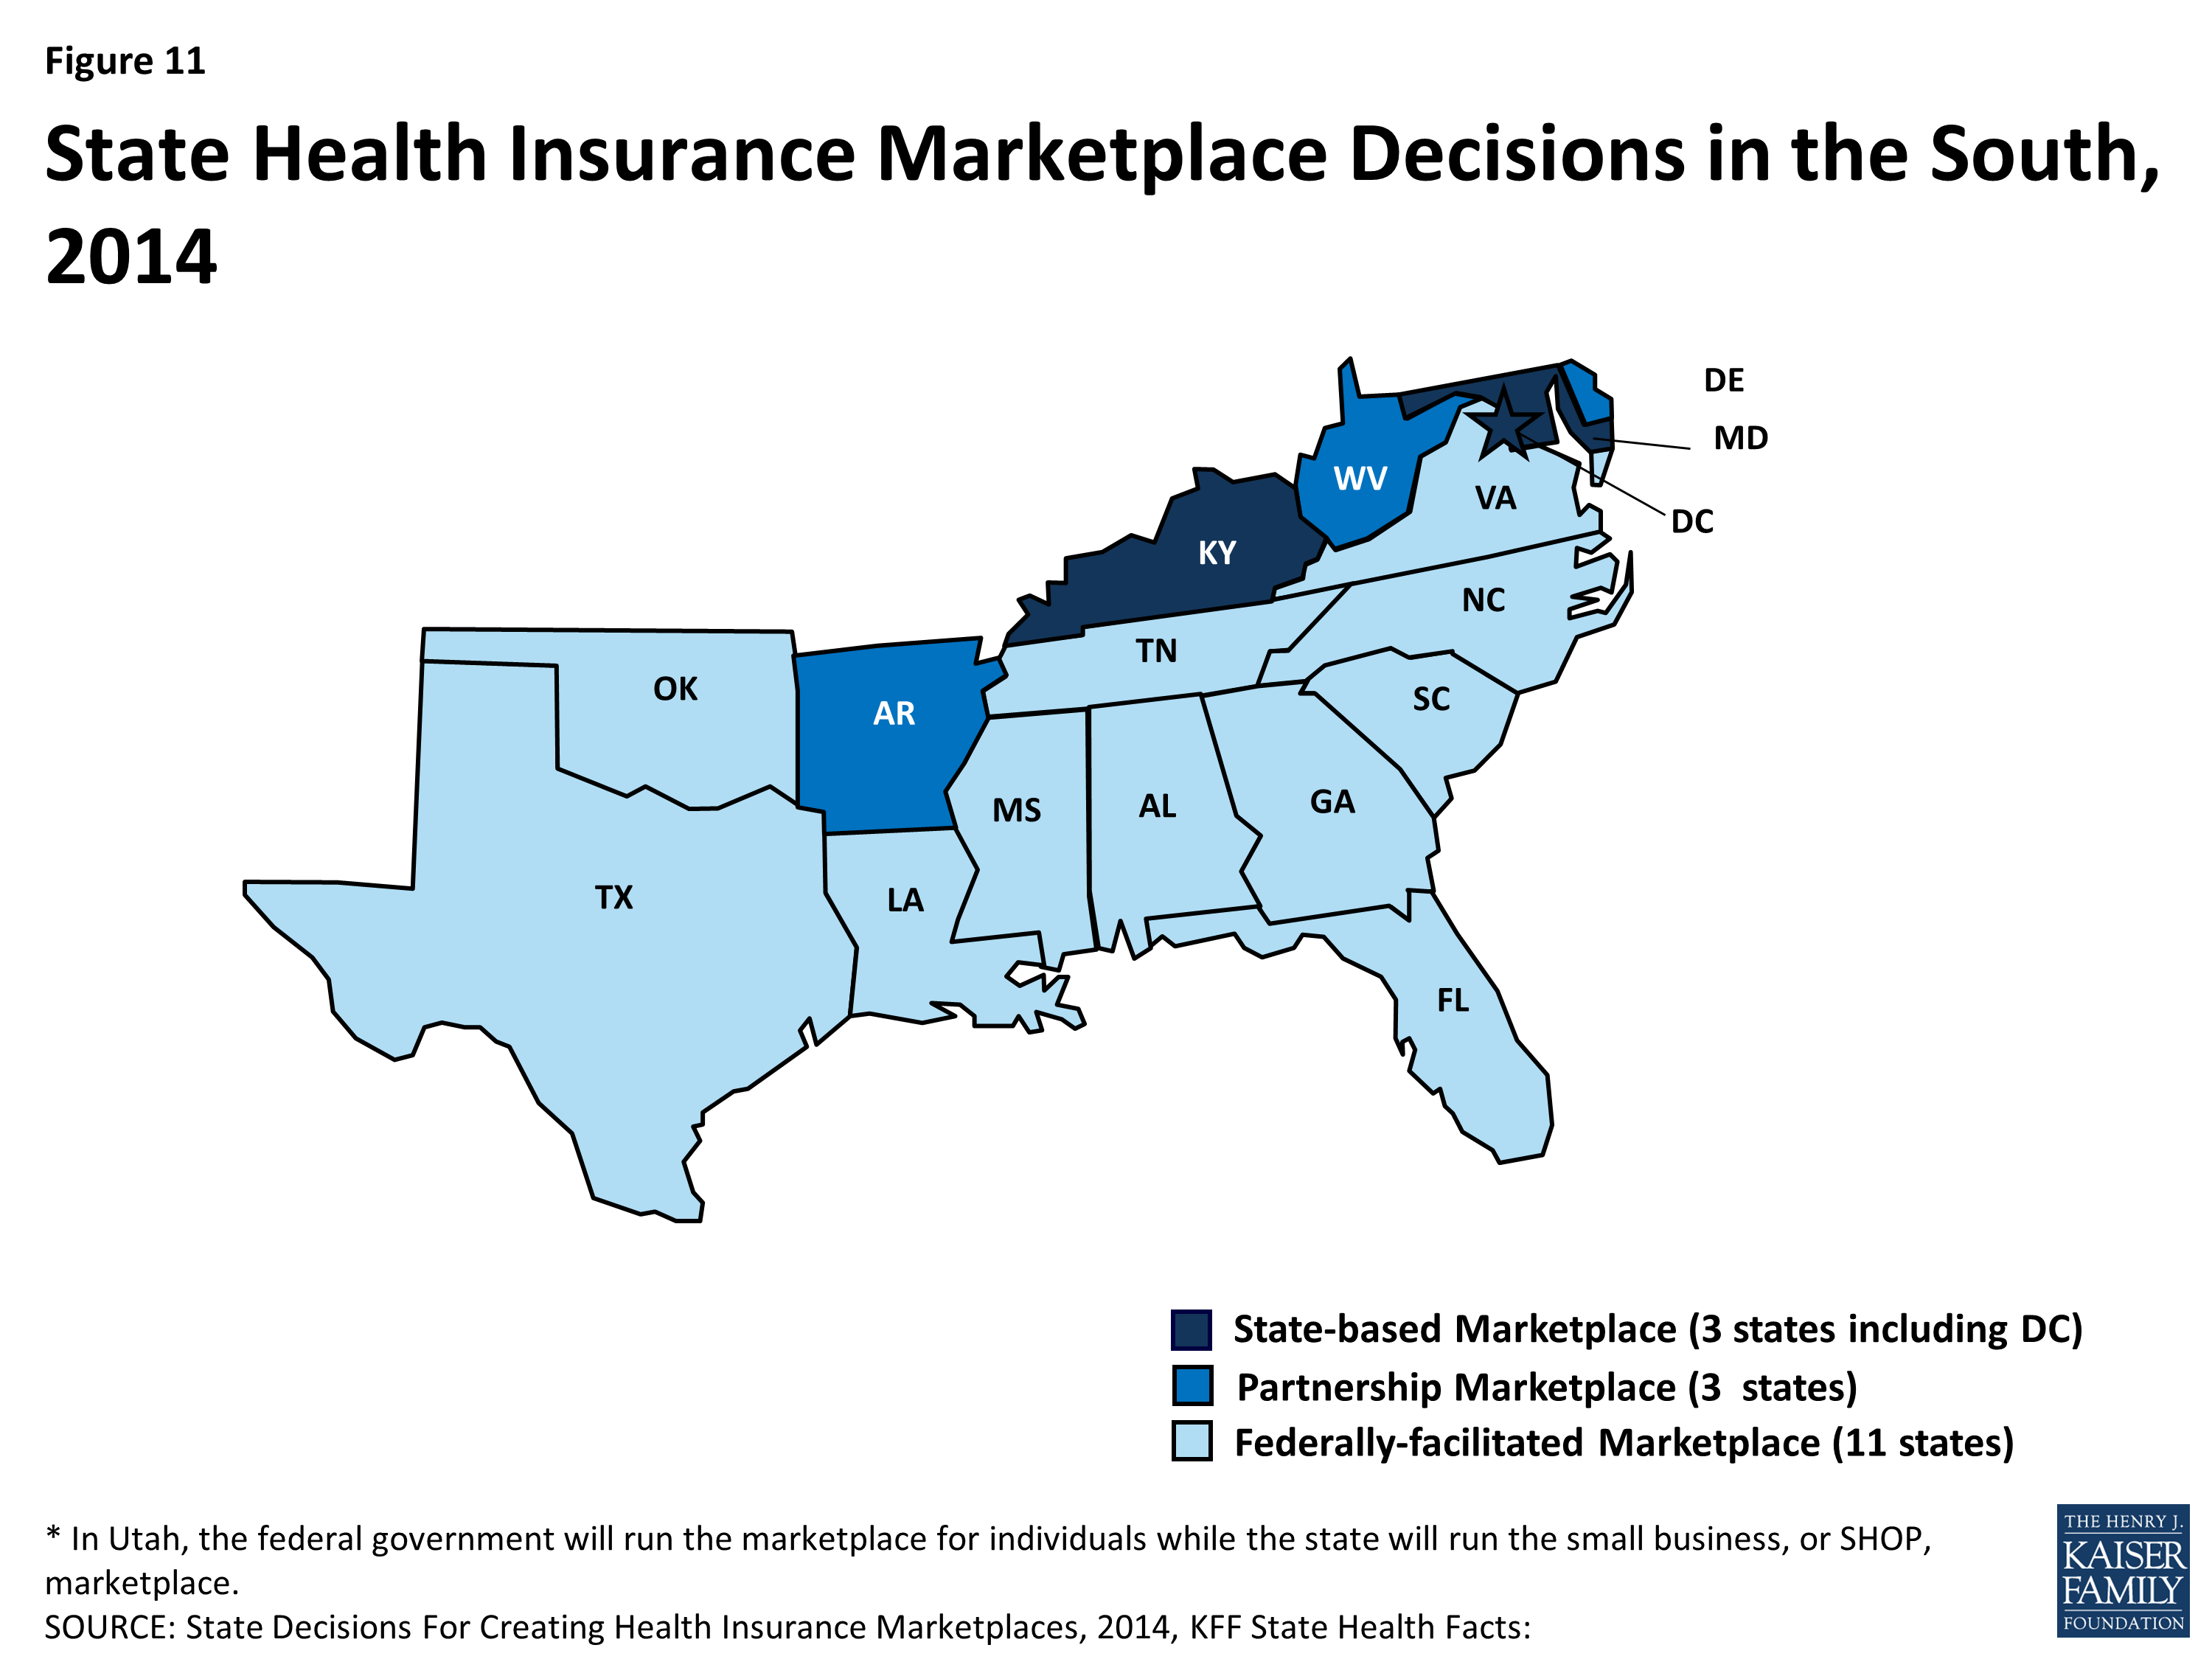
Figure 11: State Health Insurance Marketplace Decisions in the South, 2014
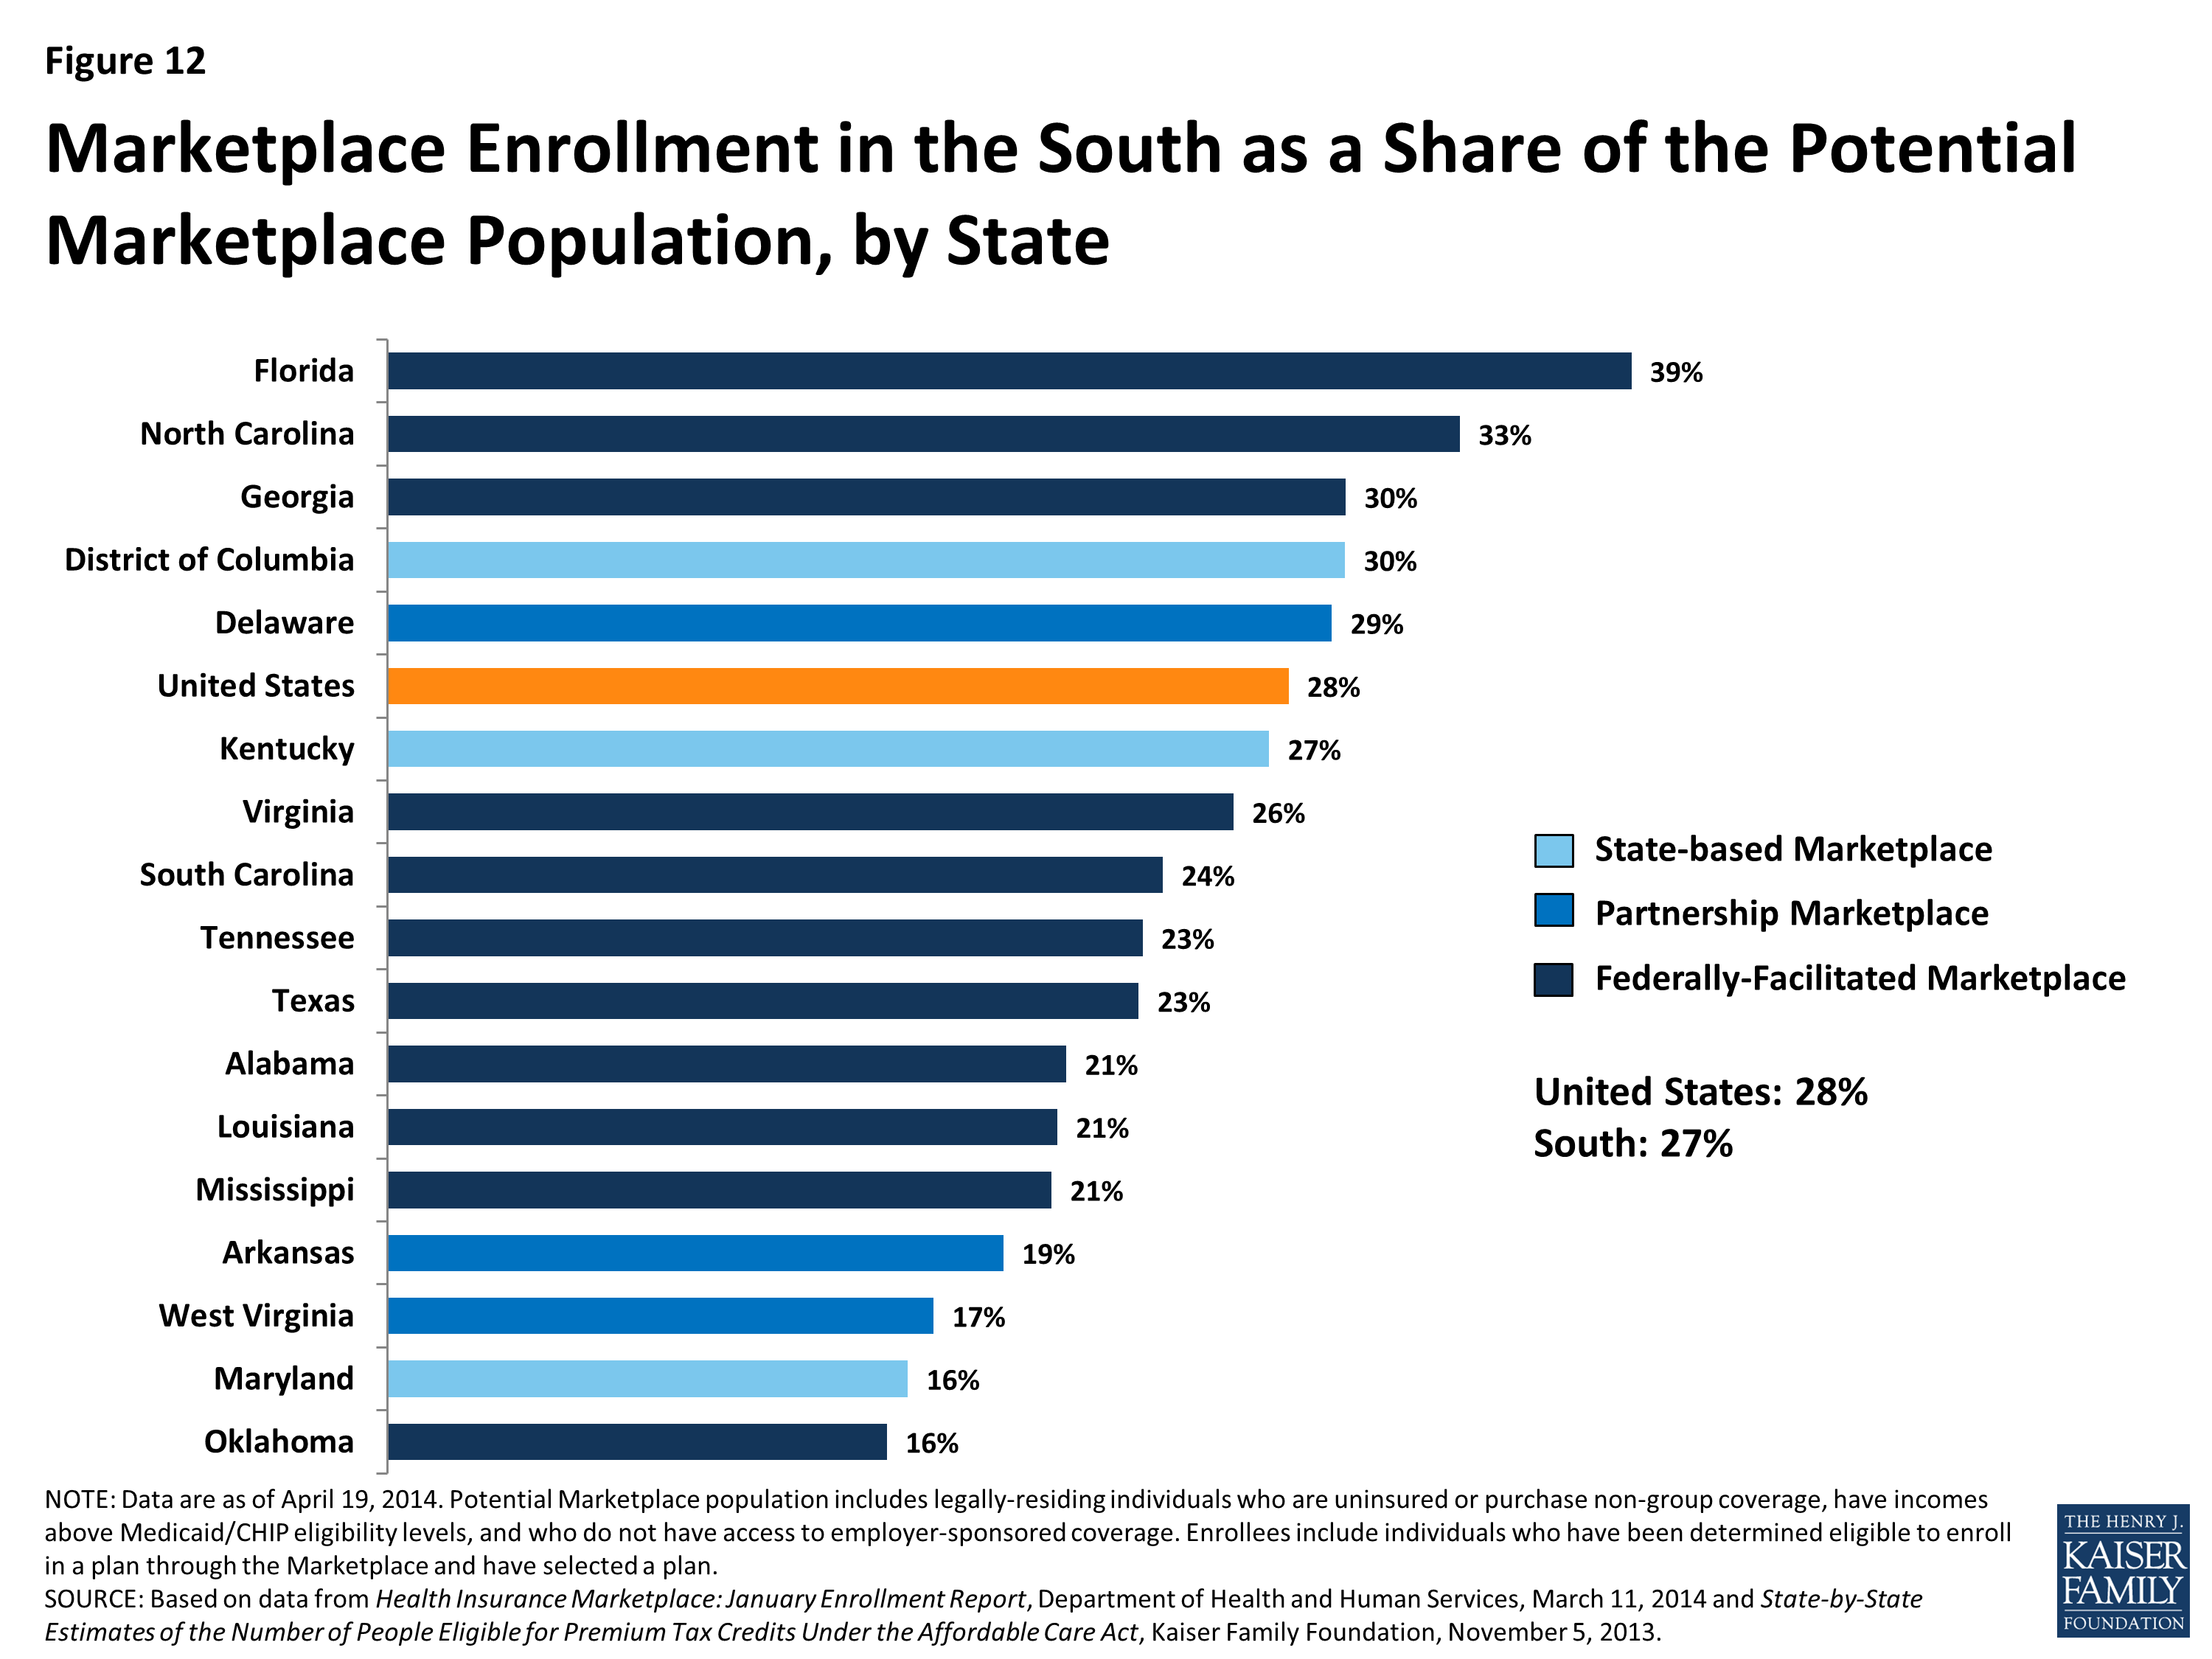
Figure 12: Marketplace Enrollment in the South as a Share of the Potential Marketplace Population, by State
The ACA offers the potential to significantly increase coverage in the South, especially for low-income adults, but gaps in coverage will remain, as many southern states are not implementing the Medicaid expansion. As enacted, the Medicaid expansion was to apply to all states, setting a national income floor of 138% FPL for all adults, but the Supreme Court ruling on the ACA effectively made the expansion a state option. Just over half of the states (27 states, including DC), including 6 of the 17 Southern states, are implementing the expansion in 2014 (Figure 13).2 There is no deadline by which states must implement the Medicaid expansion, so additional states may choose to expand in the future.
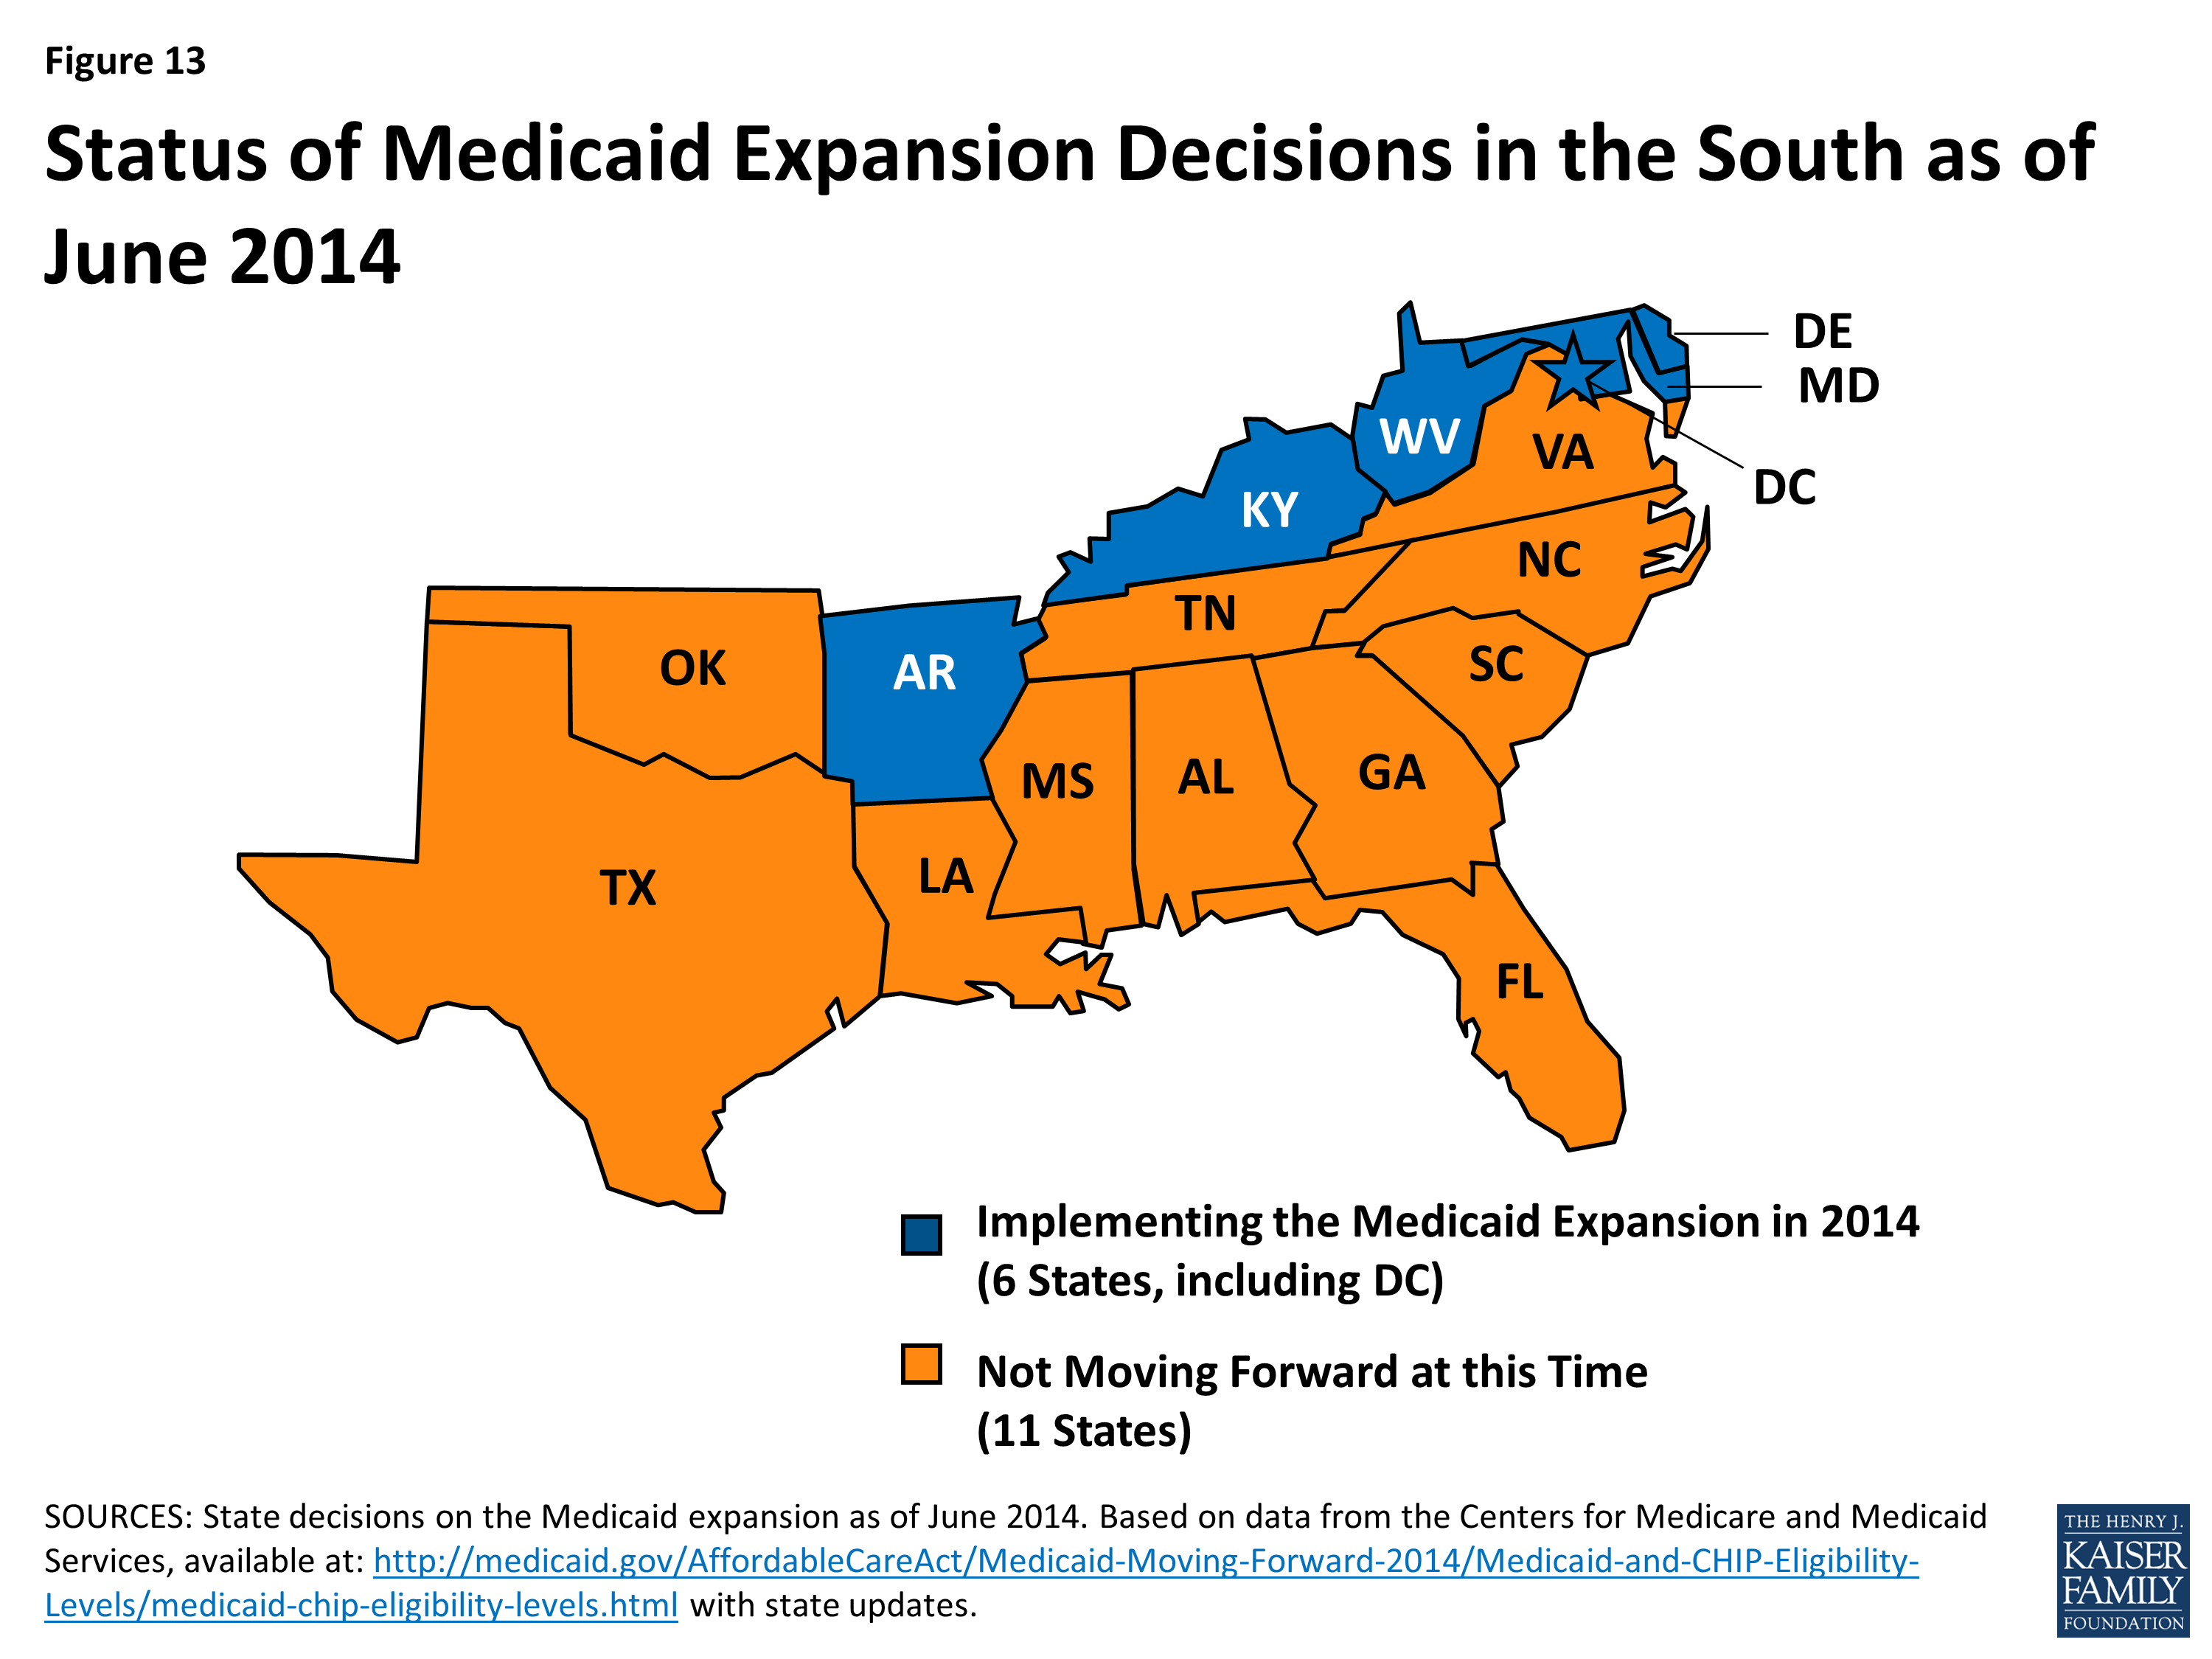
Figure 13: Status of Medicaid Expansion Decisions in the South as of June 2014
Overall, southern states experienced a 7% increase in Medicaid enrollment in April 2014, compared to the monthly average in the states during the three months prior to open enrollment. This was similar to enrollment growth in the Northeast (7%) and Midwest (8%), but much lower than the Medicaid enrollment growth rate in the West during the same period (19%). The six southern states that are implementing the Medicaid expansion experienced much higher enrollment growth compared to states that are not expanding (26% vs. 4%). However, some southern non-expansion states experienced notable growth, including South Carolina, where Medicaid enrollment increased by 14% between Summer 2013 and April 2014.3
State Medicaid expansion decisions have significant fiscal implications for state spending on uncompensated care costs and indigent care programs, state economies, and for providers.4 If all states expanded Medicaid, southern states could experience the largest percentage increase in federal funds with the Medicaid expansion, compared to states in other regions (Figure 14).
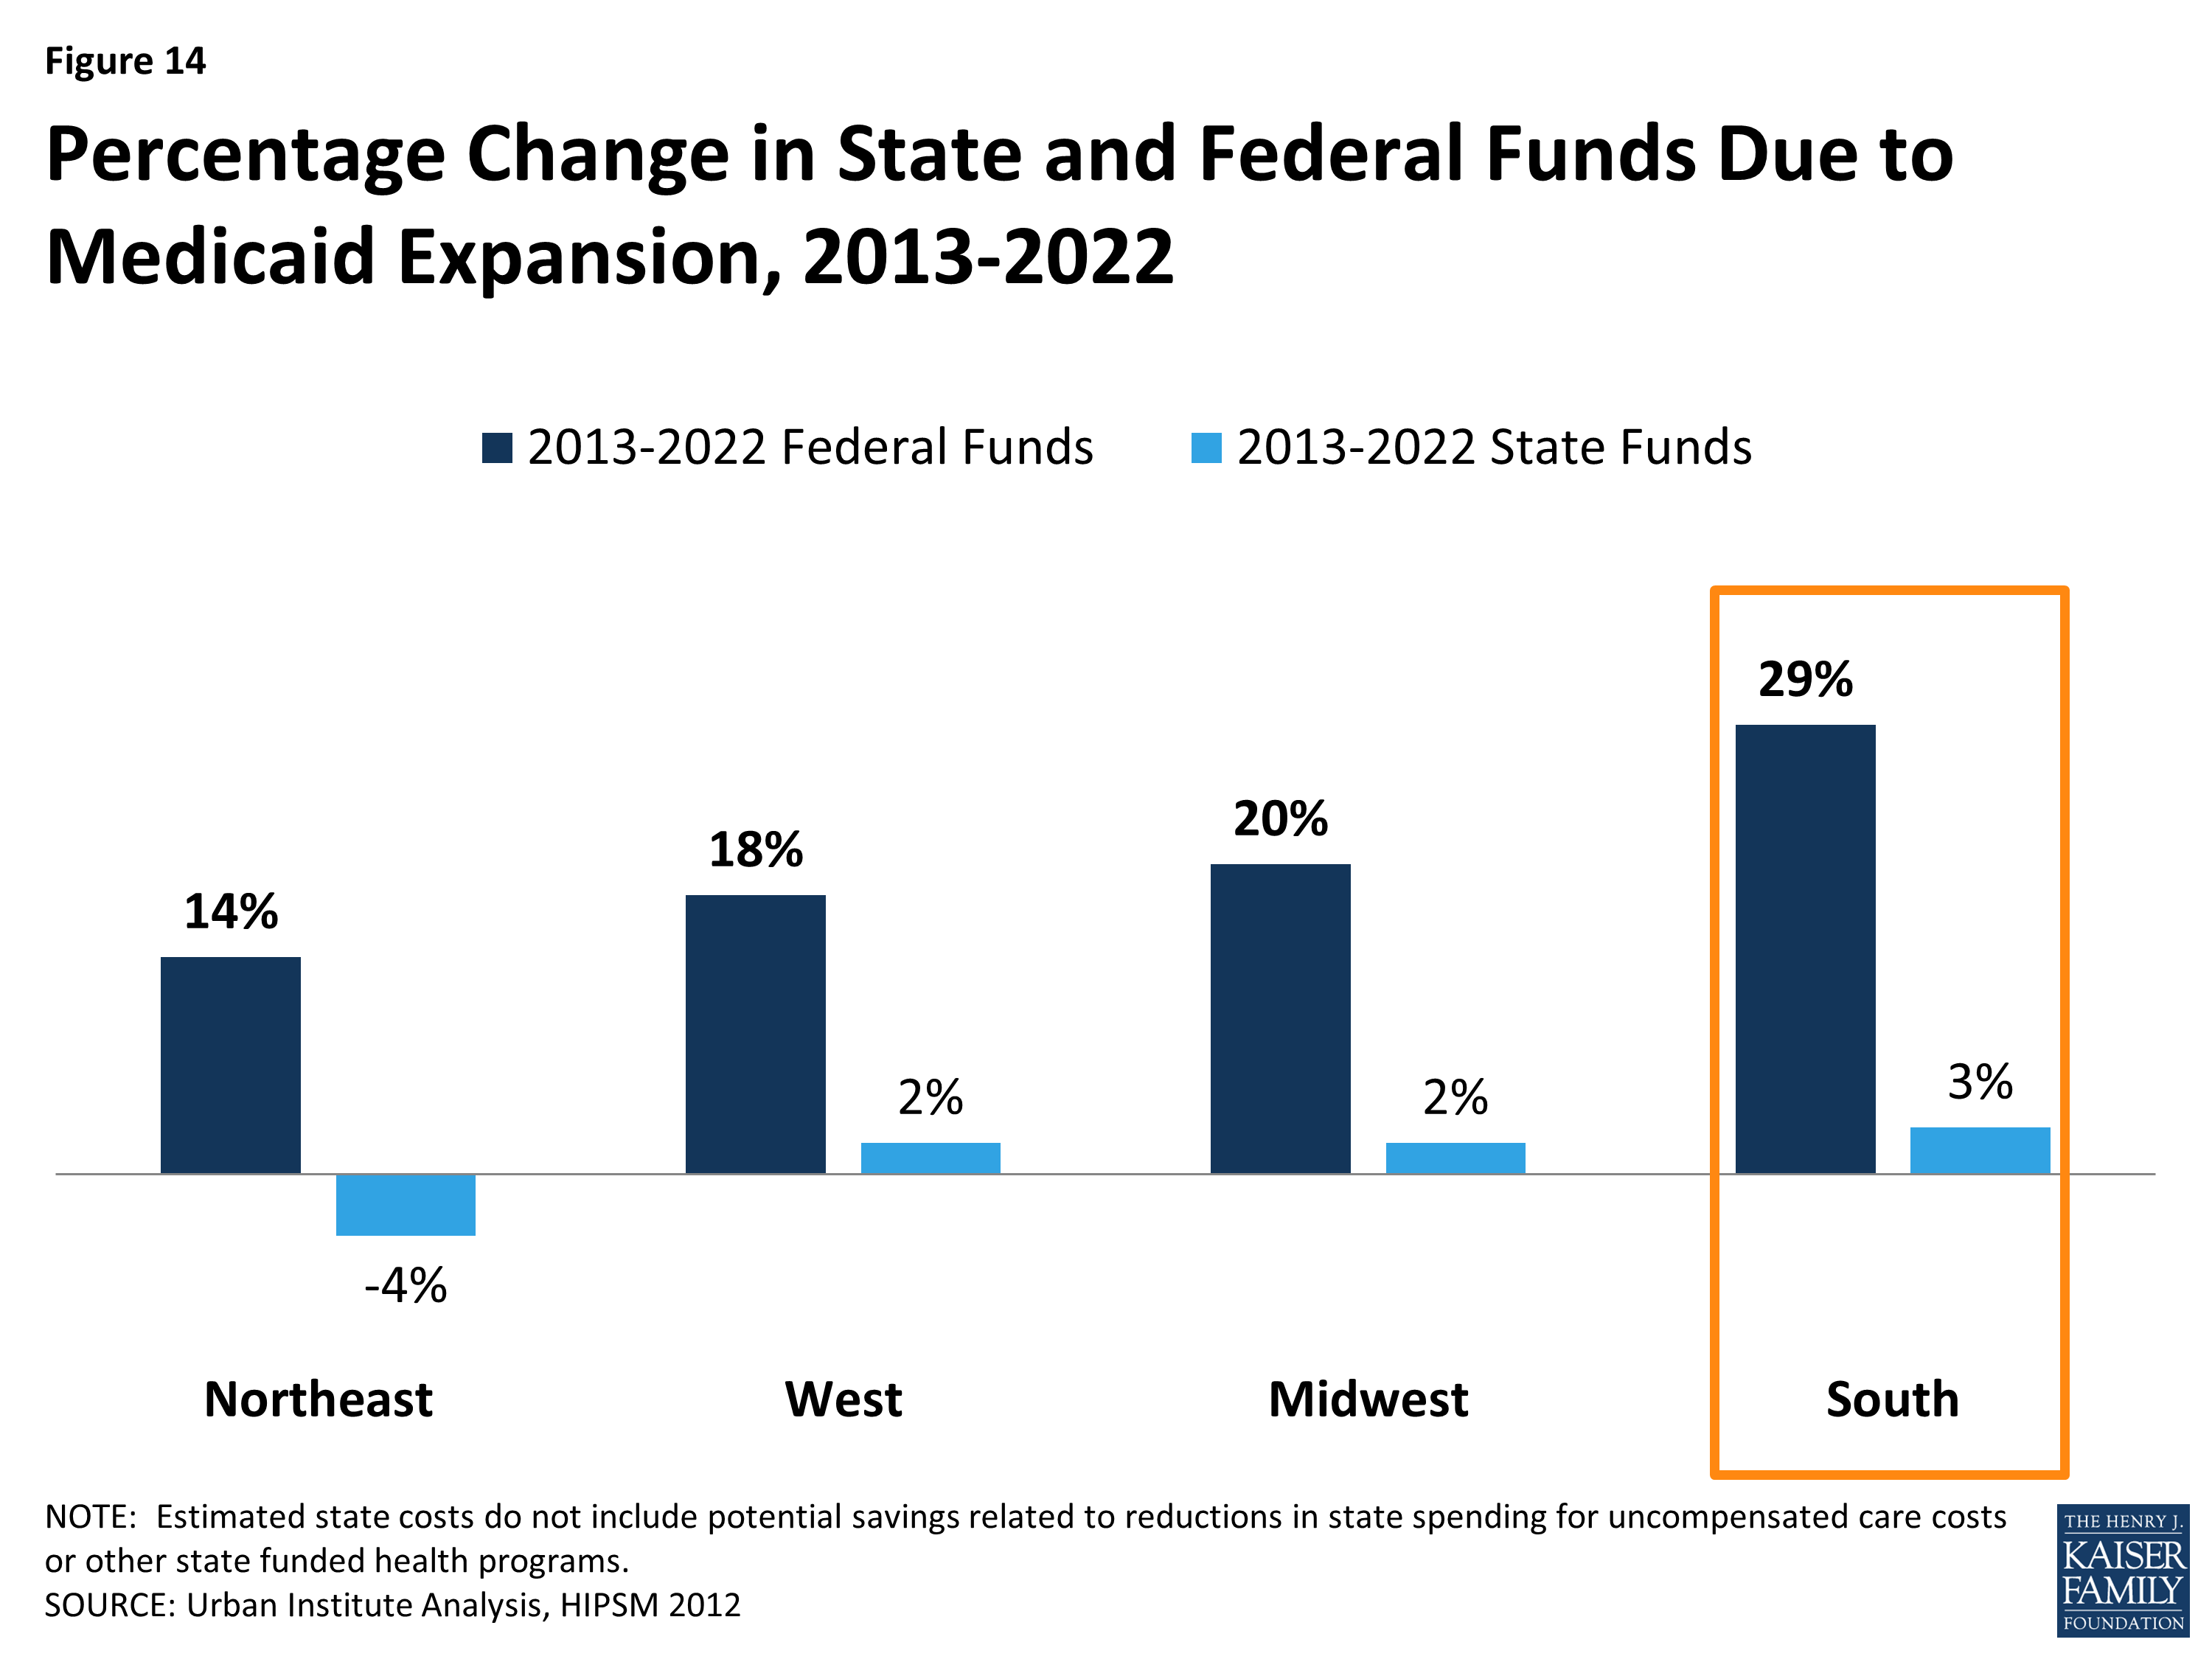
Figure 14: Percentage Change in State and Federal Funds Due to Medicaid Expansion, 2013-2022
If all states expanded Medicaid, southern states could also experience a 25 percent increase in Medicaid payments to hospitals relative to no expansion – the highest percentage increase of any region (Figure 15).
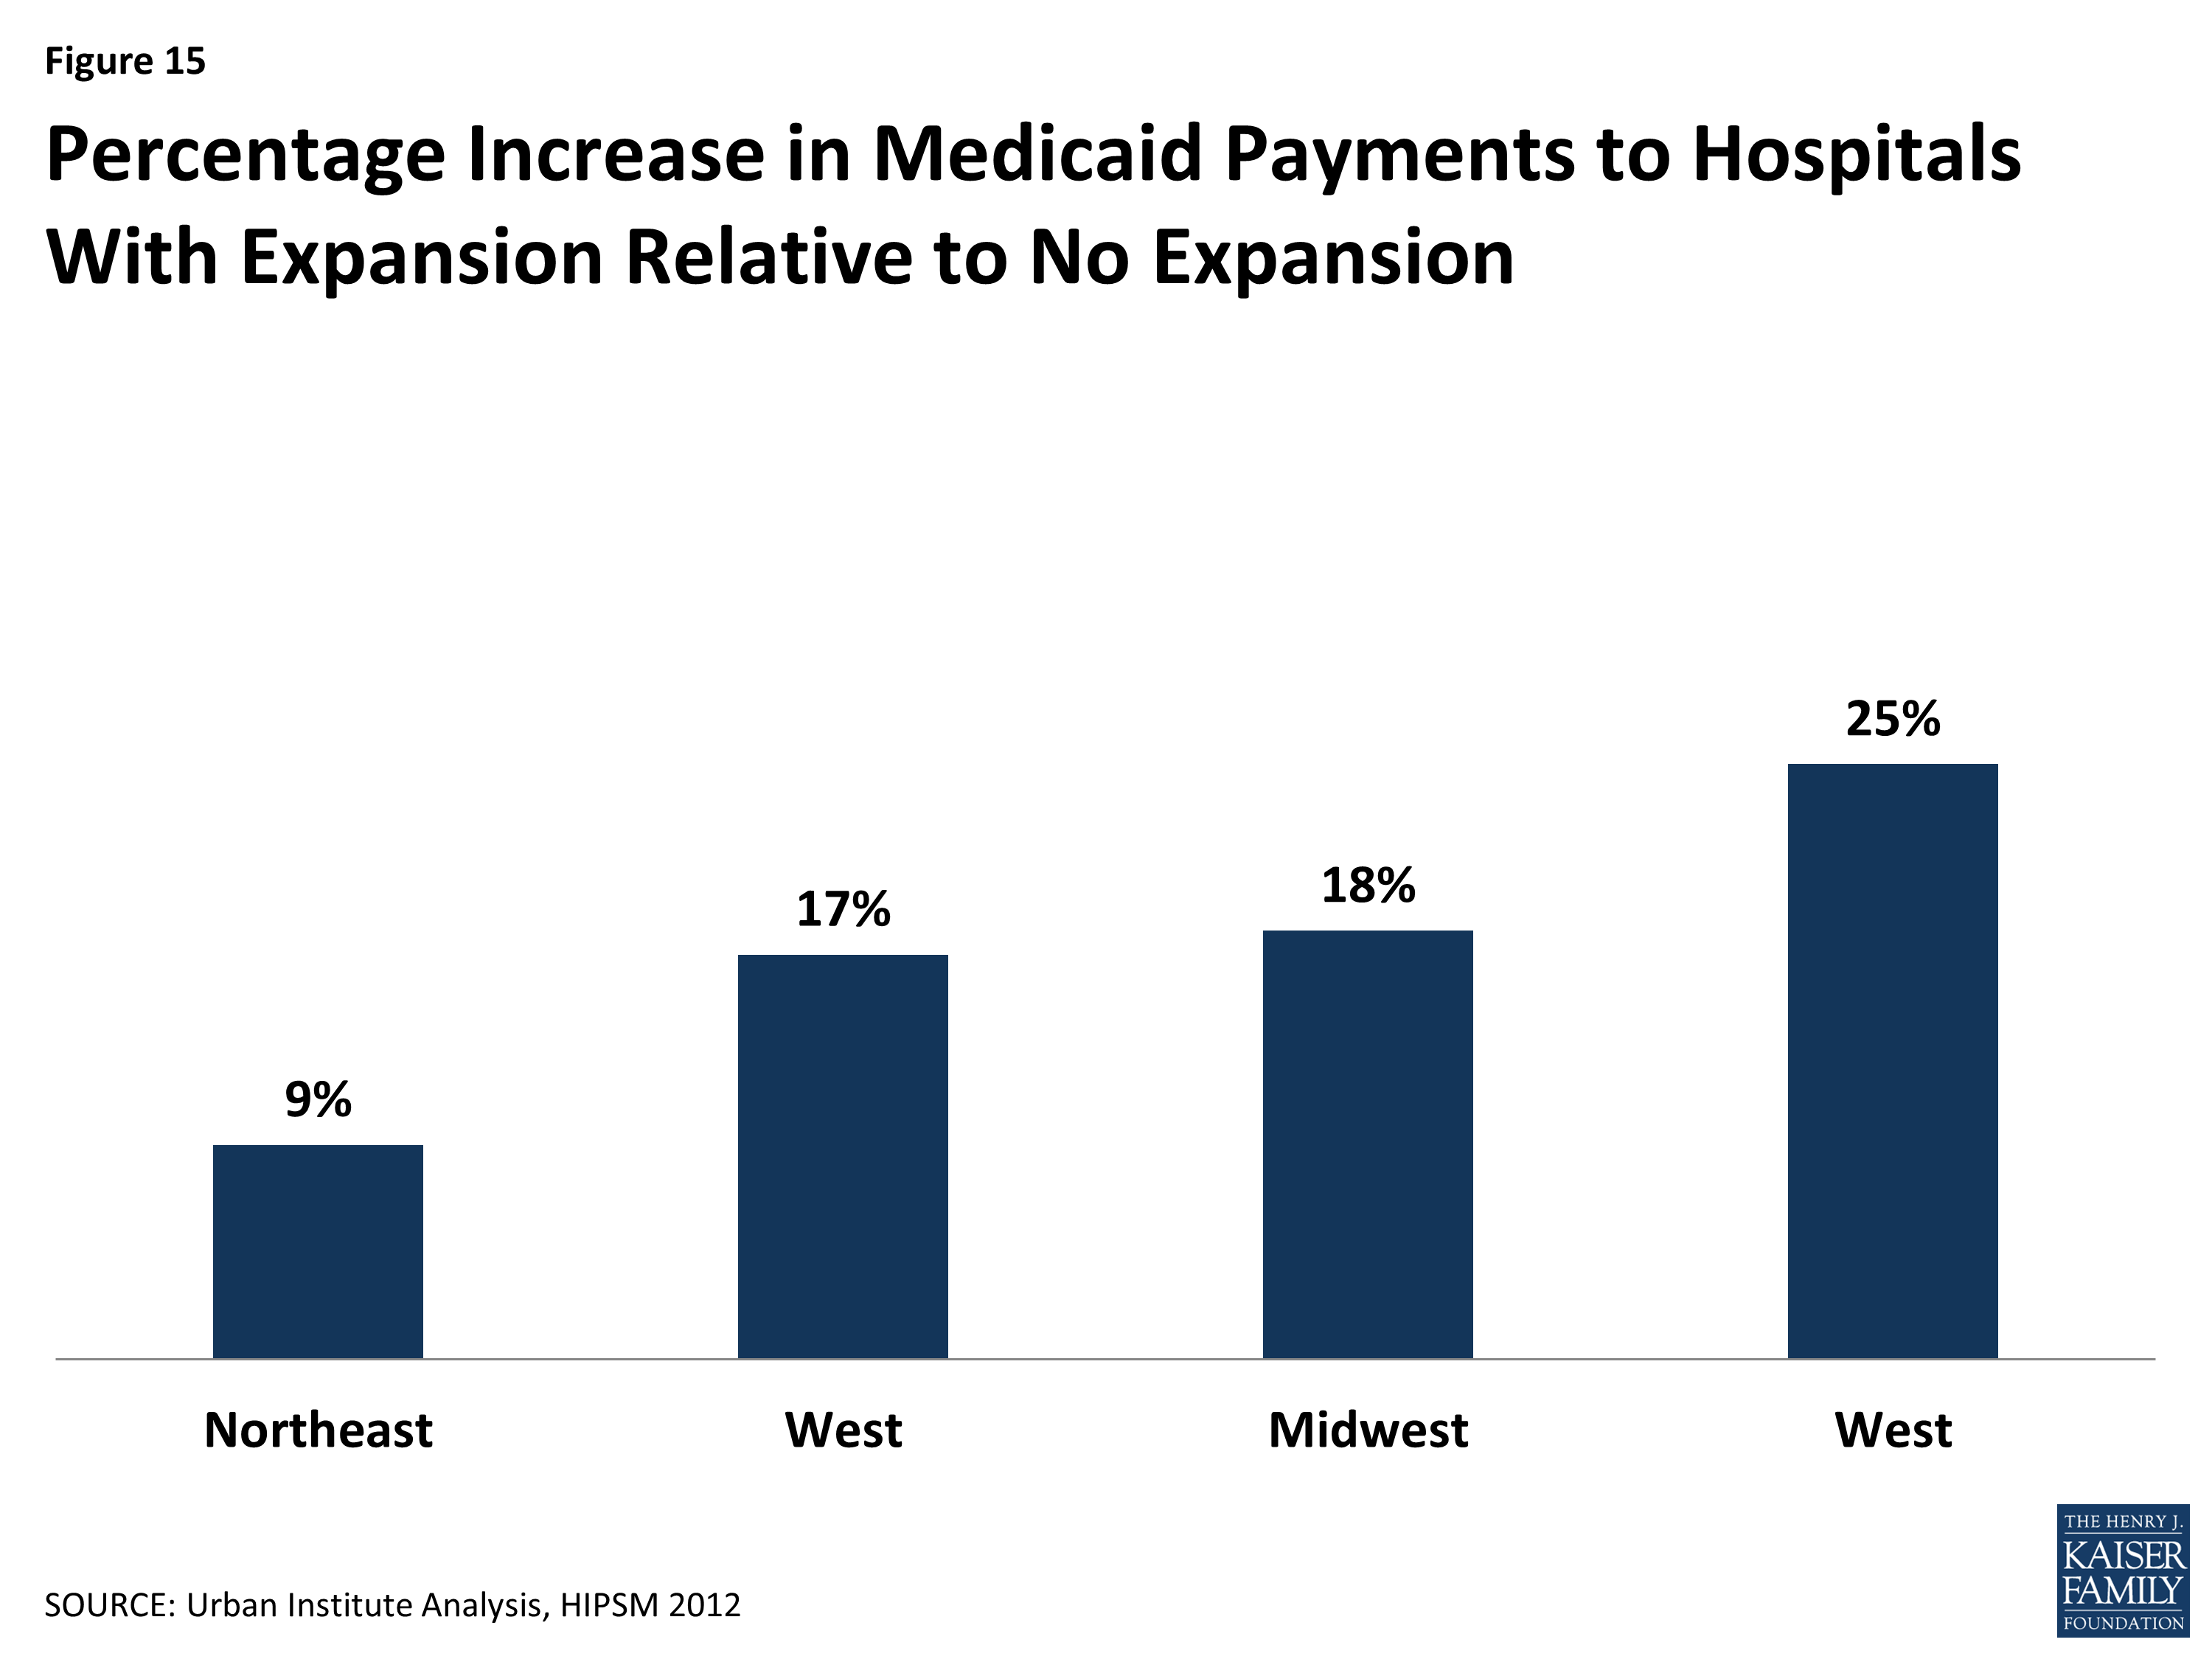
Figure 15: Percentage Increase in Medicaid Payments to Hospitals With Expansion Relative to No Expansion
Without the Medicaid expansion, Medicaid eligibility for adults remains very limited in the South. The ACA Medicaid expansion was designed to fill longstanding gaps in Medicaid eligibility for parents and other non-disabled adults. In the absence of the expansion, adults without dependent children in 11 of the 17 southern states remain ineligible for Medicaid regardless of how low their incomes are. Moreover, eligibility limits for parents remain below 50% FPL ($9,895 per year for a family of three) in eight southern states (see Appendix Table 5). Overall, the median Medicaid eligibility limits for parents (52% FPL) and childless adults (0% FPL) in the South are far lower than the median limits for other regions (Figure 16). In addition, even though Medicaid and CHIP eligibility limits for children and pregnant women in the South remain higher than those for adults, they are still low compared to other regions.
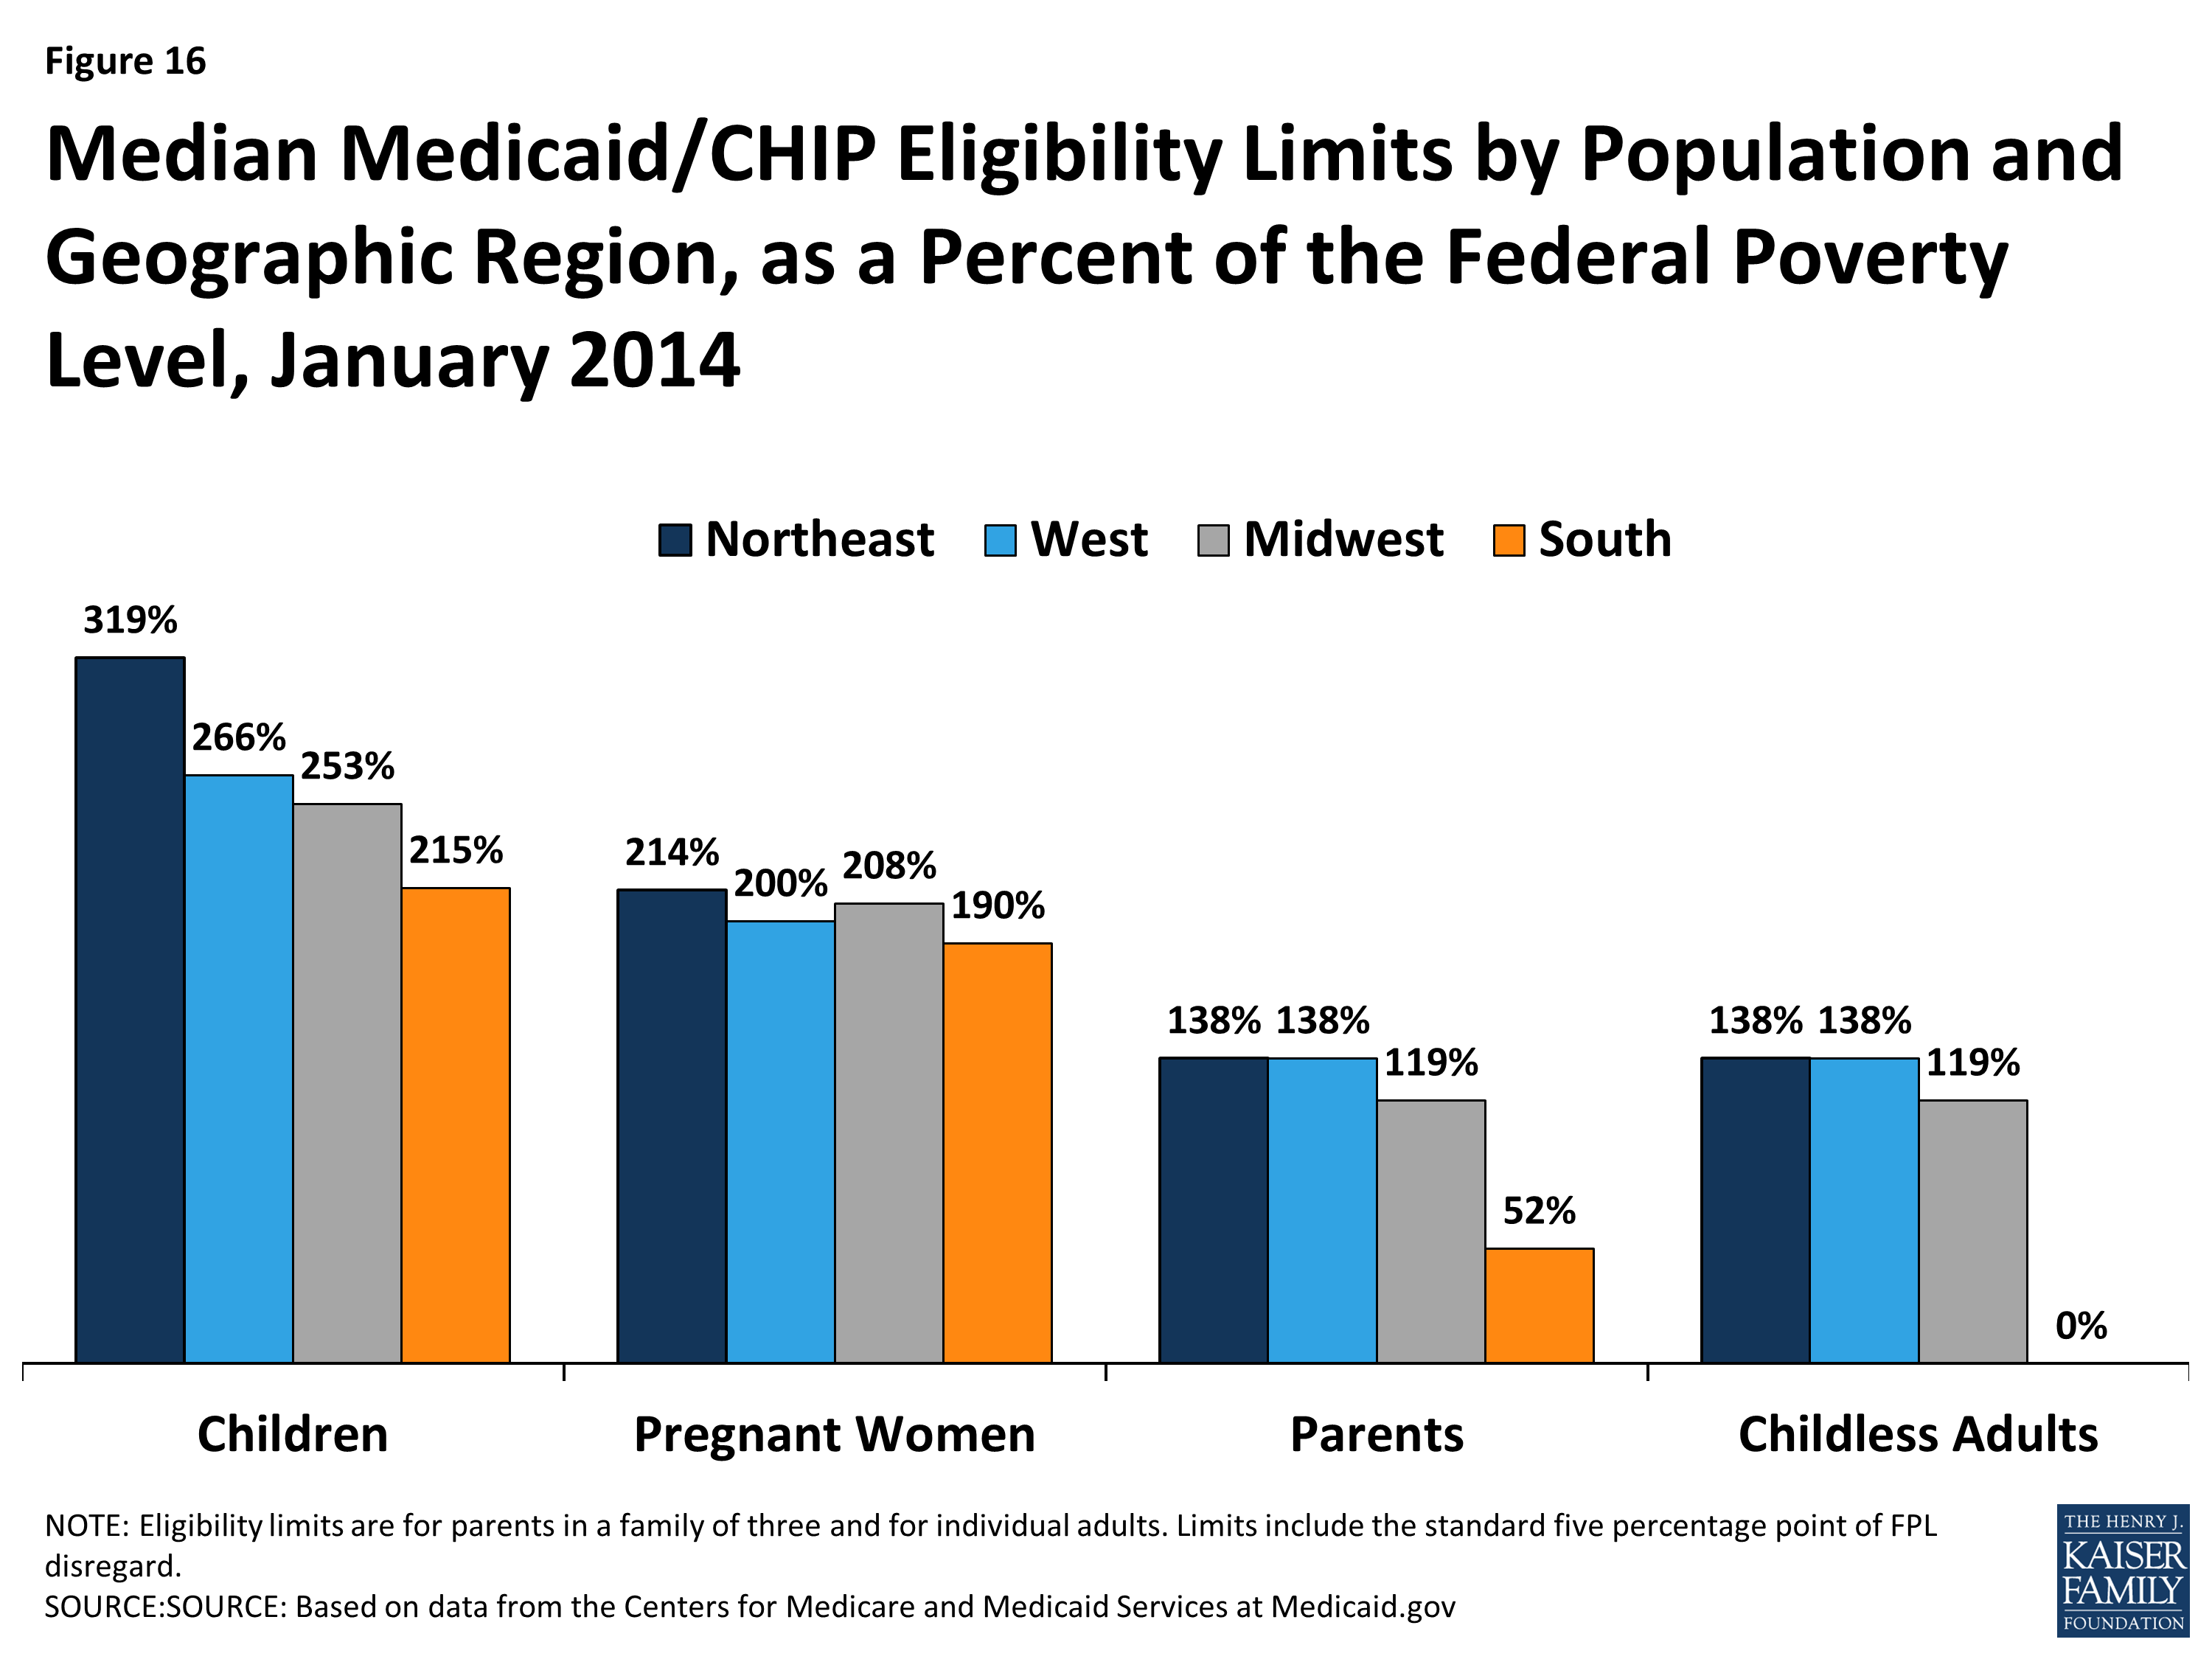
Figure 16: Median Medicaid/CHIP Eligibility Limits by Population and Geographic Region, as a Percent of the Federal Poverty Level, January 2014
Nearly 4 million poor uninsured Southerners fall into a coverage gap because they remain ineligible for Medicaid but do not earn enough to qualify for the premium tax credits for Marketplace coverage. Because the ACA envisioned that low-income people would receive coverage through Medicaid, the tax credit subsidies to help people purchase private coverage through the Marketplace are only available to people with incomes at or above the poverty level ($11,670 for and individual and $19,790 for a family of three in 2014). Consequently, in states that do not expand Medicaid, uninsured adults with incomes above Medicaid eligibility limits but below poverty fall into a “coverage gap.” These individuals earn too much to qualify for Medicaid but not enough to qualify for the premium tax credits. Over half (51%) of uninsured adults in the South who would be eligible for Medicaid if their states implemented the expansion fall into this coverage gap (Table 3). These 3.8 million poor uninsured adults in the South, nearly half of whom (46%) reside in Texas, Florida, and Georgia, make up nearly eight in ten of the 4.8 million poor uninsured adults who fall into the coverage gap nationwide (Figure 17).
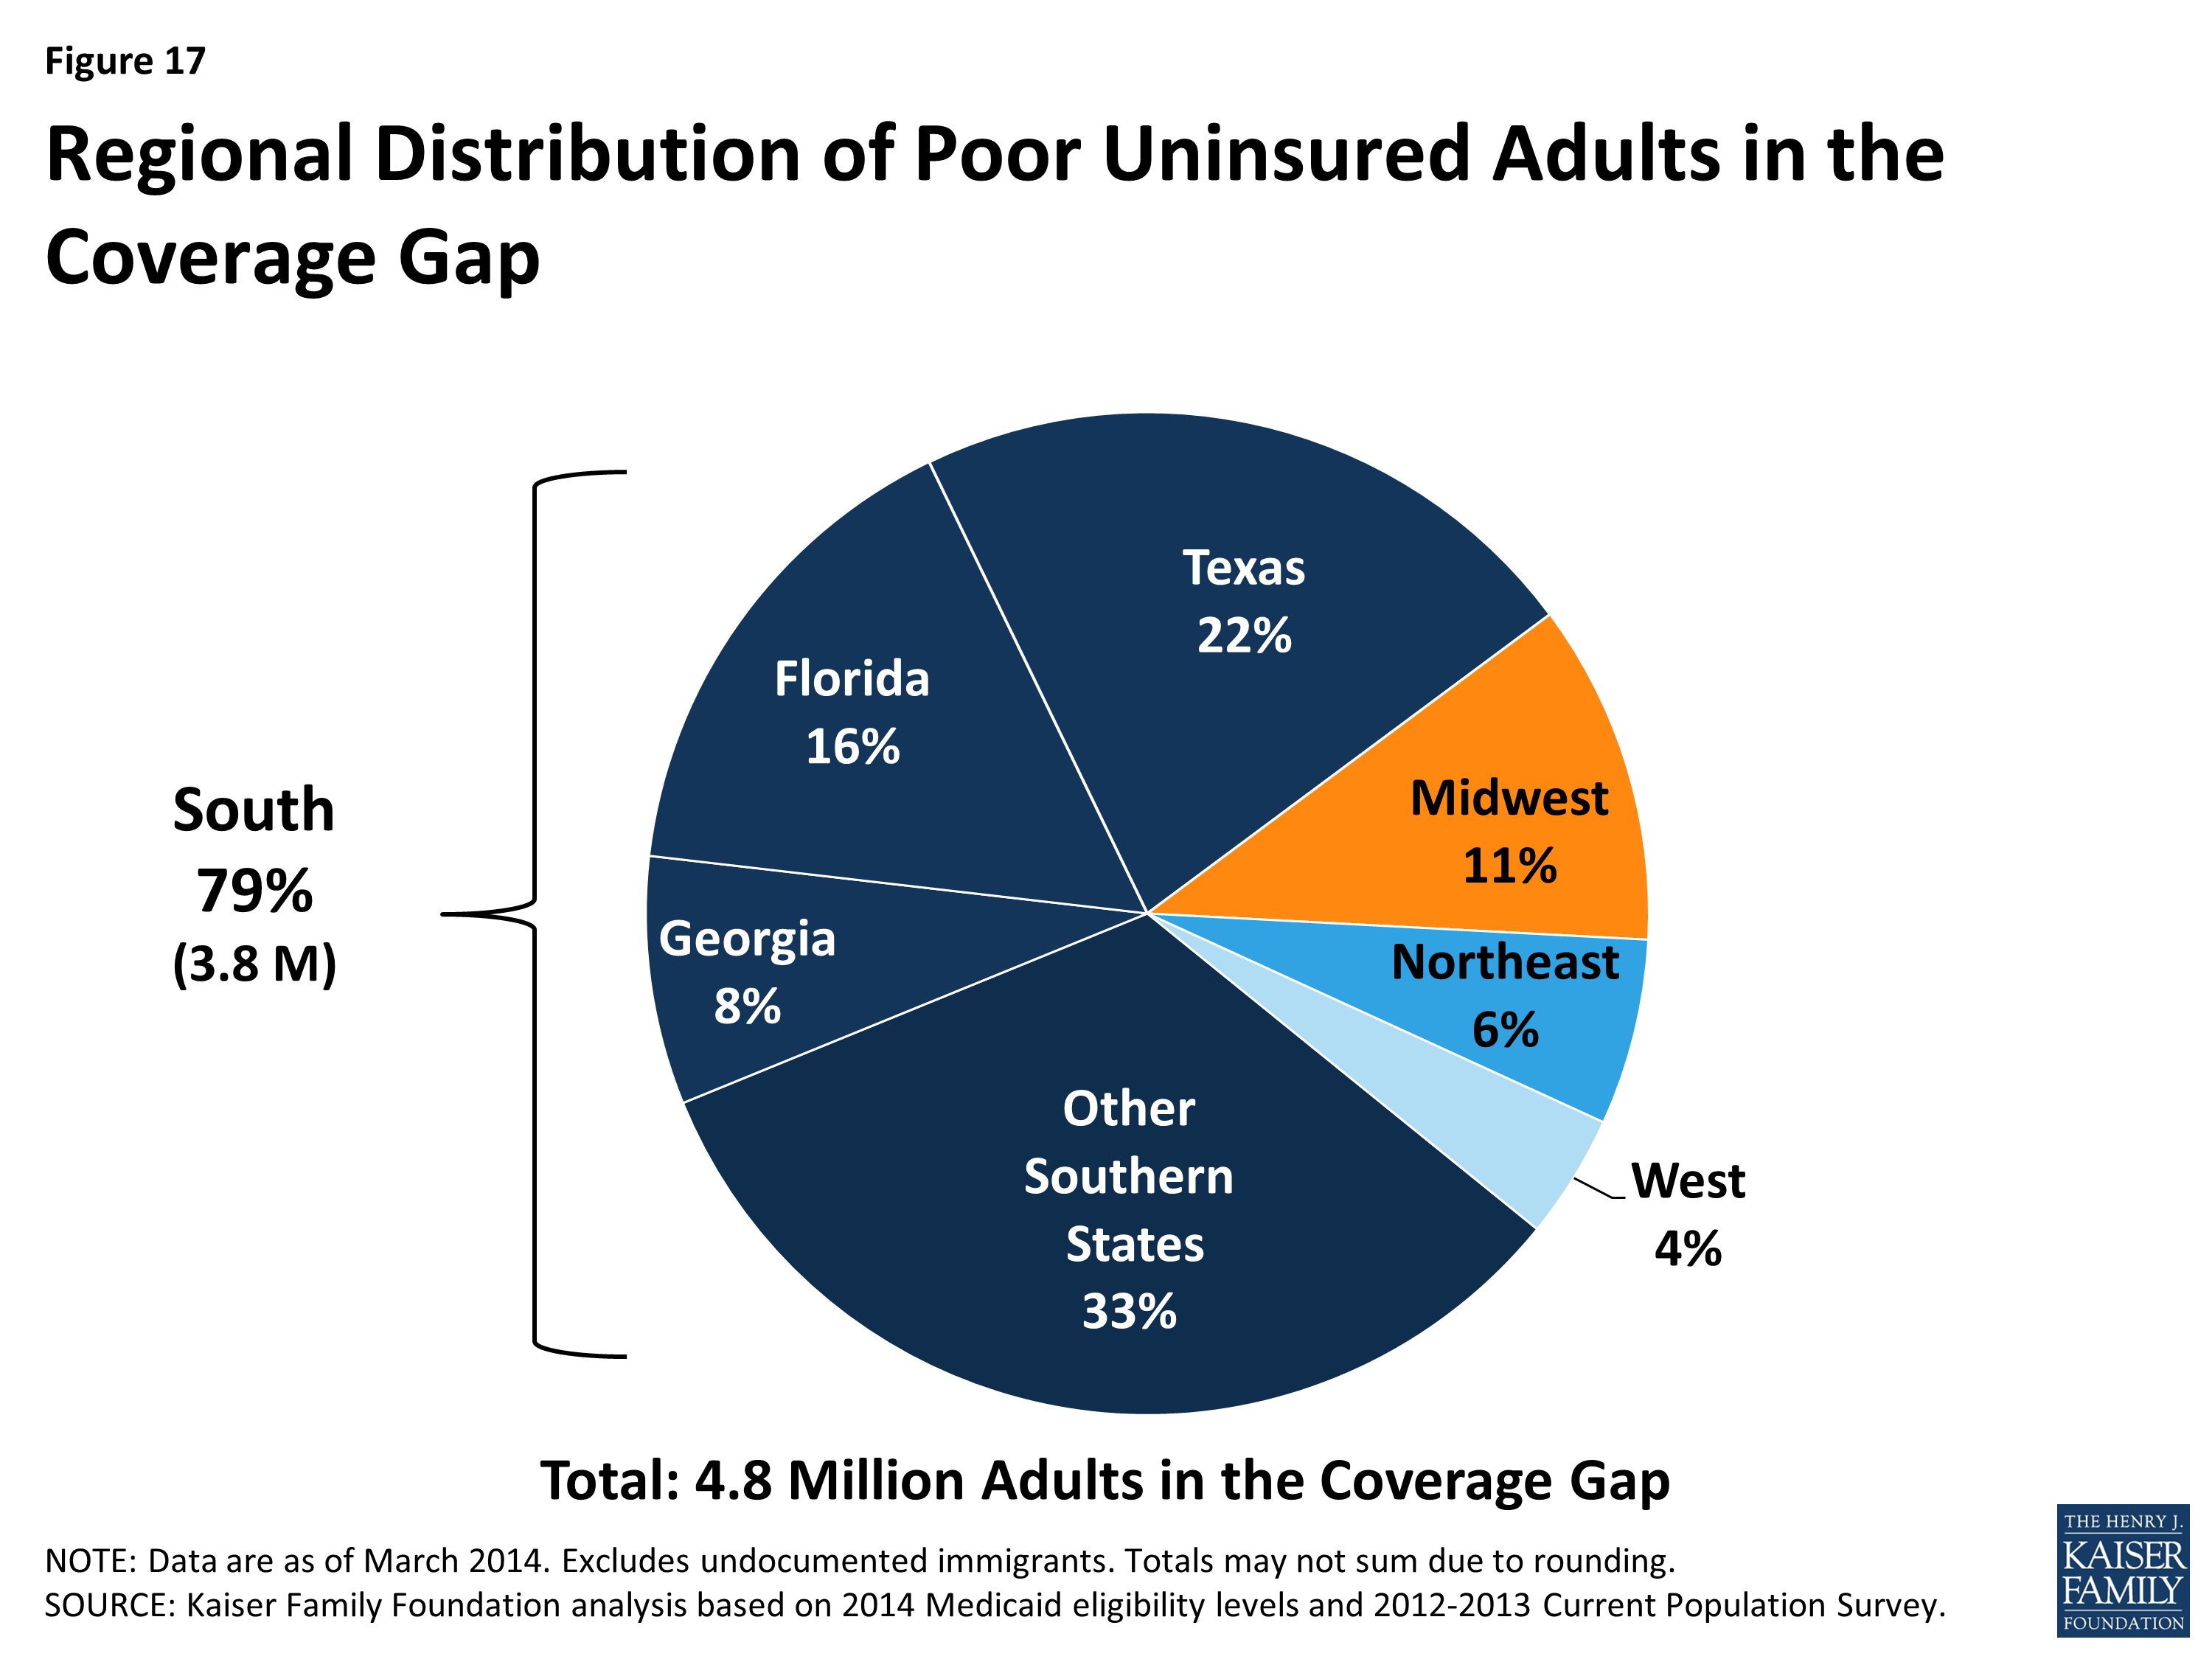
Figure 17: Regional Distribution of Poor Uninsured Adults in the Coverage Gap
| Table 3: Number of Uninsured Nonelderly Adults in the ACA Coverage Gap, by State | |||
| State | Number in Coverage Gap | As a Share of All Uninsured Nonelderly Adults in State | As a Share of Uninsured Nonelderly Adults Who Would Be Eligible for the Medicaid Expansion (<138% FPL) |
| National Total | 4,831,580 | 27% | 30% |
| Total in South | 3,800,940 | 25% | 51% |
| Alabama | 191,320 | 36% | 64% |
| Florida | 763,890 | 27% | 58% |
| Georgia | 409,350 | 31% | 61% |
| Louisiana | 242,150 | 34% | 60% |
| Mississippi | 137,800 | 37% | 62% |
| North Carolina | 318,710 | 28% | 61% |
| Oklahoma | 144,480 | 28% | 58% |
| South Carolina | 194,330 | 33% | 66% |
| Tennessee | 161,650 | 24% | 60% |
| Texas | 1,046,430 | 27% | 56% |
| Virginia | 190,840 | 25% | 48% |
| SOURCE: KFF analysis of March 2012 and 2013 CPS and Medicaid MAGI eligibility levels. For more information, see Kaiser Family Foundation. “The Coverage Gap: Uninsured Poor Adults in States that Do Not Expand Medicaid.” October 2013 https://www.kff.org/health-reform/issue-brief/the-coverage-gap-uninsured-poor-adults-in-states-that-do-not-expand-medicaid/ | |||
People of color are disproportionately affected by the coverage gap. Within the South, the impact of the coverage gap varies across racial and ethnic groups, reflecting the fact that Blacks are more likely than Hispanics to live in the South and to be uninsured. Overall, among uninsured adults in the South who would be eligible for Medicaid under the ACA expansion, 54% of adults of color and 56% of Blacks fall into the coverage gap, compared to less than half (47%) of Whites (Figure 18).

Figure 18: Share of Nonelderly Uninsured Adults Targeted by the Medicaid Expansion (<138% FPL) in the South who are in the Coverage Gap by Race/Ethnicity
However, White adults are the largest racial or ethnic group in the coverage gap in the South. Four in ten poor adults in the South who fall into the coverage gap are White, compared to 31% who are Black, and about one quarter (24%), who are Hispanic (Figure 19). In total, 1.5 million poor, White adults and 2.3 million people of color in the South fall into the coverage gap.
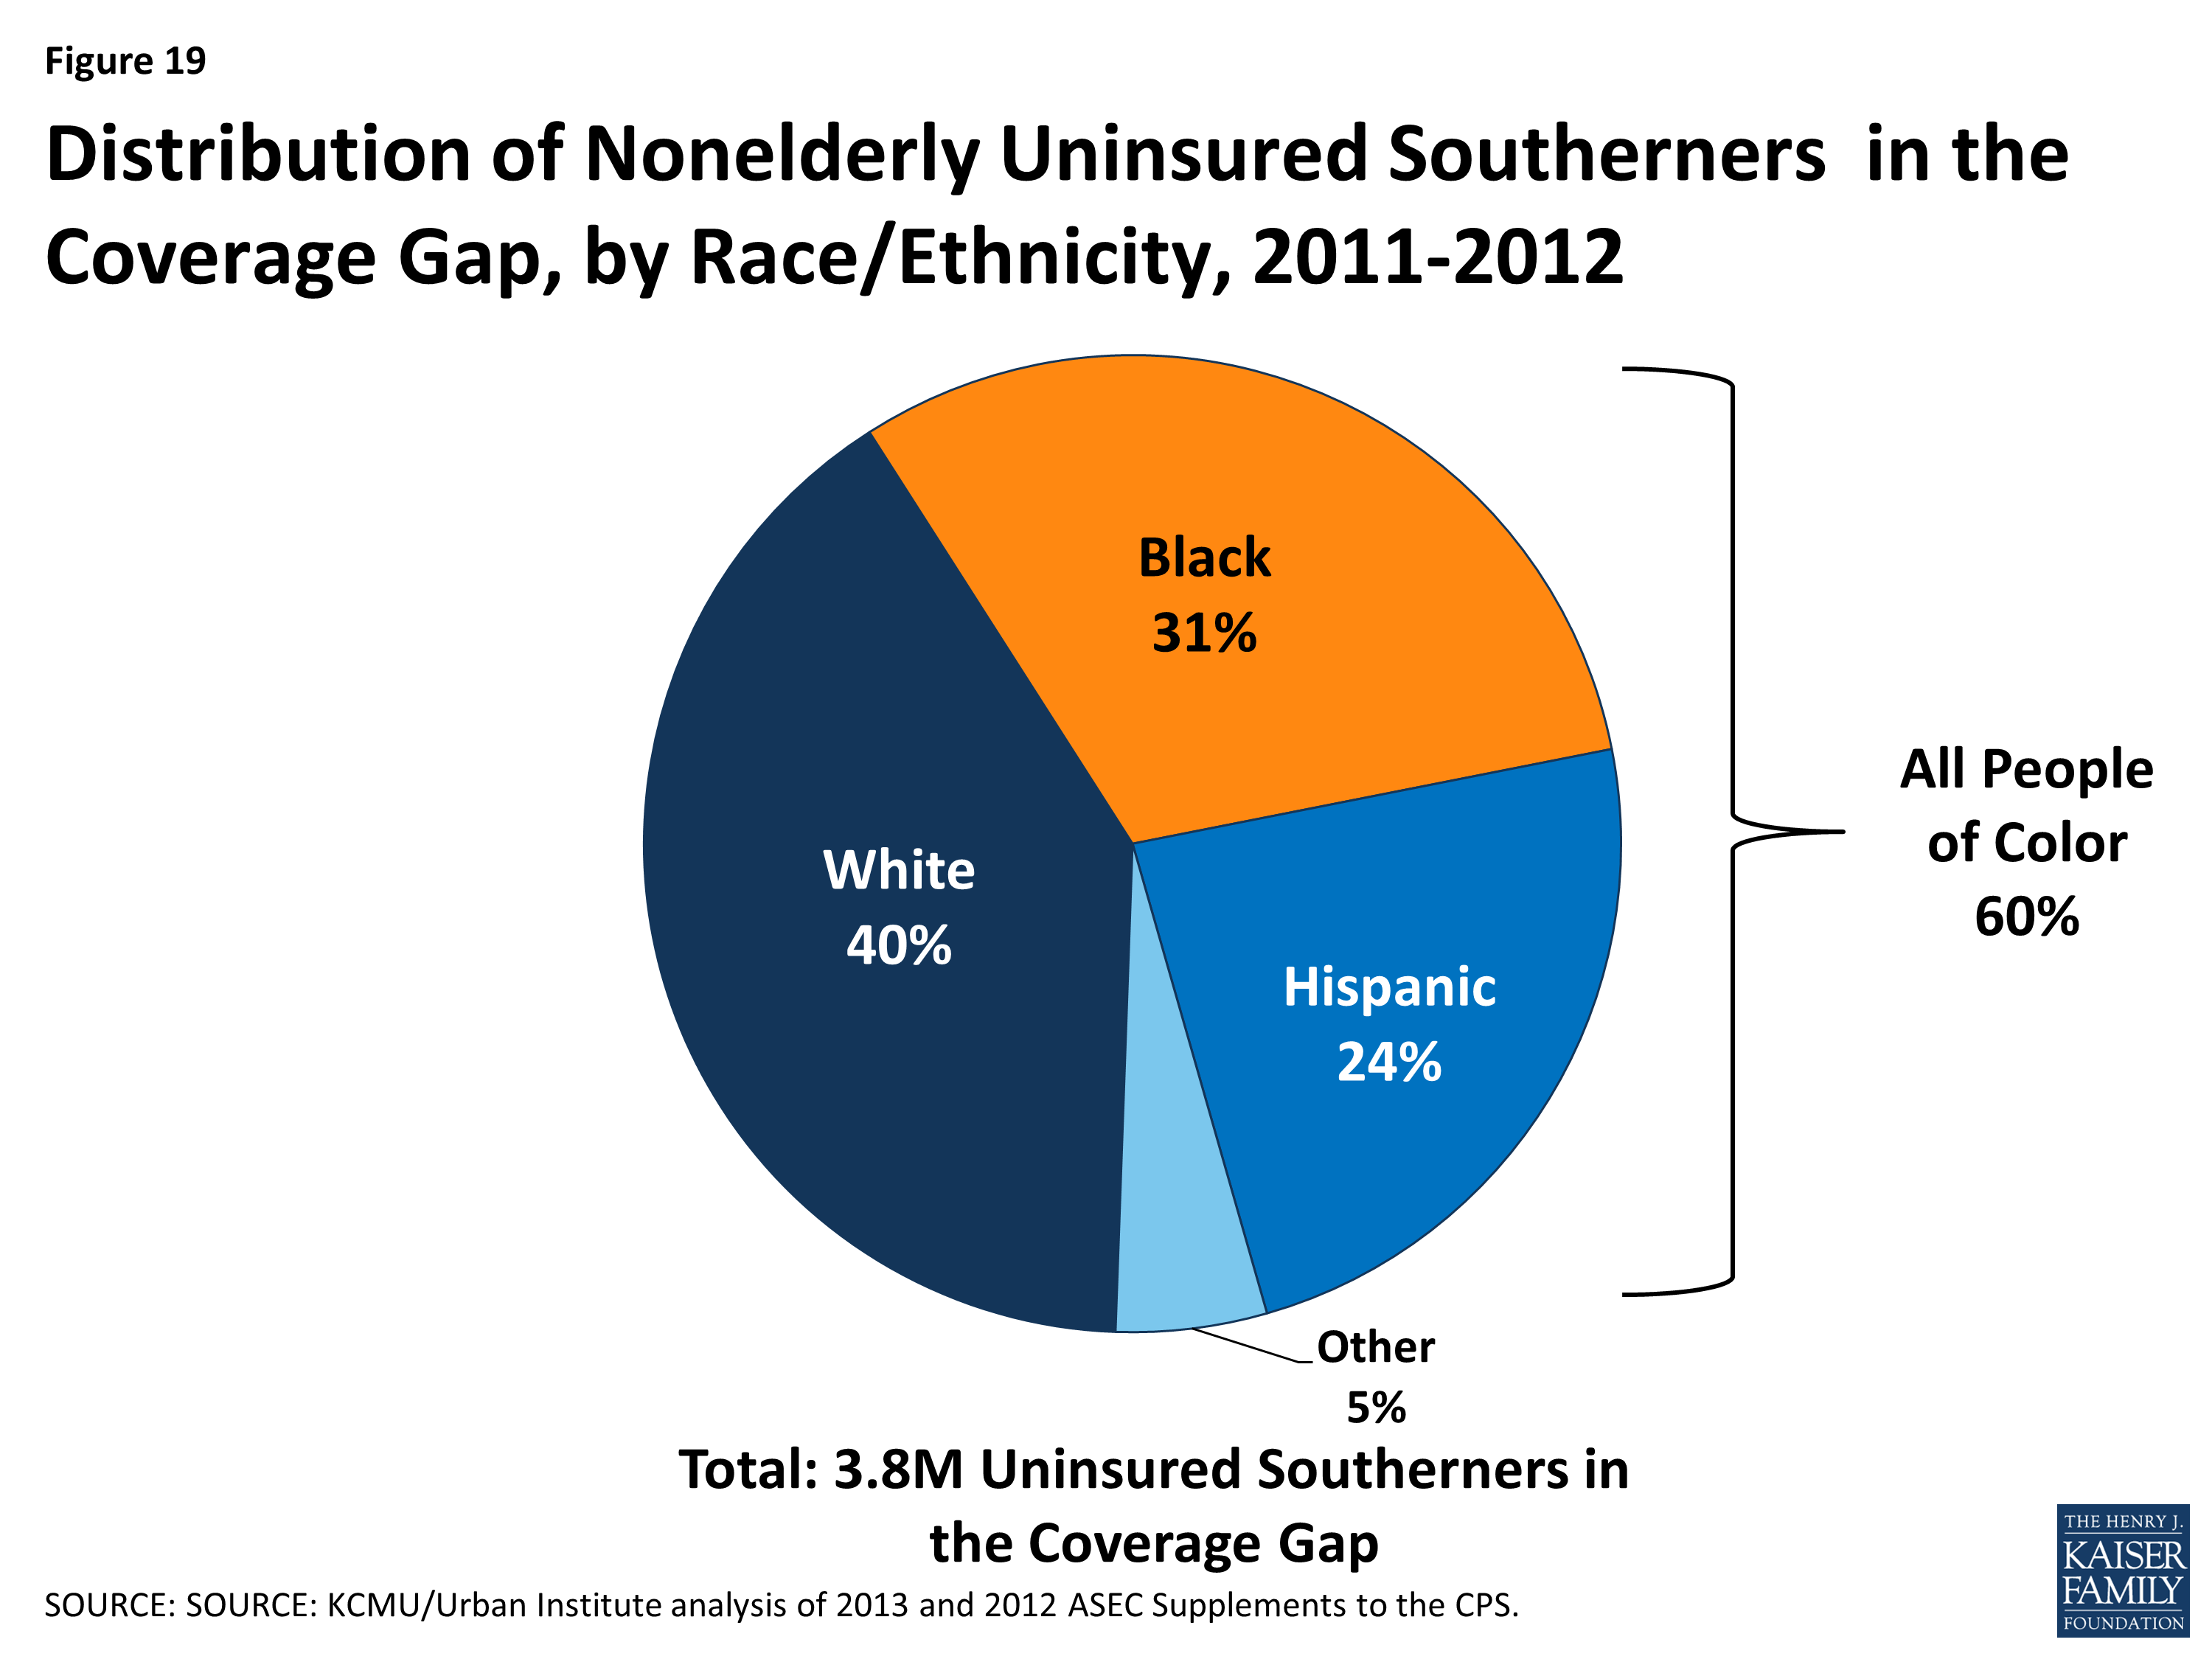
Figure 19: Distribution of Nonelderly Uninsured Southerners in the Coverage Gap, by Race/Ethnicity, 2011-2012
Even with these gaps in coverage, nearly half (48%) of the 21 million uninsured Southerners are eligible for financial assistance for health coverage in 2014 (Figure 20). About 30% of uninsured Southerners are eligible for premium tax credits to purchase Marketplace coverage and 18% are eligible for Medicaid or CHIP, including those newly eligible in the states implementing the Medicaid expansion as well as individuals who were already eligible but not yet enrolled, who are mostly children. Nearly one in five uninsured Southerners (18%) fall into the coverage gap because they reside in a state that is not implementing the Medicaid expansion. The remaining third (34%) of uninsured Southerners are not eligible for assistance for health coverage. About one in five (21%) do not qualify for the premium tax credits because they have incomes above 400% FPL or have access to affordable coverage through their employer. These individuals can still purchase unsubsidized coverage through the Marketplaces. The other 13% are not eligible to enroll in Medicaid and are barred from purchasing coverage through the Marketplaces due to their immigration status; they will likely remain uninsured.5
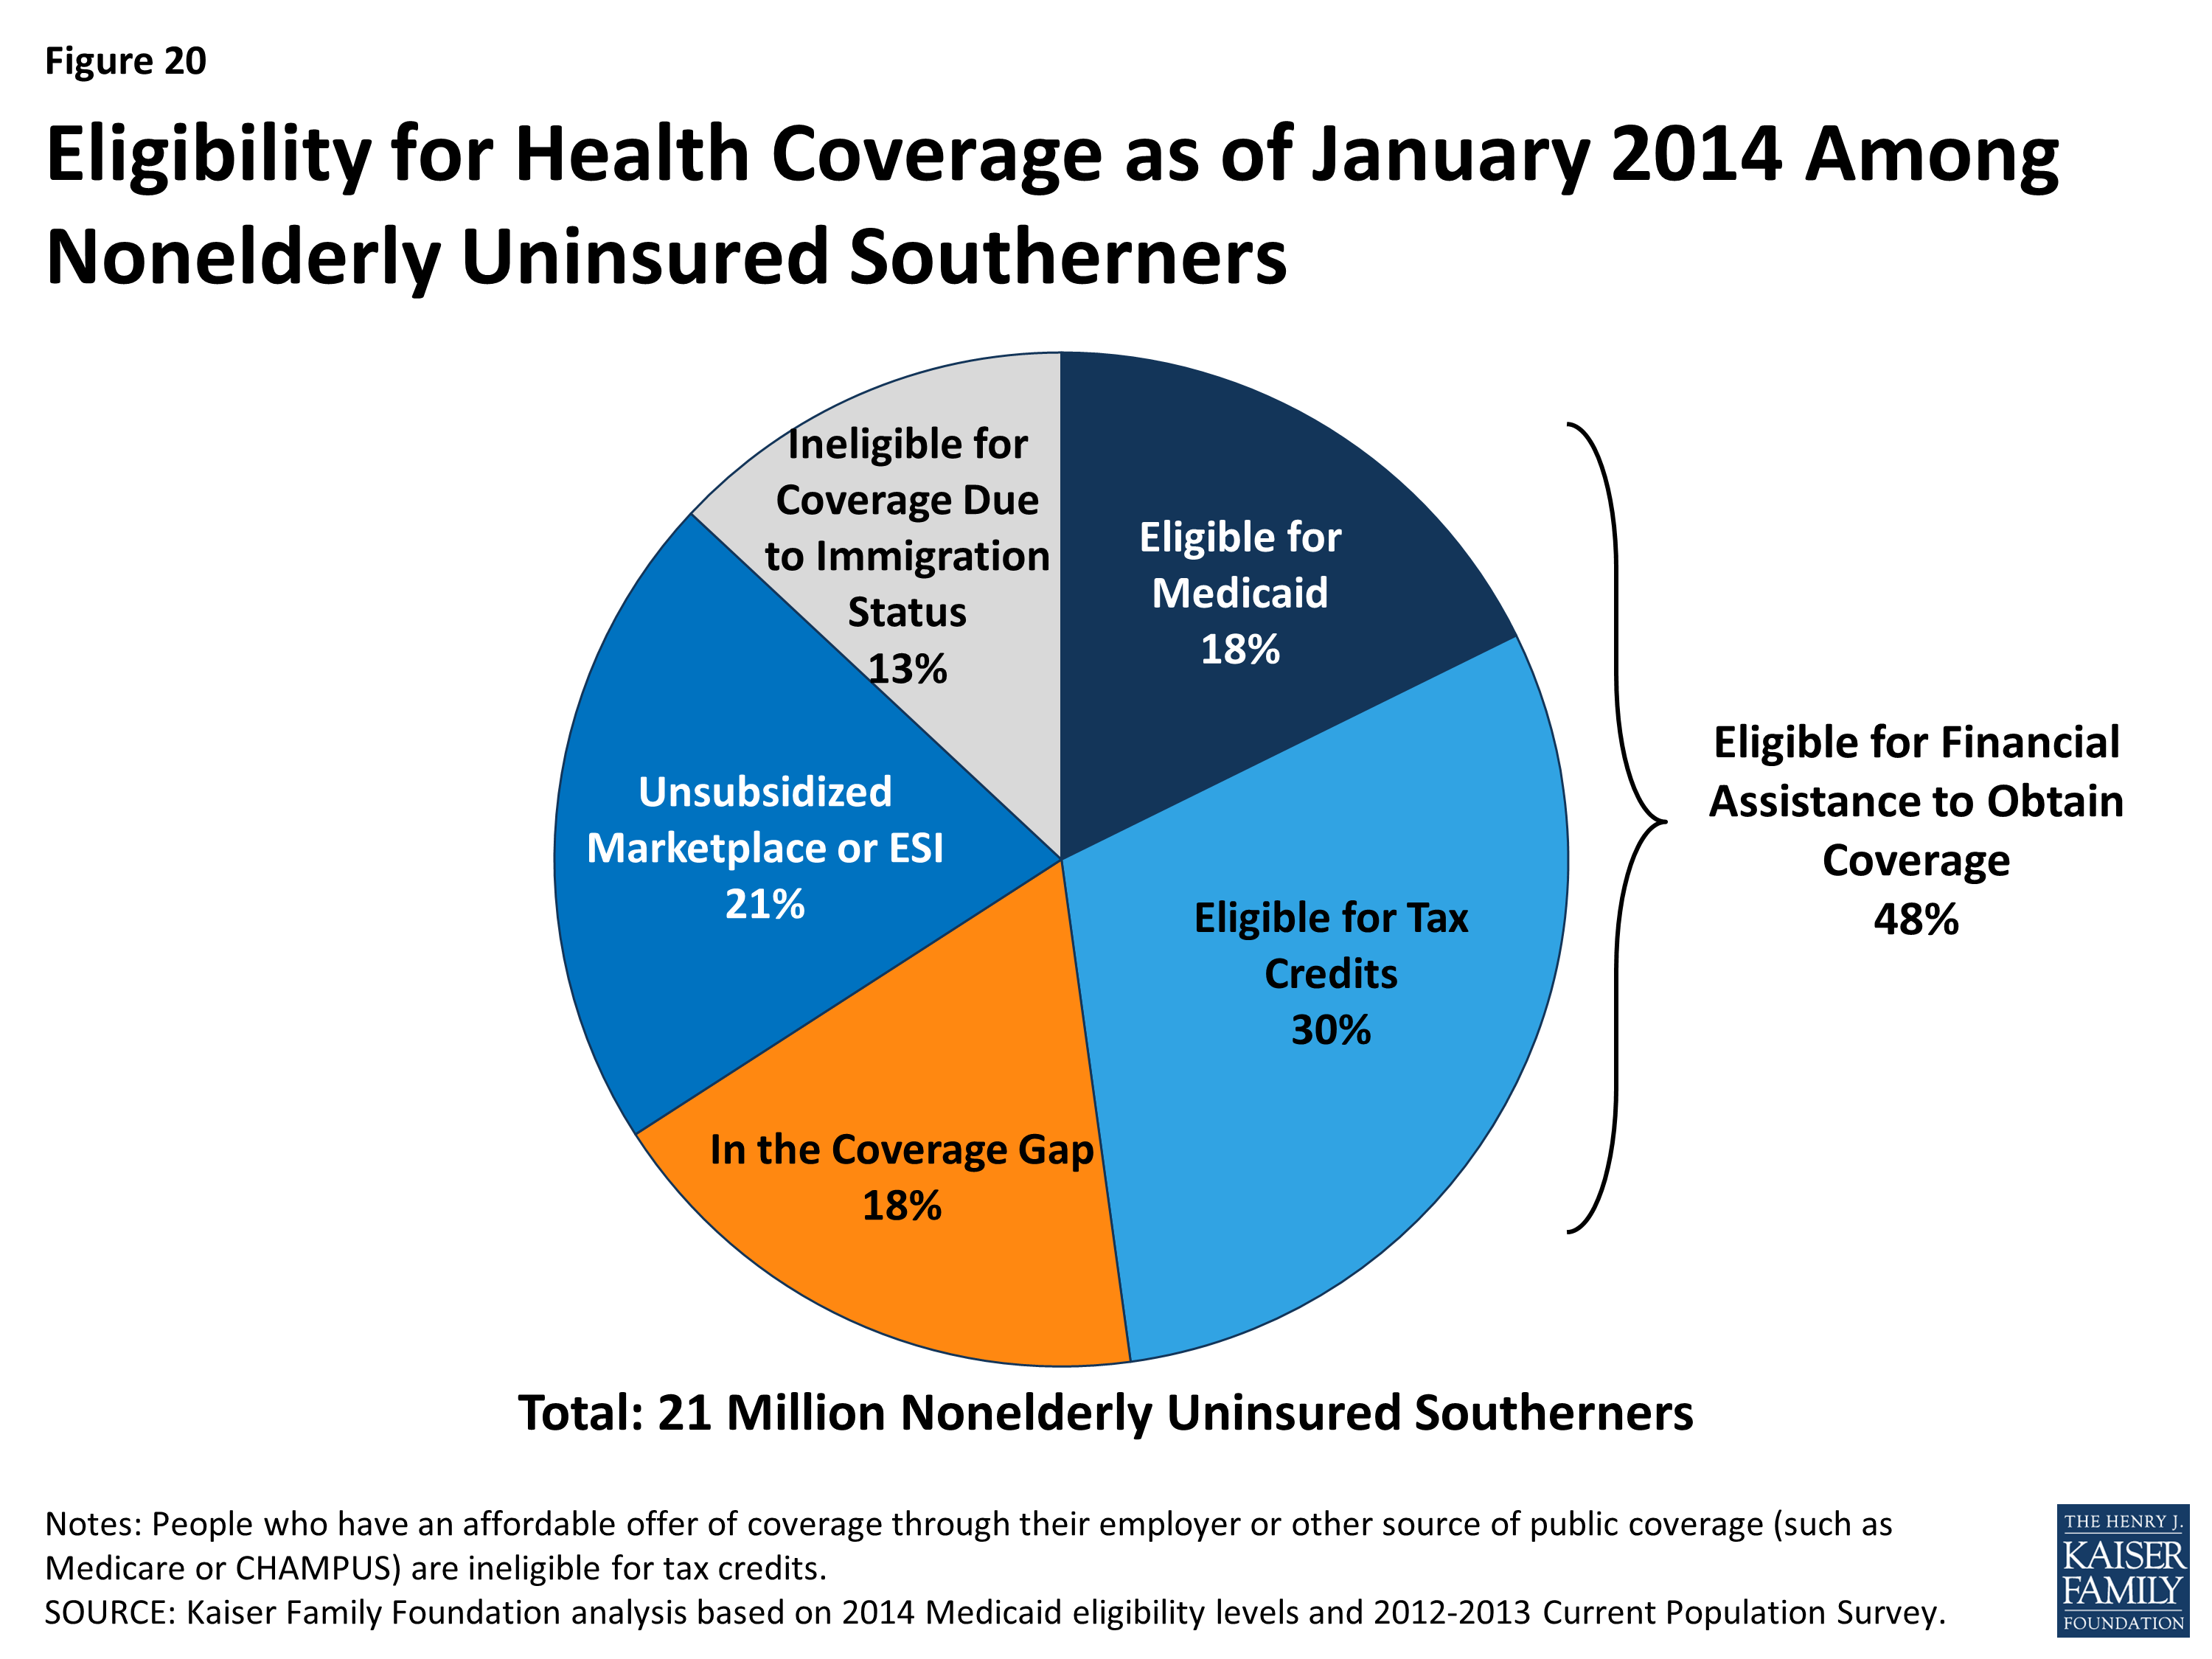
Figure 20: Eligibility for Health Coverage as of January 2014 Among Nonelderly Uninsured Southerners
Connecting Individuals to Coverage Through Outreach and Enrollment
Effective outreach and enrollment efforts are key to ensuring that the millions of uninsured Southerners who are eligible for coverage are enrolled. Even with remaining coverage gaps, millions of uninsured individuals in the South have gained access to new coverage options under the ACA. Effective outreach and enrollment efforts will be important for successfully enrolling these individuals, including targeted efforts to reach people of color, immigrant families, rural populations, low- and moderate-income families, and people with serious health needs. Regardless of state decisions to expand Medicaid, the ACA requires all states to adopt new approaches to simplify enrollment and renewal that make it easier for individuals to apply for and retain coverage. These include providing multiple application avenues for families (including online, by phone, and in person) and moving to technology-driven eligibility verification processes.6 Through previous experience with Medicaid and CHIP, a number of southern states have demonstrated that these and other strategies can be effective ways to enroll eligible populations into coverage while improving efficiency and minimizing burdens on state agencies (see Box 1). Looking forward, these state experiences provide key lessons for improving access to coverage in the South.
| Box 1: Examples of Innovative Outreach and Enrollment Policies in the South |
|
Oklahoma: Streamlining the Application and Renewal Process with the Use of Technology. In September 2010, Oklahoma became the first state to launch a real-time Medicaid and CHIP eligibility system to allow individuals to apply for coverage over the internet. The state verified applicants’ self-attested income electronically after making an initial eligibility determination, reducing the need for paper documentation. With the electronic verification system, enrollees were also able to review, update, and renew their coverage at any time. The new processes developed by the state reduced manual processes required by eligibility workers, and one year after implementing the enrollment system, the state estimated that it was able to process more than a thousand applications per day, and 90 percent received on-the-spot eligibility determinations, even when state offices were closed.7
.
South Carolina: Simplifying Renewals through Express Lane Eligibility. In 2011, South Carolina initiated a data-driven decision-making process to identify potential simplifications to its Medicaid enrollment process. Using data analysis, the state identified significant churn in its Medicaid program that was creating burdens for families, administrative staff, and providers. The state moved quickly to begin using eligibility findings from its Supplemental Nutrition Assistance Program (SNAP) and Temporary Assistance for Needy Families (TANF) program to conduct express lane renewals, resulting in coverage renewals for about 80,000 children in just nine months. The state estimated direct administrative cost savings of $1 million and 50,000 hours in staff time per year from implementing express lane eligibility at renewal.8,9
.
Louisiana: Improving Retention through Over Time through Incremental Policy Changes. In the years leading up to ACA implementation, Louisiana implemented several policy changes to improve retention for families enrolled in Medicaid and CHIP. In 2000, the state implemented an ex parte renewal process in which the state reviewed eligibility information available through the SNAP and TANF programs before closing a case. In 2003, the state implemented telephone renewals, and in 2005, began an administrative renewal process in which the state auto-renewed cases that had a very low likelihood of ineligibility at renewal. Following implementation of this policy, the proportion of children in CHIP who lost coverage at renewal due to procedural or administrative reasons fell from 17 percent to less than 1 percent. As of May 2013, only 4 percent of Medicaid renewals occurred through the use of a paper form, and most (69%) renewed though express lane eligibility or administrative renewals. Coupled with organizational changes, Louisiana found that these efforts helped to reduce burdens on eligibility staff while maintaining low error rates.10
.
Arkansas and West Virginia: Using Targeted Enrollment Strategies to “Fast Track” Medicaid-Eligible Individuals Into Coverage. In late 2013, Arkansas and West Virginia took advantage of a new option to facilitate the enrollment of eligible individuals into Medicaid using data already available to the state. Both states received approval to use data from the Supplemental Nutrition Assistance Program (SNAP) to identify Medicaid-eligible adults, and West Virginia also implemented the option to use Medicaid and CHIP enrollment data for children to reach eligible parents. In less than two months, over 63,400 people had been verified eligible and enrolled into Medicaid in Arkansas, and 54,100 people had been verified as eligible and enrolled into Medicaid in West Virginia. Both states found the fast track approach to be an effective way to jump-start enrollment into their Medicaid expansions while minimizing burdens on individuals, staff, and enrollment systems.11
|
Translating Coverage to Care: Delivery Systems and the Safety Net
To improve health outcomes in the long term, it will also be important to ensure that newly-insured individuals are able to obtain needed primary and specialty care services. As uninsured individuals in the South gradually gain coverage and seek care, health resources in these communities may be further stretched. The ACA includes a number of provisions to help states improve health system capacity, including increased funding to expand community health centers and a temporary increase in Medicaid payment rates for primary care physicians.1 Increases in physician capacity will be especially important in areas with historically limited health resources.
Provider Capacity in the South
Many Southerners live in a primary care Health Professional Shortage Area (HPSA), meaning that they reside in a region with a documented shortage of primary care providers. As of 2012, nearly one-quarter (22%) of southern residents were residing in a primary care HPSA. In four southern states (AL, DC, LA, and MS), more than one in three residents lived in a primary care HPSA, and in Mississippi, over half of the state population lived in a primary care HPSA—the highest share in the country (Table 4). As coverage expands and the demand for care increases, expanding provider capacity will be key to ensuring that coverage translates into access to care.
| Table 4: Share of Population Living in a Primary Care Health Professional Shortage Area (HPSA), by State, 2014 | ||
| State | Number of Residents Living in Primary Care HPSA | Share of Population in HPSA |
| United States | 57,742,576 | 18% |
| South | 25,759,887 | 22% |
| Mississippi | 1,676,661 | 56% |
| Louisiana | 2,001,796 | 43% |
| Alabama | 1,802,365 | 37% |
| District of Columbia | 241,638 | 37% |
| Oklahoma | 1,113,275 | 29% |
| South Carolina | 1,286,623 | 27% |
| Florida | 4,613,535 | 24% |
| Delaware | 203,525 | 22% |
| Georgia | 1,984,945 | 20% |
| Texas | 5,229,179 | 20% |
| Kentucky | 763,738 | 17% |
| Maryland | 931,622 | 16% |
| Tennessee | 965,306 | 15% |
| West Virginia | 284,335 | 15% |
| Virginia | 1,144,027 | 14% |
| Arkansas | 364,909 | 12% |
| North Carolina | 1,152,408 | 12% |
| SOURCE: Bureau of Clinician Recruitment and Service. Health Resources and Services Administration. “Designated Health Professional Shortage Areas.” January 1, 2014 | ||
Medicaid payment rates are one lever for increasing provider supply and access in the program, but additional measures are needed to overcome provider shortages. In 2012, state Medicaid programs overall paid physicians just 66% of Medicare fee levels. Notably, though, 13 of the 17 Southern states paid Medicaid rates equal to at least 75% of Medicare rates, including eight southern states that paid 80% or more of Medicare fee levels (Figure 21). Under the ACA, Medicaid payment rates to primary care physicians (PCP) for most of their services must be at least equal to Medicare rates in 2013 and 2014 (the difference is fully funded by the federal government); in 2013, this provision increased PCP fees by at least 40% in half of the southern states, including Florida, where they more than doubled.
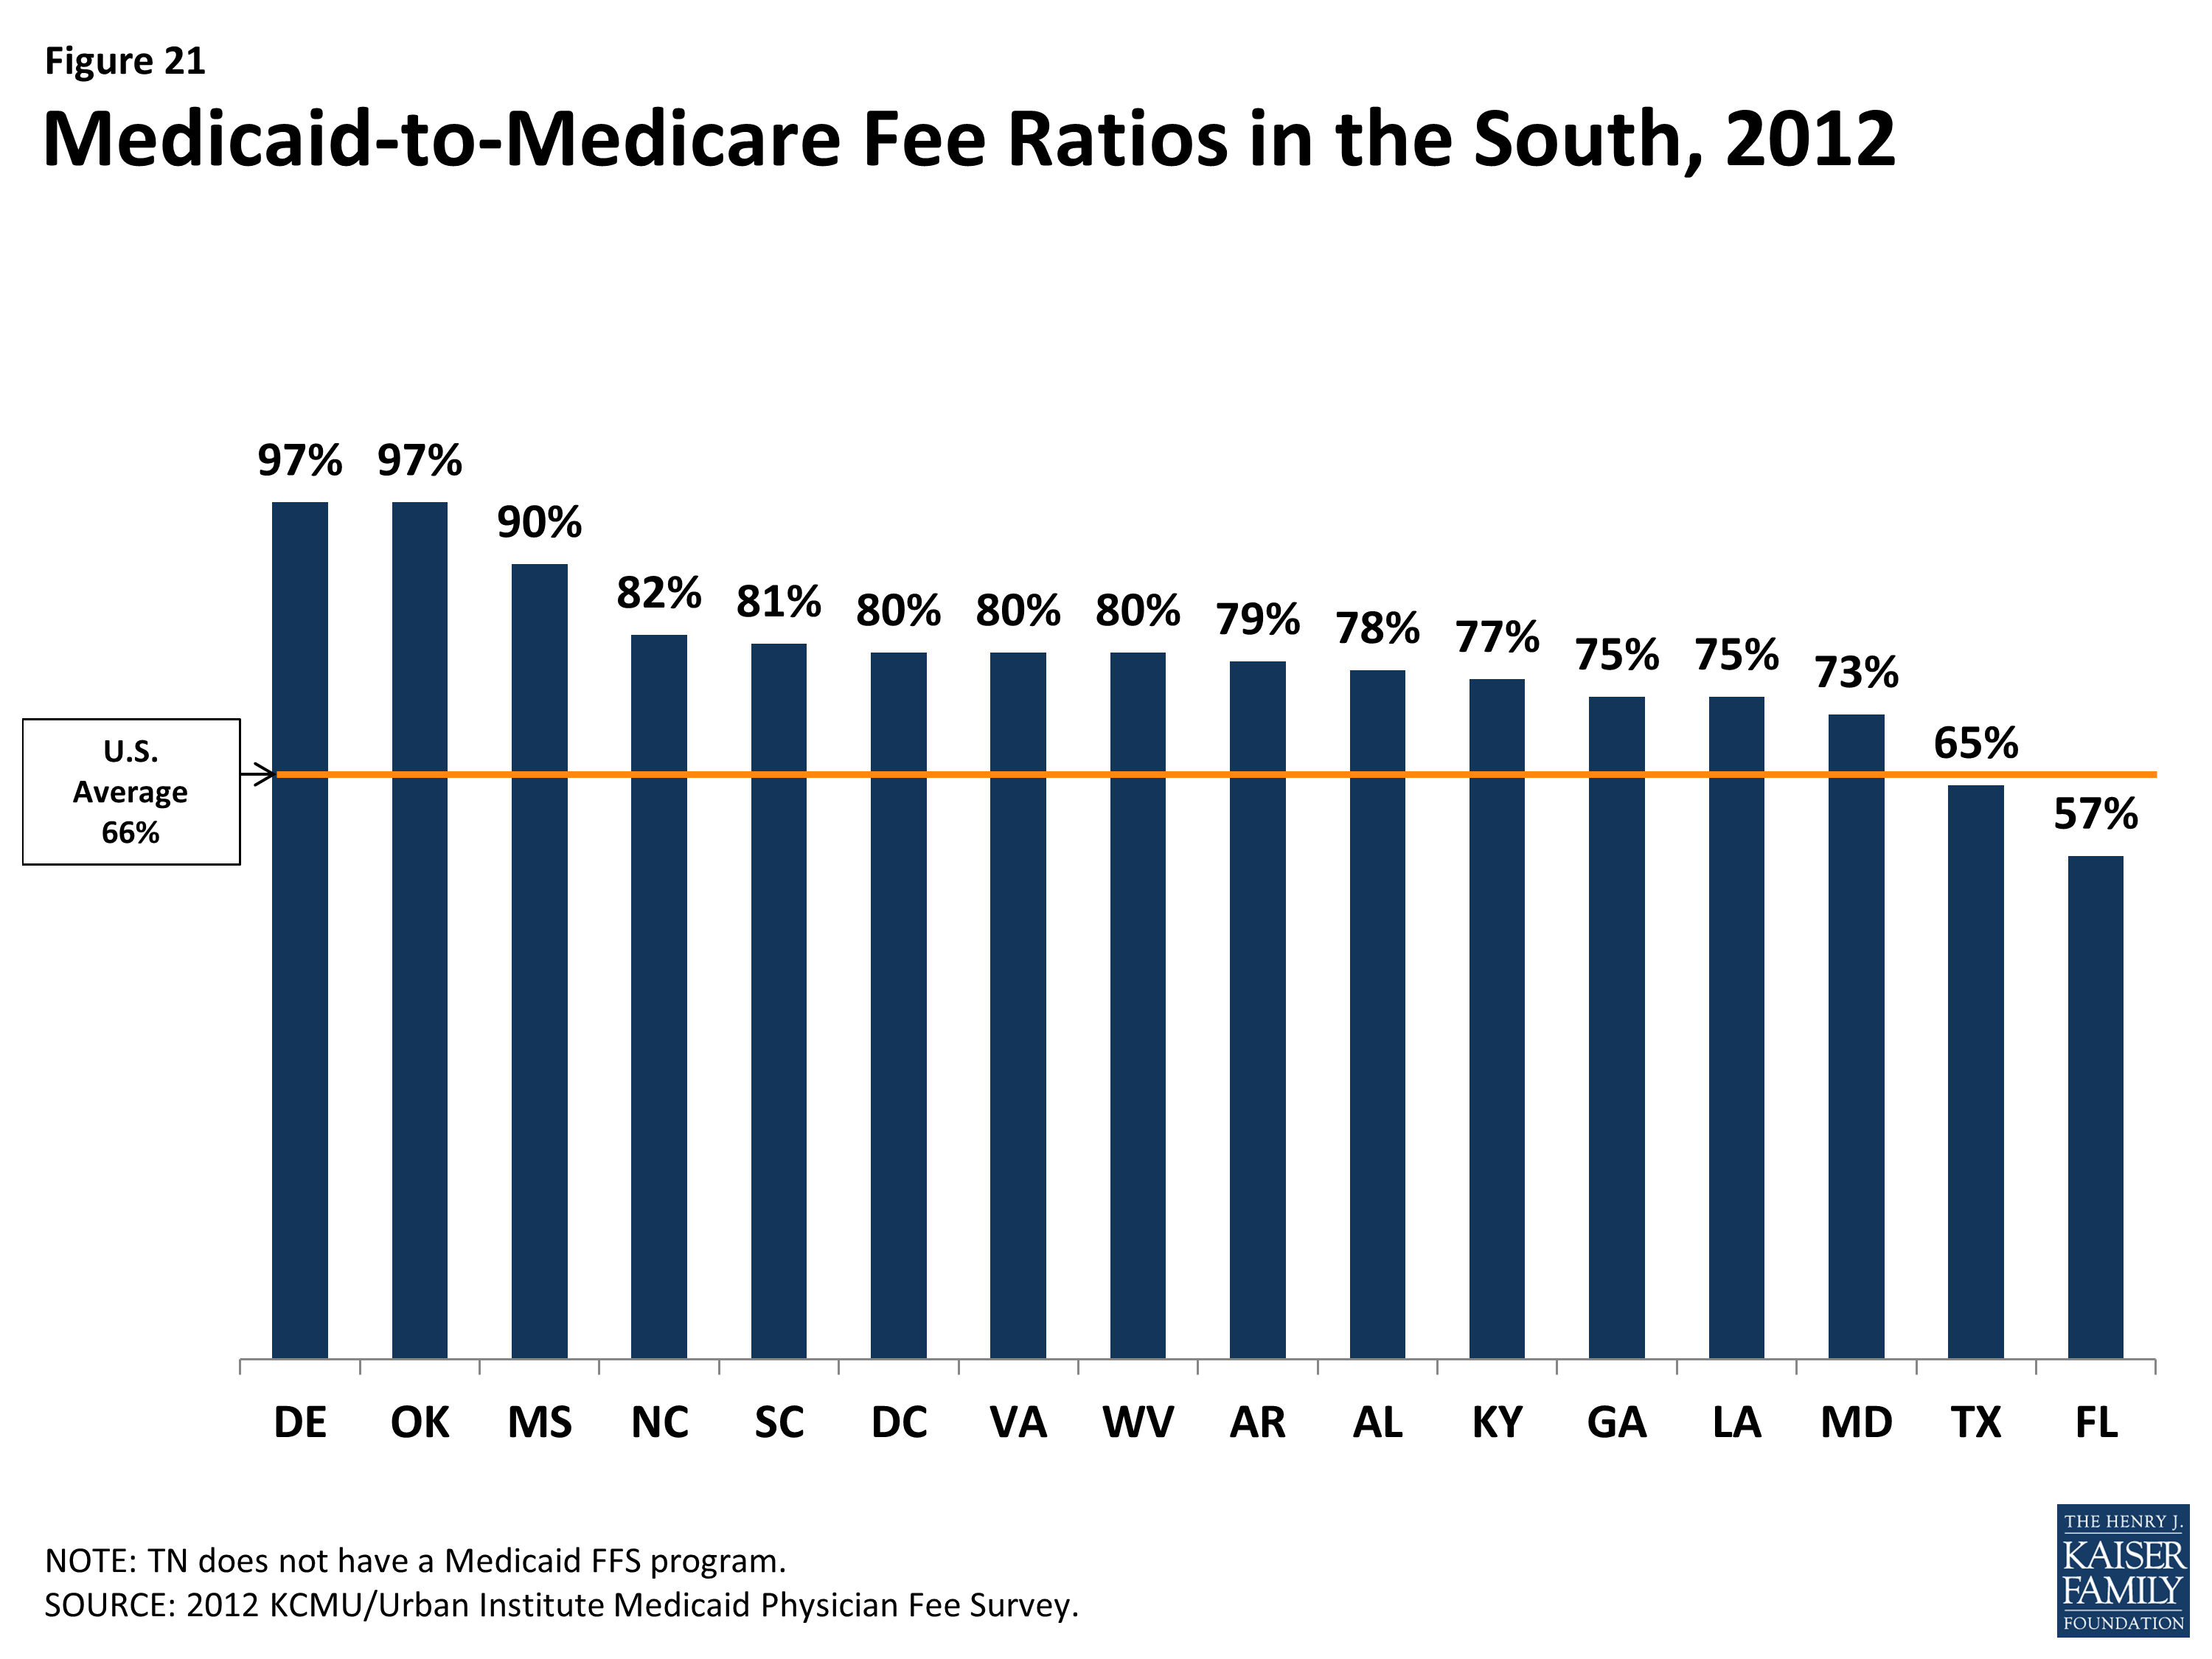
Figure 21: Medicaid-to-Medicare Fee Ratios in the South, 2012
Although paying providers fee-for-service rates closer to Medicare and private insurance rates may attract more provider participation in Medicaid, absolute shortages in the supply of physicians, particularly in rural and low-income communities, are system-level capacity constraints that Medicaid payment rates cannot correct. Broader strategies and investments to develop a more adequate health care workforce are called for. The ACA includes numerous provisions along those lines, but they will take time to bear fruit. A more immediate strategy for expanding access (especially access to primary care) is to expand the role of nurse practitioners (NP), physician assistants (PA), and other health professionals in delivering care. A large body of evidence on NPs shows that the care they provide is of equal or, in some cases, better quality than physician-provided care for the same conditions. In many states, including 11 states in the South, state regulations that restrict NP scope of practice are a major obstacle to this strategy. These restrictions prevent NPs from diagnosing and treating illness and prescribing drugs without physician supervision.2 Of the southern states, only DC, Maryland, and Delaware extend full autonomy to NPs to practice independently at the “top of their license” (Figure 22).
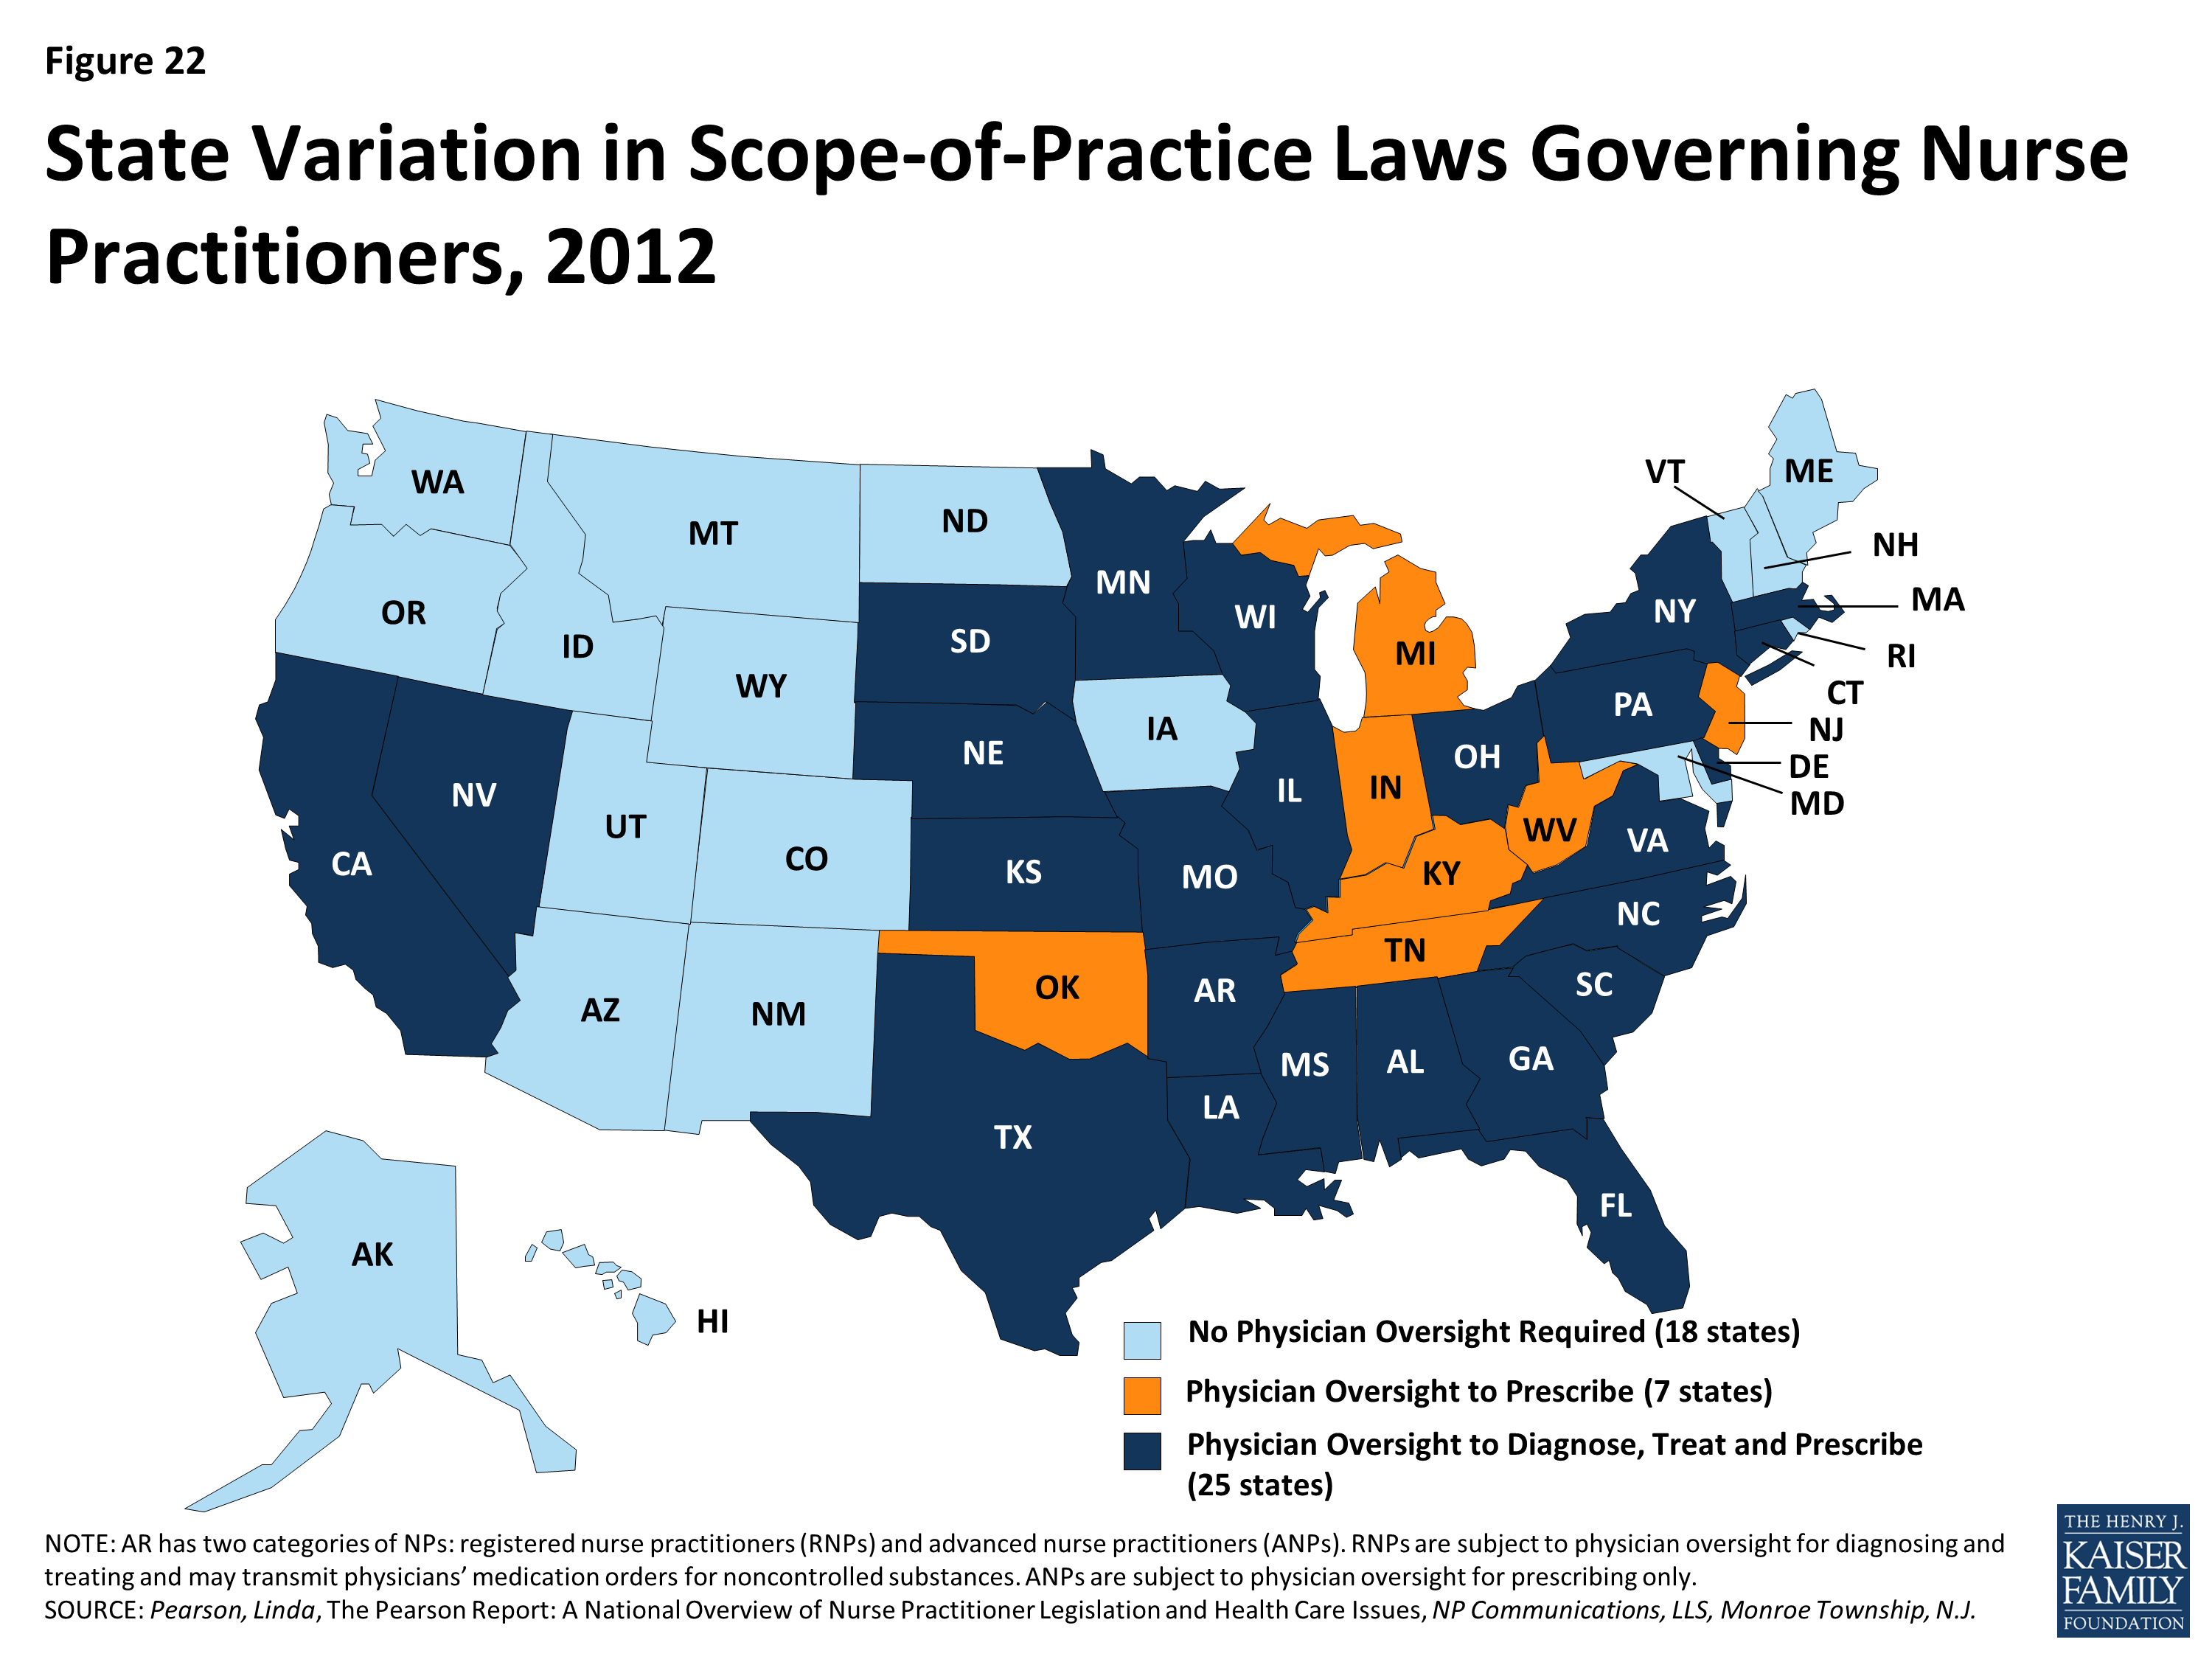
Figure 22: State Variation in Scope-of-Practice Laws Governing Nurse Practitioners, 2012
Medicaid managed care programs can also expand the role of NPs by including them in their primary care provider panels. A 2009 RAND study that estimated potential health care savings associated with expanding the role of NPs and PAs in Massachusetts assumed in its model that NPs and PAs could provide care for six simple acute conditions (e.g., cough, fever, earache) that are among those commonly treated at retail clinics staffed by these providers. Care for these six conditions, plus well-baby visits and general medical examinations, which the model also assumed NPs and PAs could provide, represent nearly one in five of all office-visits nationally.3 This analysis suggests that expanding the use of NPs and PAs in the South – in effect, increasing the supply could increase the availability of routine primary care.
Medicaid managed care
Nationwide, a large and growing share of Medicaid beneficiaries receive their care in capitated managed care plans. Increasingly, state Medicaid programs across the country are contracting with private managed care plans to deliver Medicaid benefits to Medicaid enrollees. Under these contracts, states pay a fixed “capitation” rate to plans for each person enrolled, and the plans are at financial risk for all the services specified in their Medicaid contracts. Enrolled beneficiaries receive all or most of their care from their plan’s network of providers. Under the other major (though much smaller) model of Medicaid managed care, known as primary care case management (PCCM), states retain fee-for-service payment, but provide a small monthly fee to primary care providers to coordinate primary care for their Medicaid patients. Some states’ PCCM programs involve partial capitation payment.As of July 2011, over half of all Medicaid beneficiaries nationally were enrolled in risk-based managed care, but the proportion varied considerably across the country. A number of factors may contribute to the variation. Some states or areas lack sufficient population to attract risk-based plans. Organized medicine and managed care interests may influence Medicaid policy choices. Some states have abandoned risk-based contracting because of plan exits from the market, budget pressures, or a preference for managing their Medicaid programs themselves by contracting directly with providers, rather than shifting responsibility and financing for services to insurers.
Most states in the South have some share of their Medicaid population enrolled in risk-based managed care. In 2011, 5 of the 17 states in the South had no risk-based Medicaid managed care (Alabama, Arkansas, Louisiana, North Carolina, and Oklahoma). However, the other 12 had risk-based programs that, with a few exceptions, covered at least half their Medicaid population, and substantially more in the District of Columbia (77%), Maryland (75%) and Tennessee (97%) (Figure 23). Notably, Louisiana more recently adopted risk-based managed care statewide, Alabama is slated to do so later this year, and under Arkansas’ proposed “private option” for implementing the ACA Medicaid expansion, adults newly eligible for Medicaid are to be enrolled in the same managed care plans offered in the new insurance Marketplaces.

Figure 23: Risk-based Medicaid managed care is less prevalent in the South than in the U.S. overall, but varies widely by state
PCCM programs are prevalent in the South as well, operating in 12 of the 17 states in the region. In four states – Arkansas, Louisiana, North Carolina, and Oklahoma – over 60% of Medicaid beneficiaries were enrolled in these arrangements as of 2011. Interestingly, while the Medicaid trend nationally is for states to move away from the fee-for-service toward risk-based managed care, in the mid-2000s, both North Carolina and Oklahoma terminated their risk-contracting programs and implemented PCCM statewide.
Trends suggest a continued movement toward managed care within the South going forward. In a recent 50-state survey, nearly all states in the South reported that they undertook Medicaid managed care initiatives in 2013 or planned to in 2014, including expansions of managed care to new geographic areas or groups, mandatory managed care enrollment, implementation or expansion of managed long-term care, and measures to improve quality.
Delivery system innovation
State Medicaid programs, including many in the South, are in a period of dynamic innovation in health care delivery and payment. Medicaid programs have historically been a source of new approaches to improving care for some of the nation’s most medically complex and low-income populations. Now, new options, demonstration programs, and funding opportunities provided by the ACA are catalyzing increased activity, including Medicaid participation in multi-payer initiatives designed to leverage broader systemic change, as well as reforms within Medicaid programs themselves.
Consistent with a broader trend nationally, most states in the South have undertaken medical home initiatives designed to provide comprehensive and continuous patient-centered care to Medicaid beneficiaries. In addition, both Alabama and North Carolina have taken up a new Medicaid option under the ACA to establish health homes to provide comprehensive care coordination for Medicaid beneficiaries with chronic conditions, and Arkansas, Delaware, the District of Columbia, Maryland, Oklahoma, and West Virginia are planning such programs. Alabama and North Carolina have also taken steps to establish accountable care organizations (ACO) in Medicaid. In ACOs, participating providers, plans, and hospitals are collectively responsible for the care of a defined population, encompassing the continuum of care across different settings. The participating providers agree to achieve specified financial and quality outcomes and may share in savings associated with their performance. The following selected initiatives in Arkansas, North Carolina, South Carolina, and Texas illustrate the diversity of service delivery and payment innovation underway in Medicaid:
| Box 2: Examples of Innovative Delivery System and Payment Models in the South |
|
Arkansas. The State Innovation Models (SIM) initiative, sponsored by CMS’ Center for Medicare and Medicaid Innovation, provides support to states for the development and testing of state-based models for multi-payer payment and health care delivery system transformation, with the goal of improving health system performance. Arkansas was one of six states to receive a Model Testing award under the initiative, and will receive up to $42 million over 42 months to implement its plan.
.
Arkansas’ innovation plan is aimed at moving from an encounter-based, fee-for-service system to a more patient-centered, comprehensive, and coordinated care system. Within three to five years, most Arkansans will have access to medical homes, and those with more complex needs (e.g., individuals with developmental disabilities and behavioral health conditions) will have access to health homes. Both medical and health homes will receive episode-based payments for certain procedures, acute care, and chronic care for selected conditions. Medical homes will extra fees for care coordination, and may share in savings based on their performance. Health homes will also receive such fees, with shared savings possible in the future. The plan calls for Medicaid, CHIP, Medicare, and private payers to participate in the initiative. Arkansas has already established common payment mechanisms for Medicaid and private payers, consistent quality metrics, and a multi-payer provider web portal. The plan also includes strategies to strengthen the health care workforce, use team-based care, increase consumer engagement, and adopt electronic medical records and a health information exchange. The state projects savings of $1.1 billion over the three-year Model Testing period, and $8.9 billion through 2020.
.
North Carolina. Community Care of North Carolina (CCNC), North Carolina’s widely recognized statewide Medicaid medical home and care management program, serves the vast majority of Medicaid beneficiaries in the state. Beneficiaries are enrolled in participating primary care or group practices that serve as medical homes in their local communities. The state funds and provides training, data, and tools to 14 regional Community Care networks that support the practices and work with them to improve care.
.
North Carolina has built on the CCNC infrastructure over time to enhance the delivery system in the state. In 2008, for example, North Carolina initiated the Transitional Care Program (TCP) after it expanded CCNC to include aged and disabled Medicaid beneficiaries. These beneficiaries have high rates of multiple chronic conditions and are thus at high risk for fragmented care that can lead to multiple hospitalizations. The TCP identifies high-risk CCNC members when they are admitted to the hospital and plans for, coordinates, and arranges their transition from the hospital back to the community. The concept is that robust discharge and transition planning can reduce the risk of emergency department use and hospital readmission for complex Medicaid patients, improve health outcomes, and reduce costs. A recent evaluation of the TCP showed that readmission rates among Medicaid beneficiaries who received TCP support were 20% lower than the rates for clinically similar patients who received usual care. TCP participants were also less likely to experience multiple readmissions.
.
South Carolina. Medicaid pays for 50% of all births in South Carolina. The South Carolina Birth Outcomes Initiative (BOI), a multi-stakeholder effort that includes the South Carolina Department of Health and Human Services, the state hospital association, the state chapter of the March of Dimes, and BlueCross Blue Shield of South Carolina (the other major payer of births in the state), has three major goals: to improve health outcomes for newborns in the Medicaid program and throughout the state, decrease the number of days babies spend in neonatal intensive care units (NICU), and reduce racial disparities in birth outcomes.
.
The BOI comprises several components. One is Medicaid reimbursement for Screening, Brief Intervention, and Referral to Treatment (SBIRT) services, to help identify and treat pregnant and postpartum Medicaid beneficiaries who may smoke, have alcohol or other substance dependencies, experience depression, or face domestic violence. The BOI also involves efforts to encourage breastfeeding, including incentives to hospitals to improve their support for breastfeeding and achieve “Baby Friendly Hospital” status. Reducing early elective deliveries in the state is another major thrust of the BOI. An initial voluntary effort by the state’s birthing hospitals led to a 50% reduction in early elective deliveries. To gain more ground, the Medicaid program and BlueCross BlueShield jointly pursued a policy of non-payment for early elective inductions. Data from the first eight quarters show large declines in the early elective rate in Medicaid and across all payers and declines in NICU admissions also occurred. A report prepared for the state showed savings of $6 million in the first quarter of 2013.
.
Texas. Faced with rising health care costs and disparities in health outcomes, policymakers have increasingly focused on the benefits of investing in preventive care. In particular, states are expanding efforts to promote personal responsibility and support individuals in changing their lifestyle habits to achieve better health. To build on these efforts, the ACA established the Medicaid Incentives for Prevention of Chronic Diseases (MIPCD) program, which provides a total of $85 million in grants over five years to states that provide incentives to Medicaid beneficiaries who participate in prevention programs and change their health risks and outcomes by adopting healthy behaviors. Each program must address at least one of the following prevention goals: tobacco cessation, weight loss, lowered cholesterol, lowered blood pressure, and prevention or management of diabetes.
.
Texas, one of ten states to receive an award, began implementing its Wellness Incentives and Navigation (WIN) Project in April 2012. The project targets 1,250 nonelderly adults in Harris County with both a behavioral health condition (including mental health and substance abuse disorders, as well as severe mental illness) and a physical chronic health diagnosis. Structured as a randomized control trial, the project randomly assigns volunteer participants to either an intervention or a control group. Individuals in the intervention group develop individual wellness plans and have access to flexible wellness accounts of $1,150/year to help pay for services and activities that advance their specific health goals. They also receive support from trained health system navigators to manage their health and wellness plans more effectively. The program is available for a maximum of three years for each participant, with the last participants completing the study in December 2015. The most popular goals for participants thus far have been weight loss, increased physical activity, and healthy eating habits.
|
The Safety Net
Safety net providers will continue to be an important part of the health care system in the South. Historically, uninsured and low-income individuals have relied on safety net providers such as community health centers and clinics when seeking care, and even with broad-scale efforts to expand physician capacity and improve the delivery of services to low-income populations, these providers will likely remain a primary source of care for millions of newly-insured Southerners and many low-income individuals who will likely remain uninsured. As of 2011, there were 388 federally-funded federally qualified health centers (FQHCs) in the South that served over six million patients.4 The number of FQHCs available to serve the low-income population in the South varies by state from 5.6 per million low-income people in Florida to nearly 17 FQHCs per million people with low incomes residing in Mississippi (Figure 24). In addition, as of 2011, there were over 1,500 Medicare-certified rural clinics in the South serving the 20 million Southerners residing in rural areas5 and 448 public hospitals, which saw nearly 2.5 million patient visits in the year.6
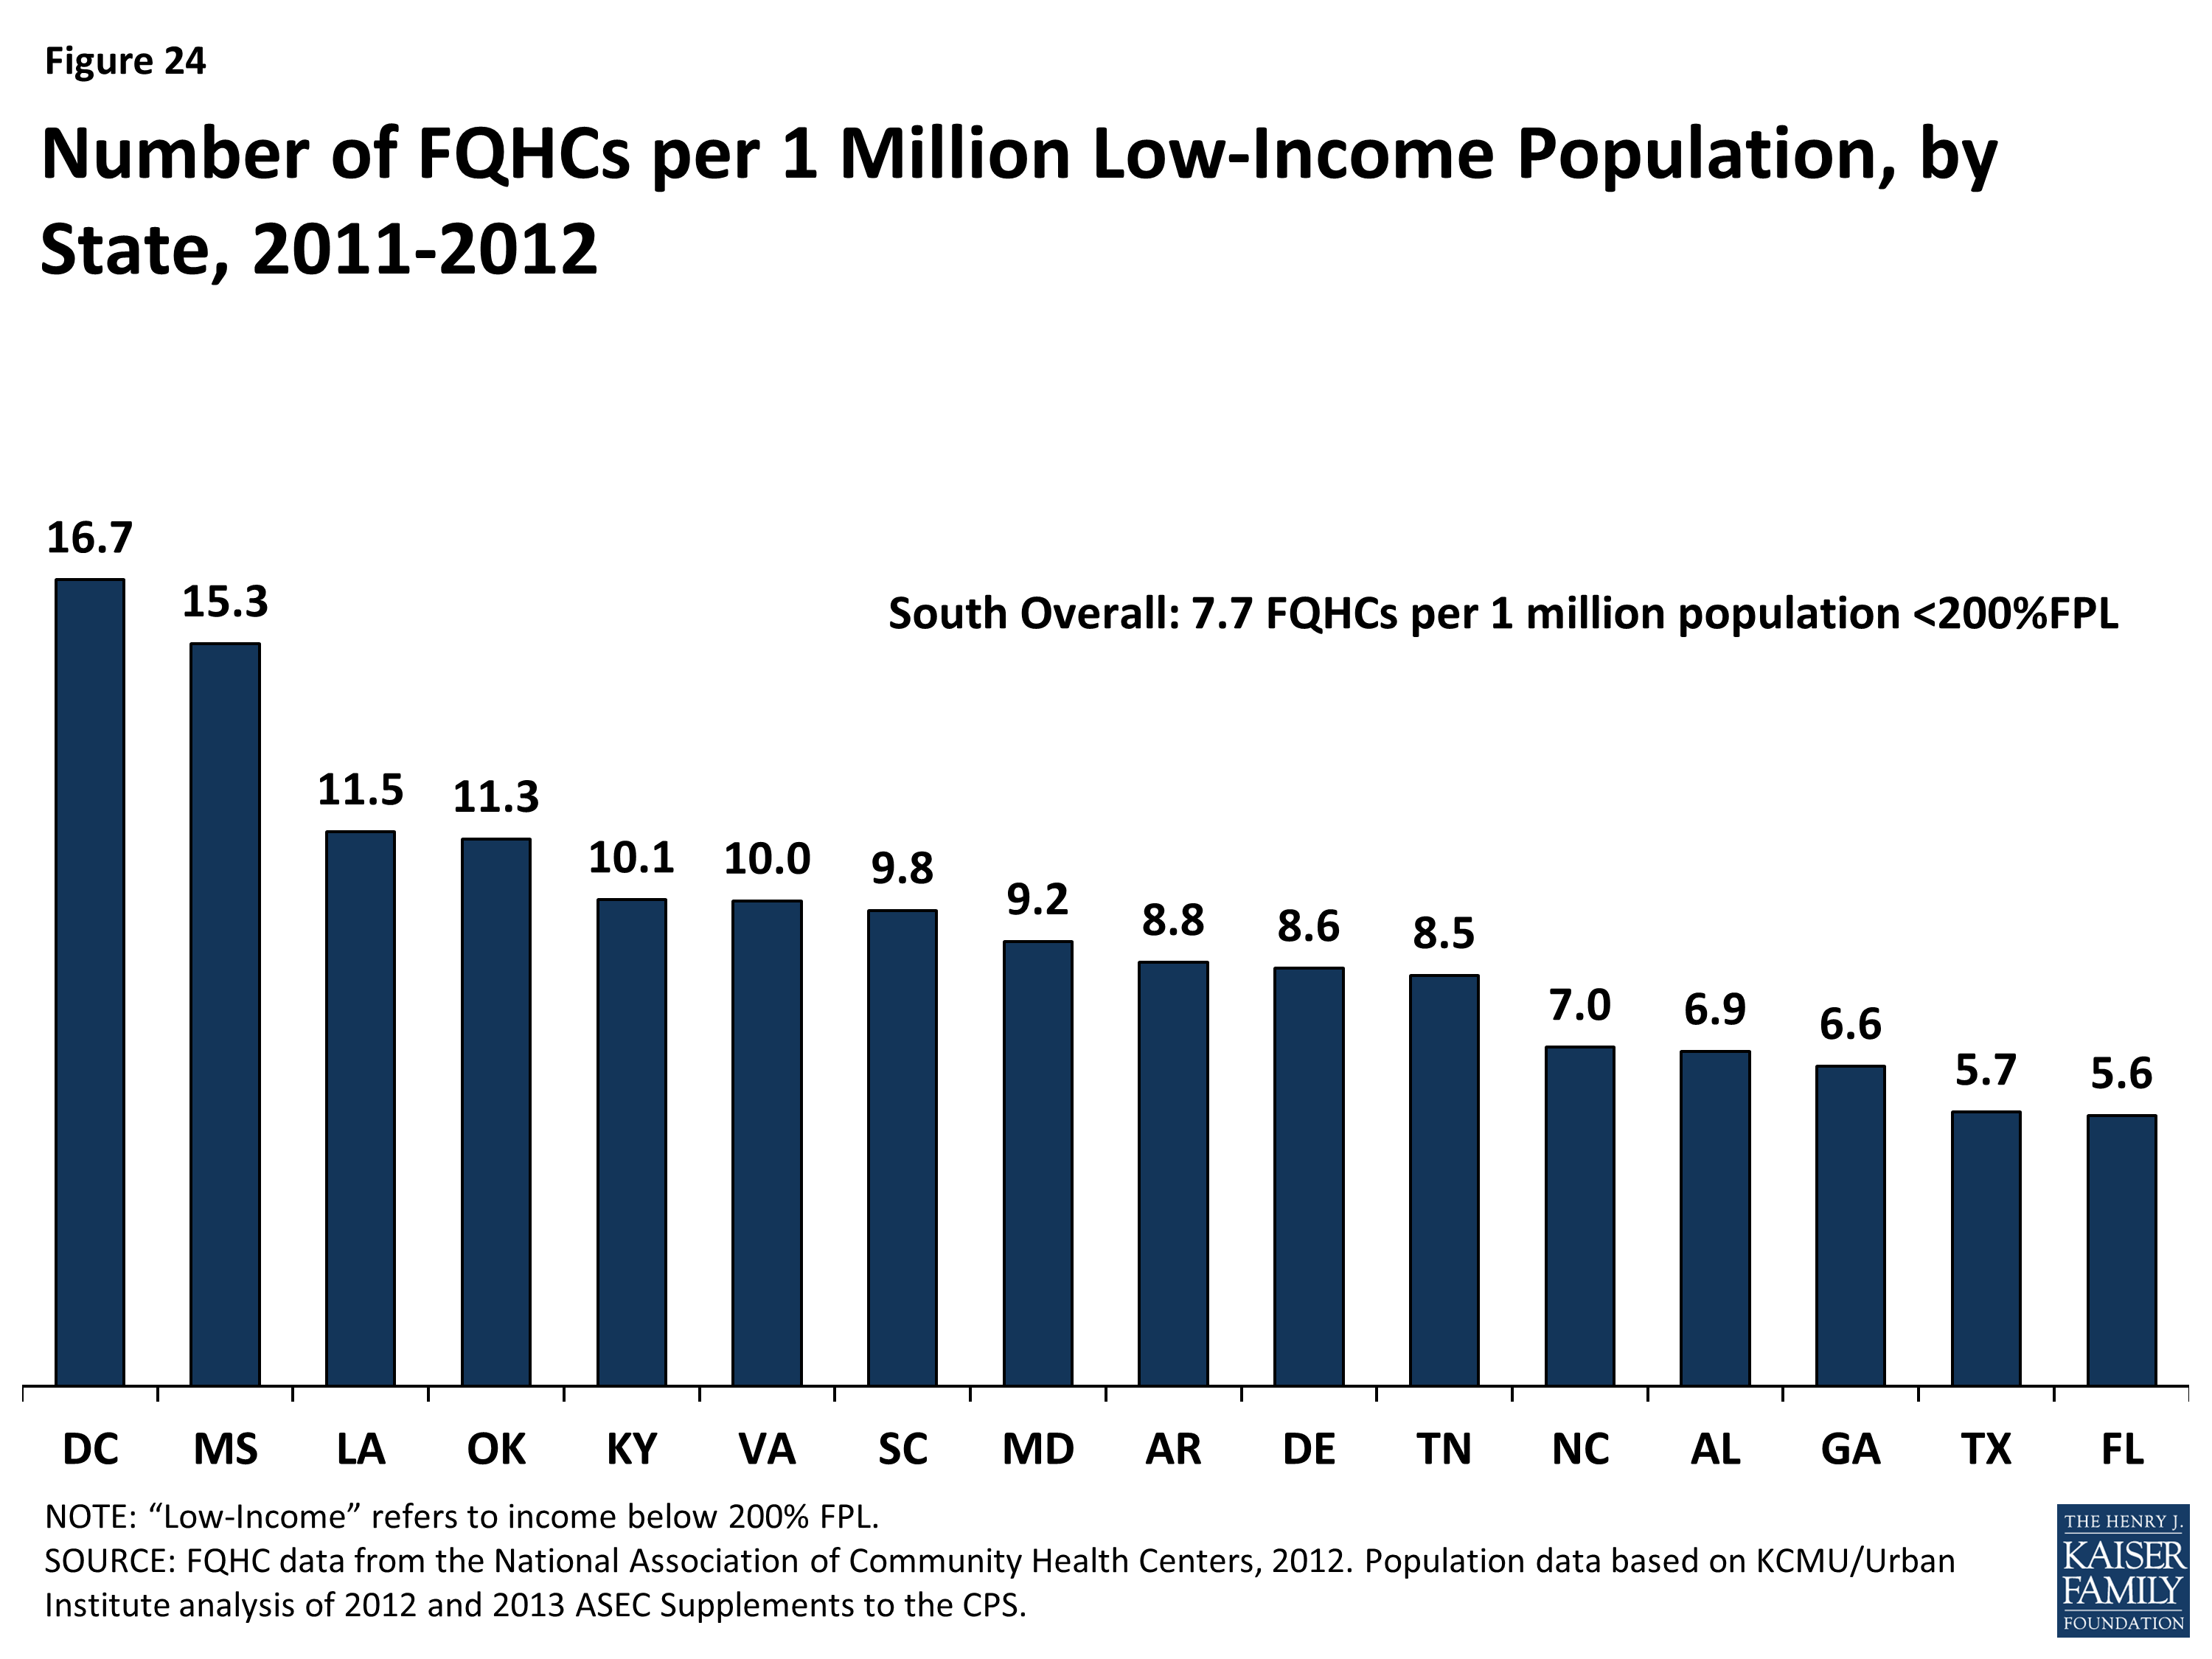
Figure 24: Number of FQHCs per 1 Million Low-Income Population, by State, 2011-2012
Community health centers and other safety net providers serve many vulnerable populations in the South. In addition to providing free or low-cost services to those with low incomes, community health centers are often seen as a trusted source for care within the community and are able to offer culturally and linguistically appropriate services that meet the needs of the diverse populations they serve. In the South, over 90% of patients in federally-funded community health centers are low-income. Over half (56%) are people of color, nearly four in ten are uninsured, 12% are better served in a language other than English, and 5% are homeless (Figure 25). Health centers provide an array of services to their patients, including primary and preventive care, professional services such as dental and mental health care, and enabling services such as case management, health education, and interpretation and translation services.7 As coverage expands, some of these health centers may experience revenue gains as more patients obtain coverage. However, they will continue to serve as a key source of care for individuals who remain uninsured or who have historically relied on their services, requiring adequate resources to support this role.
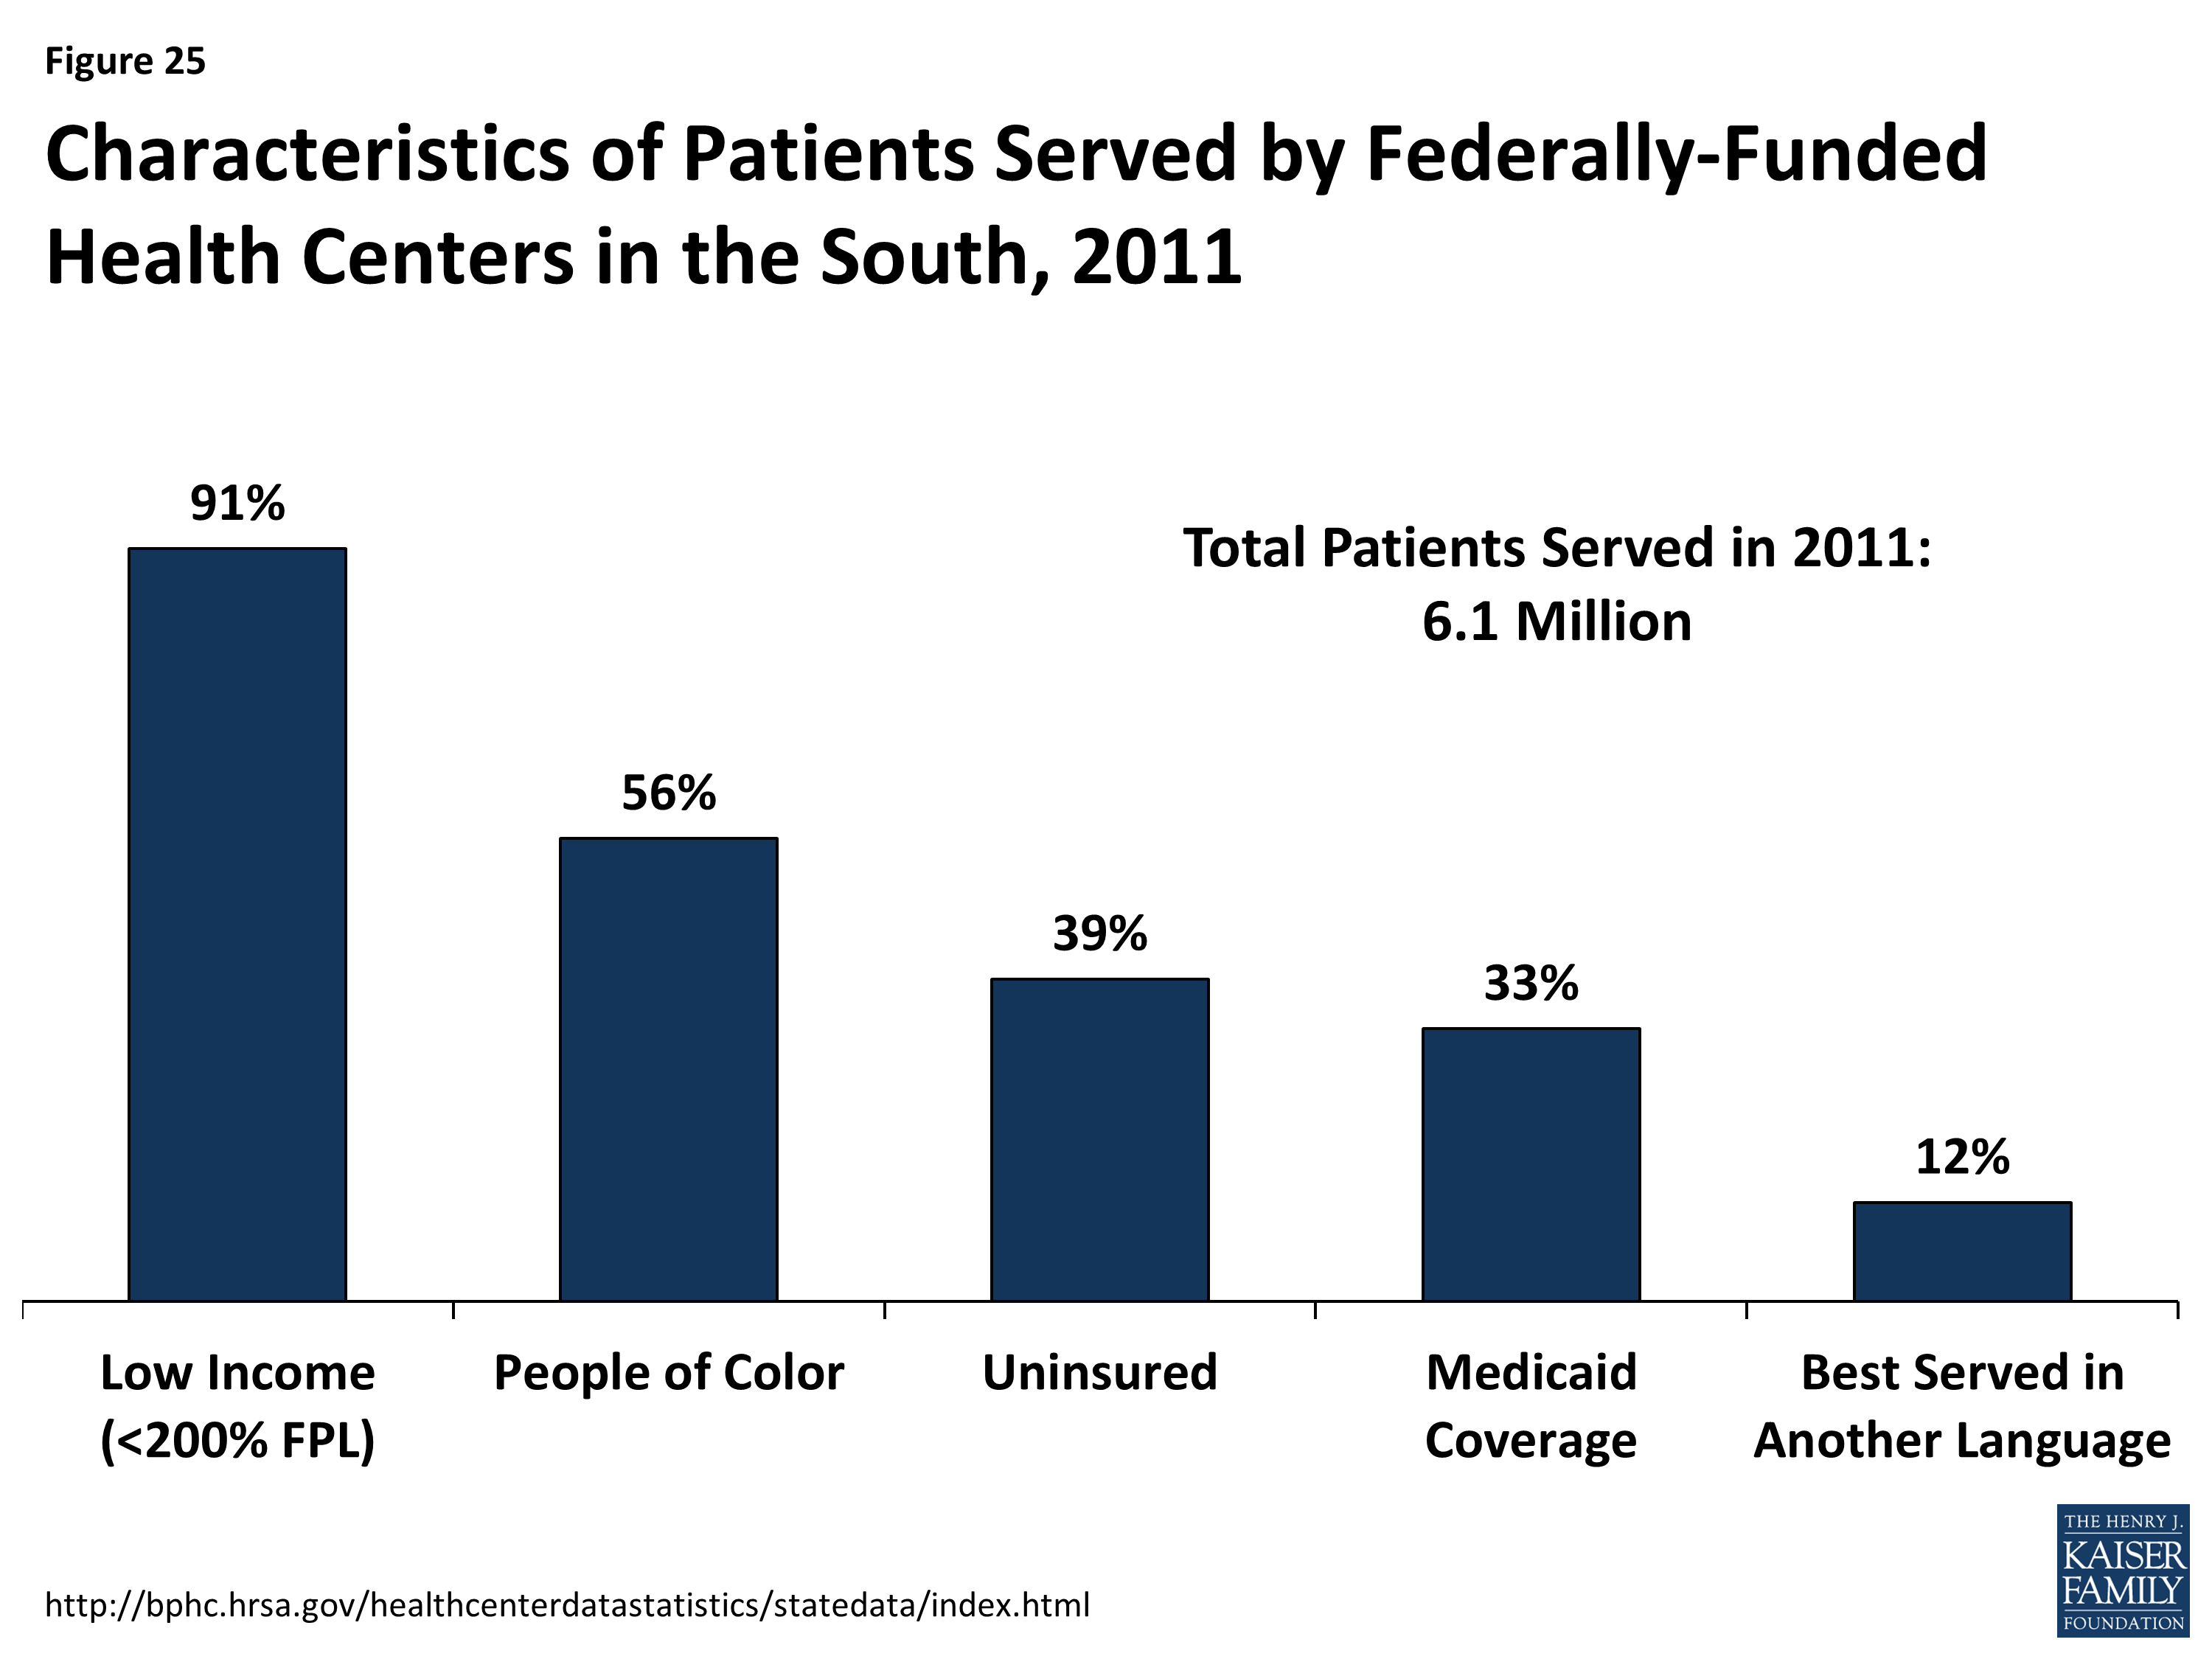
Figure 25: Characteristics of Patients Served by Federally-Funded Health Centers in the South, 2011
Conclusion
Historically, the South has faced longstanding disparities in coverage and care. Yet, access to health coverage and care is particularly important for Southerners given a high prevalence of chronic health conditions and poor health outcomes in the region. The ACA offers the potential to connect many currently uninsured Southerners to coverage, serving as a key first step in enabling individuals in the region to access needed care and manage their health conditions.
To date, the ACA has expanded coverage options for many Southerners, particularly through the new Marketplaces. However, millions of poor Southerners who could gain access to coverage through the ACA Medicaid expansion fall into a coverage gap and are left without a new coverage option in states that are not implementing the Medicaid expansion at this time. If additional states in the South opt to expand in the future there will be even greater coverage gains within the region.
Looking ahead, helping uninsured Southerners who have gained access to new coverage options to enroll successfully will help boost coverage. Regardless of state decisions to expand Medicaid, all states must implement new simplified enrollment processes, which will help connect eligible individuals to coverage. Even with simpler processes in place, effective outreach and enrollment efforts will be key. Across the South, in communities that have historically faced restrictions in coverage and barriers to enrollment, using targeted strategies and one-on-one assistance are available to help eligible individuals enroll and access the health care services they need will be required.
Furthermore, to improve health outcomes in the South, newly-insured individuals need to be able to access health services. The ACA includes a number of provisions to help expand the availability of primary and specialty services in underserved communities, including an increase in Medicaid fees to primary care physicians. Separately, many southern states are adopting a number of innovative approaches to provide comprehensive and patient-centered care to Medicaid beneficiaries including an expansion of managed care and reform of delivery systems to improve care coordination for medically-complex low-income populations. Even with these efforts, safety net providers will likely remain a primary source of care for millions of newly-insured Southerners and for many low-income individuals in the South who remain uninsured.
Given the growing and diverse population in the South, changing patterns of health coverage and care in the region have important implications nationally and for people of color. As such, continued attention to health coverage and care in the South for those gaining coverage and those remaining uninsured will be important for understanding the impact of the ACA and implications for longstanding efforts to reduce disparities in coverage, care, and health outcomes.
This brief was prepared to help inform a collaborative effort with the Satcher Health Leadership Institute at the Morehouse School of Medicine, which focuses on advancing opportunities and assessing challenges in health care and health equity.
Appendix
Appendix Tables
| Appendix Table 1: Population and Distribution by Region and State | |||||||
| Total | White | Black | Hispanic | Asian/Pacific Islander | Other Race/ Ethnicity | All People of Color | |
| UNITED STATES | 309,044,000 | 63% | 12% | 17% | 5% | 3% | 37% |
| NORTHEAST | 55,014,000 | 68% | 11% | 13% | 6% | 1% | 32% |
| Connecticut | 3,515,000 | 72% | 9% | 12% | 5% | 1% | 28% |
| Maine | 1,328,000 | 95% | 1% | 1% | 1% | 3% | 5% |
| Massachusetts | 6,542,000 | 75% | 6% | 11% | 7% | 1% | 25% |
| New Hampshire | 1,304,000 | 93% | 1% | 3% | 2% | 1% | 7% |
| New Jersey | 8,676,000 | 59% | 12% | 20% | 8% | 1% | 41% |
| New York | 19,308,000 | 57% | 14% | 18% | 9% | 2% | 43% |
| Pennsylvania | 12,693,000 | 80% | 11% | 6% | 2% | 2% | 20% |
| Rhode Island | 1,033,000 | 76% | 6% | 13% | 3% | 2% | 24% |
| Vermont | 615,000 | 94% | 1% | 1% | 1% | 2% | 6% |
| MIDWEST | 66,147,000 | 77% | 10% | 7% | 3% | 2% | 32% |
| Illinois | 12,704,000 | 63% | 14% | 16% | 5% | 2% | 37% |
| Indiana | 6,340,000 | 82% | 9% | 5% | 1% | 2% | 18% |
| Iowa | 3,017,000 | 86% | 3% | 6% | 2% | 2% | 14% |
| Kansas | 2,796,000 | 78% | 6% | 10% | 3% | 4% | 22% |
| Michigan | 9,714,000 | 77% | 14% | 4% | 3% | 2% | 23% |
| Minnesota | 5,314,000 | 83% | 5% | 5% | 5% | 2% | 17% |
| Missouri | 5,924,000 | 81% | 11% | 3% | 2% | 4% | 19% |
| Nebraska | 1,834,000 | 79% | 4% | 11% | 3% | 3% | 21% |
| North Dakota | 679,000 | 84% | 1% | 3% | 1% | 11% | 16% |
| Ohio | 11,349,000 | 81% | 12% | 4% | 2% | 2% | 19% |
| South Dakota | 815,000 | 84% | 1% | 4% | — | 10% | 16% |
| Wisconsin | 5,661,000 | 83% | 5% | 7% | 2% | 3% | 17% |
| WEST | 72,769,000 | 52% | 4% | 30% | 10% | 4% | 48% |
| Alaska | 697,000 | 67% | 2% | 8% | 9% | 15% | 33% |
| Arizona | 6,579,000 | 54% | 4% | 34% | 3% | 4% | 46% |
| California | 37,722,000 | 40% | 6% | 39% | 13% | 2% | 60% |
| Colorado | 5,076,000 | 71% | 4% | 20% | 3% | 2% | 29% |
| Hawaii | 1,327,000 | 18% | 1% | 11% | 52% | 18% | 82% |
| Idaho | 1,580,000 | 82% | — | 13% | 2% | 2% | 18% |
| Montana | 990,000 | 89% | — | 3% | — | 7% | 11% |
| Nevada | 2,703,000 | 51% | 8% | 27% | 9% | 4% | 49% |
| New Mexico | 2,048,000 | 42% | 1% | 45% | 3% | 9% | 58% |
| Oregon | 3,863,000 | 78% | 2% | 11% | 5% | 4% | 22% |
| Utah | 2,822,000 | 81% | 1% | 12% | 3% | 2% | 19% |
| Washington | 6,794,000 | 71% | 3% | 11% | 10% | 6% | 29% |
| Wyoming | 568,000 | 86% | — | 9% | — | 4% | 14% |
| SOUTH | 115,113,000 | 59% | 19% | 17% | 3% | 3% | 41% |
| Alabama | 4,776,000 | 67% | 26% | 4% | 1% | 2% | 33% |
| Arkansas | 2,906,000 | 75% | 15% | 5% | 3% | 2% | 25% |
| Delaware | 899,000 | 65% | 20% | 10% | 4% | 2% | 35% |
| District of Columbia | 625,000 | 36% | 48% | 10% | 4% | 1% | 64% |
| Florida | 19,045,000 | 58% | 15% | 22% | 3% | 2% | 42% |
| Georgia | 9,620,000 | 56% | 30% | 8% | 4% | 2% | 44% |
| Kentucky | 4,315,000 | 85% | 7% | 4% | 1% | 2% | 15% |
| Louisiana | 4,478,000 | 62% | 31% | 4% | — | — | 38% |
| Maryland | 5,832,000 | 53% | 28% | 9% | 7% | 2% | 47% |
| Mississippi | 2,907,000 | 58% | 37% | 2% | — | — | 42% |
| North Carolina | 9,523,000 | 63% | 21% | 8% | 3% | 4% | 37% |
| Oklahoma | 3,727,000 | 65% | 7% | 8% | 1% | 19% | 35% |
| South Carolina | 4,629,000 | 66% | 28% | 4% | 1% | 2% | 34% |
| Tennessee | 6,337,000 | 75% | 16% | 5% | 2% | 2% | 25% |
| Texas | 25,774,000 | 42% | 11% | 41% | 4% | 1% | 58% |
| Virginia | 7,908,000 | 65% | 19% | 7% | 6% | 3% | 35% |
| West Virginia | 1,812,000 | 93% | 3% | 1% | — | 2% | 7% |
| NOTE: Data may not sum to 100% due to rounding and data restrictions. SOURCE: KCMU/Urban Institute analysis of 2013 and 2012 ASEC Supplements to the CPS. |
|||||||
| Appendix Table 2: Selected Demographic Characteristics by Geographic Region, 2011-2012 | |||||
| Total | Northeast | Midwest | West | South | |
| Residence | |||||
| Metropolitan | 84% | 90% | 78% | 90% | 82% |
| Rural | 15% | 10% | 22% | 8% | 17% |
| Not Identifiable | 1% | NA | NA | 2% | 1% |
| Age | |||||
| 0-18 | 25% | 23% | 25% | 26% | 26% |
| 19-34 | 22% | 22% | 21% | 23% | 21% |
| 35-54 | 27% | 28% | 27% | 27% | 27% |
| 55-64 | 12% | 13% | 12% | 12% | 12% |
| 65+ | 14% | 15% | 14% | 12% | 14% |
| Citizenship Status | |||||
| U.S-Born Citizen | 87% | 84% | 93% | 81% | 89% |
| Naturalized Citizen | 6% | 8% | 3% | 9% | 5% |
| Non-Citizen | 7% | 8% | 4% | 10% | 7% |
| Parent Status of Nonelderly Adults (19-64) | |||||
| Parent | 34% | 32% | 34% | 35% | 34% |
| Not a Parent | 66% | 68% | 66% | 65% | 66% |
| Educational Attainment of Adults (19-64) | |||||
| Less than High School | 11% | 11% | 9% | 13% | 13% |
| High School Graduate | 29% | 29% | 32% | 25% | 31% |
| Some College/Assoc. Degree | 31% | 31% | 31% | 31% | 28% |
| College Grad or Greater | 30% | 30% | 28% | 30% | 27% |
| Employment Characteristics of Nonelderly | |||||
| Households with at Least 1 Full-time Worker | 76% | 77% | 77% | 75% | 77% |
| Share of Workers in Blue-Collar Job | 61% | 60% | 61% | 61% | 62% |
| Work in Small Firms (< 50 Workers) | 25% | 26% | 24% | 26% | 25% |
| Self-Employed | 8% | 8% | 8% | 10% | 8% |
| Public Sector Job | 14% | 14% | 13% | 14% | 15% |
| NOTE: Data may not sum to 100% due to rounding and data restrictions. SOURCE: KCMU/Urban Institute analysis of 2013 and 2012 ASEC Supplements to the CPS. |
|||||
| Appendix 3: Nonelderly Uninsured by Race/Ethnicity and State, 2011-2012 | ||||||
| Total | White | Black | Hispanic | Other | All People of Color | |
| UNITED STATES | 47,616,500 | 21,350,500 | 6,983,700 | 15,431,700 | 3,850,700 | 26,266,100 |
| NORTHEAST | 5,887,700 | 3,009,400 | 919,100 | 1,471,900 | 487,300 | 2,878,300 |
| Connecticut | 285,800 | 157,400 | 41,600 | 71,600 | — | 128,000 |
| Maine | 129,300 | 121,500 | — | — | — | — |
| Massachusetts | 242,900 | 160,300 | — | — | — | 83,000 |
| New Hampshire | 158,500 | 138,500 | — | — | 9,000 | 20,000 |
| New Jersey | 1,250,800 | 445,800 | 196,000 | 479,300 | 129,600 | 805,000 |
| New York | 2,220,900 | 913,600 | 406,000 | 655,400 | 245,900 | 1,307,000 |
| Pennsylvania | 1,426,900 | 956,700 | 234,900 | 179,400 | 55,800 | 470,000 |
| Rhode Island | 125,000 | 72,200 | 11,600 | 32,900 | 8,300 | 53,000 |
| Vermont | 47,800 | 43,400 | — | — | — | — |
| MIDWEST | 8,092,900 | 5,136,000 | 1,153,000 | 1,225,200 | 578,700 | 2,956,900 |
| Illinois | 1,772,400 | 783,600 | 345,400 | 534,300 | 109,100 | 989,000 |
| Indiana | 801,600 | 578,900 | 102,500 | 65,700 | 54,500 | 223,000 |
| Iowa | 301,500 | 230,400 | — | 41,400 | — | 71,000 |
| Kansas | 368,400 | 231,000 | 25,300 | 85,300 | 26,900 | 137,000 |
| Michigan | 1,110,500 | 773,300 | 181,500 | 106,600 | — | 337,000 |
| Minnesota | 462,500 | 297,900 | 44,800 | 63,200 | 56,600 | 165,000 |
| Missouri | 834,100 | 590,300 | 153,800 | — | 54,600 | 244,000 |
| Nebraska | 233,300 | 138,500 | — | 60,900 | 20,200 | 95,000 |
| North Dakota | 70,000 | 39,900 | — | — | 24,800 | 30,000 |
| Ohio | 1,460,800 | 1,029,500 | 217,000 | 128,800 | 85,500 | 431,000 |
| South Dakota | 111,300 | 71,300 | — | 12,400 | 25,300 | 40,000 |
| Wisconsin | 566,500 | 371,600 | 51,600 | 87,400 | 55,900 | 195,000 |
| WEST | 12,588,100 | 4,411,100 | 564,800 | 5,998,700 | 1,613,600 | 8,177,000 |
| Alaska | 129,400 | 71,500 | — | 11,800 | 43,800 | 58,000 |
| Arizona | 1,140,200 | 362,000 | — | 651,000 | 82,200 | 778,000 |
| California | 6,992,400 | 1,674,800 | 342,500 | 4,050,200 | 924,900 | 5,318,000 |
| Colorado | 736,900 | 391,400 | 48,000 | 260,100 | 37,400 | 345,000 |
| Hawaii | 102,200 | 20,900 | — | 13,900 | 66,000 | 81,000 |
| Idaho | 257,900 | 157,500 | — | 84,700 | — | 100,000 |
| Montana | 178,900 | 145,000 | — | — | 26,100 | 34,000 |
| Nevada | 620,800 | 235,400 | 61,800 | 247,800 | 75,800 | 385,000 |
| New Mexico | 421,700 | 112,000 | — | 216,500 | 88,400 | 310,000 |
| Oregon | 559,400 | 379,500 | — | 127,100 | 45,800 | 180,000 |
| Utah | 406,800 | 252,400 | — | 110,900 | 38,900 | 154,000 |
| Washington | 947,700 | 537,900 | 43,100 | 205,200 | 161,500 | 410,000 |
| Wyoming | 93,800 | 70,700 | — | 12,600 | 8,500 | 23,000 |
| SOUTH | 21,047,800 | 8,794,000 | 4,346,800 | 6,735,900 | 1,171,200 | 12,253,800 |
| Alabama | 660,700 | 365,100 | 208,500 | 73,100 | — | 296,000 |
| Arkansas | 510,400 | 340,000 | 88,400 | 53,200 | — | 170,000 |
| Delaware | 92,600 | 43,500 | 18,700 | 25,500 | — | 49,000 |
| District of Columbia | 49,800 | 10,100 | 27,300 | 9,400 | — | 40,000 |
| Florida | 3,866,700 | 1,657,200 | 752,800 | 1,280,400 | 176,200 | 2,209,000 |
| Georgia | 1,849,700 | 747,300 | 639,700 | 334,000 | 128,700 | 1,102,000 |
| Kentucky | 647,100 | 496,000 | 64,000 | 62,500 | — | 151,000 |
| Louisiana | 866,300 | 382,900 | 384,300 | 77,100 | — | 483,000 |
| Maryland | 755,900 | 277,700 | 226,900 | 181,300 | 70,100 | 478,000 |
| Mississippi | 453,600 | 197,900 | 227,700 | — | — | 256,000 |
| North Carolina | 1,593,300 | 740,700 | 384,100 | 346,600 | 121,900 | 853,000 |
| Oklahoma | 633,100 | 346,000 | 44,000 | 94,000 | 149,100 | 287,000 |
| South Carolina | 765,300 | 436,800 | 245,600 | 68,500 | — | 328,000 |
| Tennessee | 849,600 | 532,600 | 166,400 | 126,700 | — | 317,000 |
| Texas | 6,166,600 | 1,509,300 | 588,200 | 3,794,000 | 275,200 | 4,657,000 |
| Virginia | 1,020,500 | 471,400 | 266,800 | 191,200 | 91,200 | 549,000 |
| West Virginia | 266,700 | 239,400 | — | — | — | 27,000 |
| NOTE: Data may not sum to 100% due to rounding and data restrictions. SOURCE: KCMU/Urban Institute analysis of 2013 and 2012 ASEC Supplements to the CPS. |
||||||
| Appendix Table 4: Nonelderly Uninsured Rate by Race/Ethnicity and State, 2011-2012 | ||||||
| Total | White | Black | Hispanic | Other | All People of Color | |
| UNITED STATES | 18% | 13% | 21% | 31% | 17% | 25% |
| NORTHEAST | 13% | 10% | 17% | 21% | 13% | 18% |
| Connecticut | 10% | 8% | 14% | 18% | — | 14% |
| Maine | 12% | 12% | — | — | — | — |
| Massachusetts | 4% | 4% | — | — | — | 5% |
| New Hampshire | 14% | 13% | — | — | 20% | 22% |
| New Jersey | 17% | 11% | 21% | 29% | 18% | 24% |
| New York | 13% | 10% | 17% | 20% | 14% | 18% |
| Pennsylvania | 13% | 11% | 19% | 26% | 12% | 20% |
| Rhode Island | 14% | 11% | 21% | 25% | 17% | 23% |
| Vermont | 9% | 9% | — | — | — | — |
| MIDWEST | 14% | 12% | 19% | 27% | 17% | 21% |
| Illinois | 16% | 12% | 22% | 27% | 14% | 23% |
| Indiana | 15% | 13% | 20% | 20% | 27% | 21% |
| Iowa | 12% | 10% | — | 23% | — | 18% |
| Kansas | 15% | 13% | 17% | 33% | 15% | 23% |
| Michigan | 13% | 12% | 16% | 27% | — | 17% |
| Minnesota | 10% | 8% | 16% | 26% | 15% | 19% |
| Missouri | 16% | 15% | 25% | — | 19% | 23% |
| Nebraska | 15% | 11% | — | 30% | 20% | 25% |
| North Dakota | 12% | 8% | — | — | 30% | 28% |
| Ohio | 15% | 13% | 18% | 33% | 23% | 22% |
| South Dakota | 16% | 12% | — | 37% | 31% | 32% |
| Wisconsin | 12% | 9% | 19% | 24% | 19% | 21% |
| WEST | 20% | 14% | 20% | 30% | 18% | 25% |
| Alaska | 20% | 17% | — | 23% | 29% | 26% |
| Arizona | 20% | 13% | — | 31% | 18% | 28% |
| California | 21% | 14% | 19% | 29% | 17% | 25% |
| Colorado | 17% | 13% | 26% | 28% | 15% | 25% |
| Hawaii | 9% | 11% | — | 10% | 9% | 9% |
| Idaho | 19% | 15% | — | 42% | — | 37% |
| Montana | 22% | 20% | — | — | 38% | 33% |
| Nevada | 27% | 21% | 31% | 35% | 23% | 31% |
| New Mexico | 24% | 17% | — | 26% | 39% | 29% |
| Oregon | 17% | 15% | — | 31% | 14% | 23% |
| Utah | 16% | 12% | — | 34% | 25% | 31% |
| Washington | 16% | 13% | 21% | 28% | 17% | 22% |
| Wyoming | 19% | 17% | — | 26% | 38% | 30% |
| SOUTH | 21% | 16% | 22% | 38% | 19% | 28% |
| Alabama | 16% | 14% | 18% | 42% | — | 20% |
| Arkansas | 21% | 19% | 23% | 34% | — | 26% |
| Delaware | 12% | 9% | 12% | 29% | — | 17% |
| District of Columbia | 9% | 5% | 11% | 15% | — | 11% |
| Florida | 25% | 19% | 29% | 34% | 23% | 31% |
| Georgia | 22% | 16% | 24% | 43% | 23% | 28% |
| Kentucky | 17% | 16% | 22% | 38% | — | 25% |
| Louisiana | 22% | 17% | 30% | 41% | — | 31% |
| Maryland | 15% | 11% | 15% | 37% | 14% | 19% |
| Mississippi | 18% | 14% | 23% | — | — | 23% |
| North Carolina | 20% | 15% | 21% | 44% | 19% | 26% |
| Oklahoma | 20% | 18% | 18% | 31% | 22% | 23% |
| South Carolina | 19% | 17% | 21% | 39% | — | 22% |
| Tennessee | 16% | 13% | 17% | 45% | — | 22% |
| Texas | 27% | 17% | 22% | 39% | 20% | 33% |
| Virginia | 15% | 11% | 20% | 36% | 15% | 22% |
| West Virginia | 17% | 17% | — | — | — | 24% |
| NOTE: ” –” Not sufficient data for a reliable estimate. Data may not sum to 100% due to rounding and data restrictions. SOURCE: KCMU/Urban Institute analysis of 2013 and 2012 ASEC Supplements to the CPS. |
||||||
| Appendix Table 5: Medicaid/CHIP Income Eligibility Limits as a Percent of the Federal Poverty Level, by Region and State as of January 2014 |
||||
| Children | Pregnant Women | Parents (in a family of three) |
Childless Adults (for an individual) |
|
| NORTHEAST | ||||
| Connecticut | 323% | 263% | 201% | 138% |
| Maine | 213% | 214% | 105% | 0% |
| Massachusetts | 305% | 205% | 138% | 138% |
| New Hampshire | 323% | 201% | 75% | 0% |
| New Jersey | 355% | 199%/205% | 138% | 138% |
| New York | 405% | 223% | 138% | 138% |
| Pennsylvania | 319% | 220% | 38% | 0% |
| Rhode Island | 266% | 195%/258% | 138% | 138% |
| Vermont | 318% | 213% | 138% | 138% |
| Median | 319% | 214% | 138% | 138% |
| MIDWEST | ||||
| Illinois | 318% | 213% | 138% | 138% |
| Indiana | 255% | 213% | 24% | 0% |
| Iowa | 380% | 380% | 138% | 138% |
| Kansas | 250% | 171% | 38% | 0% |
| Michigan | 217% | 200% | 138% | 138% |
| Minnesota | 288% | 283% | 205% | 205% |
| Missouri | 305% | 210% | 24% | 0% |
| Nebraska | 218% | 199% | 55% | 0% |
| North Dakota | 175% | 152% | 138% | 138% |
| Ohio | 211% | 205% | 138% | 138% |
| South Dakota | 209% | 138% | 54% | 0% |
| Wisconsin | 306% | 306% | 100% | 100% |
| Median | 253% | 208% | 119% | 119% |
| WEST | ||||
| Alaska | 208% | 205% | 128% | 0% |
| Arizona | 205% (closed) | 161% | 138% | 138% |
| California | 266% | 213% | 138% | 138% |
| Colorado | 265% | 200%/265% | 138% | 138% |
| Hawaii | 313% | 196% | 138% | 138% |
| Idaho | 190% | 138% | 27% | 0% |
| Montana | 266% | 164% | 52% | 0% |
| Nevada | 205% | 164% | 138% | 138% |
| New Mexico | 305% | 255% | 138% | 138% |
| Oregon | 305% | 190% | 138% | 138% |
| Utah | 205% | 144% | 47% | 0% |
| Washington | 305% | 198% | 138% | 138% |
| Wyoming | 205% | 159% | 59% | 0% |
| Median | 265% | 177% | 138% | 138% |
| SOUTH | ||||
| Alabama | 317% | 146% | 16% | 0% |
| Arkansas | 216% | 214% | 138% | 138% |
| Delaware | 217% | 214% | 138% | 138% |
| District of Columbia | 324% | 324% | 221% | 215% |
| Florida | 215% | 196% | 35% | 0% |
| Georgia | 252% | 225% | 39% | 0% |
| Kentucky | 218% | 200% | 138% | 138% |
| Louisiana | 255% | 214% | 24% | 0% |
| Maryland | 322% | 264% | 138% | 138% |
| Mississippi | 214% | 199% | 29% | 0% |
| North Carolina | 216% | 201% | 45% | 0% |
| Oklahoma | 210% | 138% | 48% | 0% |
| South Carolina | 213% | 199% | 67% | 0% |
| Tennessee | 255% | 200% | 111% | 0% |
| Texas | 206% | 203% | 19% | 0% |
| Virginia | 205% | 148% | 52% | 0% |
| West Virginia | 305% | 163% | 138% | 138% |
| Median | 217% | 200% | 52% | 0% |
|
Eligibility thresholds include the standard five percentage point of the federal poverty level disregard. For states with two levels listed, the value before the slash is the eligibility limit for pregnant women in Medicaid. |
||||
Endnotes
Issue Brief
Profile of the Southern Population Today
KCMU/Urban Institute analysis of 2013 and 2012 ASEC Supplements to the CPS.
United States Census Bureau. 2005 Interim State Population Projections. “Percent change in population by region of the United Stats for five-year periods: 2000 to 2030.” http://www.census.gov/population/projections/data/state/projectionsagesex.html
KCMU/Urban Institute analysis of 2013 and 2012 ASEC Supplements to the CPS.
Urban Institute tabulations of 2013 ASEC Supplement to the CPS.
KCMU/Urban Institute analysis of 2013 and 2012 ASEC Supplements to the CPS.
Ibid.
Ibid
Health Coverage and Care in the South Today
Ibid.
KCMU analysis of the Center for Disease Control and Prevention (CDC)'s Behavioral Risk Factor Surveillance System (BRFSS) 2012 Survey Results.
Ibid.
Health Coverage in the South in 2014
Based on data from Health Insurance Marketplace: March Enrollment Report, October 1, 2013 - March 1, 2014, Office of the Assistant Secretary for Planning and Evaluation (ASPE), Department of Health and Human Services (HHS); March 11, 2014 and State-by-State Estimates of the Number of People Eligible for Premium Tax Credits Under the Affordable Care Act, Kaiser Family Foundation, November 5, 2013. https://www.kff.org/health-reform/state-indicator/marketplace-enrollment-as-a-share-of-the-potential-marketplace-population/#
Kaiser Family Foundation. “State of State Action on the Medicaid Expansion Decision, 2014” https://www.kff.org/health-reform/state-indicator/state-activity-around-expanding-medicaid-under-the-affordable-care-act/.
CMS, Medicaid & CHIP Monthly Applications, Eligibility Determinations, and Enrollment Reports: March 2014 (Updated) and April 2014; accessed June 4, 2014.
For more detail on the fiscal implications of the Medicaid expansion see: Kaiser Commission on Medicaid and the Uninsured. “The Cost of Not Expanding Medicaid.” July 2013. https://www.kff.org/medicaid/report/the-cost-of-not-expanding-medicaid/
For more detail on Medicaid coverage for immigrants, see: http://www.kff.org/disparities-policy/fact-sheet/key-facts-on-health-coverage-for-low/.
Kaiser Commission on Medicaid and the Uninsured. “Medicaid Eligibility, Enrolment Simplification and Coordination under the Affordable Care Act: A Summary of CMS’s March 23, 2012 Final Rule.” December 2012. https://www.kff.org/medicaid/issue-brief/medicaid-eligibility-enrollment-simplification-and-coordination-under-the-affordable-care-act-a-summary-of-cmss-march-23-2012-final-rule/
Heberlein, M. et al. “Performing Under Pressure: Annual Findings of a 50-State Survey of Eligibility, Enrollment, Renewal, and Cost-Sharing Policies in Medicaid and CHIP, 2011-2012. https://www.kff.org/medicaid/report/performing-under-pressure-annual-findings-of-a/
“Supra, J. “South Carolina’s Experience Implementing Express Lane Redeterminations.” Presentation. November 1, 2011. http://www.insurekidsnow.gov/professionals/events/2011_conference/ele-jsupra.pdf
Kaiser Commission on Medicaid and the Uninsured. “Using Data and Technology to Drive Process Improvement in Medicaid and CHIP: Lessons from South Carolina.” March 2012. https://www.kff.org/medicaid/fact-sheet/using-data-and-technology-to-drive-process/
Batts, D. “Improving Retention in Louisiana.” Presentation for Kaiser Family Foundation Webinar, Stop the Drop: Profiles of Innovative Medicaid Renewal Initiative and Lesson for 2014 and Beyond. May 14, 2013. https://www.kff.org/medicaid/event/stop-the-drop-profiles-of-innovative-medicaid-renewal-initiatives-and-lessons-for-2014-and-beyond/
Guyer, J. et al, “Fast Track to Coverage: Facilitating Enrollment of Eligible People into the Medicaid Expansion,” Kaiser Commission on Medicaid and the Uninsured, November 2013.
Translating Coverage to Care: Delivery Systems and the Safety Net
Riley, P., J. Berenson, and C. Dermody. “How the Affordable Care Act Supports a High-Performance Safety Net.” Commonwealth Fund. January 2012. http://www.commonwealthfund.org/Blog/2012/Jan/Affordable-Care-Act-Safety-Net.aspx
AANC 2012
Controlling Health Care Spending in Massachusetts: An Analysis of Options, RAND, 2009. http://www.rand.org/content/dam/rand/pubs/technical_reports/2009/RAND_TR733.pdf
National Association of Community Health Centers, 2012. Population data based KCMU/Urban Institute analysis of 2013 and 2012 ASEC Supplements to the CPS.
Centers for Medicare and Medicaid Services, Rural Health Center, Medicare Certified Rural Health Clinics as of 1/9/201
HCUP Nationwide Inpatient Sample (NIS), 2011, Agency for Healthcare Research and Quality (AHRQ), based on data collected by individual States and provided to AHRQ by the States.
National Association of Community Health Centers, 2012. Population data based KCMU/Urban Institute analysis of 2013 and 2012 ASEC Supplements to the CPS.