Community Health Centers’ Experiences in a More Mature ACA Market
Executive Summary
Community health centers provide comprehensive primary care services in some of the most underserved communities in the nation. Four years following implementation of the ACA’s coverage expansions, health centers continue to play a central role in connecting consumers to expanded Medicaid and marketplace coverage even as they faced challenges during the 2018 marketplace open enrollment period because of the administration’s decision to shorten the enrollment period to six weeks, reduce advertising funding, and reduce federal Navigator funding. In addition, in response to improved financing from having more insured patients as well enhanced federal grant support under the ACA, health centers have also experienced significant growth in their service capacity. This brief summarizes findings from the Kaiser Family Foundation/Geiger Gibson Program in Community Health Policy 2018 Health Center Survey to provide a snapshot of health centers’ outreach and enrollment activities as well as changes in service capacity, and overall financial condition since implementation of the ACA. Key findings include:
- Most health centers took steps to prepare for the shorter open enrollment period in effect in most states. Nearly four in five health centers took some action, including contacting consumers ahead of November 1st to inform them of the shortened enrollment period and increasing outreach activities.
- The majority of health centers employed the same level of outreach and enrollment staff as last year and served about the same number or more people seeking enrollment assistance. Two-thirds of health centers indicated that the number of full time equivalent (FTE) paid enrollment assistance staff had stayed about the same since the last open enrollment period, but 21% said staffing had decreased. Despite arguments from policymakers that the need for in-person assistance would diminish, over seven in ten health centers reported serving the same number or more people seeking enrollment assistance during the most recent open enrollment period.
- Many health centers received state or federal navigator funding and some experienced reductions in that funding. Funding for outreach and enrollment activities is included in the federal Section 330 grants health centers receive. In addition, about four in ten health centers reported receiving state or federal navigator funding in 2018. Of those, 34% said their funding had been cut compared to the previous year. In response to these funding cuts, nearly a third said they reduced staff and 27% reduced the number of outreach activities.
- Health centers’ support for patients applying for Medicaid remained strong, while assistance with marketplace applications stayed about the same or decreased. Over four in ten health centers said they provided assistance for more new Medicaid applications in calendar year 2017 compared to 2016, and 34% said they helped with more Medicaid renewals. In contrast, less than a quarter of health centers said they helped with more new marketplace applications during the 2018 open enrollment period compared to the 2017 enrollment period, and only 26% said they assisted with more marketplace renewals.
- Health centers are continuing to expand their services and staffing. The most commonly reported increases for services and staffing in the past year were for mental health services and staff, substance use disorder treatment services and staff, chronic care management services, and dental services and staff.
- Most health centers experienced stable or improved financing from key revenue sources in the past year. Nearly half of health centers reported increases in their Medicaid revenue in the past year and an additional 38% reported that their Medicaid revenue did not change. Following the delay in reauthorizing the Community Health Center Fund in 2017, most health centers reported an increase or no change in their federal grant funding in the past year. Importantly, though, about 20% of health centers experienced a decrease in their federal grant funding.
- Health centers reported increasing financial pressure on privately insured patients and lapses in coverage for Medicaid and privately insured patients. More than half of health centers reported increases in insured patients who are unable to afford their cost-sharing payments and deductibles. Roughly a third of health centers reported that the percentage of privately insured and Medicaid/CHIP patients with lapses in coverage also increased compared to last year.
- Workforce recruitment, inadequate physical space, and insufficient grant funding are top challenges for health centers. Workforce recruitment is a consistent challenge for health centers and was ranked as a top-three challenge by nearly six in ten health centers. Other commonly-reported top-three challenges were inadequate physical space (36%) and insufficient grant funding (32%) and, among health centers in non-expansion states, high numbers of uninsured patients (42%).
Issue Brief
Introduction
Community health centers provide comprehensive primary care services in some of the most underserved communities in the nation. In 2017, 1,373 health centers operated in over 11,000 sites and served nearly 27.2 million patients.1 Four years following implementation of the ACA’s coverage expansions, health centers continue to play a central role in connecting consumers to expanded Medicaid and marketplace coverage and have experienced significant growth in their service capacity. Assisting community members enroll in health insurance programs for which they may be eligible has long been a core feature of the health centers program. Building on this commitment, health centers have been actively engaged in the outreach and enrollment efforts under the ACA. In addition, growing revenue associated with improved insurance coverage of health center patients combined with increased grant funding under the ACA, bolstered health centers’ overall financial capacity, enabling them to expand much needed services.2 At the same time, health centers face serious challenges that reflect the poverty and health risks that characterize their patients, challenges related to recruiting sufficient clinical and administrative staff into seriously medically underserved urban and rural communities, and reliance on two key revenue sources – federal grant funding and Medicaid – that remain vulnerable to political and policy uncertainties.
Health centers faced particular challenges during the most recent open enrollment period. The open enrollment period was shortened in most states3 (ending on December 15, 2017 instead of January 31, 2018), although nine states that run their own marketplaces extended the open enrollment period beyond December 15, 2017.4 In addition, the administration cut the federal government’s advertising budget by 90%, halted Department of Health and Human Services (HHS) staff’s participation in local enrollment events, and reduced navigator grant funding by about 40% below FY 2017 levels.5 Despite these changes, marketplace enrollment fell only slightly to 11.8 million for the 2018 open enrollment period from 12.2 million in 2017.6 At the same time, the Administration’s reduced ACA enrollment efforts increased the importance of health centers’ longstanding’ outreach and enrollment activities that predated the ACA.
This issue brief presents findings from the Kaiser Family Foundation and Geiger Gibson Program in Community Health Policy 2018 Health Center Survey to describe health centers’ experiences under the ACA. It provides a snapshot of health centers’ outreach and enrollment activities for the 2018 open enrollment period, describes strategies that health centers implemented to respond to the shortened open enrollment period, and compares the experiences of health centers in Medicaid expansion and non-expansion states. This brief also describes findings on overall operational and financial capacity as well as ongoing challenges.
Findings
Health Center Experiences with Outreach and Enrollment
Most health centers took steps to prepare for the shorter open enrollment period in effect in most states. Nearly eight in ten health centers reported taking some action to help them serve the same number of clients as in past years in half as much time. The most common actions were contacting patients ahead of November 1st to inform them of the shortened open enrollment period (45%) and increasing outreach events ahead of open enrollment (42%) (Figure 1). Other actions included increasing hours during open enrollment (32%) and developing educational materials to send to patients (30%). However, over 20% of health centers reported taking no actions in response to the shortened open enrollment period, and these health centers were located both in states that extended the open enrollment deadline beyond December 15th and in those that did not.
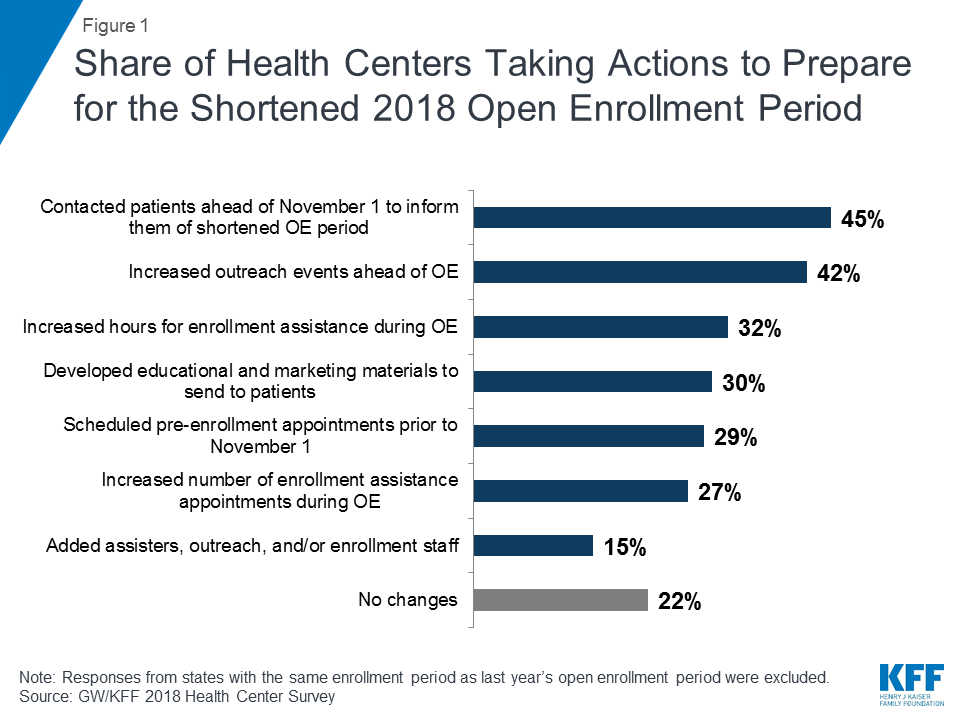
Health centers in Medicaid non-expansion states were significantly more likely to reach out to consumers in advance of the open enrollment period to schedule pre-enrollment appointments (36% vs. 24%) and to contact patients to inform them of the shortened open enrollment period (52% vs. 40%). They were also more likely to add additional outreach and enrollment staff (20% vs. 11%),
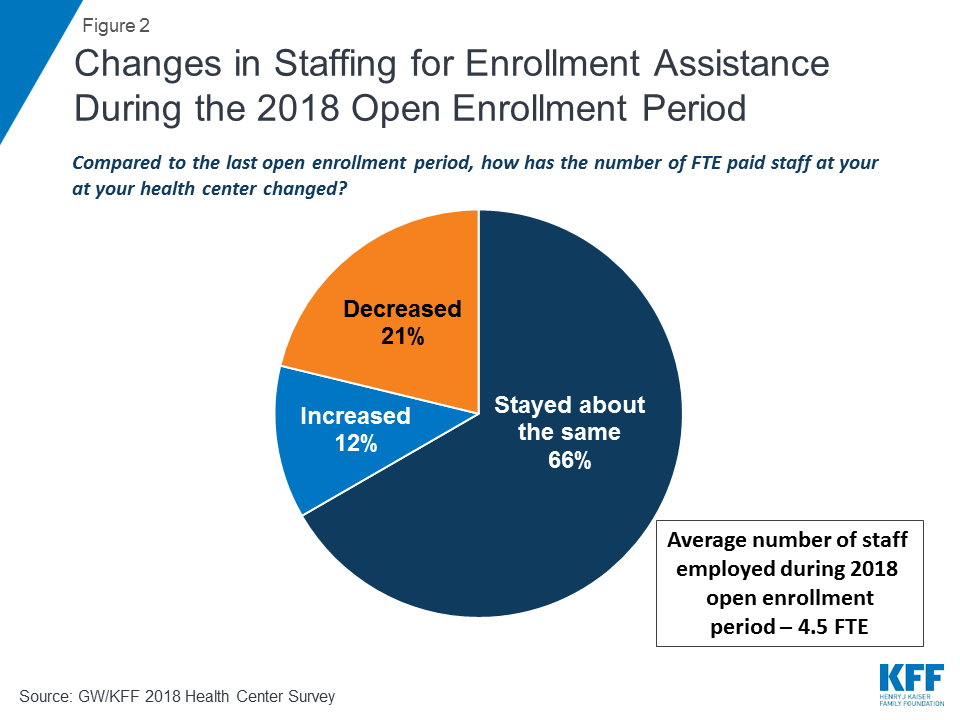
The majority of health centers were able to employ the same level of outreach and enrollment staff as last year. Two-thirds (66%) of health centers reported the number of full-time equivalent (FTE) paid enrollment assistance staff has stayed about the same since the last open enrollment period (Figure 2). On average, health centers employed 4.5 FTE enrollment assistance staff during the open enrollment period and 4.3 FTE staff throughout the year. Health centers in Medicaid expansion states employed more staff both during open enrollment and throughout the year than health centers in non-expansion states (5.0 FTE vs. 3.4 FTE during open enrollment and 4.9 vs. 3.1 FTE throughout the year).
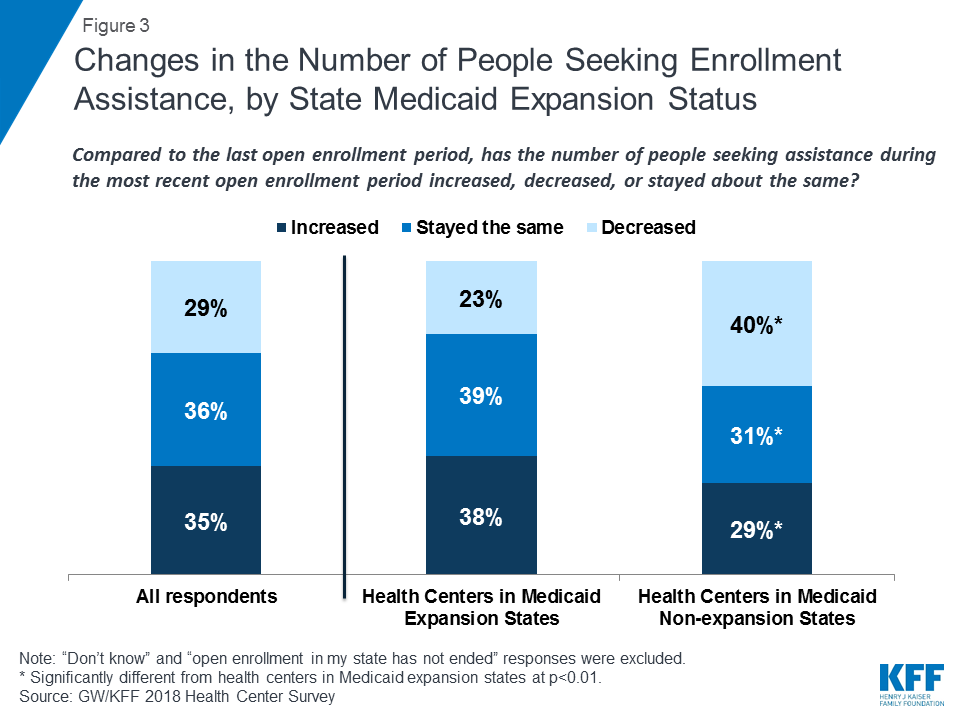
Compared to the previous open enrollment period, health centers served about the same number or more people seeking enrollment assistance. While some policymakers argued that the need for in-person assistance would diminish during the most recent open enrollment period as people became more familiar with how to apply for and enroll in coverage, a majority of health centers reported that the number of people seeking assistance was about the same as, or more than, last year. Thirty-five percent said the number of people needing help increased while 29% said the number had decreased (Figure 3). The experience differed in Medicaid expansion and non-expansion states. Over three-quarters (77%) of health centers in Medicaid expansion states said the number of people seeking assistance had increased or stayed the same compared to only 60% of health centers in non-expansion states.
Most health centers continued to participate in off-site outreach activities. Over nine in ten (93%) health centers indicated that they participated in off-site outreach activities. Among these health centers, nearly half (47%) reported similar participation in off-site outreach events this enrollment period compared to last year’s enrollment period, while 25% reported participating in more off-site activities than last year. Participating in off-site outreach events enables health center staff to reach consumers in the community who are not patients of the health center.
In addition to eligibility assistance, health centers’ outreach and enrollment staff provided a range of services to support consumers seeking health insurance. Nearly three-quarters (72%) of health centers reported counseling consumers on how to use insurance while over six in ten said they provided health insurance literacy counseling, assisted consumers with appeals of eligibility determinations, provided interpretation services, and assisted consumers with post-enrollment problems regarding billing or denied claims (Figure 4). These services are critical to ensuring consumers can understand and use their insurance to access the care they need. About half (52%) of health centers that reported offering these additional services said they spent about the same amount of time engaging in these activities compared to the last open enrollment period, and 34% reported spending more time.

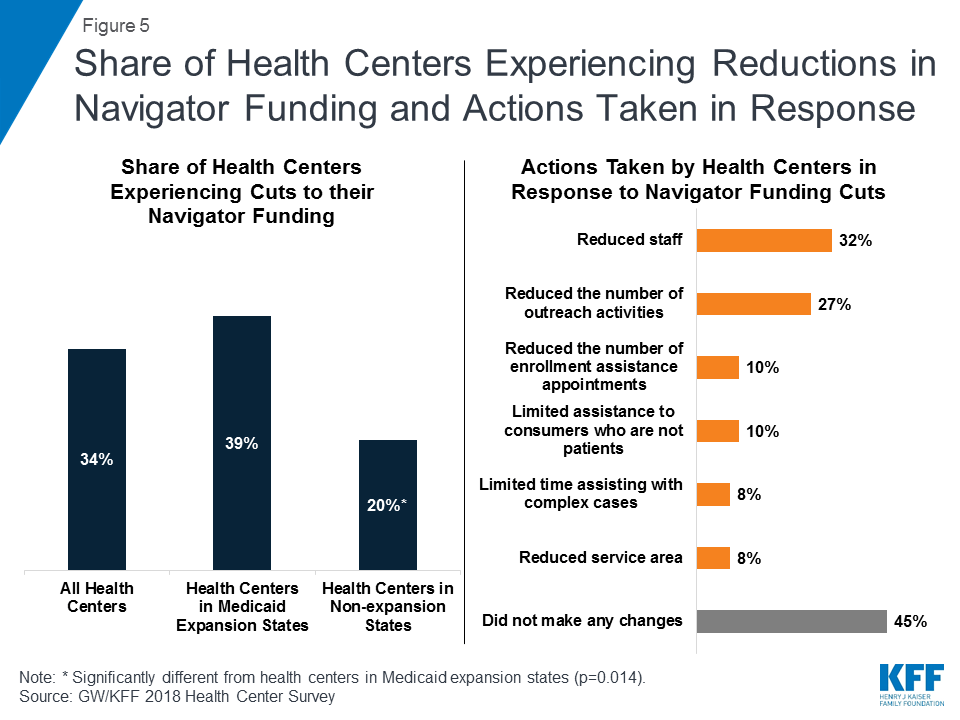
While funding for outreach and enrollment activities has been incorporated into health centers’ federal grants, many health centers received additional state or federal navigator grant funding and some experienced reductions in those grants. Because enrollment assistance is a requirement of all health centers, grants under Section 330 of the Public Health Service Act (which establishes the program) include modest funding for outreach and enrollment. In addition, about four in ten (38%) health centers also reported receiving navigator funding, either as a grantee or as a sub-grantee, to provide outreach and enrollment services (Figure 5). Of those that reported receiving this funding, over a third (34%) said that their funds were cut in the 2017-2018 funding year, with health centers in Medicaid expansion states twice as likely to report funding cuts as those in non-expansion states (39% versus 20%). Among health centers whose funding was cut, nearly half (45%) said they did not make any changes in response to the funding cuts. However, about a third (32%) said they reduced staff and 27% reduced the number of outreach activities and events.
Changes in New Applications and Coverage Renewals
Health centers’ support for patients applying for Medicaid remained strong and grew in both expansion and non-expansion states. Over four in ten (41%) health centers said they provided assistance for more new Medicaid applications in calendar year 2017 compared to calendar year 2016, and just over a third (34%) said they helped with more Medicaid renewals (Figure 6). In contrast, only 20% reported providing assistance for fewer new Medicaid applications and 14% said they helped with fewer Medicaid renewals in 2017. Health centers in Medicaid expansion states were more likely to report seeing increases in new Medicaid applications and renewals; however, health centers in non-expansion states also reported growth in the number of Medicaid applications. Almost half of health centers in Medicaid expansion states (44%) reported an increase in new Medicaid applications in 2017, while in non-expansion states, slightly over one-third (35%) of health centers reported an increase in Medicaid applications (Table 1). Additionally, over a third of health centers in Medicaid expansion states reported more renewals for Medicaid coverage in 2017 compared to about a quarter of health centers in non-expansion states.
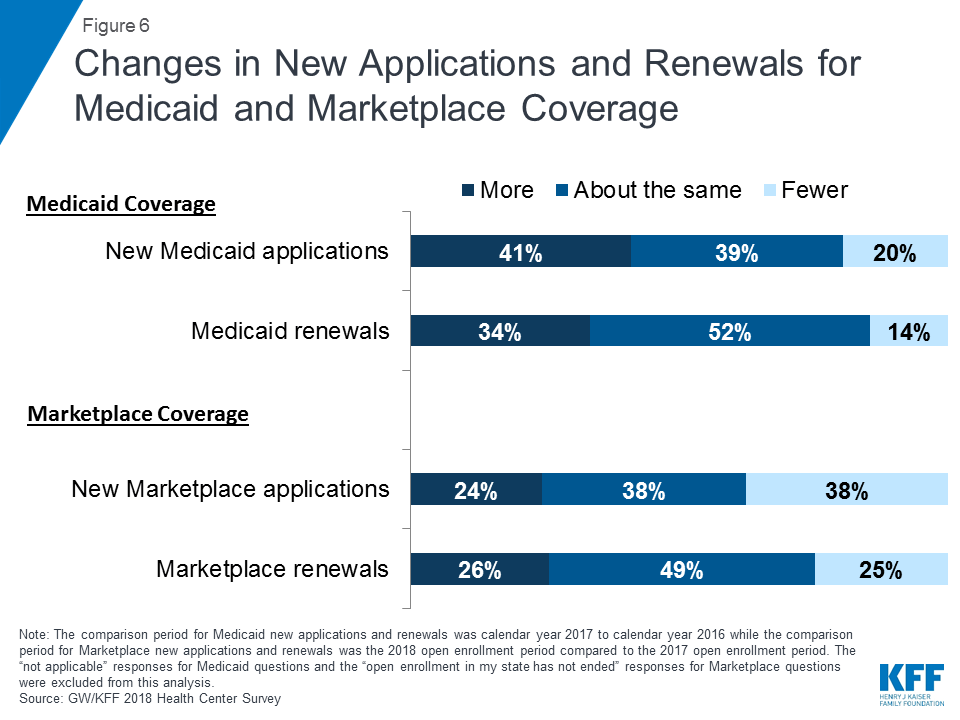
In contrast, assistance with marketplace applications and renewals stayed about the same or decreased during the most recent open enrollment period. Fewer than one in four health centers (24%) reported that they assisted with more new marketplace applications compared to the last open enrollment period, and just 26% said that marketplace renewals had increased (Figure 6). In contrast, 38% indicated they assisted with fewer new marketplace applications since last open enrollment. The drop-off was more significant in non-expansion states. A higher percentage of health centers in non-expansion states (45%) reported assisting with fewer new applications for marketplace coverage compared to health centers in Medicaid expansion states (33%). Nearly half of health centers (49%) indicated the number of marketplace renewals remained relatively stable while a quarter said they assisted with fewer marketplace renewals.
| Table 1. Changes in New Medicaid and Marketplace Applications and Renewals by State Medicaid Expansion Status | ||
| Medicaid Coverage1 | Health Centers in MedicaidExpansion States | Health Centers in MedicaidNon-expansion States |
| New Medicaid Coverage Applications* | ||
| More than last calendar year | 44% | 35% |
| Fewer than last calendar year | 22% | 15% |
| About the same as last calendar year | 34% | 49% |
| Medicaid Coverage Renewals* | ||
| More than last calendar year | 37% | 26% |
| Fewer than last calendar year | 15% | 14% |
| About the same as last calendar year | 48% | 61% |
| Marketplace Coverage2 | Health Centers in MedicaidExpansion States | Health Centers in MedicaidNon-expansion States |
| New Marketplace Coverage Applications* | ||
| More than last year’s open enrollment period | 25% | 24% |
| Fewer than last year’s open enrollment period | 33% | 45% |
| About the same as last year’s open enrollment period | 42% | 31% |
| Marketplace Coverage Renewals | ||
| More than last year’s open enrollment period | 25% | 27% |
| Fewer than last year’s open enrollment period | 24% | 26% |
| About the same as last year’s open enrollment period | 51% | 47% |
| * Distribution of responses for health centers in non-expansion states is significantly different from health centers in Medicaid expansion states at p<.05.1 “Not applicable” responses were excluded.2 “Open enrollment in my state has not ended” responses were excluded. | ||
General Health Center Capacity and Access
Fueled by the additional revenue flowing from patients’ improved insurance coverage coupled with growing grant funding under the ACA, health centers are continuing to expand their service capacity. A majority of health centers reported increased capacity for services they provided in the past year. Health centers were most likely to report expanding mental health and substance use disorder treatment services (70% and 69%, respectively) as well as mental health staff (67%) and substance use disorder treatment staff (60%) in the past year (Figure 7). Over half of health centers also reported expanding chronic care management services, dental services, and dental staff. Health centers in Medicaid expansion states were significantly more likely to report increased substance use disorder treatment services (74% versus 59%) in the past year, while health centers in non-expansion states were significantly more likely to report increased family planning staff (25% vs. 14%).

Health centers have taken additional steps to expand access to services, including increasing hours of operation, particularly in Medicaid expansion states, but some struggle to meet the increased demand for care. Almost four in ten health centers reported increasing the number of sites (39%) and hours of operation (36%) (Table 2). Health centers in Medicaid expansion states were significantly more likely to report increased hours of operation (41% versus 29 %) in the past year compared to health centers in non-expansion states. At the same time, health centers also reported increased pressure on access to care for their patients. Just under a third reported increased wait times for new patient appointments (32%) and increased wait times for follow-up appointments (27%), while nearly one in five (19%) reported longer waits in the waiting room for patients with appointments.
| Table 2. Share of Health Centers Reporting Efforts to Expand Access and Pressure on Access Increased in the Past Calendar Year by State Medicaid Expansion Status, 2018 | ||||
| All Health Centers | Health Centers in MedicaidExpansion States | Health Centers in MedicaidNon-expansion States | ||
| Expanded access | ||||
| Increased number of sites | 39% | 39% | 39% | |
| Increased hours of operation | 36% | 41% | 29%* | |
| Increased pressure on access | ||||
| Increased waits for new patient appointments | 32% | 30% | 35% | |
| Increased waits for follow-up appointments | 27% | 25% | 32% | |
| Increased waits in the waiting room | 19% | 18% | 20% | |
| * Significantly different from health centers in Medicaid expansion states at p<.05NOTE: Statistical significance is based the percentage reporting increased vs. decreased or no change. “Not applicable” responses were excluded from this analysis. | ||||
Health Center Financing
As a result of growing insurance coverage among their patients, most health centers experienced stable or improved financing from key revenue sources in the past year. Medicaid and Federal Section 330 grants are the most important revenue sources for most health centers, comprising over 60% of total revenues in 2017.7 As Medicaid coverage grew, nearly half (47%) of health centers reported increases in their Medicaid revenue in the past year and an additional 38% reported that their Medicaid revenue did not change (Figure 8). Following the Congressional delay in reauthorizing the Community Health Center Fund in 2017, most health centers reported an increase or no change in their federal grant funding in the past year. Importantly, though, about 20% of health centers experienced a decrease in their federal grant funding. For health centers that are particularly reliant on these grants to finance care to the uninsured, any reductions in funding can affect operations, and the uncertainties created by the delay in reauthorizing grant funds added to the pressures created by grant reliance. These findings were similar for health centers in expansion and non-expansion states.
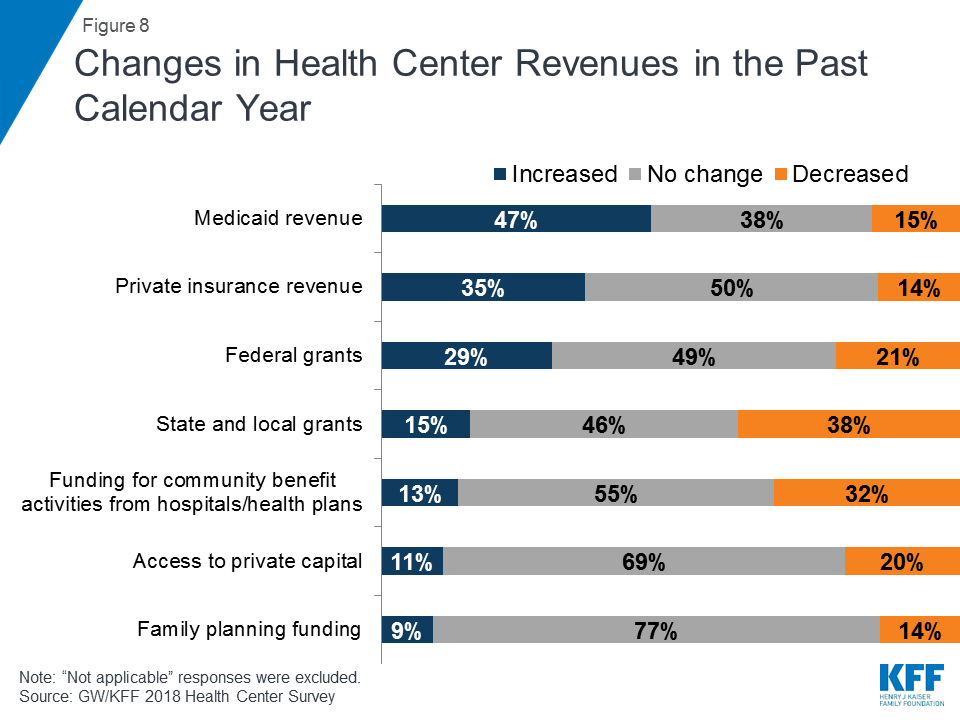
Revenue from private insurance also remained relatively stable. Approximately a third (35%) of health centers reported an increase in their private insurance revenues since last year, while 50% reported no change. Since implementation of the marketplaces in 2014 and as more low-income people have gained private coverage, all health centers, and particularly those in non-expansion states, have seen an increase in revenues from private insurance. Health centers in non-expansion states were significantly more likely to report increased private insurance revenue (44% versus 30%) in the past year compared to health centers in Medicaid expansion states.
Some health centers saw reductions in state and local funding. State and local grants represented about 7% of total revenues in 2017.8 Nearly four in ten (38%) health centers reported decreased revenue from state and local grants in the past year and nearly a third (32%) reported a drop in funding for community benefit activities from local hospitals and health plans (Figure 8). For some of these health centers, these losses may have been made up for by increases in other revenue sources.
Health Center Challenges
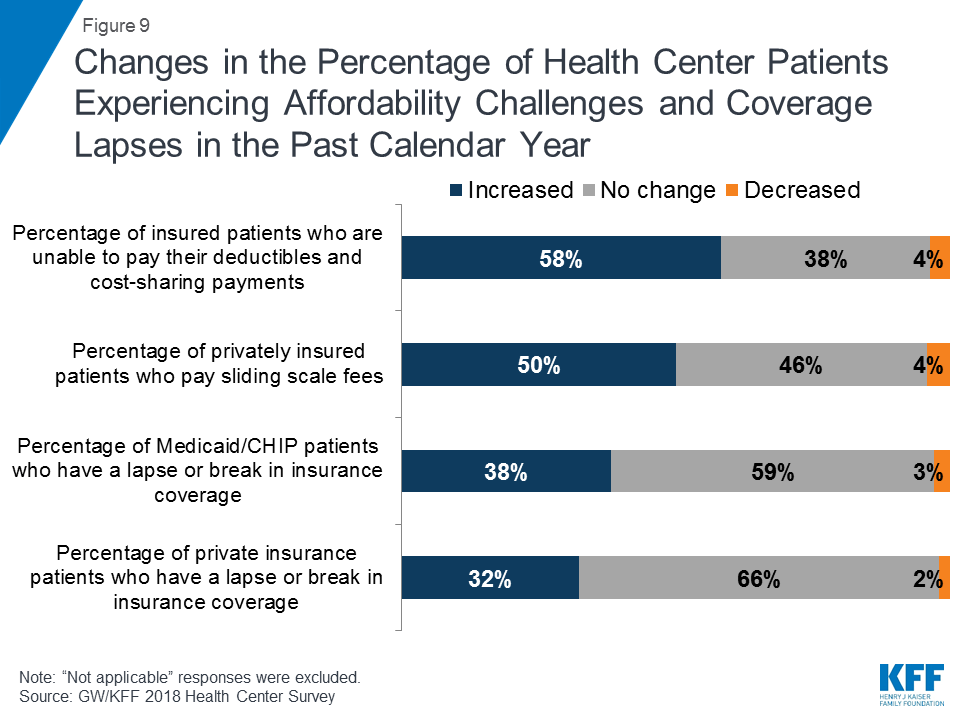
Health centers reported increasing financial pressure on privately insured patients. As a sign of the heightened vulnerability of low-income patients to rising out-of-pocket health care costs, more than half of health centers (58%) reported that the share of their insured patients who were unable to pay their deductibles and cost-sharing payments had increased in the past year. Additionally, half of health centers reported increases in privately insured patients who pay sliding scale fees, presumably for care that is subject to their insurance plans’ deductible or high cost-sharing (Figure 9). These trends have financial implications for health centers by increasing the need to rely on federal grant funding to finance these unreimbursed costs. About a third of health centers reported that the percentage of Medicaid/CHIP and privately insured patients with lapses in coverage also increased compared to last year.
Workforce recruitment and insufficient grant funding continue to be top challenges for health centers. Staffing has been a perennial challenge for health centers because of the inherent difficulties in recruiting sufficient staff to high-poverty communities. Nearly six in ten health centers (58%) said workforce recruitment was one of their top three challenges (Table 3). Given their location in rural and underserved communities, recruiting staff, especially as health centers seek to expand their services, remains a perennial problem. In 2016, workforce recruitment was also the most commonly reported top-three challenge.9 Other challenges facing health centers included inadequate physical space (36%), insufficient grant funding (32%), and high numbers of uninsured patients (26%). Health centers in non-expansion states were significantly more likely than health centers in Medicaid expansion states to rank as their top challenges high numbers of uninsured patients (42% versus 17%) and insufficient grant funding (38% versus 29%). Perhaps reflecting concern over efforts by a number of states to impose new work, premium, and other requirements on Medicaid enrollees, particularly expansion enrollees, health centers in Medicaid expansion states were significantly more likely to report changes to Medicaid eligibility criteria as one of the top three challenges facing their health center (15% versus 5%).
| Table 3. Share of Health Centers Ranking Selected Factors Among Their Top Three Challenges, by State Medicaid Expansion Status, 2018 | ||||
| Challenges | All Health Centers | Health Centers in MedicaidExpansion States | Health Centers in MedicaidNon-expansion States | |
| Workforce recruitment | 58% | 59% | 57% | |
| Inadequate physical space | 36% | 37% | 34% | |
| Insufficient grant funding | 32% | 29% | 38%* | |
| Workforce retention | 28% | 29% | 25% | |
| High numbers of uninsured patients | 26% | 17% | 42%* | |
| Changes to Medicaid reimbursement | 23% | 24% | 21% | |
| Insufficient insurance reimbursement | 20% | 21% | 18% | |
| Changes to Medicaid eligibility criteria | 11% | 15% | 5%* | |
| * Significantly different from health centers in Medicaid expansion states at p<.05Source: GW/KFF 2018 Health Center Survey | ||||
Discussion
Now four years out from the major expansions in Medicaid and marketplace coverage, health centers are continuing to expand their operational capacity amid a relatively stable financial situation. At the same time, health centers remain financially vulnerable because of reliance on funding sources that may be susceptible to policy and political uncertainties, as reflected in the delay in extending ACA grant funds. Consistent with their mission, health centers also report a strong presence in outreach and enrollment activities. Increased insurance coverage for health centers patients, along with enhanced federal grant funding through the ACA have contributed to a significantly improved financial picture for health centers. Health centers report that they are continuing to grow their capacity in terms of staffing, services, number of sites, and hours of operation. However, as they seek to expand capacity, health centers continue to face workforce recruitment challenges. Furthermore, while many health centers have experienced increased federal grant funding over the past four years (and 29% reported an increase in the past year), for some, particularly those in non-expansion states, the amount they receive is still insufficient to meet rising health care costs overall as well as the ongoing costs of caring for the uninsured. Together, these challenges create additional pressures and constraints on health centers’ ability to maintain their increased capacity to provide services, including their ability to provide outreach and enrollment support.
Health centers also continue to play an important role in outreach and enrollment assistance for low-income consumers. With funding for enrollment activities included in their federal grants, health centers have been able to maintain staffing and eligibility assistance at levels they had previously reported. As a result, health center staff were able to take steps to prepare their patients and community members for the shorter enrollment periods in effect in most states. They also continued to provide essential services beyond enrollment assistance, including counseling on health insurance literacy and how to use insurance, to ensure their clients are able to use their coverage to access needed health care services.
Looking ahead, health centers will remain critical sources of comprehensive primary care services as well as outreach and enrollment assistance in their communities. With the Community Health Center Fund reauthorized, and the ACA coverage expansions still in place, the financial situation of health centers will likely remain stable in the immediate term. However, the uncertainty over future funding remains; any delays in securing funding could cause disruptions to health center operations. Additionally, if the threat to repeal and replace the ACA resurfaces and the ACA were to be repealed, it would jeopardize future health center growth. Finally, 1115 Medicaid waiver proposals in several states to impose work requirements, premiums and cost-sharing, and time limits on benefits, will restrict Medicaid enrollment, which could lead to coverage losses among health center patients, and further add to the financial uncertainty facing community health centers.
Additional funding support for this brief was provided to the George Washington University by the RCHN Community Health Foundation.
Methods
The 2018 Survey of Community Health Centers’ Experiences and Activities under the Affordable Care Act was conducted by the Geiger Gibson Program in Community Health Policy at the George Washington University (GW) and the Kaiser Family Foundation Program on Medicaid and the Uninsured, with input from the National Association of Community Health Centers (NACHC). The purpose of this survey was to assess the experiences of community health centers in a more mature ACA market. The survey focused on three key issues: (i) health centers’ role in health insurance outreach and enrollment; (ii) how health centers are evolving under the ACA and the financial, professional, and patient care-related challenges they face; and (iii) how health centers are approaching the opioid crisis and the treatment options that are available. A report presenting findings on the role health centers play in addressing the opioid epidemic was published separately.
The online survey was emailed to all CEOs of federally funded community health centers (n=1,337) in the 50 states and the District of Columbia (DC) identified in the 2016 Uniform Data System (UDS), to which all health centers must report annually. The survey was fielded from early January to late February 2018. There were a total of 489 survey responses from 49 states and DC, resulting in a response rate of 37%. Survey respondents and non-respondents were compared on the basis of 2016 UDS variables. Comparisons of 2016 UDS data found no significant differences between survey respondents and non-respondents for location in rural or urban locations, location in Medicaid expansion states, the number of patients served and clinic visits, the percentage of patients who are low-income, the percentage of patients by insurance type, or average total revenue. However, there were significant differences by the percentage of patients who are racial/ethnic minorities, the ratio of total staff FTEs to 10,000 patients, and the total revenue per patient.
The survey data was weighted using 2016 UDS variables for total health center patients, the percentage of their patients reported as racial/ethnic minorities, and total revenue per patient. Bivariate analyses (t-tests and X2 tests) were conducted to test for significant differences by Medicaid expansion status. Findings are presented for all respondents and by location in states that expanded Medicaid and in non-expansion states.
Endnotes
- Bureau of Primary Health Care. (2018). 2017 Health Center Data: National Data. Rockville, MD: Health Resources and Services Administration. https://bphc.hrsa.gov/uds/datacenter.aspx?q=tall&year=2017&state=; number of sites based on a GW analysis of 2017 UDS data ↩︎
- Rosenbaum, S., Tolbert, J., Sharac, J., Shin, P., Gunsalus, R., & Zur. (2018). Community Health Centers: Growing Importance in a Changing Health Care System. Kaiser Family Foundation. https://modern.kff.org/medicaid/issue-brief/community-health-centers-growing-importance-in-a-changing-health-care-system/ ↩︎
- Nine states with state-run marketplaces extended the open enrollment period beyond December 15, 2017. ↩︎
- These states are CA (January 31, 2018), CO (January 12, 2018), CT (December 22, 2017), MA (January 23, 2018), MN (January 14, 2018), NY (January 31, 2018), RI (December 31, 2017), WA (January 15, 2018) and DC (January 31, 2018). ↩︎
- Pollitz, K., Tolbert, J., & Diaz, M. Data Note: Changes in 2017 Federal Navigator Funding. Kaiser Family Foundation. https://modern.kff.org/health-reform/issue-brief/data-note-changes-in-2017-federal-navigator-funding/ ↩︎
- Kaiser Family Foundation: State Health Facts. Changes in Marketplace Enrollment, 2017-2018. Data source: Marketplace Open Enrollment Period Public Use Files for February 2017 Effectuated Enrollment Snapshot and February 2018 Effectuated Enrollment Snapshot. Available at https://modern.kff.org/health-reform/state-indicator/change-in-marketplace-enrollment-2017-2018/?currentTimeframe=0&sortModel=%7B%22colId%22:%22Location%22,%22sort%22:%22asc%22%7D ↩︎
- GW analysis of data reported in the 2017 UDS National report. Bureau of Primary Health Care. (2018). 2017 Health Center Data: National Data. Rockville, MD: Health Resources and Services Administration. https://bphc.hrsa.gov/uds/datacenter.aspx?q=tall&year=2017&state= ↩︎
- Ibid. ↩︎
- Rosenbaum, S., Paradise, J., Markus, A. R., Sharac, J., Tran, C., Reynolds, D., & Shin, P. (2017). Community health centers: Recent growth and the role of the ACA. Kaiser Family Foundation. https://modern.kff.org/medicaid/issue-brief/community-health-centers-recent-growth-and-the-role-of-the-aca/ ↩︎