Individual Insurance Market Performance in Early 2020
Issue Brief
The coronavirus pandemic and the resulting economic downturn are likely to impact the individual insurance market in profound but complex ways. In this brief, we analyze first quarter data from 2011 through 2020 to examine how the individual insurance market performed under the Affordable Care Act (ACA) and during the first few months of the year, when the coronavirus pandemic was first emerging in the United States.
We use financial data reported by insurance companies to the National Association of Insurance Commissioners and compiled by Mark Farrah Associates to look at the average premiums, claims, medical loss ratios, gross margins, and enrollee utilization in the individual market. These figures include coverage purchased through the ACA’s exchange marketplaces and ACA-compliant plans purchased directly from insurers outside the marketplaces (which are part of the same risk pool), as well as individual plans originally purchased before the ACA went into effect.
We find that, on average, the individual market remained relatively stable through the first three months of 2020. Individual market insurers remained profitable, on average, as claims costs rose only slightly in the first three months of 2020. On average nationally, hospitalization rates, inpatient admissions, and physician encounters through March did not changed substantially compared to previous years. It is likely that the most significant impacts of the coronavirus outbreak and economic crisis on the individual market will not be evident nationally until data from the second and third quarters of 2020 become available.
Medical Loss Ratios
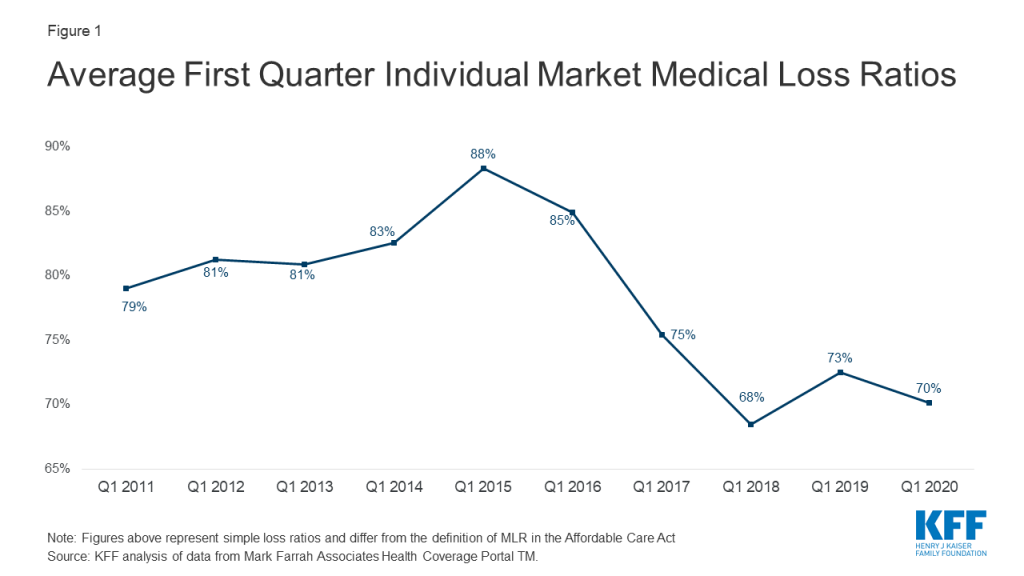
As we found in our previous analysis, insurer financial performance as measured by loss ratios (the share of health premiums paid out as claims) worsened in the earliest years of the ACA Marketplaces, but began to improve in recent years. This is to be expected, as the market had just undergone significant regulatory changes in 2014 and insurers had very little information to work with in setting their premiums.
The chart below shows simple loss ratios, which differ from the formula used in the ACA’s MLR provision.1 Loss ratios began to decline in 2016, suggesting improved financial performance. In 2017, following relatively large premium increases, individual market insurers saw significant improvement in loss ratios, a sign that individual market insurers on average were beginning to better match premium revenues to claims costs. Loss ratios continued to decline in 2018, averaging 68% through the first quarter, suggesting that insurers were able to build in the loss of cost-sharing subsidy payments when setting premiums and some insurers over-corrected. With such low ratios, insurers could not justify premium hikes for 2019, and loss ratios rebounded to average 73% in the first three months of 2019. In early 2020, medical loss ratios fell slightly, to an average of 70%. This decline reflects slow growth in claims costs, possibly due to cancelled elective procedures and routine care due to COVID-19 restrictions.
First quarter loss ratios tend to follow the same pattern as annual loss ratios, but in recent years have been between 2 and 10 percentage points lower than annual loss ratios (Figure 1).2
Gross Margins
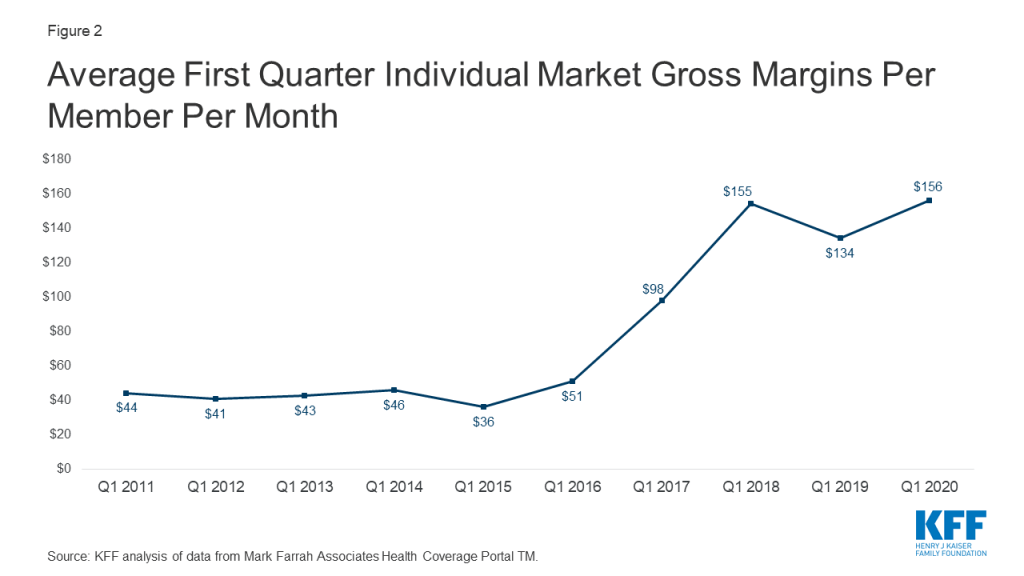
Another way to look at individual market financial performance is to examine average gross margins per member per month, or the average amount by which premium income exceeds claims costs per enrollee in a given month. Gross margins are an indicator of performance, but positive margins do not necessarily translate into profitability since they do not account for administrative expenses.
Gross margins show a similar pattern to loss ratios (Figure 2). Insurer financial performance improved through early 2018 and fell slightly in 2019 as premium growth moderated. Margins increased during the first three months of 2020 to an average of $156 per member per month, slightly above the previous high point of $155 in 2018. These data suggest that insurers in this market remain financially healthy, on average, even while the coronavirus outbreak emerged during the first three months of 2020.
Underlying Trends in Utilization
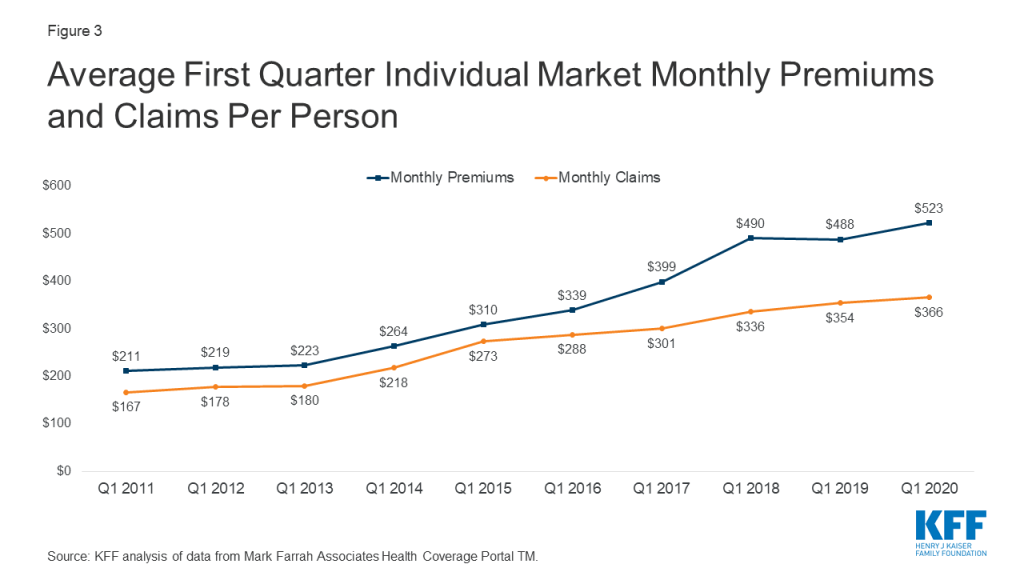
Some individual market insurers have seen high claims costs for those who needed testing or treatment for coronavirus, particularly as insurers are prohibited by law from charging patient cost-sharing for COVID-19 testing and some insurers have voluntarily waived cost-sharing for coronavirus-related treatment costs. However, insurers have also seen claims fall for elective procedures and routine care. On net, claims per enrollee grew by only 3% on average, while per person premiums grew by 7% during first quarter 2020 relative to the same period last year (Figure 3).
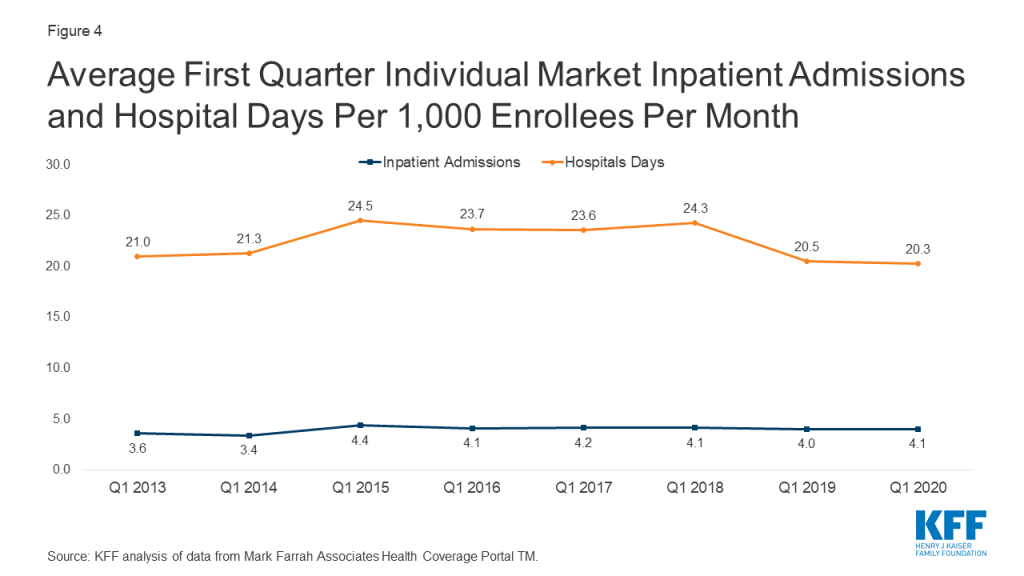
Similarly, several competing forces affected health care utilization among those enrolled in the individual market through the first three months of 2020. Enrollees who contracted coronavirus often had lengthy hospital stays or several physician encounters for COVID-19 testing and treatment. However, in many cases, routine health care was delayed or forgone and hospitals delayed or canceled elective procedures. On net, average hospital days per month and average inpatient admissions remained essentially unchanged in early 2020, compared with 2019 (Figure 4).
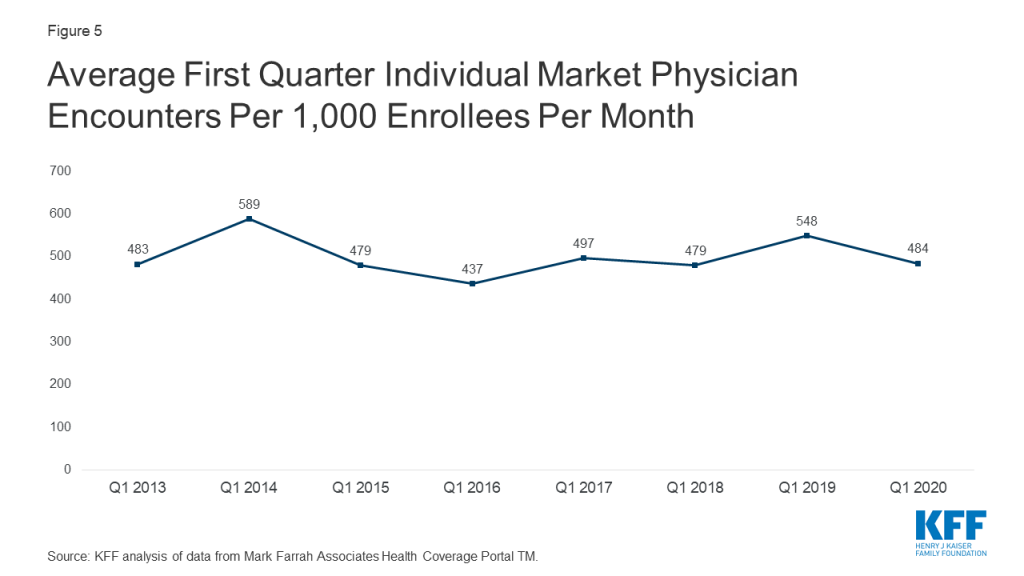
Average physician encounters in the individual market were lower in the first quarter of 2020 than in 2019, falling to 484 encounters per 1,000 enrollees per month (Figure 5). This drop may reflect routine care that was delayed or cancelled due to coronavirus, but the decrease is within the variation seen in previous years.
Discussion
Data from the first three months of 2020 suggest that the individual market had not yet been severely impacted by the coronavirus pandemic or the economic crisis as of March, but there are reasons to suspect more significant changes in the second and third quarters. Enrollment in individual market plans may have increased since March, as people losing job-based coverage may have moved onto the individual market. CMS recently reported that, since the end of the open enrollment period in December, 487,000 consumers have enrolled in plans through HealthCare.gov after qualifying for a Special Enrollment Period (SEP) following the loss other qualifying health coverage. Second quarter data for 2020 may also show more changes in utilization among individual market enrollees, as other data have shown health care utilization dropped sharply in late March through Mid-April due to social distancing and fears of contracting the virus, although some services began to return by late-April and May.
Insurers have begun to submit their 2021 premiums to state regulators for review. Most insurers have said they expect the pandemic to have complex effects on premiums, but many do not yet have a specific estimate of how much premiums might change due to COVID-19. It therefore remains to be seen how continued uncertainty around the coronavirus pandemic and the economic crisis may affect premiums and plan participation in 2021 or beyond.
Methods
We analyzed insurer-reported financial data from Health Coverage Portal TM, a market database maintained by Mark Farrah Associates, which includes information from the National Association of Insurance Commissioners. The dataset analyzed in this report does not include NAIC plans licensed as life insurance or California HMOs regulated by California’s Department of Managed Health Care; in total, the plans in this dataset represent at least 80% of the individual market. All figures in this issue brief are for the individual health insurance market as a whole, which includes major medical insurance plans and mini-med plans sold both on and off exchange. We excluded some plans that filed negative enrollment, premiums, or claims and corrected for plans that did not file “member months” in the annual statement but did file current year membership.
To calculate the weighted average loss ratio across the individual market, we divided the market-wide sum of total incurred claims by the sum of all unadjusted health premiums earned. Medical loss ratios in this analysis are simple loss ratios and do not adjust for quality improvement expenses, taxes, or risk program payments. Gross margins were calculated by subtracting the sum of total incurred claims from the sum of unadjusted health premiums earned and dividing by the total number of member months (average monthly enrollment) in the individual insurance market.
Endnotes
- The loss ratios shown in this issue brief differ from the definition of MLR in the ACA, which makes some adjustments for quality improvement and taxes, and do not account for reinsurance, risk corridors, or risk adjustment payments. Reinsurance payments, in particular, helped offset some losses insurers would have otherwise experienced. However, the ACA’s reinsurance program was temporary, ending in 2016, so loss ratio calculations excluding reinsurance payments are a good indicator of financial stability going forward. ↩︎
- Although first quarter loss ratios and margins generally follow a similar pattern as annual data, starting in 2014 with the move to an annual open enrollment that corresponds to the calendar year, first quarter MLRs have been about 2 – 10 percentage points lower than annual loss ratios in the same year. This is because renewing existing customers, as well as new enrollees, are starting to pay toward their deductibles in January, whereas pre-ACA, renewals would occur throughout the calendar year. ↩︎