Poll Finding

Political Preferences and Views on U.S. Immigration Policy Among Immigrants in the U.S.: A Snapshot from the 2023 KFF/LA Times Survey of Immigrants

Published: Nov 30, 2023

Findings

Immigration has been a hot-button issue in U.S. political debate for decades, with policymakers trying to balance economic, security, and humanitarian concerns, and candidates on both sides using immigration talking points to appeal to their base. Immigration policy at the federal level has often shifted dramatically between presidential administrations, and enforcement differs between states. However, debates over immigration policies, including those that restrict or promote pathways to citizenship and access to benefits for undocumented immigrants, often leave out the viewpoints of immigrants themselves, and in some cases, immigrant feel they are treated as pawns in a political game.

A majority of immigrants are naturalized citizens (58%) and thus eligible to vote in U.S. elections, but their views are not often explored in polls of the general public. Immigrants who are noncitizens may have other ways to influence the U.S. political process, but many face language barriers and immigration-related fears that make it difficult for them to engage in the political process.

The Survey of Immigrants, a partnership between KFF and The Los Angeles Times, is the largest nationally representative survey focused on immigrants, interviewing 3,358 immigrant adults in 10 languages. This report focuses on the political engagement, attitudes, and policy preferences of the growing immigrant population in the U.S.

Highlights

  • Most immigrants (62%) say they pay attention to politics and government in the U.S. a least a “fair amount,” though few (17%) say they pay “a lot” of attention. Older immigrants, naturalized citizens and those who are English proficient are among the most likely groups of immigrants to say they pay a lot of attention to U.S. affairs.
  • Immigrants, including naturalized citizens, lean more towards the Democrats when asked which political party represents their own views, which party best represents the interests of immigrants overall, and whether immigrants were better off under the Biden or Trump presidencies.
  • However, many immigrants do not feel that their views or the interests of immigrants generally are well represented by either of the two major U.S. political parties, and half of all immigrants say that who the president is makes no difference in the lives of immigrants.
  • Like most U.S.-born adults, a large majority (79%) of immigrant adults support allowing undocumented immigrants who were brought to the U.S. as children to apply for citizenship. A smaller majority of immigrants (59%) also supports allowing undocumented immigrants to sign up for government-sponsored health insurance, though immigrants who are naturalized citizens are split on this question and a majority (69%) of U.S.-born adults are opposed.

Attention to Politics and Political Leanings of Immigrants

Most immigrants report paying at least some attention to U.S. politics, with those who are older, English proficient, and naturalized citizens being the most engaged. About six in ten (62%) immigrants say they follow politics and government in the U.S. a lot (17%) or a fair amount (45%), with majorities across age and immigration statuses saying they follow it at least a fair amount. Immigrants ages 65 and older, naturalized citizens, and immigrants who speak English at least “very well” are most likely to report that they pay “a lot” of attention to politics and government in the U.S.

A Majority Of Immigrants Say They Pay Attention To U.S. Politics At Least A  Fair Amount

Twice as many immigrants say that immigrants in general are better off under a Biden presidency than a Trump presidency, but about half say who the president is makes no difference in the lives of immigrants. One in three (33%) say immigrants are better off under Biden, and one in six (16%) say immigrants were better off under Trump.

Immigrants who say they follow U.S. politics “a lot” or “a fair amount” are more likely than those who do not to say who the president is makes a difference, yet across levels of political interest, immigrants lean towards President Biden when asked which recent president was better for immigrants. While, unsurprisingly, six in ten immigrants who say they are best represented by the Democratic Party say immigrants are better off under Biden and about half (53%) of Republican-identifying immigrants say immigrants are better off under Trump, one-third of immigrants who say they are best represented by either the Democrats (34%) or Republicans (32%) say it “makes no difference” who the president is.

Twice As Many Immigrants Say They Are Better Off Under President Biden Than Trump, But Half Say It Makes No Difference

Larger shares of immigrants say that the Democratic Party represents their own personal political views better than the Republican Party. Immigrants overall are twice as likely to say that the Democratic Party (32%) represents their political views better than the Republican Party (16%). However, this still leaves about half of immigrants saying that neither party (25%) best represents their views or that they are not sure (27%). Majorities of undocumented immigrants (76%), recent immigrants (67%), immigrants who do not pay attention to U.S. politics (65%), and younger immigrants (ages of 18 and 29) (65%) say they are “not sure” or that neither party represents their political views.

Immigrants differ by race and ethnicity on their partisan leanings, with Hispanic, Asian, and Black immigrants leaning towards the Democratic Party and White immigrants more evenly split between saying the Democratic and Republican parties best represent their views. Across racial and ethnic groups, large shares—between four in ten and six in ten—say neither party best represents them or that they are not sure.

Although more Hispanic immigrants say they feel better represented by the Democratic Party, there are some differences by country or region of origin. Immigrants from South America (18%), Central America (15%), and the Caribbean (18%) are about twice as likely as those from Mexico (7%) to say the Republican Party best represents their political views. Roughly equal shares—three in ten—across these countries and regions say they feel represented by the Democrats, though larger shares of immigrants from Central America (41%) and Mexico (38%) say they are “not sure” which party better represents their views compared to those from South America (26%) or the Caribbean (23%). Among immigrants from Asia, there are few differences by country or region of origin.

Immigrants in California are more likely to say the Democratic party represents their views (36%) while a smaller share in Texas says the same (25%). Yet in both states, about three in ten immigrants say they are not sure and about one in four say neither party better represents their political views.

Twice As Many Immigrants Say The Democratic Party Represents Their Own Views Than The Republicans, Though Many Say "Neither Party" Or They Are Not Sure

Nearly half of immigrants (46%) say they think the Democratic Party represents the interests of immigrants at least “somewhat well,” more than twice the share who say the same about the Republican Party (20%). Immigrants across immigration statuses are more likely to say the Democratic Party represents immigrants’ interests well than the Republican Party. Three in ten say they are “not sure” about how well the Republican (33%), or Democratic (31%) Parties represent the interests of immigrants. Noncitizens are more likely to say they are “not sure” how well each of the political parties represent the interests of immigrants.

More Say The Democratic Rather Than The Republican Party Represents Immigrants' Interests Well, Though One-Third Are Unsure

In Their Own Words: Views and Attitudes Towards U.S. Politics and Enforcement Policies

In focus groups, many immigrants expressed that they felt their lives were better off under President Biden than President Trump, though some participants expressed that who the president is does not matter. Many said they feel they are “used as pawns” or “just for their vote.” When asked whether they think their voices are heard, many in these focus groups expressed that they thought voting “doesn’t make a difference,” and many voiced frustrations with the U.S. political system. These mixed feelings are captured in the quotes below.

“I feel the whole thing about politics and immigration is like putting the immigrants as a bait. I see a lot of promises. They come to power and say we are going to do this and that for the immigrants but nothing ever happens. But I feel personally they put the immigrants as bait and of course everybody is better than Trump, which I have to agree but I don’t see any progress.” – 47-year-old Indian immigrant woman in New York

“I feel like they give us the right by voting when a Latino can vote. But other than that, forget it. They just take our vote.” – 36-year-old Mexican immigrant woman in Texas

“During that Trump Administration he built his platform on being stricter on immigration specifically. He said we are going to send out ICE agents to capture all the illegal immigrants and there [were] videos in the media of people being arrested and deported. My family, although we are of legal status here, the process for getting to that point for us was very traumatic. So even though we were of legal status, we still felt scared because all that kind of very extremist stuff about anti-immigration was very scary.” – 24-year-old Korean immigrant woman in New York

“I feel more human right now. Even if the money is not doing well, I feel human. Those of us who are here, we would want documents but I am very pleased that our current President [Biden] gives asylum to refugees” – 34-year-old Mexican immigrant woman in California

Attitudes Towards Immigration Policies

Immigrants have mixed views in their assessments of whether U.S. enforcement of immigration laws is too tough or not tough enough, which stands in stark contrast to the views of U.S.-born adults.1  About one in five immigrant adults say the U.S. is “too tough” (19%) and a similar share say the U.S. is “not tough enough” (18%) in enforcing immigration laws, while about one-fourth (27%) say enforcement is “about right,” and about one-third (35%) say they are not sure. U.S.-born adults are much more likely to say that enforcement of these laws is “not tough enough” (52%), while one in six say enforcement is “too tough” (15%) or “about right” (14%). Immigrants vary somewhat in their assessments of immigration enforcement by immigration status, as naturalized citizens are somewhat more likely to say the U.S. is not tough enough in enforcement, while those who are likely undocumented are more likely to say they are “not sure.”

One In Five Immigrants Say The U.S. Is Too Tough In Immigration Enforcement, Including Three In Ten Likely Undocumented Immigrants

Immigrants’ views on U.S. enforcement of immigration laws are also largely divided by their political leanings. Immigrants who say their views are best represented by the Democratic Party (referred to here as Democratic-leaning) are more likely than Republican-leaning immigrants or immigrants who do not feel represented by either political party to say that enforcement in the U.S. is “too tough” (29%). Republican-leaning immigrants are most likely to say that enforcement in the U.S. is “not tough enough” (48%). However, many immigrants are not sure if immigration enforcement in the U.S. is too tough or not, including about one in four Democratic-leaning (26%) immigrants, one in five Republican-leaning (22%) immigrants and 45% of immigrants who do not have a political leaning.

About Half Of Republican-Leaning Immigrants Say U.S. Enforcement Of Immigration Policy Is Not Tough Enough, Few Others Say The Same

The idea of allowing undocumented immigrants who were brought to the U.S. as children to apply for citizenship is widely popular, with about eight in ten immigrants (79%) and two-thirds of U.S.-born adults saying this is a “good idea.” This proposal has been introduced to Congress in a variety of forms over the past two decades as The Development, Relief, and Education for Alien Minors Act, or DREAM Act, but has failed to pass. Immigrants across partisan affiliation and citizenship status largely support the policy, though fewer (55%) Republican-leaning immigrants say this is a good idea. Under the Deferred Action for Childhood Arrivals (DACA) program created in 2012, eligible young adults who were brought to the U.S. as children can receive protection from deportation and work authorization for temporary, renewable periods. However, DACA does not provide a pathway to U.S. citizenship, and the federal government is not currently processing new DACA requests due to court orders.

While a majority of immigrants support allowing undocumented immigrants to sign up for government-sponsored health insurance, a majority of U.S.-born adults say this is a “bad idea.” Nearly twice the share (59%) of immigrants than U.S.-born adults (30%) say this policy is a “good idea.” Even still, immigrants are split by immigration status and partisan affiliation on their support for this policy. Immigrants who are likely undocumented or lawfully present are more likely to say this policy is a “good idea” (85% and 68%) while naturalized citizens are split, with half saying it is a “good idea” (49%) and half saying it is a “bad idea” (48%). Similar shares of Democratic-leaning immigrants say the policy is a good idea (71%) and Republican-leaning immigrants say it is a bad idea (71%).

Notably, these questions did not offer arguments for or against the policies, and support may be higher or lower in a more contextualized situation.

Large Shares Of Immigrants And U.S.-Born Adults Support The Dream Act, But Are Split On Support For Government Insurance For Undocumented Immigrants

KFF would like to thank the Association of Asian Pacific Community Health Organizations, the Black Alliance for Just Immigration, Dr. May Sudhinaraset, the National Immigration Law Center, the National Resource Center for Refugees, Immigrants, and Migrants, and UnidosUS for their invaluable inputs, insights, and suggestions throughout the planning, fielding, and dissemination of this survey project.

Methodology

The KFF/LA Times Survey of Immigrants is a partnership survey conducted by KFF and the LA Times examining the U.S. immigrant experience.

The survey was conducted April 10-June 12, 2023, online, by telephone, and by mail among a nationally representative sample of 3,358 immigrants, defined as adults living in the U.S. who were born outside the U.S. and its territories. Respondents had the option to complete the survey in one of ten languages: English (n=2,435), Spanish (n=627), Chinese (n=171), Korean (n=52), Vietnamese (n=22), Portuguese (n=16), Haitian-Creole (n=13), Arabic (n=9), French (n=9), and Tagalog (n=4). These languages were chosen as they are most commonly spoken by immigrant adults from countries of focus for the survey with limited English proficiency (LEP), based on the 2021 American Community Survey (2021).

Teams from KFF and The Los Angeles Times worked together to develop the questionnaire and both organizations contributed financing for the survey. KFF researchers analyzed the data, and each organization bears the sole responsibility for the work that appears under its name. Sampling, data collection, weighting, and tabulation were managed by SSRS of Glenn Mills, Pennsylvania in collaboration with public opinion researchers at KFF.

Respondents were reached through one of three sampling modes: an address-based sample (ABS) (n=2,661); a random digit dial telephone (RDD) sample of prepaid (pay-as-you go) cell phone numbers (n=565); and callbacks to telephone numbers that that were previously randomly sampled for RDD surveys and were identified as speaking a language other than English or Spanish (n=132). Respondents from all three samples were asked to specify their country of birth and qualified for the survey if they were born outside of the U.S.

Project design was informed by a pilot study conducted from January 31-March 14, 2022 among a sample of 1,089 immigrants in collaboration with SSRS. Prior to fielding the pilot study, KFF and SSRS conducted interviews with experts who had previous experience surveying immigrants. These conversations informed decisions on sampling, modes of data collection, recruitment strategies, and languages of interviews. The pilot test measured incidence of immigrant households across four different sample types and offered a short survey in 8 different languages both online and on the telephone. Based on the results of the pilot test, the following recruitment and data collection protocol was implemented:

Sampling strategy and interview modes:

The ABS was divided into areas (strata), defined by Census tract, based on the incidence of immigrants among the population overall and by countries of origin. Within each stratum, the sample was further divided into addresses that were flagged by Marketing Systems Group (MSG) as possibly occupied by foreign-born adults and unflagged addresses. To increase the likelihood of reaching immigrant adults, strata with higher incidence of immigrant households overall, and of immigrants from certain countries of origin were oversampled.

Households in the ABS were invited to participate through multiple mail invitations: 1) an initial letter in English with a short paragraph of instructions in each of the 10 survey languages on the back; 2) a reminder postcard in English plus up to two additional languages; 3) a follow-up letter accompanied by hardcopy questionnaires in English and one additional language; and 4) a final reminder including short messages in all 10 languages. For mailings 2 and 3, additional languages were chosen by using flags to identify the language other than English likely spoken at home. Invitation letters requested the household member ages 18 or older who was born outside of the U.S. with the most recent birthday to complete the survey in one of three ways: by going online, dialing into a toll-free number, or returning the completed paper questionnaire. In addition, interviewers attempted outbound calls to telephone numbers that were matched to sampled addresses. ABS respondents completed the survey online (n=2,087), over the phone (n=105), or by mail on paper (n=469). The random sample of addresses was provided by MSG.

The RDD sample of prepaid (pay-as-you-go) cell phone numbers was obtained through MSG. The prepaid cell phone component was disproportionately stratified to effectively reach immigrants from different countries based on county-level information. To increase the likelihood of reaching immigrant adults, counties with higher incidence of immigrants overall, and of certain countries of origin were oversampled.

The callback sample included 132 respondents who were reached by calling back telephone numbers that were previously randomly sampled for SSRS RDD surveys within two years and coded by interviewers as non-English or non-Spanish speaking.

Incentives:

Initial mailings to the ABS sample included $2 as part of the invitation package, and respondents received a $10 incentive if they completed the survey in the first two weeks after the initial mailing. In order to increase participation among under-represented groups, the incentive increased to $20 for those who did not respond within the first two weeks. ABS phone respondents received this incentive via a check received by mail, paper respondents received a Visa gift card by mail, and web respondents received an electronic gift card incentive. Respondents in both phone samples received a $25 incentive via a check received by mail.

Questionnaire design and translation:

In addition to collaboration between KFF and the LA Times, input from organizations and individuals that directly serve or have expertise in issues facing immigrant populations helped shaped the questionnaire. These community representatives were offered a modest honorarium for their time and effort to review questionnaire drafts, provide input, attend meetings, and offer their expertise on dissemination of findings.

After the content of the questionnaire was largely finalized, SSRS conducted a telephone pretest in English and adjustments were made to the questionnaire. Following the English pretest, Research Support Services Inc. (RSS) translated the survey instrument from English into the nine languages outlined above and performed cognitive testing through qualitative interviews in all languages including English. The results of the cognitive testing were used to adjust questionnaire wording in all languages including English to ensure comprehension and cohesiveness across languages and modes of interview. As a final check on translation and its overlay into the web and CATI program, translators from Cetra Language Solution reviewed each question, as it appears in the program, and provided feedback. The questionnaire was revised and finalized based on this feedback.

Data quality checks:

A series of data quality checks were run on the final data. The online questionnaire included two questions designed to establish that respondents were paying attention and cases were monitored for data quality. Fifteen cases were removed from the data because they failed two or more quality checks, failed both attention check questions, or skipped over 50% of survey questions. An additional 67 interviews were removed after deemed ineligible by SSRS researchers (they were not U.S. immigrants).

Weighting:

The combined sample was weighted to adjust for the sampling design and to match the characteristics of the U.S. adult immigrant population, based on data from the Census Bureau’s 2021 American Community Survey (ACS). Weighting was done separately for each of 11 groups defined by country or region of origin (Mexico, China, Other East/Southeast Asia, South Asia, Europe, Central America, South America, Caribbean, Middle East/North Africa, Sub-Sahara Africa, all others). The samples were weighted by sex, age, education, race/ethnicity, census region, number of adults in the household, presence of children in the household, home ownership, time living in the U.S., English proficiency, and U.S. citizenship. The overall sample was also weighted to match the share of U.S. adult immigrants from each country/region of origin group. The weights take into account differences in the probability of selection for each of the three sample types. This includes adjustment for the sample design and geographic stratification, and within household probability of selection. Subgroup analysis includes data checks to ensure that the weighted demographics of subgroups are within reasonable range from benchmarks whenever possible.

The margin of sampling error including the design effect for the full sample is plus or minus 2 percentage points. Numbers of respondents and margins of sampling error for key subgroups are shown in the table below. For results based on other subgroups, the margin of sampling error may be higher. Sample sizes and margins of sampling error for other subgroups are available by request. Sampling error is only one of many potential sources of error and there may be other unmeasured error in this or any other public opinion poll. KFF public opinion and survey research is a charter member of the Transparency Initiative of the American Association for Public Opinion Research.

GroupN (unweighted)M.O.S.E.
Total3,358± 2 percentage points
Race/Ethnicity
Black immigrants274± 8 percentage points
Hispanic immigrants1,207± 4 percentage points
Asian immigrants1,318± 4 percentage points
White immigrants495± 6 percentage points
Immigration Status
Naturalized citizen2,134± 3 percentage points
Green card or valid visa holder819± 5 percentage points
Likely undocumented372± 6 percentage points
English Proficiency
Speaks English only or “very well”1,713± 3 percentage points
Speaks English “less than very well”1,635± 3 percentage points

Focus group methodology:

As part of this project, KFF conducted 13 focus groups with immigrant adults across the country to help inform survey questionnaire development, provide deeper insights into the experiences of immigrant groups that had a smaller sample size in the survey, and to provide a richer understanding of some of the survey findings.

Two rounds of focus groups were completed. The first round of 6 groups was conducted between September-October 2022 virtually among participants living across the country who are Hispanic immigrants (conducted in Spanish), Asian (excluding Chinese) immigrants (conducted in English), or Chinese immigrants (conducted in Mandarin Chinese). The groups were separated by gender, lasted 90 minutes, and included 5-7 participants each.

The second round of groups were conducted in-person between May-June 2023 in Los Angeles, CA and Fresno, CA with Hispanic immigrants conducted in Spanish; and in Houston, TX and Irvine, CA with Vietnamese immigrants conducted in Vietnamese. In addition, virtual groups were conducted among participants living in the Texas border region (Hispanic immigrants), the Miami, FL region (Haitian immigrants), and nationally (Black immigrants from sub-Saharan Africa). Groups were mixed gender, lasted between 90 minutes and two hours, and were conducted in English, Spanish, Vietnamese, and Haitian-Creole with 5-8 participants each.

For each group, participants were chosen based on the following criteria: Must be at least 18 years of age and have been born outside of the U.S. and its territories; for groups conducted in languages other than English, must speak English “less than very well” and be able to speak conversationally in the group’s language (i.e., Spanish). In addition, groups were chosen to represent a mix of household composition, including at least some participants who are parents; a mix of household income levels, with a preference for recruiting lower income participants; a mix of health insurance types; and a mix of immigration statuses. Goodwin Simon Strategic Research (GSSR) recruited and hosted the first round of focus groups. PerryUndem recruited and hosted the second round of focus groups. The screener questionnaire and discussion guides were developed by researchers at KFF in consultation with the firms who recruited and hosted the groups. Groups were audio and video recorded with participants’ permission. Each participant was given $150-$175 after participating.

Appendix

Demographic Profile of U.S. Adults by Citizenship and Immigration Status

Country Of Origin By Regions

Endnotes

  1. u00a0u00a0Supplemental to the Survey of Immigrants, KFF also conducted a representative survey of 1,049 U.S.-born adults. to compare the immigrant and native-born experience. KFF/LA Times Survey of Immigrants: U.S. Born Adult Comparison (June 29 u2013 July 9, 2023). ↩︎

A Look at Waiting Lists for Medicaid Home- and Community-Based Services from 2016 to 2023

Authors: Alice Burns, Maiss Mohamed, and Molly O’Malley Watts
Published: Nov 29, 2023

Home- and community-based services (HCBS) waivers allow states to offer a wide range of benefits and to choose—and limit—the number of people who receive services. The only HCBS that states are required to cover is home health, but states may choose to cover personal care and other services such as private duty nursing through the Medicaid state plan. Those benefits are generally available to all Medicaid enrollees who need them. States may use HCBS waivers to offer expanded personal care benefits or to provide additional services such as adult day care, supported employment, and non-medical transportation. Because waivers may only be offered to specific populations, states often provide specialized benefits through waivers that are specific to the population covered, such as providing supported employment only to people under age 65. KFF estimates that over 4 million Medicaid enrollees use HCBS, and that the numbers of people using HCBS through the state plan are similar to the numbers using HCBS through waivers.

States’ ability to cap the number of people enrolled in HCBS waivers can result in waiting lists when the number of people seeking services exceeds the number of waiver slots available. Waiting lists reflect the populations a state chooses to serve, the services it decides to provide, the resources it commits, and the availability of workers to provide services. In addition, states’ waiting list management approaches differ with regard to prioritization and eligibility screening processes, making comparisons across states difficult. States are only able to use waiting lists for optional services so the number of people on waiting lists can increase when states offer a new waiver or make new services available within existing waivers; in these cases, the number of people receiving services increases, but so does the number of people on a waiting list. In many cases, people may need additional services, but the state doesn’t offer them to anyone or only offers them to people with certain types of disabilities. Waiting lists would not capture the unmet needs of those people. Finally, although people may wait a long time to receive waiver services—36 months on average—most people are eligible for other types of HCBS while they wait.

Even though HCBS waiting lists are an imperfect measure of unmet need, there are no alternative measures available. Many HCBS programs were enacted or expanded in response to the Olmstead decision, a court ruling that found the unjustified institutionalization of people with disabilities is illegal discrimination. As the 25th anniversary of Olmstead nears, waiting lists are sometimes described as contributing to the risk of unnecessary institutionalization for people with disabilities, and policy makers across political parties have proposals to address them. A recent proposed rule would require states to report the number of people are on waiting lists but is not clear how that requirement would be defined.

This data note provides new information about waiting lists from KFF’s most recent survey of state Medicaid HCBS programs, including a discussion of why waiting lists are an incomplete measure of unmet need and why they are not necessarily comparable across states or over time. In the 2023 survey, KFF asked states to report the number of people who were on “interest” lists for HCBS, as well as waiting lists, a difference from prior years (see Box 1). Key takeaways include:

  • The number of states that maintain waiting lists or interest lists for people who would like to receive HCBS has fluctuated little between 2016 and 2023.
  • In most years since 2016, there have been close to 0.7 million people on waiting lists or interest lists, with a total of over 692,000 in 2023.
  • Most people on waiting lists or interest lists have intellectual or developmental disabilities and most live in states that do not screen any people for eligibility prior to adding them to waiting lists.
  • Most people on waiting lists or interest lists are eligible for personal care provided through states’ regular Medicaid programs or for services provided through specialized state plan HCBS benefits.

KFF also recently updated the waiting list indicators on State Health Facts to help people better understand who is on waiting lists and what those waiting lists mean.

How did the number of states with waiting lists change between 2016 and 2023?

Between 2016 and 2023 the number of states with waiting lists has fluctuated between 35 and 41 and is currently at 38 states (Figure 1). While some Affordable Care Act (ACA) opponents have cited waiver waiting lists to argue that expanding Medicaid diverts funds from seniors and people with disabilities, research shows that ACA Medicaid expansion has led to gains in coverage for people with disabilities and chronic illnesses. Waiting lists for HCBS predate the ACA Medicaid expansion, which became effective in most states in 2014, and both expansion and non-expansion states have waiting lists. Waiver enrollment caps have existed since HCBS waiver authority was added to federal Medicaid law in the early 1980s.

Box 1: Changes to KFF’s 2023 Survey on Waiting Lists and Interest Lists

In 2023, KFF asked states to report the total number of people who were on a “waiting list, referral list, interest list, or another term” for HCBS whereas older surveys only asked about waiting lists or referral lists. The change reflects states’ increasing use of terms other than “waiting list” to keep track of people who had expressed interest in HCBS but are not receiving services. KFF broadened the survey to increase the comparability of data across states and across years if states transition to use of different terms.

Prior to 2023, some states used terms other than waiting lists to describe their lists and reported data in the KFF survey, but periodically a state would change its terminology and approach, resulting in what appeared a large fluctuation in the number of people on “waiting lists.” For example, in 2018, Louisiana had nearly 30,000 people on a waiting list for their intellectual or developmental disability waiver. The state implemented a new system to screen people for urgent HCBS needs. Those that met the criteria for urgent needs were placed immediately in services and people with less pressing needs were placed on a “registry” that replaced the older waiting list. By 2020, the waiting list was eliminated. KFF’s assessment is that the broader survey question will capture data that are as consistent with the older years’ data as possible and provide for more meaningful comparisons between states.

When asked specifically, the 2023 survey showed how widespread the use of interest lists was: In 2023, there were more people on interest lists (361,000) than on waiting lists (331,000). The use of the term “interest lists” has important ramifications for a proposed rule on Medicaid access. Under that rule, states would be required to report the number of people on waiting lists, but it’s unclear whether the requirement would apply to lists that are described as interest lists or registries.

A smaller change to KFF’s survey in 2023 was to ask the states to report the number of people on the waiting list at the time the survey was completed. Historically, KFF asked states to report the number of people on waiting lists in the prior year. In the spring of 2023, KFF asked states to report the number of people on waiting lists in 2022, but also the number of people currently on the list. Future years’ surveys will only ask about current waiting list numbers.

The Number of States with Waiting Lists or Interest Lists for Medicaid HCBS has Been Fairly Stable Since 2016

Despite the changes to KFF’s survey question, there were few changes in the number of states that reported any waiting lists between the 2022 survey (which requested data from 2021) and the 2023 survey. There were more changes in waiting lists for specific types of waivers, however, with three states eliminating waiting lists for specific waivers, including Connecticut for people with intellectual or developmental disabilities, and North Carolina and West Virginia for people with traumatic brain or spinal cord injuries. Connecticut reported a new list for people with mental health conditions and South Carolina reported several new “processing lists,” that track people’s movement from intake to enrollment for people who are 65 and older or with physical disabilities, for medically-fragile or technology-dependent children, for people with mental health conditions, and for people with HIV or AIDs.

How did the number of people on waiting lists change between 2016 and 2021?

In most years between 2016 and 2023, nearly 0.7 million people have been on waiting lists or interest lists for HCBS (Figure 2). One factor that contributes to changes over time—especially the notable decline between 2018 and 2020—is that not all states screen for Medicaid eligibility prior to adding people to waiting lists and changes in this policy may result in changes in waiting list volumes. For example, between 2018 and 2020, the total number of people on waiting lists decreased by 155,000 or 19%. However, nearly half of that change came from Ohio’s implementation of a waiting list assessment of waiver eligibility, which reduced the size of the state’s waiting list by nearly 70,000 people. In 2023, most states (32) with waiting lists screened individuals for waiver eligibility among at least one waiver, but even among those states, 5 did not screen for all waivers. There were 6 states that do not screen for eligibility among any waivers and those 6 states (Alaska, Illinois, Iowa, Oklahoma, Oregon, and Texas) account for over half of all people on waiting lists. Changes in total waiting lists over time may reflect changes in states’ policies towards eligibility screening (Figure 2).

Over Half of People on HCBS Waiting Lists or Interest Lists Live in States That do not Screen People for Eligibility Prior to Adding Them to the List

In all years since 2016, over half of people on HCBS waiting lists or interest lists lived in states that did not screen people on waiting lists for eligibility. One reason waiting lists provide an incomplete picture of need is that not all people on waiting lists will be eligible for services. Stakeholder interviews about HCBS waiting lists found that when waiver services are provided on a first-come, first-served basis, people enrolled in waiting lists are in anticipation of future need. That study found that in some states, families would add their children to waiting lists for people with intellectual or developmental disabilities (I/DD) at a young age, assuming that by the time they reached the top of the waiting list, their children would have developed the immediate need for services. Many of those waivers offer comprehensive HCBS packages that include supported employment, supportive housing, or round-the-clock services. Among the six states that do not screen people for eligibility on any lists, five have only waiting lists and the sixth uses interest lists (Illinois does not establish eligibility until selection but does do a preliminary evaluation of eligibility prior to placing someone on the list).

Between 2021 and 2023, total enrollment in waiting lists and interest lists increased by 6%. Overall, there was an increase in the number of people on waiting or interest lists in 18 states and a decrease in 16 states. Some states had significant decreases in their waiting lists such as New Mexico which used additional federal funding from the American Rescue Plan Act to decrease their waiting list for people with I/DD from 3,500 in 2022 to fewer than 300 in 2023. Virginia’s waiting list also decreased significantly from 23,000 in 2021 to under 15,000 in 2022 and 2023.

Increases in waiting lists may reflect improved data about people seeking services. For example, Texas revised its questionnaire to gather more data about people who are interested in HCBS and the number of people on waiting lists/interest lists statewide rose from 312,000 in 2021 to 343,000 in 2023. New York is currently building a portal to track the services received and the number of people waiting for services. The portal will help target provider capacity but may also show an increase in the number of people “waiting” for services that is attributable to improved data collection rather than an increase in unmet needs (New York reported that they had an interest or referral list but that the number of people on it was unknown).

Who is on waiting lists for HCBS?

Most people on waiting lists have intellectual or developmental disabilities (I/DD), particularly in states that do not screen for waiver eligibility before placing someone on a waiting list. People with I/DD comprise 88% of waiting lists in states that do not screen for waiver eligibility, compared with 51% in states that do determine waiver eligibility before placing someone on a waiting list (Figure 3). People with I/DD comprise almost three-quarters (72%) of the total waiver waiting list population. Seniors and adults with physical disabilities account for one-quarter (25%), while the remaining share (3%) includes children who are medically fragile or technology dependent, people with traumatic brain or spinal cord injuries, people with mental illness, and people with HIV/AIDS. People who are on HCBS waiting lists are generally not representative of the Medicaid population or the population that uses HCBS. Most people on waiting lists have I/DD, but KFF analysis shows that people with I/DD comprise fewer than half of the people served through 1915(c) waivers (the largest source of Medicaid HCBS spending).

Most People on Medicaid HCBS Waiting Lists or Interest Lists Have Intellectual or Developmental Disabilities

How long do people on HCBS waiting lists wait to access services and do they have access to HCBS while waiting?

In 2023, people on the waiting or interest lists waited an average of 36 months to receive HCBS waiver services (27 of 38 states responding), down from 45 months in 2021. People with I/DD waited the longest for services, 50 months on average. The average waiting period for other waiver populations ranged from 5 months for waivers targeting seniors to 37 months for waivers that serve people with autism. People with I/DD residing in states that do not screen for eligibility wait longer for services than people with I/DD residing in states that do screen for waiver eligibility (61 months versus 45 months, on average).

Most people on waiting or interest lists are eligible to receive other types of HCBS while they wait. Among the nearly 700,000 people on lists for waiver services in 2023, living arrangements are unknown for more than 600,000. Among the people whose living arrangements are known, 97% (77,000) lived in the community and 3% (2,000) lived in institutional settings. While waiting for waiver services, people living in the community are likely to be eligible for other HCBS through Medicaid state plans. Of the over 4 million people who use HCBS, KFF estimates that roughly half use services provided through the Medicaid state plan, such as personal care to help with bathing or preparing meals, therapies to help people regain or acquire independent living skills, and assistive technology. States may not use waiting lists to restrict the number of people eligible to use such services and over 80% of people on HCBS waiting lists are eligible for personal care or other state plan services. They would not, however, have access to more specialized services such as supported employment or adult day care. People on waiting lists who receive state plan services may also have fewer hours of personal care than they would in a waiver program, or they may not have assistance with some of the activities they need help with such as bathing, dressing, preparing meals, or managing medication.

What to watch?

How might shortages of HCBS workers create problems for states seeking to reduce the number of people on waiting lists? The COVID-19 pandemic exacerbated existing workforce shortages across all HCBS settings and KFF’s most recent survey of state HCBS programs highlighted states efforts to try and address those shortages. Waiting lists may reflect both shortages of workers and insufficient state funds. Although states reported increasing provider payment rates and other efforts to bolster the workforce, challenges remain and some of states’ policies for addressing those challenges have ended with the conclusion of pandemic-era programs. It remains to be seen how policy changes enacted during the pandemic will affect the provision of HCBS in future years and whether the investments in HCBS through the American Rescue Plan Act will result in capacity increases even after the federal funding ends.

How might recently proposed rules affect the number of people on waiting lists or interest lists? One proposed rule on Medicaid access would require states to report on the number of people “who are waiting to enroll in the waiver program,” but it’s unclear whether that requirement would also apply to interest lists, which may include people who are interested in services but not “waiting to enroll.” The rule would make other changes, also intended to increase Medicaid enrollees’ access to HCBS. Increased access to HCBS would increase Medicaid spending, but there is no new federal funding beyond the standard federal matching payments provided to states for Medicaid costs. Funding challenges for states may be particularly relevant given other potential requirements for more staffing in nursing homes, which would tend to increase states’ spending on institutional long-term services and supports. Another proposed rule would codify the Olmstead court decision that requires services to be provided in the most integrated setting appropriate and has spurred many expansions of HCBS waivers.

News Release

Waiting for Care: Three-Fourths of States Have Waiting Lists for Some Medicaid Home Care Programs

Worker shortages could worsen states’ waiting list times, which currently average three years.

Published: Nov 29, 2023

In a new analysis of survey data from state Medicaid home care programs, KFF found that in most years since 2016, there have been nearly 700,000 people on waiting or interest lists for expanded home and community-based services (HCBS), with a total of 692,000 across 38 states in 2023 and waiting lists averaging three years.

People with intellectual or developmental disabilities make up almost three-quarters of waiting lists, with seniors and adults with physical disabilities constituting another quarter. People on waiting lists may not have access to increased hours of home care to support activities such as bathing, dressing, preparing meals and managing medication as well as increased types of community care, such as adult day care and supported employment, which are often designed to meet the needs of specific populations.

States can cap enrollment for these services, resulting in waiting lists (also described as “interest lists”) for expanded home care programs when demand surpasses the available slots. While these lists are an imperfect measure of unmet need, there are currently no alternative measures.

Home care waivers that allow states to offer these services have been in place since the 1980s, but their use increased after the Supreme Court’s Olmstead decision in 1999, which characterized the unjustified institutionalization of people with disabilities as illegal discrimination. As the 25th anniversary of Olmstead nears, people have cited waiting lists as one reason for continued discrimination based on disability.

Shortages of home care workers could worsen states’ waiting list times. Although states reported increasing provider payment rates and other efforts to bolster the workforce, challenges remain and some state policies for addressing these challenges ended with the conclusion of pandemic-era programs.

Another factor affecting waiting list volumes is whether states screen for Medicaid eligibility before adding people to waiting lists. Between 2018 and 2020, waitlist sizes for expanded home care programs fell by 19% nationally, largely due to eligibility assessments added to waiting lists. Today, all but six states screen their waiting lists for Medicaid eligibility.

Rules proposed earlier this year would require states to report the size of their waiting lists.

News Release

KFF Examines Key Considerations for the Implementation of Insurance Coverage for Over-the-Counter Contraceptives

Published: Nov 28, 2023

With federal regulators seeking public input on the potential benefits, costs, and implementation considerations of requiring private health insurance plans to cover over-the-counter preventive products without a prescription, a new KFF post explores the issues relevant to covering over-the-counter contraceptives. These contraceptives include Opill, the first daily oral contraceptive pill to receive FDA approval for over-the-counter availability.

The analysis draws on the lessons learned from KFF staff interviews with more than 80 key players nationally and in states that have passed laws or taken other actions to expand access to birth control without a clinician’s prescription. It describes implementation challenges and strategies including standardized billing protocols for over-the-counter products, enrollees and pharmacists’ awareness of required coverage, and the impact of mitigating pharmacist and pharmacy staff overload.

Under current federal policy guidelines, insurers are generally required to cover prescribed FDA-approved contraceptives with no patient cost-sharing. In October 2023, the Departments of Treasury, Labor, and Health and Human Services issued a request for information related to requiring private insurers to cover over-the-counter preventive services and supplies without a prescription. Comments on the proposal are due on December 4.

Considerations for Covering Over-the-Counter Contraception

Published: Nov 28, 2023

Note: This policy watch was updated on April 17, 2024 to incorporate the latest available data.

In 2023, the FDA approved the first over-the-counter (OTC) daily oral contraceptive pill, Opill, and more recently, the first OTC at-home test for chlamydia and gonorrhea, Simple 2 Test. With these OTC products becoming available online and/or in stores soon, the implementation issues raised about the availability and affordability of these products and other OTC preventive supplies have garnered the attention of policymakers and advocates. Private insurers and Medicaid generally require a prescription to cover OTC products, so even though these products will be available without the need to obtain a prescription from a clinician, coverage without a prescription will be limited without federal or state action.

In October 2023, the Departments of the Treasury, Labor, and Health and Human Services issued a request for information to gather public input regarding the potential benefits, costs, and implementation considerations of requiring private health insurance plans to cover OTC preventive services and supplies without a prescription.

This policy watch addresses key considerations for the implementation of insurance coverage for non-prescribed OTC contraceptives based on the lessons learned from KFF’s 2023 study of Insurance Coverage of OTC Oral Contraceptives. KFF staff interviewed more than 80 individuals representing key players in states that require state regulated plans to cover certain OTC contraception methods without a prescription and without cost sharing.

Background

Current federal policy does not require insurance coverage of OTC contraceptives without a prescription (unlike the ACA contraceptive coverage requirements that mandate coverage with no patient cost-sharing with a prescription). To date, however, seven states have passed laws requiring state-regulated private health plans to cover certain OTC contraception, such as emergency contraception and condoms, without the need for a prescription and without cost-sharing (Figure 1). State health insurance requirements apply to individual plans, plans offered by public employers, and fully-insured plans offered by private employers, but not to self-funded plans offered by private employers, which cover nearly two-thirds of workers with employer-sponsored insurance. Seven states use state-only funds to provide coverage for certain non-prescribed OTC contraceptives for Medicaid beneficiaries. In other states, health plans rarely offer this coverage to their enrollees voluntarily.

Coverage of Over-the-Counter Contraception Without a Prescription, State Policies as of November 2023

Billing Protocols for OTC Contraceptives in States that Require Coverage

In states where coverage for OTC contraception is required without a prescription, there are generally two pathways for consumers to receive coverage.

  • Direct billing at the pharmacy counter: This is the most commonly used billing method and requires consumers to obtain the product at the pharmacy counter. Depending on the insurer’s protocol, the pharmacist or technician must enter a National Provider Identifier (NPI), a unique, 10-digit number issued by the Centers for Medicare and Medicaid Services (CMS) to health care providers, including pharmacists, which is also used for billing purposes. This claim is then transmitted to the plan, the pharmacy is reimbursed, and the policyholder receives the product in much the same way that most prescribed drugs are processed.
  • Purchasing the OTC contraceptive product outside the pharmacy, with the enrollee submitting a pharmacy claim to the plan: This method of coverage is used by few private health plans and is similar to the reimbursement process that was used for some at-home COVID-19 tests. While this option can expand access to coverage in certain situations, it potentially poses financial and logistical barriers for the enrollee because the policyholder needs to pay the cost upfront and navigate the plan’s claims and reimbursement process.

Considerations for Implementing Coverage of OTC Contraception

In general, most private insurance and Medicaid payment systems have been set up to process claims for prescribed drugs and currently lack the infrastructure to process claims for non-prescribed OTC drugs. Key players interviewed by KFF cited several common implementation challenges and possible approaches, including:

  • Establishing universal NPI numbers for OTC products and standardized billing protocols: Interviewees noted that billing protocols for non-prescribed OTC contraception vary widely by health insurance plan, leading to confusion for some pharmacists. Some states that have implemented coverage of OTC contraceptives without a prescription for their Medicaid enrollees have created a universal NPI number for each covered OTC contraceptive to avoid the need to for pharmacists or pharmacies to enter their individual NPI numbers for an OTC product. In interviews with pharmacists, some said they were reluctant to enter their own NPI number for a product they did not prescribe, citing concerns about potential legal liability. A standardized billing process across payors would facilitate any federal or state requirement to cover OTC drugs.
  • Increasing awareness and communication: There has been little specific outreach about this covered benefit to health plan enrollees and pharmacists, and there has been limited communication about billing protocols between pharmacies, pharmacy benefit managers (PBMs), health plans, and state insurance departments. Increasing awareness and improving communication across key players can help increase utilization of this covered benefit and facilitate coverage for OTC contraceptives.
  • Mitigating pharmacist and pharmacy staff overload: The role and scope of pharmacists and pharmacy staff in health care have rapidly expanded over the years, with a growing number of pharmacists dispensing medication, administering vaccines, and counseling patients, among other services. Staff at major drugstore chains recently staged walkouts over difficult working conditions. Processing claims for OTC contraceptives adds another layer of responsibility for pharmacists who are already overstretched. Properly assessing pharmacy staffing needs, compensating pharmacists for the time it takes to process these claims, and streamlining the billing process were identified as factors that could alleviate these challenges and enable pharmacists and other staff to play a role in facilitating coverage of OTC contraceptives.

Broader Implications

Coverage for non-prescribed preventive health care items available over the counter could facilitate access to a broad range of OTC products that support sexual and reproductive health, including emergency contraceptive pills; condoms; folic acid supplements; and the newly-FDA-approved STI tests, and pave the way for new contraceptive products that may become FDA approved for OTC use in the future.

Across the spectrum of key players, the KFF research reveals that there is interest and engagement about the potential of OTC contraception to broaden the availability of and access to contraceptive options, but the extent to which this occurs will depend on many factors, including state and federal policies and guidance, pharmacy engagement, billing systems, and public and provider awareness, and modifications to current systems of coverage.

Additional KFF resources on Over-The-Counter Contraceptive Pills:

Report: Insurance Coverage of OTC Oral Contraceptives: Lessons from the Field

Web Event: Will Insurance Cover Over-the-Counter Contraceptive Pills? A Discussion of Coverage Options and Challenges

Issue Briefs:

A Look at Navigating the Health Care System: Medicaid Consumer Perspectives

Published: Nov 27, 2023

This brief gauges Medicaid enrollees’ perspectives on their health insurance, based on findings from KFF’s Survey of Consumer Experiences with Health Insurance, fielded February 21 through March 14, 2023. Importantly, people covered by different types of insurance have different levels of income, education, and health status, which may affect their experiences and views. Adults with Medicaid are more likely to be younger, female and to have lower incomes. They are also more likely to describe their health as “fair” or “poor” than those with other coverage. Medicaid also has limited or negligible premiums and out-of-pocket costs, which may affect the types of problems enrollees face. This brief provides an overview of the survey findings, describes Medicaid enrollees’ views of their health and health coverage, explores problems those with Medicaid experience, compares how Medicaid performs relative to Medicare and private coverage, and reviews variation in Medicaid experiences. Key take-aways include the following:

  • Medicaid enrollees report worse health status compared to those with other coverage, which could lead to greater need for health care and more opportunities to encounter problems with the system. Still, the large majority (83%) of Medicaid enrollees rate the overall performance of Medicaid positively. However, over half of Medicaid enrollees report having experienced a problem in the past year, and relative to Medicare and employer-sponsored insurance (ESI), Medicaid enrollees are more likely to report certain negative outcomes from insurance problems.
  • Medicaid enrollees report fewer cost-related problems relative to those with Marketplace coverage and ESI; however, Medicaid enrollees report more problems with prior authorization and provider availability compared to people with other insurance types.
  • Across racial and ethnic groups, most enrollees rate their Medicaid coverage positively, with White Medicaid enrollees the most likely to describe their insurance as “excellent.” Similar shares of enrollees among all racial and ethnic groups report experiencing problems with their coverage. Similar to the experiences of people with other coverage, Medicaid enrollees who utilize more health care services experience more problems with their insurance.

Proposed federal rules related to Medicaid access and prior authorization that are pending aim to address some of the problems faced by Medicaid enrollees.

How do Medicaid enrollees view their health and health coverage?

A higher share of Medicaid enrollees rate their health status as fair or poor relative to adults with other coverage. About one-third (32%) of those with Medicaid describe their physical health status as “fair” or “poor.” Over a third (36%) of Medicaid enrollees report “fair” or “poor” mental health, a rate much higher than Marketplace enrollees (20%) and over double the rate of those with Medicare or employer-sponsored insurance (ESI).

A Higher Share Of Medicaid Enrollees Rate Their Health Status As Fair Or Poor

Despite worse health status – which could lead to greater need for health care and more opportunities to encounter problems with the system – the large majority (83%) of Medicaid enrollees rate the overall performance of their current health insurance as either “excellent” or “good.” This positive rating is similar to ratings among those with ESI (80%), lower than those with Medicare (91%) and higher than those with Marketplace coverage (73%).

Most Medicaid Enrollees Give Their Health Insurance An Overall Positive Rating

Even though most enrollees view their insurance positively, over half report having experienced a problem in the past year.  The share of those with Medicaid reporting any problem with their insurance (58%) is similar to those with ESI (60%) and Marketplace coverage (56%), and higher than those with Medicare (51%). Though majorities across insurance types report at least some problem with their insurance, the nature of problems people experience differs across health coverage types. For example, those with private coverage are more likely to experience cost-related issues while those on Medicaid are more likely to report problems with prior authorization and provider availability.

More Than Half Of Medicaid Enrollees Report Having Experienced A Problem With Their Insurance In The Past Year

Relative to adults with Medicare and ESI, Medicaid enrollees are more likely to report certain negative outcomes from insurance problems.  For example, Medicaid enrollees are more likely to report experiencing a decline in health (23%) and being unable to receive recommended treatment (26%) because of a problem they had with their insurance. Medicaid enrollees’ experiences on these measures are similar to those with Marketplace coverage. However, Medicaid enrollees are less likely than those with other insurance types to report having to pay more than expected for treatment or services (12%).

Insurance Problems Can Lead To  Negative Outcomes for Medicaid Enrollees

In what ways do Medicaid enrollees view their coverage more favorably compared to views of those with other coverage?

Medicaid enrollees are less likely to report cost-related problems than those with Marketplace coverage and ESI, but as likely to report these problems as those with Medicare.  Smaller shares of adults with Medicaid (11%) say their insurance paid less than they expected for a medical bill, compared to those with private coverage (ESI 35%, Marketplace 28%). Similarly, Medicaid enrollees are less likely to report that insurance paid nothing at all for a service they thought was covered (12%) compared to those with private coverage (ESI 21%, Marketplace 20%). Smaller shares of adults with Medicaid report delaying a visit to the doctor’s office in the past year due to cost (10%) than those with ESI (17%) or Marketplace plans (18%).  Enrollees with Marketplace and ESI plans can face significant cost sharing in the form of high deductibles, high out-of-pocket limits, and coinsurance or copay requirements. Given that Medicaid enrollees have low incomes, federal rules generally have protections to limit out-of-pocket costs that can help improve access.

Medicaid Enrollees Are Less Likely To Report Cost-Related Problems Than Those With Private Coverage

Medicaid enrollees are more likely to report having an easier time understanding parts of their insurance coverage than privately insured adults. Over seven in ten (73%) Medicaid enrollees compared to over six in ten (62%) of those with Marketplace plans and 65% of those with ESI say they find it easy to understand statements explaining whether or how much insurance will pay for care; these statements are called Explanation of Benefits, or EOBs. Additionally, more than eight in ten Medicaid enrollees describe understanding what they would owe out-of-pocket as easy, a much higher share than those with ESI (66%) or Marketplace coverage (59%). About seven in ten Medicaid enrollees easily understand what their insurance does and does not cover, while smaller shares of adults covered in Marketplace plans (54%) or ESI (60%) cite similar ease. Medicaid enrollees also report having an easier time understanding specific terms, such as “deductible,” “coinsurance,” “prior authorization,” or “allowed amount” than those with private insurance. This comparative ease in understanding by Medicaid enrollees may be a result of limited out-of-pocket costs for Medicaid plans leading to a simpler plan design.

Medicaid Enrollees Are More Likely To Report Having An Easier Time Understanding Parts Of Their Insurance Coverage Than Privately Insured Adults

Although a majority of Medicaid enrollees are unaware they have a right to appeal insurance decisions, Medicaid enrollees are more likely to be aware of these appeal rights than those who are privately insured. Less than half of Medicaid enrollees (45%) report being aware of their legal right to appeal to a government agency or an independent medical expert if their health insurance refuses to cover medical services they think they need, with most either incorrectly saying they do not have appeal rights (7%) or saying they are not sure if this is a right they have (48%). However, Medicaid enrollees have a higher awareness of their right to an appeal than those who are privately insured, with 34% of those with ESI or Marketplace coverage reporting they are aware of their right to appeal insurance decisions.

Medicaid Enrollee Awareness Of A Right To Appeal Insurance Decisions Is Higher Than The Privately Insured

In what ways do Medicaid enrollees view their coverage less favorably compared to views of those with other coverage?

Medicaid enrollees are more likely to report problems with prior authorization. About one in five adults with Medicaid (22%) report that their health insurance denied or delayed prior approval for a treatment, service, visit, or drug before they received it, which is double the rate of adults with Medicare (11%). Consumers with prior authorization problems tend to face other insurance problems and are far more likely to experience serious health and financial consequences compared to people whose problems did not involve prior authorization.

Medicaid enrollees were also more likely to have problems finding providers available to care for them. One in three Medicaid enrollees report that a doctor covered by their insurance who they needed to see did not have available appointments, the highest share of any coverage group. Nearly one in five adults with Medicaid also report that a doctor or hospital they needed was not covered by their insurance, a higher share than adults with Medicare (9%) or ESI (13%) and a similar share to adults with Marketplace plans (20%). Overall, adults with Medicaid are more likely than adults with any other insurance type to report receiving care in the emergency room, with Medicaid enrollees twice as likely to report receiving care in the emergency room compared to those with ESI or Marketplace coverage.  Higher emergency room utilization may be due to barriers in accessing providers as well as a number of other factors, including higher disease burden and minimal cost sharing requirements for emergency room care.

While a large body of research shows that Medicaid beneficiaries have substantially better access to care than people who are uninsured, lower provider payment and participation rates may contribute to findings that Medicaid enrollees experience more difficulty obtaining health care than those with private insurance. In 2021, MACPAC found physicians were less likely to accept new Medicaid patients compared to other payers, but rates may vary by state, provider type, and setting. Acceptance of new Medicaid patients was much higher where physicians practiced in community health centers, mental health centers, non-federal government clinics, and family clinics compared to the average for all settings.

Medicaid Enrollees Are More Likely To Report Problems With Prior Authorization And Provider Availability

While the majority of Medicaid enrollees rate the quality of available providers positively, Medicaid enrollees are less likely to do so relative to individuals with other insurance types. Overall, more than two in three Medicaid enrollees (69%) report positive perceptions of provider quality. However, adults with Medicare, Marketplace, and ESI all exceed Medicaid enrollees in satisfaction provider quality satisfaction, with 90% of Medicare adults, 78% of Marketplace adults, and 84% of ESI adults rating the quality of providers as “good” or “excellent.”

Medicaid Enrollees Are Less Likely To Positively Rate The Quality Of Available Medical Providers Than Those With Other Insurance Types

Medicaid enrollees report issues with availability and quality for mental health providers. Adults with Medicaid and Marketplace coverage are more likely than those with ESI or Medicare to negatively rate their insurance when it comes to the availability of mental health providers. Medicaid enrollees more frequently report “fair” or “poor” mental health and may, therefore, have a greater need for mental health providers than adults with other coverage. When looking specifically at adults with Medicaid who describe their own mental health as “fair” or “poor,” notable shares give their plan a negative rating for the availability (47%) and quality (41%) of mental health therapists and professionals.

Over Four In Ten Medicaid Enrollees With Fair Or Poor Mental Health Rate The Availability And Quality Of Mental Health Providers Under Their Insurance Negatively

Where is there significant variation within Medicaid?

Few enrollees across racial and ethnic groups report their Medicaid coverage as fair or poor, with a large share of White Medicaid enrollees describing their insurance as excellent. Across all racial and ethnic groups, 80% or more of enrollees rate their Medicaid positively. White adults are the most likely to refer to their insurance as “excellent,” with more than 4 in 10 White adults (44%) describing their Medicaid coverage this way compared to 34% of Hispanic adults and 29% of Black adults. Larger shares of White Medicaid enrollees compared to Black or Hispanic enrollees also report the quality of doctors and hospitals available to them as “excellent.” Notably, for problems frequently faced by Medicaid enrollees, such as prior authorization or provider availability, similar shares of Black, White, and Hispanic adults report experiencing these issues.

Interactive DataWrapper Embed

Among those with Medicaid, Black adults are the most likely to have received care in an emergency room at least once in the past year. Nearly six in ten Black Medicaid enrollees report receiving care in an emergency room in the past year, compared to about four in ten White and Hispanic Medicaid enrollees. As noted above, adults with Medicaid are more likely than adults with any other insurance type to report receiving care in the emergency room.

Among Those With Medicaid, Black Adults Are The Most Likely To Have Received Care In An Emergency Room

Not surprisingly, Medicaid enrollees who utilize more health care services experience more problems with their insurance. Across all insurance types, adults with fair or poor health status – who have greater need for health care – are more likely to face problems such as lack of appointment availability and high prescription drug costs. In addition to health status, those who have more frequent interactions with their health insurance are also more likely to report problems. When comparing Medicaid enrollees who had over ten visits in the past 12 months to enrollees who had two or fewer visits, high health care utilizers are much more likely to have experienced a problem with their health insurance than lower users. Higher shares of moderate health care utilizers (those who had seen a provider between three to ten times in the past 12 months) also tended to face problems with their insurance compared to low utilizers. These high and moderate health care utilizers are more likely to report that a doctor they needed to see did not have available appointments, that a mental health therapist, treatment, or prescription was not covered by their insurance, or that their health insurance did not cover or required a very high copay for a prescription drug. Compared to both moderate and low health care utilizers, high utilizers are more likely to report running into prior authorization issues or reaching the limit on the number of visits or services their insurance would pay for a specific illness or injury.

Medicaid Enrollees Who Utilize More Health Care Services Experience More Problems With Their Insurance

What to Watch

Recent federal proposed rules attempt to address some issues related to availability of providers and access in Medicaid. On April 27, 2023, the Biden Administration released two notices of proposed rulemaking (NPRMs) to help ensure access to quality health care in Medicaid and the Children’s Health Insurance Program (CHIP). The proposed rules include changes to Medical Care Advisory Committees (to allow for more meaningful engagement from Medicaid enrollees), increase transparency for fee-for-service (FFS) and managed care payments, establish national maximum appointment wait time standards for managed care enrollees, and require state monitoring related to access and network adequacy for managed care plans. Currently, federal law requires Medicaid managed care plans to assure that they have capacity to serve expected enrollment in their service area and maintain a sufficient number, mix, and geographic distribution of providers but there are no uniform standards.

Centers for Medicare and Medicaid Services (CMS) proposed rules, Office of the Inspector General (OIG) recommendations, and state legislation could help to address Medicaid prior authorization issues. Prior authorization is a tool long used to control spending and promote cost effective care, but it can also delay care and result in negative clinical outcomes. A recent review by the U.S. Department of Health and Human Services OIG found that in 2019, Medicaid MCOs had an overall prior authorization denial rate of 12.5% – more than double the Medicare Advantage rate. The OIG recommended stronger state monitoring of denials and a requirement for automatic external medical reviews following MCO appeal denials. In December of 2022, the Biden Administration also proposed prior authorization regulations that would apply to Medicaid and other coverage types, but these rules focus mostly on streamlining processes, improving transparency, and reducing approval wait times. While CMS has not yet finalized these proposed prior authorization rules, a final rule may be published soon.

A range of state regulatory actions have also focused on prior authorization practices. New state laws or updates to existing ones affecting prior authorization for Medicaid enrollees have passed in states such as Georgia, Illinois, and Washington state. State requirements include: new reporting on prior authorization standards and claims denials, shortened time frames for decision-making, allowing certain providers to bypass prior authorization to limit delays (e.g. “gold carding”), and restrictions on the use of clinical criteria developed by insurers to make coverage decisions. California has also recently began relaxing prior authorization requirements for diabetes care for Medi-Cal members.

Conclusion

Overall, most adults rate their insurance coverage favorably but the complex nature of health care and differences in insurance design and out-of-pocket costs lead to variations in beneficiary experiences. Compared to adults with private coverage or Medicare, Medicaid enrollees are more likely to face problems with provider availability and prior authorization and are at greater risk of experiencing negative outcomes as a result of problems with their insurance, including a decline in their health. However, because of federal rules that limit out-of-pocket costs, Medicaid enrollees are less likely to report cost-related problems or difficulty understanding what they would owe out of pocket. Pending federal rules addressing provider availability for Medicaid managed care enrollees may improve access to care for these enrollees. Proposed regulations from the Biden administration may streamline prior authorization processes and impact wait times but fall short of OIG recommendations for stronger state monitoring of denials and required automatic external medical reviews.

This work was supported in part by the Robert Wood Johnson Foundation. KFF maintains full editorial control over all of its policy analysis, polling, and journalism activities.

Methodology

This KFF Survey of Consumer Experiences with Health Insurance was designed and analyzed by researchers at KFF. The survey was designed to reach a representative sample of insured adults in the U.S. The survey was conducted February 21–March 14, 2023, online and by telephone among a nationally representative sample of 3,605 U.S. adults who have employer sponsored insurance plans (978), Medicaid (815), Medicare (885), Marketplace plans (880), or a Military plan (47). The margin of sampling error is plus or minus 2 percentage points for the full sample and plus or minus 5 percentage points for adults with Medicaid as their main source of health coverage.

The sample includes 2,595 insured adults reached through the SSRS Opinion Panel either online or over the phone (n=75 in Spanish). Another 504 respondents were reached online through the Ipsos Knowledge Panel. Another 289 (n=10 in Spanish) interviews were conducted from a random digit dial (RDD) of prepaid cell phone numbers (n=190) and landline telephone numbers (n=99). An additional 217 respondents were reached by calling back respondents who said they were insured in previous KFF probability-based polls.

Respondents were weighted separately to match each group’s demographics using data from the 2021 American Community Survey (ACS). Weighting parameters included gender, age, education, race/ethnicity, and region.

For full details on the survey methodology, see the Methodology tab of the KFF Survey of Consumer Experiences with Health Insurance.

Poll Finding

KFF COVID-19 Vaccine Monitor November 2023: With COVID Concerns Lagging, Most People Have Not Gotten Latest Vaccine And Half Say They Are Not Taking Precautions This Holiday Season

Published: Nov 17, 2023

Findings

Key Takeaways

The latest KFF COVID-19 Vaccine Monitor survey suggests the lack of public concern about getting sick from COVID-19 may be why many people have not gotten the latest vaccine and why half of the public are not planning on taking precautions to limit the spread of the virus during the coming months.

  • As the public heads into the fourth holiday season with the virus, about half of adults say they do not plan to get the latest vaccine which became publicly available nearly two months ago. This includes three in ten of those who were previously vaccinated. A quarter of the public say that while they have not gotten the latest vaccine, they intend to do so.
  • That leaves about two in ten adults reporting having gotten the latest COVID-19 vaccine. Consistent with demographic differences across other COVID-related behaviors, uptake of the new vaccine is highest among those ages 65 and older (34%) and Democrats (32%). Smaller shares of younger adults ages 18-29 (18%), Republicans (11%) and independents (16%) report getting the latest vaccine. Similar shares across racial and ethnic groups say they have gotten the updated vaccine, including 26% of Black adults, 20% of Hispanic adults, and 19% of White adults. However, when combining the shares who have gotten the shot and those who intend to get it, Black adults (59%) and Hispanic adults (59%) both outpace White adults (42%).
  • The latest COVID-19 Vaccine Monitor survey explores why previously vaccinated people haven’t received the latest vaccine and finds decreasing concerns around the virus tops the list of reasons. About half (52%) of those who were previously vaccinated but haven’t gotten the latest shot say lack of worry about COVID-19 is a reason why they haven’t gotten the vaccine. Getting vaccinated is also seemingly not the priority it once was, with many also saying they haven’t gotten it because they have been too busy (37%) or that they are waiting to get it a later date (32%).
  • With the upcoming winter holidays, small shares of the public are worried COVID-19 will impact their holiday plans. About three in ten are worried they will spread COVID-19 to people close to them (31%) or that they will get seriously sick from COVID-19 (28%), and about a quarter (26%) worry they will get COVID-19 over the holidays. A larger share of the public is worried about increased hospitalizations, with almost half (46%) saying they are “very” or “somewhat worried” that there will be an increase in hospitalizations in the U.S. this winter.
  • The public is divided on precautions this upcoming season, with half of adults saying they are planning to take at least one of several precautions to limit the spread of COVID this fall and winter, while the other half are not planning to take any of the precautions asked about in the survey. The most common precautions people say they plan to take are avoiding large gatherings (35%) or wearing a mask in crowded places (30%). Smaller shares say they are avoiding travel this fall and winter (25%), avoiding dining indoors at restaurants (19%), or taking a COVID-19 test before visiting with friends or family (18%). Some groups are more likely to report taking such precautions including majorities of Black adults (72%), Hispanic adults (68%), Democrats (66%), and just over half (53%) of vaccinated adults. 

The Latest COVID-19 Vaccine Uptake And Intentions

The November KFF COVID-19 Vaccine Monitor investigates uptake for the new, updated COVID-19 vaccine, which has been recommended by the CDC for people ages 6 months and older. Two months after the vaccine became available, about half of adults say they have gotten or will get the shot, but another half say they won’t get the latest shot and a third seem steadfast in that decision.

One in five (20%) adults now say they have received the new, updated COVID-19 vaccine that became available in September. An additional one in four adults say they will “definitely get” (13%) or “probably get” (15%) the updated shot. Consistent with demographic differences across other COVID-related behaviors, uptake is highest among those ages 65 and older (34%) and Democrats (32%). This is meaningful given that those ages 65 and older are more vulnerable to COVID-19, as they’re more likely to get seriously sick and experience complications that could result in hospitalization. This is in comparison to smaller shares of younger adults ages 18-29 (18%), Republicans (12%) and independents (16%) who report getting the latest vaccine. Similar shares across racial and ethnic groups report having gotten the updated vaccine, including 26% of Black adults, 20% of Hispanic adults, and 19% of White adults. However, when combining the shares who have gotten the shot and those who intend to get it, Black adults (59%) and Hispanic adults (59%) both outpace White adults (42%).

Uptake of the newest vaccine matches closely to uptake of the updated bivalent booster measured in December 2022, just after the updated bivalent COVID-19 booster had become available for use. About two in ten adults said they had received the booster dose (22%).

One in three (34%) adults say they will “definitely not” get the new COVID-19 vaccine, and another 17% say they will “probably not” get the vaccine. The share who say they “probably” or “definitely” won’t get the new COVID-19 vaccination has remained unchanged from the September COVID-19 Vaccine Monitor, which was fielded immediately prior to when the vaccine became available.

Majorities of those who have never received any COVID-19 vaccine (94%), Republicans (77%), independents (59%), those who live in rural areas (65%), White adults (58%), and those under the age of 65 (55%) continue to say they will not get the updated COVID-19 vaccine.

One In Five Adults Report Having Gotten The Updated COVID-19 Vaccine, Including Larger Shares Of Those Ages 65 And Older

The survey finds that partisanship is continuing to play an outsized role in vaccine attitudes. While nearly six in ten White adults say they do not plan to get the new vaccine, this increases to eight in ten among White adults who self-identify as Republicans. This is more than twice the share of White adults who are Democrats (29%) who say they will either “definitely not” or “probably not” get the vaccine. In fact, three in ten (31%) White adults who are Democrats have already gotten the new vaccine, compared to 11% of their Republican counterparts.

Most adults (79%) say they have heard at least “a little” about the updated COVID-19 vaccine, with one in five (22%) saying they have heard “a lot.” A small share (21%) say they have heard “nothing at all” about the updated vaccine.

Awareness is high across demographic groups, including the vast majority (92%) of adults ages 65 and older who have heard at least “a little” about the updated vaccine compared to a somewhat smaller share, but still a majority, of younger adults, including six in ten of those ages 18 to 29. Larger shares of Democrats are also more aware of the vaccine, with 86% who have heard at least “a little” compared to three-quarters (74%) of Republicans.

Majorities Have Heard At Least "A Little" About New COVID-19 Vaccine, Despite Lackluster Uptake

With most people aware of the latest vaccine, many, including large shares of previously vaccinated adults, have not yet received the updated shot and some don’t plan to. About six in ten (58%) adults are previously vaccinated and have yet to get the updated vaccine. This group is roughly divided between people who say they will get the vaccine and those who say they are not planning to get the latest shot. The latest COVID-19 Vaccine Monitor survey explores why this group of previously vaccinated people have not gotten the latest dose.

Six In Ten Have Been Previously Vaccinated For COVID-19 But Have Not Gotten The Updated Vaccine

Around half of adults (47%) have both previously received a COVID-19 vaccine and also say they will get or have already gotten the updated vaccine. On the other hand, one in five (20%) adults are previously unvaccinated and say they will not get the updated vaccine. That leaves three in ten (31%) who have previously been vaccinated but now say they will not get the updated shot.

More than four in ten Republicans (43%) and one in three independents (35%) say they are previously vaccinated but won’t get the updated shot, compared to 19% of Democrats. A larger share of White adults (34%) also report being previously vaccinated but not planning on getting the latest shot compared to Black adults (20%). Around a quarter of Hispanic adults (26%) are previously vaccinated but now do not plan to get the latest vaccine.

Three In Ten Adults Say They're Vaccinated For COVID-19 But Will Not Get The New Vaccine, Including Over Four In Ten Republicans

Decreasing Concerns About COVID top The Reasons for Not Getting the Latest Vaccine

In 2021, KFF surveys examining initial vaccine rollout found that concerns about vaccine safety were the driving reason why people didn’t get vaccine. Even as those concerns dissipated among most of the public, a small share of the public remained steadfast and never received a COVID-19 vaccine. Yet, subsequent booster never reached the same uptake levels as seen in the initial vaccine rollout. And as the country enters its fourth year of COVID-19 concerns, it appears this trend continues.

When asked about a series of reasons that could explain why people are not getting the latest vaccine, not being worried about getting COVID-19 tops the list. About half (52%) of those who were previously vaccinated say lack of worry about COVID-19 is at least a minor reason why they haven’t gotten the vaccine, including a quarter who say it is a “major reason.” Getting vaccinated may also not be a priority for some with around four in ten (37%) saying being too busy is at least a minor reason why they have not gotten it yet, and another third saying they are waiting to get it a later date. Experiences from previous doses may also be keeping people from getting the new vaccine with about a quarter saying that bad side effects from a previous COVID-19 vaccine dose is a reason why they have not gotten the new vaccine.

Small shares say there are other barriers to getting the vaccine including 16% who say they cannot take the time off work and 13% who say they haven’t been able to get an appointment. One in ten (11%) say their doctor told them to wait or to not to get the updated vaccine.

Over Half Of Vaccinated Adults Who Haven't Gotten The New Shot Cite Not Being Worried About COVID-19 As Reason For Not Getting It

Among Hispanic adults who were previously vaccinated but have not gotten the new shot, about half (55%) say they aren’t worried about getting COVID-19, they are too busy (51%), or they are waiting to get it at a later date (48%). In addition, a third (35%) of Hispanic adults as well as a quarter (22%) of Black adults cite not being able to take time off work, compared to just one in ten (9%) White adults.

Larger Shares Of Black Adults And Hispanic Adults Cite Not Being Able To Take Time Off Work As Reason For Not Getting Updated COVID-19 Vaccine

Democrats’ top reasons for not getting the updated COVID-19 vaccine suggests there will likely still be additional uptake in this group, while Republicans’ top reasons may indicate more resistance to the latest vaccine. Among those who were previously vaccinated but haven’t gotten the new shot, half of Democrats (49%) say being too busy is a “major” or “minor” reason they haven’t gotten the updated vaccine yet, compared to 22% of Republicans and 35% of independents. On the other hand, two-thirds of Republicans (66%) and more than half of independents (57%) say not being worried about getting COVID is at least a minor reason why they have not gotten the updated vaccine, compared to a third of Democrats (35%).

Two-Thirds Of Republicans Cite Lack Of Worry Of COVID-19 Infection As Reason For Not Getting Updated Vaccine, Half Of Democrats Say They Have Been Too Busy

Half Of The Public Says COVID-19 Isn’t Changing Their Holiday Plans

With fall and winter holidays coming up, the possibility of a further wave of COVID-19 infections is looming with increased indoor gatherings and time with friends and family. Yet, most of the public is not worried about spreading or catching COVID-19 over the coming months. About three in ten adults are worried they will spread COVID-19 to people close to them (31%) or they will get seriously sick from COVID-19 (28%), and about a quarter (26%) are worried they will get COVID-19 over the holidays. A larger share of the public is worried about increased hospitalizations, with almost half (46%) saying they are “very” or “somewhat worried” that there will be an increase in hospitalizations in the U.S. this winter.

At Least Half Of Adults Are Not Worried About Increases In COVID-19 Cases And Hospitalizations, Getting COVID-19 Over The Holidays

Older adults are not more worried than younger adults about the spread of COVID-19 this holiday season except for concerns about increases in cases and hospitalizations. Around half (53%) of adults ages 65 and older say they are worried that there will be an increase in COVID-19 cases and hospitalizations this winter, compared to smaller shares (44%) of those under the age of 65.

Around the same share say they are “very” or “somewhat worried” about an increase in COVID-19 cases and hospitalizations this winter as were in December of last year when there was a similar uptick in COVID-19 cases.

Similar Shares Of Adults Say They Are Worried About An Increase In COVID-19 Cases And Hospitalizations This Winter Compared To 2022

Precautions Against COVID-19

In addition to not being worried about COVID-19 during the upcoming holidays, the public is divided on precautions, with half of adults saying they aren’t planning to take any of the precautions asked about in the survey, while the other half report they plan to take at least one precaution this fall and winter. The most common precautions people said they planned to take were avoiding large gatherings (35%) or wearing a mask in crowded places (30%). Smaller shares say they are avoiding travel this fall and winter as a precaution against COVID-19 (25%), avoiding dining indoors at restaurants (19%), or taking a COVID-19 test before visiting with friends or family (18%).

The share who say they plan to take precautions to limit the spread of COVID is similar to the share of the public who said they were taking precautions because of the “tripledemic” back in January of this year. Back then, about half (46%) of adults said the news of COVID-19, RSV, and the flu spreading that winter had made them more likely to take a precaution, including three in ten (31%) who said they were more likely to wear a mask in public and a quarter (26%) who were more likely to avoid large gatherings.

While four in ten (39%) White adults say they will take at least one precaution, majorities of Black adults (72%) and Hispanic adults (68%) report they are planning to take any of the precautions mentioned.

Similarly, partisanship and previous vaccine uptake continue to be strong predictors of whether people plan to take precautions to limit the spread of the virus. Two thirds (66%) of Democrats and half (48%) of independents say they plan to take at least one precaution, compared to three in ten (29%) Republicans who say the same. Just over half (53%) of vaccinated adults say they are taking any of the precautions, compared to four in ten (39%) unvaccinated adults.

Half Of Adults Say They Are Not Taking Precautions Because Of COVID-19 This Fall And Winter

Similar shares of younger and older adults report that they will be taking at least one precaution during the fall and winter. However, four in ten (41%) adults ages 65 and older say they plan to avoid large gatherings, compared to a third (33%) of those under the age of 65. While younger adults are less likely to say they will avoid large gatherings, larger shares of younger adults say they will take a test for COVID-19 before spending time with friends of family, with 21% who say so (including 25% of those ages 18-29), compared to one in ten (10%) of those ages 65 and older.

Methodology

This KFF Health Tracking Poll/COVID-19 Vaccine Monitor was designed and analyzed by public opinion researchers at KFF. The survey was conducted October 31- November 7, 2023, online and by telephone among a nationally representative sample of 1,301 U.S. adults in English (1,222) and in Spanish (79). The sample includes 1,016 adults (n=52 in Spanish) reached through the SSRS Opinion Panel either online (n=991) or over the phone (n=25). The SSRS Opinion Panel is a nationally representative probability-based panel where panel members are recruited randomly in one of two ways: (a) Through invitations mailed to respondents randomly sampled from an Address-Based Sample (ABS) provided by Marketing Systems Groups (MSG) through the U.S. Postal Service’s Computerized Delivery Sequence (CDS); (b) from a dual-frame random digit dial (RDD) sample provided by MSG. For the online panel component, invitations were sent to panel members by email followed by up to three reminder emails.

Another 285 (n=27 in Spanish) interviews were conducted from a random digit dial telephone sample of prepaid cell phone numbers obtained through MSG. Phone numbers used for the prepaid cell phone component were randomly generated from a cell phone sampling frame with disproportionate stratification aimed at reaching Hispanic and non-Hispanic Black respondents. Stratification was based on incidence of the race/ethnicity groups within each frame.

Respondents in the phone samples received a $15 incentive via a check received by mail, and web respondents received a $5 electronic gift card incentive (some harder-to-reach groups received a $10 electronic gift card). In order to ensure data quality, cases were removed if they failed attention check questions in the online version of the questionnaire, or if they had over 30% item non-response, or had a length less than one quarter of the mean length by mode.  Based on this criterion, one case was removed.

The combined cell phone and panel samples were weighted to match the sample’s demographics to the national U.S. adult population based on parameters derived from the Census Bureau’s 2022 Current Population Survey (CPS), 2021 Volunteering and Civic Life Supplement data from the CPS, and the 2023 KFF Benchmarking survey with ABS and prepaid cell phone samples. The demographic variables included in weighting for the general population sample are sex, age, education, race/ethnicity, region, education, civic engagement, internet use, and political party identification by race/ethnicity.  The sample of registered voters was weighted separately to match the U.S. registered voter population using the parameters above plus recalled vote in the 2020 presidential election by county quintiles grouped by Trump vote share. Both weights take into account differences in the probability of selection for each sample type (prepaid cell phone and panel). This includes adjustment for the sample design and geographic stratification of the cell phone sample, within household probability of selection, and the design of the panel-recruitment procedure.

The margin of sampling error including the design effect for the full sample and registered voters is plus or minus 4 percentage points. Numbers of respondents and margins of sampling error for key subgroups are shown in the table below. For results based on other subgroups, the margin of sampling error may be higher. Sample sizes and margins of sampling error for other subgroups are available by request. Sampling error is only one of many potential sources of error and there may be other unmeasured error in this or any other public opinion poll. KFF public opinion and survey research is a charter member of the Transparency Initiative of the American Association for Public Opinion Research.

GroupN (unweighted)M.O.S.E.
Total1,301± 4 percentage points
Total Registered Voters1,072± 4 percentage points
Republican Registered Voters342± 7 percentage points
Democratic Registered Voters333± 7 percentage points
Independent Registered Voters296± 7 percentage points
 
Race/Ethnicity
White, non-Hispanic719± 5 percentage points
Black, non-Hispanic218± 9 percentage points
Hispanic247± 8 percentage points
News Release

Most Black and Hispanic Adults Expect to Get the New COVID-19 Vaccine, Though Most White Adults Don’t

Two-Thirds of the Public Aren’t Worried About Getting Sick or Spreading the Virus Over the Holidays

Published: Nov 17, 2023

The latest KFF COVID-19 Vaccine Monitor survey reveals that half (51%) of all adults nationally say they “definitely” or “probably” will not get the latest COVID-19 vaccine, with many saying that they aren’t worried about catching the virus.

One in five (20%) say that they’ve already gotten the new vaccine that became available in September, with an additional 28% saying they “definitely” or “probably” will get the new shot. The rest say they “definitely” or “probably” will not get the new shot – a large group that includes three-in-10 (31%) of all adults who previously got a COVID vaccine but now say they don’t plan to get the updated vaccine.

Most Black adults (59%) and Hispanic adults (59%) say they have either already gotten the vaccine or expect to get the new vaccine. In contrast, most White adults (58%) say they “definitely” or “probably” will not get it. Partisanship also continues to play an outsized role in vaccine attitudes. For example, eight-in-10 (80%) White adults who identify as Republicans say they do not plan to get the new vaccine – more than twice the share of White adults who identify as Democrats (29%).

Among previously vaccinated adults who have not yet gotten latest vaccine, half (52%) cite a lack of concern about getting the virus as a reason. Fewer say being too busy (37%), waiting to get it later (32%), or having had bad side effects after a previous dose (27%) are all reasons why they haven’t gotten the new shot.

About one-in-six (16%) say that they can’t afford to take time off work to get the vaccine, including more than a third (35%) of Hispanic adults and one-in-five (22%) Black adults. About one-in-eight (13%) cite not being able to get a vaccine appointment as a reason for not getting the new shot.

Heading into the fourth holiday season since COVID-19 emerged, most people are not too worried about its potential impact on themselves or their friends and families, the survey shows.

For instance, three quarters (74%) of the public say that they are “not too worried” or “not at all worried” about getting COVID-19 over the holidays, almost three times the share who are “very” or “somewhat” worried (26%). At least two- thirds (68%) say that they are not worried about spreading the virus to people close to them, more than twice the share who are worried (31%).

The public is split on precautions being taken because of COVID-19 this fall and winter. Half (50%) of the public plans to take at least one of five potential precautions to reduce their risks during the fall and winter: Avoiding large gatherings (35%); wearing a mask in crowded places (30%); avoiding travel (25%); avoiding indoor restaurants (19%); or taking a COVID-19 test before visiting family and friends (18%). The other half plans to take none of those precautions.

People who are at least 65 years old – a group especially at risk of severe COVID-19 illness – are among the most likely to say that they’ve already gotten the new vaccine (34%), though they are no more likely than younger adults to say that they plan to take at least one of the five precautions.

Black (72%) and Hispanic (68%) adults are much more likely than White adults (39%) to say they plan to take at least one of those precautions. Similarly, Democrats (66%) are more than twice as likely as Republicans (29%) to say they plan to take precautions.

Designed and analyzed by public opinion researchers at KFF, the survey was conducted from October 31-November 7, 2023, online and by telephone among a nationally representative sample of 1,401 U.S. adults. Interviews were conducted in English and in Spanish. The margin of sampling error is plus or minus 4 percentage points for the full sample. For results based on other subgroups, the margin of sampling error may be higher.

KFF COVID-19 Vaccine Monitor Dashboard

The KFF COVID-19 Vaccine Monitor dashboard provides an overview of the findings on several key topics highlighted below.

Interactive DataWrapper Embed

LATEST COVID-19 Vaccine

  • Democrats, Older Adults, College Graduates, Among Largest Shares To Have Ever Been Vaccinated

    Democrats, Older Adults, College Graduates, Among Largest Shares To Have Ever Been Vaccinated

    The COVID-19 Vaccine Monitor finds that around three-quarters of adults say they have ever received at least one dose of a COVID-19 vaccine, a share that continues to hold relatively steady since September 2021. Democrats (91%), older adults (91%), and college graduates (88%) continue to report the highest rates of vaccination. Those under the age of 65 without health insurance (61%) and Republicans (66%) continue to report lower COVID-19 vaccine uptake than their counterparts.

  • One In Five Adults Report Having Gotten The Updated COVID-19 Vaccine, Including Larger Shares Of Those Ages 65 And Older

    One In Five Adults Report Having Gotten The Updated COVID-19 Vaccine, Including Larger Shares Of Those Ages 65 And Older

    One in five (20%) adults now say they have received the new, updated COVID-19 vaccine that became available in September. An additional one in four adults say they will “definitely get” (13%) or “probably get” (15%) the updated shot. Consistent with demographic differences across other COVID-related behaviors, uptake is highest among those ages 65 and older (34%) and Democrats (32%). This is in comparison to smaller shares of younger adults ages 18-29 (18%), Republicans (12%) and independents (16%) who report getting the latest vaccine

Majorities Have Heard At Least “A Little” About New COVID-19 Vaccine, Despite Lackluster Uptake

Most adults (79%) say they have heard at least “a little” about the updated COVID-19 vaccine, with one in five (22%) saying they have heard “a lot.” A small share (21%) say they have heard “nothing at all” about the updated vaccine.
Awareness is high across demographic groups, including the vast majority (92%) of adults ages 65 and older who have heard at least “a little” about the updated vaccine compared to a somewhat smaller share, but still a majority, of younger adults, including six in ten of those ages 18 to 29. Larger shares of Democrats are also more aware of the vaccine, with 86% who have heard at least “a little” compared to three-quarters (74%) of Republicans.

Majorities Have Heard At Least "A Little" About New COVID-19 Vaccine, Despite Lackluster Uptake

PARENTS AND KIDS

  • Teenagers Are Most Likely To Have Previously Gotten COVID-19 Vaccine, Smaller Shares Of Parents Of Younger Children

    Teenagers Are Most Likely To Have Previously Gotten COVID-19 Vaccine, Smaller Shares Of Parents Of Younger Children

    The COVID-19 Vaccine Monitor has consistently shown COVID-19 vaccine uptake has been higher among older kids, with half of parents of teenagers saying their child has received at least one dose of the vaccine, compared to a quarter of parents of kids between 6 months and 4 years old, and two in five parents of kids between 5 and 11 years old.

  • Over Half Of Parents Say They Won't Get New COVID-19 Vaccine For Their Child

    Over Half Of Parents Say They Won't Get New COVID-19 Vaccine For Their Child

    The new version of the COVID-19 vaccine has been recommended for all children ages 6 months and older and unlike previous COVID-19 vaccines, most parents say they will either “probably not get” or “definitely not get” their child, regardless of age, vaccinated. Six in ten parents of teenagers (those between the ages of 12 and 17) say they will not get their child the new COVID-19 vaccine as do two-thirds of parents of children ages 5 to 11 (64%) and ages 6 months to 4 years old (66%).

  • Most Parents Understand Logistics Of Children's Vaccines, But Some Struggle Understanding Which Vaccines Their Children Should Get And The Costs

    Most Parents Understand Logistics Of Children's Vaccines, But Some Struggle Understanding Which Vaccines Their Children Should Get And The Costs

    Most parents report that it is easy to understand the logistics of their vaccinations, such as when and where to get the shots and why their child should get vaccinated. Nearly nine in ten (88%) parents say it is easy to know where to go to get their children vaccinated and about three-fourths of parents say the same about why their children should get vaccines in general (78%), when their child should get certain vaccines (77%), or which vaccines their child should get (73%). Two-thirds (68%) say it is easy for them to understand how much they have to pay out-of-pocket for their child’s vaccines. Most insurance coverages require no out-of-pocket costs for recommended vaccines for children.   

  • Large Majorities Of Parents, Regardless Of Partisanship, Keep Their Child's Vaccines Up-To-Date

    Large Majorities Of Parents, Regardless Of Partisanship, Keep Their Child's Vaccines Up-To-Date

    Adherence to recommended vaccines is higher among children than adults overall. Nine in ten parents say they normally keep their child or children up-to-date with recommended childhood vaccines, such as the MMR vaccine, while one in ten say they have delayed or skipped some of their child’s vaccines.
    Large majorities of parents, regardless of partisanship, race and ethnicity and income, say they keep their child up-to-date including nearly all Democratic and Democratic-leaning parents (97%) and about nine in ten Republican or Republican-leaning parents.

Majorities Of Parents Of Children Between 6 Months and 4 Years Concerned About Long-Term, Serious Side Effects Of COVID-19 Vaccine In Children

Parents’ worries about side effects and about the newness of the vaccines have been evident throughout the COVID-19 Vaccine Monitor when they explain in their own words why they would not get their young child vaccinated for COVID-19 right away. Parents’ concerns about the efficacy of the vaccine and the feeling that the vaccine is not needed have also been apparent in some of the reasons they give for not vaccinating their young child. Notably, more than four in ten (44%) Black parents of unvaccinated children under 5 years old said they were concerned they might need to take time off work to get their child vaccinated or care for them if they experience side effects. Among Hispanic parents of young unvaccinated children, 45% said they were concerned about being able to get the vaccine for their child from a place they trust and about a third (36%) expressed concern that they might have to pay an out-of-pocket cost to get their child the vaccine.

Majorities Of Parents Of Children Between 6 Months and 4 Years Concerned About Long-Term, Serious Side Effects Of COVID-19 Vaccine In Children

Perceived Lack Of Research, Potential Side Effects, And Safety Concerns Among The Top Reasons Why Parents Said They Won’t Vaccinate Their Young Children

Parents who had not yet vaccinated their eligible children under 5 and did not plan to do so right away when the vaccine was first being recommended to the age group offer many different reasons why they are reluctant to get their child vaccinated. Concerns about the newness of the vaccine and not enough testing or research (19%) emerged as a top reason why parents did not plan to vaccinate their young children as soon as possible. Concerns over side effects (14%) and the overall safety of the vaccines (13%) were also prominent reasons given by parents as to why they did not plan on vaccinating their young child. Some parents (11%) said they did not think their child needed the vaccine or say they were not worried about COVID-19.

Perceived Lack Of Research, Potential Side Effects, And Safety Concerns Are Among The Top Reasons Why Parents Say They Won't Vaccinate Their Young Children

Black And Hispanic Parents Were Less Likely Than White Parents To Feel Their Child Was Very Safe From COVID-19 At School

Nearly half of parents with a child in school said they thought their child was “very safe” (44%) from the risk of exposure to COVID-19 when they are at school in April, 2022. An additional 40% thought their child was “somewhat safe”. However, parents who are Black or Hispanic were less likely than White parents to say they felt their child was “very safe” from COVID-19 when they were at school.


Black And Hispanic Parents Are Less Likely Than White Parents To Feel Their Child Is Very Safe From COVID-19 At School

Partisanship and politics

Two-Thirds Of Republicans Cite Lack Of Worry Of COVID-19 Infection As Reason For Not Getting Updated Vaccine, Half Of Democrats Say They Have Been Too Busy


Democrats’ top reasons for not getting the updated COVID-19 vaccine suggests there will likely still be additional uptake in this group, while Republicans’ top reasons may indicate more resistance to the latest vaccine. Among those who were previously vaccinated but haven’t gotten the new shot, half of Democrats (49%) say being too busy is a “major” or “minor” reason they haven’t gotten the updated vaccine yet, compared to 22% of Republicans and 35% of independents. On the other hand, two-thirds of Republicans (66%) and more than half of independents (57%) say not being worried about getting COVID is at least a minor reason why they have not gotten the updated vaccine, compared to a third of Democrats (35%).

Two-Thirds Of Republicans Cite Lack Of Worry Of COVID-19 Infection As Reason For Not Getting Updated Vaccine, Half Of Democrats Say They Have Been Too Busy
  • Six In Ten Adults Say They Will Get Annual Flu Shot, Including Eight In Ten Older Adults

    Six In Ten Adults Say They Will Get Annual Flu Shot, Including Eight In Ten Older Adults

    Six in ten adults (58%) say they will get a flu shot this year including 2% who say they have already gotten their flu shot. This includes eight in ten adults ages 65 and older, as well as three in four Democrats. Those who report normally getting a flu shot (53% of all adults) are nearly six times as likely as those who do not normally get a flu shot to say they will get it this year. About half of Republicans (51%) and independents (49%) say they will get their annual flu shot or have already gotten it.

  • Majorities Across Groups Are Confident In Vaccine Safety, Except For Republicans When It Comes To COVID-19 Vaccines

    Majorities Across Groups Are Confident In Vaccine Safety, Except For Republicans When It Comes To COVID-19 Vaccines

    Amidst news of the impending virus season, most adults think that the vaccines developed to combat these viruses are safe. While a majority of adults are confident in the safety of the COVID-19 vaccine (57%), it lags slightly behind confidence in the RSV vaccine (65%) and the flu vaccine (74%). Majorities across age groups, racial and ethnic identities, and partisanship are confident in the safety of all three vaccines – with one notable exception. About one in three Republicans say they are “very confident” or “somewhat confident” in the safety of the COVID-19 vaccine (36%), compared to more than half of Republicans who are confident the RSV vaccine is safe (52%) and nearly two-thirds who are confident in the safety of the flu vaccine (64%).

Compared To 2019, More Adults Said Parents Should Be Able To Decide Not To Vaccinate Their Children For Measles, Mumps, And Rubella In Winter, 2022

Democrats’ top reasons for not getting the updated COVID-19 vaccine suggests there will likely still be additional uptake in this group, while Republicans’ top reasons may indicate more resistance to the latest vaccine. Among those who were previously vaccinated but haven’t gotten the new shot, half of Democrats (49%) say being too busy is a “major” or “minor” reason they haven’t gotten the updated vaccine yet, compared to 22% of Republicans and 35% of independents. On the other hand, two-thirds of Republicans (66%) and more than half of independents (57%) say not being worried about getting COVID is at least a minor reason why they have not gotten the updated vaccine, compared to a third of Democrats (35%).

Compared To 2019, More Adults Now Say Parents Should Be Able To Decide Not To Vaccinate Their Children For Measles, Mumps, And Rubella
  • Large Shares Across Partisans Questioned The Value Of The Updated COVID-19 Booster

     Large Shares Across Partisans  Questioned The Value Of The Updated COVID-19 Booster

    The top reasons given by those eligible for the new booster who had not yet gotten it have been similar across partisans, but the share who cited each reason varied. Majorities of Republicans or Republican-leaning independents said they had not gotten the booster because they felt they had enough protection from a previous dose or infection (62%), or they didn’t think they needed it (56%). These were also the top reasons given by Democrats and Democratic-leaning independents, but four in ten of this group (43%) said they felt they had enough protection and about one in three (34%) said they didn’t think they needed the new booster. Other reasons were more frequently mentioned by Democrats and Democratic-leaning independents than Republicans, including being too busy or not having time (37% vs. 17%), that they couldn’t afford to take time off work to get the booster or deal with side effects (19% vs. 10%), or they were not sure how or where to get the booster (15% vs. 6%). Notably, one-fourth (27%) of Republicans said they had not gotten a booster because they thought “COVID is over.”

  • Majorities Across Partisans Trust Health Care Providers, Public Health Agencies Rank Lower Among Republicans

    Majorities Across Partisans Trust Health Care Providers, Public Health Agencies Rank Lower Among Republicans

    While large majorities across partisans say they trust their own doctor or child’s pediatrician, government sources of information like the CDC, local public health departments, and the FDA fare much worse among Republicans. About four in ten Republicans say they trust the FDA (42%) or the CDC (40%) to provide reliable information about vaccines, and about half of Republicans (51%) say the same about their local public health departments. Large majorities of Democrats and more than half of independents say they trust each of these organizations at least a fair amount.

Adults Split On Whether K-12 Schools Should Require COVID-19 Vaccines, With Significant Partisan Divides


The public has been divided on whether K-12 schools should require their staff and eligible students to get a COVID-19 vaccine, with similar shares who said schools should (46%) and should not (51%) require vaccines, in February, 2022. Three-fourths of Democrats (76%) said schools should require COVID-19 vaccinations while more than eight in ten Republicans (84%) said schools should not. Independents were more likely to say schools should not require COVID-19 vaccines (56%) than to say they should be required (40%). Six in ten parents said schools should not require vaccines including majorities of parents of teens ages 12-17 (58%), children 5 to 11 years old (66%), and children under age 5 (59%).

Interactive DataWrapper Embed
  • Health Care Providers Are The Most Trusted Sources For Vaccine Information

    Health Care Providers Are The Most Trusted Sources For Vaccine Information

    More than eight in ten adults (82%) say they trust their own doctor or health care provider at least a fair amount when it comes to providing reliable information about vaccines. A similar share of parents (84%) has the same level of trust in their child’s pediatrician. About three-quarters of adults (77%) say they trust pharmacists to provide reliable information. A smaller share, but still a majority, say they trust public health government agencies like their own local public health department (68%), the Centers for Disease Control and Prevention (CDC) (63%), or the U.S. Food and Drug Administration (FDA) (61%). This is similar to the share of insured adults (68%) who say they trust their health insurance company. Schools and daycares rank below other groups asked about with slightly more than half (56%) of parents with children attending school or daycare saying they trust them to provide reliable information about vaccines.

  • Most Understand Why And How To Get Vaccines, But A Quarter Say It Is Difficult To Know Costs, Which Ones To Get, And How They Work

    Most Understand Why And How To Get Vaccines, But A Quarter Say It Is Difficult To Know Costs, Which Ones To Get, And How They Work

    Nearly all adults (93%) say it is easy for them to understand where to go to get vaccinated, including six in ten (63%) who say it is “very easy.” At least three-quarters of adults also say it is easy for them to understand why they should get vaccines (84%), when they should get them (79%), how vaccines work (78%), which vaccines they should get (77%), and how much they may have to pay for a vaccine (63%). While most adults say it is easy for them to understand the reasoning behind vaccines and the logistics of how to get them, at least one in five of adults still say some of these aspects are difficult to understand. This includes understanding which vaccines they should get (23%), how vaccines generally work (22%), or understanding when they need to get certain vaccines (20%). More than one in four adults say it is difficult to know how much they may have to pay out-of-pocket (27%), even as most people with health insurance will not have to pay any out-of-pocket costs for recommended vaccines.

Trust In Government Sources For COVID-19 Vaccine Information Has Fallen, Particularly Among Republicans


The share who have said they trust President Biden, the FDA, the CDC, and Dr. Fauci to provide reliable information on COVID-19 vaccines has declined since December 2020. Despite some criticism of how the FDA and CDC have handled vaccine rollout and messaging, trust among Democrats has remained high. However, among Republicans, the share who said they trust the FDA fell from a majority (62%) in December, 2020 to about four in ten (43%) in April, 2022.

Similarly, the share of Republicans who said they trust the CDC at least a fair amount fell from a majority in December (57%) to four in ten (41%) in April. The share of Republicans who trust Dr. Fauci for vaccine information fell by roughly half between December 2020 and spring 2022, from 47% to 25%. In addition, trust in President Biden, already low among Republicans in December when he was President-elect, sank even further.

Interactive DataWrapper Embed

Large Shares of U.S. Adults Have Heard Items Of COVID-19 Misinformation, Though Fewer Say They Are True


KFF’s Health Misinformation Tracking Poll Pilot finds that the most widespread misinformation items included in the survey were related to COVID-19 and vaccines, including that the COVID-19 vaccines have caused thousands of deaths in otherwise healthy people (65% say they have heard or read this) and that the MMR vaccines have been proven to cause autism in children (65%). Across the five COVID-19 and vaccine related misinformation items, adults without a college degree are more likely than college graduates to say these claims are definitely or probably true. Notably, Black adults are at least ten percentage points more likely than White adults to believe some items of vaccine misinformation, including that the COVID-19 vaccines have caused thousands of sudden deaths in otherwise healthy people, and that the MMR vaccines have been proven to cause autism in children.

Large Shares of U.S. Adults Have Heard Items Of Health Misinformation, Though Fewer Say They Are True

Seven In Ten Women Who Were Pregnant Or Planning To Believed Or Were Unsure About At Least One Piece Of Misinformation Surrounding Pregnancy And COVID-19 Vaccines

KFF’s Health Misinformation Tracking Poll Pilot finds that the most widespread misinformation items included in the survey were related to COVID-19 and vaccines, including that the COVID-19 vaccines have caused thousands of deaths in otherwise healthy people (65% say they have heard or read this) and that the MMR vaccines have been proven to cause autism in children (65%). Across the five COVID-19 and vaccine related misinformation items, adults without a college degree are more likely than college graduates to say these claims are definitely or probably true. Notably, Black adults are at least ten percentage points more likely than White adults to believe some items of vaccine misinformation, including that the COVID-19 vaccines have caused thousands of sudden deaths in otherwise healthy people, and that the MMR vaccines have been proven to cause autism in children.

Seven In Ten Women Who Are Pregnant Or Planning To Believe Or Are Unsure About At Least One Piece Of Misinformation Surrounding Pregnancy And COVID-19 Vaccines

Questions about pregnancy, fertility and the COVID-19 vaccines answered!

OB/GYNs, a nurse and midwife affirm the safety of the COVID-19 vaccines during pregnancy and debunk myths about the impact on fertility in 40+ new FAQ videos from THE CONVERSATION / LA CONVERSACIÓN. The new videos join the expansive living video library of more than 300 FAQ videos in English and Spanish featuring a diverse group of more than 30 healthcare workers of color produced by KFF under its Greater Than COVID public information response.

TAKING PRECAUTIONS

Half Of Adults Say They Are Not Taking Precautions Because Of COVID-19 This Fall And Winter

The public is divided on precautions, with half of adults saying they aren’t planning to take any of the precautions asked about in the survey, while the other half report they plan to take at least one precaution this fall and winter. The most common precautions people said they planned to take were avoiding large gatherings (35%) or wearing a mask in crowded places (30%). Smaller shares say they are avoiding travel this fall and winter as a precaution against COVID-19 (25%), avoiding dining indoors at restaurants (19%), or taking a COVID-19 test before visiting with friends or family (18%).

While four in ten (39%) White adults say they will take at least one precaution, majorities of Black adults (72%) and Hispanic adults (68%) report they are planning to take any of the precautions mentioned. Similarly, partisanship and previous vaccine uptake continue to be strong predictors of whether people plan to take precautions to limit the spread of the virus. Two thirds (66%) of Democrats and half (48%) of independents say they plan to take at least one precaution, compared to three in ten (29%) Republicans who say the same. Just over half (53%) of vaccinated adults say they are taking any of the precautions, compared to four in ten (39%) unvaccinated adults.

Half Of Adults Say They Are Not Taking Precautions Because Of COVID-19 This Fall And Winter

Six In Ten Adults Said People Should Continue Masking To Avoid COVID-19 Surges, With Splits By Partisanship, Income, Race

In March, 2022, about six in ten adults (59%) said that now that COVID-19 case rates are lower, people should continue to wear masks in some public places to minimize the spread and avoid another surge in cases, while four in ten said that people should stop wearing masks in most public places so things can go back to normal. There were significant divides not only by partisanship, and vaccination status, but also by race, ethnicity, and income.

Eight-five percent of Democrats said that people should continue to wear masks, as did 57% of independents and 67% of vaccinated adults. Around seven in ten Republicans (69%) said that people should stop wearing masks so that things can return to normal, as did 67% of unvaccinated adults.

While White adults were split (49% said people should stop wearing masks, 49% said they should continue to wear them in some public places), large majorities of Black adults (88%) and Hispanic adults (69%) said that people should continue to wear masks in some public places to minimize the spread of COVID-19. Around two-thirds of those with a household income of less than $40,000 a year (68%) said the same, compared to 55% of those with an income between $40,000-$89,900 and 54% of those with an income of $90,000 or more. This finding that people of color have been more likely to support continued mask wearing may reflect larger shares of Black and Hispanic adults being employed in service industries compared to White adults, putting them at an increased risk of exposure to COVID-19.

Six In Ten Adults Say People Should Continue Masking To Avoid COVID-19 Surges, With Splits By Partisanship, Income, Race

PANDEMIC IMPACTS

Black And Hispanic Adults More Likely To Have Experienced Negative Impacts Of The Pandemic

Black and Hispanic adults reported higher levels of financial impacts and worry about illness than their White counterparts when it comes to COVID-19 related issues, reflecting the increased burden the pandemic has placed on people of color over the past two years.

Black And Hispanic Adults More Likely To Have Experienced Negative Impacts Of The Pandemic

Half Said COVID-19 Pandemic Had A Negative Impact On Their Mental Health, Four In Ten On Physical Health, Financial Situation

The March, 2022 survey found the pandemic has taken a heavy toll on adults and children over the last two years. Whether it comes to their education, work, finances, mental or physical health, many – regardless of race, ethnicity and income – report feeling the negative effects of the pandemic.

The most common negative effects of the pandemic, as reported by parents, were about their children’s education and mental health. Almost two-thirds of parents said that the pandemic has negatively affected their children’s education (63%), with 28% who said it had no effect, and 9% who reported it had a positive effect. Moreover, over half (55%) of parents said the pandemic had a negative impact on their children’s mental health, compared to 36% who said it made no difference, and 9% who said it had a positive effect.

Half Say COVID-19 Pandemic Had A Negative Impact On Their Mental Health, Four In Ten On Physical Health, Financial Situation

Many Workers, Including Six In Ten Of Those Earning Less Than $40,000, Reported Having To Miss Work During Past Three Months Due To COVID-19 Concerns

Four in ten workers (42%) said they had to miss work at least once in the past three months because of a COVID-19 related concern or sickness in February, 2022. This includes one in four workers (26%) who said they had to miss work to quarantine following a COVID-19 exposure, one in five who missed work because they tested positive for COVID-19, and one in eight (13%) who missed work because their place of employment was closed or reduced hours due to COVID-19 concerns. Additionally, three in ten parents (28%) said they had to miss work in the three months prior to the survey because they had to stay home with a child who had to quarantine, or their child’s school went virtual due to COVID-19 concerns.

Many Workers, Including Six In Ten Of Those Earning Less Than $40,000, Report Having To Miss Work During Past Three Months Due To COVID-19  Concerns

Two-Thirds Of Young Adults Reported Negative Impacts From The COVID-19 Pandemic On Their Mental Health

Younger people also reported disproportionate effects from the COVID-19 pandemic in March, 2022, especially when it comes to their mental and physical health. Two-thirds of young adults aged 18-29 (67%) reported that the pandemic had a negative impact on their mental health, compared to just over half of 30-49 year-olds (54%), and under four in ten 50-64 year-olds (38%) and those over the age of 65 (37%).

Young adults were also more likely to report difficulties with their physical health due to the pandemic, with 53% of those under 30 reporting a negative impact, 47% of those 30-49, 37% of those 50-64, and 28% of those over the age of 65. In addition, larger shares of young adults reported negative effects on their employment situation (36%) compared to older adults, including those ages 50-64 (23%) and those 65 and older (17%).

Two-Thirds Of Young Adults Report Negative Impacts From The COVID-19 Pandemic On Their Mental Health

KFF COVID-19 Vaccine Monitor was a research project tracking the public’s attitudes and experiences with COVID-19 vaccinations. Using a combination of surveys and qualitative research, the Monitor tracks the dynamic nature of public opinion as vaccine development and distribution unfold, including vaccine confidence and acceptance, information needs, trusted messengers and messages, as well as the public’s experiences with vaccination. A list of all Vaccine Monitor reports is available here.

Medicare Advantage 2024 Spotlight: First Look

Authors: Meredith Freed, Anthony Damico, Jeannie Fuglesten Biniek, and Tricia Neuman
Published: Nov 15, 2023

Data Note

This analysis, originally published on Nov. 8, 2023, has been updated to reflect that CalOptima Health OneCare is not a new entrant in the Medicare Advantage market and that Orange County Health Authority and Imperial Health Plan of California are not exiting insurers. 

Over the last decade, Medicare Advantage, the private plan alternative to traditional Medicare, has taken on a prominent role in the Medicare program. In 2023, nearly 31 million Medicare beneficiaries are enrolled in a Medicare Advantage plan, more than half, or 51%, of the eligible Medicare population. This brief provides an overview of the Medicare Advantage plans that are available for 2024 and key trends over time. (A separate overview of the 2024 Medicare Part D marketplace is also available.)

Medicare Advantage Highlights for 2024

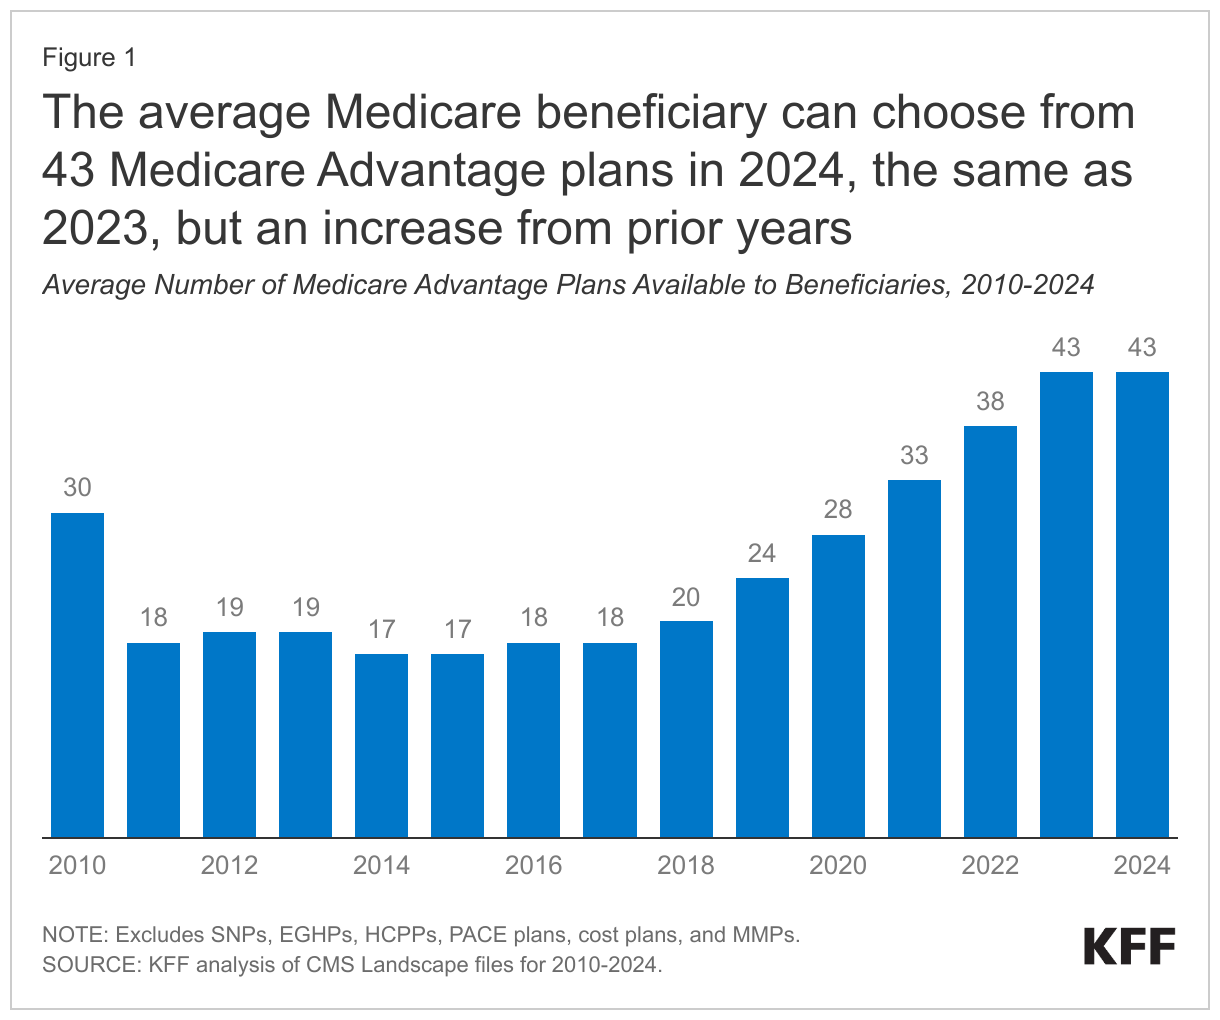
  • The average Medicare beneficiary has access to 43 Medicare Advantage plans in 2024, the same as in 2023, but more than double the number of plans offered in 2018.
  • HMOs account for more than half of all Medicare Advantage plans nationwide (56% in 2024) but are declining as a share of total, while local PPOs are rising as a share of all plans (42% in 2024).
  • The number of D-SNPs (for dually-eligible beneficiaries) has increased substantially over the past five years, nearly doubling from 465 dual SNPs in 2019 to 851 dual SNPs in 2024.
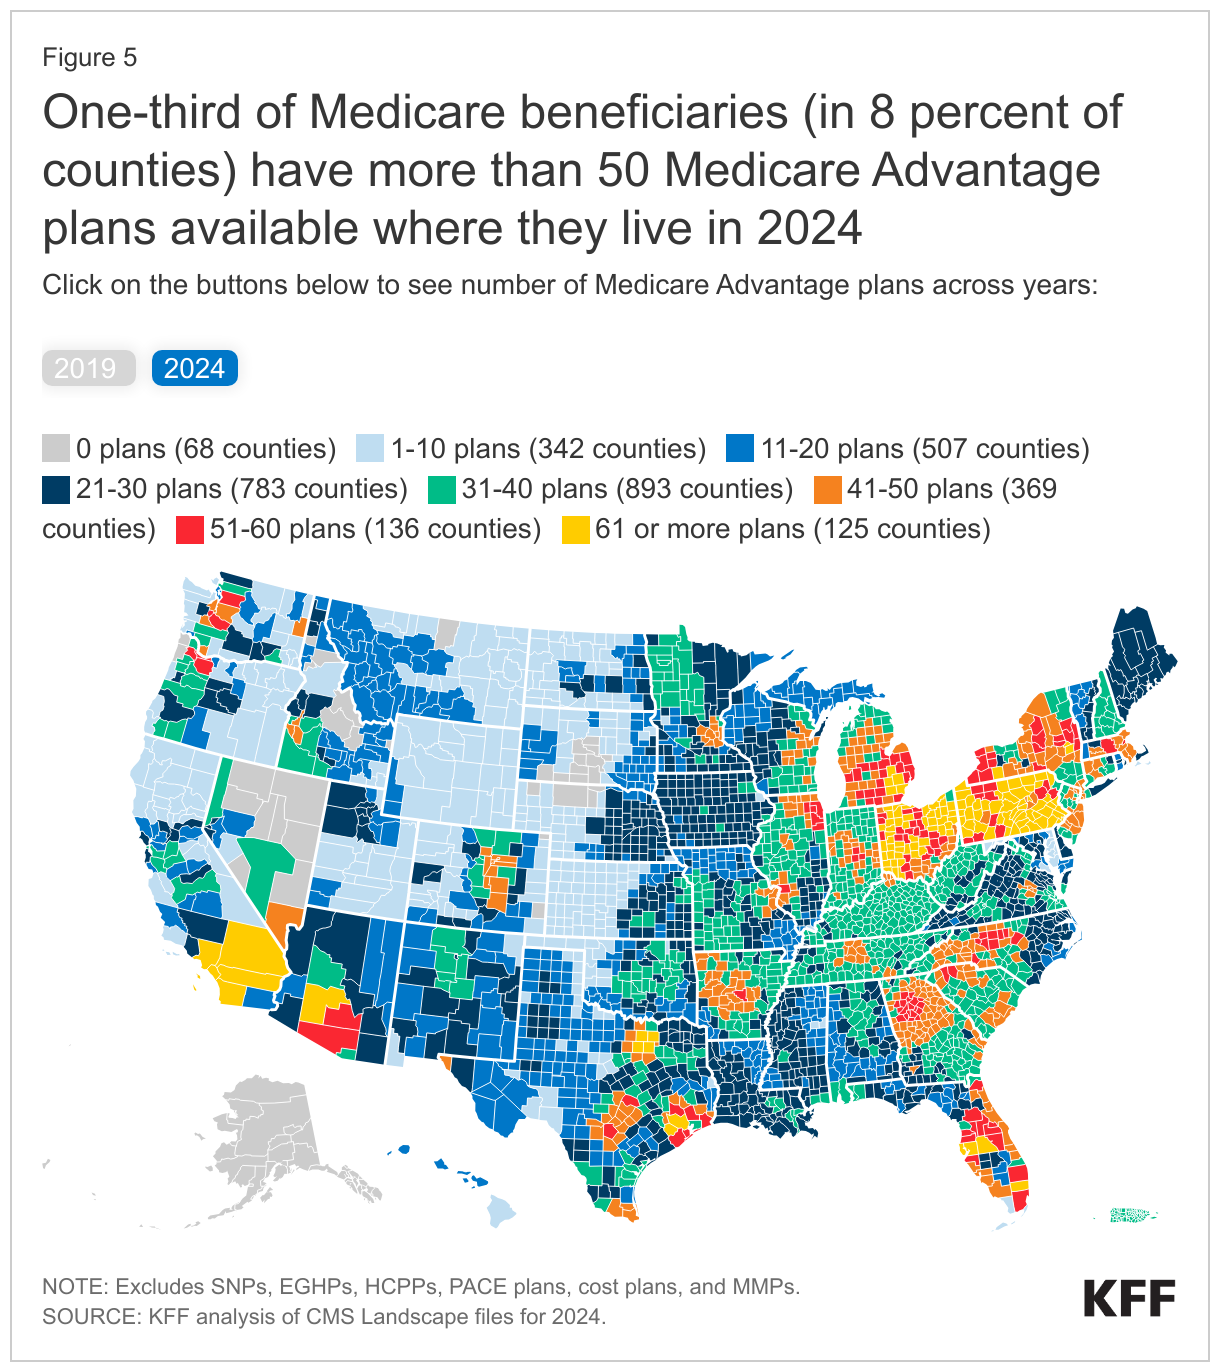
  • One-third of Medicare beneficiaries live in a county with more than 50 Medicare Advantage plans available in 2024, up from 1 percent in 2019. Less than 1 percent of beneficiaries live in a county with fewer than four Medicare Advantage plans available.
  • The average Medicare beneficiary can choose among plans offered by 8 firms in 2024, one fewer than in 2023. Three new insurers entered the Medicare Advantage market in 2024, two of which offer SNPs, while twelve firms exited the market in 2024, principally due to low or no enrollment.
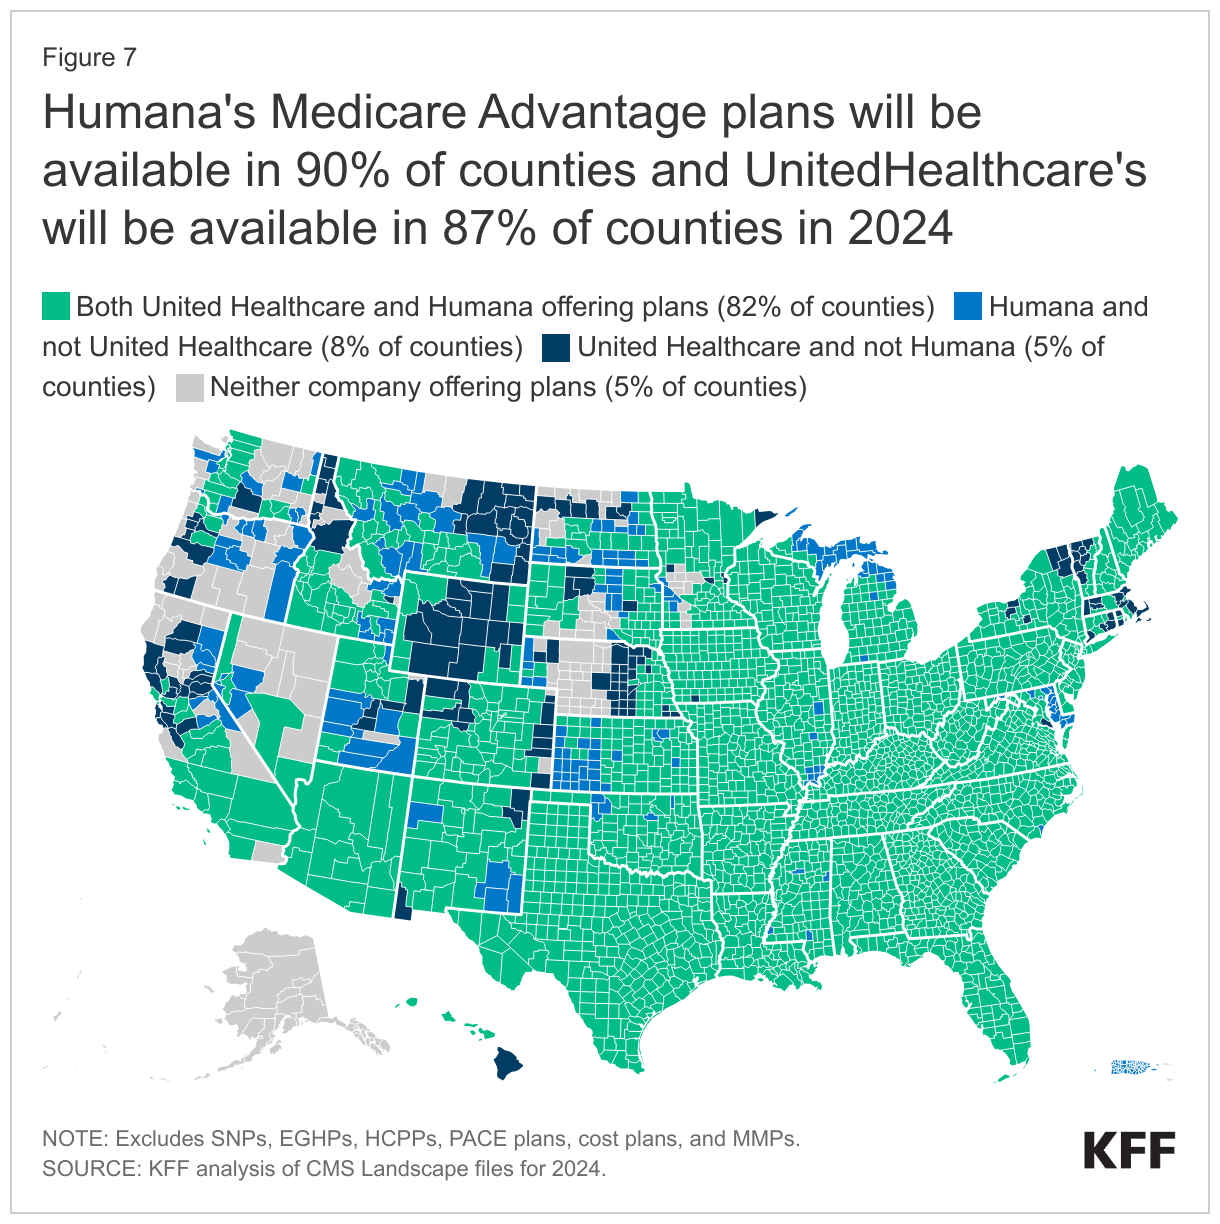
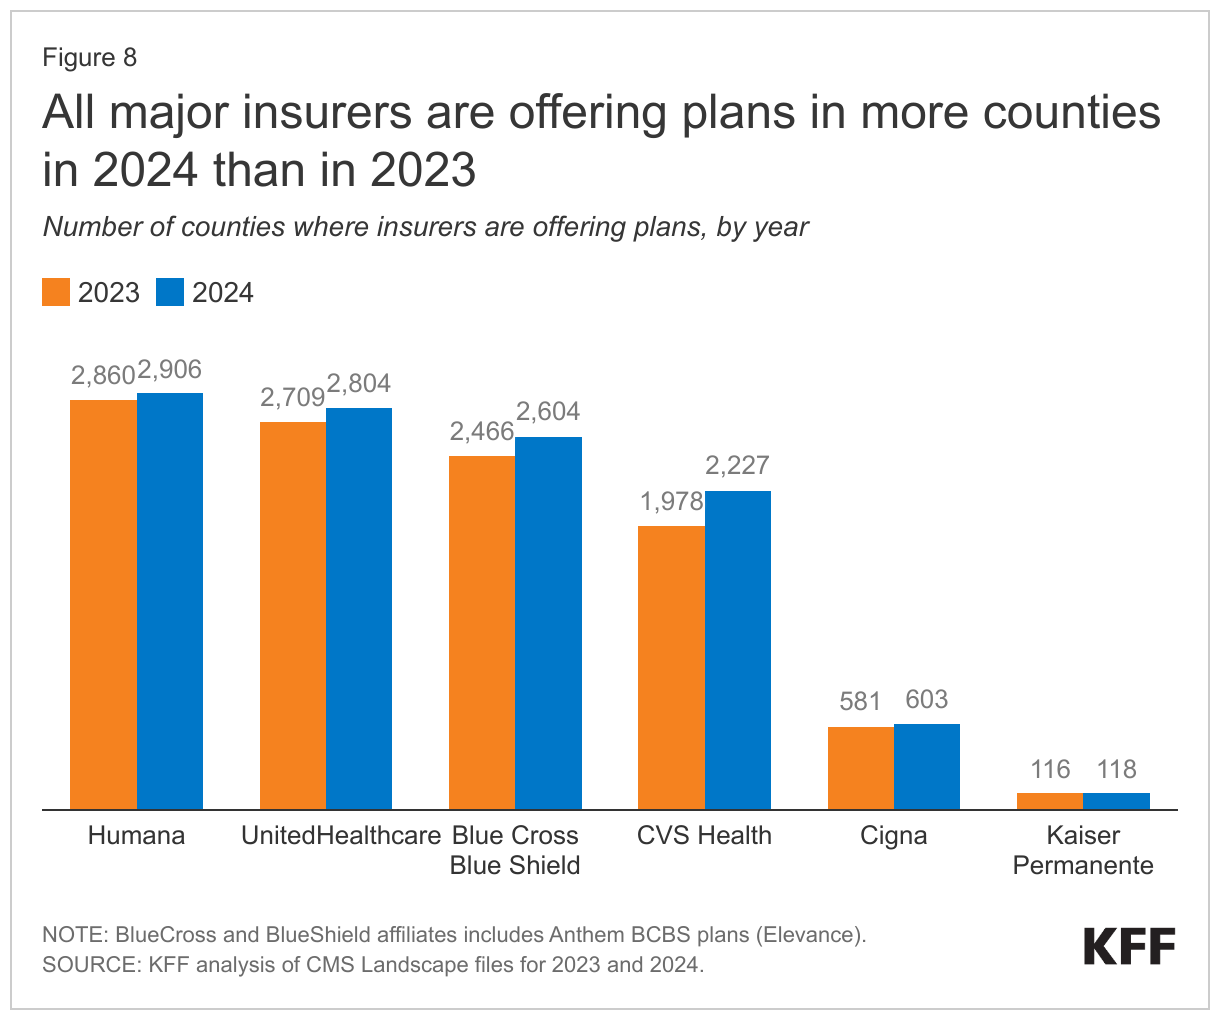
  • Humana and UnitedHealthcare plans are available in most counties in 2024 (90% and 87%, respectively). Most major insurers are also expanding into new counties, with CVS Health expanding in the largest number of counties in 2024.
  • Two thirds of all MA-PDs (66%) will charge no premium (other than the Part B premium) in 2024, the same as in 2023. In addition, 19% of Medicare Advantage plans will offer some reduction in the Part B premium in 2024, similar to 2023.
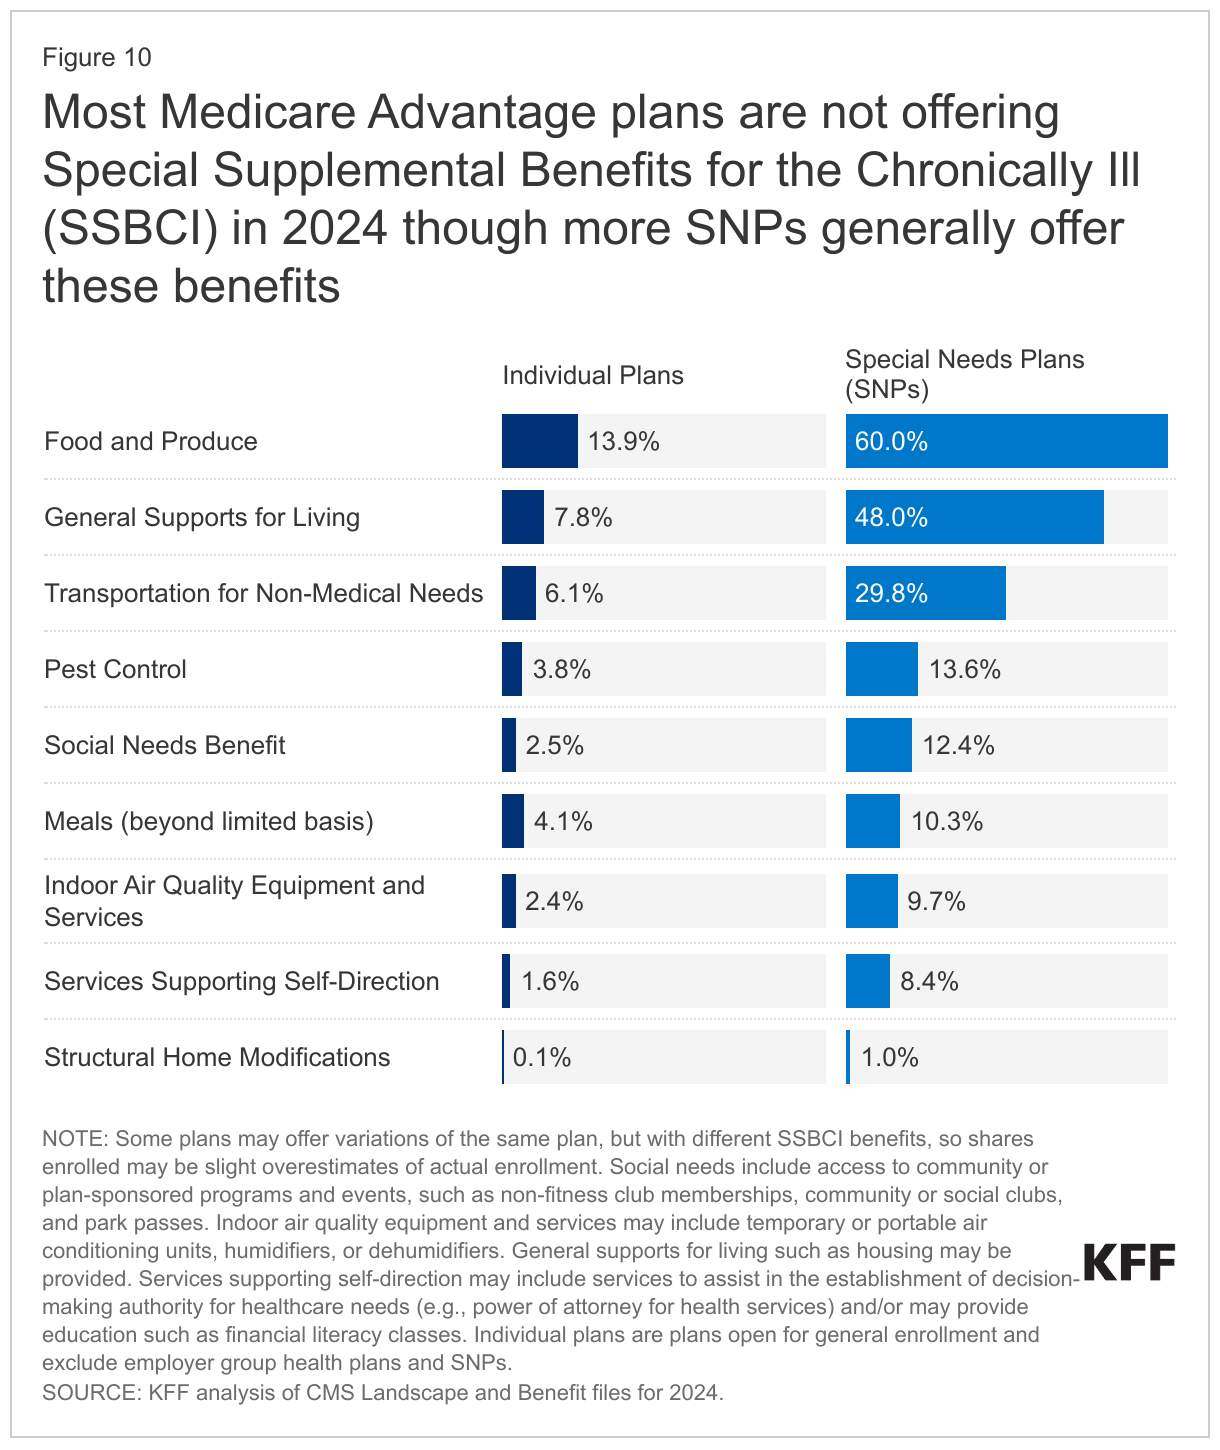
  • Most Medicare Advantage plans are offering extra benefits, such as vision, dental and hearing as they have in previous years. Most Medicare Advantage plans are not offering Special Supplemental Benefits for the Chronically Ill, which are extra benefits available to a subset of a plan’s enrollees, that are not primarily health related, and are specifically for chronically ill beneficiaries. However, more SNP plans than individual plans generally offer these benefits, particularly food and produce (60.0% in SNPs compared to 13.9% in individual plans).

Plan Offerings in 2024

Number of Plans

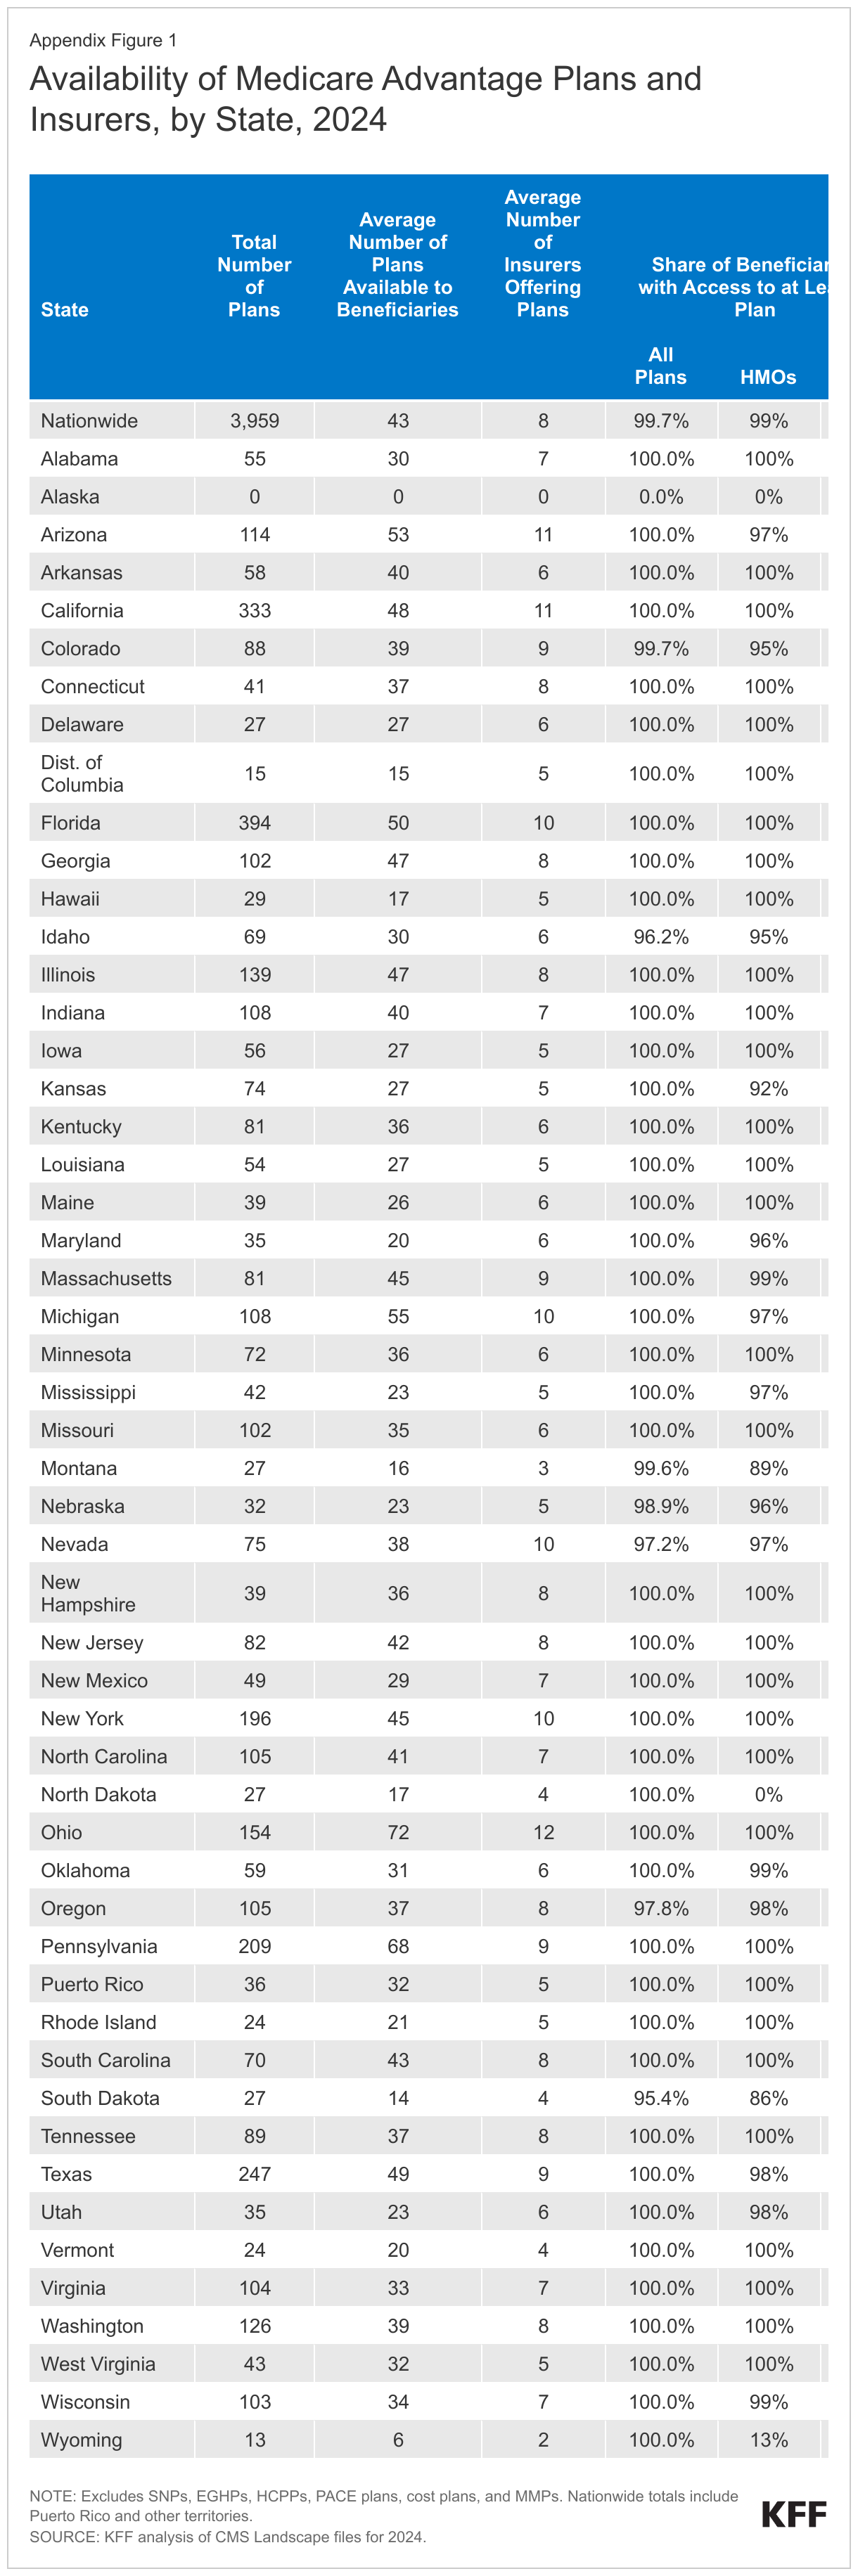
Number of Plans Available to Beneficiaries. For 2024, the average Medicare beneficiary has access to 43 Medicare Advantage plans, the same as 2023, but more than double the average number available in 2018, and the largest number of options available over the period we examined, which goes back to 2010 (Figure 1). These numbers exclude employer or union-sponsored group plans, Special Needs Plans (SNPs), PACE plans, cost plans, and Medicare-Medicaid plans (MMPs) that are only available to select populations.

The average Medicare beneficiary can choose from 43 Medicare Advantage plans in 2024, the same as 2023, but an increase from prior years

Of the 43 Medicare Advantage plans available for individual enrollment, 36 of the plans include prescription drug coverage (MA-PDs), on average.

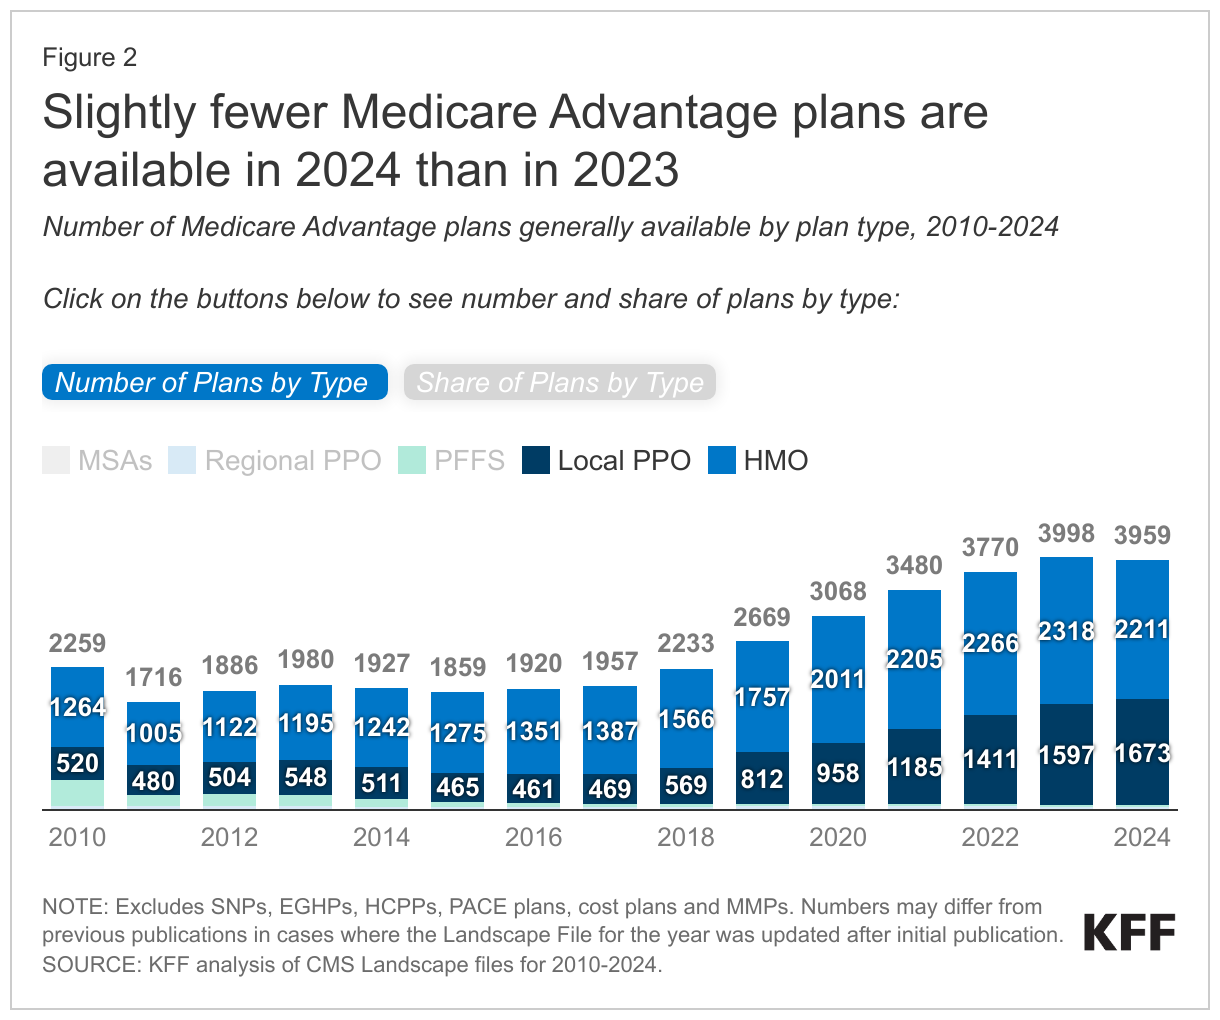
Total Number of Plans. In total, 3,959 Medicare Advantage plans are available nationwide for individual enrollment in 2024 – a slight decrease in the number of plans (1% decrease; 39 fewer plans) offered in 2023. However, it is the second largest number of plans available over the period we examined, which goes back to 2010 (Figure 2; Appendix Table 1).

Slightly fewer Medicare Advantage plans are available in 2024 than in 2023

HMOs account for more than half (56%) of all Medicare Advantage plans offered in 2024 but have declined as a share of all Medicare Advantage plans since 2017 (71% of plans), while local PPOs are rising as a share of all plans. During this period, the availability of local PPOs has increased from 24% in 2017 to 42% in 2024. The share of regional PPOs has slowly declined from around 3% of plans offered in 2017 to 1% in 2024.

The decline in number of plans varies across states and counties, with the preponderance of the decline occurring in Alabama (20 fewer plans), Illinois (18 fewer plans), and Texas (16 fewer plans) (data not shown), though beneficiaries in Alabama still have a choice of 30 plans on average (down from 32 in 2023), while beneficiaries in Illinois have a choice of 47 plans on average and beneficiaries in Texas have a choice of 49 plans (both down 2 from 2023). Unlike in 2022 and 2023 where two plan options were offered in Alaska, in 2024, there are no plans offered. While there has been an overall decline in the number of plans offered, Colorado has 18 more plans available for 2024 than in 2023. In the remaining states, the number of plans either stayed the same or the growth or decline in plans was 13 or fewer.

While many employers and unions also offer Medicare Advantage plans to their retirees, no information about these 2024 plan offerings is made available by CMS to the public during the Medicare open enrollment period because these plans are administered separately and may have enrollment periods that do not align with the Medicare open enrollment period.

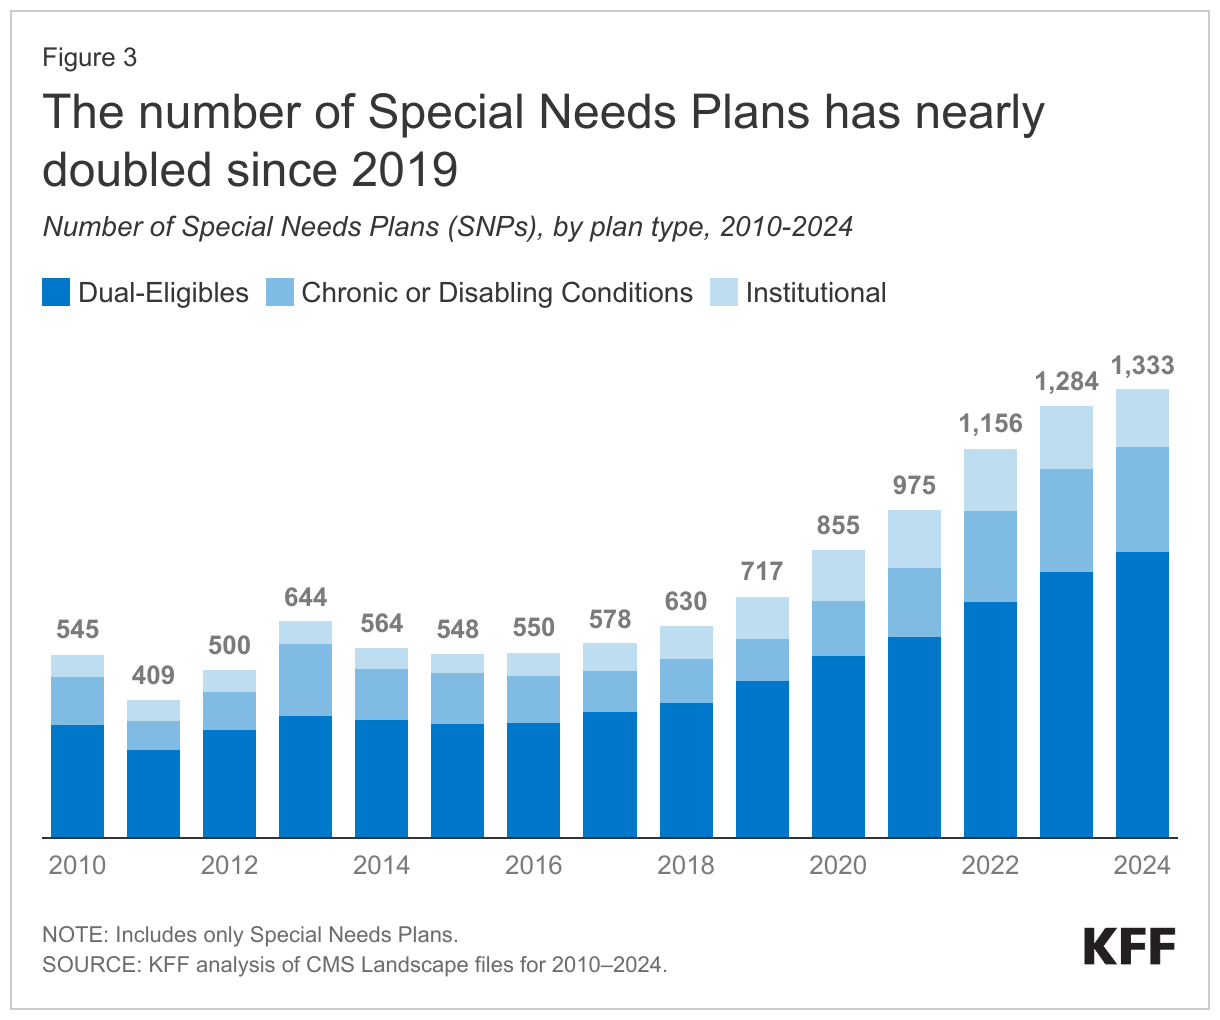
Special Needs Plans (SNPs). In 2024, 1,333 SNPs will be offered nationwide, a 4 percent increase between 2023 and 2024 (Figure 3).

The number of Special Needs Plans has nearly doubled since 2019E

D-SNPs. Nearly two-thirds of SNPs (64%) are designed for people dually eligible for Medicare and Medicaid (D-SNPs). The number of D-SNPs has increased substantially over the past five years, increasing from 465 dual SNPs in 2019 to 851 dual SNPs in 2024, suggesting insurers continue to be drawn to this high-need population.

I-SNPs. The number of SNPs for people who require an institutional-level of care (I-SNPs) nearly doubled from 97 plans in 2018 to 189 plans in 2023, before dropping modestly to 173 plans for 2024. I-SNPs may be attractive to insurers because they tend to have much lower marketing costs than other plan types since they are often the only available option for people who require an institutional level-of-care, such as those who have been in nursing homes for an extended period of time. In 2023, about 100,000 Medicare beneficiaries are enrolled in I-SNPs.

C-SNPs. The number of SNPs offered for people with chronic conditions (C-SNPs) is very similar to 2023 (309 plans in 2024 vs 306 in 2023), more than doubling from 2019 (127 plans). Most C-SNPs focus on people with diabetes, heart disease, or lung conditions, as has been the case since the inception of C-SNPs. For 2024, one firm is offering a C-SNP for people with dementia (compared to two firms in 2023) in four states (California, Florida, Michigan, Virginia). No firms are offering C-SNPs for people with mental health conditions (compared to two firms in 2023), and only one firm is offering a C-SNP for people with HIV/AIDS, the same as 2023. Eight firms are offering C-SNPs for people with end-stage renal disease (up one from 2023).

Variation in the Number of Medicare Advantage Plans, by Geographic Area. Medicare beneficiaries living in metropolitan areas – counties with at least 50,000 people – can choose from 47 Medicare Advantage plans in 2024 on average, substantially more than beneficiaries living in rural or micropolitan areas. Beneficiaries in rural areas – counties with less than 10,000 people – can choose from an average of 27 plans, while beneficiaries in micropolitan areas (10,000 to 50,000 people) can choose from an average of 32 plans.

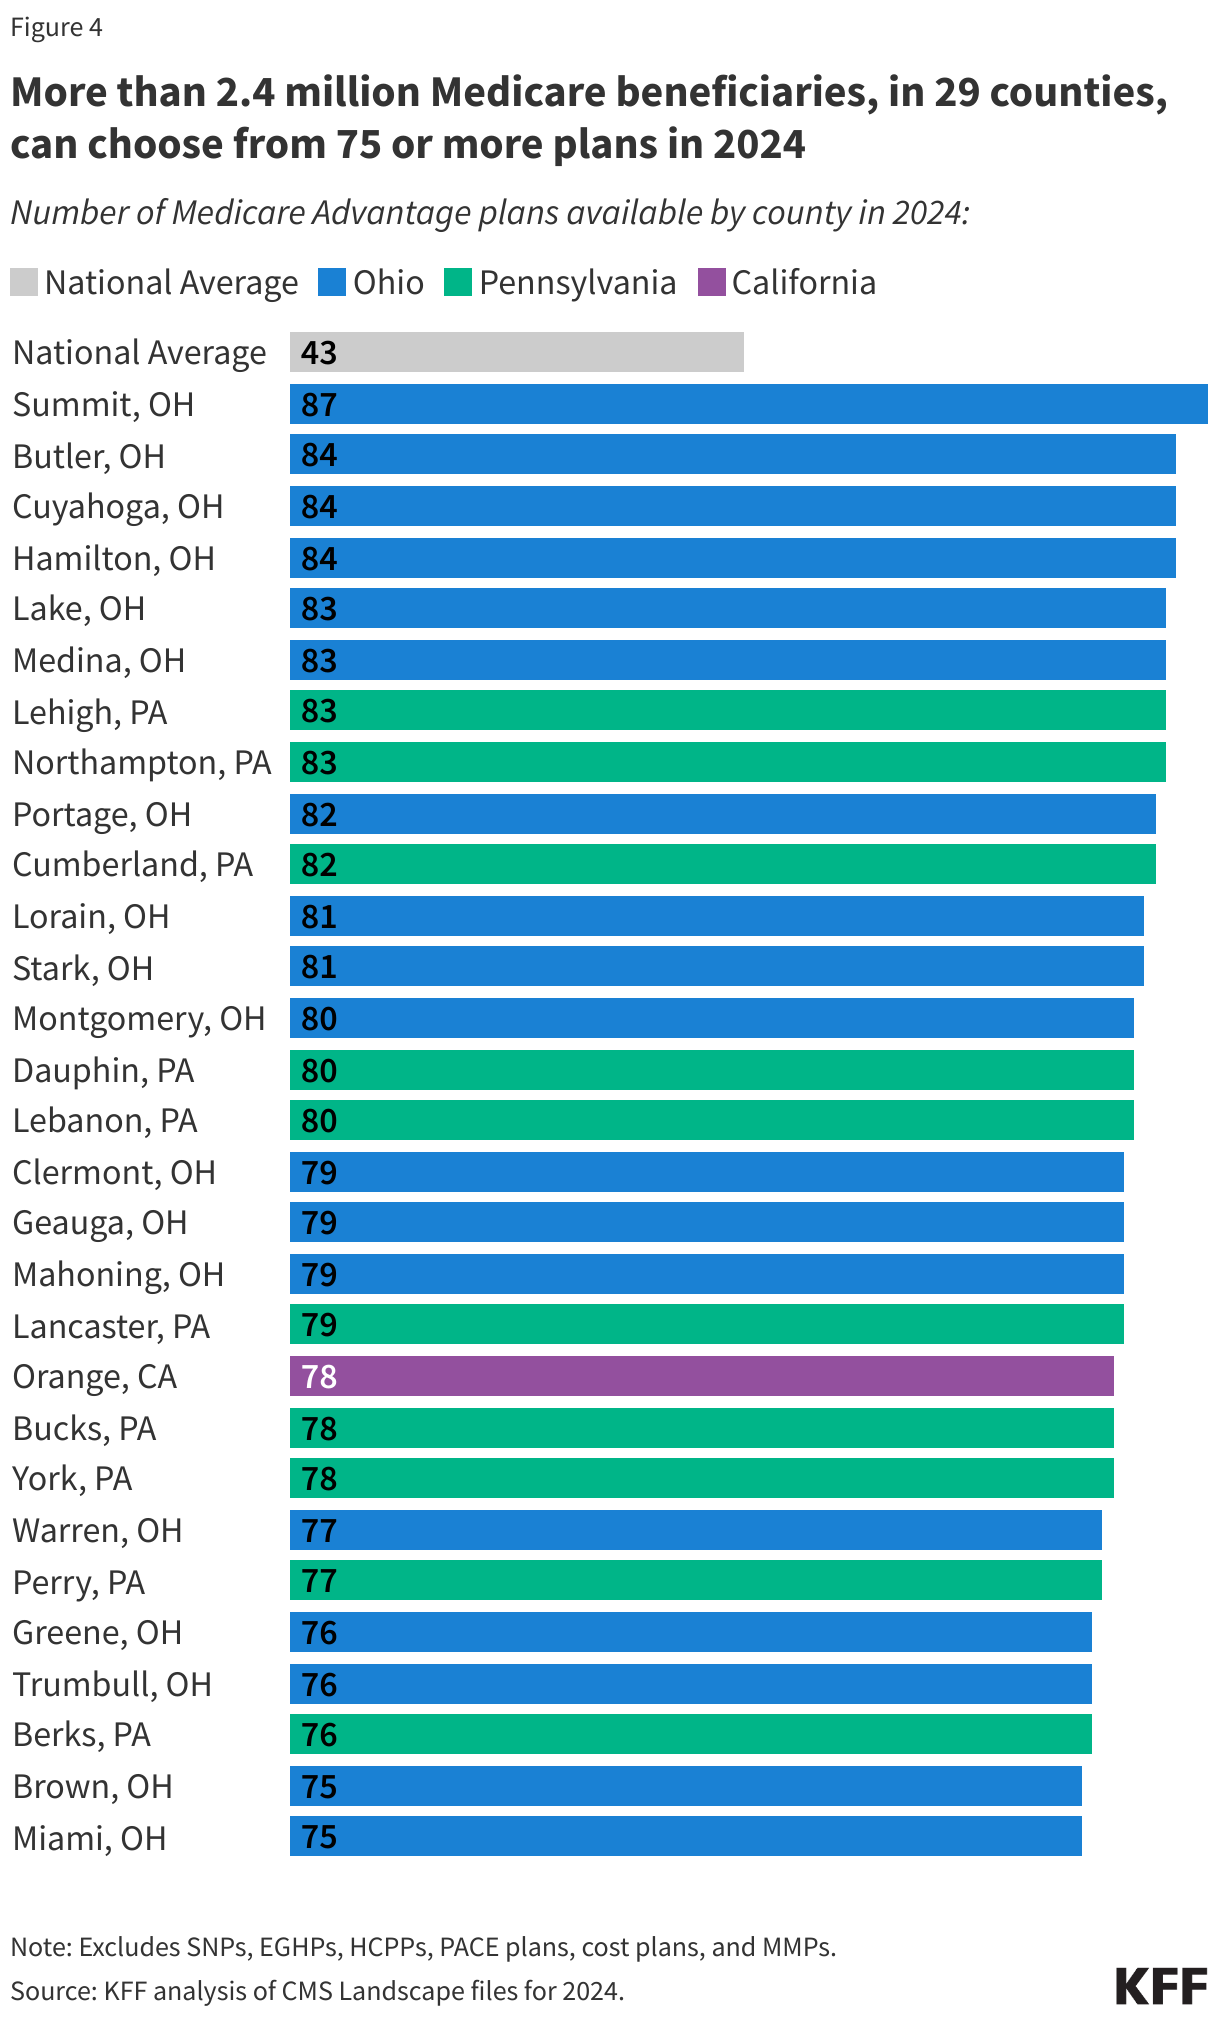
More than 2.4 million beneficiaries in 29 counties can choose from 75 or more Medicare Advantage plans. Similar to the last two years, the counties with the most plan options are predominantly in Ohio and Pennsylvania. In Ohio, for example, beneficiaries can choose from 80 or more Medicare Advantage plans in 10 counties, including Hamilton County (Cincinnati) and Cuyahoga County (Cleveland). Beneficiaries in Summit County, Ohio (Akron) can choose from 87 Medicare Advantage plans – the most offerings of any county in the US. Beneficiaries living in five counties in Pennsylvania can also choose from 80 or more plans. In California, beneficiaries in Orange County can choose from 78 plans (Figure 4).

More than 2.4 million Medicare beneficiaries, in 29 counties, can choose from 75 or more plans in 2024

In 2024, one-third of Medicare beneficiaries (33%) (in 8 percent of counties), can choose from more than 50 Medicare Advantage plans where they live (Figure 5).

One-third of Medicare beneficiaries (in 8 percent of counties) have more than 50 Medicare Advantage plans available where they live in 2024

The share of Medicare beneficiaries with a choice of at least 50 Medicare Advantage plans has increased from 1% in 2019 to 33% in 2024.

Unlike in 2022 and 2023, there are no Medicare Advantage plans being offered in any county in Alaska in 2024, which includes about 94,000 beneficiaries. In 2024, less than 1 percent of beneficiaries live in a county with fewer than four Medicare Advantage plans available. Additionally, no Medicare Advantage plans are available in territories other than Puerto Rico.

Access to Medicare Advantage Plans, by Plan Type. As in recent years, virtually all Medicare beneficiaries (99.7%) have access to a Medicare Advantage plan as an alternative to traditional Medicare, including almost all beneficiaries in metropolitan areas (99.9%) and the vast majority of beneficiaries in micropolitan (99.5%) and rural areas (98.4%). In micropolitan and rural counties, a smaller share of beneficiaries have access to HMOs (93% in micropolitan counties and 96% in rural counties versus over 99% in metropolitan counties) or local PPOs (98% in micropolitan counties and 96% in rural counties versus 99% in metropolitan counties), while a slightly larger share of beneficiaries in non-metropolitan counties have access to regional PPOs (77% in both micropolitan and rural counties versus 73% in metropolitan counties).

Number of Firms

The average Medicare beneficiary is able to choose from plans offered by 8 firms in 2024, one fewer than in 2023 and 2022 (Figure 6). Despite most beneficiaries having access to plans operated by several different firms, enrollment is concentrated in plans operated by UnitedHealthcare and Humana, and together UnitedHealthcare and Humana account for nearly half (47%) of Medicare Advantage enrollment in 2023.

One-third of beneficiaries can choose among Medicare Advantage plans offered by 10 or more firms in 2024

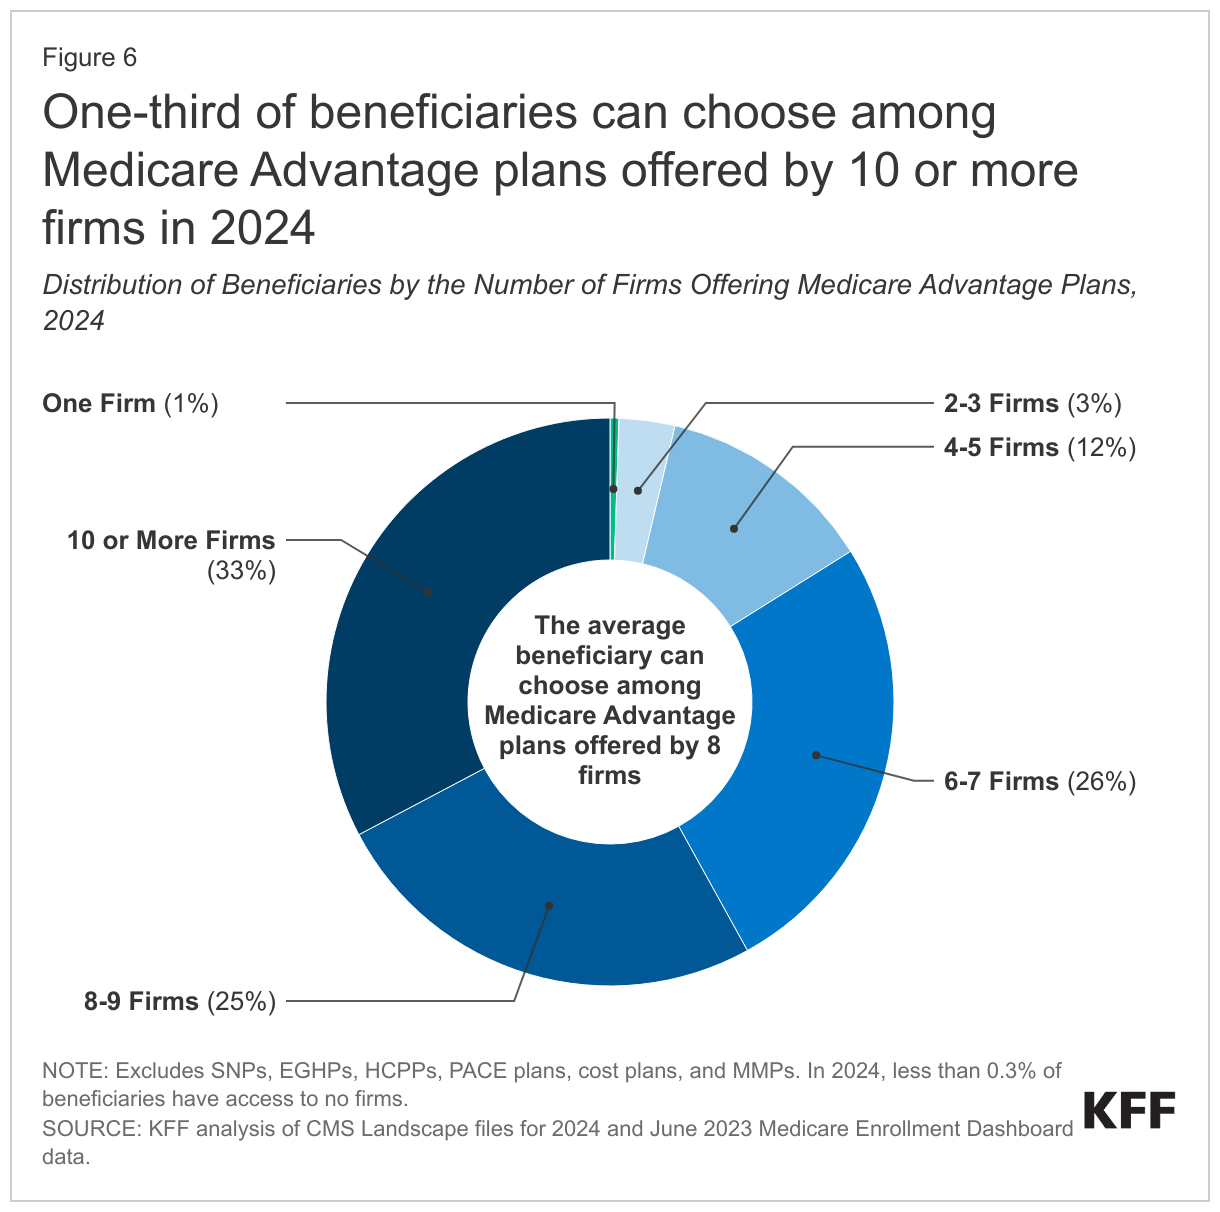
One-third of beneficiaries (33%), in 211 counties, are able to choose from plans offered by 10 or more firms or other sponsors. Fifteen firms are offering Medicare Advantage plans in Butler and Hamilton counties in Ohio, and 14 firms are offering Medicare Advantage plans in 12 counties: 6 in Ohio, 5 in California, and 1 in Arizona (Maricopa). In contrast, 4 percent of beneficiaries live in a county where one to three firms offer Medicare Advantage plans (528 counties). Further, in 130 counties, most of which are rural counties with relatively few Medicare beneficiaries (less than 1 percent of total), only one firm will offer Medicare Advantage plans in 2024.

Availability of Plans by Firm and County. UnitedHealthcare and Humana, the two firms with the most Medicare Advantage enrollees in 2023, have large footprints across the country, offering plans in most counties. Humana is offering plans in 90 percent of counties and UnitedHealthcare is offering plans in 87 percent of counties in 2024, roughly the same as in 2023 (Figure 7).

Humana's Medicare Advantage plans will be available in 90% of counties and UnitedHealthcare's will be available in 87% of counties in 2024

Most major insurers are also expanding into new counties, with CVS Health expanding in the largest number of counties in 2024 – an increase of 249 counties from 2023 (2,227 counties overall) (Figure 8).

All major insurers are offering plans in more counties in 2024 than in 2023

Blue Cross Blue Shield Affiliates are offering plans in 2,604 counties in 2024, an increase of 138 counties from 2023. UnitedHealthcare is offering plans in 2,804 counties in 2024, an increase of 95 counties from 2023, while Humana is offering plans in 2,906 counties in 2024, an increase of 46 counties from 2023. Cigna is offering plans in 603 counties, an increase of 22 counties, and Centene is offering plans in 1,748 counties, an increase of 9 counties; Kaiser Permanente is offering plans in 118 counties, an increase of 2 counties.

Multiple Plan Offerings by Firms in the Same County. Many Medicare Advantage firms are also offering more than one plan option in each county. In 1,276 counties (accounting for 59% of beneficiaries), at least one firm is offering 10 or more plans for individual enrollment. For example, in Bucks and Delaware counties in Pennsylvania, four firms are offering 10 or more plans (Humana, UnitedHealthcare, Blue Cross Blue Shield Affiliates, and CVS Health). In 92 counties, two firms are offering 10 or more plans, and in 28 counties, three firms are offering 10 or more plans.

Blue Cross Blue Shield Affiliates and Humana are offering the most plan options in individual counties. BCBS Affiliates are offering 19 different plan options in seven counties, 17 plan options in 9 counties, and 16 plans in 5 counties. Humana is offering 18 Medicare Advantage plans in three counties, 17 plan options in 1 county, and 16 plan options in 35 counties.

New Market Entrants and Exits

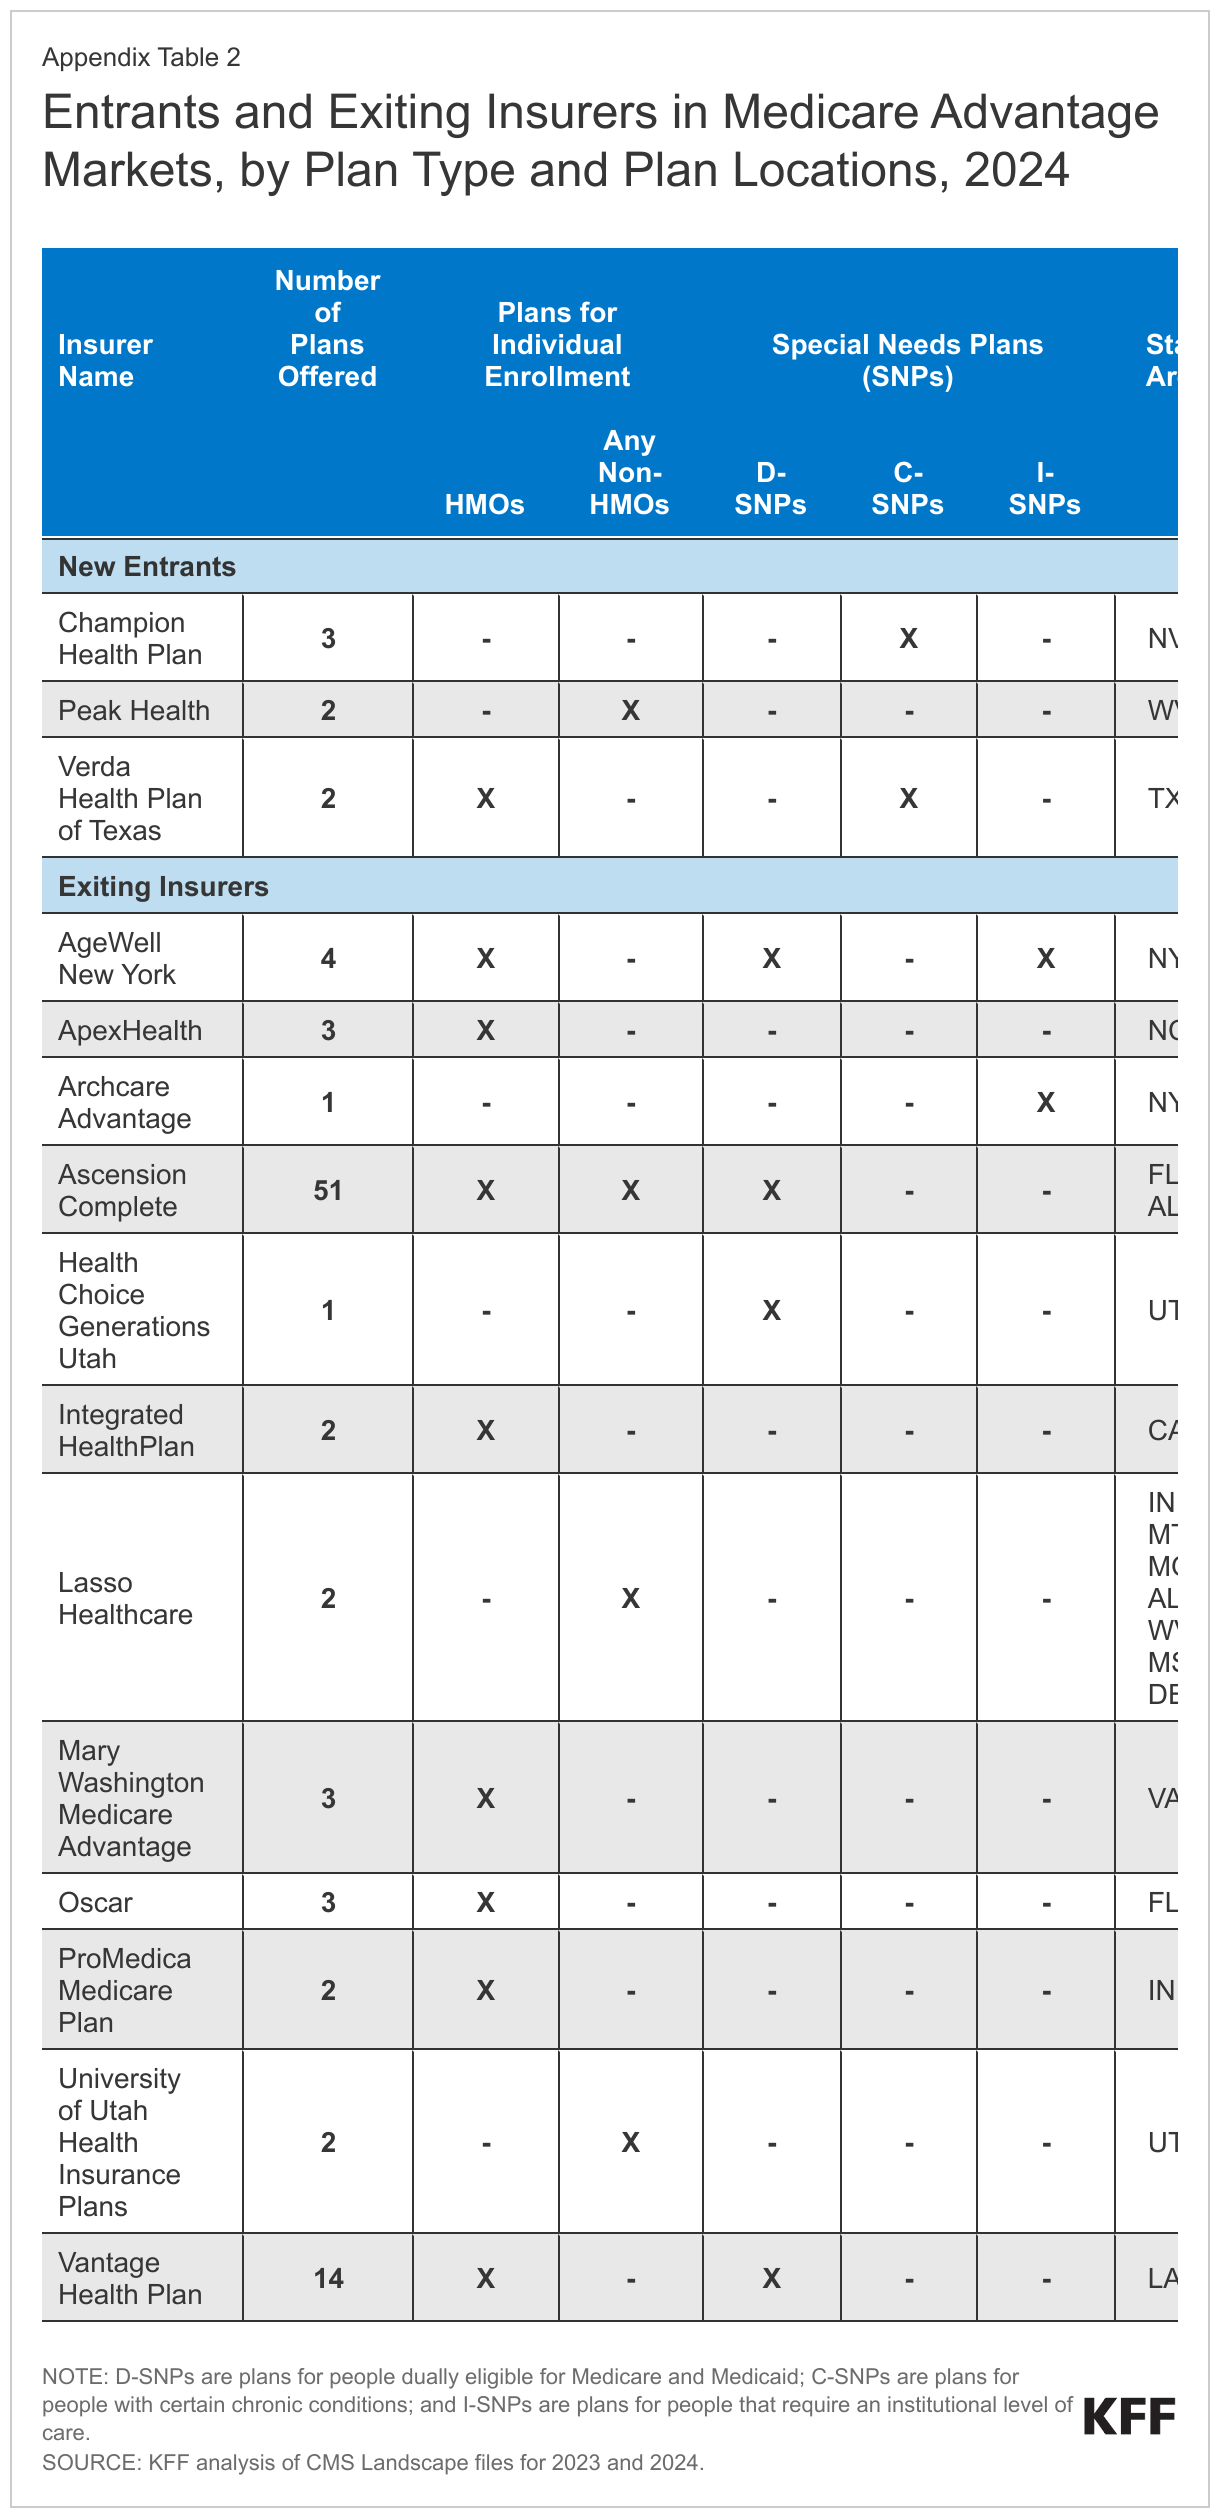
In 2024, three firms (Champion Health Plan, Peak Health, and Verda Health Plan of Texas) entered the market for the first time, while twelve firms exited the market. One new entrant has two new plans available for general enrollment in West Virginia. Two firms are offering C-SNP plans, for people with select chronic conditions in California, Nevada, and Texas. collectively accounting for about 12 percent of the growth in SNPs (Appendix Table 2).

In the last few years, more firms have introduced plans that are either co-branded or are in partnership with another company. For example, in 2024, Alignment Health is offering four plans co-branded with Instacart in 13 counties in California and Nevada. These plans will offer groceries to qualifying beneficiaries with chronic conditions. UnitedHealthcare has partnered with Walgreens over the last few years to offer plans, while Alignment Health has a new partnership with Walgreens for 2024. UnitedHealthcare’s plans with Walgreens in 2024 are available in California, Georgia, Illinois, Missouri, Nevada, Texas, Utah, and Wisconsin, while Alignment Health’s plans with Walgreens in 2024 are offered in Arizona, California, Florida and Texas. Other companies with a partnership that are offering plans in 2024 include Select Health and Kroger and Alignment Health and Rite Aid, though this is not an exhaustive list.

Twelve firms that participated in the Medicare Advantage market in 2023 are not offering plans in 2024. Five of the fourteen firms had low enrollment in 2023 (less than 3,500 enrollees) while five firms either had no enrollment or enrollment of less than 11 people in 2023, one of which was a Medicare Medical Savings Account (MSA) operating in many states.  Two of the firms with slightly higher enrollment had contracts taken over by other insurers.

Premiums

The vast majority of Medicare Advantage plans for individual enrollment (89%) will include prescription drug coverage (MA-PDs), and the share of MA-PDs that charge no premium (other than the Part B premium) is 66% in 2024, the same as in 2023. In addition, 19% of Medicare Advantage plans will offer some reduction in the Part B premium in 2024, similar to the share in 2023. Nearly all beneficiaries (99%) have access to a MA-PD with no additional monthly premium in 2024, the same as in 2023 (99%).

In 2023, 73% of enrollees in MA-PD plans pay no premium other than the Medicare Part B premium of $164.90 per month. Based on enrollment in March 2023, 10% of enrollees pay at least $50 a month, including 3% who pay $100 or more. CMS announced that the average monthly plan premium among all Medicare Advantage enrollees in 2024, including those who pay no premium for their Medicare Advantage plan, is expected to be $18.50 a month. In 2023, 10 percent of Medicare Advantage enrollees are in a plan that offered some reduction in Medicare Part B premiums.

Extra Benefits

Medicare Advantage plans may provide extra benefits that are not available in traditional Medicare, are considered “primarily health related,” and can use rebate dollars (including bonus payments) to help cover the cost of these extra benefits. Beginning in 2019, CMS expanded the definition of “primarily health related” to allow Medicare Advantage plans to offer additional supplemental benefits. Medicare Advantage plans may also restrict the availability of these extra benefits to certain subgroups of beneficiaries, such as those with diabetes or congestive heart failure, making different benefits available to different enrollees.

Availability of Extra Benefits in Plans for General Enrollment. In 2024, 97% or more individual plans offer some vision, fitness, hearing or dental benefits (Figure 9). Though these benefits are widely available, the scope of coverage for these services varies. For example, a dental benefit may include cleanings and preventive care or more comprehensive coverage, and often is subject to an annual dollar cap on the amount covered by the plan. Plans are not required to report data about utilization of these benefits or associated costs, so it is not clear the extent to which supplemental benefits are used by enrollees.

97% or more of individual Medicare Advantage plans offer vision, fitness, hearing, or dental benefits in 2024

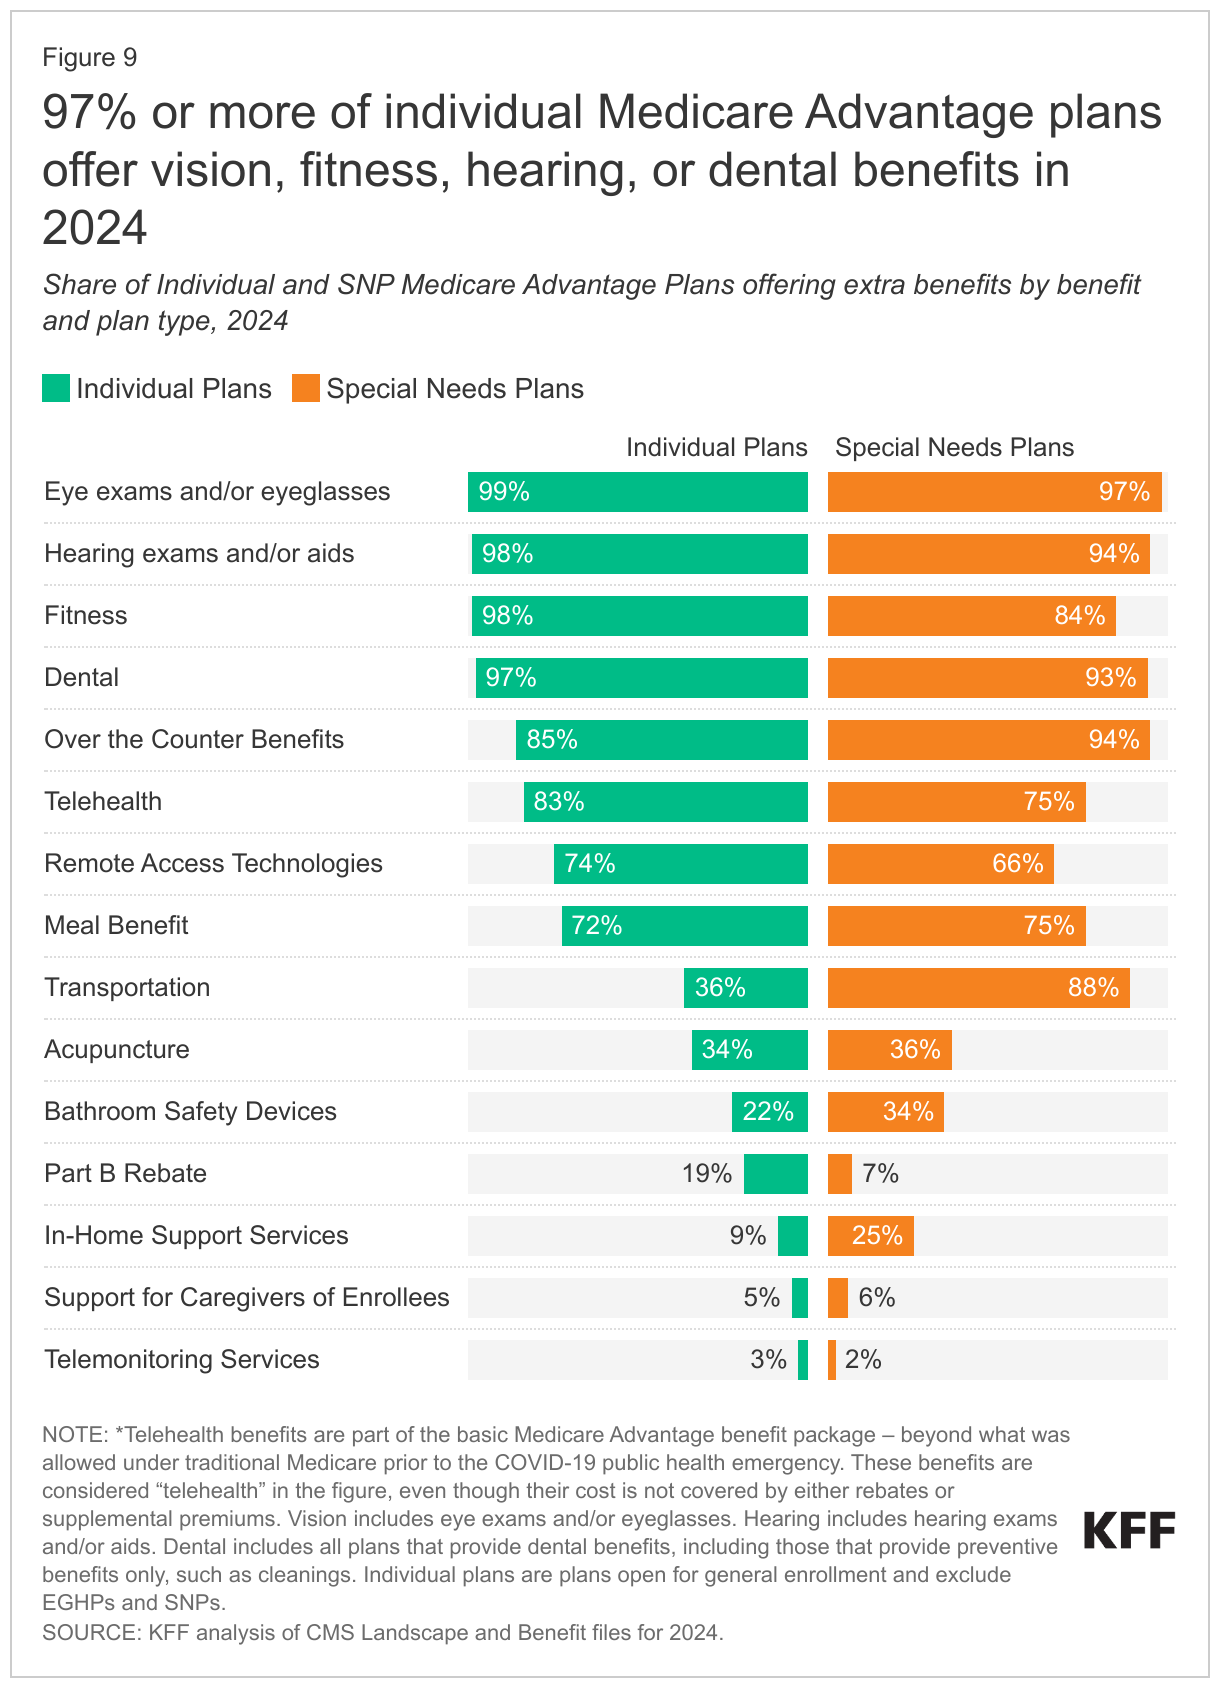
As of 2020, Medicare Advantage plans have been allowed to include telehealth benefits as part of the basic benefit package – beyond what was allowed under traditional Medicare prior to the COVID-19 public health emergency. These benefits are shown in the figure above, even though their costs are built into the bid, and are not covered by either rebates or supplemental premiums. Additionally, Medicare Advantage plans may offer supplemental telehealth benefits via remote access technologies and/or telemonitoring services, which can be used for those services that do not meet the requirements for coverage under traditional Medicare or the requirements for the telehealth benefits as part of the basic benefit package (such as the requirement of being covered by Medicare Part B when provided in-person). The majority (83%) of Medicare Advantage plans are offering telehealth in 2024, but a decline from 2023, when 97% of plans offered these benefits.

Other extra benefits that are frequently offered for 2024, similar to the share of plans offering these benefits in 2023, include over the counter items, such as adhesive or elastic bandages (85%), remote access technologies (74%), meal benefits, such as meal delivery (72%), acupuncture (34%), support for caregivers of enrollees (5%), and telemonitoring services (3%). A little more than a third of plans offer transportation benefits for medical needs (36%), down from 43% in 2023, about two in ten plans (22%) offer access to bathroom safety devices, up from 10% in 2023, and nine percent offer in-home support services, down from 14% in 2023. This is not an exhaustive list of extra benefits that plans offer, and plans may provide other services such as home-based palliative care, therapeutic massage, and adult day health services, among others.

Access to Medicare Advantage Plans with Extra Benefits. Virtually all Medicare beneficiaries live in a county where at least one Medicare Advantage plan available for general enrollment (excluding SNPs) has some extra benefits not covered by traditional Medicare, with over 99% having access to at least one or more plans with dental, fitness, vision, and hearing benefits for 2024. The vast majority of beneficiaries also have access to one or more plans that offer telehealth benefits (over 99%), over the counter items (over 99%), a meal benefit (over 99%), remote access technologies (99%), acupuncture (99%), bathroom safety devices (97%), transportation assistance (96%) but fewer have access to one or more plans that offer in-home support services (72%), caregiver support (44%), or telemonitoring services (20%) .

Availability of Extra Benefits in Special Needs Plans. SNPs are designed to serve a disproportionately high-need population, and a somewhat larger percentage of SNPs than plans for other Medicare beneficiaries provide their enrollees over the counter benefits (94%; up from 86% in 2023), transportation benefits for medical needs (88%; the same as 2023), bathroom safety devices (34%; up from 14% in 2023), and in-home support services (25%; down from 34% in 2023). Similar to plans available for general enrollment, a relatively small share of SNPs offer support for caregivers (6%) or telemonitoring services (2%).

Availability of Special Supplemental Benefits for the Chronically Ill (SSBCI). Beginning in 2020, Medicare Advantage plans have also been able to offer extra benefits to a subset of a plan’s enrollees, that are not primarily health related and are specifically for chronically ill beneficiaries, known as Special Supplemental Benefits for the Chronically Ill (SSBCI). Most individual and SNP Medicare Advantage plans still do not offer these benefits, though more SNP plans generally offer these benefits, particularly food and produce. SSBCI benefits offered in 2024 include food and produce (13.9% for individual plans and 60.0% for SNPs), general supports for living (e.g., housing, utilities) (7.8% in individual plans and 48.0% for SNPs), transportation for non-medical needs (6.1% for individual plans and 29.8% for SNPs), and pest control (3.8% for individual plans and 13.6% for SNPs) (Figure 10).

Most Medicare Advantage plans are not offering Special Supplemental Benefits for the Chronically Ill (SSBCI) in 2024 though more SNPs generally offer these benefits

Discussion

The average Medicare beneficiary has a choice of 43 plans in 2024, the same as in 2023, offered by an average of 8 insurers, one less than in 2023. Medicare Advantage plans can be attractive to beneficiaries because they typically offer extra benefits, such as dental, vision and hearing, often for no additional premium, with the trade-off of more restrictive provider networks and greater use of cost management tools, such as prior authorization. The sheer number of plans presents both opportunities (to shop for better coverage) and challenges (to decipher potentially important differences across plans) although a minority of Medicare Advantage enrollees compare plans during the open enrollment period. Insurers have been drawn to the Medicare Advantage market because it is profitable relative to other health insurance markets, and this comes at a cost to Medicare, in that Medicare currently pays Medicare Advantage 106% of traditional Medicare costs, on average, according to MedPAC. As enrollment continues to climb, it will be increasingly important to assess how well Medicare Advantage is serving beneficiaries in terms of costs, quality, benefits and patient outcomes, as well as how well Medicare’s current payment methodology for Medicare Advantage is working to hold down beneficiary costs and Medicare spending.

Meredith Freed, Jeannie Fuglesten Biniek, and Tricia Neuman are with KFF. Anthony Damico is an independent consultant.

Methods

This analysis focuses on the Medicare Advantage marketplace in 2024 and trends over time. The analysis includes nearly 31 million enrollees in Medicare Advantage plans in 2023.

Data on Medicare Advantage plan availability, enrollment, and premiums were collected from a set of data files released by the Centers for Medicare & Medicaid Services (CMS):

  • Medicare Advantage plan landscape files, released each fall prior to the annual enrollment period
  • Medicare Advantage plan and premium files, released each fall
  • Medicare Advantage plan crosswalk files, released each fall
  • Medicare Advantage contract/plan/state/county level enrollment files, released on a monthly basis
  • Medicare Advantage plan benefit package files, released quarterly
  • Medicare Enrollment Dashboard files, released on a monthly basis

In previous years, KFF had calculated the share of Medicare beneficiaries enrolled in Medicare Advantage by including Medicare beneficiaries with either Part A and/or B coverage. We modified our approach in 2022 to estimate the share enrolled among beneficiaries eligible for Medicare Advantage who have both Medicare Part A and Medicare B. These changes are reflected in all data displayed trending back to 2010.

Additionally, in previous years, KFF had used the term Medicare Advantage to refer to Medicare Advantage plans as well as other types of private plans, including cost plans, PACE plans, and HCPPs. However, cost plans, PACE plans, HCPPs are excluded from this analysis in addition to MMPs. These exclusions are reflected in all data displayed trending back to 2010.

KFF’s plan counts may be lower than those reported by CMS and others because KFF uses overall plan counts and not plan segments. Segments generally permit a Medicare Advantage organization to offer the “same” local plan, but may vary supplemental benefits, premium and cost sharing in different service areas (generally non-overlapping counties).

Appendix

Appendix Table 1: Availability of Medicare Advantage Plans and Insurers, by State, 2024
Appendix Table 2: Entrants and Exiting Insurers in Medicare Advantage Markets, by Plan Type and Plan Locations, 2024