The Business of Health with Chip Kahn
When Minutes Matter, What Is AI’s Role?
May 12, 2026
Audio
About this Episode
Episode 3, AI Series: When minutes matter for a patient’s care, what is AI’s role in clinical practice? Elad Walach, co-founder and CEO of Aidoc — a company with a comprehensive AI health care platform that analyzes real-time images and flags time-sensitive findings — shares his perspective on AI’s transformative power in dodging diagnostic error, improving access to care, and ensuring care quality in busy clinical settings.
The Host
Charles N. Kahn III is a senior visiting fellow at KFF. He is also a visiting senior fellow at the American Enterprise Institute and a nonresident senior scholar at the University of Southern California’s Schaeffer Center for Health Policy & Economics. He serves as co-chair of the international Future of Health collaborative.
Guest
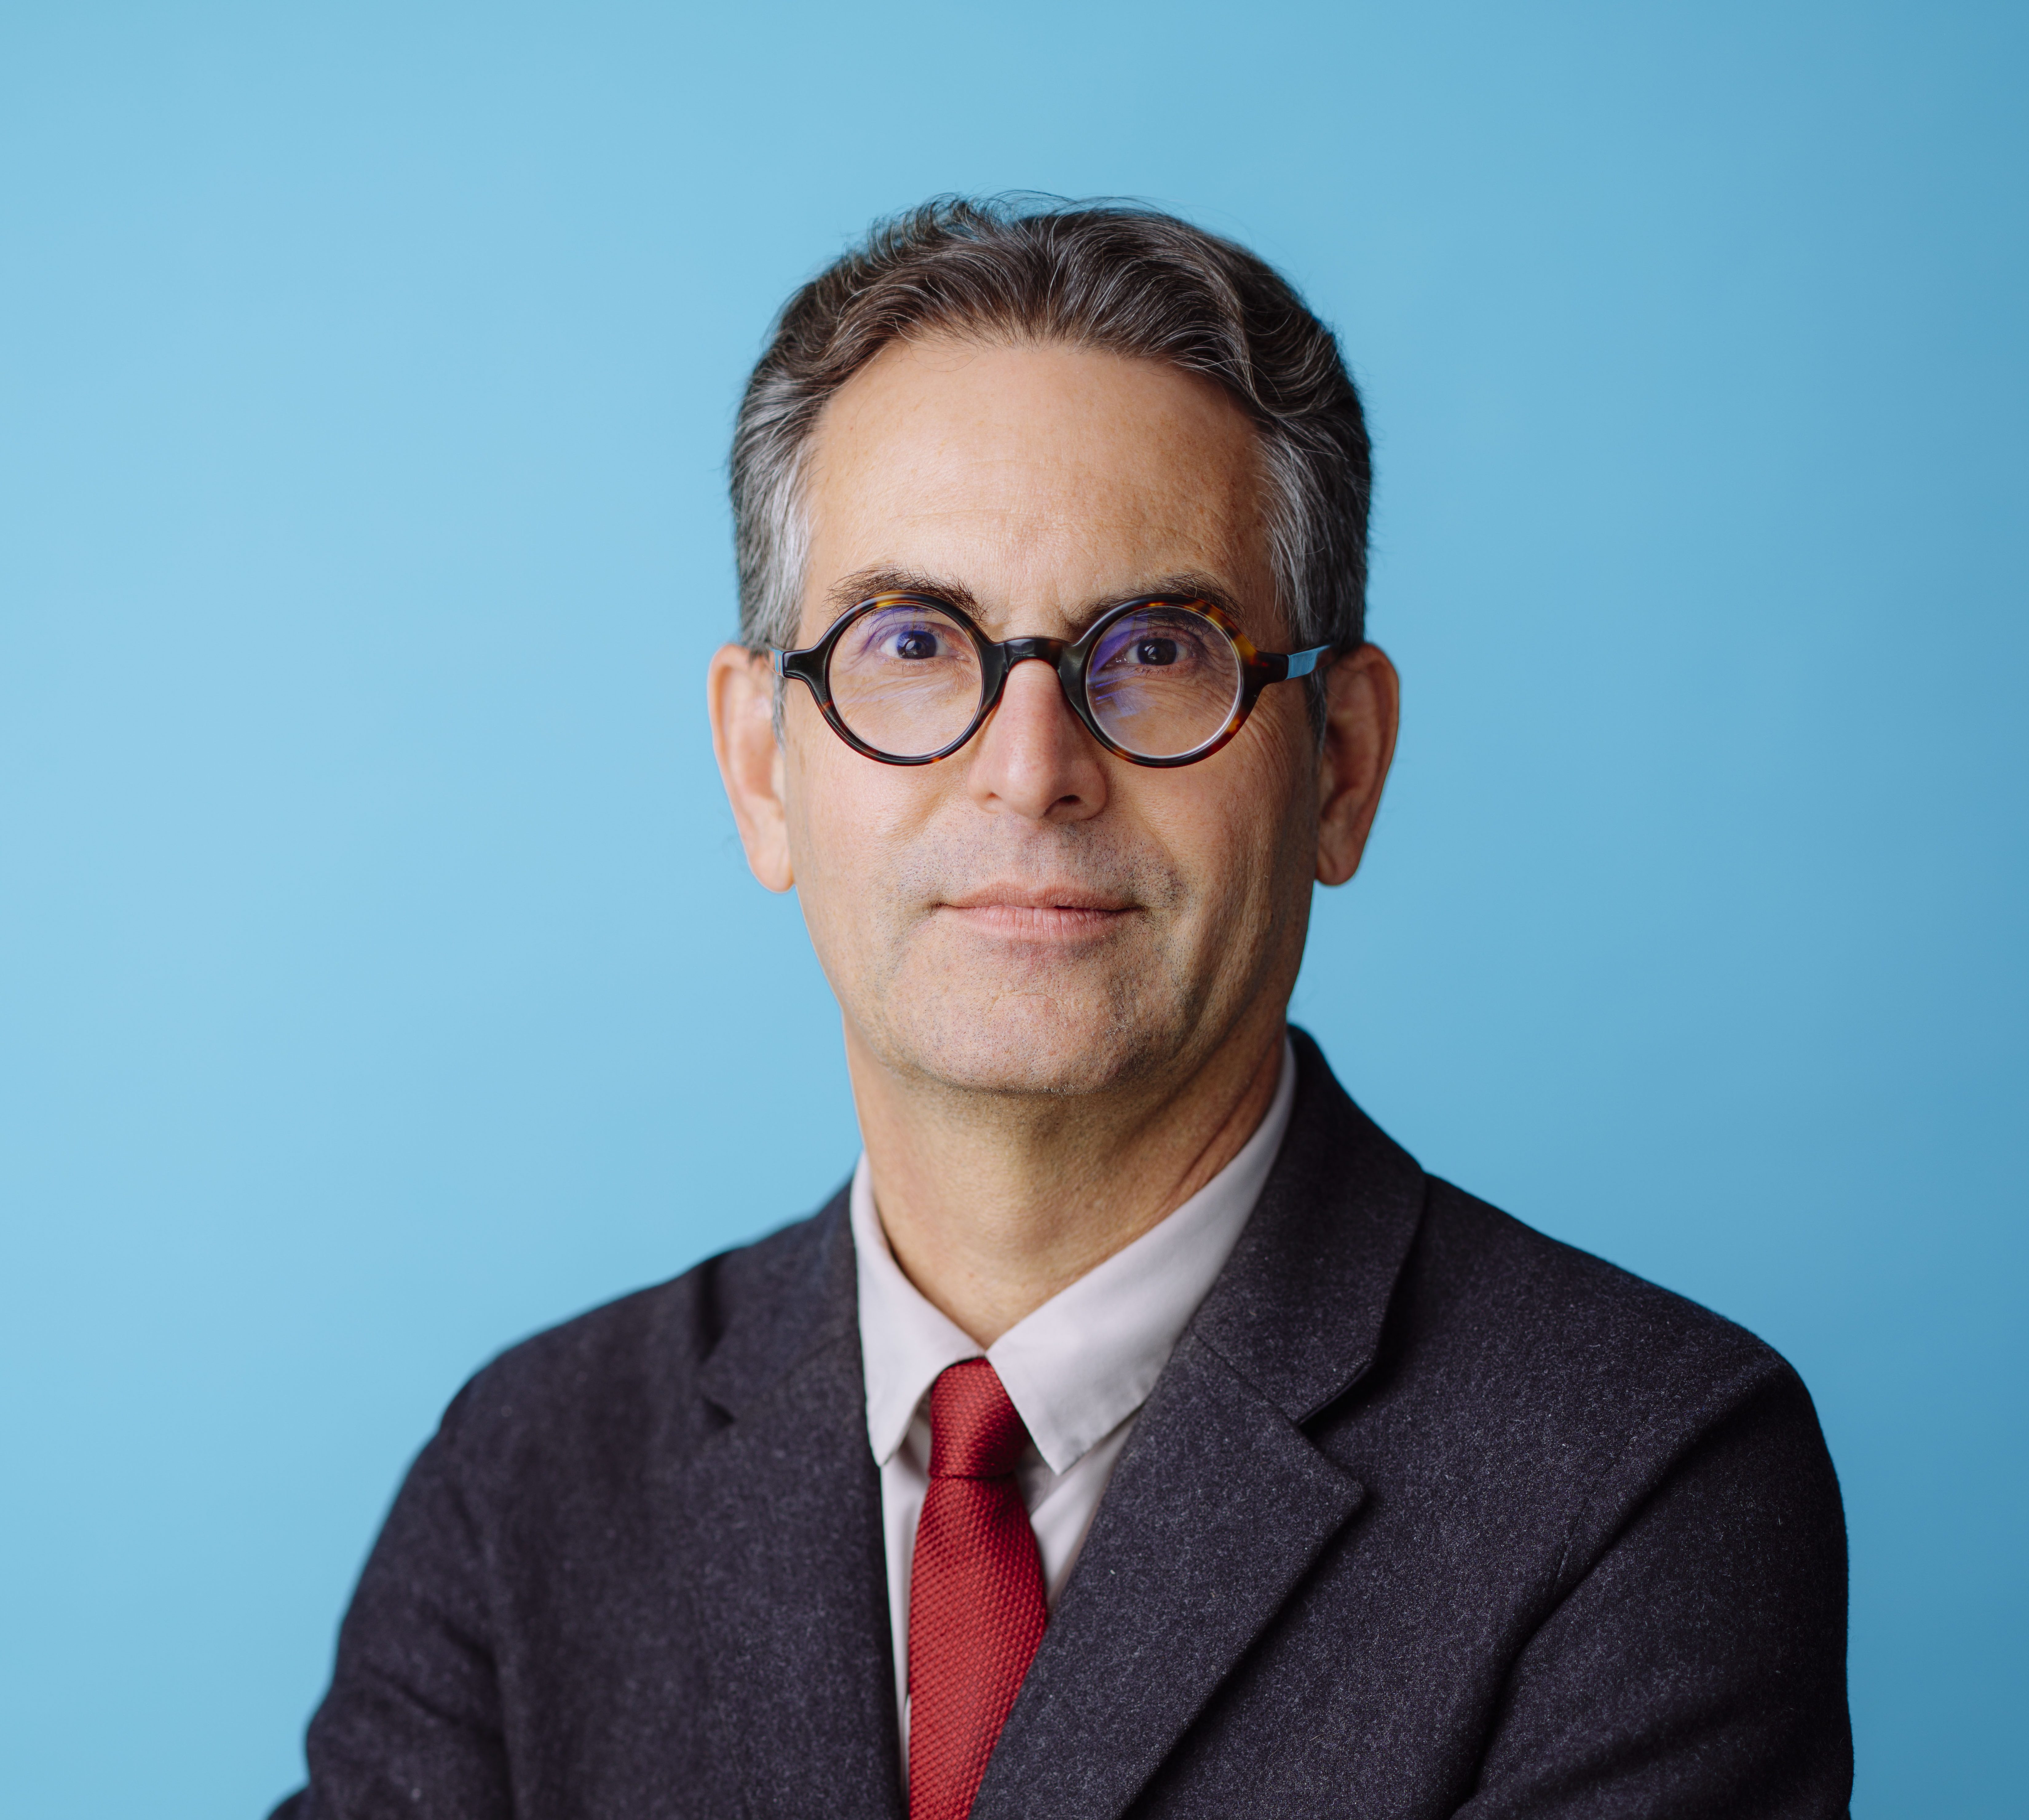
Elad Walach is a co-founder and CEO of Aidoc. He is an expert in AI with visionary business insights in the healthcare space. Since establishing Aidoc in early 2016, Elad led the company through four investment rounds bringing the total investment to $250M, drove the commercial availability of 20 product lines, created an install base of over 1,600 global hospitals while growing the company to over 450 employees.
Transcript
AI Usage Disclosure: This transcript was created with assistance from AI tools. It was reviewed and edited by KFF Staff.
Chip Kahn: In our earlier episodes, we covered the strategic landscape for AI in health care and drew the line between what AI can do in clinical settings and what it cannot do. This conversation goes to the front line, to a firm that has put FDA-cleared clinical AI into more hospitals than anyone else. For most of modern medicine, the great leaps forward have been physical things you could see and touch. A new drug, a surgical technique, a new machine. But what we are witnessing now is something different. The new medical miracles may come not from a molecule or a device, but from digits, from patterns detected in data, from algorithms operating in an abstract, informational space that no surgeon’s hands will ever reach. That is what makes this episode both exciting and maybe a bit unsettling. You will learn that Aidoc’s platform is running right now in more than 1,600 hospitals worldwide, analyzing over 70 million patient cases a year. It holds 32 FDA clearances, the most in its category. When a patient gets a CT scan in an emergency department that runs Aidoc, the AI analyzes the images as they complete and flags time-sensitive findings. Brain hemorrhages, pulmonary emboli, aortic dissections. So, the radiologist sees the most urgent cases first, rather than in the order they arrived at the ER. When minutes matter, that patient lineup can be the difference between a good outcome or a catastrophic one. Elad Walach co-founded Aidoc in 2016, years before the current AI hype cycle. He came from national security AI where the lesson was that cutting edge algorithms mean nothing if they are not actionable. He has built the most widely deployed clinical AI platform in health care. And the question today is what that deployment has actually taught us. How will it change clinical practice? And can FDA-cleared AI change patient outcomes at scale or will obstacles presented by payment structures, workflow constraints and liability concerns limit dissemination despite the clinical validation? Elad Walach, welcome to KFF’s Business of Health with Chip Kahn.
Elad Walach: Hey Chip. Great to be here.
Chip Kahn: It’s so wonderful to have you here because you really represent what we’re trying to get at in this series, which is the ultimate application of AI. And that’s what we’re going to talk about. But before we get into, Aidoc, your company, and talking about the specifics of what you do, I’d like to give our audience some background and ask you how did you get from national security, in Israel, where you were doing AI to health care? And in a sense, what did that transition teach you as you went?
Elad Walach: I do not come from health care originally as you’ve mentioned, I led an AI division for more national security purposes in Israel. But I always had this health care bug in me. A lot of it was through my father, who’s been a huge influence on me. So, when he was younger, years ago, his sister unfortunately passed away due to diagnostic error. And I always had this influence in the back of my mind. It also influenced him. He was actually working in IBM research at the time, and he was one of the people that actually pushed IBM to go into health care, back in the day. He would tell me all the stories on what they’re working on and kind of ingrain that passion into me. When I finished my service together, my two co-founders, we all finished our service at the same time. We said that’s what we’re really passionate about — helping improve quality of care, helping mitigate errors and improve access. And we just spent a lot of time in hospitals. Basically, because we didn’t know much about health care, we spent about a year to a year and a half until we’ve started seeing these recurring problems, recurring problems of lack of access, recurring problems of amazing people who are the clinicians barely holding on in to this crazy system. And that’s why we decided to start Aidoc, really with the mission of improving access to care, improving quality of care.
Chip Kahn: Before we get into Aidoc, and I want to take you back to 2016 and the genesis but what is it about, Israel, and technology and health care that come together? I mean, I’ve spent a lot of time in Israel and done work with Sheba’s ARC, their innovation center. What is the sauce there that’s produced so much innovation?
Elad Walach: First of all, we’ve been proud to be working with Sheba’s ARC from the early days. And I think there are two things that work well in that ecosystem. First of all, we’re all very pragmatic AI people. So especially in the early days of clinical AI, people could get really excited about the model building. And especially I did a lot of work with professors in academia and they could get super excited about this new model coming out or this new paper and always trying to test stuff. But I think you kind of learn about a lot of the practical application and there is a lot more into making an impact than there is to the model-building. You would find a lot of innovation in Israel because of the fact we have to make things work. We’re becoming very practical. And that was a big aspect, by the way, of how we built Aidoc. The second aspect it is, you, know Israel is very small, and that actually has an advantage because everybody knows everybody. If you want to get a clinician together with a technology guy and a business guy in a room brainstorming ideas, it’s much more possible. It’s very easy to kind of find the right cohort.
Chip Kahn: That’s interesting. And just for the audience that, probably don’t know, Sheba Medical Center is, the largest hospital in the Middle East, 1,600 beds and just a tremendous complex and really a university unto itself, in terms of the teaching and the research that’s done there. So, let’s go back to 2016. And you, got into AI before all the hype. And what did you see that others didn’t see?
Elad Walach: I sometimes say I got into AI before it was cool, but it was always cool. So I, wouldn’t say that. But look, I think we’ve realized that there are intractable problems in health care that are going to be very hard to change, manually, basically. And we got into AI in the 2016 world. That was just the first time where deep learning came into being. So those that don’t know, machine learning before that was much less accurate. And it’s about that time when deep learning was invented. And that was the first time we could build an AI that was good enough to provide results that are clinical grade or physician accuracy. Not with the aim of replacing physicians, but finally you have to be roughly as good as them to be actually be able to support them. And that was only possible for the first time. Then there was a tradeoff, by the way, which we can talk more about, but the tradeoff was always that you can be really accurate, but you have to be very specific. You could build an algorithm, for example, to find brain bleed. That was the first one we built. It was very accurate. It could do it like 95% accuracy, but it could only do brain bleeds. If you want to do spine fractures or stroke, that’s a whole different model. And that was the world back then when we got started.
Chip Kahn: So, the focus is on imaging, and the focus is on the emergency room and this indispensable technology, the CT scan. Talk a bit about when a patient gets a CT scan and what Aidoc does.
Elad Walach: Clinical AI, the category we’re in, I think, is the category where people are thinking about health care AI, that’s what they’re imagining. So, Chip, you’ve mentioned that’s a lot of the conversations we are building up to. To be clear, I think we need to tackle the administrative burden. The backend offices describing all of those are really important problems. Clinical AI is really touching care delivery and boy, is that an area where I think health care needs the help. We’re stretched so thin. We have amazing, amazing, passionate clinicians, but the system they’re surrounded with is so overwhelmed. I just read a study today that shows that in ‘22 and ‘23, in two years, we more than doubled the wait times for outpatient imaging diagnosis in two years. The shortage of physicians is becoming so profound. It’s literally impacting access and quality of care. Another study that’s really influenced me is a study by a group at [Johns] Hopkins with David Newman-Toker who did a study about the impact of diagnostic errors in the U.S. and every person probably listening to this will suffer diagnostic harm due to diagnostic error in their lifetime. And the group estimated we have, every year in the U.S., 400,000 deaths due to delays and diagnostic errors. That is such a big number, it’s hard to wrap our heads around. And that is where I don’t think there are any manual things we can do to solve this problem. We threw labor at the problem for years and we’ve made some impact. But the problem keeps growing and growing and growing. The only way out in my mind is technology. And what we need to build as a society is this ubiquitous layer that analyzes every diagnostic encounter and provides this kind of second set of eyes that would help both the patient get accurate and timely diagnosis, the physician do their work efficiently. To imagine what Aidoc does today, we do exactly that for imaging, either as an ED patient or as an outpatient. You go to a facility that has Aidoc, you would get kind of this clinical AI platform, also analyze your data, and then identify certain types of findings. So, let’s say you’re in an ED with an abdominal pain, and today you’re going to get a scan and you’re going to go on a list with, maybe, 100 other patients and you’re going to be waiting for your diagnosis. With Aidoc, basically, the AI look at your scan and find whatever diseases are there. Let’s say it would now scan you for 15 different diseases and we’d say, oh, you likely have appendicitis, or you could have maybe a liver lesion, and it would then prioritize you for a radiologist read almost immediately. Or a pulmonary embolism is an example. So instead of waiting tens of minutes or an hour, you could get the results almost instantly and then get your next step of care. So that’s an example today of how patients get an impact through this technology.
Chip Kahn: So, to get this into the hospitals in the United States and get it disseminated…was it used in Israel before it came here?
Elad Walach: Actually, in tandem with Israel and the United States…
Chip Kahn: The first sort of regulatory hurdle is FDA. You’re in 1,600 hospitals. I want to talk about that in a moment, but let’s start with the regulation part of it. How do you deal with FDA with this kind of technology? How receptive was the regulator to this really disruptive technology that changes things completely?
Elad Walach: When we first started this, I was imagining FDA as this, you know, bureaucratic wall, that is more process than anything else. But through the years, I’ve actually learned it’s people, and it’s actually really passionate people about changing health care. The interaction is not like you’re submitting this and then you forget about it. You actually have continuous interactions with the agency. We’ve submitted more than 30 submissions to the FDA, so we’ve seen that often through the years. And they’re very passionate. And I actually believe they’re providing a critical service to the adoption of clinical AI. The way FDA reacts to it, they’re saying, we understand this is going to be one of the most transformative changes in care delivery we’ve had in decades. But on the flip side, we see a responsibility to both keep patients safe and create a layer of trust. Trust is going to be a determining factor in what gets adopted, what’s not going to get adopted, and, also, what’s getting used and what’s not getting used. It’s how do I know that you work in a safe manner? And I think FDA is actually serving a really critical function in that way. And what they do is they basically ask us, look, tell us what you think your device does, what is your claim, and then let’s validate that. The issue is that our claims keep changing as the technology evolves. But, they’re with us on the journey to keep evolving how we test these. I would say our testing methods really changed over the years as the technology expanded in capabilities.
Chip Kahn: So, in terms of first adoption, you’ve got health systems and you’ve got physicians, you’ve got radiologists and emergency room doctors, who are going to be either aides or obstacles here. And you’re at 1,600 hospitals worldwide right now, which is a phenomenal number. But I assume getting that first one or two here in the United States was a real hurdle to talk them into testing this. And then you had to go through a process. Can you talk about that process? I know with others I’ve talked to who brought startups in the United States from Israel, the biggest issue is how do we show what we can do and get a place to demo this.
Elad Walach: It all comes back to two things that were critical. First of all, it’s the topic of trust and safety and quality. Hospitals and health systems are very concerned on partnerships, both for patient care reasons, for cyber reasons. You have to show them. Even when we were a way smaller startup, right, we had to show them that we’re going to handle this relationship with the utmost care and that breeds trust. And I think that’s going to be really key for adoption. The second thing is they were really compelled by the vision of what we offered, especially in the early days, by the way. I believe in AI. It still is true today. You don’t partner on product, you partner on vision and roadmap and belief in execution. I think AI is in such rapid innovation right now that if you’re actually just evaluating a product, you’re valuing the wrong thing. Because a year from now, the product is going to be different and the value you’re going to get is going to be different. And you always have to think not just what the product that I want can do, but who am I going to bed with because that is going to matter a lot more than anything else.
Chip Kahn: Well, that actually maybe is a good opening to talk aboutWellSpan expanding from radiology AI to 21 care pathways, across nine hospitals. What convinced them?
Elad Walach: With WellSpan specifically, we started with six products. And each product, when I say product, I mean a different disease. So, think about, I mentioned the example of an abdominal pain or a brain bleed. Each one of them was a different disease. During the early phase of the partnership, it was all about obsessing about showing value. And that is a really, really important lesson learned. A lot of people in AI world are focusing on the model or focusing on the product. Both are awesome. But what people really care about in health care is outcomes. So, the real question is, what are the outcomes we can achieve? And for them, the things that they really cared about was time to diagnosis. In their backlog was efficiency. They want to make, you know, to make the reading more productive. They want to ensure their care is coordinated better. And within about 12 months, we were able to show massive improvement across all of these metrics enough that they said, look, we want to go big. On their end, they realize that AI is going to be one of the most important aspects of their strategy to moving forward. I think we all probably believe that AI is going to be a transformational technology, but the implication of that is that we have to change how we operate to absorb it and adopt it in a much more rapid fashion. They’ve basically said, look, we understand we want to build the future, and we don’t just want the future be built on top of us. And that kind of bold leadership is what allowed them to say, hey, we’re going to look at the outcome we’ve generated and then we’re going to go big and we’re not going to do this one at a time. We want in a year’s time to get from the six use cases to over 20 use cases. Once they made a choice, because they had an amazing team, they were able to get there not in a year, but actually in three months from the day we’ve signed. They were like, okay, we’re going to go from 6 to 20 and basically, we’re able to quadruple all the outcomes they’ve seen before, which is only possible, I think, with bold leadership and strong change management practices that their team has.
Chip Kahn: Just because the audience may not be aware, can you sort of talk about where they are geographically and what the spread was geographically of the operation? You just described this dissemination.
Elad Walach: I think that the geographical dissemination was less important because it was always around their whole footprint. The big deal was growing across service lines. So how health care health systems work is typically you have one service line, let’s say radiology, or one service line, cardiology. And the way health care AI can be adopted, there are two different approaches. There is the approach of letting a thousand flowers bloom and there is the approach of let’s develop an enterprise strategy. The thousand flowers bloom, meaning I’m going to let every clinician, every service line, pick their own flavor of the day, and they’re going to build their own point solutions. And these point solutions are really valuable. I don’t want to use “point solution”—is not a bad term. There are incredible point solutions out in the world, but that is one worldview: I want to let everybody do their own thing. I personally have not seen that scale in health care. The reason why it’s not scaling is because change is too complicated for health systems, there’s too many dependencies, and we’re lacking a lot of the platform and governance infrastructure to actually scale these one-by-one use cases. The other approach is saying we’re going to determine as an enterprise what is our approach. And yes, it may be less democratic, and yes, it may be less consensus driven, but what we’re going to get in return is velocity. We will get to dozens, if not hundreds of use cases in a very rapid clip because we’re creating the guardrails for that adoption that I think was the key for the WellSpan growth. It’s not just the geography, it’s more about the fact that they said we’re not going to let every service line or every clinician have a go at their point solution. We’re going to define enterprise guardrails, but with that look at the outcomes. Dozens of use cases running in production in less than six months. It’s pretty remarkable. I mean, if you try and do this in a one-by-one fashion, it’s almost impossible.
Chip Kahn: It’s interesting you describe it like you do because one of the things that was really stressed by Eric Larsen, our first guest on AI, was this notion of at the end of the day it’s going to be top down, in terms of getting the kind of dissemination that’s going to work. This is difficult, this process for the frontline physicians, radiologists, the ER docs, the other docs. And there’s this thing called “alert fatigue” that comes in decision support. And this is really a type of decision support. How do you deal with that? What is it? And how do you make sure it doesn’t undermine all of the advantages you have from the very specific accurate readings that, in a sense, your machine is doing?
Elad Walach: You’re asking a really good question about both alert fatigue and I’ll connect it to the topic of safety and quality. And both are really, really difficult. People are trying to understand, well, why, why wouldn’t we just use ChatGPT, you know, or Claude, and just let it run on all of our scans to identify signals. And you’re right. I think people treat accuracy as a solved problem, the model is going to be good enough. And I will tell you it is not good enough. It is actually the determining factor of what gets adopted versus what’s not getting adopted. Because accuracy means both safety and quality. You’re not missing critical things. But also, it’s the opposite of alert fatigue. I think we’re all sensing it. Also, why are agents not proliferated in every aspect of our life yet? Because agents are proactive. They analyze every piece of data to trigger an action that is a very, very difficult thing because the accuracy requirements when you analyze every piece of data are way higher. So, accuracy is going to be a really, really important factor in all of this. And in my mind, to create accuracy you have to do two things really well. First of all, on the model side, you have to build really, really good models. And we tried to use a lot of different tier models to help speed our work. It was not very productive. In fact, a few years ago we made the very tough decision;I still remember my hand shaking the day I had to present it to the board. We’ve decided to build our own foundation model. Basically, a model that is like a ChatGPT that can take a scan in this instance and not just find one disease like we spoke about before, but actually every disease, altogether. I remember the day the team had the first breakthrough and the team told me, Elad, the model is working. It can find every disease in like 95% accuracy, which was the accuracy of our old production grade models that have been analyzing tens of millions of patients a year. I was like, that’s great. But then my team told me I was like the overly optimistic CEO. My team told me, Elad, you’re not getting it. 95% is no longer good enough when you’re running on 100 diseases all at once because you’re going to have compounded errors. So, the 5%, to give a simple math, if I have a 5% false positive on a scan and I’m running 20 models, I know I’m oversimplifying the math here. It’s roughly going to be false positive, every scan you’re going to like, we’re going to false alarm the hell out of the physicians. Basically we then realized we have to get our models from 95 to 99.5 to become production rate. People don’t understand the difficulty of getting that extra ounce of accuracy. But effectively the model we built and recently got FDA cleared could get up to 99.7% on the specificity. And that was really the key determining factor. So that was the one aspect of everything you’ve mentioned. There is another aspect to it, which is unrelated to the model at all, and that’s thinking about the governments and the monitoring. Data drift is very, very real. It is not an imaginary ghost. On average, we as the market leader, we have the most volume of clinical AI. Even for us, accuracy drifts about 10% every 18 months, we don’t track it 10% in the accuracies I spoke about is the day and night difference between usable and unusable. So you have to build a governance and monitoring infrastructure to track performance drift, to track data drift, and then fix it somehow. Both of these components, the governance, and the monitoring, as well as the model, are key to get this higher accuracy level, which I agree with you, is the only difference between what you can and can’t use in the real world.
Chip Kahn: I want to get a deeper dive into some specific examples, but before that, let’s define, when you say data drift, what’s causing that? Because you’ve got a tremendous amount of records that are feeding all the information you have, and you’ve got all these scans, why a drift?
Elad Walach: I love that question. And it’s very counterintuitive when you’re kind of outside in. I’ll give a simple example. How do you know that a scan, let’s say, is a head scan and contains or doesn’t contain contrast? I would imagine it’s somewhere there in the metadata. It’s written somewhere, somebody knows. Nobody knows. It is all manual. You know, it’s manual all the way down. You need to have a person typically saying, this is a head CT and this is without contrast. And typically you need a human in the loop to determine that. So that is the problem called model orchestration. You need somebody to say, this model, this AI, is relevant to this piece of data. And in theory, if you don’t have another solution, it will be a very manual process. And these protocols keep changing. For example, I added a new stroke protocol, or I had a new type of machine, or I changed this type of workflow, or I acquired a health system, or I had another scanner in the ED. Each one of those changes my data. And because the data is unstructured by nature, that’s what causes the data drift. And you add one plus one plus one, and effectively what you’re getting is a whole complete new data set after two to three years. That is some of the problem we have in health care. When you think about even units of medication, types of medication, types of procedures, all of it changes all the time. So that is why another layer is necessary to both mitigate and then monitor all of that drift.
Chip Kahn: In terms of this drift, is the machine smart enough to constantly calibrate, or does it take human eyes to make sure that calibration is there?
Elad Walach: Yeah, that’s a beautiful question. And the answer is both. On the one hand, the machine can do some of it. If you train the model orchestrator good enough, it can fix some of this. But at the end of the day there are a lot of these that are unknown. You don’t know what’s going to change. And it’s very hard to train an algorithm that can face the unknown. You almost always have to have some sort of human in the loop to monitor at least the high-level components of the data. And I think it’s here to stay. I think it’s a new profession. I remember when the first ChatGPT paper came out, they thanked all their team members and one of the roles was they thanked their AI babysitters. And I found that so interesting that we have this new generation of professions of people whose expertise is to really manage these new models and agents and workflows. And it’s necessary. I actually think you have to have a human in the back end holding up the AI to some extent.
Chip Kahn: And this isn’t just a health care issue. This would be in every data-based process you’re going to have the same thing happening as you get new data expansion and the feedback loop is going to be somewhat distorted, it sounds like, and you’re going to have to constantly keep calibrated.
Elad Walach: I agree, it’s not just a health care issue. I think it’s slightly worse in health care because of the pace of change combined with the needed accuracy. Again, we’re all going back to accuracy, that it’s not a solved problem. Because safety and quality are so paramount. We have to be much more hawkish on ensuring consistent accuracy and performance.
Chip Kahn: So, let’s take a deeper dive. Patient comes in, Aidoc flags a brain hemorrhage 30 minutes earlier. Where’s the value versus what would happen without Aidoc?
Elad Walach: There are multiple areas of value. One area is that you mentioned the emergency department that is truly time to diagnosis, time to treatment. A friend of mine called me to tell me a true story right now. They went into a Mayo institution, and they got pulmonary embolism results in minutes from coming in. So, they came in, they were scanned for something oncological related, and within minutes they got, hey, you have a pulmonary embolism. We need to treat you for that. Because of the increasing backlogs we have, the likelihood of a pulmonary embolism being identified within minutes is very low if you’re not using AI because the backlogs in the ED are increasing by a lot. The other area of value is proactive care, or precision medicine. And I’ll give the example from Mercy, which is a fantastic hospital in St. Louis, what they said is there is a test called calcium scoring. It’s one of the best predictors we have for heart disease. You know, you pay whatever, a hundred bucks, you do a dedicated study. Well, guess what? Most people are not going to take the time of day and pay 100 bucks and get their calcium score. Especially as you go to rural America, right, or more community-based care. The opportunity we have is immense. Today AI can look at the scan and say, hey, we have suspicion, you actually have calcium score. We should take a look at that and we actually can marry that with your clinical record to find the short list of patients that have heart disease risk and are currently unmanaged. The example of Mercy in St. Louis, they’ve decided to be proactive for their patients. And they found that about 6% of all patients doing a chest CT for whatever reason—think about you broke a rib or whatever—have this unmanaged intermediate to high-risk calcium score and are now reaching out to those patients to help them get care. So, think about this, us also moving with AI, the health system from reactive—I’m just doing what I’m told—to proactive. We’ve got your back because we have all this data. These are some examples of how clinical AI can be used to really change the care paradigm.
Chip Kahn: I understand that one of your customers flagged 10,000 incidental findings in a year and these are conditions that nobody was looking for. What does it mean to sort of treat the whole patient through imaging here, and what are the positives and negatives of that? Because in a sense you’ve got, you know, finding disease. On the other hand, you have issues of liability and payment, and it gets complicated because of the way our system works.
Elad Walach: It does get complicated. I will tell you, I’ve met a lot of health system executives, and I think they all share the passion for improving care. They’re generally doing this for the right reasons, which is amazing because I get all these warnings at the beginning. It’s all cynical. It really isn’t, like people want to do the right thing for their patients, but obviously we have to be realistic and build sustainable models. In my mind, the key is not just creating problem with “lets us find all these solutions,” but actually help with the management and the workflow of these patients. And I think for that, that’s where you really need to have an end-to-end understanding of the situation. Notice the example of calcium scoring I gave you. I could have ended with the image. I could have said we’re just scanning the patient, looking at the image for suspicion, but I actually added another component. We’re looking at the charts, we’re looking to understand are they managed, what is the clinical history. And then you actually can shortlist the patients that require that follow up care. And that I think is the key. Don’t stop in just the detection in an already overwhelmed system. Help with risk certification to make sure that the patients that we’re finding are those that you actually want to treat.
Chip Kahn: Let’s talk a bit. And we’re sort of heading in that direction about the business model. I mean, there’s no reimbursement, necessarily, for this extra service. There’s the cost that’s paid, I mean the charge, that’s paid for the scan. So, who’s paying for this? I mean at the margin. Is this costing more money? And then, you know, where does the money come from? And obviously you need to be paid.
Elad Walach: You have to find sustainable ways to create innovation. Right? I think the people that I know in health care are doing this because they want to help improve care. But we all live in an environment where, you know, building this foundation model I described earlier costs $300 million at least. You know, you’re not going to get $300 million for just doing good, right? So, you have to figure out a sustainable way. And you’re right, there is no reimbursement. The way these models work, you have to find an ROI that is directly good for the health system in a financially sustainable way. And typically, the way these work is you have to show, and obviously it highly varies per the AI solution and disease, but you have to show either you’re improving efficiency, maybe reducing time to diagnosis. So, improve efficiency, that influences things like ED length of stay or driving more revenue because you’re able to create more valuable patient encounters. But whatever which way you’re looking at this, you have to find a way to show that every dollar you’re spending on improving quality of care through clinical AI is also good for them, by improving their operations. Otherwise, it’s just not sustainable. And they’ll just do like maybe a few, but they can’t really sustain that.
Chip Kahn: And then also, I guess the other factor is that you’ve got the EHRs, you’ve got Epic, that dominates, but you also have Oracle and Meditech and a few others. How do you integrate with them? And then in looking into the future, how do you sort of stay parallel and maintain your business model when in a sense you could argue that something like this should just be part of the EHR, the electronic health record in the first place.
Elad Walach: I’ll actually start with the second question. You know you’re asking really, you know, really bold and tough questions, which is great. I think that’s what makes it interesting.
Chip Kahn: That’s why they pay you the big bucks.
Elad Walach: Yeah, exactly. I think so. Let me start with the second question. I actually think those are two somewhat distinct categories like diagnostic FDA-cleared complex signal AI. FDA actually has a different category for what they call complex signal analysis. Like an image versus what they call clinical decision support, more text based. And in my mind the line draws on the topic of commoditization, what is like very hard to do. And we talked about accuracy, we talked about workflow integration. There are all sorts of these aspects that require this distinct category. And we’re seeing that trend of differentiation between what I would categorize, AI enabled system of records to an AI specific category. If you look at the broader software market, the interesting thing I find is that you find a lot of the AI natives are actually gaining a lot of share for AI-specific non-commoditized use cases while the AI enabled system records are also monetizing AI, but for very different use cases. And again, we’re seeing that play out in the broader software market as a whole. I’m not going to get into an argument who’s going to win in the long run in the broader software market but I think in here it actually is parallel. Those are two different spaces where we’re talking about the uncommodified, incredibly complex diagnostic AI versus doing some of the things that are more native to the workflow kind of semi-tech solved problem that are still very difficult. I’m not going to reduce the magnitude of them, and I do think they’re going to maintain parallel. Should they be integrated? Absolutely. I think workflow is key. Anybody who ever touched health care applications will tell you the same thing. And luckily, I actually think that all the vendors, if it’s Oracle or Epic or Meditech, I think they’re actually all opening up. We found them incredibly collaborative in a way to integrate back into the workflow. I would say the key would be not to take people out of the workflow but actually feed more information in. But I think it’s actually very possible today.
Chip Kahn: Well, it sounds like from your description that there has to be in proper use of Aidoc integration with the EHR so that you’ve got that data that sets a context for the image, reading, right?
Elad Walach: Yes, but even more than that, I think that it’s, A, it’s a patient context, but B, it’s about being easy to use and being automatic. The more you’re going to ask people to go outside of their norm, the harder adoption is going to be. So, you have to find ways to not overwhelm your users. If the whole point is to increase efficiency, you cannot ask them to click a button, go to a different system, click three more buttons, go back into the system, copy paste. I just think it’s going to be way harder to drive adoption this way. So, I think the integration into the EHR is going to be key, yes, for patient context, which as mentioned, multimodal is going to be key, but also to be embedded in the way they work.
Chip Kahn: And so where is the physician, particularly the radiologist here? Who’s had the role historically, traditionally of reading the image? I mean, prior to this technology, you know, you had to wait til the radiologist read the image, right? So, you’re coming in on top. What’s the response of the profession and what are the implications for the future of that profession and the other maybe other, specialties also?
Elad Walach: So, let me state very plainly. I don’t believe in the “we’re going to replace radiologist” paradigm. I also don’t believe in the paradigm of bypassing. I do believe it will enable better collaboration between the specialties. Because imagine an ED physician that now has these AI flag that alerts both them and the radiologist for the existence of a patient. Maybe for normal findings, they can speed through the ED. I do believe we’re going to see more of these workflows. Generally, I think we have to be extremely careful in how we think about workflow in the context of safety and quality. I know I’m like banging that drum time and time again, but what we don’t want to do is to move too fast and then have this blow up in our faces and actually, taking a decade back, I think there are ways to progress. There are collaborative and are not going to be overly disruptive to any specialty, but actually shifting over time more tasks between the different specialties. I do believe we want to do something like that to allow everybody, basically, to diagnose—radiologist or not—top of their license. And I do think saying that means we will shift over time some tasks but called the bottom of the license work out of that. But I think we need to do it safely, carefully, and it’s going to take us time to think through all the governance, through all the guardrails and how do we do it in a way that really preserves the quality of care.
Chip Kahn: So, to sort of see what comes next. I think your January 2026 clearance points towards an AI managing whole clinical workflows. And you’re beginning to hit on that. Where is that headed?
Elad Walach: I mentioned foundation models before. I think it’s the most transformative technology for care delivery, honestly, that we’ve seen. So, what are foundation models? I’ll say it briefly. It’s basically as mentioned, instead of finding one disease at a time, it’s a model think about like a ChatGPT where you can upload a scan and find every disease all at once. And also, as mentioned, with way higher accuracy than 99.5. It’s quite incredible. It’s expensive to build, but once you build it, it’s incredibly powerful. Today, an average health system using clinical AI with a platform would adopt 12 use cases, 12 different diseases. I think we’re a year and a half away with foundation models that we can cover every disease on an image, at least in CT and X-ray. My belief that a health system will be running over 100 clinical AI or disease detectors, at least an average system. We’re not that far away from this. I know it sounds crazy right now, but that’s the nature of exponential growth. Things like we can’t imagine are growing very, very rapidly. What I’m imagining in the future is that clinical AI will be as ubiquitous as driving with a seat belt. Right? You can’t think of going into a car and not putting your seatbelt on. I think similarly we should imagine a world that no diagnostic encounter doesn’t have this AI layer supporting it. And with foundation models, I actually don’t think we’re that far away. It has been that transformative and as you mentioned, it’s very new. We’ve got, to the best of my knowledge, world’s first clearance for a foundation model-based application. This was like a couple months ago, so, it’s all very new, it’s all very rapidly evolving, but the exponent is coming and I think it will have an immense impact on care.
Chip Kahn: I mean, that sounds transformational, not just a game changer. And maybe we’ll close out with this question. What should a patient know about AI’s role in their care that they certainly don’t know today, I mean, clearly, what you just described is something I think the average patient couldn’t. I can’t visualize even, what should they know?
Elad Walach: So today, AI has been serving a very backend role, and to some extent, justifiably so. The heroes in this equation are the clinicians, and the AI is just augmenting them. And I still believe that is going to be true. However, I do think as AI Is becoming more proliferated, and now we’re at the pace of over 70 million scans a year, so it’s becoming quite proliferated, it will become the standard. And as you want to know that your health system is using the best tools out there, I think patients should be aware of, at least, what are the systems doing to ensure they’re using the best tools out there. And I do think patients should be aware of that. I’ll give an example. If you’re a patient going into an outpatient imaging center that has clinical or imaging AI, it would scan you for acute findings, even if you’re not being suspected for that. If you are a cancer patient, you have increased risk of pulmonary embolism. Today, because of the backlogs, we have some institutions, not everywhere, but some, where you would be waiting a week to get your diagnosis. Now, imagine you’re one of the two of those 2 to 4% that has an acute finding. And now imagine the world where you’re waiting a week to get this result. Maybe pick up the phone, maybe not, versus getting picked up by the head immediately to go to the ED. That is not science fiction. That is an existing capability today and I think we should all start becoming more and more aware of that.
Chip Kahn: Elad, thank you so much. This has just been so informative, and, I think I used the word unsettling at the beginning, to characterize it. But I don’t think it’s unsettling. I think it really is exciting. We all should look for a better future, I think, from what you’re doing.
Elad Walach: Thank you, Chip.
SERIES
This weekly podcast features insightful conversations between host Chip Kahn and his guests, who discuss the business of health care, connecting the dots between the health care business, policy, and patients.
The podcast’s first series on AI in health care illuminates how AI is changing health care, and features guests who are deploying this technology, managing its consequences, and designing policy around it.