News Release

More States Are Providing Fully State-Funded Health Coverage to Some Individuals Regardless of Immigration Status

Published: May 1, 2024

More states are providing fully state-funded health coverage to some individuals regardless of immigration status. 

An updated KFF analysis shows that as of March 2024, 12 states and Washington D.C. provide fully state-funded coverage for income-eligible children regardless of immigration status. These states include California, Connecticut, Illinois, Maine, Massachusetts, New Jersey, New York, Oregon, Rhode Island, Utah, Vermont, and Washington.Six states — California, Colorado, Illinois, New York, Oregon, and Washington, plus D.C. — have also expanded fully state-funded coverage to some income-eligible adults regardless of immigration status. In most of these cases these state expansions have taken place since 2020.

These programs, wholly funded with state money, extend coverage to undocumented immigrants and Deferred Action for Childhood Arrivals, who are excluded from any federally funded coverage, as well as some lawfully present immigrants who are not eligible for Medicaid or CHIP. States vary in the eligibility and scope of benefits offered through these coverage programs, and these efforts are limited by funding constraints.Beyond state-funded efforts, many states have taken up options in Medicaid and CHIP to draw on federal funding to expand coverage to lawfully present immigrant children and pregnant women. The analysis provides an overview of state take-up of these options and state health coverage programs for immigrants regardless of status. It also examines how health coverage and care for immigrants vary by state coverage policies using data from the 2023 KFF/LA Times Survey of Immigrants.

Data suggest that providing state coverage options for immigrants make a difference in their health coverage. The 2023 KFF/LA Times Survey of Immigrant Adults shows that immigrants residing in states with more expansive coverage policies for immigrants, including state-funded coverage, are less than half as likely to report being uninsured as those in states with less expansive coverage (11% vs. 22%).

Despite these expansions, uninsured rates remain high among noncitizen immigrants, with 18% of lawfully present immigrant adults and half of likely undocumented immigrant adults reporting being uninsured. 

Coverage of Sexual and Reproductive Health Services in Medicare

Published: Apr 30, 2024

Note: This analysis was updated on July 18, 2024, to use 2022 data for the overall estimate of women of reproductive age with Medicare and includes the addition of state-level estimates.

Key Takeaways

  • Over one million women of reproductive age (20 to 49 years) receive their health insurance coverage from Medicare, qualifying for Medicare coverage because of having a long-term disability. Compared to women with Medicare who are ages 65 and over, women of reproductive age with Medicare are more likely to be Black or Hispanic, have lower incomes, be in worse health, and experience functional and cognitive impairment.
  • Medicare coverage of many preventive sexual and reproductive health services, including wellness visits, screenings for sexually transmitted infections and HIV, and cancer screenings, is on par with coverage in Medicaid and private insurance.
  • Many contraceptive products are covered under Medicare’s Part D prescription drug benefit, but coverage and cost sharing for specific contraceptive products vary across Medicare Part D plans. In general, Part D coverage of intrauterine devices (IUDs) and contraceptive implants is not widespread in 2024, though most Part D enrollees are in plans that cover contraceptive pills, rings, patches, and injections. While the out-of-pocket cost for some contraceptive products is relatively low, some Part D enrollees could pay up to a $100 copayment or 50% coinsurance for certain higher-cost contraceptive products.
  • While Medicare covers many types of contraception, coverage is more limited than Medicaid and private insurance, which generally cover all U.S. Food and Drug Administration (FDA)-approved, -granted or -cleared contraceptive supplies and services without cost sharing. In contrast to coverage under Medicaid or private insurance, people with Medicare can face out-of-pocket costs for visits to insert or remove long-acting reversible methods such as IUDs and implants.
  • Female sterilization (e.g., tubal ligation) for females is covered under Medicare only when it is necessary as part of the treatment of an illness or injury. However, under Medicaid and most private plans, the procedure is covered without cost sharing.
  • The Hyde Amendment prohibits federal funds from being used to cover abortions under Medicare except if the pregnancy is the result of rape or incest or when the pregnancy poses a threat to the life of the pregnant person.
  • Medicare, unlike Medicaid, requires cost sharing for pregnancy-related services and, unlike private plans, typically requires cost sharing for prenatal visits and related services including breastfeeding support and supplies.
  • Nearly 8 in 10 (79%) women of reproductive age with Medicare are also covered by Medicaid, which gives them broader coverage of sexual and reproductive health services relative to having Medicare alone. In addition, most dual-eligible individuals receive assistance with their Medicare Part A and B cost sharing, meaning they do not pay out-of-pocket for Medicare services that require cost sharing, and also receive subsidies that help pay their cost sharing for contraceptive products covered under Part D.

Introduction

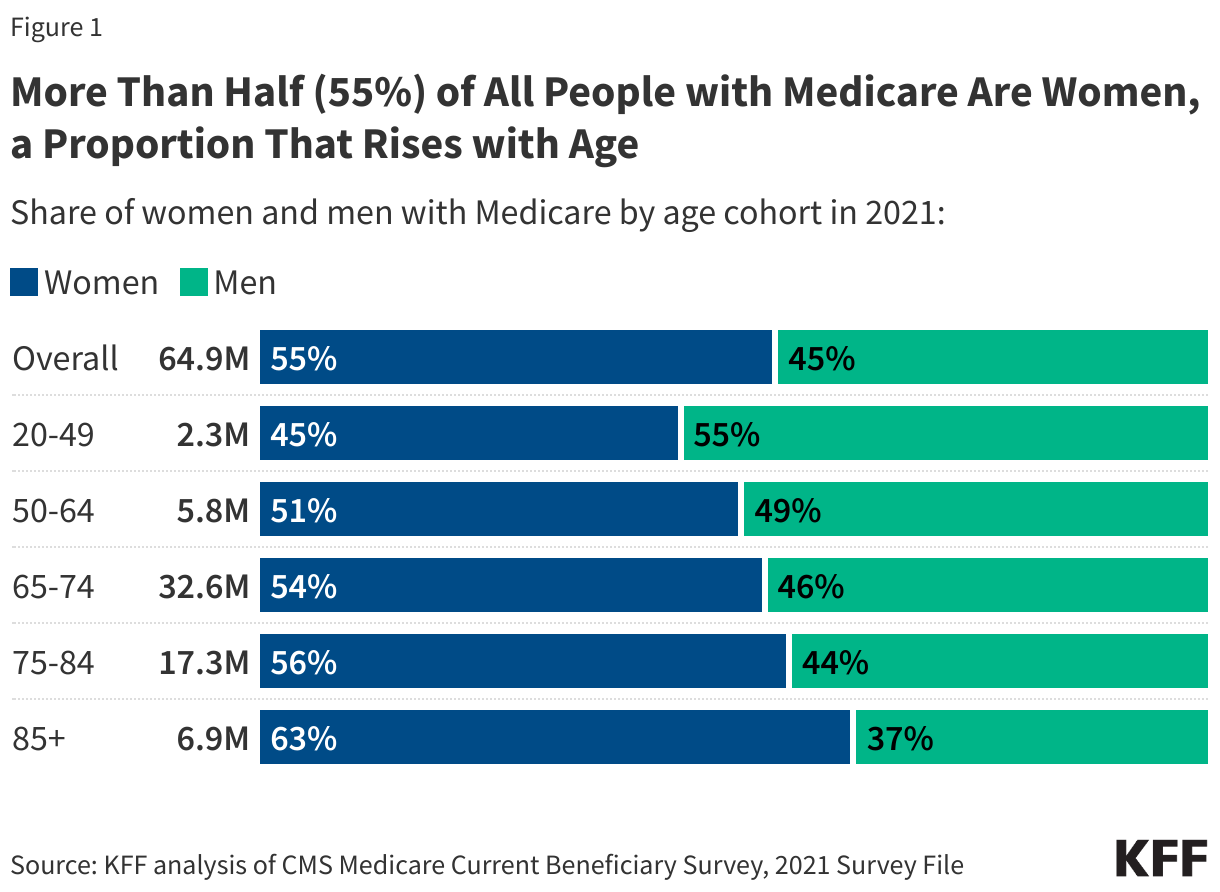
Medicare is the federal program that provides health insurance coverage to 66 million people, including over 35 million women. While Medicare primarily covers people ages 65 and older, it also covers people under age 65 with long-term disabilities, including 1.1 million women of reproductive age (ages 20-49) in 2022. (For state-level estimates of women of reproductive age, see Table 1.)  Women with disabilities have unique health needs and experience greater disparities in health outcomes and access to care, such as physical barriers for those with mobility impairments and a shortage of clinicians with expertise in caring for people with a disability. Misperceptions about the sexual health needs and preferences of women with disabilities may also result in patients not getting needed care or their preferred form of contraception. People who are under age 65 covered by Medicare report worse access to care, more cost concerns, and lower satisfaction than people with Medicare ages 65 and older, yet are often overlooked in discussions about Medicare and ways to make the program work better for beneficiaries.

While Medicare covers a broad range of health and medical care services, it was not originally designed to meet the specific health care needs of people under age 65 with long-term disabilities, including sexual and reproductive health care for women of reproductive age, since Medicare eligibility for people under age 65 was added several years after the program’s creation. Addressing this gap may be part of the impetus behind the executive order issued by President Biden in June 2023 directing the U.S. Department of Health and Human Services (HHS) and the Centers for Medicare & Medicaid Services (CMS) to take steps to improve Medicare coverage of contraceptives. The Biden Administration has recently updated the formulary review process for coverage of contraception under the Medicare Part D drug benefit, which could increase coverage of additional types of contraception for people with Medicare, specifically intrauterine devices (IUDs) and implants.

This brief describes Medicare coverage of sexual and reproductive health services for women and others capable of becoming pregnant. It also compares Medicare coverage with what is required by federal law under private insurance plans and Medicaid, the federal-state health coverage program for people with low incomes. (KFF recognizes that some individuals who require contraception and other reproductive health care services may not self-identify as women. The language used here attempts to be as inclusive as possible, but some of the analysis is based on survey data that uses specific gender labels for female and male for the data year analyzed for this brief, and may not be inclusive of gender non-binary, transgender, and other gender expansive identities.)

A Profile of Reproductive-Age Women with Medicare

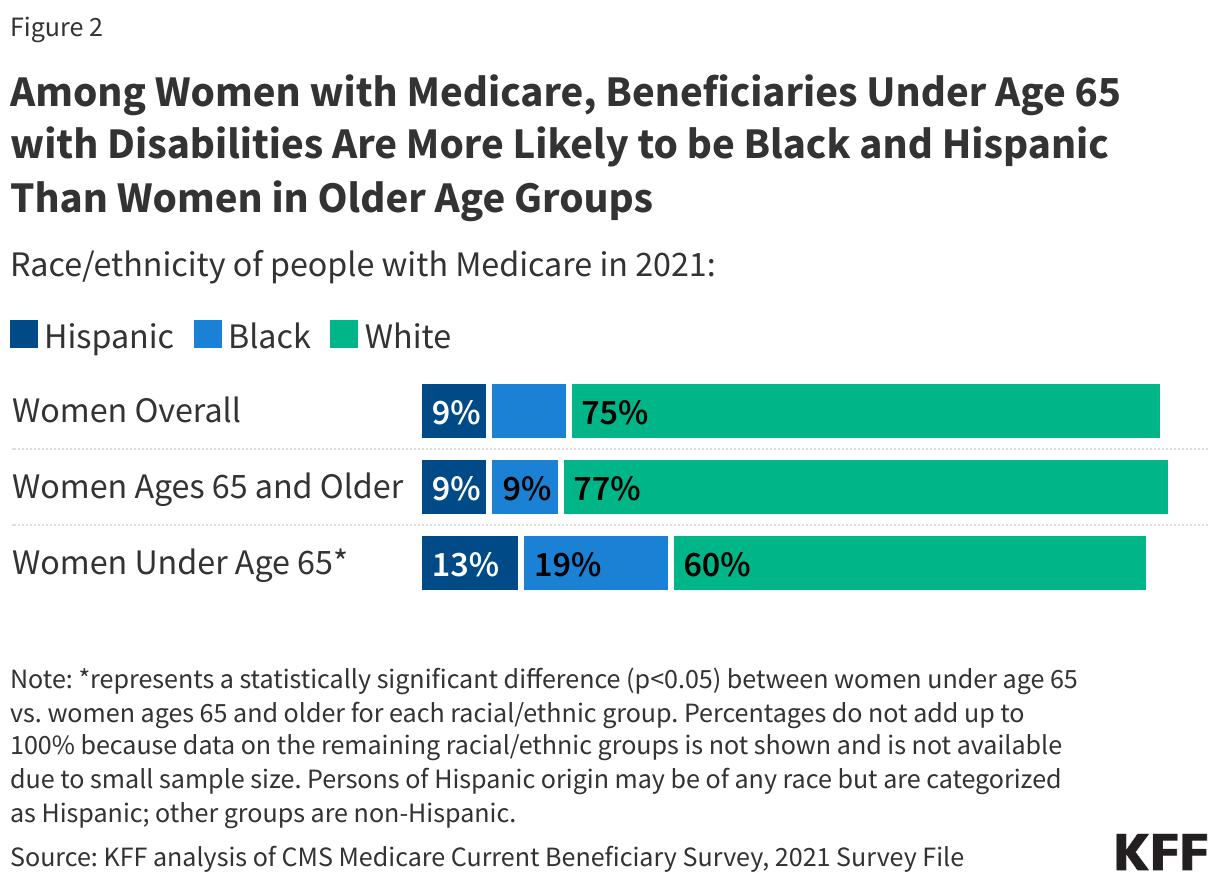
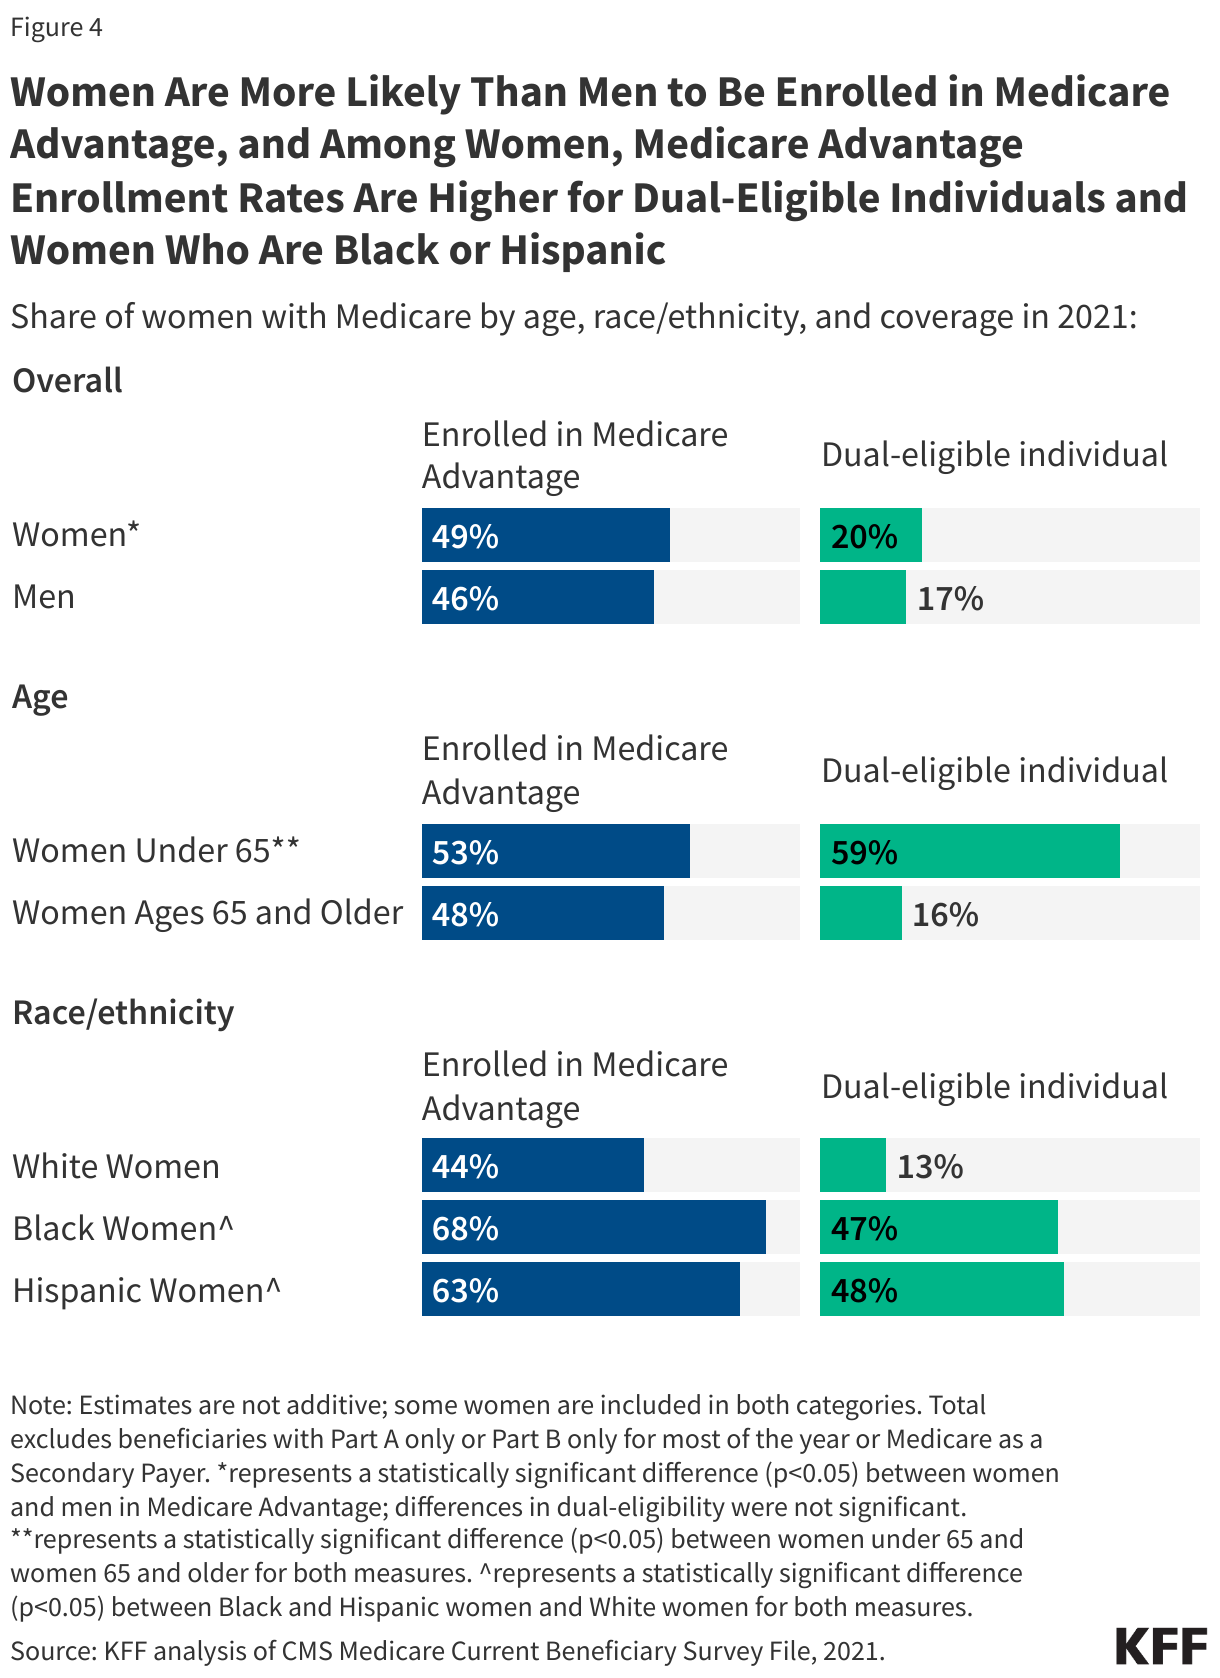
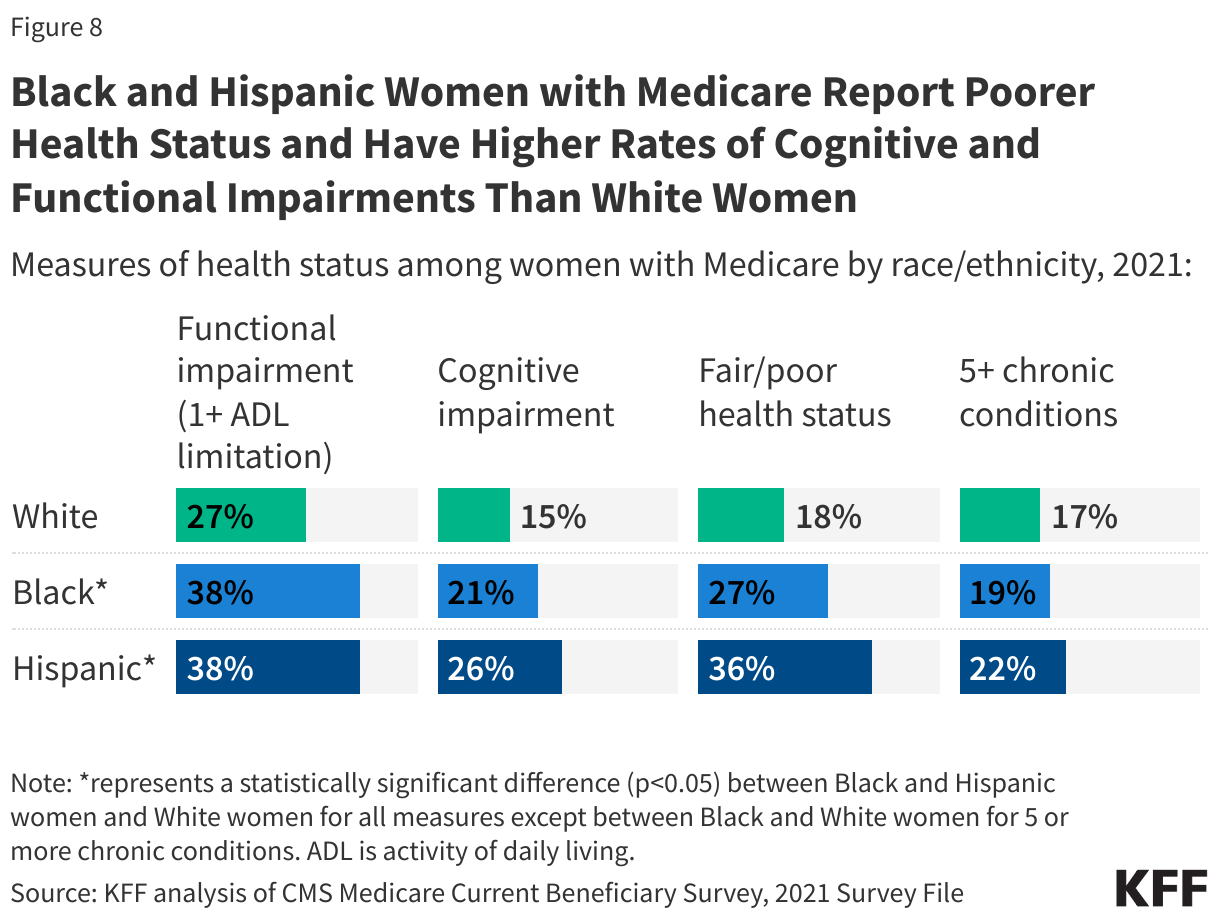
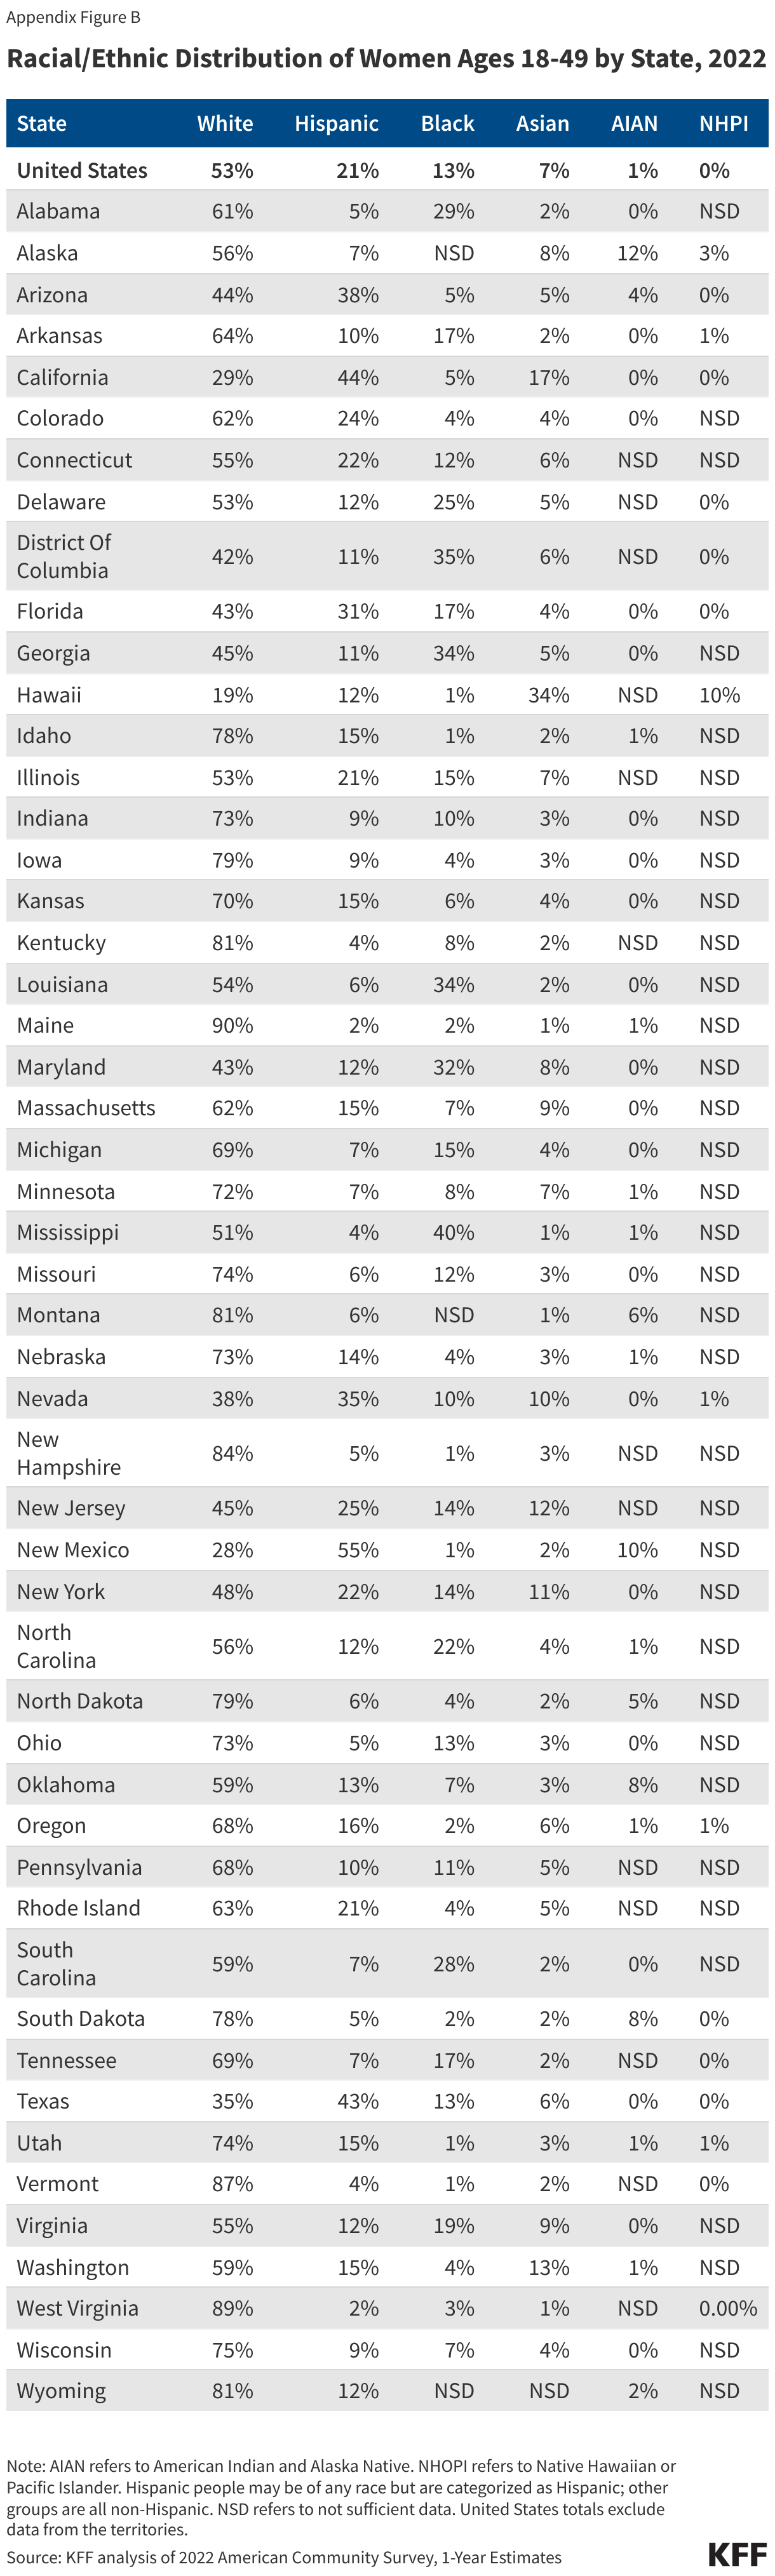
Women of reproductive age (ages 20 to 49) with Medicare are more likely than women ages 65 and older with Medicare to be Black or Hispanic, have lower incomes, be in worse health, and experience functional and cognitive impairment (Figure 1). (These estimates are based on KFF analysis of 2021 data from the CMS Medicare Current Beneficiary Survey.)

Reproductive-Age Women with Medicare Are More Likely Than Women 65 and Older to Be Black or Hispanic, Have Low Incomes, and Be in Worse Health

Race/Ethnicity. A larger share of women of reproductive age than women 65 and older with Medicare are Black (20% vs 9%, respectively) and Hispanic (14% vs 9%, respectively).

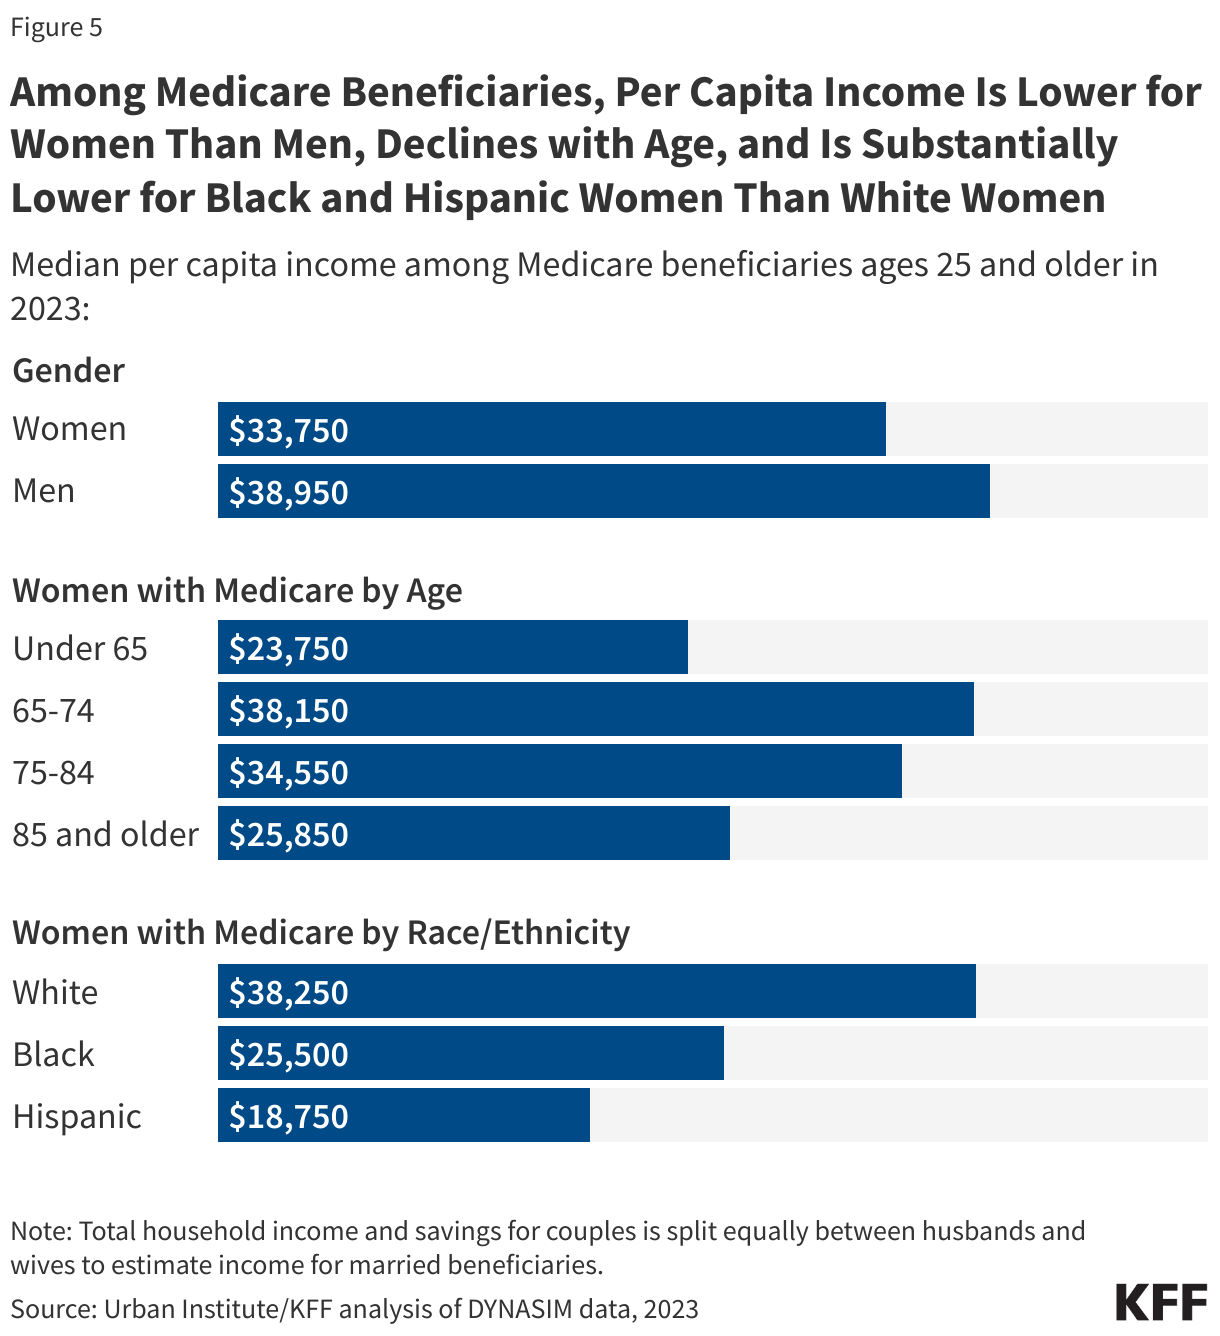
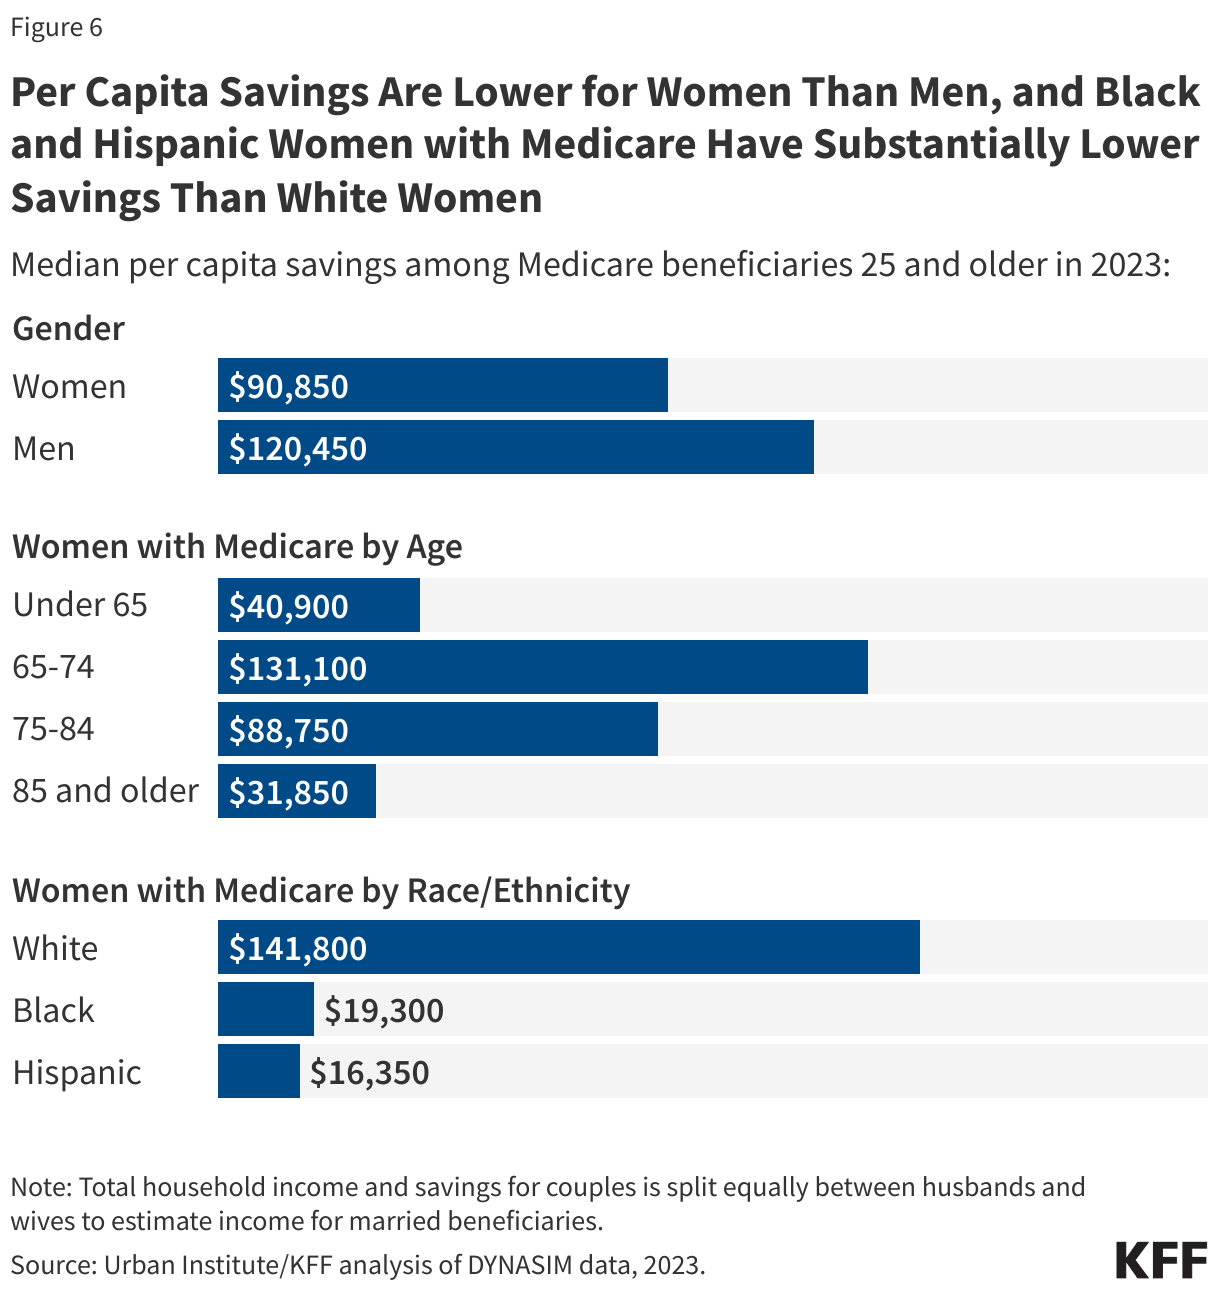
Income. A much larger share of reproductive-age women enrolled in Medicare have low incomes compared to women 65 and older. For example, nearly three-quarters (73%) of women ages 20-49 have incomes of less than $20,000 per year compared to 28% of women ages 65 and older.

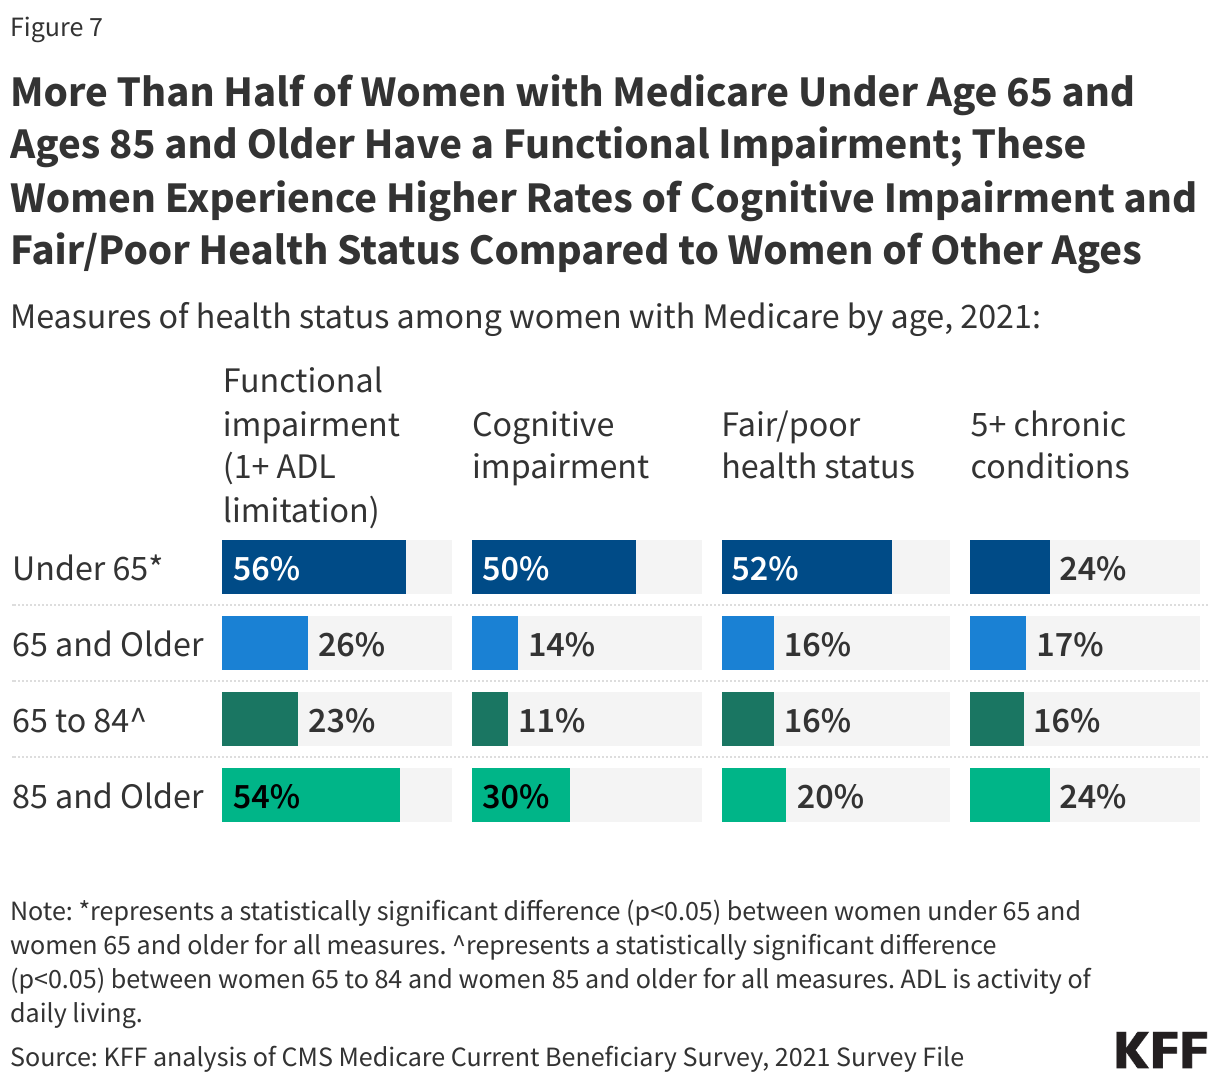
Health Status. Because eligibility for Medicare for those under age 65 generally depends on having a long-term disability, a larger share of reproductive-age women has significant health problems or functional limitations compared to women with Medicare ages 65 and older. Slightly less than half of women of reproductive age (44%) rate their health status as fair or poor compared to 16% of older women, 44% have a limitation in activities of daily living compared to 26% of older women, and 57% have a cognitive impairment compared to 14% of older women.

Sources of Coverage. Among the nearly 1 million women of reproductive age enrolled in Medicare Part A and Part B in 2021, close to 6 in 10 (57%) were covered under traditional Medicare and 43% were enrolled in Medicare Advantage plans (Figure 2). A somewhat smaller share of women 65 and older with Medicare are enrolled in traditional Medicare and a somewhat larger share in Medicare Advantage (52% and 48%, respectively).

Compared to Women Age 65 or Older with Medicare, a Larger Share of Women of Reproductive Age with Medicare Have Both Medicare and Medicaid, but Similar Shares of Both Groups Are in Medicare Advantage

Nearly 8 in 10 (79%) women of reproductive age with Medicare are also covered by Medicaid, the federal-state health program for people with low incomes, whereas a relatively small share of women 65 and older with Medicare also have Medicaid (16%). This reflects the fact that most women of reproductive age in Medicare have low incomes. Among women of reproductive age with both Medicare and Medicaid (known as dual-eligible individuals), in 2021, 60% were in traditional Medicare and 40% in Medicare Advantage, whereas among those age 65 and older, the pattern was reversed (37% in traditional Medicare vs. 63% in Medicare Advantage) (data not shown).

Most women of reproductive age who are dual-eligible individuals qualify for full Medicaid benefits, which gives them enhanced coverage of sexual and reproductive health services relative to having Medicare alone, as described in more detail below (see How Does Coverage of Sexual and Reproductive Health Services Compare Between Medicare and Medicaid?).

Sexual and Reproductive Health Services Covered by Medicare

Medicare covers many sexual and reproductive health services for women, including preventive care and screenings, maternity care, and contraceptive coverage. Medicare Advantage plans, the private alternative to traditional Medicare that provided coverage to 43% of reproductive-age women with Medicare in 2021, are required to cover all benefits covered under traditional Medicare. Most Medicare Advantage plans also cover Part D outpatient prescription drugs, whereas for people with traditional Medicare, prescription drugs are generally covered under stand-alone Part D prescription drug plans (PDPs).

Preventive Care

Evidence-based preventive services can improve health by preventing the onset of certain conditions or by identifying health conditions earlier when they can be managed more effectively. While Medicare has long provided coverage of many preventive services, the Affordable Care Act requires that Medicare cover many of these services without cost sharing if the Secretary of the Department of Health and Human Services (HHS) determines that they are reasonable and necessary for the prevention or early detection of an illness or disability, and appropriate for individuals in traditional Medicare.

Wellness Visits

Medicare Part B covers, without cost sharing, one “Welcome to Medicare” preventive visit within the first 12 months of being enrolled in Medicare, which includes a review of the beneficiaries’ medical and social history related to their health. After their first 12 months in Medicare, beneficiaries are eligible for a free yearly “Wellness” visit to develop or update a personalized plan to help prevent disease or disability, based on current health and risk factors.

Breast Cancer Screenings and Preventive Medications

The U.S. Preventive Services Task Force (USPSTF) recommends routine screening mammograms every two years for women ages 50 to 74 to detect breast cancer, depending on risk factors. Medicare covers one baseline mammogram to screen for breast cancer or women between ages 35 to 39, as well as screening mammograms once every 12 months for women ages 40 and older without cost sharing under Part B. Diagnostic mammograms may be covered more than once a year, if medically necessary, but typically with cost sharing. For diagnostic mammograms, after the Part B deductible is met, 20% coinsurance applies.

Preventive medications such as tamoxifen and raloxifene can reduce the risk of breast cancer for those who are at high risk. These medications are covered under Part D (both stand-alone drug plans for those in traditional Medicare and Medicare Advantage drug plans), with cost-sharing amounts varying by drug and by plan.

Cervical and Vaginal Cancer Screening

The USPSTF recommends routine cervical cancer screenings for women ages 21 to 65. The recommended frequency ranges from every three years to every five years depending on the person’s age and the type of screening test. Medicare covers pelvic exams and Pap tests to check for cervical and vaginal cancers, once every 24 months, including for women over 65. For women at high risk for cervical or vaginal cancer, or for women of child-bearing age who had an abnormal Pap test in the past 36 months, Medicare covers these screening tests once every 12 months. Medicare also covers Human Papillomavirus (HPV) tests (as part of a Pap test) once every 5 years for women ages 30 to 65 without HPV symptoms. These tests and exams for cervical and vaginal cancers are covered under Part B without cost sharing.

HIV and Other Sexually Transmitted Infections and Preventive HIV Medications

Routine screenings for HIV and other sexually transmitted infections (STIs) such as chlamydia and herpes are important for early detection, treatment, and preventing transmission. Screenings for HIV and other sexually transmitted infections and counseling services are covered with no cost sharing under Medicare Part B.

Medicare covers HIV screening once per year for people who meet one of the following conditions:

  • Ages 15 to 65.
  • Younger than age 15 or older than age 65 and at an increased risk for HIV.
  • Pregnant people can get screened up to 3 times during their pregnancy.

Medicare also covers sexually transmitted infection screenings for chlamydia, gonorrhea, syphilis, and Hepatitis B for pregnant people at certain times during their pregnancy and for people at increased risk for a sexually transmitted infection, once every 12 months. Medicare also covers up to 2 face-to-face, high-intensity behavioral counseling sessions for sexually active adults at increased risk for these infections.

For individuals who are at higher risk for HIV, use of pre-exposure prophylaxis medication, or PrEP, is a highly effective option to prevent infection. Medicare has proposed a national coverage determination that would make PrEP a Part B preventive service, which would make it available at no cost for beneficiaries who qualify. Medicare also proposed to cover up to seven counseling visits per year, HIV screenings up to seven times per year, and a screening for hepatitis B. Currently, antiretrovirals (ARVs) used for PrEP are covered under both Medicare Part D for oral medications and Part B for injectable physician-administered medications. The NCD would streamline coverage of these services under Part B.

Contraception

Coverage of Contraception Under Part B

Most sexually active females ages 18 to 49 use some form of contraception. While most use contraception to prevent pregnancy, some use it to manage a medical condition or in the case of condoms, to prevent the transmission of STIs. With limited exceptions, Medicare Part B generally does not cover contraception for the sole purpose of preventing pregnancy (unlike coverage under Part D; see below for details).

Under Medicare Part B, IUDs may be covered but coverage is limited to some menstrual illnesses, including to treat endometrial hyperplasia. When IUDs are covered under Part B, Medicare would cover the device and costs for insertion and removal by a physician, but cost sharing would still apply.

Female sterilization (e.g., tubal ligation) is a permanent contraceptive method used to prevent pregnancy. Sterilization is not covered by Medicare as an elective procedure, nor if a physician believes that a future pregnancy would endanger the overall health of the woman. When covered, whether the service falls under Part A or Part B depends on whether the procedure was performed on an inpatient or outpatient basis and would be subject to cost sharing.

Coverage of Contraception Under Part D

Since the Medicare Part D prescription drug benefit took effect in 2006, contraceptive products have been covered by stand-alone Part D prescription drug plans and Medicare Advantage prescription drug plans, but not all types of contraception have been covered by all Part D plans. Until recently, not all forms of contraception were listed on the Part D formulary reference file, which is a list of drugs that may be (though are not all required to be) included on Part D formularies. The Biden Administration has recently taken steps to update the formulary review process in Part D for coverage of contraception, based on widely-accepted clinical guidelines, which could increase access to more types of contraception. While the formulary reference file is not a Part D coverage list, plan formularies must include different types of contraceptives that meet widely accepted clinical treatment guidelines and evidence. As of 2024, the Part D formulary reference file includes IUDs and implants, in addition to contraceptive pills, patches, rings, and injections that were already listed on the formulary reference file.

Coverage and cost sharing for specific contraceptives vary across Medicare Part D plans. In general, Part D coverage of IUDs and contraceptive implants is not widespread in 2024, though most Part D enrollees are in plans that cover contraceptive pills, rings, patches, and injections (Figure 3).

Most Part D Enrollees are in Plans that Cover Contraceptive Pills, Rings, Patches, and Injections in 2024, But Not IUDs or Implants

When IUDs, implants, patches, rings, and injections are covered, they are typically placed on higher formulary tiers than oral contraceptives – most often on Tier 4 in the Part D plan’s formulary, which usually corresponds to the non-preferred drug tier and requires higher levels of cost sharing than other tiers (Figure 4). In contrast, for a select group of widely used oral contraceptives, around 4 in 10 Part D enrollees are in plans with coverage on Tier 1 or Tier 2, which typically correspond to generic drug tiers that require relatively low cost sharing.

IUDs, Implants, Patches, Rings, and Injections, When Covered by Medicare Part D Plans, Are Usually Covered on a Non-Preferred Tier With Higher Cost Sharing

The following examples illustrate the variation in potential cost sharing for selected contraceptive products faced by Medicare Part D enrollees who do not receive Part D low-income subsidies (LIS), which helps cover premiums and cost sharing for low-income enrollees:

  • For the less than 1% of Part D enrollees with coverage of the Mirena IUD in 2024, over 90% are in plans where the drug is covered on Tier 4, which would translate to a copayment of $100 for most of these enrollees. (These costs do not include cost sharing for the physician visit required for insertion of the device). The Mirena IUD typically lasts for 8 years.
  • For the 67% of enrollees who have coverage of the Xulane patch, nearly 90% are in plans where the drug is covered on Tier 4. Around half of these enrollees would face Tier 4 copayments of $100 for a month’s supply, while the others would face coinsurance of 50% for Tier 4 drugs, which translates to around $45 to $50 for Xulane depending on the retail price.
  • For a selected group of contraceptive pills, which are covered nearly all Part D enrollees, around 4 in 10 enrollees are in plans where these drugs are covered on Tier 2, and most of these enrollees would face Tier 2 cost sharing of $10 for a month’s supply. However, if the retail cost of the drug is less than the copayment, enrollees would pay the lower cost. For example, the retail cost of Junel FE 1/20 is between $5 and $6 per one-month supply, so an enrollee would pay that lower amount rather than a $10 copayment.

As noted, these examples of cost sharing do not apply to Medicare Part D enrollees who receive Part D Low-Income Subsidies (LIS), which offers financial assistance with Part D plan premiums and cost sharing for beneficiaries with low incomes and assets. LIS enrollees face only modest copayments for prescriptions covered under Part D regardless of tier placement. Of note, dual-eligible individuals – a majority of all women of reproductive age with Medicare – automatically receive LIS. These subsidies are a valuable benefit to those who qualify. In 2024, Part D enrollees receiving LIS pay no more than $4.50 for generic and $11.20 for brand-name covered contraceptive products, regardless of which formulary tier the drugs are placed on by their plans, while non-LIS enrollees would face higher cost sharing depending on the specific product and tier placement, as explained above.

It is not yet clear whether or how coverage will be provided for the insertion and/or removal of IUDs, implants, and other forms of longer-acting contraception when the device itself is covered under Part D for birth control.

Abortion

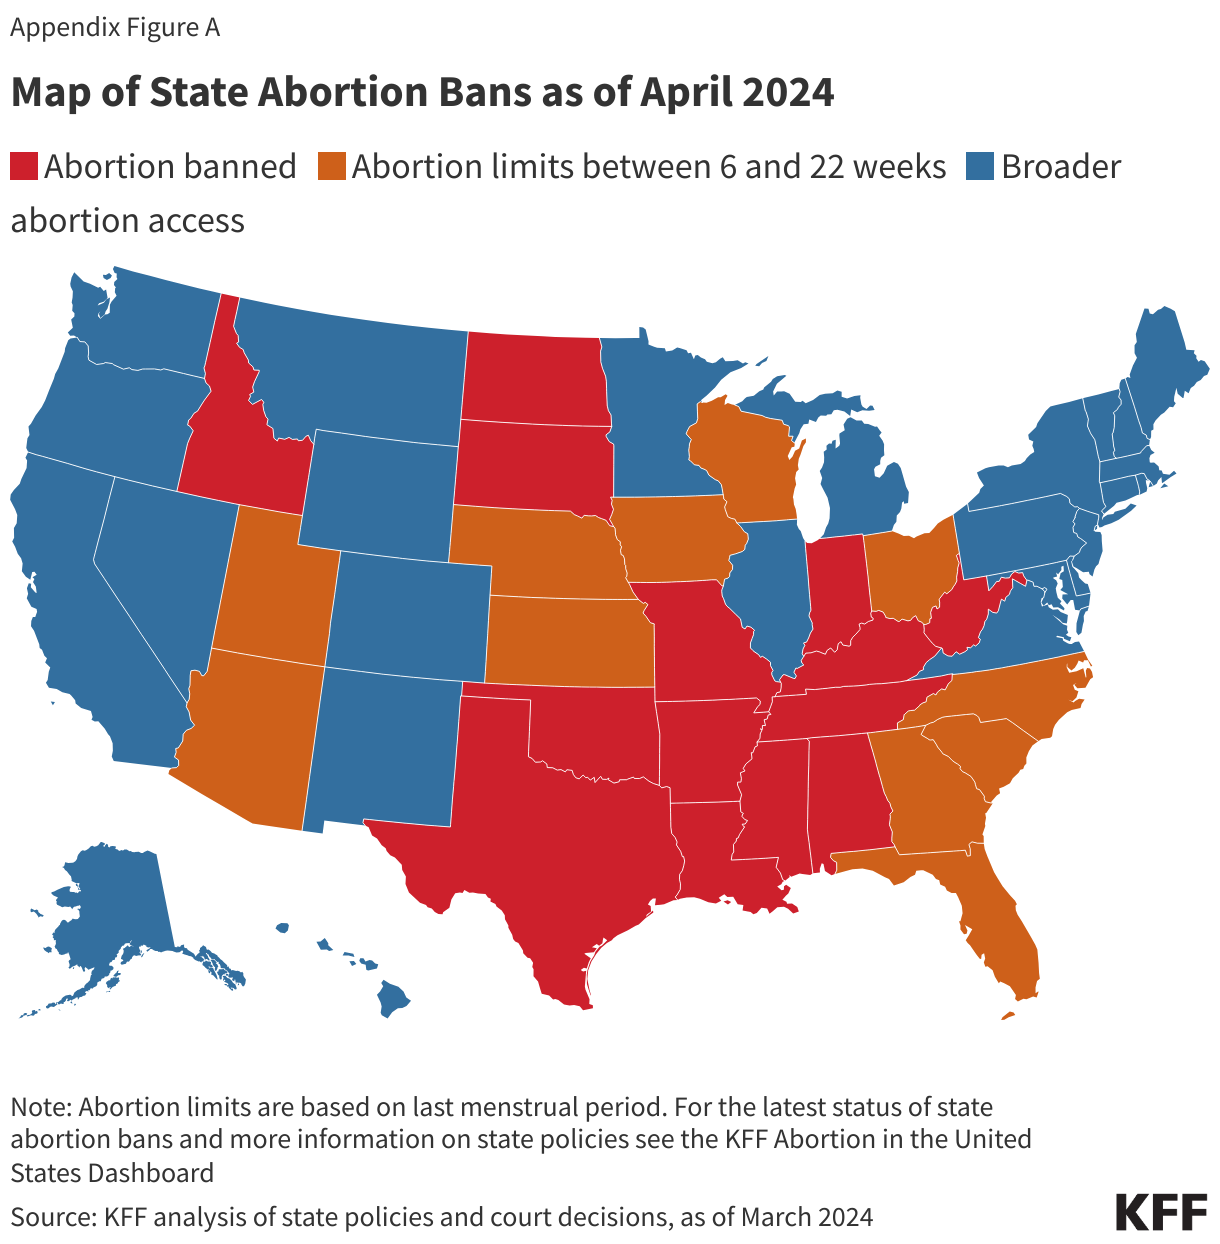
For nearly 50 years, since 1976, the Hyde Amendment has blocked federal funds from being used to cover abortions under all federal programs including Medicare except: 1) if the pregnancy is the result of rape or incest or (2) in the case where a woman suffers from a physical injury, including a life-endangering physical condition arising from the pregnancy itself, that could cause her death unless an abortion is performed. When covered, whether the service falls under Medicare Part A or Part B depends on whether the procedure was performed as inpatient (Part A) or outpatient (Part B).

In June 2022, the Supreme Court overturned Roe v. Wade, allowing states to prohibit or severely restrict abortion. In states where abortion is now banned, individuals covered by Medicare wanting or needing an abortion have few options: they can travel out of state or seek medication abortion pills via telehealth or from an online platform if it is still early in the pregnancy. In states that prohibit abortion, even exceptions for life endangerment of the pregnant person can be legally unclear. Doctors in these states may be hesitant to perform an abortion even for life endangerment due to concerns about legal risk.

Fertility Services

Treatments for infertility include fertility medications, artificial insemination, surgery, and in-vitro fertilization. According to the Medicare Benefit Policy Manual, “reasonable and necessary services associated with treatment for infertility are covered under Medicare [Part B].” However, specific covered services are not listed, and the definition of “reasonable and necessary” in this specific context is not defined. The 2003 law that established the Medicare Part D prescription drug benefit explicitly prohibits Part D plans from covering fertility drugs, along with some other types of drugs, including those prescribed to treat sexual or erectile dysfunction.

A wide range of services are recommended to support the health of pregnant and postpartum individuals. Medicare covers “reasonable and necessary” services associated with pregnancy, including prenatal care, labor and delivery, and necessary postnatal care. Medicare Part A hospital insurance covers all pregnancy-related care when admitted to the hospital. Medicare Part B covers doctors’ visits and other outpatient services and tests related to pregnancy. All these services are subject to Medicare cost-sharing requirements.

Gender-Affirming Care

Gender-affirming care includes a spectrum of “social, psychological, behavioral or medical (including hormonal treatment or surgery) interventions designed to support and affirm an individual’s gender identity.”

While federal Medicare policy does not cover gender reassignment surgery for beneficiaries with gender dysphoria, local Medicare Administrative Contractors (MACs) may determine coverage of gender reassignment surgery on a case-by-case basis. Coverage may also include hormonal therapies such as estrogens and anti-androgens for male to female transitions and androgens and progestins for female to male transitions; such therapies would be covered under Part D, subject to each plan’s formulary coverage and cost-sharing requirements.

How Does Coverage of Sexual and Reproductive Health Services Compare Between Medicare and Medicaid?

About 8 in 10 reproductive-age women (79%) with Medicare also have Medicaid coverage to help with the out-of-pocket costs of Medicare. Most of these women qualify for full Medicaid benefits, which gives them broader coverage of sexual and reproductive health services relative to having Medicare alone, as described below. In addition, most dual-eligible individuals receive assistance with their Medicare Part A and Part B cost sharing, meaning they do not pay out-of-pocket for Medicare services that require cost sharing, whether they receive their Medicare coverage through traditional Medicare or a Medicare Advantage plan. As noted earlier, dual-eligible individuals also receive Medicare Part D Low-Income Subsidies, which offer financial assistance with Part D plan premiums and cost sharing.

Federal Medicaid rules allow states some flexibility to design their own benefit packages beyond meeting mandatory federal requirements, which include coverage for physician, family planning, and pregnancy-related services. Furthermore, individuals who qualify for Medicaid under the Affordable Care Act (ACA) Medicaid expansion option (now offered by 40 states and DC) requires coverage of “essential health benefits” including several specific services for women (for a discussion of Medicaid and women, see Medicaid Coverage for Women). While this coverage requirement typically only applies to ACA Medicaid expansion populations (generally, single individuals or married couples without children), most states have aligned the benefits to also include those who qualify for Medicaid under other coverage pathways.

In terms of coverage of sexual and reproductive health services, traditional Medicaid programs must cover family planning services broadly and states are permitted to define those services within that broad category, but cost sharing is prohibited for family planning services, including contraception. All state expansion programs must cover FDA-approved, -granted or -cleared contraceptives with a prescription, including long-acting contraception such as IUDs, implants, and sterilizations without cost sharing.

As under Medicare, the Hyde Amendment also limits Medicaid coverage of abortions to cases of rape, incest, or life endangerment of the pregnant person. However, 17 states use their own funds to pay for abortions for Medicaid enrollees in other (non-Hyde) circumstances.

Medicaid also covers pregnancy-related services, but unlike Medicare, federal law prohibits cost sharing for these services. Medicaid pays for over 4 in 10 births in the U.S. Beyond inpatient and outpatient hospital care, which must be covered, states can define the specific maternity services covered by Medicaid. Nearly all states provide comprehensive pregnancy-related benefits, including prenatal vitamins, ultrasounds, and postpartum visits. Breast pumps and lactation counseling are required benefits for individuals who qualify for the Medicaid expansion under the ACA, and most people who qualify for Medicaid through other eligibility pathways typically receive this benefit without cost sharing, which is not the case in the Medicare program.

While most reproductive-age women with Medicare are also enrolled in Medicaid, which should protect them from cost sharing relative to those who have Medicare alone, navigating coverage under these two different health care programs can be challenging, with varying levels of coordination across states and payors. Recognizing these challenges, federal and state governments are engaged in efforts to improve coordination of benefits between Medicare and Medicaid, but few dual-eligible individuals are enrolled in fully integrated plans and there are reports of difficulties in accessing coverage for contraceptives among dual-eligible individuals. A recent study of contraceptive use among women with disabilities found that those with Medicare alone had the lowest use of contraceptive care and while utilization was higher among dual-eligible individuals, utilization was highest among those with Medicaid alone.

How Does Coverage of Sexual and Reproductive Health Services Compare Between Medicare and Private Insurance?

Under a requirement of the ACA, individual and fully-insured small group health insurance plans must cover ten categories of “essential health benefits” such as prescription drug coverage, doctors’ services, maternity care, and hospital care. In addition, nearly all health insurance plans (including self-funded plans and large group plans) must also cover, without cost sharing, certain recommended preventive health services.

Like Medicare, private plans are required to cover certain preventive services for women such as annual check-ups and routine cancer screenings like mammograms and Pap tests without cost sharing. Coverage for maternity care is required to be covered in the individual and fully-insured small group markets as an essential health benefit but may be subject to cost sharing. The Pregnancy Discrimination Act effectively requires the health plans of employers with a minimum of 15 workers to cover pregnancy-related services, including maternity care. Nearly all private plans must also cover, without cost sharing, prenatal care visits (considered to be a type of well-women care) and preventive screenings recommended by the U.S. Preventive Services Task Force for pregnancy-related care and by the Health Resources and Services Administration (HRSA). In addition, plans must also cover without cost sharing pre-pregnancy, postpartum, and interpregnancy visits (defined as well woman care), and breastfeeding support services and supplies.

The preventive services coverage requirements also mandate that most private plans cover risk-reducing medications, such as tamoxifen, raloxifene, or aromatase inhibitors, to women ages 35 years and older who are at increased risk for breast cancer and at low risk for adverse medication effects. These medications are required to be covered for high-risk women without cost sharing. Under Medicare, these drugs are typically covered under Part D plans, but cost sharing can apply. Similarly, private plans must cover PrEP for individuals at high risk of acquiring HIV. Insurers must also cover at no cost baseline and monitoring services including HIV testing, Hepatitis B and C testing, creatinine testing and calculated estimated creatine clearance or glomerular filtration rate, pregnancy testing, STI screening and counseling, adherence counseling, as well as office visits associated with these services.

As discussed earlier, Medicare offers coverage for contraception, but the scope of coverage is not as comprehensive as that which is required in most private plans (with the exception of the plans of employers with religious objections to contraception and grandfathered plans). Under the ACA, most plans are required to include coverage of the full range of FDA-approved, -granted, or -cleared contraceptives, as well as effective family planning practices, and sterilization procedures, and they must be covered without cost sharing. This also includes coverage of counseling and device insertion and removal, without cost sharing, which is not the case under Medicare Part B or Part D.

In contrast to Medicare, which is subject to federal laws, state regulated private health insurance plans (individual plans and the fully-insured group markets) are subject to state insurance laws, in addition to the federal requirements. Although federal law does not require private plans to cover abortion, 10 states require this coverage for their state-regulated plans. Likewise, some states also require coverage of other sexual and reproductive health services not required by federal law such as certain infertility services, over-the-counter contraceptive methods without a prescription, and one state explicitly requires coverage of specific gender-affirming care services in its state-regulated plans.

Women of Reproductive Age (Ages 20-49) with Medicare, 2022

10 Key Facts About Women with Medicare

Published: Apr 30, 2024

Medicare is the federal program that provides health coverage to over 66 million people ages 65 and older and younger people with long-term disabilities. More than half of all people with Medicare are women, including more than 31 million ages 65 and older and about 4 million under age 65 with long-term disabilities. Medicare plays a key role in supporting the health and well-being of women, covering a broad range of services essential to women’s health, including preventive, reproductive, primary, and specialty care, and prescription drugs.

This brief presents 10 key facts about women with Medicare, based on data from various sources (see methods for additional information). (A separate KFF brief, Coverage of Sexual and Reproductive Health Services in Medicare, describes Medicare coverage of services for women of reproductive age.) The language used here attempts to be as inclusive as possible, but the analysis draws on survey data that uses specific gender labels for female and male for the data year used for this analysis, not inclusive of gender non-binary, transgender and other gender expansive identities. In addition, due to sample size and data collection limitations, analysis is unavailable by race and ethnicity for Asian adults, American Indian and Alaska Native adults, and Native Hawaiian and Pacific Islander adults.

1. More Than Half of All People with Medicare Are Women, a Proportion That Rises with Age

In 2021, more than half (55%) of all Medicare beneficiaries were women and 45% were men (Figure 1). Of the more than 35 million women with Medicare, about 4 million are under age 65 with long-term disabilities (11%) and 4.3 million are ages 85 and older (12%). Since women live longer than men, on average (having 19.7 years of life expectancy at age 65 vs. 17 for men in 2021), women represent a larger share of older age cohorts. For example, nearly two-thirds (63%) of Medicare beneficiaries ages 85 and older are women.

More Than Half (55%) of All People with Medicare Are Women, a Proportion That Rises with Age

2. Among Women with Medicare, Beneficiaries Under Age 65 with Disabilities Are More Likely to be Black and Hispanic Than Women in Older Age Groups

Reflecting the demographics of older residents of the U.S., White people are the largest racial/ethnic group among people with Medicare, both men and women, while Black and Hispanic people together represent approximately 2 in 10 beneficiaries. Among women with Medicare, Black and Hispanic women represent larger shares of those under age 65 – who qualify for Medicare due to having a long-term disability – than of women ages 65 and older (Figure 2). People on Medicare who are under age 65 with disabilities report worse access to care, more cost concerns, and lower satisfaction.

Among Women with Medicare, Beneficiaries Under Age 65 with Disabilities Are More Likely to be Black and Hispanic Than Women in Older Age Groups

3. Women with Medicare Are More Likely to Live Alone or in a Facility Than Men; the Same is True for Women Ages 85 and Older Compared to Younger Women

Among Medicare beneficiaries, women are more likely than men to live alone, which may pose challenges as they grow older and are at greater likelihood of needing long-term care services and supports (LTSS). More than one-third of all women with Medicare (36%) live alone, rising to more than half (53%) of all women ages 85 and older (Figure 3). Women ages 85 and older are also considerably more likely than women ages 65 to 84 to live in facility (11% vs. 1%), including nursing homes, assisted living facilities, and other long-term care facilities. Medicare offers only time-limited coverage for skilled nursing facility services (up to 100 days) and does not typically cover long-term care services and supports needed by people who are unable to care for themselves in the community. (Medicaid is the primary payer of LTSS in the U.S., covering 20% of women with Medicare in 2021, as described below.)

Women with Medicare Are More Likely to Live Alone or in a Facility Than Men; the Same is True for Women Ages 85 and Older Compared to Younger Women

4. Women Are More Likely Than Men to Be Enrolled in Medicare Advantage, and Among Women, Medicare Advantage Enrollment Rates Are Higher for Dual-Eligible Individuals and Women Who Are Black or Hispanic

Medicare beneficiaries can choose to get their Medicare benefits through the traditional Medicare program or a private Medicare Advantage plan. Many Medicare beneficiaries also have some type of additional coverage, which can help with Medicare cost-sharing requirements and, in some instances, provides benefits not otherwise covered by Medicare. This includes Medicaid, the federal-state health insurance program for people with low-incomes and modest assets.

In 2021, 49% of women covered by Medicare were enrolled in Medicare Advantage plans, a significantly higher share than men (46%) (Figure 4). (The share of all eligible Medicare beneficiaries enrolled in Medicare Advantage has increased since then and now exceeds 50% of all eligible beneficiaries.) Larger shares of Black and Hispanic women with Medicare were enrolled in Medicare Advantage in 2021 than White women (68%, 63%, and 44%, respectively).

Women Are More Likely Than Men to Be Enrolled in Medicare Advantage, and Among Women, Medicare Advantage Enrollment Rates Are Higher for Dual-Eligible Individuals and Women Who Are Black or Hispanic

In 2021, 20% of women with Medicare were also enrolled in Medicaid. Women under 65 were enrolled in Medicaid at over three times the rate of women ages 65 and older (59% vs. 16%); Black (47%) and Hispanic (48%) women with Medicare were also significantly more likely to have Medicaid than White women (13%). Having supplemental Medicaid coverage gives women financial assistance in paying their Medicare deductibles and cost sharing, whether they receive their Medicare coverage through traditional Medicare or a Medicare Advantage plan. In addition, they qualify for coverage of long-term services and supports under Medicaid than can provide support for care in a facility or community-based at home supportive care to assist with a range of health and functional needs.

5. Per Capita Income Is Lower for Women with Medicare Than Men, Declines with Age, and Is Substantially Lower for Black and Hispanic Women Than White Women

Overall, women with Medicare have lower per capita incomes than men. This is largely due to the fact that average Social Security income and pension benefits are lower for women than men, primarily because women generally have lower-paying jobs than men during their working years and because many worked part-time or left the workforce for periods of time to raise families or care for aging family members. For example, the average annual Social Security benefit was substantially lower for women than men ages 65 and older in 2021 – $14,204 and $18,101, respectively.

KFF analysis shows that in 2023, half of all women with Medicare had per capita income of $33,750 or less, which is about $5,000 lower than median per capita income for men with Medicare ($38,950) (Figure 5). Among those ages 65 and older, median income declines with age, from $38,150 for women ages 65 to 74 to $25,850 for women 85 and older. Median income is also substantially lower for Black and Hispanic women compared to White women; half of all Black women with Medicare had per capita incomes of $25,500 or less, and half of all Hispanic women with Medicare had per capita incomes of $18,750 or less in 2023, compared to median per capita income of $38,250 for White women.

Among Medicare Beneficiaries, Per Capita Income Is Lower for Women Than Men, Declines with Age, and Is Substantially Lower for Black and Hispanic Women Than White Women

6. Per Capita Savings Are Lower for Women Than Men, and Black and Hispanic Women with Medicare Have Substantially Lower Savings Than White Women

As with income, savings are also much lower for women with Medicare compared to men, with half of all women having per capita savings of $90,850 or less compared to $120,450 for men (Figure 6). Among women with Medicare, both the youngest and the oldest age cohorts have substantially lower per capita savings than women ages 65 to 74 ($131,100, compared to $40,900 for those under age 65 and $31,850 for those ages 85 and older).

Median per capita savings are much lower for Black and Hispanic women than White women with Medicare. Half of all Black women have $19,300 or less in savings, which is 7 times lower than that of White women in 2023. Half of all Hispanic women have savings of $16,350 or less, which is nearly 9 times lower than that of White women. Differences in income and savings among Black and Hispanic women compared to White men and White women reflect the cumulative impact of differences in education, job opportunities, access to retirement benefits and inherited wealth. Women overall are also slightly more likely to have no savings or to be in debt compared to men (11% vs. 9%).

Per Capita Savings Are Lower for Women Than Men, and Black and Hispanic Women with Medicare Have Substantially Lower Savings Than White Women

7. More Than Half of Women with Medicare Under Age 65 and Ages 85 and Older Have a Functional Impairment; These Women Experience Higher Rates of Cognitive Impairment and Fair/Poor Health Status Compared to Women of Other Ages

Reflecting the fact that for people under age 65, eligibility for Medicare is based on having a long-term disability, women with Medicare under age 65 experience considerably higher rates of functional and cognitive impairment and poorer health status than their older counterparts on Medicare. Half of those under age 65 have a cognitive impairment, over three times the rate of women ages 65 and older (14%) (Figure 7). Women under age 65 are also more likely to have a functional impairment (56%) than women ages 65 and older (26%). Women under age 65 report fair or poor health (52%) at over three times the rate of women ages 65 and older (16%) and are more likely to have 5 or more chronic conditions (24%) compared to older women (17%).

Measures of overall health, cognitive, and functional status also reflect the poorer health status of women in the oldest age cohort relative to other older women. More than half of women ages 85 and older have a functional impairment (54%), nearly double the rate among women ages 65 to 84 (23%). Nearly one-third of women ages 85 and older have a cognitive impairment (30%) compared to 11% of women ages 65 to 84. Women ages 85 and older are also significantly more likely than women ages 65 to 84 to be in fair or poor health (20% vs. 16%) and have 5 or more chronic conditions (24% vs. 16%).

A significantly higher share of women than men have a functional impairment including limitations in activities of daily living (30% of women vs. 25% of men) and have five or more chronic health conditions (18% vs. 15%) (Appendix Table 1). Similar shares of women and men have a cognitive impairment (18% vs. 16%), and report being in fair or poor health (20% for both groups).

More Than Half of Women with Medicare Under Age 65 and Ages 85 and Older Have a Functional Impairment; These Women Experience Higher Rates of Cognitive Impairment and Fair/Poor Health Status Compared to Women of Other Ages

8. Black and Hispanic Women with Medicare Report Poorer Health Status and Have Higher Rates of Cognitive and Functional Impairments Than White Women

Black and Hispanic women with Medicare are significantly more likely than White women with Medicare to fare worse along certain measures of health status. For example, nearly four in ten (38%) Black and Hispanic women have a functional impairment compared to less than three in ten (27%) White women; 26% of Hispanic women and 21% of Black women have a cognitive compared to 16% of White women (Figure 8). Additionally, 36% of Hispanic women and 27% of Black women report being in fair or poor health compared to 18% of White women.

Black and Hispanic Women with Medicare Report Poorer Health Status and Have Higher Rates of Cognitive and Functional Impairments Than White Women

9. Among Women with Medicare, Heart Disease, Alzheimer’s/Dementia, and Incontinence Are More Common Among Those Ages 85 and Older; Depression, Lung Disease, and Diabetes Are More Common Among Those Under Age 65

Health conditions of women enrolled in Medicare differ by age cohort (Figure 9, Appendix Table 1). Women ages 85 and older are significantly more likely than women ages 65 to 84 to have heart disease (41% vs. 25%), Alzheimer’s/dementia (17% vs. 3%), and urinary incontinence (53% vs. 34%). Women under 65 are significantly more likely than women 65 and older to have depression (63% vs. 27%), diabetes (37% vs. 29%) and pulmonary disease (33% vs. 19%).

Women with Medicare overall experience higher rates of certain health conditions compared to men; for example, urinary incontinence (37% vs. 18%), depression (31% vs. 21%), osteoporosis (29% vs. 7%), and pulmonary disease (20% vs. 16%) (Appendix Table 1). Conversely, a larger share of men than women with Medicare had heart disease (35% vs. 26%) and diabetes (33% vs. 30%).

Among Women with Medicare, Rates of Heart Disease, Alzheimer’s/Dementia, and Incontinence Are Higher Among Those Ages 85 and Older, While Depression, Diabetes, and Lung Disease Are More Common Among Those Under Age 65

10. A Similar Share of Women and Men with Medicare Report Health Care Cost Problems; Among Women, They Are Most Commonly Reported by Those Who Are Low-Income, Under Age 65, or in Fair or Poor Health

Gaps in benefits, cost-sharing requirements, and premiums for Medicare and supplemental coverage can lead to cost-related challenges for some people with Medicare, including trouble getting care due to cost or money, delay in care due to cost, or problems paying medical bills. In 2021, a similar share of women and men with Medicare (12% vs 10%, respectively) reported that they faced at least one or more of these cost-related problems (Figure 10; data for men not shown). A higher share of women under age 65 (29%), Black (19%) and Hispanic (13%) women, women in fair or poor health (24%), and women with incomes below $20,000 (20%) reported experiencing more cost-related challenges than their counterparts.

A Similar Share of Women and Men with Medicare Report Health Care Cost Problems; Among Women, They Are Most Commonly Reported by Those Who Are Low-Income, Under Age 65, or in Fair or Poor Health

Methods

This analysis is based on data from the Centers for Medicare & Medicaid Services 2021 Medicare Current Beneficiary Survey (MCBS) (the most recent year available), a nationally representative survey of Medicare beneficiaries. Sources of coverage are determined based on the source of coverage held for the most months of Medicare enrollment in 2021. For more information, see methods in the following brief: A Snapshot of Sources of Coverage Among Medicare Beneficiaries.

The analysis on cost-related problems excludes beneficiaries in institutional settings since the analysis was based on questions asked of community residents only. “Cost-related problems” was defined based on positive responses to any of the following four questions:

  • Since (12 months prior), have you had any trouble getting health care that you wanted or needed because the cost was too high?
  • Since (12 months prior), have you had any trouble getting health care that you wanted or needed because you did not have enough money?
  • Since (12 months prior), have you delayed seeking medical care because you were worried about the cost?
  • Since (12 months prior) have you had problems paying or were unable to pay any medical bills?

Income and asset levels in 2023 are based on the Urban Institute’s Dynamic Simulation of Income Model (DYNASIM4). DYNASIM4 is a dynamic microsimulation model that projects the population and analyzes the long-term distributional consequences of retirement and aging issues. See Income and Assets for Medicare Beneficiaries in 2023 for more information on methods.

Measures of Health Status and Health Conditions Among Medicare Beneficiaires in 2021

Revisions to Federal Standards for Collecting and Reporting Data on Race and Ethnicity: What are They and Why do They Matter?

Published: Apr 30, 2024

Data are a cornerstone for efforts to advance health equity. How we ask for, analyze, and report information on race and ethnicity affects our ability to understand the racial and ethnic composition of our nation’s population and our ability to identify and address racial disparities in health and health care. The accuracy and precision of such data have important implications for identifying needs and directing resources and efforts to address those needs.

On March 29, 2024, the Office of Management and Budget (OMB) announced revisions to Standards for Maintaining, Collecting, and Presenting Federal Data on Race and Ethnicity, which apply to federal data collection and reporting. The revisions include using a single combined question for race and ethnicity, adding Middle Eastern or North African (MENA) as a minimum category, clarifying instructions for individuals to select multiple racial and ethnic categories that represent their identity, and requiring collection of more detail beyond the minimum categories. In addition, the Standards require that data tabulation procedures result in the production of as much information on race and/or ethnicity as possible, including data for people reporting multiple racial and/or ethnic categories.

The updated standards are effective for all new federal racial and ethnic data collection and reporting as of March 28, 2024, and existing racial and ethnic data must be updated as soon as possible but no later than March 28, 2029. OMB indicates that these revisions are intended to result in more accurate and useful race and ethnicity data across the federal government and are the first revisions that have been made since the last directive was issued in 1997. This brief provides an overview of these changes and their implications.

Why Were the Standards Revised?

Data and research show that a growing number of people do not identify with the previously used OMB race and ethnicity categories. These standards were last updated in 1997, with subsequent guidance provided by the Department of Health and Human Services (HHS) in 2011, which called for additional granularity in the collection and reporting of racial and ethnic data where possible for surveys conducted by HHS. The diversity of the U.S. population has grown significantly since the standards were last updated in 1997, as the share of people identifying as multiracial has increased and immigration patterns have evolved. Research suggests that under the previous standards, some people with Hispanic ethnicity and people from the Middle East and North Africa  selected other race because they did not identify with the available categories. Moreover, recent refinements to how the Census and other national surveys ask about race and ethnicity within the previous standards resulted in increased measures of population diversity, largely due to increases in the shares of people reported as some other race or multiracial, particularly among the Hispanic population.

Specifically, data from the American Community Survey show that between 2010 and 2022, the share of people identifying as some other race grew from 5% to 7%, while the share reporting two or more races increased from 3% to 13% (Figure 1). Among the Hispanic population, the share who identified as some other race grew from 28% to 35% between 2010 and 2022, and there was a ten-fold jump in the share reporting as multiracial, from 4% to 43%. During this period, the share of Hispanic people identifying as White plummeted from 64% to 17%. The Census Bureau indicates that many of these differences were largely due to changes in the design, data processing, and coding of the race and ethnicity questions over this period (including write-in responses), highlighting the powerful impact of these decisions. The process changes also make it challenging to identify how much of the observed change is due to actual demographic shifts.

Distribution of the Total Population and Hispanic Population by Race, 2010 to 2022

What was the Process for Updating these Standards?

In June 2022, OMB established a Federal Interagency Technical Working Group on Race and Ethnicity Standards to review the racial and ethnic data collection and reporting standards with a goal of updating them to better reflect the diversity of the nation. At that time, there were growing calls among federal, state, and local health agencies; health systems; health information technology experts, and commercial health insurance plans to revisit and revise the standards. The Working Group developed initial proposals and questions, which were published in a Federal Register notice in January 2023 to provide the opportunity for public input. In developing the new standards, the Working Group examined existing research and evidence, reviewed public comments submitted in response to the notice, and conducted listening sessions and town halls with stakeholders and members of the public. Based on this process, the Working Group outlined final recommendations to OMB, which informed OMB’s final decisions.

How Have the Standards Been Revised?

In March 2024, OMB announced revisions to the Standards for Maintaining, Collecting, and Presenting Federal Data on Race and Ethnicity that reflect the recommendations of the Working Group. Examples of how race and/or ethnicity data would be collected under these new standards are included in Appendix A. Key changes from the previous standards include:

  • Moving to a single combined race and ethnicity question. Under the previous standards, there were separate questions for individuals to identify race and Hispanic or Latino ethnicity. Research suggests that having separate questions for race and ethnicity confused some respondents who may not view the two concepts as distinct. Studies have found that many Hispanic or Latino individuals view their Hispanic or Latino identity as their race and do not identify with the race categories provided in a separate question. Many commenters expressed that moving to a single race and ethnicity question would help provide a more accurate count of the Hispanic or Latino population by reducing the number of blank responses or those classified as “some other race.” In the 2020 Census, four in ten (44%) individuals who selected Hispanic or Latino as their ethnicity did not report a race or were classified as some other race. Some commenters expressed concern that a combined race and ethnicity question may contribute to a loss of data for Afro-Latino individuals, as respondents may solely select Hispanic or Latino. However, Census Bureau research did not find that use of a single combined question led to a significant difference in estimates of the Afro-Latino population.
  • Adding MENA as a new minimum category. Prior to the 2024 update, the “White” racial category included people with European, Middle Eastern, or North African origins. However, there have been longstanding calls by the MENA community and the public to provide MENA as a separate category since most people of Middle Eastern or North African origin do not view themselves as White. Consistent with these perspectives, prior research shows a significant reduction in the share of people reporting some other race and White when a separate MENA category is offered compared to when there is no separate MENA category.
  • Requiring detailed collection of racial and ethnic categories as the default. Under the revisions, agencies are required to collect the detailed categories outlined in the standards by default. These detailed categories represent the largest population groups within the broader minimum racial and/or ethnic categories. An agency may request an exemption to the requirement to collect more detailed data if it determines that the potential benefit would not justify the additional burden to the agency and the public or the additional risk to privacy or confidentiality. Under the prior standards, detailed racial and ethnic data collection was encouraged but not required. Overall, the majority of commenters supported the collection of more detailed data beyond the minimum categories as a default, citing the diverse experiences of groups within the broader categories and the importance of having detailed data to measure differences in health care outcomes. Some commenters expressed concern regarding privacy risks, respondent burden, and the burden on agencies.
  • Modifying question instructions to encourage respondents to select all categories that reflect their identity. Specifically, question instructions must explicitly state that respondents should, “Select all that apply.” In cases in which detailed categories are collected with write-in responses, instructions must further encourage respondents to enter additional details, with instructions to, “Select all that apply and enter additional details in the spaces below.”

The revisions also make updates to terminology including removing use of “majority” and “minority” terminology (except when statistically accurate or when legal requirements call for use of those terms) and removing “Other” from the “Native Hawaiian and Other Pacific Islander” category title. They also make some revisions to definitions for the categories, including but not limited to removing “Negro” from the Black or African American definition, replacing “Far East” with “Central or East Asia” in the Asian definition, and removing the phrase “who maintains tribal affiliation or community attachment” from the American Indian or Alaksa Native definition.

Consistent with recommendations from the Working Group, OMB refrained from establishing requirements regarding a specific order for presenting racial and/or ethnic categories, continuing to leave this to agencies’ discretion. It notes that agencies generally order the categories alphabetically or by population size and that future research may help inform the best approach for ordering response options.

What are the Standards for Presenting Data on Race and/or Ethnicity?

OMB further specifies that agencies must use procedures that result in the production of as much information on race and/or ethnicity as possible, including for people reporting multiple categories, while still maintaining data quality and privacy. It encourages agencies to use one of three approaches for presenting data, including:

  • Alone or in combination. This approach groups all individuals belonging to a racial or ethnic group, whether alone or in combination with another racial or ethnic group. For example, an individual who reports their identity as both White and Black would be included in both the “White alone or in combination category” and the “Black alone or in combination” category.
  • Most frequent multiple responses. Under this approach, information is reported for as many race and ethnicity combinations as possible. In addition to the seven minimum race and/or ethnicity categories alone, the agency would report data for all combinations of racial and ethnic groups (e.g., American Indian or Alaska Native and Hispanic or Latino) that meet sufficient response thresholds or are of specific interest.
  • Combined Multiracial and/or Multiethnic category. This approach presents data for the seven minimum race and/or ethnicity categories and groups all other respondents who identify multiple race and/or ethnicity categories into a single Multiracial and/or Multiethnic category. Since this approach provides limited understanding of the diversity of the population, OMB indicates that agencies should use this approach in combination with one of the alternative approaches above to meet the overarching requirement to provide as much race and/or ethnicity information as possible, including for people who report more than one category.

Looking Ahead

The updated guidelines issued by OMB are effective for all new data collection that includes race and/or ethnicity questions as of March 28, 2024, and all existing data must be updated to the new standards “as soon as possible but, no later than March 28, 2029.” Each agency must develop an Action Plan on Race and Ethnicity Data within 18 months of the notice of the revised standards and make them publicly available upon submission to OMB.

Bridging challenges are expected as the implementation of these guidelines takes effect, with agencies expressing via public input the importance of “tools to support bridging” to compare race and ethnicity data collected under the 2024 guidelines and the 1997 guidelines. To address these concerns, the OMB Working Group has provided bridging guidelines for federal agencies. Some commenters have also expressed concern regarding the tabulation of different racial and/or ethnic categories including how to tabulate responses for individuals who select multiple race and ethnicity categories and whether Hispanic or Latino responses will be presented separately from other racial categories in civil rights reporting.

OMB has also identified areas of future research, which include, among others, how to encourage respondents to select multiple race and/or ethnicity categories by enhancing question design, how to collect high quality and useful data related to descent from people who were enslaved in the United States, the optimal order for presenting the minimum categories, and how to collect race and/or ethnicity data consistently across different languages. OMB also indicates it will establish an Interagency Committee on Race and Ethnicity Statistical Standards, that will undertake regular reviews of the standards on a ten-year cycle and provide an opportunity for public input. It also may conduct a review at any time outside of those regular review periods.

Appendix: Examples of Race and/or Ethnicity Questions Consistent with Revised OMB Standards

10368 - Appendix Figure 1

Source: Office of Management and Budget, Revisions to OMB’s Statistical Policy Directive No. 15: Standards for Maintaining, Collecting, and Presenting Federal Data on Race and Ethnicity

10368 - Appendix Figure 2

Source: Office of Management and Budget, Revisions to OMB’s Statistical Policy Directive No. 15: Standards for Maintaining, Collecting, and Presenting Federal Data on Race and Ethnicity

Five Facts About Older Adults’ Health Care Experiences by Race and Ethnicity

Authors: Liz Hamel, Ana Gonzalez-Barrera, Marley Presiado, Nancy Ochieng, Juliette Cubanski, and Tricia Neuman
Published: Apr 29, 2024

As the U.S population ages and becomes increasingly diverse, people of color are projected to comprise close to half the population of adults ages 65 and older by 2060. Consequently, the health-related experiences of older people of color will increasingly merit attention from policymakers and health care professionals to ensure that the health care system meets the needs of an aging and increasingly diverse population. KFF research has documented racial and ethnic disparities in health care that affect people of all ages, including access to care, use of services, outcomes, and experiences with unfair treatment while seeking health care. These differences are influenced by policies and practices rooted in racism and other forms of discrimination.

Medicare provides health insurance coverage to nearly all people ages 65 and older, helping to mitigate disparities in health care related to insurance coverage that impact people under age 65, but racial and ethnic disparities in health care persist along other dimensions among older adults. For example, among people on Medicare, who are predominantly ages 65 and older, Black and Hispanic adults are more likely than White adults to report relatively poor health, higher rates of chronic conditions such as hypertension, higher rates of hospital admissions, and greater likelihood of receiving care in the lowest-rated hospitals. Black and Hispanic older adults also have substantially lower incomes and savings than their White counterparts to draw on during retirement and higher poverty rates, reflecting fewer years of education, lower earnings in their working years, disparities in job opportunities, less access to pension and other retirement benefits, and far less inherited wealth.

This analysis highlights key findings about the health care experiences of people ages 65 and older based on KFF’s 2023 Survey on Racism, Discrimination, and Health. A previous report from the survey focused on the experiences of all adults more broadly, including those under age 65.

While older adults are generally less likely than younger adults to report being treated unfairly or with disrespect in health care settings, older Black adults report these experiences at higher rates compared to other older adults. Among adults ages 65 and older, about one in ten Black adults (11%) and one in twenty Hispanic and Asian adults (5% for both) say there was a time in the past three years when a health care provider or their staff treated them unfairly or with disrespect because of their race or ethnic background, compared to just 1% of older White adults. Taking into account unfair treatment based on other factors beyond race and ethnicity, about one in seven (15%) older Black adults report experiencing unfair or disrespectful treatment in the past 3 years compared to smaller shares of older White (7%), Hispanic (7%), and Asian (8%) adults.

Older Black Adults Report More Unfair Treatment in Health Care Settings Than Other Groups of Older Adults

Half of older Black adults, four in ten older Hispanic adults, and one-third of older Asian adults say they prepare for possible insults or feel they need to be very careful about their appearance to be treated fairly during health care visits. Vigilant behaviors, such as preparing for insults or considering one’s appearance, are sometimes adopted by people who experience discrimination as a means of protection from the threat of possible discrimination and to reduce exposure. Among adults ages 65 and over, about four in ten Black adults (43%) and one-third of Hispanic adults (36%) say they feel they must be very careful about their appearance at least some of the time in order to be treated fairly when they visit a doctor or health care provider, larger than the share of older White adults (21%) who say so.

Older Black adults are also more likely than older White adults to say they try to prepare for possible insults from health care providers or their staff at least some of the time (22% vs. 8%). Taken together, half of older Black adults, four in ten (39%) older Hispanic adults, and one-third (32%) of older Asian adults report adopting at least one of these vigilant behaviors at least some of the time during health care visits, as do one-quarter (25%) of older White adults.

Half of Black Adults Ages 65 and Older Say They Prepare for Insults or Feel They Have To Be Careful About Their Appearance During Health Care Visits

Older Hispanic and Asian adults are less likely than older White adults to feel comfortable asking providers questions and to say their provider usually explains things well and involves them in decision-making, which may reflect higher rates of limited English proficiency among these groups. While majorities of older adults across racial and ethnic groups report overall positive experiences with health care providers, older Hispanic and Asian adults are somewhat less likely than older White adults to say their providers explained things in a way they could understand (85%, 83%, and 93%, respectively) and involved them in decision-making about their care (75%, 66%, and 87%, respectively) during most or all of their health care visits in the past three years.

In addition, smaller shares of older Hispanic (69%) and Asian (65%) adults compared with older White adults (79%) say they have felt “very comfortable” asking providers questions about their health or treatment during visits in the past three years. These differences may reflect differences in English proficiency between these populations, as about one-third of older Hispanic (35%) and Asian (33%) adults have limited English proficiency, meaning they speak English less than very well.1  They may also reflect gaps in how health care providers tailor services to meet culturally and linguistically diverse populations.

Hispanic and Asian Older Adults Report Fewer Positive Health Care Experiences Than Their Black and White Peers

Majorities of older Black, Hispanic, and Asian adults say fewer than half of their recent health care visits were with providers who shared their racial and ethnic background. Reflecting limited racial and ethnic diversity of the health care workforce, and consistent with patterns seen among the general population, almost two-thirds of older Black adults (63%) and more than half of older Hispanic (56%) and Asian adults (54%) say that fewer than half of their health care visits in the past 3 years were with a doctor or health care provider that shared their racial and ethnic background. By contrast, three-quarters (74%) of White adults ages 65 and older say that half or more of their health care visits in the past 3 years were with a racially concordant health care provider.

Majorities of Older Black, Hispanic, and Asian Adults Say Fewer Than Half Their Health Care Visits Are With a Provider Who Shares Their Background

Older Black and Hispanic adults are more likely than older White adults to report problems paying for health care, reflecting that larger shares of them live in lower income households. Adults ages 65 and older are generally less likely than younger adults to report problems paying for health care, largely due to the fact that nearly all older adults have health insurance coverage through Medicare. Overall, about one in ten (9%) older adults say they or a family member had problems paying for health care in the past 12 months compared with almost three in ten (28%) adults under age 65. However, racial and ethnic disparities in health care affordability are evident among older adults. About one in six older Black adults (16%) and one in seven older Hispanic adults (14%) report problems paying for health care, higher than the share of older White adults (8%) who say so. About one in ten (11%) older Asian adults also report problems affording health care, a share that is not statistically different from White adults. These disparities at least partially reflect income differences between these populations. About half of older Black (50%), Hispanic (52%), and Asian adults (48%) report having household incomes under $40,000 compared with 29% of older White adults. By contrast, about a quarter of older Asian (25%) and White adults (24%) report incomes of at least $90,000, about twice the share among older Black (13%) and Hispanic adults (12%).

Older Black and Hispanic Adults Are More Likely Than Older White Adults To Report Problems Paying for Health Care
  1. The survey was conducted in English, Spanish, Chinese, Korean, and Vietnamese. Results likely underrepresent limited English proficiency among those who speak another language. ↩︎

Ballot Tracker: Outcome of Abortion-Related State Constitutional Amendment Measures in the 2024 Election

Last updated on November 6, 2024

Since the Supreme Court’s Dobbs  decision overturning Roe v. Wade, voters in 16 states have weighed in on constitutional amendments regarding abortion. In 2024, 10 states voted on abortion measures that sought to affirm that the state constitution protects the right to abortion. Nebraska voted on two measures: one seeking to protect abortion and the other seeking to ban abortion after the first trimester. Measures protecting abortion rights succeeded in 7 states – Arizona, Colorado, Maryland, Missouri, Montana, Nevada, and New York – and failed in 3 – Florida, Nebraska, and South Dakota. The measure constitutionally prohibiting abortions after the first trimester passed in Nebraska. Prior to the 2024 election, the side favoring access to abortion prevailed in every state that voted on abortion constitutional amendment ballot measures. In 4 of these states – California, Michigan, Ohio, and Vermont – measures amending the state constitution to protect the right to abortion were approved by voters and in the other 2 states – Kentucky and Kansas – measures seeking to curtail the right to abortion failed.  

There are two routes a measure may be placed on the ballot: citizen initiative and legislative referral. 

  • Legislatively-referred measures are introduced and approved by lawmakers before they appear on the ballot for citizens to vote on.
  • Citizen-initiated measures are written by citizen groups and are placed on the ballot if they receive enough signatures. 

The map below shows the outcome of the state abortion-related constitutional amendment measures.

For more background information on abortion related ballot initiatives, please see our brief Addressing Abortion Access through State Ballot Initiatives.

Abortion-Related State Constitutional Amendment Measures that Are Confirmed or Under Consideration for the 2024 Ballot, as of April 23, 2024
Abortion-Related State Constitutional Amendment Measures that Are Confirmed or Under Consideration as of April 23, 2024

Florida’s Recent Heat Protection Preemption Law Could Disproportionately Affect Hispanic and Noncitizen Immigrant Workers

Published: Apr 26, 2024

On April 11, 2024, Governor DeSantis signed House Bill 433 into law, set to go into effect on July 1, 2024. Among other actions, the legislation prevents city and county governments from requiring that employers, including government contractors, provide heat protections for outdoor workers outside of those required under state or federal law. These protections include requiring water breaks and other cooling measures for outdoor workers. The law also bans local governments from giving preference to employers based on their heat exposure policies. In response to the legislation, county commissioners in Miami-Dade withdrew their pending proposal to provide heat protections standards to outdoor workers in the county. Florida is the second state after Texas to enact a policy that prevents local ordinances from mandating certain heat protections, including water breaks. This analysis shows that the law could impact nearly 1.8 million1  nonelderly adult outdoor workers in Florida, who are disproportionately Hispanic and noncitizen immigrant workers. It is based on KFF analysis of 2022 American Community Survey data.

In Florida, Hispanic and noncitizen immigrant workers make up disproportionate shares of outdoor workers who will be impacted by the law. Hispanic workers make up 40% of the nonelderly adult outdoor workforce compared with 30% of the total nonelderly adult workforce, and noncitizen immigrants make up nearly twice the share of outdoor workers compared to their share of the workforce (22% vs. 12%) (Figure 1). Among outdoor workers, these groups make up particularly large shares of workers in transportation, outdoor cleaning, construction, and agriculture (Appendix Figure 1).

Four in Ten Outdoor Workers in Florida Are Hispanic and One in Five is a Noncitizen Immigrant

These policies have been enacted amid a recent spike in the frequency, duration, and intensity of climate change-related heat waves within the U.S. that have resulted in wildfires, air pollution events, and record-breaking hot days. Last year, Florida experienced its hottest year on record since 1895, with surface temperatures reaching 177 degrees Fahrenheit in some locations. Last year, some hospital systems in Florida experienced large increases in heat-related illness emergency visits. In April 2024, the U.S. Department of Labor (DOL) cited a contractor in South Florida for a lack of heat exposure protections after a migrant farmworker died from heat-related injuries in 2023. It is likely that more heat-related deaths may have occurred as heat-related injuries and deaths are suspected to be vastly undercounted and research shows that extreme heat is associated with a higher all-cause mortality.

Outdoor workers are exposed to high temperatures and are disproportionately likely to suffer from heat-related illnesses and deaths, which also have economic impacts. Research studies have found that agriculture, forestry, fishing, hunting, and construction workers experience the highest rates of heat-related mortality. Without any mitigation strategies, the threats associated with exposure to extreme heat are expected to increase due to climate change. A 2021 study reports that by 2050 extreme heat-related labor productivity losses could cost Florida up to $52 billion. Further, another report finds that without mitigation, extreme heat could put $8.4 billion in total annual earnings at risk by 2065 for Florida’s outdoor workers. Black and Hispanic people and noncitizen immigrants are likely to be the most affected due to their overrepresentation in many outdoor occupations. Beyond increased risks of climate-related health risks due to their jobs, people of color, immigrants, and other underserved groups also face increased climate-related health risks due to structural inequities, such as higher rates of poverty and uninsured rates as well as immigration-related fears.

As of April 2024, six states (CA, CO, MN, NV, OR, and WA) have occupational heat protection standards for outdoor workers and Maryland is in the process of developing its own heat stress standard. MN and OR also have heat protections for indoor workers, and CA is in the process of developing heat protection standards for indoor workers. Last year, the federal government took steps to protect workers from extreme heat, including issuing the first hazard alert on heat and ramping up the DOL’s enforcement of heat safety violation inspections. The National Institute for Occupational Safety and Health has occupational heat stress prevention recommendations, including teaching workers how to recognize the signs and symptoms of heat-related illness and changing working conditions to reduce exposure to and health risks associated with heat. Additionally, The Occupational Safety and Health Administration (OSHA) has a general duty clause that requires employers to provide their employees with a place of employment that “is free from recognized hazards that are causing or likely to cause death or serious harm to employees,” which includes heat-related hazards. However, there currently are no federal worker heat protection standards in place. OSHA is in the process of developing federal level indoor and outdoor worker heat protection standards, but there is no information on when they will be completed.

As the country moves into the summer months and scientists estimate a one in three chance that 2024 will be hotter than 2023, efforts to increase awareness and understanding of the dangers associated with exposure to extreme heat will be important for reducing negative extreme heat-related health impacts. Continued actions to mitigate climate-related health risks for workers will be important as the effects of climate change continue to grow.

Appendix

Shares of Outdoor Workers Who Are Hispanic and Noncitizen Immigrants by Occupation
Occupations Included in Outdoor Worker Classification
  1. KFF Analysis of 2022 American Community Survey 1-year Public Use Microdata Sample (PUMS) ↩︎
News Release

Donor Government Funding for Global Family Planning Declines to Lowest Level Since 2016

Published: Apr 24, 2024

A new KFF analysis finds donor government funding for family planning efforts in low- and middle-income countries totaled US$1.35 billion in 2022, a decline of 9% (US$129 million) compared to 2021 ($1.48 billion). This figure marks the lowest level of funding since 2016 ($1.31 billion). While some of the decline was because of decreases in actual funding by most donor governments, more than two-thirds can be attributed to exchange rate fluctuations due to the strengthening of the U.S. dollar against most currencies during 2022. Funding from the United States wasn’t affected by the currency fluctuations.

Funding from six donor governments (Australia, Canada, Denmark, Germany, Sweden, and the U.K.) decreased in 2022, though the size of the decreases was significantly smaller when accounting for exchange rate fluctuations. Some of these declines were linked to budgetary pressures associated with the humanitarian response to the conflict in Ukraine, as cited by some donors. While funding from the United States remained flat, funding from the Netherlands and Norway increased.

Without standardizing funding levels to the size of donor economies, the United States remained the largest donor to family planning funding, providing 43% ($582.9 million) of total funding from donor governments, followed by the Netherlands ($217.4 million, 16%), the United Kingdom. ($174.7 million, 13%), Sweden ($121.3 million, 9%) and Canada ($88.3 million, 7%). However, when family planning funding is standardized by GDP, the Netherlands ranked first, followed by Sweden and the United Kingdom; the United States ranked 7th.

Most family planning funding is provided bilaterally (US$1.3 billion or 96%). The remaining 4% ($50 million) is for multilateral contributions to the United Nations Population Fund’s core resources, adjusted for an estimated share for family planning.

The results of this analysis will be included in the annual progress report from FP2030, Measurement Report 2024.  

News Release

An Estimated 1 in 4 Medicare Beneficiaries With Obesity or Overweight Could Be Eligible for Medicare Coverage of Wegovy, an Anti-Obesity Drug, to Reduce Heart Risk

Published: Apr 24, 2024

In a new analysis, KFF finds that 3.6 million people with Medicare could be eligible for coverage of Wegovy (semaglutide) now that the Food and Drug Administration has approved the use of the anti-obesity drug to reduce the risk of heart attacks and stroke in certain patients.

This change potentially allows access to Wegovy for just over 1 in 4 of the 13.7 million people on Medicare diagnosed with obesity or overweight, based on data from 2020, the analysis shows.

Based on KFF research, about 7% of beneficiaries, or 3.6 million people, had established cardiovascular disease and obesity or overweight in 2020 and could be eligible for coverage of Wegovy to reduce the risk of serious heart problems. (Among this group, 1.9 million also had diabetes, making them already eligible for Medicare coverage of other GLP-1 drugs approved for diabetes.) 

Although Wegovy already had FDA approval as an anti-obesity medication, Medicare is prohibited by law from covering drugs when prescribed for obesity. The drug’s new approval by the FDA for use to reduce heart attacks and stroke paves the way for Medicare to cover it for those purposes.How this change affects Medicare spending will depend in part on how many Part D plans add coverage for Wegovy and the extent to which plans apply restrictions on use like prior authorization, how many eligible people use the drug, and negotiated prices paid by plans. Assuming just 10% of eligible beneficiaries use Wegovy in a given year, and assuming a 50% rebate on the list price, Medicare would incur nearly $3 billion in additional net Part D spending for one year for this one drug alone.KFF also finds that beneficiaries who take Wegovy could face monthly out-of-pocket costs of $325 to $430 if they have to pay a percentage of the drug’s $1,300 list price for a month’s supply. The new Part D cap on out-of-pocket spending would limit beneficiaries’ out-of-pocket cost to around $3,300 in 2024 and $2,000 in 2025—still significant sums for those who live on modest incomes. 

It is possible that Medicare could select semaglutide for drug price negotiation as early as 2025, based on its earliest FDA approval in late 2017, with a negotiated price available beginning in 2027. This could help to lower Medicare spending on Wegovy as well as Ozempic, the version approved for type 2 diabetes. (Both the Part D out-of-pocket spending cap and Medicare drug price negotiations were established under the Inflation Reduction Act of 2022.)

The full analysis, and other data and analyses about Medicare spending on prescription drugs, is available at kff.org.

What are the Implications of the Dobbs Ruling for Racial Disparities?

Published: Apr 24, 2024

Issue Brief

Note: Figures 12 and 13 were updated on April 26, 2024.

Introduction

The June 2022 Supreme Court ruling in the case Dobbs v. Jackson Women’s Health Organization has significant implications for racial disparities in health and health care. The decision overturned the longstanding Constitutional right to abortion and eliminated federal standards on abortion access that had been in place for nearly 50 years in all states across the country. As a result of Dobbs, large swaths of the country lack abortion access, with a disproportionate impact on those residing in the South and Midwest.

As of April 2024, 14 states have implemented abortion bans, 11 states have placed gestational limits on abortion between 6 and 22 weeks, and 25 states and the District of Columbia provide broader access to abortions after 22 weeks gestation. (This reflects Arizona being counted in the gestational limits category, as implementation of a recently upheld Civil War-era law banning nearly all abortions in the state is still pending amid ongoing court actions.)

Pregnant women seeking abortion that reside in states that prohibit or restrict abortions either have to travel out of state or try to obtain medication abortion pills via a telehealth appointment with an out-of-state clinician, but these options are not accessible to everyone. Some women may turn to self-managed abortions, but some will not be able to obtain an abortion and have to continue a pregnancy they do not want. Additionally, there have been reports of clinicians in states with bans and early gestational limits leaving their states due to the restrictions and criminalization for care that they provide, potentially exacerbating provider shortages in some areas.

With these state-level restrictions in place, people of color residing in those states may face disproportionately greater challenges accessing abortions due to longstanding underlying social and economic inequities, which could exacerbate existing disparities in maternal and infant health. This analysis examines the implications of state restrictions on abortion coverage for racial disparities in access to care and health outcomes. It is based on KFF analysis of data from the Centers for Disease Control and Prevention (CDC), American Community Survey (ACS), Behavioral Risk Factor Surveillance Survey (BRFSS), and Survey of Household Economics and Decisionmaking (SHED) (see Methods). Throughout this brief we refer to “women” but recognize that some individuals who have abortions do not identify as women, including transgender. Key takeaways include the following:

  • Black and American Indian and Alaska Native (AIAN) women ages 18-49 are more likely than other groups to live in states with abortion bans and restrictions. About six in ten Black (60%) and AIAN (59%) women ages 18-49 living in states with abortion bans or restrictions compared with just over half (53%) of White, less than half of Hispanic (45%), and about three in ten Asian (28%) and Native Hawaiian or Pacific Islander (NHPI) (29%) women ages 18-49.
  • Many groups of women of color have higher uninsured rates compared to their White counterparts, and, across racial and ethnic groups, uninsured rates are higher in states with abortion bans or restrictions than in those that provide broader abortion access. Among women ages 18-49, roughly a fifth of AIAN (22%) and Hispanic (21%) women are uninsured as are 14% of NHPI women and 11% of Black women compared with less than one in ten (7%) of White women. Moreover, uninsured rates for women ages 18-49 are at least twice as high in states that banned abortion compared to those in states with broader access for White (10% vs. 5%), Hispanic (33% vs. 15%), Black (14% vs. 7%), and Asian (10% vs. 5%) women, and nearly three times higher for NHPI women (29% vs. 10%).
  • Women of color have more limited financial resources and transportation options than White women, making it more difficult for them to travel out-of-state for an abortion. Some may also face linguistic barriers and have immigration-related fears that create additional challenges to accessing abortions.
  • The bans and restrictions on abortions may widen the already stark racial disparities in maternal health, especially since some states do not explicitly have exceptions that allow abortion services when pregnancy is jeopardizing a woman’s health. The restrictions may also contribute to growing provider shortages in some areas, as clinicians are responding to concerns about criminalization and prohibited from offering the full spectrum of pregnancy care. Moreover, abortion restrictions may have negative economic consequences on families and put pregnant people at increased risk for criminalization.

While there have been large inequities in abortion access for many years, the Dobbs ruling opened the door to widening those differences further. Black and AIAN women are more likely to live in states with abortion bans or restrictions. While data on the impact of Dobbs to date on health outcomes is limited to date, many indicators suggest that the ruling may exacerbate longstanding large disparities in maternal and infant health. The issue also has moved to the forefront of policy debates in the U.S. Sixteen percent of women voters, rising to 28% of Black women voters, say abortion is the “most important issue” to their vote in the 2024 presidential election.

How do Abortion Rates Vary by Race and Ethnicity?

Data on abortions by race and ethnicity are limited. The federal Abortion Surveillance System from the CDC has been providing annual national and state-level statistics on abortion for decades, based on data that is voluntarily reported by states, DC, and New York City. While most states participate, one notable exception is California, which has many protections for abortion access and is one of the most racially diverse states in the nation. Furthermore, availability of data by race and ethnicity varies among states. The most recent data in the Abortion Surveillance System, from 2021, only includes racial and ethnic data from 31 states and DC and is generally only available for White, Black, and Hispanic women. While we present the data from the Abortion Surveillance System in this brief, we recognize these limitations.

Prior to Dobbs, the abortion rate was higher among Black and Hispanic women compared to their White peers. As of 2021, the abortion rate was 28.6 per 1,000 women among Black women, compared to 12.3 per 1,000 among Hispanic women, and 6.4 per 1,000 among White women (Figure 1). Data for other racial and ethnic groups were not available. The vast majority of abortions across racial and ethnic groups are in the first trimester. Approximately eight in ten abortions among White (82%), Hispanic (82%), and Black women (80%) occur by nine weeks of pregnancy. While data on the number of abortions post-Dobbs has been released by both the #WeCount project from the Society for Family Planning and the Guttmacher Institute’s Monthly Abortion Provision Study, neither sets of data have reported demographic characteristics of abortion patients.

Abortion Rate (per 1,000 Women) by Race/Ethnicity, 2021

There are many reasons why abortion rates are higher among some women of color. As discussed below, Black, Hispanic, American Indian and Alaska Native (AIAN), and Native Hawaiian or Pacific Islander (NHPI) women have more limited access to health care, which affects their access to contraception and other sexual health services that are important for pregnancy planning. Data show that contraception use is higher among White women (69%) compared to Black (61%) and Hispanic (61%) women. Some women of color live in areas with more limited access to comprehensive contraceptive options. In addition, the health care system has a long history of racist practices targeting the sexual and reproductive health of people of color, including forced sterilization, medical experimentation, the systematic reduction of midwifery, just to name a few. Many women of color also report discrimination by providers, with reports of dismissive treatment, assumption of stereotypes, and inattention to conditions that take a disproportionate toll on women of color and certain conditions, such as uterine fibroids. These factors have contributed to medical mistrust, which some women cite as a reason that they may not access contraception. In addition, inequities across broader social and economic factors — such as income, housing, safety and education—that drive health, often referred to as social determinants of health, affect decisions related to family planning and reproductive health.

How Do State Abortion Policies Vary Across Racial and Ethnic Groups?

Overall, 16.3 million or 25% of women ages 18-49 in the US live in one of the 14 states where abortion is banned, and another 16.9 million, or 26%, live in one of the 11 states with gestational limits between 6 and 22 weeks LMP. The remaining 32.8 million, or roughly 50%, live in states that provide broader access to abortions.

White, Black, and American Indian and Alaska Native women account for larger shares of women ages 18-49 in states that have banned or limited abortion access compared to states that provide broader access to abortion. Most of the states that have banned or restricted abortion are in the South, where more than half of the Black population and roughly a third of the White (36%) and AIAN (31%) population reside. In contrast, Hispanic and Asian women make up larger shares of women ages 18-49 in states that provide broader access to abortion compared to states with abortion bans or limits. (See Appendix Table B for the racial and ethnic distribution of women ages 18-49 by state).

Racial and Ethnic Distribution of Women Ages 18-49 by State Abortion Policies, 2022

Six in ten of Black (60%) and AIAN (59%) women ages 18-49 live in states with abortion bans or restrictions (Figure 3). Just over half (53%) of White women ages 18-49 live in states with bans or restrictions, while less than half of Hispanic (45%) and about three in ten Asian (28%) and NHPI (29%) women ages 18-49 live in these states. Of note, in April 2024, the Arizona State Supreme Court upheld a Civil War era law banning nearly all abortions in the state. While that law is not currently in effect, if it were to go into effect in the future, the share of AIAN women living in a state with an abortion ban would rise from about three in ten (31%) to about four in ten (41%), and the share of Hispanic women living in a state with an abortion ban would increase from 24% to 28%.

State

How do potential barriers to accessing abortions vary by race and ethnicity?

Variation in abortion policies by state due to the Dobbs decision will likely result in women of color facing disproportionate access barriers since they face underlying disparities in health coverage and have more limited financial resources that may make it challenging to obtain an abortion out-of-state or via telehealth.

Health Coverage

Lack of health insurance limits women’s access to a broad range of health services, including contraception and pregnancy care, and leaves them at risk for significant out of pocket expenses for care. However, having coverage does not guarantee that it includes abortion benefits. In general coverage of abortion is more limited than for many other common health services. Some states prohibit coverage of abortion in state-regulated private insurance plans, and federal law bars the use of federal dollars for abortion, including in Medicaid, the national health coverage program for low-income individuals.

AIAN, Hispanic, NHPI, and Black women between ages 18-49 have higher uninsured rates compared to their White counterparts. Among women in this age group, roughly a fifth of AIAN (22%) and Hispanic (21%) women are uninsured as are 14% of NHPI women and 11% of Black women. In contrast, less than one in ten (7%) of White women lack insurance (Figure 4). These differences in uninsured rates are driven by lower rates of private coverage among these groups. Medicaid coverage helps to narrow these differences but does not fully offset them.

Health Coverage of Women Ages 18-49 by Race and Ethnicity, 2022

Across racial and ethnic groups, uninsured rates for women ages 18-49 in states that have banned or limited abortion are higher than rates in states where abortion is available beyond 22 weeks. Overall, 16% of women ages 18-49 in states that have banned abortion are uninsured compared to 12% in states that have gestational limits on abortions less than 22 weeks and 8% in states that have broader access to abortions. Uninsured rates for women ages 18-49 are at least twice as high in states that banned abortion compared to those in states with broader access for White (10% vs. 5%), Hispanic (33% vs. 15%), Black (14% vs. 7%), and Asian (10% vs. 5%) women, and nearly three times higher for NHPI women (29% vs. 10%) (Figure 5). However, even in states where abortion is not banned, many women do not have coverage, and uninsured rates remain higher for AIAN, Hispanic, and NHPI women compared to White women.

Uninsured Rates Among Women Ages 18-49 by Race and Ethnicity and State Abortion Policies, 2022

AIAN, Black, NHPI, and Hispanic women are more likely than their White counterparts to be covered by Medicaid, which provides limited coverage for abortions. For decades, the Hyde Amendment has prohibited the use of federal funds for coverage of abortion under Medicaid, except in cases of rape, incest, or life endangerment for the pregnant person. States can choose to use state funds to pay for abortions under Medicaid in other instances. However, among the 36 states that do not ban abortion, 17 use state funds to pay for abortions beyond the Hyde limitations for Medicaid enrollees. The other 19 states and DC continue to follow the Hyde limits, meaning women in these states covered by Medicaid likely must pay out of pocket for an abortion unless they meet the narrow circumstances of the Hyde Amendment.

Social and Economic Access Barriers

Women of color have more limited financial resources and transportation options than White women, making it more difficult for them to travel out-of-state for an abortion. The median self-pay cost of obtaining an abortion exceeded $500 in 2021, but costs can vary depending on the type of abortion, location, and if an individual has coverage. Traveling out of state raises the cost of abortion due to added costs for transportation, accommodation, and childcare. Moreover, it may result in more missed work, meaning greater loss of pay. Data suggest that women of color would have more difficulty than White women affording these increased costs and may face other barriers that could prevent them from traveling to obtain an abortion and instead turning to self-managed abortions or continuing the pregnancies.

Overall, AIAN (48%), Black (43%), NHPI (41%) and Hispanic (40%) women ages 18-49 are nearly twice as likely as their White counterparts (24%) to have low incomes (below 200% of the federal poverty level or $46,060 for a family of three as of 2022) (Figure 6). Moreover, across most racial and ethnic groups, women in states that have banned abortion are more likely to have low incomes than women in states that allow abortions beyond 22 weeks. For example, 48% of NHPI women in states that have banned abortion have low incomes compared to 38% of NHPI women in states where abortion is available after 22 weeks gestation. (See Appendix Table C for state-level data on the share of women who are low-income by race and ethnicity.)

Percent of Women Ages 18-49 with Income Below 200% Poverty by Race and Ethnicity and State Abortion Policies, 2022

Over half of Hispanic (57%) and Black women (58%) ages 18-49 could not cover an emergency expense of at least $500 using their current savings compared to 36% of White women in this age group (Figure 7). (Data for this measure were not available for other racial groups.) Women who have fewer resources for an emergency expense may be more likely to seek assistance from an abortion fund, which help cover the costs of abortions for people who cannot afford them. However, abortion funds are not able to keep up with the demand and support all those seeking assistance.

Percent of Women Ages 18-49 Who Could Not Handle $500 Emergency Expense Completely Using Savings, 2022

Black women ages 18-49 are more likely than their White counterparts to live in a household without access to a vehicle (12% vs. 4%), and Asian and AIAN women in this age group are more likely than White women to lack vehicle access (9% and 8%, respectively, vs. 4%) (Figure 8). Hispanic and NHPI women are also more likely than White women to lack vehicle access, although the difference is smaller (6% and 6%, respectively, vs 4%). Research shows that out-of-state travel for abortion care has risen significantly since Dobbs, but women without vehicle access may face greater challenges to traveling out of state.

Percent of Women Ages 18-49 Living in a Household Without Vehicle Access by Race and Ethnicity, 2022

Immigration-related fears make some women reluctant to travel out of state for an abortion. Among women ages 18-49, about one-third of Asian women (33%) and roughly a quarter of Hispanic (24%) and NHPI (22%) women are noncitizens, who include lawfully present and undocumented immigrants (Figure 9). Many citizen women may also live in mixed immigration status families, which may include noncitizen family members. Noncitizen women and those living in mixed immigration status families may fear that traveling out of state could put them or a family member at risk for negative impacts on their immigration status or detention or deportation, especially in states that have moved to criminalize abortions. For example, some states have enacted laws that make it illegal to “aid or abet” someone in obtaining an abortion while some are trying to make it illegal to take a minor across state lines to obtain an abortion.

Percent of Women Ages 18-49 Who are Noncitizens by Race and Ethnicity, 2022

Differences in language barriers and access to technology may also contribute to racial disparities in abortion access. Roughly a quarter of Hispanic (26%) and Asian (25%) women ages 18-49 speak English “less than very well,” as do one in ten NHPI women (10%) compared to just 1% of White women (Figure 10). This can affect their ability to find information about abortions and locate a clinic that offers abortion services. In a national KFF survey of women conducted just before the Dobbs ruling, nearly three in ten Hispanic women (29%) said if they needed an abortion, they did not know where to go or find the information, higher than other groups. Internet access is another important factor for finding information about abortion care and also for telehealth appointments, which comprise a growing share of abortion care. Among women ages 18-49, 8% of AIAN and 6% of NHPI (6%) women live in a household without internet access, compared to 2% of White women (Figure 10).

Percent of Women Ages 18-49 Who Speak English Less than Very Well by Race and Ethnicity, 2022

What are the Potential Implications of Abortion Restrictions on Racial Disparities in Health, Finances, and Criminal Penalties?

Stark racial disparities in maternal and infant health predate the Dobbs decision but may widen due to the new restrictions on abortions since abortion services can be a key factor in managing pregnancy complications and emergencies that can lead to poor outcomes. Data suggest that the abortion restrictions may also contribute to growing provider shortages in some areas, which may increase access challenges and have negative impacts on health. Moreover, abortion restrictions may have negative economic consequences on families and put people at increased risk for criminalization.

Maternal Health

Prior to the Dobbs ruling there were already significant racial disparities in pregnancy-related and infant mortality, which may widen due to abortion restrictions. NHPI, Black and AIAN people are more likely to die while pregnant or within a year of the end of pregnancy compared to White people (62.8, 39.9 and 32.0 per 100,000 births vs. 14.1 per 100,000 births) (Figure 11). Restrictions on access to abortions limit options to terminate pregnancies for medical reasons. While all state bans have some limited exceptions to preserve the life of pregnant women, the language of these exceptions is vague and narrow, and far fewer have health exceptions. This means that some people have been forced to remain pregnant even when the pregnancy is threatening their health, which could further widen disparities. One study estimated that a total abortion ban in the U.S. would increase the number of pregnancy-related deaths by 21% for all women and 33% among Black women.

Pregnancy-Related Mortality (per 100,000 births) by Race/Ethnicity, 2017-2019

There also are racial disparities in certain birth risks and adverse birth outcomes which may be exacerbated by the abortion restrictions. Specifically, as of 2022, higher shares of births to Hispanic, Black, AIAN and NHPI people were among those who received late or no prenatal care, or were preterm, or low birthweight, compared to White people (Figure 12). Timely prenatal care is particularly important for people with higher-risk pregnancies, yet research suggests that restrictive abortion policies may be causing people to start prenatal care later in pregnancy, which is already a concern for women of color who are more likely to experience delays in prenatal care initiation. Births among Asian people were also more likely to be low birthweight than those of White people. Moreover, while the birth rate among teens has been declining over time for all groups, the rate for Black, Hispanic, AIAN, and NHPI teens was over two times higher than the rate among White and Asian teens in 2021 (Figure 13). Research has also found that state-level abortion restrictions that were in place prior to Dobbs were associated with disproportionately higher rates of adverse birth outcomes, including preterm birth, for Black individuals, and that inequities widened as states became more restrictive.

Percent of Births with Selected Risk Factors by Race and Ethnicity, 2022
Birth Rate (per 1,000) for Teens Ages 15-19 by Race and Ethnicity, 2021

Abortion bans and restrictions limit care for people experiencing a pregnancy loss, which some groups of women of color are at higher risk of experiencing compared to their White counterparts. Pregnancy loss, which includes miscarriage and stillbirth, is common, occurring in up to an estimated 20% of all pregnancies. Data on racial and ethnic disparities in miscarriage is limited, but research shows that the rates of fetal mortality (fetal demise following 20 weeks of gestation) are higher among Black, AIAN, and NHPI women compared to White women (Figure 14). While some miscarriages, particularly earlier in pregnancy, pass without any medical intervention, some people seek medical care to complete a miscarriage and/or because their health may worsen with the continuation of an unviable pregnancy. Almost all medications and procedures used to manage miscarriages and stillbirths are identical to those used in abortions. As a result, clinicians may hesitate to provide care even when medically indicated because of concerns they could be conflated with providing an abortion and therefore risk criminalization or penalties as a result. Since the Dobbs ruling, there have been several high-profile cases of people experiencing pregnancy losses who could not obtain timely miscarriage care due to state abortion bans, jeopardizing their health as a result. In KFF’s national survey of OBGYNs after the Dobbs decision, more than half (55%) of OBGYNs practicing in states where abortion is banned said their ability to practice within the standard of care has worsened since Dobbs.

Fetal Mortality Rates by Race/Ethnicity,  2021

In states where abortion is banned or severely restricted, the number of women forced to continue a pregnancy is likely to rise, with data suggesting disproportionate increases among women of color. While it is relatively early to see the impact of the Dobbs ruling on births, initial research suggests that birth rates could increase as a result. One study to date has estimated that there have been approximately 32,000 “additional” births as a result of the ruling, primarily concentrated in states that have banned abortions and with a disproportionate effect among people of color. A study in Texas, which had implemented a ban on abortions after six weeks gestation starting September 2021 (prior to Dobbs), found a 2% rise in the state’s fertility rate after the law’s implementation, with the sharpest increase among Hispanic women (8%).

Provider Access and Shortages

The Dobbs decision may exacerbate health care workforce shortages, particularly among clinicians providing obstetric and gynecologic care. State-level abortion bans criminalize clinicians who provide abortion care, and this has cascading effects on other aspects of maternity care. Even prior to Dobbs, there were concerns about workforce shortages in maternity care. The estimates that more than 5 million women of reproductive age in the U.S. live in counties that have few or no obstetric providers, with the largest gaps in rural communities as well as areas with higher rates of poverty, and larger shares of Black women. Many of these areas are in states with abortion bans and gestational restrictions, and there are reports of clinicians leaving these states because they are prohibited from and criminalized for offering the full scope of services they trained for and that comport with medical standards. Abortion restrictions may also affect the pipeline of new clinicians. A few studies to date, have found declines in US medical school graduates applying to OBGYN residency positions in states with abortion bans. While all positions were filled and the changes to date have been relatively small, they could suggest that future clinicians may prefer not to practice in states that ban abortion, potentially widening existing gaps in workforce capacity.

Many OBGYNs say that the Dobbs decision has had a negative impact on racial and ethnic inequities and the broader field of maternity care. In a national KFF survey, seven in ten OBGYNs say that since the Dobbs decision, racial and ethnic inequities in maternal health (70%) as well as management of pregnancy-related medical emergencies (68%) have gotten worse. Over half think that the ability to attract new OBGYNs to the profession has worsened (55%) and 64% think the same about pregnancy-related mortality (Figure 15).

Share of OBGYNs Reporting Implications of Dobbs Decision on Maternal Health

Economic Circumstances

Denying women access to abortion services has negative economic consequences. Many women who are not able to obtain abortions will have children that they hadn’t planned for and face the associated costs of raising a child. In addition to the direct costs, lack of abortion access can affect women’s longer-term educational and career opportunities. Research from the Turnaway Study, which examined the impact of an unwanted pregnancy on women’s lives, found a range of negative economic effects of abortion denials, including higher poverty rates, financial debt, and poorer credit scores among women who were not able to obtain abortions compared to women who received abortions. The study also found negative socioeconomic impacts for the children born to women who were denied abortions, which may exacerbate existing racial disparities in income. Poverty rates are already much higher among children of color than White children, and research shows children in families with lower incomes experience negative long-term outcomes, including lower earnings and income, increased use of public assistance, greater likelihood of committing crimes, and more health problems.

Criminalization

People of color may be at increased risk for criminalization in the post-Roe environment. A long history of racism in judicial policy in this country has led to disproportionately higher rates of criminalization among people of color and is likely to grow as abortion care is criminalized. Prior to the Dobbs ruling, there were already cases of women criminalized for their own miscarriages, stillbirths, or infant death, due in part to the establishment of laws that protect and prioritize “fetal personhood.” The women charged were disproportionately women with lower incomes, Black women, and women living in southern states that have subsequently banned or greatly restricted abortion access. None of the state-level abortion bans specifically criminalize women for getting an abortion, but fetal personhood laws can conflate miscarriage and abortion. For example, in one high-profile case, Brittany Watts is an Ohio woman who faced criminal charges after she had a miscarriage at home in Fall 2023. While Ms. Watts sought medical care, other pregnant people experiencing a miscarriage or other complications may be deterred from seeking care, since treatment could be conflated with an abortion, putting their own health at risk as a result. Furthermore, many accusations of fetal harm are initiated by health care providers. State laws that penalize people who aid and abet abortion access and those that grant fetal personhood can perpetuate the culture of criminalizing pregnancy, particularly among communities of color.

Methods

This analysis uses data from multiple sources including the 2022 American Community Survey, the 2022 Behavioral Risk Factor Surveillance System, the 2022 Survey of Household Economics and Decisionmaking, as well as from several online reports and databases including the Centers for Disease Control and Prevention (CDC) Morbidity and Mortality Weekly Report (MMWR) on abortion surveillance, National Vital Statistics Reports, the 2017 CDC Natality Public Use File, and the CDC WONDER online database. Unless otherwise noted, race/ethnicity was categorized by non-Hispanic White (White), non-Hispanic Black (Black), Hispanic, non-Hispanic American Indian and Alaska Native (AIAN), non-Hispanic Asian (Asian), and non-Hispanic Native Hawaiian or Pacific Islander (NHPI).

In this analysis, states are grouped into three categories of abortion policies based on policies implemented as of April 2024 as follows:

  • Abortion Banned: Alabama, Arkansas, Idaho, Indiana, Louisiana, Kentucky, Missouri, Mississippi, North Dakota, Oklahoma, South Dakota, Texas, Tennessee, West Virginia
  • Abortion Limits Between 6 and 22 weeks gestation: Arizona, Florida, Georgia, Iowa, Kansas, Nebraska, North Carolina, Ohio, South Carolina, Utah, Wisconsin
  • Broader Access to Abortion: Alaska, California, Colorado, Connecticut, Delaware, District of Columbia, Hawaii, Illinois, Maine, Maryland, Massachusetts, Michigan, Montana, New Hampshire, New Jersey, New Mexico, New York, Minnesota, Oregon, Pennsylvania, Rhode Island, Vermont, Virginia, Washington, Wyoming

This analysis uses 2022 population data but categories for state abortion status are based on 2024 policy. In 2022, Wisconsin’s pre-Roe abortion ban was in effect and Indiana’s 22-week LMP ban was in effect.

Data on the share of women ages 18-49 who could not cover a $500 emergency expense using current savings is from the 2022 Survey of Household Economics and Decisionmaking and is defined as largest emergency expense individuals could handle right now using only savings.

Appendix

Map of State Abortion Bans as of April 2024
Racial/Ethnic Distribution of Women Ages 18-49 by State, 2022
Share of Women Ages 18 to 49 Who are Uninsured by Race/Ethnicity and State, 2022