Texas Judge Overturns Controversial Nursing Facility Staffing Rule

Published: Apr 11, 2025

On Monday, April 7, Judge Matthew Kacsmaryk in the US District Court for Northern Texas ruled to overturn key elements of a Biden administration rule that established the first-ever minimum staffing ratios for nursing facilities. The court’s opinion stated that the regulations ultimately overstepped CMS’ authority, noting “the agency lacks authority to eliminate consideration of a facility’s nursing ‘needs’ when prescribing minimum staffing standards”, and “any regulatory response must be consistent with Congress’s legislation governing nursing homes.”

The rule, finalized to address long-standing concerns about the effect of staffing shortages on the quality of care in nursing homes, has been mired in controversy since it was issued. The nursing home industry opposed the rule, suggesting it was too burdensome and costly, and could lead to nursing facility closures. Resident and family advocates and others supported the new staffing standards to address well-documented concerns about substandard facility conditions, unattended residents, and poor patient care. According to one estimate, the rule was projected to save 13,000 lives each year. In April 2022, the National Academies of Science, Engineering, and Medicine also recommended minimum staffing levels as part of its comprehensive report to improve nursing home quality.

The ruling overturned two requirements that were slated to phase in over time, but take effect no later than 2029 for all facilities:

  1. Facilities must have a registered nurse (RN) on duty 24 hours a day, 7 days a week (24/7 requirement);
  2. Facilities must have a minimum of 3.48 hours per resident day of total nursing care, including at least 0.55 hours of RN care and 2.45 hours of nurse aide care.

Before the rule had passed, the only federal requirements for nursing facility staffing were that, irrespective of facility size, there had to be one RN on staff for 8 consecutive hours a day and at least one RN or licensed practical nurse working for the remaining 16 hours. There were no requirements for nurse aides or minimum staffing ratios that would account for facility size. Updated data maintain that about 1 in 5 nursing facilities meet the now-overturned minimum staffing hour requirements, and the percentage of for-profit facilities (12%) that meet the requirements is lower than that of non-profit (47%) and government-owned facilities (41%).

For-Profit Nursing Facilities Were the Least Likely to Meet the Requirements in the Now-Overturned Rule

The court left several other requirements from the staffing rule intact, including the requirement for state Medicaid agencies to report the percentage of Medicaid payments for institutional long-term care that are spent on compensation for direct care workers and support staff.

The future of nursing home regulation is unclear, though President Trump’s first term may provide some insight. During President Trump’s first term, CMS proposed regulations that rolled back or relaxed many of the 2016 Obama-era regulations, categorizing them as “unnecessary, obsolete, or excessively burdensome.” Those rollbacks were not finalized under his first term, though the Administration may reissue them or issue similar ones. Another open question is the fate of regulations issued under the Biden Administration aimed at promoting transparency around nursing facility ownership.

Congress has been considering legislative proposals as part of a tax and spending package to overturn the nursing home staffing rule which could have included up to $22 billion in savings over the next 10 years. It is unclear how the CBO will score these proposals in light of the recent court ruling, and it could depend on future court decisions and actions by the administration. The House budget resolution includes up to $880 billion or more in federal Medicaid reductions. Such reductions in Medicaid spending could have implications for nursing facility residents, since Medicaid covers 63% of all nursing home costs nationwide, and could lead to reductions in Medicaid payment rates for nursing homes, making it harder for nursing facilities to bolster staffing to improve the quality of patient care.

This work was supported in part by The John A. Hartford Foundation. KFF maintains full editorial control over all of its policy analysis, polling, and journalism activities.

PEPFAR Reauthorization: Side-by-Side of Legislation Over Time

Published: Apr 10, 2025

Overview

The President’s Emergency Plan for AIDS Relief (PEPFAR) is the U.S. government’s global effort to combat HIV and the largest global health program in the world devoted to a single disease (for more information, see PEPFAR). First proposed by President George W. Bush in 2003, PEPFAR was authorized that same year and has been reauthorized four times since, including its latest – a short-term extension that marks a significant departure from past five-year PEPFAR reauthorizations (see Table 1). PEPFAR’s authorizing legislation governs the U.S. bilateral HIV response, as well as participation in the Global Fund to Fight AIDS, Tuberculosis and Malaria (Global Fund) and bilateral assistance for tuberculosis (TB) and malaria programs. These legislative vehicles have permanently authorized most of the program within U.S. law but have also created some time-bound provisions; other than these time-bound provisions, PEPFAR does not need to be reauthorized to continue to operate, as long as Congress appropriates funding for the program. The recent short-term reauthorization extended the program until March 25, 2025, but since its timebound provisions have now lapsed, what happens after this point is uncertain and likely to be affected by the ongoing Trump administration actions related to global health as well as the current complex outlook for PEPFAR. This brief provides a detailed comparison of PEPFAR’s authorizing legislation over time and highlights those authorities that are time-bound (see Tables 2 and 3).

PEPFAR Legislation

Legislative Changes to PEPFAR Over Time

After first setting the broad parameters for PEPFAR and creating its main structures in 2003, PEPFAR’s subsequent authorizing legislation has made several key changes to the program, as the HIV response has evolved and as PEPFAR has moved from an emergency response to one supporting longer-term sustainability and epidemic control. These include changes to funding authorization levels and spending directives, as well as requirements for reporting and oversight. Among the major changes over time are:

  • Funding authorization levels: The Leadership Act authorized $15 billion during PEPFAR’s first five-year period (FY 2004 – FY 2008), which marked a significant increase in funding for HIV by the U.S. government. The Lantos-Hyde Act authorized even more, with $48 billion over the next five-year period (FY 2009 – FY 2013). Subsequent reauthorizations have not included specific authorization of funding amounts.
  • Spending directives: Congress has provided several spending directives to PEPFAR through its authorizing legislation, although these have generally been relaxed over time. For example, in the Leadership Act, Congress required that at least 33% of prevention funds be spent on abstinence-until-marriage programs during the FY 2004 – FY 2009 period. This was relaxed in the Lantos-Hyde Act, which removed the 33% directive and replaced it with a requirement of “balanced funding” for prevention, to be accompanied by a report to Congress if less than half of prevention funds were spent on abstinence, delay of sexual debut, monogamy, fidelity, and partner reduction activities in any host country with a generalized epidemic.
  • Reporting, monitoring, and transparency: Each of the authorizing bills has included reporting requirements to provide Congress and others with data and information about the program and to support oversight and evaluation. For example, the Leadership Act and the Lantos-Hyde Act required the Institute of Medicine to conduct evaluations of PEPFAR; however, this has not been included in subsequent reauthorizations. On the other hand, all authorizations have required the Inspectors General of several U.S. agencies (the Department of State, the Department of Health and Human Services, and the U.S. Agency for International Development) to jointly develop coordinated annual plans for overseeing U.S. government global HIV, TB, and malaria programs.

It is important to note that Congress has also made changes to PEPFAR through other legislative vehicles. For example, Congress has used appropriations legislation in certain years to change the amount of withholding required from the annual U.S. contribution to the Global Fund, pending certification of certain benchmarks by the Secretary of State. Still, by the time of the Stewardship Act in 2013, a decade after PEPFAR’s creation, most changes have been relatively minor, focused on adding new or refining existing reporting requirements.

Permanent and Time-Bound Authorities

PEPFAR operates largely under permanent authorities of U.S. law that allow for ongoing funding and the continuation of the major structures of the program, such as the Office of the Global AIDS Coordinator at the Department of State (now within the Bureau of Global Health Security and Diplomacy) as well as the position of Global AIDS Coordinator, U.S. participation in the Global Fund, and annual reporting on PEPFAR efforts. Absent a reauthorization, the PEPFAR program would continue, provided funds are appropriated. At the same time, a subset of PEPFAR’s congressionally-mandated requirements are time-bound and are currently lapsed, having been extended through only March 25, 2025 (approximately midway through FY 2025). Of these, two relate to how HIV funding is allocated, four specify requirements related to the U.S. contribution to the Global Fund, and two address reporting or oversight (see Table 2).

Current Status of PEPFAR Time-Bound Provisions

Detailed Comparison

Table 3 provides a detailed comparison of PEPFAR’s authorizing legislation over time, by key topic. Time-bound provisions are specified. The recent short-term reauthorization’s extension of these provisions is reflected in The PEPFAR Extension Act column.

Side-by-Side of PEPFAR Legislation

5 Key Facts About Medicaid Coverage for Adults with Chronic Conditions

Published: Apr 10, 2025

Note: This brief was updated on April 14, 2025 to clarify the sources of data, which include data on both self-reported and diagnosed chronic conditions.

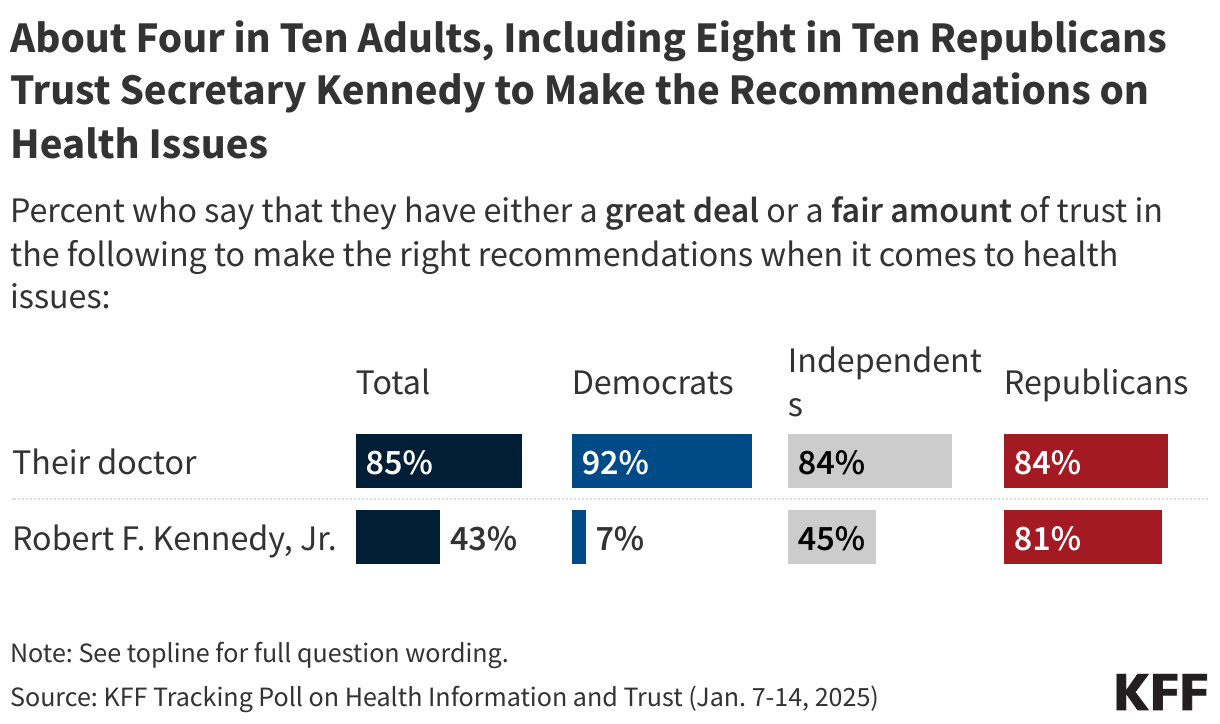
Chronic conditions (also referred to as chronic disease or illness) have drawn increased attention in recent months, partly due to the focus on chronic conditions under HHS secretary Robert F. Kennedy’s “Make America Healthy Again,” (MAHA) initiative. Among working age adults enrolled in Medicaid, approximately three quarters have one or more chronic conditions, and nearly one-third have three or more. Medicaid coverage facilitates access to care for this population.

To achieve the federal savings required by the House budget resolution, Congress would need to cut federal Medicaid spending by hundreds of billions of dollars, leaving states with significant budget shortfalls. Federal funding cuts of that magnitude would force states to make difficult choices—such as reducing Medicaid eligibility, scaling back benefits, lowering provider reimbursement rates, raising taxes, or cutting spending on other programs such as education. Because state Medicaid programs differ considerably, their policy responses would likely vary. Amid this evolving landscape, this issue brief examines Medicaid’s coverage of adults with chronic conditions using data from the National Health Interview Survey (NHIS) and Medicaid administrative data (see Methods).

1. Three in four adults enrolled in Medicaid report one or more chronic conditions.

Chronic conditions are conditions that last at least one year and require ongoing medical care or limit daily activities (e.g. heart disease, diabetes, cancer, mental illness, etc.). Medicaid-enrolled adults (ages 19-64) report higher chronic condition rates than privately insured adults (75% vs. 66%), and nearly one-third report three or more chronic conditions (Figure 1). Higher rates among Medicaid enrollees partly reflect program eligibility criteria because states are generally required to cover people with disabilities who receive Supplemental Security Income, and all states choose to provide additional optional coverage for other adults with disabilities or high medical spending. Uninsured adults report lower chronic condition rates, which may reflect less incentive to obtain coverage because they don’t feel it’s needed or a lack of awareness of their health conditions because of limited health care access. Other KFF work shows that less than half of those without insurance had a doctor’s visit in the past year versus about 85% of insured adults.

Three in Four Nonelderly Adults Enrolled in Medicaid Have One or More Chronic Conditions--More Than Other Coverage Groups

2. Medicaid facilitates access to care for people with chronic conditions.

Nine in ten (91%) of Medicaid-enrolled adults with chronic conditions reported having a healthcare visit in the last year, which is just higher than privately insured adults (86%), and significantly higher than uninsured adults (63%) (data not shown). In addition to health care visits, many chronic conditions require routine access to prescription medications and when that access is limited, the risk of health complications, including those that are life-threatening, rises. Over three-quarters of Medicaid-enrolled adults with one or more chronic conditions filled a prescription medication in the past year, rising to 95% among those with three or more conditions (data not shown). Low or no out-of-pocket costs for prescription medications in the Medicaid program help adults with chronic conditions avoid cost-related rationing or delays in prescription access. Uninsured adults were 2.5 times more likely than Medicaid-enrolled or privately insured adults to report skipping or delaying prescription medications due to cost (28%, 11%, and 8%, respectively, Figure 2).

Medicaid Coverage Helps Adults With Chronic Conditions Avoid Cost-Related  Prescription Medication Rationing or Delays

3. The most common chronic conditions diagnosed among adult Medicaid enrollees are physical conditions, followed by behavioral health.

The most common chronic conditions are physical, with 13.9 million adult Medicaid enrollees having a diagnosed physical health condition in 2021. High blood pressure, high cholesterol, and obesity were the most frequently diagnosed physical health conditions and can act as risk factors for other chronic conditions, such as heart disease. More than 10.1 million nonelderly Medicaid-enrolled adults have a diagnosed behavioral health condition, including mental health and substance use conditions. A separate KFF analysis shows that among those with any mental illness, approximately 2.3 million have a diagnosed serious mental illness. Cognitive impairment conditions, including dementia and intellectual and developmental disabilities (IDD), affect over 700,000 nonelderly Medicaid adults and often cause functional limitations that require long-term care (Figure 3). The number of enrollees diagnosed with behavioral, physical, or cognitive impairment conditions varies by state, but in all states, at least 1,000 Medicaid enrollees have each type of chronic condition (Appendix Table 1).

Unlike earlier exhibits, this analysis uses Medicaid claims data from 2021, the latest available to KFF. Claims data reflect only diagnoses recorded during medical visits in 2021 and do not measure overall prevalence. Prevalence rates from surveys are generally higher than claims-based estimates because not everyone is screened, treated, or has a recorded diagnosis for their chronic conditions in claims data in any given year. Additionally, during the pandemic, certain types of health care utilization declined even as Medicaid enrollment increased. While the direction of change for utilization rates is more clear (a decline), it is uncertain how these changes impacted the total number of people with recorded diagnoses in 2021 claims data. The numbers exclude Medicaid enrollees who also have Medicare (since Medicare is the primary payer for outpatient and acute care services), as well as enrollees ages 65 and older, nearly all of whom also have Medicare coverage (see Methods).

The most common chronic conditions among adult Medicaid enrollees are physical conditions, followed by behavioral health conditions

4. Rates of diagnosed physical conditions among adult Medicaid enrollees increase with age.

Unlike behavioral health and cognitive impairment conditions, rates of diagnosed physical health conditions among adult Medicaid enrollees increase with age. Seventeen percent of Medicaid enrollees ages 19 to 26 have one or more diagnosed physical health conditions in a year, rising to 32% of enrollees ages 27 to 49 and 61% of enrollees ages 50 to 64. In contrast, rates of diagnosed behavioral health conditions remain relatively stable across age groups, ranging from 20% among those ages 19 to 26 to 27% among the older age groups. Cognitive impairments are less prevalent among adults under age 65, affecting only 3% of Medicaid enrollees ages 19-26 and 1% of enrollees ages 27-64 (Figure 4).

Rates of Physical Health Conditions Among Adult Medicaid Enrollees Increase With Age

5. Medicaid spending doubles for adult enrollees diagnosed with one or two chronic conditions and increases fourfold for those with three or more conditions.

Medicaid spends an average of $5,000 for adult enrollees without chronic conditions compared with $10,000 for those with one or two diagnosed conditions in a year, and nearly $20,000 for those with three or more conditions (Figure 5). The higher spending reflects increased health care needs, which result in in more health care visits, greater use of acute care, and an increased likelihood of using long-term care. Adult enrollees with chronic conditions account for 69% of all spending for adult enrollees (data not shown).

Medicaid spending doubles for adult enrollees with one or two chronic conditions and increases fourfold for those with three or more conditions

Medicaid-Enrolled Adults with Any Diagnosed Chronic Condition, by Condition Group

Methods

National Health Information Survey (NHIS): The NHIS is a nationally representative survey that collects data on chronic conditions, among other topics, from respondents. This analysis includes 24 chronic conditions: coronary heart disease, high cholesterol, angina, myocardial infarction, stroke, hypertension, diabetes, chronic obstructive pulmonary disease, asthma, arthritis, psoriasis, Crohn’s disease, ulcerative colitis, hepatitis, epilepsy, dementia, depression/anxiety, glaucoma, cataracts, diabetic retinopathy, macular degeneration, cancer, obesity, and chronic fatigue syndrome. Anxiety and depression are combined into a single mental health flag. The total number of chronic conditions reported by respondents was categorized as none, 1-2, or 3 or more. Most chronic conditions are self-reported, and for conditions where NHIS differentiates lifetime from current prevalence (cholesterol, hypertension, chronic fatigue, asthma), only current conditions were included. National survey estimates presented in Figures 1 and 2 use the most recent NHIS data (2023) and include respondents ages 19-64. Health insurance coverage is self-reported and includes respondents who report any Medicaid.

Medicaid Claims Data: This analysis used the 2021 T-MSIS Research Identifiable Files including the inpatient (IP), long-term care (LT), other services (OT), and pharmacy (RX) claims files merged with the demographic-eligibility (DE) files from the Chronic Condition Warehouse (CCW).

Defining Chronic Conditions: This analysis used the CCW algorithm for identifying chronic conditions (updated in 2020). This analysis also included in its definition of chronic conditions substance use disorder, mental health, obesity, HIV, hepatitis C, and intellectual and developmental disabilities. In total, 35 chronic conditions were included and were further grouped into 3 broad categories: behavioral health, physical health, and cognitive impairment conditions. Specific conditions within these groupings include:

  • Behavioral health conditions: Any mental health condition and any substance use disorder. See KFF’s brief, “5 Key Facts About Medicaid Coverage for Adults with Mental Illness,” KFF brief “SUD Treatment in Medicaid: Variation by Service Type, Demographics, States and Spending,” and the Urban Institute, Behavioral Health Services Algorithm for additional details (Victoria Lynch, Lisa Clemans-Cope, Doug Wissoker, and Paul Johnson. Behavioral Health Services Algorithm. Version 4. Washington, DC: Urban Institute, 2024).
  • Physical health conditions: Hypertension, transient ischemic attack, acute myocardial infarction, hyperlipidemia, ischemic heart disease, atrial fibrillation, heart failure, obesity, chronic obstructive pulmonary disease, pneumonia, asthma, diabetes, arthritis, hip fracture, osteoporosis, cataracts, glaucoma, chronic kidney disease, colorectal cancer, endometrial cancer, urologic cancer, prostate cancer, lung cancer, breast cancer, benign prostatic hyperplasia, hepatitis, HIV, anemia, hypothyroidism
  • Cognitive impairment conditions: Alzheimer’s, intellectual and developmental delay, Parkinson’s, and dementia

Enrollee Inclusion Criteria: Enrollees were included if they were ages 19-64, had full Medicaid or CHIP coverage for at least one month, and were not dually eligible for Medicare.

State Inclusion Criteria: To assess the usability of states’ data, the analysis examined quality assessments from the DQ Atlas for OT claims volume and OT managed care encounters and compared the share of adults diagnosed with any mental illness (AMI) in each states’ Medicaid data to estimates for adult Medicaid enrollees from the 2021-2022 restricted National Survey on Drug Use and Health (NSDUH). States were excluded if: (1) they received a “High Concern/ Unusable” rating on the relevant DQ Atlas assessment measure, and (2) their Medicaid estimate of AMI differed from the NSDUH estimate by more than 15.1 percentage points (the 75th percentile of all differences). If at least 70% of a state’s Medicaid enrollees were covered by either managed care or by fee for service, only the corresponding DQ Atlas indicator was considered (i.e. managed care encounters volume or claims volume (FFS)). For states with more mixed delivery systems, both sets of indicators were considered; in these cases; a “High Concern/Unusable” rating on either measure, combined with a difference above 15.1 percentage points, led to exclusion. Based on these criteria, Mississippi was excluded, leaving 49 states and D.C. in the data presented in Figures 3 and 4.

The DQ Atlas was used to assess the usability of state Medicaid spending data. Due to “unusable” 2021 spending data according to the DQ Atlas, West Virginia and Mississippi were excluded from Figure 5.

Most People in the Most Rural Counties Get Medicare Coverage from Traditional Medicare

Published: Apr 10, 2025

Enrollment in Medicare Advantage, the private plan alternative to traditional Medicare, has grown steadily over the past decade, and since 2023, more than half of all eligible Medicare beneficiaries have been enrolled in Medicare Advantage. The rapid transformation of the Medicare program to a system that is largely administered by private companies has been less pronounced in places where Medicare Advantage has a smaller presence, such as in rural counties, especially those that are far from metropolitan areas.

This data note examines the share of eligible Medicare beneficiaries (those with both Part A and Part B) with coverage under traditional Medicare and Medicare Advantage across counties that are part of either urban or rural areas, defined using Urban Influence Codes published by the U.S. Department of Agriculture. To focus on rural areas that have less access to the goods and services of urban areas, including for the delivery of health care services, rural counties are further classified as adjacent or not adjacent (most rural) to an urban area.

In the most rural areas, nearly six in ten (58%) Medicare beneficiaries are covered by traditional Medicare.

The share of Medicare beneficiaries who receive their coverage through traditional Medicare is higher in the most rural counties (58%) than in rural counties that border an urban area (48%) or counties that are within an urban area (44%) (Figure 1). Among the just over 61 million Medicare beneficiaries with both Part A and Part B in 2024, 3.4 million lived in a rural county that is outside an urban area, 7.3 million lived in a county that borders an urban area, and 50.4 million lived in a county that is in an urban area.

In Rural Areas, Nearly Six in Ten (58%) Medicare Beneficiaries are Covered by Traditional Medicare

In 44% of the most rural counties, at least 70% of Medicare beneficiaries are in traditional Medicare.

In 44% of the most rural counties, at least 70% of Medicare beneficiaries are in traditional Medicare, which is substantially larger than the 13% of counties in rural counties adjacent to urban areas, and 6% of counties in urban areas where at least 70% of Medicare beneficiaries are in traditional Medicare (Figure 2). Across all 3,144 counties in the United States (excluding territories), 912 are in a rural area not adjacent to an urban area, 1,046 are in a rural area adjacent to an urban area, and 1,186 are in an urban area.

In 44% of Rural Counties, At Least 70% of Medicare Beneficiaries are Covered by Traditional Medicare

Half as many Medicare Advantage plans are available to people living in the most rural areas compared with those living in urban areas

Medicare Advantage plans are offered at the county level and the number of plans available varies considerably across counties. Counties with larger populations tend to have more plans available. In 2024, the average Medicare beneficiary living in one of the most rural counties had 22 plans to choose from, compared with 30 for those living in rural counties adjacent to urban areas, and 46 for those in urban areas (Figure 3) (note, plan counts include those with and without Part D prescription drug coverage).

Half as Many Medicare Advantage Plans are Available to People Living in Rural Areas (23) Compared With Those Living in Large Metropolitan Areas (50)

The share of Medicare beneficiaries in traditional Medicare varies substantially in both rural and urban counties.

Among the most rural counties, the share of beneficiaries in traditional Medicare ranges from 26% in Clay County, Kentucky to 100% in Lake and Peninsula Borough, Alaska (Figure 4, Tab 1). Among rural counties adjacent to urban areas, the share of beneficiaries in traditional Medicare ranges from 16% in Starr County, Texas to 99% in Yukon-Koyukuk Census Area, outside of Fairbanks, Alaska (Figure 4 Tab 2). Similarly, among counties in urban counties, the share of eligible beneficiaries in traditional Medicare ranges from 17% in Monroe County, New York to 98% in Fairbanks, AK (Figure 4, Tab 3).

KFF analysis of CMS Medicare Enrollment data, September 2024.

This work was supported in part by Arnold Ventures. KFF maintains full editorial control over all of its policy analysis, polling, and journalism activities.

Health Spending Issues to Watch This Year

Authors: Emma Wager, Lynne Cotter, Cynthia Cox, Sarah Berk, Mairin Mancino, and Julia Harris
Published: Apr 10, 2025

The cost of health care in the United States has continued to grow in recent years. Between 2022 and 2023, overall health spending rose 7.5%, and it is projected to rise another 4.2% in 2025.

A new issue brief authored by KFF and the Peterson Center on Healthcare examines market trends contributing to rising health costs and identifies several potential federal and state policy issues to watch throughout 2025, including high-cost drugs, federal funding cuts, and workforce shortages.

This brief is available through the Peterson-KFF Health System Tracker, an online information hub dedicated to monitoring and assessing the performance of the U.S. health system.

VOLUME 20

Fluoride Bans and Food Safety Doubts


Summary

This Monitor covers how fears about fluoride as a neurotoxin are impacting public health and how trust in food safety is eroding following the USDA’s disbandment of two food safety panels. It also discusses approaches to addressing false information and the accuracy of AI chatbots, like ChatGPT, in answering health questions compared to traditional search engines.


Recent Developments

CDC and EPA Will Re-Evaluate Water Fluoridation Recommendations as Communities Push to Ban Fluoride

Source: KFF Health News

On April 7, Health and Human Services (HHS) Secretary Robert Kennedy Jr., a fluoridation skeptic, announced that he is assembling a task force of health experts to study fluoride and will ask the Centers for Disease Control (CDC) to change its water fluoridation recommendation. At the same time, the Environmental Protection Agency (EPA), which regulates fluoride levels in public water systems, said it will review new evidence on the health effects of water fluoridation. Fluoride, a naturally occurring mineral, was first added to public water in Grand Rapids in 1945 to prevent tooth decay and has since spread to around 70% of the U.S. population. The CDC, American Dental Association, and the American Academy of Pediatrics support adding fluoride to drinking water to prevent cavities, and multiple studies have shown that water fluoridation reduces tooth decay by about 25% in children and adults.

Opponents of water fluoridation have linked the practice to illnesses without scientific backing for decades, including bone cancer and AIDS. Public debate over fluoride was reignited last September when a federal judge in California ordered the Environmental Protection Agency (EPA) to regulate fluoride in drinking water over concerns of cognitive effects on children. More recently, a January review published in JAMA Pediatrics found that as fluoride exposure increased, children’s IQ tended to decrease. The authors note that most of the studies they reviewed were from countries where the fluoridation level far exceeded the United States’ recommended level of 0.7 milligrams per liter, and, according to the review, no studies of fluoride exposure and children’s IQ have been performed in the United States.

Fears that fluoride is a neurotoxin are contributing to efforts to ban it. In March, Utah became the first state to ban fluoride in public drinking water under a new law that will take effect on May 7, and dozens of other cities and local governments are considering similar actions. However, dentists and researchers warn that ending community fluoridation, especially in rural communities where dental care access is more limited, could risk exacerbating this lack of access. More than 150 towns and counties have voted to end fluoridation since 2010, and 14 states this year have considered or are considering ending fluoride mandates or banning fluoridation. According to a KFF Health News analysis, at least 230 counties face dentist shortages and mostly or completely unfluoridated drinking water.

Polling Insights:

A January KFF tracking poll found that about four in ten adults say they have a great deal or a fair amount of trust in Secretary Robert F. Kennedy Jr. (43%). However, there are large partisan differences in trust. Few Democrats express trust in health recommendations from Secretary Kennedy (7%), whereas among Republicans, about eight in ten say they trust Secretary Kennedy (81%). Notably, Republicans are as likely to say they trust Secretary Kennedy as they are to trust their own doctors (84%) to make the right recommendations on health issues.

Split bar chart showing percent who say they trust  their doctor, RFK Jr., and Dr. Oz a great deal or a fair amount when it comes to making the right recommendations about health issues broken down by total and party identification.

Shifts in Public Confidence in Food Safety after USDA Disbands Two Safety Panels

Nitat Termmee / Getty Images

The USDA’s decision to disband two advisory panels on food safety in March prompted a sharp uptick in online discussion, reflecting both genuine concern and emerging misinformation. Between March 5 and March 11, there were approximately 9,000 news articles, social media posts, and comments mentioning the committees. Most of these posts expressed concern that the elimination of these committees would lead to more foodborne illnesses. However, some posts and comments, primarily on Instagram, responded to these fears by misleadingly claiming that a plant-based diet prevents foodborne illness entirely. While animal products are more likely to be contaminated with bacteria and viruses that can cause foodborne illness, plant products can also be contaminated. A CDC study looking at the origins of foodborne illness outbreaks in the U.S. found that produce contributed to 46 percent of cases. This nuance is often lost in posts promoting plant-based diets as completely risk-free.

The response to the USDA’s decision reflects a broader decline in trust in the government’s ability to ensure food safety. In recent years, public concern about food additives and ingredients such as seed oils and artificial coloring has grown, sometimes fueled by false or overstated claims that misrepresent their risks.

Training to Identify False Health Information Builds Resilience, but Follow-Up Reminders Are Needed for Long-Term Impact

champpixs / Getty Images

The rapid spread of false or misleading claims on social media makes it difficult for fact-checkers to keep up as new versions of persistent narratives quickly resurface during high-profile health policy and news events. Many health communicators work with limited time and resources, and reactive debunking alone may not keep up with the scale and speed of misinformation. Instead, building resilience to false or misleading information by training people on how to recognize and reject false information before they encounter it may offer a more sustainable approach. However, resilience requires reinforcement, as people forget what they’ve learned, and repeated exposure to falsehoods makes them seem more believable over time – a phenomenon known as the “illusory truth effect.” A study published in Nature Communications finds that using “booster” messages – follow-up reminders that repeat key lessons – can strengthen people’s ability to recognize false or misleading information after their initial training. The researchers used either an article, a video, or a game to train people to recognize and reject false information. They found that the article and video had the longest-lasting effects, but resilience lasted longer when participants received a refresher. These findings suggest that, without reinforcement, communicators and educators risk losing the impact of their initial intervention. Even with limited resources, adding brief follow-up messages can help sustain the impact of health literacy interventions over time in a complicated information environment.

Efforts to fact-check health information are further complicated by a lack of agreement about what counts as false health information. For example, KFF’s 2023 Health Misinformation Pilot Poll asked adults to cite COVID-19 misinformation they had encountered and found that many examples directly contradicted each other – what one person considered misinformation, another considered accurate. Instead of combatting misinformation directly, it may be more effective to focus on common goals that can bring people together and improve the way trusted messengers communicate. One study in the HKS Misinformation Review suggests that rather than simply labeling claims as “misinformation,” health communicators and educators should consider why people disagree in the first place. The authors explain that false information often spreads because of deeper differences in values, identities, or ways of understanding the world, not just gaps in knowledge. Health communicators and educators can address these deeper differences by creating respectful conversations that explore the emotional, cultural, and social context that underlie people’s beliefs. This might involve focusing on shared concerns, like protecting loved ones or keeping communities healthy, rather than simply pointing out what’s true or false. While this approach may be more complex and slower than fact-checking alone, the study from HKS Misinformation Review suggests that it is likely to build more trust and lead to longer-term changes in how people engage with health information.


AI & Emerging Technology

Half of Adults Trust AI Chatbots to Provide Reliable Information About Practical Tasks, Technology; Fewer Trust Their Reliability for Health  and Political Information

A 2024 KFF poll found that while most adults reported regularly using search engines for health information and advice on a weekly basis, few (13%) said they regularly used AI chatbots for this purpose. Additionally, 70% of adults say they trust AI chatbots “not too much” or “not at all” to provide them with reliable health information. A recent study published in Nature Digital Medicine, however, suggests that LLMs may provide more accurate results than traditional search engines. Search engines, like Google or Bing, work by indexing large amounts of web content and ranking results based on keywords and popularity, often directing users to existing websites. LLMs, on the other hand, are trained on large datasets and generate original responses based on patterns in the data, rather than retrieving exact matches from the web. Unlike search engines, which display a list of sources, LLMs typically present a single answer, which can feel more direct but may also hide the reasoning or sources behind it. The study found that search engines share correct answers 50-70% of the time, with 10-15% of top-ranked results containing harmful advice. In contrast, LLMs generally outperformed the search engines, although they still provided incorrect answers, particularly with poorly framed prompts.

As AI continues to shape the health information landscape, traditional search engines are integrating more AI capabilities. For example, Google’s AI Overviews provide AI-generated summaries at the top of search queries, although their accuracy can vary. These summaries are powered by LLM-like technology, blending the retrieval functions of a search engine with the generative abilities of a chatbot. More recently, Google introduced the "What People Suggest" feature, which uses AI to collect and present comments from patients with similar health conditions to help users understand how others have described their experiences. However, relying on the experiences of others may impact the quality of the information provided, as it introduces subjective perspectives that may not always align with medical evidence or expert advice.

About The Health Information and Trust Initiative: the Health Information and Trust Initiative is a KFF program aimed at tracking health misinformation in the U.S., analyzing its impact on the American people, and mobilizing media to address the problem. Our goal is to be of service to everyone working on health misinformation, strengthen efforts to counter misinformation, and build trust. 


View all KFF Monitors

The Monitor is a report from KFF’s Health Information and Trust initiative that focuses on recent developments in health information. It’s free and published twice a month.

Sign up to receive KFF Monitor
email updates


Support for the Health Information and Trust initiative is provided by the Robert Wood Johnson Foundation (RWJF). The views expressed do not necessarily reflect the views of RWJF and KFF maintains full editorial control over all of its policy analysis, polling, and journalism activities. The Public Good Projects (PGP) provides media monitoring data KFF uses in producing the Monitor.

Ending the HIV Epidemic (EHE) Funding Tracker

Authors: Lindsey Dawson, Tenzin Dhondup, and Jennifer Kates
Published: Apr 8, 2025

The “Ending the HIV Epidemic Initiative” (EHE), is a federal effort to reduce new HIV infections in the United States, launched by the first Trump administration in 2019, with the goal of a 75% reduction in five years and 90% reduction in ten years. The EHE built on earlier efforts made by the Obama administration and was continued throughout the Biden administration.

The initiative has focused on a subset of “Priority Jurisdictions”, comprised of the 48 counties in the U.S. that had the largest number of HIV diagnoses (in 2018), as well as San Juan, Puerto Rico, Washington D.C., and 7 states with a substantial share of rural HIV cases (see Figure 1). It also has been accompanied by additional federal funding, including reprogrammed funding in FY 2019 and new Congressional appropriations in FY 2020 through FY 2025. Still, this additional funding accounts for a relatively small share of overall federal HIV funding provided to state and local jurisdictions.

While the second Trump administration has continued the EHE. However, there were some questions as to whether it would when a leaked document suggested the administration may not support EHE early on. The administration has proposed cutting HIV prevention funding at the Centers for Disease Control and Prevention (CDC) and moving that EHE funding to the proposed Adminstration for Healthy America (AHA). More recently, the CDC’s HIV Prevention branch and the Office at Health and Human Services (HHS) tasked with coordinating the EHE were eliminated as were key HIV officials at NIH as was the Office of Infectious Disease Policy at HHS, which coordinated EHE.

Ending the HIV Epidemic (EHE) Priority Jurisdictions –  Local Jurisdictions

This tracker provides up-to-date data on federal EHE funding, including an overview of funding mechanisms by year, agency, grant mechanism, and jurisdiction. It will be updated over time.

Funding by Year, Agency, and Grant Mechanism

While FY 2020 is considered the first year of EHE funding, in FY 2019, some funds were reprogrammed from existing accounts to help start the initiative. From FY 2019-2024, funding totaled $2.33 billion. Funding for the EHE increased each year from FY 2020-2023 but has since been flat funded. (See Table 1.)

Ending the Epidemic Funding, FY 2019 – FY 2026 (in Millions) (Table)

Prior to the Congressional appropriations process, the administration makes a presidential budget request for Congress to consider. A budget request lays out presidential priorities both in terms of the policy issues identified and the level of funding requested. Table 2 provides the history of EHE presidential budget requests showing that EHE funding requests increased each year from FY 2020 to FY 2023. In FY 2024 the request was flat compared to the prior year. The FY 2025 budget request represents a $256.75 million decrease compared to the FY 2024 request. Since then, funding has been similar except for the Indian Health Services (IHS), which has seen declining request levels. (seen in Table 1).

Ending the HIV Epidemic Budget Requests FY2020 – FY2027 (in Millions) (Table)

Table 3 provides detail on each federal EHE grant mechanism by agency. Most EHE funding is allocated directly to EHE jurisdictions to assist with local efforts. A subset of EHE funding is provided to other grantees to carry out related efforts, such as to support capacity building and technical assistance and for science implementation hubs through NIH-funded Centers for AIDS Research (CFAR) and the NIMH AIDS Research Centers (ARC) programs.

FY2019 EHE Funding – Federal Funding Streams and Grants Awarded

Funding by Year and Jurisdictions

Tables 4 and 5 detail funding from FY 2019 to FY 2024 directed to EHE priority jurisdictions (data for FY 2025 are not yet available). Table 4 includes funding directed to EHE Counties and other local jurisdictions. Table 5 includes funding directed to the seven EHE states. See notes in these tables for details on how funding was allocated in this analysis.

Ending the HIV Epidemic Initiative: FY2019 Funding for Counties, D.C., and San Juan, Puerto Rico
Ending the HIV Epidemic Initiative: FY2019 Funding for States

What Do Federal Staffing Cuts and HHS Restructuring Mean for the Nation’s HIV Response?

Published: Apr 8, 2025

On March 27th, the Trump administration announced that the U.S. Department of Health and Human Services (HHS) would implement “a dramatic restructuring” in accordance with President Trump’s Executive Order, “Implementing the President’s ‘Department of Government Efficiency’ Workforce Optimization Initiative.” This included plans to reduce the Department’s workforce by 10,000 employees. As a result, thousands of federal HHS employees were given “reduction in force” announcements (or RIFs) or otherwise learned that their roles had been eliminated when they were denied access to their offices. Others were offered reassignments. In addition, several HHS offices and functions have reportedly been reduced or ended. These actions seem to be particularly focused on the federal government’s work on HIV and have the potential to negatively affect the nation’s HIV response. While there continues to be some uncertainty about the full extent of these actions, and there are some reports that certain personnel may be reinstated, here is what is known thus far about the implications of these actions on HIV efforts:

  • Centers for Disease Control and Prevention (CDC): A near 20% cut to CDC staff and elimination of divisions and offices:
    • This includes cuts within the National Center for HIV, Viral Hepatitis, STD, and Tuberculosis Prevention (NCHHSTP), the division that handles most federal HIV prevention efforts, with several branches being effectively eliminated, and it’s director, Jonothan Mermin, reassigned. For HIV, these include the elimination of the following divisions:
      • Prevention Communication Branch
      • Division of Behavioral & Clinical Surveillance Branch
      • Capacity Development Branch
      • Quantitative Sciences Branch
      • HIV Research Branch
    • These divisions within the CDC have provided leadership, subject matter expertise, tools and campaigns for communication with the public (important for a providing evidence-based information on a communicable and often stigmatizing disease), generated and analyzed data, helped develop capacity among grantees, supported outbreak investigation, and conducted research across a range of areas to improve HIV prevention, care engagement, and response efforts.
    • Beyond these HIV specific divisions, cuts also occurred within branches or divisions related to public health concerns that have a disproportionate impact on people with HIV or relate to conditions that increase vulnerability to HIV, including those focused on addressing tuberculosis, viral hepatitis, and sexually transmitted diseases (STD). For example, the disease intervention and response branch within the STD division faced eliminations, an office whose role it is to identify STD case and outbreaks and mitigate spread through linkage to care and provision of technical assistance.
  • HHS: Elimination of the Office of Infectious Disease Policy (OIDP) within the Office of the Secretary at HHS:
    • The OIDP office was eliminated and most staff were terminated or reassigned. This includes staff who supported coordination of the Ending the HIV Epidemic Initiative (EHE) which spans multiple HHS agencies and the Executive Director of the President’s Advisory Council on HIV/AIDS (PACHA), who was an employee within the office.
    • OIDP provides infectious disease leadership, expertise, and coordination across the federal government, with HIV being a special focus of the office. This includes coordinating multiple national strategies aimed at addressing infectious diseases including, the National HIV/AIDS Strategy (NHAS), Vaccines National Strategic Plan (Vaccine Plan), Viral Hepatitis National Strategic Plan (Viral Hepatitis Plan), and the STI National Strategic Plan (STI Plan), in addition to providing EHE leadership.
  • National Institutes of Health (NIH): Key officials in NIH leadership were placed on administrative leave and some offices were eliminated:
    • Specific to HIV, Jeanne Marrazzo, the director of the National Institute of Allergy and Infectious Diseases (NIAID) was reportedly placed on administrative leave. The role was previously held by Anthony Fauci.
    • Additionally, there have been reports that the Workforce Operations, Communications, and Reporting Branch (WOCRB) at the Division of AIDS (DAIDS) within NAID has been eliminated. WOCRB’s role is to coordinate division-wide operational activities.
    • NIAID conducts and supports research related to infectious, immunologic, and allergic diseases, including HIV. Specifically related to HIV, NIAID has worked to “better understand HIV and how it causes disease, find new tools to prevent HIV infection, develop new and more effective treatments for HIV-infected people, and find a cure.” NAID’s HIV research has focused on HIV treatment, prevention, cure and vaccine.
  • Beyond those offices dedicated to HIV, several others that have reportedly faced staff or complete elimination conduct activities relevant to addressing the needs of people with and at risk for HIV. These offices address communities disproportionately represented among people with HIV, including those focused on the needs of people of color, LGBTQ people, those with lower incomes, those with comorbidities, including mental health substance use problems, and those that address aging issues.
    • Examples of where such cuts/elimination have reportedly occurred include following offices/agencies: the Centers for Medicare & Medicaid Services (CMS)’s Office of Minority Health, the Substance Abuse and Mental Health Services Administration (SAMHSA) (including multiple offices such as the National Mental Health and Substance Use Policy Laboratory and the Office of Minority Health), and the Administration for Community Living (including the Center for Policy and Evaluation). In addition to NIAID at NIH described above, the National Institute on Drug Abuse with NIH was also reportedly The Office of Minority Health at HHS has also reportedly been told to prepare for elimination.

There are also plans for a new agency, the Administration for a Healthy America (AHA) to be created, consolidating activities from the Office of the Assistant Secretary for Health (OASH), the Health Resources Services Administration (HRSA) (home to the health center and Ryan White HIV/AIDS programs), SAMHSA, and others. AHA will consist of multiple divisions, including one on HIV/AIDS. It is not known whether AHA will seek to reinstitute some of the terminated positions or eliminate additional roles from within the agencies it consolidates.

Regardless of what happens with AHA, the elimination of directors, staff, and departments across HHS to date, represents a significant loss to HIV research, prevention efforts, leadership, expertise, and coordination of the HIV response across the federal government. In addition to cuts described above, it has also been reported that there may be cuts to CDC’s HIV prevention budget, that funding for NIAID’s HIV Prevention Trials Network and HIV Vaccine Trials Network (HVTN) has been suspended, and that some NIH grants focused on HIV have been rescinded. Taken together these actions could all hamper the nation’s ability to address HIV in the immediate term, jeopardize innovation, and lead to increased HIV incidence. In addition, expertise built by these officials and offices has been utilized in public health arenas outside of HIV, as was the case with the development of the COVID-19 vaccine which was built on HIV vaccine research. Given this, erosion of HIV expertise, research, and infrastructure could have ramifications for public health more broadly.

Medicaid Eligibility Levels for Older Adults and People with Disabilities (Non-MAGI) in 2025

Authors: Alice Burns, Maiss Mohamed, and Molly O’Malley Watts
Published: Apr 7, 2025

Issue Brief

To achieve the federal savings required by the House budget resolution, Congress would need to cut federal Medicaid spending by hundreds of billions of dollars, leaving states with significant budget shortfalls. Such policies could have major implications for older adults and people with disabilities who comprise 1 in 4 Medicaid enrollees but over half of Medicaid spending on account of higher per-person costs. Within this group, there are multiple eligibility pathways, most of which are optional for states to cover, and all of which have more complex eligibility requirements than coverage for other enrollees. Proposals to limit federal spending on Medicaid may pressure states to restrict Medicaid eligibility pathways, cover fewer optional benefits, and reduce provider payment rates. Coverage for people eligible through optional pathways, which are offered by all states, may be particularly at risk because of the high per-person costs of people enrolled through those pathways.

KFF’s Survey of Medicaid Financial Eligibility for Older Adults & People with Disabilities conducted in March 2025 by KFF and Watts Health Policy Consulting, provides a baseline of Medicaid eligibility as states return to normal operations after the end of the COVID-19 pandemic and ahead of potential changes to the Medicaid program. (These eligibility pathways are known as “non-MAGI” pathways because they do not determine eligibility based on Modified Adjusted Gross Income, as is the case for people covered under the Affordable Care Act Medicaid expansion and other groups.) Overall, 50 states including the District of Columbia (hereafter referred to as a state) responded to the survey, though response rates to specific questions varied. Florida was the only state that did not respond. Responses were supplemented with publicly available data and information from KFF’s past surveys when available, and state-level data are included in the Appendix Tables. Key takeaways include:

  • States are generally required to provide Medicaid to people who receive Supplemental Security Income (SSI) and Medicare beneficiaries with limited income and savings. Eighteen states have increased the income or savings limits for Medicare beneficiaries beyond the federal minimums.
  • Any optional pathway: All states also offer coverage through one or more optional eligibility pathways to people who have disabilities or are ages 65 and older who have limited financial resources.
  • Optional income-related pathway: All states except Alabama extend eligibility to low-income adults with disabilities or people ages 65 and older who have income above the SSI limits (Figure 1).
    • The most common income-based optional eligibility group is the Medicaid Buy-In for adults with disabilities who want to work, which is offered by 47 states.
  • Optional LTC-related pathway: All states except for Montana offer optional coverage to people who use long-term care, people who tend to have much higher average spending than other Medicaid enrollees.
  • Between 2024 and 2025, there were few changes in states’ eligibility requirements for older adults and people with disabilities, although 12 states increased the personal needs allowance for people using institutional care in 2025, with South Dakota reporting the largest increase (from $60 to $100).

All States Have Optional Pathways for Medicaid Eligibility as of March 2025

What are the two required eligibility pathways for older adults and people with disabilities?

States are only required to cover two eligibility groups for older adults and people with disabilities in Medicaid, both of which require people to demonstrate having limited income and savings. Federal statutes generally require states to enroll people who receive Supplemental Security Income (SSI) in Medicaid and to enroll eligible Medicare beneficiaries in the Medicare Savings Programs:

  • SSI is a disability program that provides monthly income to people who are unable to work on account of a disability and who have limited income ($967 per month in 2025 for an individual) and financial resources below federal limits ($2,000 for an individual).
  • The Medicare Savings Programs provide Medicaid coverage of Medicare premiums and in most cases, cost sharing to Medicare beneficiaries who have limited income ($1,781 per month in 2025 for an individual) and financial resources below federal limits ($9,660 for an individual in 2025). People who are eligible for the Medicare Savings Programs, but not full Medicaid, receive help only with Medicare costs, and not full Medicaid benefits.

States may choose to expand eligibility for the Medicare Savings Programs beyond federally-required minimum levels. As was the case in 2024, 33 states use federal eligibility criteria for the Medicare Savings Programs, and the remaining 18 states expanded eligibility beyond those limits (Appendix Table 2).

Which states offer optional Medicaid eligibility for low-income older adults and people with disabilities?

All states except for Alabama offer optional Medicaid eligibility for low-income older adults and people with disabilities. There are four types of optional Medicaid eligibility pathways based on income for people with disabilities which include:

  • Medicaid buy-in programs for working adults are available in 47 states in 2025, allowing working people with disabilities to “buy into” Medicaid by paying a premium when their earned income exceeds eligibility limits but falls below a percentage of the federal poverty level (FPL).
    • In 2025, the median income limit was 250% of FPL ($3,261 per month in 2025) and median asset limit was $10,000 for an individual and $14,470 for a couple (Appendix Table 3).
    • Over half of states (27 of 45 responding) have an age limit for these buy-in programs, typically ages 16-64.
    • Most states (33 of 47 responding) reported premiums for buy-in enrollees, with the median premium being $25 in 2025.
  • Medically needy coverage is available in 34 states in 2025, allowing people to qualify for Medicaid if their income or assets are higher than permitted under another pathway but below the medically needy limit after accounting for their health care expenses.
    • Most income limits are low—usually below 50% of FPL and many states limit enrollees’ assets to $2,000 (Appendix Table 4).
    • Unlike income limits for other eligibility pathways, medically needy limits are generally established as a dollar amount. The median income limit increased from $504 in 2024 to $511 in 2025.
  • Poverty level coverage is available in 28 states, allowing low-income older adults and people with disabilities to qualify for Medicaid when their income exceeds the SSI limits. States with this type of coverage generally establish income eligibility as a percentage of the SSI benefit rate or federal poverty level ($1,305 per month for an individual in 2025). Among the states that have expanded eligibility above SSI levels:
    • 11 states have eligibility above SSI but below FPL,
    • 15 states have eligibility at FPL, and
    • 2 states have eligibility above FPL (Appendix Table 5).
  • Coverage through the Family Opportunity Act, available in 9 states, allows families with incomes up to 300% of FPL to purchase Medicaid for their children under age 19 (Appendix Table 3). Parents who are eligible for coverage through an employer are required to pay premiums for private coverage too as a condition of Medicaid eligibility. In such cases, Medicaid covers the services children with disabilities need which are often not covered by private coverage.
    • In 2025, the median income limit was about 265% of FPL ($3,452 per month) and 7 states had no limit on assets.
    • Family Opportunity Act coverage is another type of “buy in,” with 5 states charging premiums in 2025. Premiums vary with family income and the median premium started at $12 per month for families with an income of 150% FPL.

What states offer optional Medicaid eligibility for people who use long-term care?

All states except for Montana offer optional Medicaid eligibility for people who use long-term care. Recognizing the high costs of long-term care, eligibility for people who use long-term care is almost always 300% of the SSI limit ($2,901 per month per individual in 2025), and most states limit enrollees’ assets to $2,000 per person (Appendix Table 6). The pathways include:

  • Katie Beckett coverage is available in 43 states, allowing children under 20 with significant disabilities who require an institutional level of care to receive Medicaid while living at home. Only the child’s income and assets are considered for eligibility purposes, which allows some children of higher-income families to qualify. Like Family Opportunity Act coverage, children with Katie Beckett coverage may also have private health insurance, and 7 states charge families premiums for Medicaid.
  • The special income rule allows states to extend Medicaid eligibility to people who require an institutional level of care and live in institutions or in home and community settings. Each pathway is available in 41 states, although Massachusetts offers coverage only for people using home care and New Hampshire offers coverage only for people using institutional care.

Most Medicaid enrollees who qualify because of long-term care are subject to limits on their home equity and must contribute to the cost of their care each month. In 2025, federal rules specified that limits on home equity must be between $730,00 and $1,097,000; and most states set the 2025 limit at $730,000 (Appendix Table 7). In all states, there are circumstances in which the home is exempt from limits, and other circumstances in which the home is counted as an asset when determining eligibility. California is the only state that does not have a home equity limit. Once eligible for Medicaid, enrollees who use long-term care must generally contribute nearly all monthly income to the cost of their care except for a small “personal needs allowance.” In 2025, the median personal needs allowance is $62 for institutional care and $2,901 for home care. Those limits were similar to the limits in 2024, although 12 states increased the personal needs allowance for institutional care in 2025, with South Dakota reporting the largest increase (from $60 to $100).

This work was supported in part by Arnold Ventures. KFF maintains full editorial control over all of its policy analysis, polling, and journalism activities.

Appendix

Table 1

State Adoption of Key Medicaid Eligibility Pathways Based on Old Age or Disability as of March 2025

Table 2

Eligibility for Medicare Savings Programs as of March 2025

Table 3

Medicaid Eligibility for Buy-In Programs for Working People with Disabilities and the Family Opportunity Act as of March 2025

Table 4

Medicaid Eligibility for Medically Needy Populations as of March 2025

Table 5

Medicaid Eligibility for SSI Enrollees and Optional Older Adults & People with Disabilities Up To 100% FPL as of March 2025

Table 6

Medicaid Eligibility for Katie Beckett Children with Significant Disabilities and Special Income Rule as of March 2025

Table 7

State Home Equity Disregards for LTC Eligibility and Personal Needs Allowances as of March 2025

CDC’s Funding for State and Local Public Health: How Much and Where Does it Go?

Published: Apr 7, 2025

Summary

Federal funding has long been a major source of support for public health efforts across the United States, estimated to account for more than half of state and local health department budgets. The Centers for Disease Control and Prevention (CDC), the primary public health agency of the federal government, provides much of this funding, helping to support public health systems and activities across the country. However, CDC and other federal health agencies are being targeted by the Trump administration for downsizing and budget cuts, reductions that could impact the amount of funding available for public health. To better understand how much CDC funding is provided to state and local jurisdictions, we analyzed FY 2023 funding obligation data (see Methods and Appendix 1). Among the key findings:

  • In FY 2023, CDC obligated almost $15 billion to state and local jurisdictions. While most (62% or $9.2 billion) was from CDC’s regular budget, a significant share (38% or $5.7 billion) was from time-limited, supplemental funding for COVID-19 and public health infrastructure rebuilding.
  • Of the $9.2 billion in regular budget obligations, half ($4.7 billion or 51%) was for the Vaccines for Children program, a mandatory program that provides vaccines at no cost for children who are uninsured or underinsured and other eligible children (4% was for additional mandatory programs). The remaining $4.1 billion (45%) was discretionary funding supporting a range of programs including HIV/AIDS, Viral Hepatitis, STI and TB Prevention, Chronic Disease Prevention and Health Promotion, Public Health Preparedness and Response, and Injury Prevention and Control.
  • Both red and blue states benefit from CDC funding, with states that voted for President Trump in 2024 receiving the majority of funding (56%), compared to states that voted for Kamala Harris (44%); on a per capita basis, states voting for Harris received slightly more compared to those that voted for Trump ($46 vs $43 per capita).
  • The top five state recipients also represent a mix of red and blue states (California, Texas, New York, Florida, and Georgia), as do the top five states by funding per capita (District of Columbia, Alaska, Maryland, Vermont, and Wyoming).
  • By region, Southern states received the largest share of funding (43%) followed by the West (22%), Midwest (19%), and Northeast (17%); the South also ranked first in funding per capita.

Funding cuts, therefore, could have a significant impact on the amount of funding available to states and local jurisdictions for public health activities. Such cuts, coupled with the expected end in supplemental funding for COVID-19 and public health infrastructure support, could also represent a double whammy, affecting both red and blue states, and especially states in the South. While state and local governments could potentially fill some of the gap left by federal dollars, they may also be facing their own budget constraints and other cuts in federal funding, leaving the future of the nation’s public health infrastructure capacity uncertain.

Findings

  • In FY 2023, CDC obligated $14.9 billion to state and local jurisdictions. This included $9.2 billion (62%) as part of its regular budget and $5.7 billion (38%) in supplemental funding (see Figure 1). These amounts were distributed to jurisdiction across a number of categories (see Figure 2).
CDC Public Health Funding, Share by Funding Type, FY 2023
CDC Public Health Funding by Category, FY 2023
  • Of the $9.2 billion in regular budget obligations, $5.1 billion (56%) was mandatory funding, required by law, and $4.1 billion (44%) was discretionary and dependent on annual appropriations from Congress. The share of mandatory vs discretionary funding provided varied by state (see Appendix Table 2).
    • Most mandatory funding (92%) was for the Vaccines for Children program. The remainder was for Chronic Disease Prevention and Health Promotion, Cross-Cutting Activities and Program Support, and several other smaller mandatory programs.
    • Discretionary funding was spread across a wide range of public health areas, with the largest share (22%) directed to HIV/AIDS, Viral Hepatitis, STI and TB Prevention efforts. Chronic Disease Prevention and Health Promotion received the next largest share (17%), followed by Public Health Preparedness and Response (16%), and Injury Prevention and Control (15%). A variety of other programs comprised the remainder (see Figure 3).
  • Of the $5.7 billion in supplemental funding, most ($4.9 billion or 87%) was from the Public Health and Social Services Emergency Fund (PHSSEF), transferred to CDC by HHS to support COVID-19 response activities as well as public health infrastructure and workforce. The remainder was for Cross-Cutting Activities and Program Support, which included COVID response activities and hurricane supplemental funding.
CDC Discretionary Public Health Funding, by Category, FY 2023
  • There was significant variation in the amount of CDC funding provided to the 50 states and Washington D.C., ranging from $45.9 million to $1.4 billion; when standardized by population size, funding ranged from $35 to $314 per capita (see Figure 4 and Appendix Table 3).
    • Funding was concentrated in a subset of states, with the top 10 state recipients accounting for 51% of all funding, and the top five states accounting for a third (34%). The top five state recipients were California, Texas, New York, Florida, and Georgia. Per capita, the top five state recipients were the District of Columbia, Alaska, Maryland, Vermont, and Wyoming (see Figure 5).
    • If supplemental funding is removed, CDC’s funding by state ranged from $25.7 million to $906 million, or $21 to $235 per capita; the top five state recipients, representing over a third (36%) of non-supplemental funding, remain the same (California, Texas, New York, Florida, and Georgia), with some variation in the rank by per capita funding (District of Columbia, Alaska, Vermont, Rhode Island, and Wyoming).
CDC Public Health Funding by State, FY 2023
Top 10 States Receiving CDC Public Health Funding, Per Capita, FY 2023
  • By region, the South received the largest share of funding overall (43%) followed by the West (22%), Midwest (19%), and Northeast (17%). In per capita terms, the South remained the top funded region followed by the Northeast, West, and Midwest. With supplemental funding removed, the funding distribution is largely the same as is the per capita rank by region (see Figure 6).
  • States that voted for President Trump in the 2024 election received the majority of CDC funding, although there was a more even distribution when standardized by population size. The 31 states that voted for President Trump received 56% of overall CDC funding, compared to 44% for the 20 states that voted for Kamala Harris. On a per capita basis, states voting for Harris received slightly more ($46 per capita) compared to those voting for Trump ($43 per capita). With supplemental funding removed, the distribution of funding remains almost the same (57% for Trump states and 43% for Harris states) while funding per capita was almost even ($27 per capita for Trump states vs $28 per capita for Harris states) (see Figure 7).
CDC Public Health Funding by Region, FY 2023
CDC Public Health Funding by State 2024 Presidential Election Voting Result, FY 2023

Methods

Data for this analysis were obtained from the CDC’s Grant Funding Profiles database which contains data on funding obligations provided by the agency to U.S. states, including the District of Columbia, territories, and freely associated states by fiscal year and grantee name. The focus of this analysis was on funding obligations provided in FY 2023 to state and local jurisdictions only (funding provided to U.S. territories and freely associated states was excluded). For the purposes of this analysis, funding provided directly to local recipients (e.g., local health departments) is included in the state totals. CDC’s database only includes grants and cooperative agreements, and not other CDC expenditures (e.g., funding for international activities, research and development agreements, user fees), and therefore do not represent total CDC obligations. Most funding represents actual obligations, however, funding for the Vaccines for Children program represents the value of vaccines purchased and provided. Grantee names were manually reviewed by KFF researchers and re-coded to the following grantee types: state or local government (including state and local governments and agencies, public school districts, public universities, and tribal governments), non-profit, or private sector. It is important to note that the grantee's address often represents the geographical location of the grantee's primary headquarters and may not reflect the actual geographic scope of the grantee's work, including national associations that carry out public health programs across the country. Classification of mandatory, discretionary, and supplemental funding was determined by KFF based on congressional appropriations bill language. Supplemental funding represents funding appropriated or transferred from emergency supplemental bills. Population data, for calculating per capita funding amounts, was obtained from the U.S. Census Bureau using the 2023 state population tables, and state regional classifications were obtained from the U.S. Census Bureau’s States and Regions Divisions. State 2024 presidential election voting results were obtained from the National Archive’s 2024 Electoral College Results. While most states delegate all of their electoral college votes to one presidential candidate, two states (Maine and Nebraska) allow for split electoral college votes. For the purposes of this analysis, Maine has been designated as "blue" since most of its votes went to former Vice President Kamala Harris and Nebraska has been designated as "red" since most of its votes went to President Donald Trump in the 2024 election.

Appendix 1: What Does the CDC Budget Include?

CDC’s budget is comprised of three major categories:

  • A discretionary budget determined and appropriated annually by Congress;
  • A mandatory budget determined by a specific set of congressionally-mandated program authorizations, such as the Vaccines for Children program;
  • In some years, supplemental funding is also provided to CDC outside of the regular annual appropriations process, typically to help with response to disease outbreaks or other health emergencies. Starting in 2020, CDC funding has included supplemental funds supporting COVID-19 response.

In FY 2023, the CDC discretionary budget was $8.28 billion, while mandatory budget totaled $6.97 billion. The exact amount of supplemental funding in CDC’s FY2023 budget is not clear. Since 2020, Congress provided CDC with additional funding via five different COVID-19 relief laws, with much of these supplemental appropriations made available to be spent over several years. In addition, other supplemental funds have been provided to CDC via transfers from other agencies. Further, in later legislation Congress rescinded some of the previously appropriated COVID-19 relief funding for CDC. CDC does not publicly report how much supplemental funding it has available in its budget, so developing a full picture of CDC’s available funding is a challenge.

However, CDC does report the amount of funds that it directs to state and local entities, which amounted to $14.9 billion in FY2023. CDC reports this funding by category and sub-category (program areas and activities) In addition, KFF designated these by funding type (discretionary, mandatory, and supplemental), as determined by appropriation bill language; Appendix Table 1 shows these categories and corresponding funding types.

Mandatory, Discretionary, and Supplemental Funding Categories and Sub-Categories in CDC's FY 2023 Budget


Appendix 2: Additional Charts

CDC Public Health Funding, Share by State and Funding Type, FY 2023

CDC Public Health Funding by Geographic Area, FY 2023