Since the enactment of Medicare and Medicaid in 1965, the federal government has played a central role in providing support to older adults and people with low incomes, with health insurance coverage under Medicare for those 65 and older and Medicaid for those with low incomes, including older adults. The Older Americans Act, enacted that same year, is perhaps lesser known than Medicare and Medicaid but also provides important support for older adults through a broad range of community-based social services programs, including home-delivered and congregate meals, transportation services, caregiver support, chronic disease prevention services, and the Long-Term Care Ombudsman program. These programs and services may face some disruption, however, in light of the Trump administration’s organizational changes and staffing reductions at the Department of Health and Human Services (HHS), which houses the Administration for Community Living (ACL), the agency that has administered the programs and services authorized by the Older Americans Act.
According to a recent HHS press release, ACL is releasing over $1 billion of Fiscal Year (FY) 2025 funding for Older Americans Act programs to state, local, and Tribal grant recipients – funds that had already been appropriated by Congress but withheld by the Trump administration. At the same time, the Trump administration recently announced a restructuring within HHS, including budget cuts for several divisions and layoffs of 10,000 employees, with the stated goal of saving money and reducing inefficiencies. As part of this effort, the President’s proposed HHS FY 2026 budget outlines the Trump administration’s plans to dissolve ACL and integrate its functions within a newly established Administration for Children, Families, and Communities (ACFC).
The reorganization and staffing reductions at HHS create some uncertainty about the potential effect on older adults that could result from dissolving the agency at the center of administering programs and services authorized under the Older Americans Act. While the Trump administration generally can make organizational changes of this nature at federal agencies, Congress typically has the final say in determining agency funding levels and appropriating funds. The most recent reauthorization of the Older Americans Act in 2020 appropriated funds through FY 2024, with funding for FY 2025 provided through continuing resolutions at FY 2024 levels.
With the changes to ACL and other restructuring at HHS as context, this brief provides an overview of programs and services provided under the Older Americans Act, the role that was played by ACL in administering Older Americans Act programs, and trends in Older Americans Act program funding and service utilization by older adults.
What programs and services are provided under the Older Americans Act?
The Older Americans Act was signed into law in 1965 with the goal of providing older adults with home and community-based social services to support independent living as long as possible. Unlike Medicaid, the Older Americans Act does not have explicit income criteria used to determine who can qualify to receive services funded under the Act. Instead, the law aims to support people age 60 and older with the greatest economic or social need, including older adults with limited English proficiency and older individuals at risk for institutional placement.
The Older Americans Act authorizes grants from the federal government to states to provide community social services to older adults and established the Administration on Aging, an office within ACL, to administer these grant programs. The scope of Older Americans Act programs has been expanded over time and now includes home-delivered and congregate nutrition services, transportation services, state Long-Term Care Ombudsman programs, elder abuse prevention, caregiver support, elder rights and legal assistance, employment training, chronic disease prevention, and several other activities. Through this wide array of programs and thousands of service providers across states, territories, and Tribal organizations, the Older Americans Act serves millions of older adults each year.
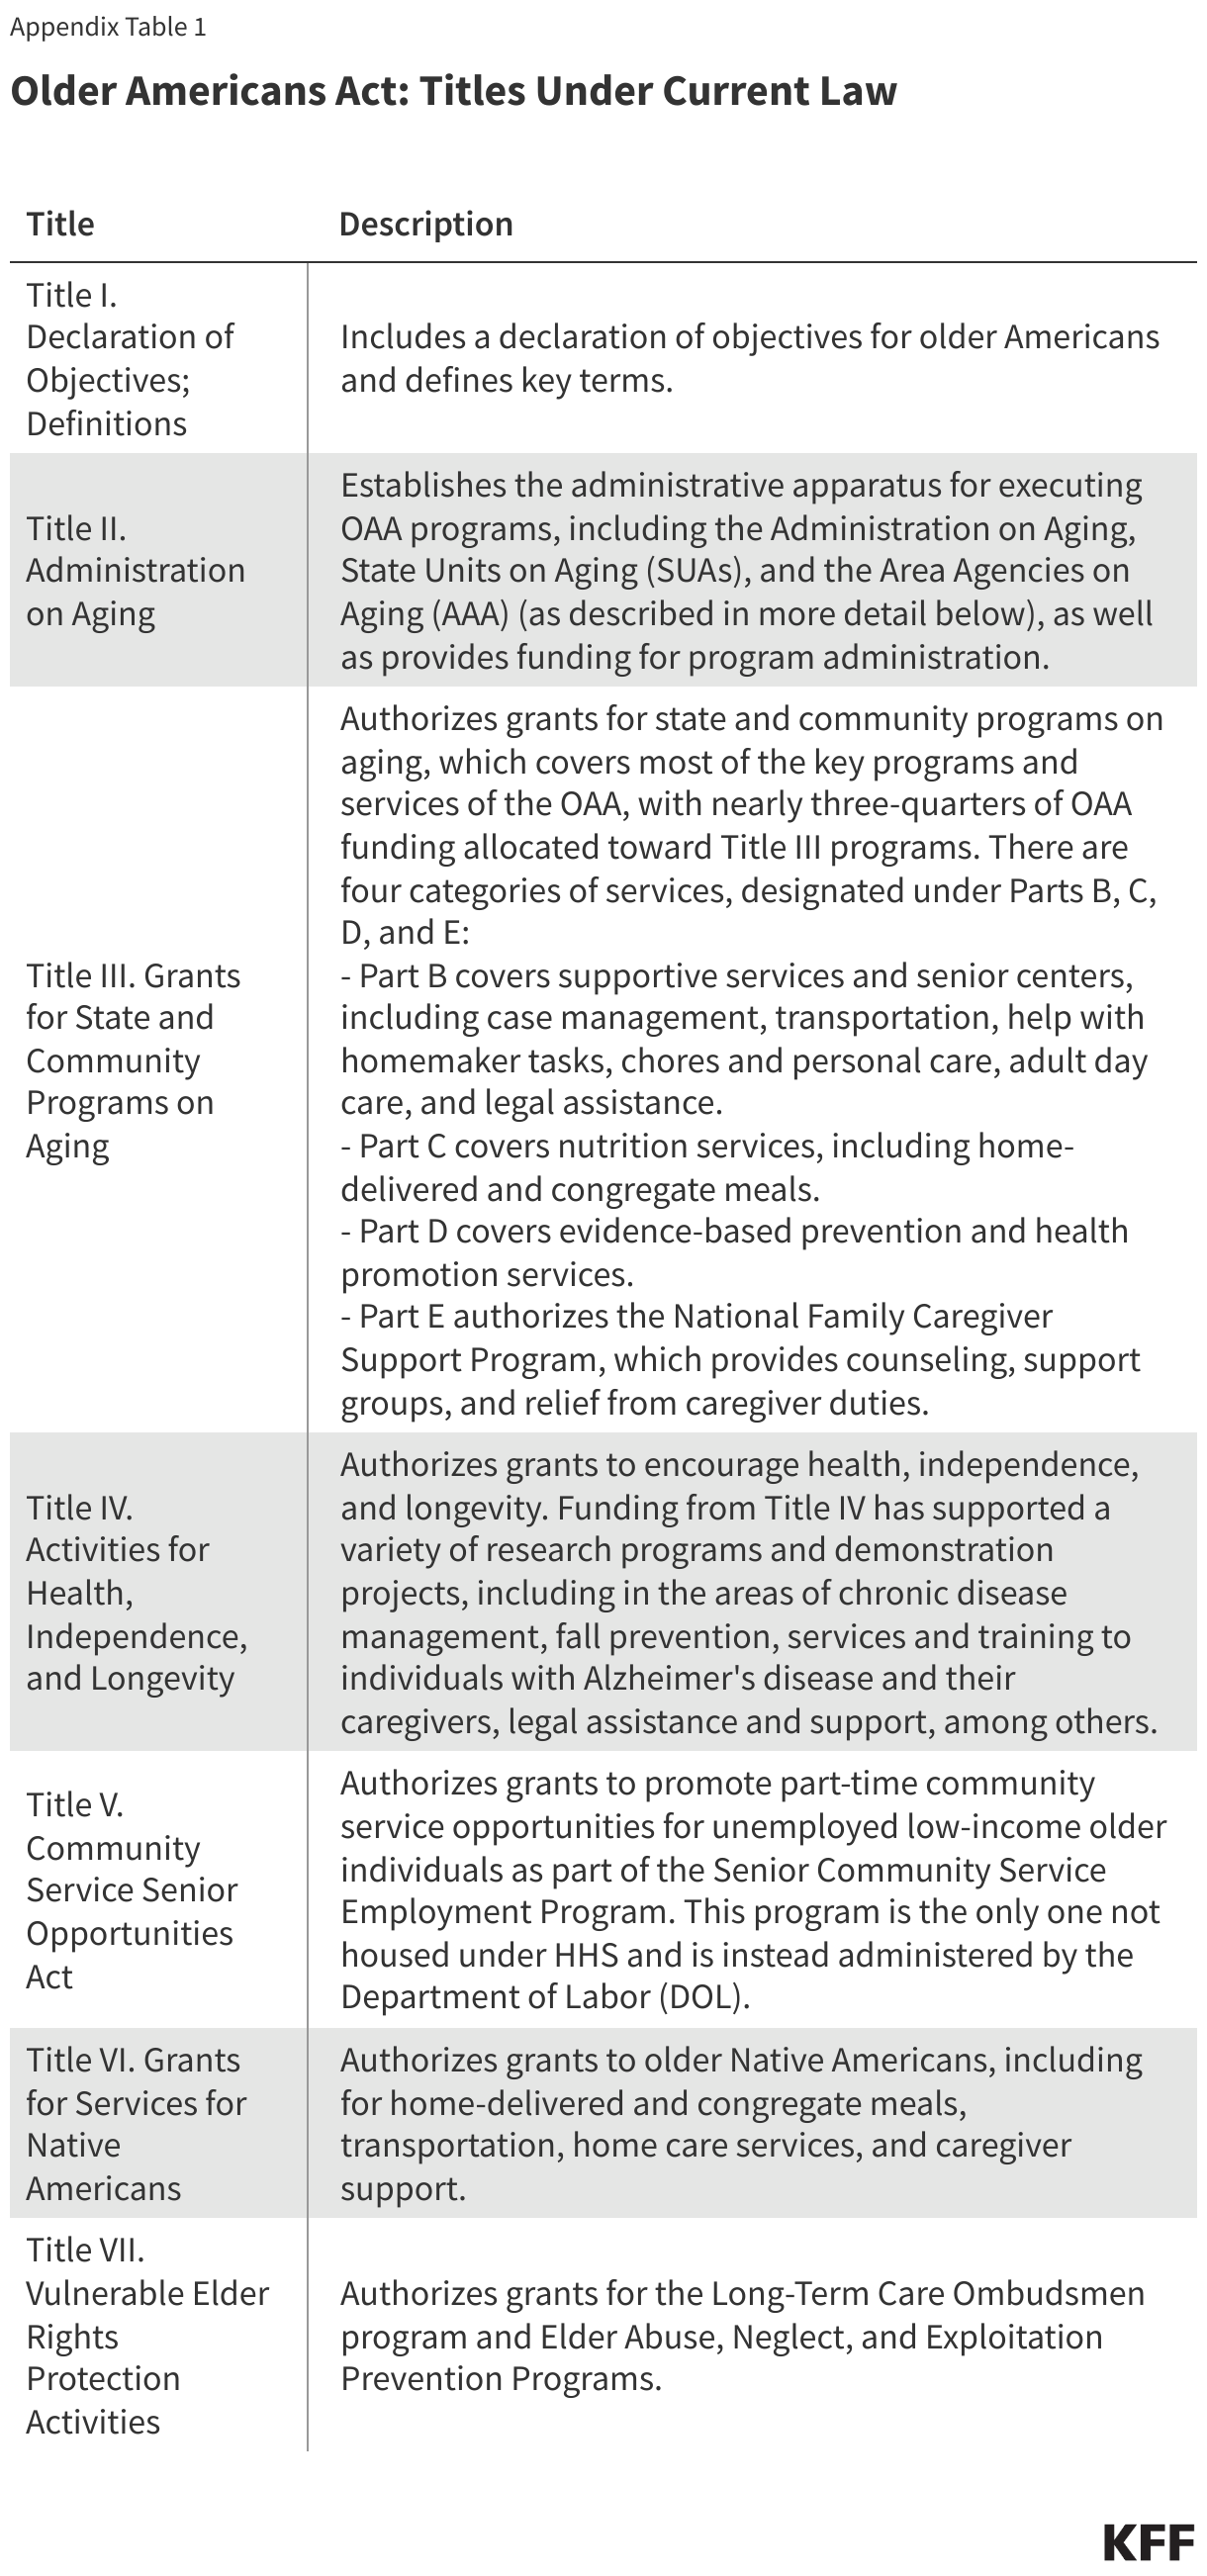
The Older Americans Act statute includes seven titles that describe the administration and funding of the programs (Appendix Table 1). Most of the funding for Older Americans Act services falls under Title III of the Act, which authorizes grants for state and community programs on aging to provide:
- supportive services and senior centers, including case management, transportation, help with homemaker tasks, chores and personal care, adult day care, and legal assistance,
- nutrition services, including home-delivered and congregate meals,
- evidence-based prevention and health promotion services, and
- the National Family Caregiver Support Program, which provides counseling, support groups, and relief from caregiver duties.
Separately, the law also provides funding for grants to encourage health, independence, and longevity, including research programs and demonstration projects in the areas of chronic disease management and fall prevention, for example; grants to promote part-time community service employment opportunities for unemployed low-income older individuals; grants for the provision of nutrition, supportive services, and caregiver support services to older American Indians, Alaska Natives, and Native Hawaiians; grants for the Long-Term Care Ombudsman program and Elder Abuse, Neglect, and Exploitation Prevention Programs, and funding for Aging and Disability Resource Centers. (Most but not all of these programs have been administered by the Administration on Aging within ACL; the community service program is administered by the Department of Labor, while Aging and Disability Resource Centers have been administered by the Center for Innovation and Partnership within ACL.)
How is the Older Americans Act administered and what has been the role of ACL?
Under the organizational structure that existed prior to the Trump administration’s restructuring at HHS, the Administration on Aging within ACL was the office that authorized Older Americans Act grant funds to 56 State Units on Aging and hundreds of Tribal organizations. The State Units on Aging are state- and territorial-level agencies that use funds to carry out policy and development responsibilities and the administration of Older Americans Act activities. The State Units on Aging in turn work with and distribute funding to over 600 local Area Agencies on Aging, which operate within a designated planning area within the state or territory. The Area Agencies on Aging are local entities that either directly, or through contracts with nearly 30,000 local service providers, oversee a system for the delivery of Older Americans Act services.
While not part of the Older Americans Act, the State Health Insurance Assistance Program (SHIP) has also been administered by ACL through its Office of Healthcare Information and Counseling. The SHIPs provide local, in-depth, and objective counseling and assistance to Medicare beneficiaries and their families to help them make informed decisions about their care and benefits. There are 54 SHIPs, organized at the state and territory level, which may have different names in different areas. SHIP staff and volunteers provide unbiased one-on-one counseling, information, and education about Medicare benefits, how Medicare works, different Medicare coverage options, low-income assistance programs, and other types of information. The provision of SHIP services is free and not limited by income or other beneficiary demographic criteria.
How many people are helped by Older Americans Act programs?
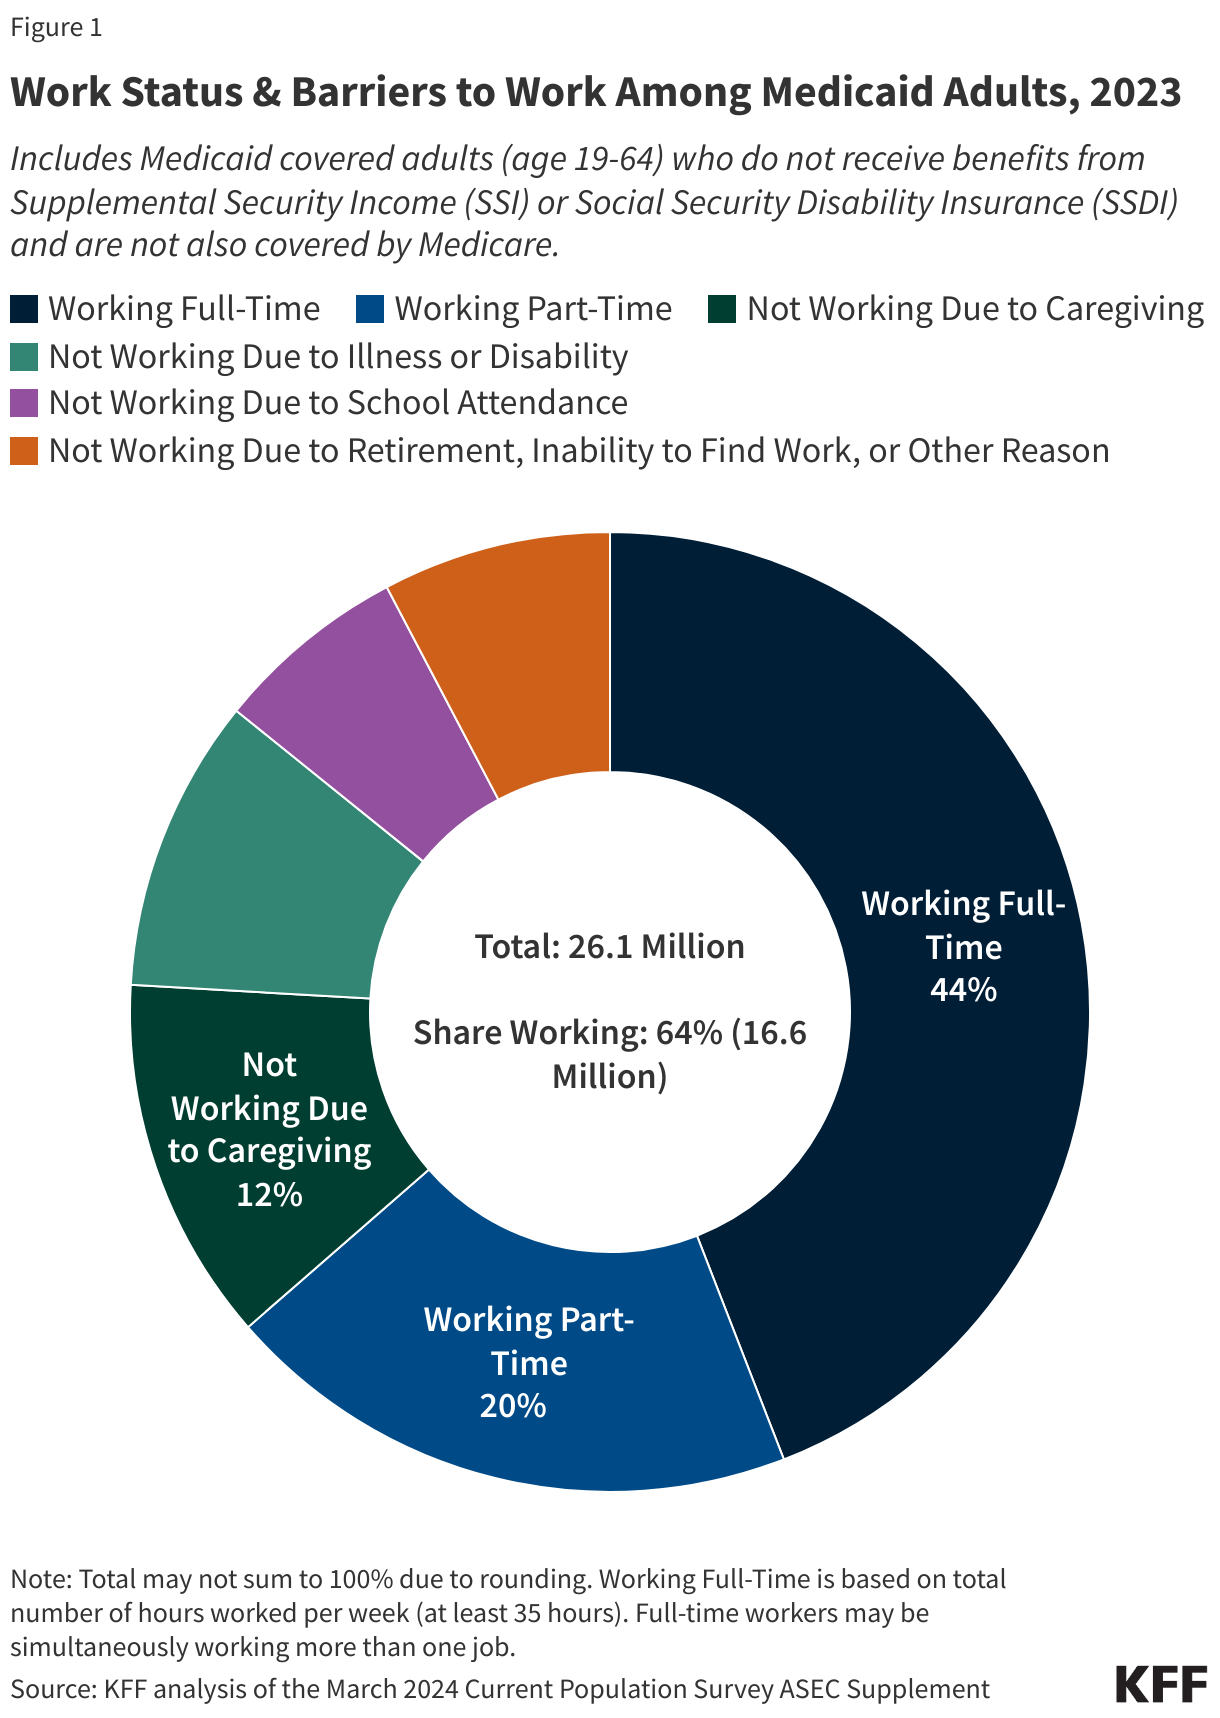
Millions of older adults are helped by programs funded by the Older Americans Act each year – one in six, according to HHS. Focusing in on programs and services funded under Title III, which represent nearly three-quarters of total Older Americans Act funding in FY 2024, more than 12 million individuals were served by select Title III programs in FY 2023 (the most recent year available), according to data from ACL (Figure 1).
Among the programs funded under Title III of the Older Americans Act, the number of older adults served and services provided in 2023 include:
- Nutrition counseling and education: Nearly 2 million individuals received some type of nutrition counseling and education, including 1.9 million individuals who received nutrition education to support food and nutrition choices, with 2.8 million education sessions provided, and 23,000 individuals who received nutrition counseling, which includes one-on-one counseling provided by a registered dietitian who provides options and methods for improving nutrition, with 37,000 hours of nutritional counseling provided.
- Meals: Well over 1 million older adults benefited from home-delivered or congregate meals provided through the Older Americans Act, including 1.3 million who received home-delivered meals and 1.3 million who received congregate meals, with 181 million home-delivered meals and 57 million congregate meals provided to these individuals.
- Case management: 413,000 older adults received case management services, such as developing care plans, coordinating services among providers, and conducting follow-ups as needed, with 3 million hours of case management provided to these individuals.
- Legal assistance: 216,000 individuals received legal assistance, including legal advice and counseling, with 1 million hours of legal assistance provided.
- Homemaker services: 116,000 people received homemaker services, which include assistance with routine tasks such as preparing meals, shopping for personal items, managing money, or doing light housework, with 12.4 million homemaker hours provided.
- Personal care: 77,000 older adults received personal care services, which include services that help individuals with activities of daily living, with 11.3 million hours of personal care provided to these individuals.
- Assisted transportation services: 34,000 individuals received assistance with transportation services, which include escorts for people who have difficulties using regular transportation, with 1.2 million one-way assisted transportation trips provided.
- Chore services: 27,000 people were provided with chore services, including assistance with such activities as heavy housework, yard work, or sidewalk maintenance, with 599,000 hours of assistance provided to these individuals.
- Adult day care services: 8,300 individuals received adult day care services, which include personal care for dependent older adults in a supervised group setting, such as social and recreational activities, training, and counseling, with 2.6 million hours of adult day care services provided to these individuals.
- Caregiving services: The National Family Caregiver Support Program provides help to thousands of caregivers. According to the HHS FY 2024 Congressional Budget Justification for ACL, 779,000 caregivers were served by the National Family Caregiver Support Program in 2021 (data not shown). In addition, the National Family Caregiver Support Program provided 50,245 family caregivers with nearly 4.9 million hours of temporary relief from their caregiving responsibilities and provided an estimated 1.5 million contacts to caregivers, assisting them in locating services from various agencies. Furthermore, the program provided an estimated 92,865 family caregivers with counseling, peer support, and training to better cope with the stresses of caregiving.
- Other services: that are provided under Title III include transportation, such as to medical appointments or the grocery store; information and assistance, such as about opportunities and services that are available in the community; and outreach on how to use existing services and benefits. Data on the number of people who used each of these services are not collected but data on the number of services provided is collected. According to ACL, in 2023, 13.1 million one-way transportation trips were provided from one location to another, and nearly 11 million contacts for information and assistance were provided.
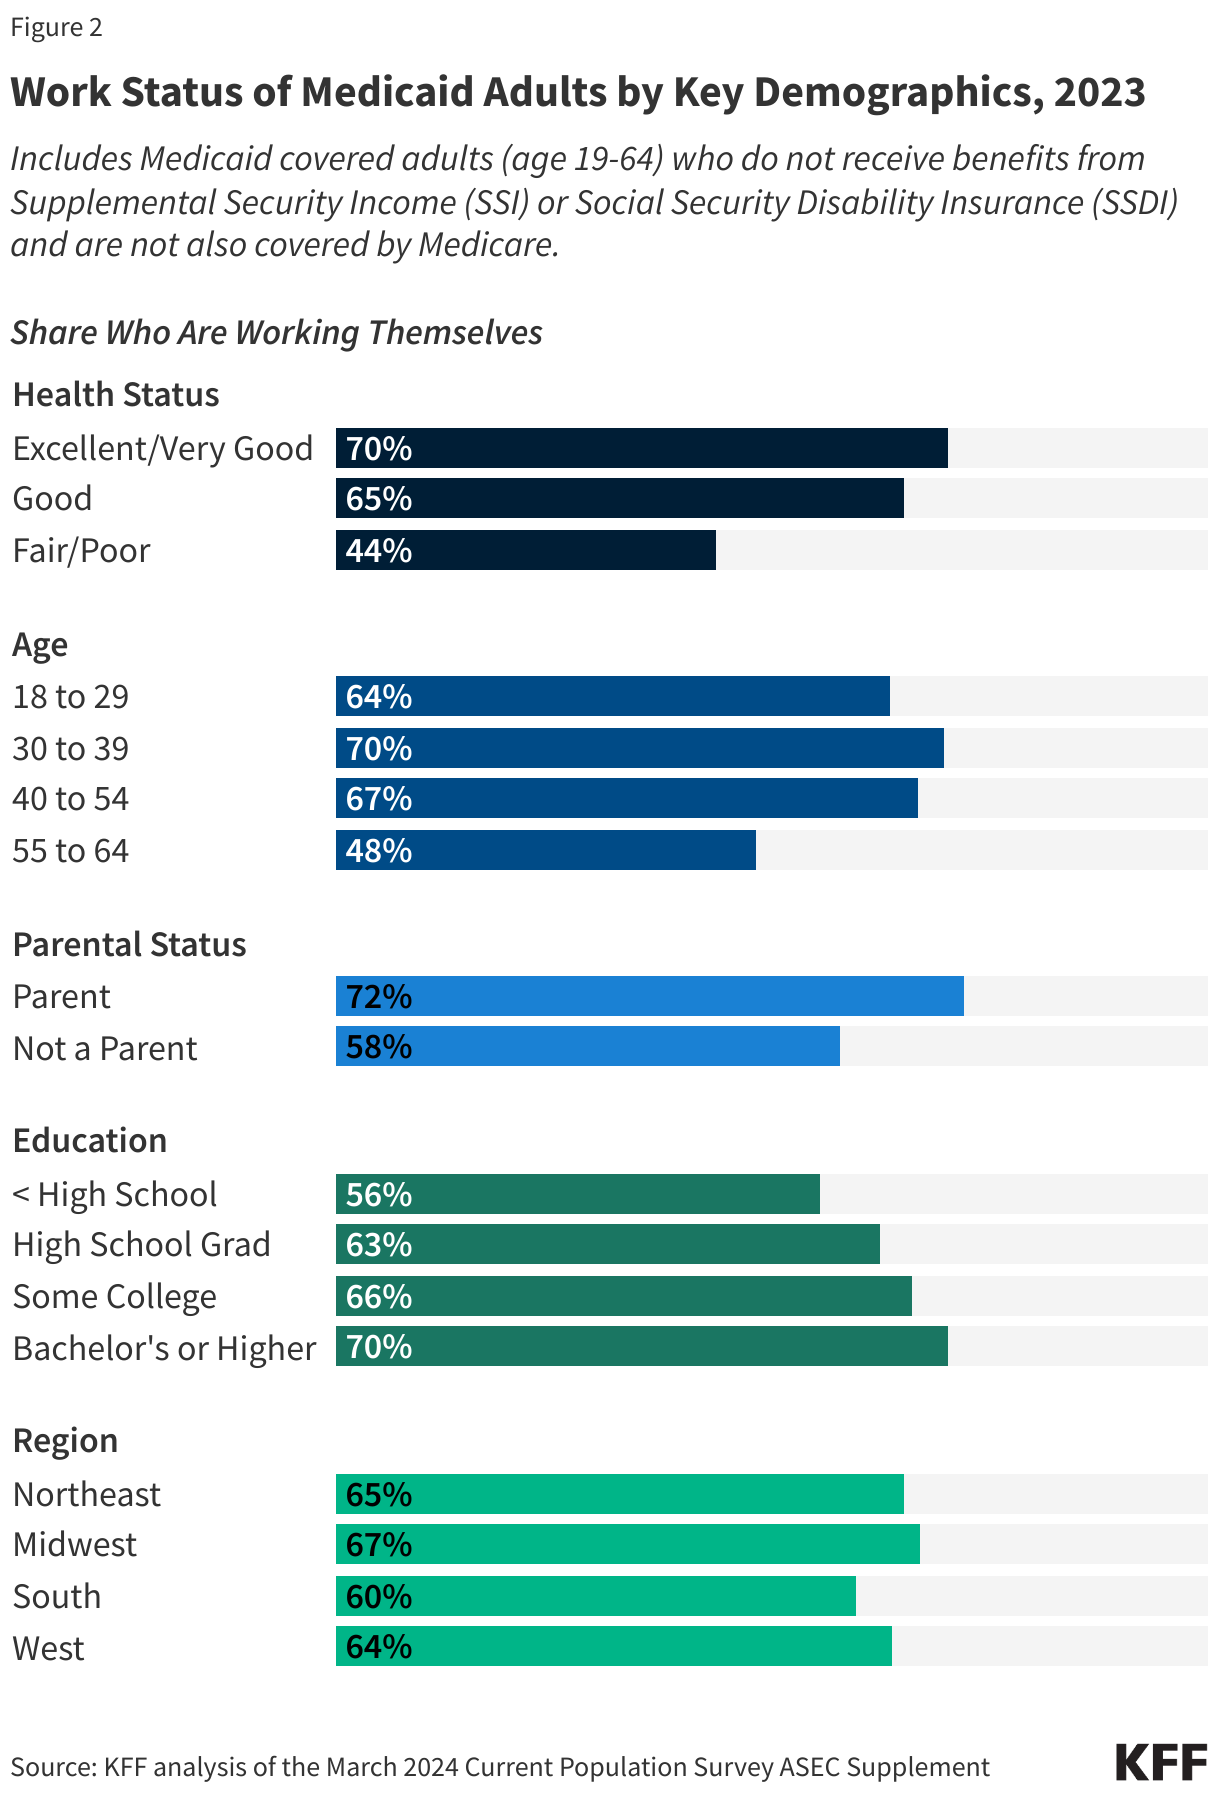
Among older adults receiving select Title III services in 2023, 39% were living below the poverty level, 33% were people of color, and 29% lived in rural areas, according to data from ACL (Figure 2).
In addition to the programs mentioned above that are provided under Title III, the Older Americans Act provides funding for other programs that help older adults, including:
- Long-Term Care Ombudsman program: Each state is required to operate a statewide Office of the Long-Term Care Ombudsman to improve the quality of life and care of residents of long-term care facilities, including individuals living in nursing homes and assisted living facilities, and advocate on behalf of residents. In 2024, paid and volunteer staff conducted nearly 380,000 visits to over 50,000 long-term care facilities, investigated over 205,000 complaints, and provided more than 710,000 instances of information and assistance to individuals and facility staff. These services help support the 6 million people on Medicaid who live in institutional settings.
- Social supports for older American Indians, Alaska Natives, and Native Hawaiians: As part of the social supports provided to older American Indians, Alaska Natives, and Native Hawaiians under the Older Americans Act, in 2022, nearly 600,000 transportation services were provided, including for visits to medical providers, picking up prescriptions, and staying active within their communities, an estimated 4 million home-delivered and 2.1 million congregate meals were provided, and nearly 780,000 hours of information, referral, and outreach services were provided including help with navigating health care systems and payers, making appointments, and coordinating access to services.
What are the trends in funding for Older Americans Act programs?
Federal funding for all Older Americans Act services was $2.37 billion for FY 2024, the most recent year of fully appropriated funding, with nearly three-quarters (72%) devoted to grants to states and community providers for nutrition services, caregiver support services, and other social services (Figure 3).
This is roughly the same as funding from the prior fiscal year ($2.38 billion in FY 2023) but an increase of 23% since FY 2014, when Older Americans Act funding totaled $1.92 billion – or average annual growth of 2.1% (not adjusted for inflation; Figure 4). (Congress provided temporary increases in supplemental funding to Older Americans Act programs due the COVID-19 public health emergency in FY 2020 and FY 2021.)
However, the growth of overall funding for Older Americans Act programs and services has not kept pace with the growth in the older adult population in the U.S. Between 2014 and 2024, the number of people ages 60 and older increased by 28% (2.5% average annual growth), from 64.7 million to 82.5 million. As a result, Older Americans Act funding per person age 60 or older decreased slightly over these years by 3%, though this reduction would be larger in inflation-adjusted dollars, with general prices rising by 33% (2.9% annually, on average) over this period.

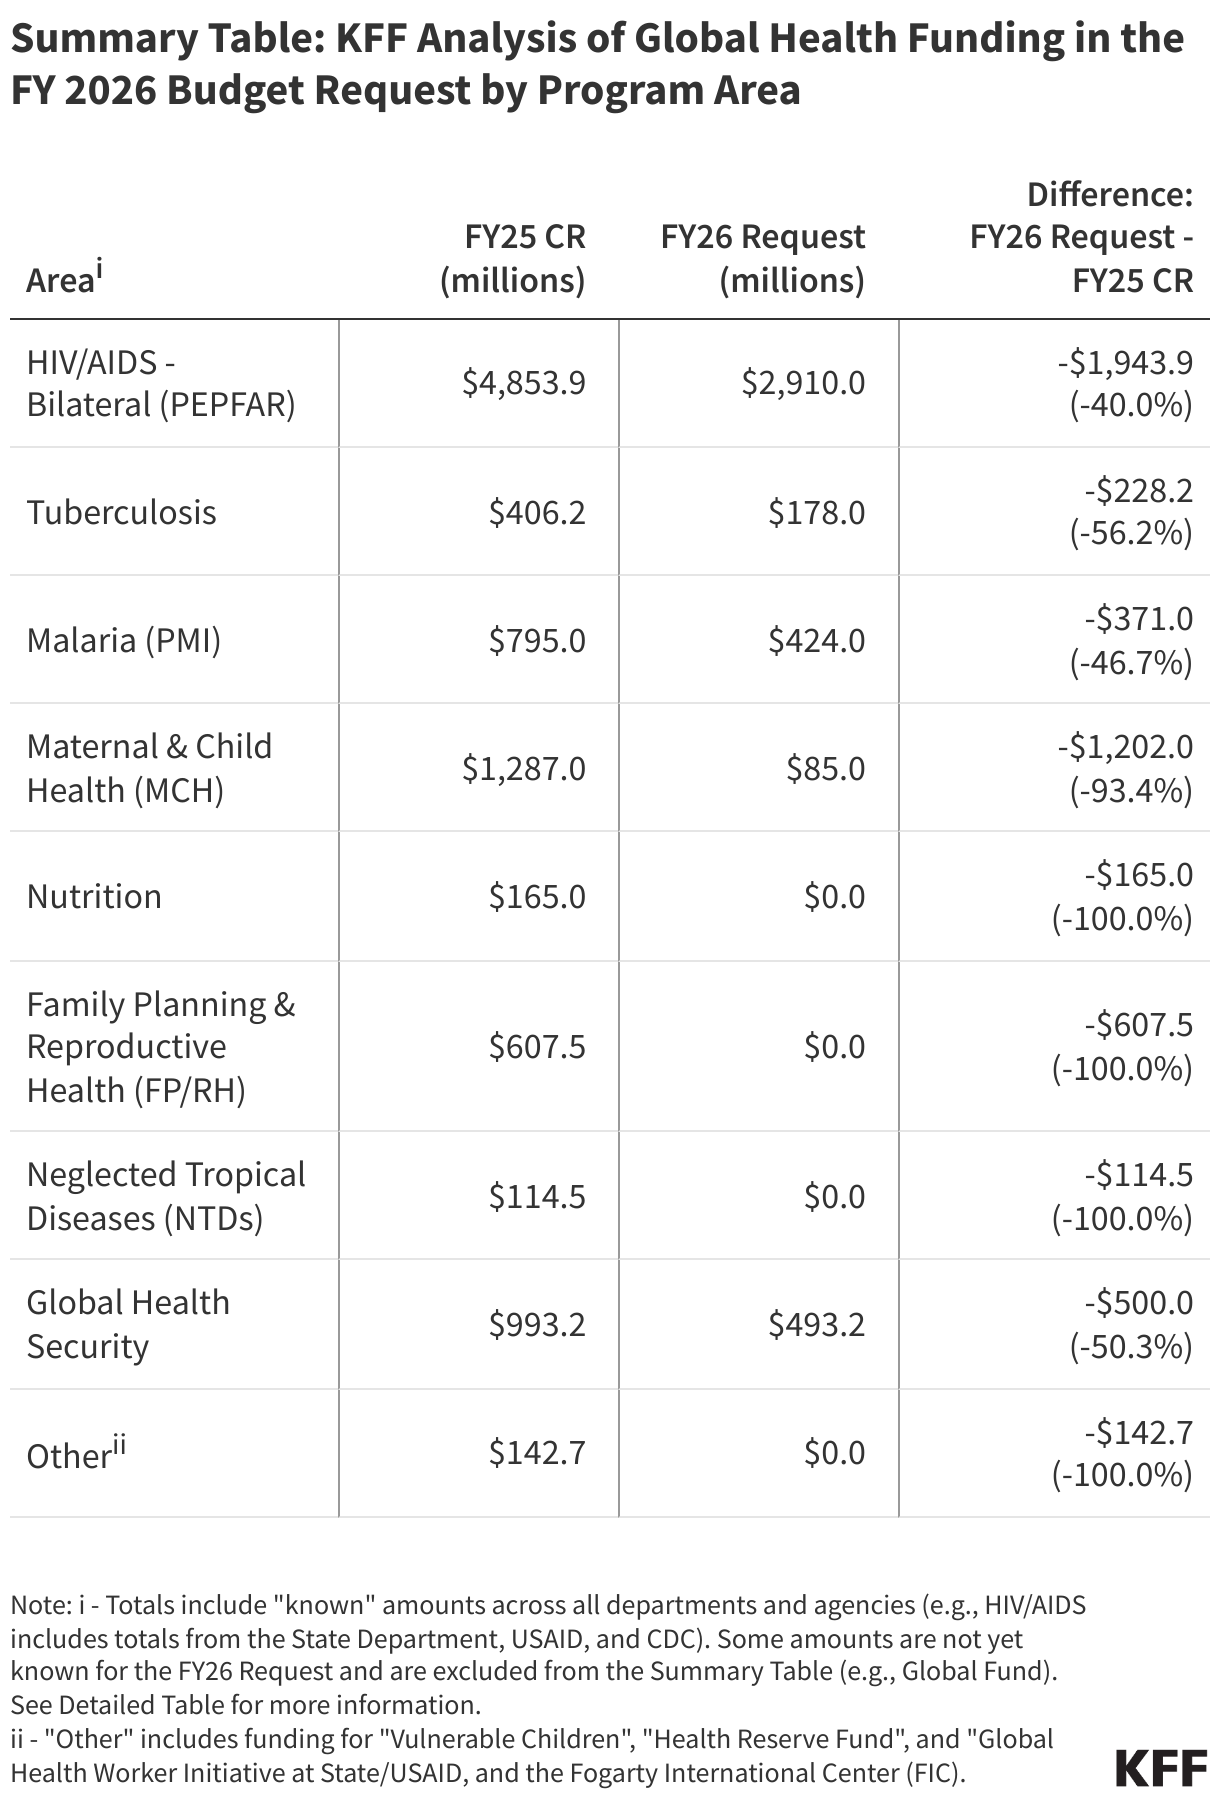
Based on the president’s proposed FY 2026 HHS budget, the Trump administration is proposing level funding for most Older Americans Act programs and services, including home and community-based supportive services, nutrition programs, caregiver and family support services, and programs for the protection of vulnerable older adults, like the Long-Term Care Ombudsman program. This would mean another year with no funding increases for these programs, unless Congress provides funding above current levels in new appropriations legislation or in reauthorizing the Older Americans Act. The Trump administration proposes a reduction in funding for the Alzheimer’s disease program, from $32 million in FY 2025 to $17 million in FY 2026, along with the elimination of chronic disease self-management education.
The Older Americans Act has been reauthorized and amended several times since its passage in 1965, including most recently through the Supporting Older Americans Act of 2020, which authorized appropriations for Older Americans Act programs through FY 2024. On December 10, 2024, the Senate unanimously passed the Older Americans Act Reauthorization Act of 2024, which would have reauthorized the Act for another 5 years. The House introduced legislation that included the Older Americans Act reauthorization but this funding deal fell apart under pressure from then President-elect Donald Trump. Subsequent legislation passed by Congress to keep the government funded until March 14, 2025, and then again through September 30, 2025, did not include reauthorization of the Older Americans Act.
How could the Trump Administration’s reorganization of HHS affect Older Americans Act programs?
According to the HHS FY 2026 Budget in Brief, ACL is being dissolved and its functions integrated into the newly established Administration for Children, Families, and Communities (ACFC). Programs being shifted include home and community based supportive services, nutrition programs, aging network support activities, family caregiver support services, caregiver support services for American Indians, Alaska Natives, and Native Hawaiians, Alzheimer’s disease supportive services, and prevention of elder abuse and neglect. The administration has not yet released a detailed budget justification for the new ACFC, which makes it difficult to assess whether funding for any of the former ACL’s functions will be scaled back or terminated.
Staffing reductions within HHS and at the former ACL specifically could hinder the ability of remaining staff to oversee Older Americans Act programs. Staff cuts reported to have occurred within ACL’s budget office, evaluation and policy teams, and regional offices could impede the effective administration of Older Americans Act programs, the provision of grant funding to state and local entities, and the direct delivery of services to older adults.
This work was supported in part by The John A. Hartford Foundation. KFF maintains full editorial control over all of its policy analysis, polling, and journalism activities.
Appendix