Health care affordability has been a longstanding concern in the U.S., including among older adults, many of whom have relatively low incomes and modest assets to help cover the cost of premiums and medical bills. Medicare offers important financial protection by providing health insurance coverage to 69 million people in the U.S., including adults age 65 or older and younger adults with long-term disabilities. However, Medicare-covered benefits are subject to cost-sharing requirements and exclude some commonly needed services, like dental and vision care. Additionally, traditional Medicare does not include a cap on out-of-pocket costs.
To help with cost sharing for Medicare-covered services and fill the gaps in Medicare benefits, most Medicare beneficiaries supplement traditional Medicare with additional coverage, such as Medigap, for which policyholders pay an average of $2,600 annually in premiums. More than half of people with Medicare are currently enrolled in Medicare Advantage, which offers extra benefits not available in traditional Medicare and caps annual out-of-pocket costs. Medicare beneficiaries may also have employer- or union-sponsored coverage or Medicaid coverage in addition to Medicare. But some people on Medicare lack additional coverage and face the risk of incurring high out-of-pocket costs if they need expensive medical care.
This analysis documents the different sources of coverage among people with Medicare and examines variation in beneficiary characteristics by source of coverage. The analysis draws on data from the Centers for Medicare & Medicaid Services (CMS) March 2025 Medicare Advantage enrollment files and the 2023 Medicare Current Beneficiary Survey (see Methods for details).
Key Facts
- More than half of all people with Medicare Part A and Part B (54% or 34.1 million in 2025) are enrolled in a Medicare Advantage plan, while 46% (28.7 million) are in traditional Medicare.
- Among traditional Medicare beneficiaries, most (87%) had additional coverage that supplements Medicare benefits in 2023, but 3.5 million beneficiaries (13%) lacked additional coverage, leaving them at risk of facing high out-of-pocket costs for medical care.
- Overall, 14.1 million beneficiaries (23% of all Medicare beneficiaries) had employer or union sponsored coverage in 2023, either as a supplement to traditional Medicare or through group Medicare Advantage plans, another 12.2 million (20%) had Medicaid in addition to traditional Medicare or Medicare Advantage, and the same number, 12.2 million (20%) had a Medicare supplemental insurance (Medigap) policy to supplement traditional Medicare.
- The number and share of Medicare beneficiaries with Medicaid (dual eligible individuals) were substantially higher in Medicare Advantage (68%) than traditional Medicare (32% in 2023).
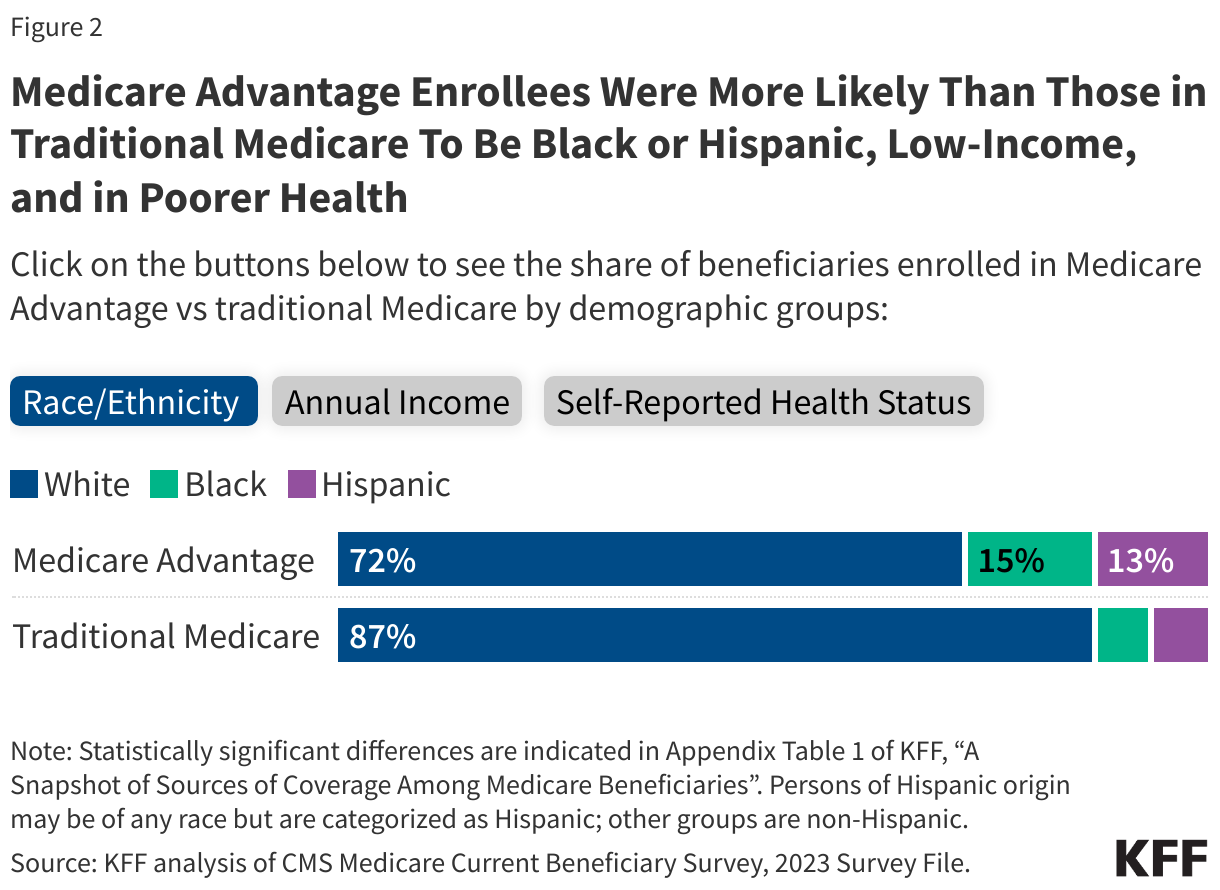
- Compared to traditional Medicare beneficiaries, Medicare Advantage enrollees were more likely to be Black or Hispanic, have incomes below $20,000 per person, and self-report fair or poor health.
More than Half of All People with Medicare Are Enrolled in Medicare Advantage
In 2025, Medicare Advantage covered more than half (54%) of Medicare beneficiaries with both Medicare Parts A and B, or 34.1 million out of about 62.8 million people. Of the total number of Medicare Advantage enrollees in 2025, most (62%) are enrolled in individual plans available to all Medicare beneficiaries. One in five (21%) are in Special Needs Plans (SNPs) and 17% are enrolled in employer- or union-sponsored group plans, where employers or unions contract with an insurer and Medicare pays the insurer a fixed amount per enrollee to provide benefits covered by Medicare. (These estimates are based on March 2025 Medicare Advantage plan enrollment data and therefore differ from those discussed below and shown in Figure 1, which are based on the 2023 Medicare Current Beneficiary Survey (MCBS)).
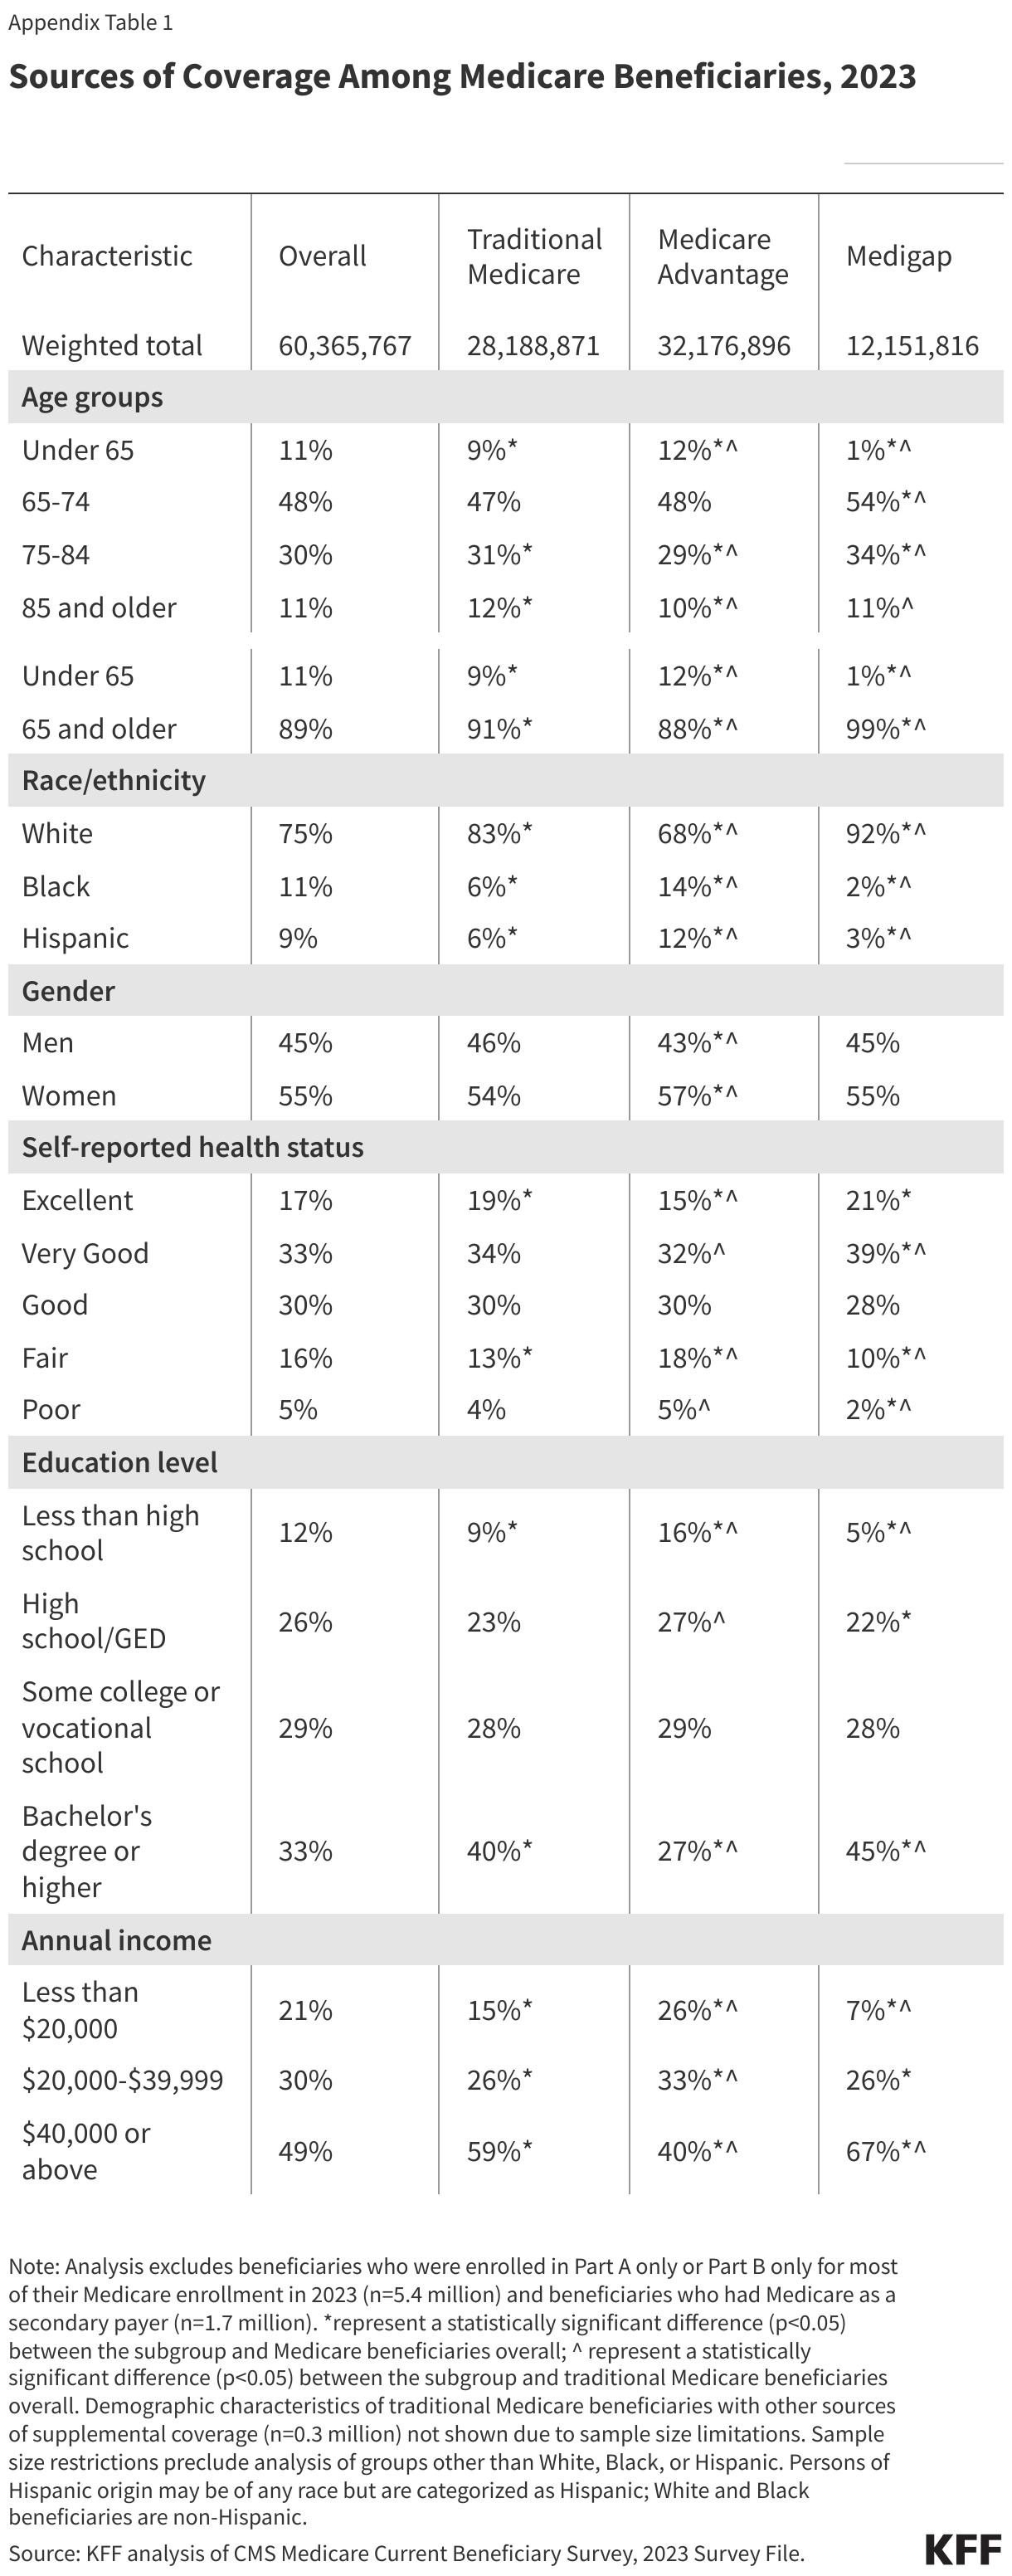
Compared to traditional Medicare beneficiaries, Medicare Advantage enrollees were more likely to be Black or Hispanic, have incomes below $20,000 per person, and self-report fair or poor health, based on KFF analysis of the 2023 MCBS (Figure 2, Appendix Table 1).
Medicare Advantage Enrollees Were More Likely Than Those in Traditional Medicare To Be Black or Hispanic, Low-Income, and in Poorer Health
Click on the buttons below to see the share of beneficiaries enrolled in Medicare Advantage vs traditional Medicare by demographic groups:
Race/Ethnicity
Annual Income
Self-Reported Health Status
Statistically significant differences are indicated in Appendix Table 1 of KFF, “A Snapshot of Sources of Coverage Among Medicare Beneficiaries”. Persons of Hispanic origin may be of any race but are categorized as Hispanic; other groups are non-Hispanic.
KFF analysis of CMS Medicare Current Beneficiary Survey, 2023 Survey File.
Medicare Advantage Enrollees Were More Likely Than Those in Traditional Medicare To Be Black or Hispanic, Low-Income, and in Poorer Health
Click on the buttons below to see the share of beneficiaries enrolled in Medicare Advantage vs traditional Medicare by demographic groups:
Race/Ethnicity
Annual Income
Self-Reported Health Status
Statistically significant differences are indicated in Appendix Table 1 of KFF, “A Snapshot of Sources of Coverage Among Medicare Beneficiaries”. Persons of Hispanic origin may be of any race but are categorized as Hispanic; other groups are non-Hispanic.
KFF analysis of CMS Medicare Current Beneficiary Survey, 2023 Survey File.
Most Medicare Beneficiaries in Traditional Medicare Have Additional Coverage that Supplements Medicare Benefits
In 2023, most (87%) people in traditional Medicare had some form of additional coverage, either through Medigap (43%), employer coverage (29%), Medicaid (14%), or another source (1%),based on estimates from the MCBS.But 3.5 million Medicare beneficiaries in traditional Medicare (13%) had no additional coverage. A more detailed discussion of these types of coverage and the characteristics of people with each coverage type is below.
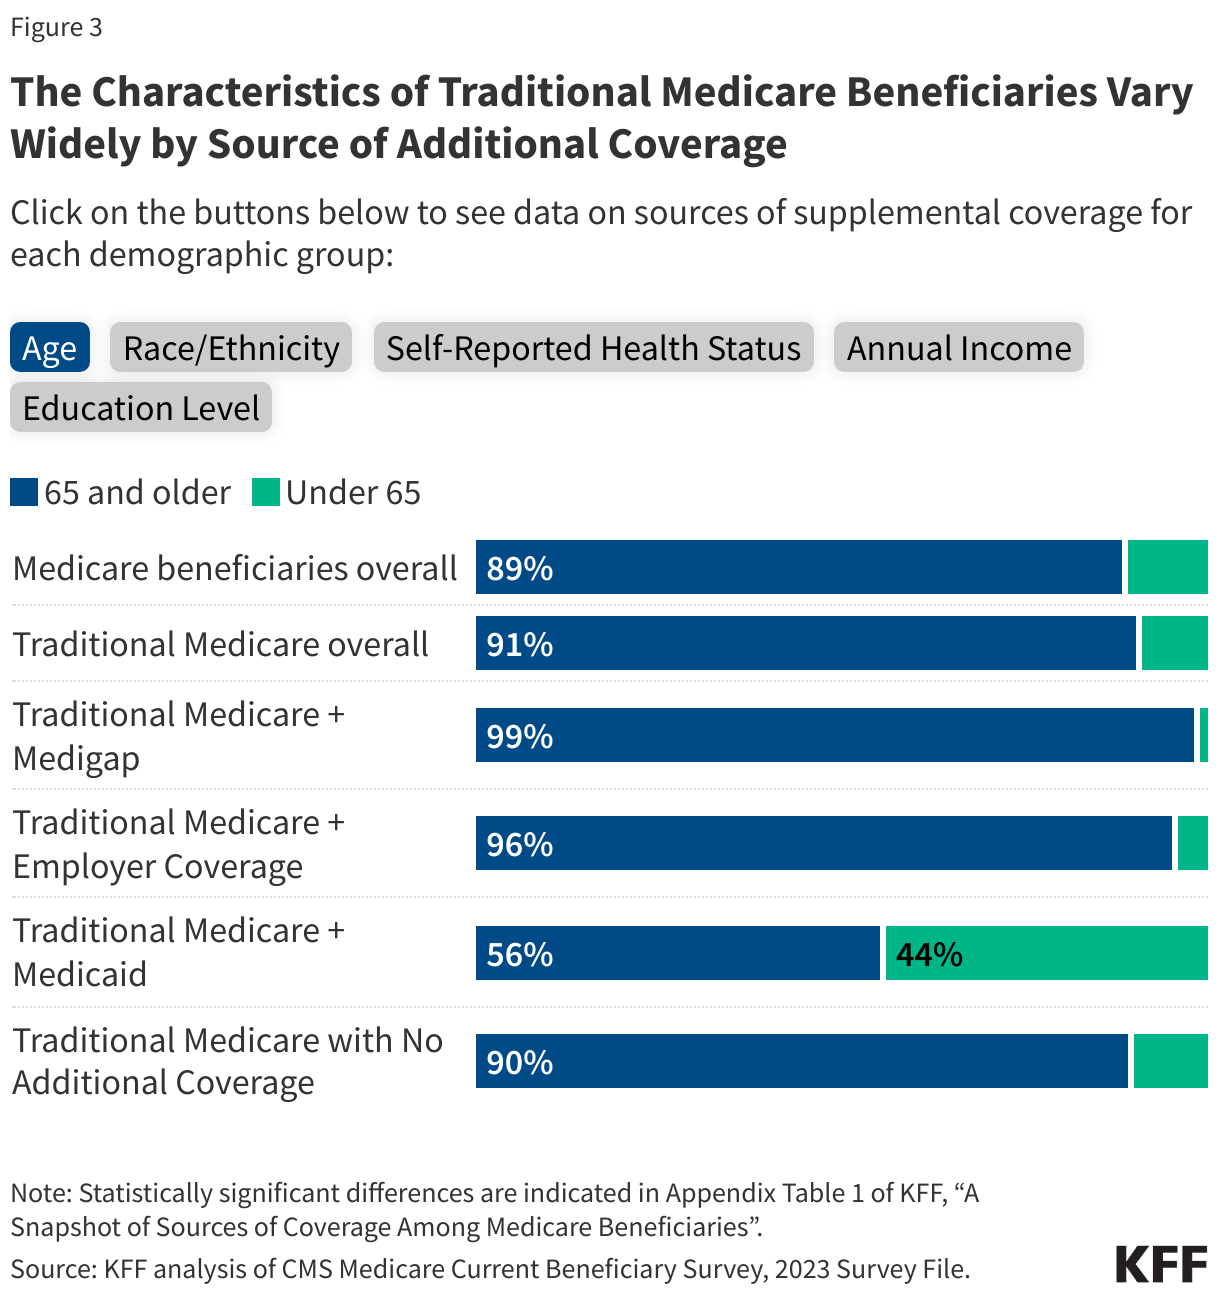
The Characteristics of Traditional Medicare Beneficiaries Vary Widely by Source of Additional Coverage
Click on the buttons below to see data on sources of supplemental coverage for each demographic group:
Age
Race/Ethnicity
Self-Reported Health Status
Annual Income
Education Level
Statistically significant differences are indicated in Appendix Table 1 of KFF, “A Snapshot of Sources of Coverage Among Medicare Beneficiaries”. Sample size restrictions preclude analysis of groups other than White, Black, or Hispanic. Persons of Hispanic origin may be of any race but are categorized as Hispanic; White and Black beneficiaries are non-Hispanic.
KFF analysis of CMS Medicare Current Beneficiary Survey, 2023 Survey File.
The Characteristics of Traditional Medicare Beneficiaries Vary Widely by Source of Additional Coverage
Click on the buttons below to see data on sources of supplemental coverage for each demographic group:
Age
Race/Ethnicity
Self-Reported Health Status
Annual Income
Education Level
Statistically significant differences are indicated in Appendix Table 1 of KFF, “A Snapshot of Sources of Coverage Among Medicare Beneficiaries”.
KFF analysis of CMS Medicare Current Beneficiary Survey, 2023 Survey File.
The Characteristics of Traditional Medicare Beneficiaries Vary Widely by Source of Additional Coverage
Click on the buttons below to see data on sources of supplemental coverage for each demographic group:
Age
Race/Ethnicity
Self-Reported Health Status
Annual Income
Education Level
Statistically significant differences are indicated in Appendix Table 1 of KFF, “A Snapshot of Sources of Coverage Among Medicare Beneficiaries”.
KFF analysis of CMS Medicare Current Beneficiary Survey, 2023 Survey File.
The Characteristics of Traditional Medicare Beneficiaries Vary Widely by Source of Additional Coverage
Click on the buttons below to see data on sources of supplemental coverage for each demographic group:
Age
Race/Ethnicity
Self-Reported Health Status
Annual Income
Education Level
Statistically significant differences are indicated in Appendix Table 1 of KFF, “A Snapshot of Sources of Coverage Among Medicare Beneficiaries”.
KFF analysis of CMS Medicare Current Beneficiary Survey, 2023 Survey File.
Nearly a Quarter of Medicare Beneficiaries Have Employer Coverage, Either through Group Medicare Advantage Plans or in Addition to Traditional Medicare
In total, 14.1 million Medicare beneficiaries – nearly a quarter (23%) of Medicare beneficiaries overall – had some form of employer or union-sponsored health insurance coverage in 2023 in addition to Medicare Part A and Part B. Of this total, 8.2 million beneficiaries had employer coverage in addition to traditional Medicare (29% of beneficiaries in traditional Medicare), while 5.9 million beneficiaries were enrolled in Medicare Advantage employer group plans. Most people with both Medicare Part A and Part B and employer- or union-sponsored coverage are retirees with Medicare as their primary source of health insurance coverage.
Compared to traditional Medicare beneficiaries overall in 2023, beneficiaries with employer or union-sponsored coverage in addition to traditional Medicare were more likely to have higher incomes ($40,000 or greater per person), a bachelor’s degree or higher, self-report excellent or good health, and were less likely to be under age 65 (Figure 3, Appendix Table 1).
Separately, in 2023, an estimated 5.8 million Medicare beneficiaries had Part A only, a group that primarily includes people who were active workers (either themselves or their spouses) and had primary coverage from an employer plan and Medicare as a secondary payer. People with Part A only cannot enroll in a Medicare Advantage plan, so people with coverage through Medicare Advantage employer group plans are likely to be retired.
Four in 10 People in Traditional Medicare Have a Medigap Supplemental Policy
Medicare supplement insurance, also known as Medigap, covered 2 in 10 (20%) Medicare beneficiaries overall, or 43% of those in traditional Medicare (12.2 million beneficiaries) in 2023. Medigap policies, sold by private insurance companies, fully or partially cover Medicare Part A and Part B cost-sharing requirements, including deductibles, copayments, and coinsurance. Medigap limits the financial exposure of Medicare beneficiaries and provides protection against catastrophic medical expenses. However, Medigap premiums can be costly and can rise with age, among other factors, depending on the state in which they are regulated.
Compared to all traditional Medicare beneficiaries in 2023, beneficiaries with Medigap were more likely to be White, have higher annual incomes (above $20,000 per person), self-report excellent, very good, or good health, and have a bachelor’s degree or higher (Figure 3, Appendix Table 1).
In contrast, a smaller share of traditional Medicare beneficiaries under age 65 have a Medigap policy than traditional Medicare beneficiaries ages 65 and older (1% versus 9%). Federal law provides a 6-month guarantee issue protection for adults ages 65 and older when they first enroll in Medicare Part B if they want to purchase a supplemental Medigap policy, but these protections do not extend to adults under the age of 65 with disabilities, and most states do not require insurers to issue Medigap policies to beneficiaries under age 65.
One in Five People with Medicare Also Have Coverage from Medicaid, with More Covered Under Medicare Advantage than Traditional Medicare
Medicaid, the federal-state program that provides health and long-term services and supports coverage to low-income people, was a source of supplemental coverage for 12.2 million Medicare beneficiaries with low incomes and modest assets in 2023, or 20% of all Medicare beneficiaries. A larger number and share of Medicare beneficiaries with Medicaid (known as dual-eligible individuals) were enrolled in a Medicare Advantage plan (8.3 million, or 68% of all dual-eligible individuals) than in traditional Medicare (4.0 million, or 32%) (Appendix Table 1). For these beneficiaries, Medicaid typically pays the Medicare Part B premium and may also pay a portion of Medicare deductibles and other cost-sharing requirements. Most dual-eligible individuals are also eligible for full Medicaid benefits, including long-term services and supports.
Compared to traditional Medicare beneficiaries overall in 2023, dual-eligible individuals were more likely to have low incomes and relatively low education levels, self-report fair or poor health, identify as Black or Hispanic, and be under the age of 65 (Figure 3, Appendix Table 1).
3.5 Million Traditional Medicare Beneficiaries Lack Supplemental Coverage
In 2023, 3.5 million Medicare beneficiaries – 6% overall –and 13% of beneficiaries in traditional Medicare – had no supplemental health insurance coverage. Traditional Medicare beneficiaries with no additional coverage are fully exposed to Medicare’s cost-sharing requirements, which would mean paying a $1,736 deductible for a hospital stay in 2026, daily copayments for extended hospital and skilled nursing facility stays, and a $283 deductible plus 20% coinsurance for physician visits and other outpatient services. (These costs are in addition to the standard Part B premium amount of $203 per month in 2026). Beneficiaries in traditional Medicare without additional coverage also face the risk of high annual out-of-pocket costs because there is no cap on out-of-pocket spending for Part A and B services in traditional Medicare, unlike in Medicare Advantage plans.
Beneficiaries in traditional Medicare without any form of additional coverage were more likely to have modest incomes (between $20,000 and $40,000 per person) compared to all traditional Medicare beneficiaries in 2023 (Figure 3, Appendix Table 1). Medicare beneficiaries with modest incomes have limited ability to afford Medigap premiums and are unlikely to qualify for Medicaid because their income and assets are not low enough to meet eligibility guidelines.
The number and share of traditional Medicare beneficiaries without any form of supplemental coverage has steadily declined in recent years. Between 2018 and 2023, the number of traditional Medicare beneficiaries without supplemental coverage declined from 5.6 million beneficiaries (10% of the total Medicare population, or 17% of those in traditional Medicare) to 3.5 million (6% of the total Medicare population, or 13% of those in traditional Medicare). This decline likely reflects the increase in Medicare Advantage enrollment over time, which has increased from 20 million in 2018 to 34 million in 2025.
Methods
For information on Medicare Advantage enrollment in 2025, this analysis draws on data from the Centers for Medicare & Medicaid Services (CMS) Medicare Advantage Enrollment files for March 2025 (See Methods of KFF, “Medicare Advantage in 2025: Enrollment Update and Key Trends” for more details). For information on sources of supplemental coverage within traditional Medicare and Medicare Advantage, this analysis draws on data from the CMS Medicare Current Beneficiary Survey (MCBS) 2023 Survey file data (the most recent year available), a nationally representative survey of Medicare beneficiaries.
Sources of coverage are determined based on the source of coverage held for the most months of Medicare enrollment in 2023. The analysis includes 60.4 million people with both Part A and B Medicare coverage in 2023 (weighted), including beneficiaries living in the community and in facilities. It excludes beneficiaries who were enrolled in Part A only (typically active workers or their spouses with employer or union sponsored coverage) or Part B only for most of their Medicare enrollment in 2023 (weighted n=5.4 million) and beneficiaries who had Medicare as a secondary payer (weighted n=1.7 million). (Because this analysis reflects coverage held for most months, it shows fewer Medicare beneficiaries with Part A-only or Part B-only coverage than the CMS Medicare enrollment dashboard, which reports 5.8 million with Part A only in 2023). The analysis also focuses only on coverage for Part A and Part B benefits, not Part D. This analysis of the MCBS accounted for the complex sampling design of the survey.
In this brief, the number and share of beneficiaries enrolled with both Medicare and Medicaid coverage (dual-eligible individuals) do not align with other KFF estimates due to differences in data sources and methods used. In other KFF publications, the number of dual-eligible individuals is estimated using a 100% CCW sample and include dual-eligible individuals with at least one month of enrollment in Medicare Part A or Part B, rather than those with coverage for most months of the year. The analysis in this brief is based on the MCBS because this data source provides a wider array of demographic and health status indicators than the CCW.
All reported differences in the text are statistically significant; results from all statistical tests are reported with p<0.05 considered statistically significant. Because estimates reported in the text and figures are rounded to the nearest whole number, some estimates may not sum to overall totals due to rounding.
Appendix





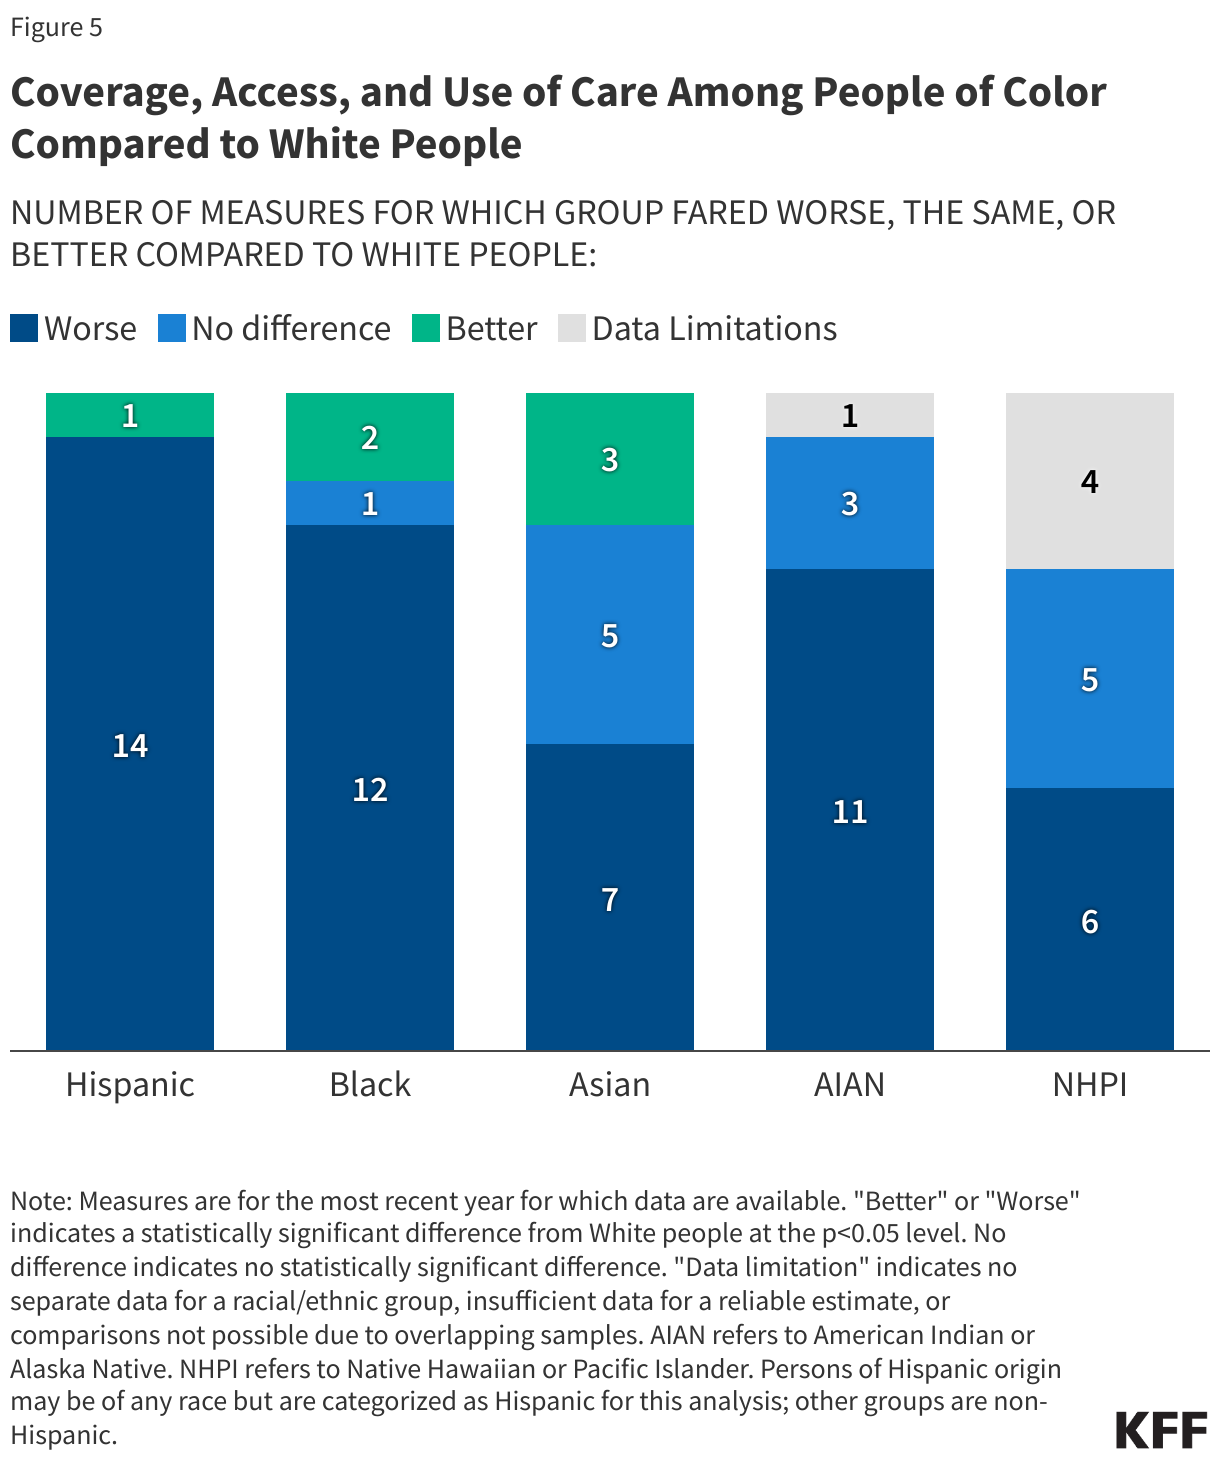
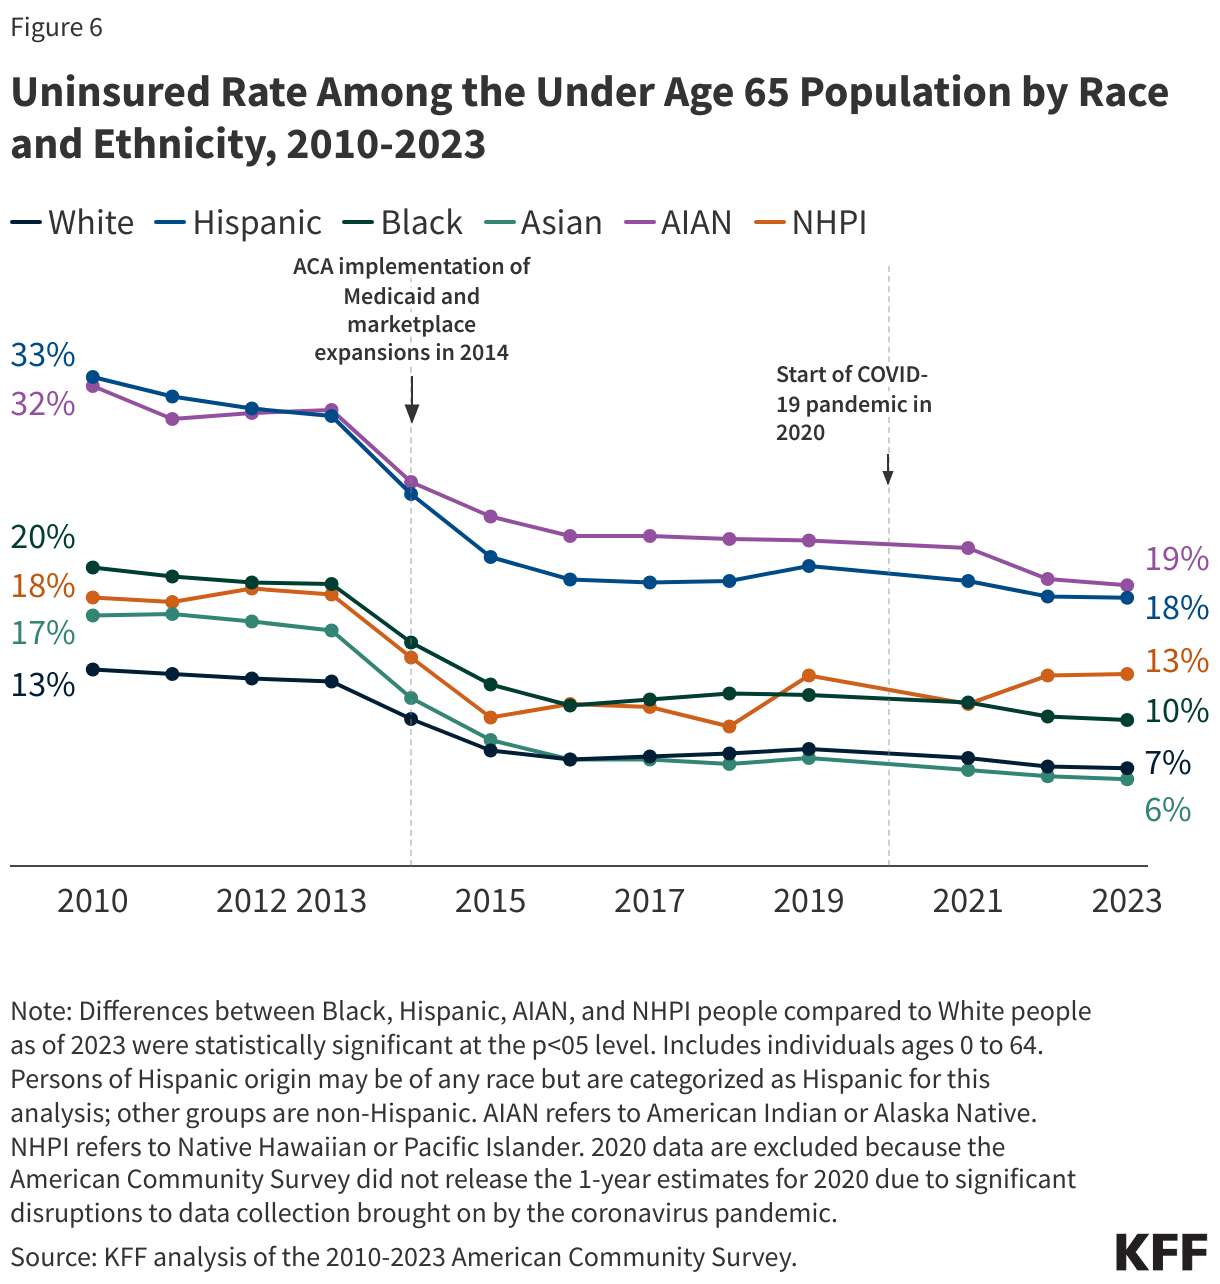
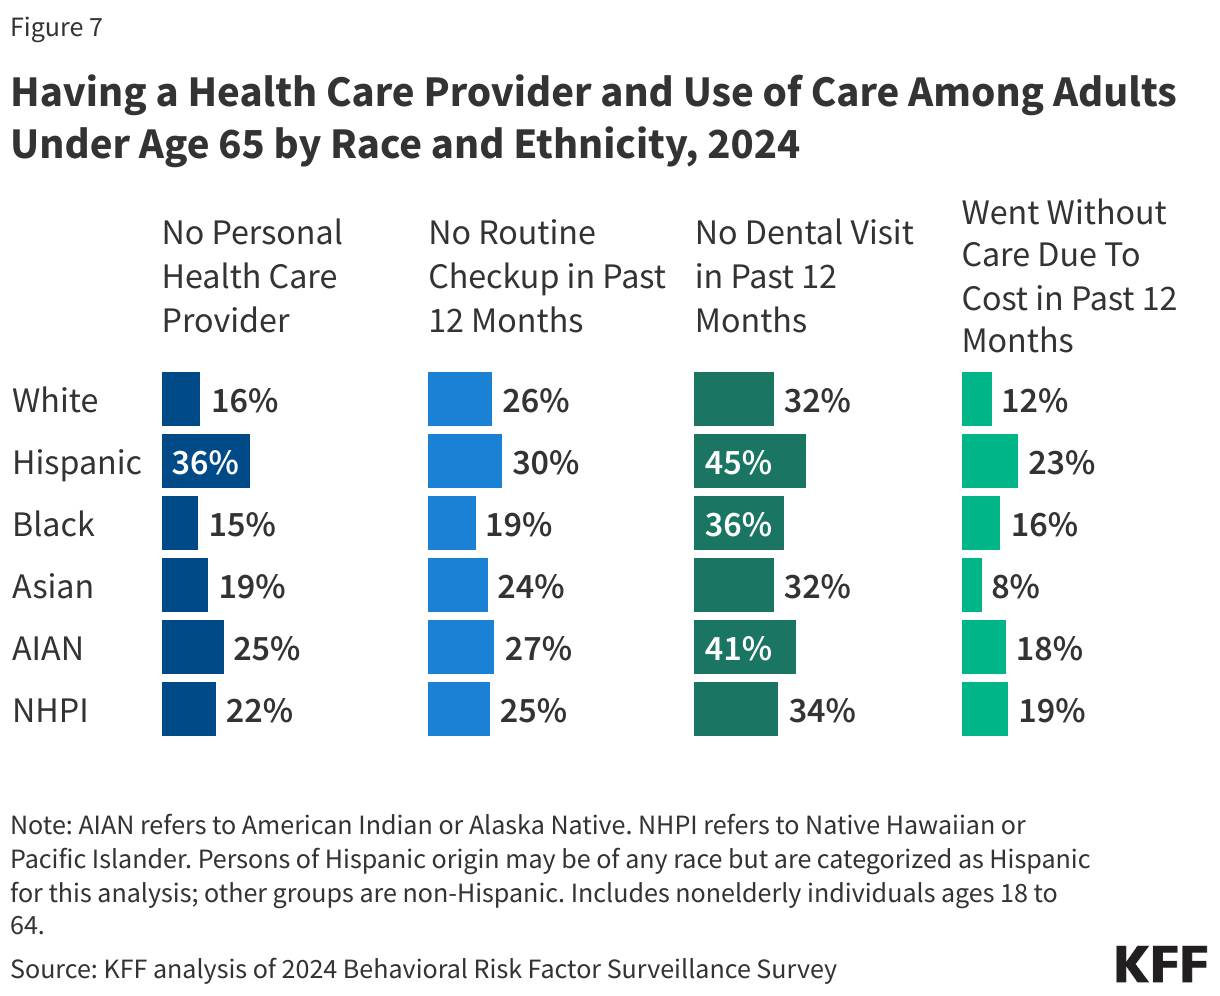
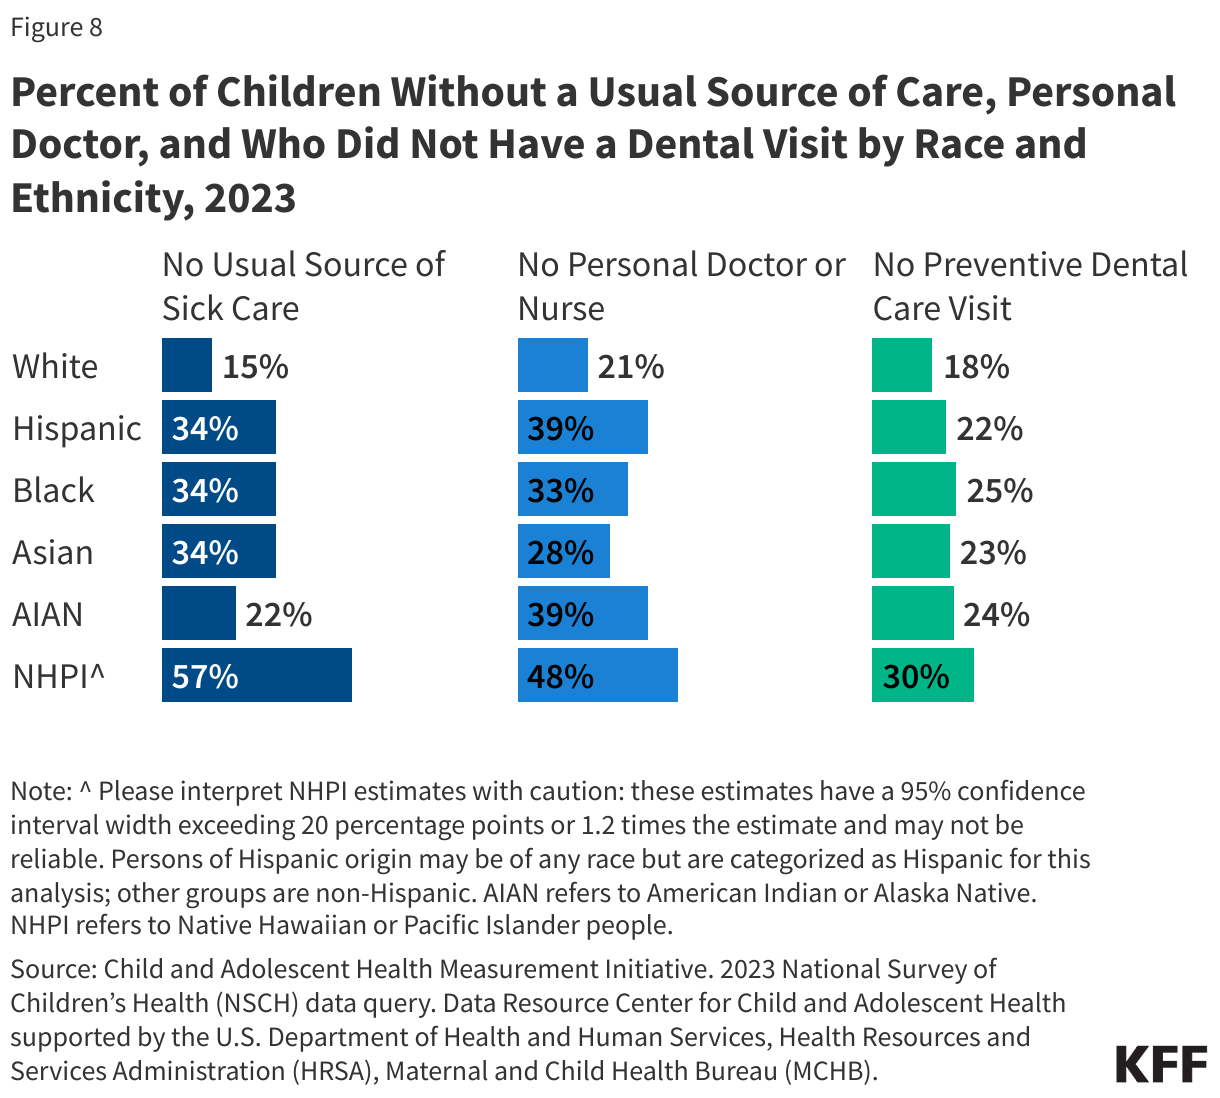

Social and Economic Factors
Racial Disparities in Social and Economic Factors
Social and economic factors like socioeconomic status, education, immigration status, language, neighborhood and physical environment, employment, and social support networks, as well as access to health care have an important influence on health. There has been extensive research and recognition that addressing social, economic, and environmental factors is important for addressing health disparities. Research also shows how racism and discrimination drive inequities across these factors and impact health and well-being.
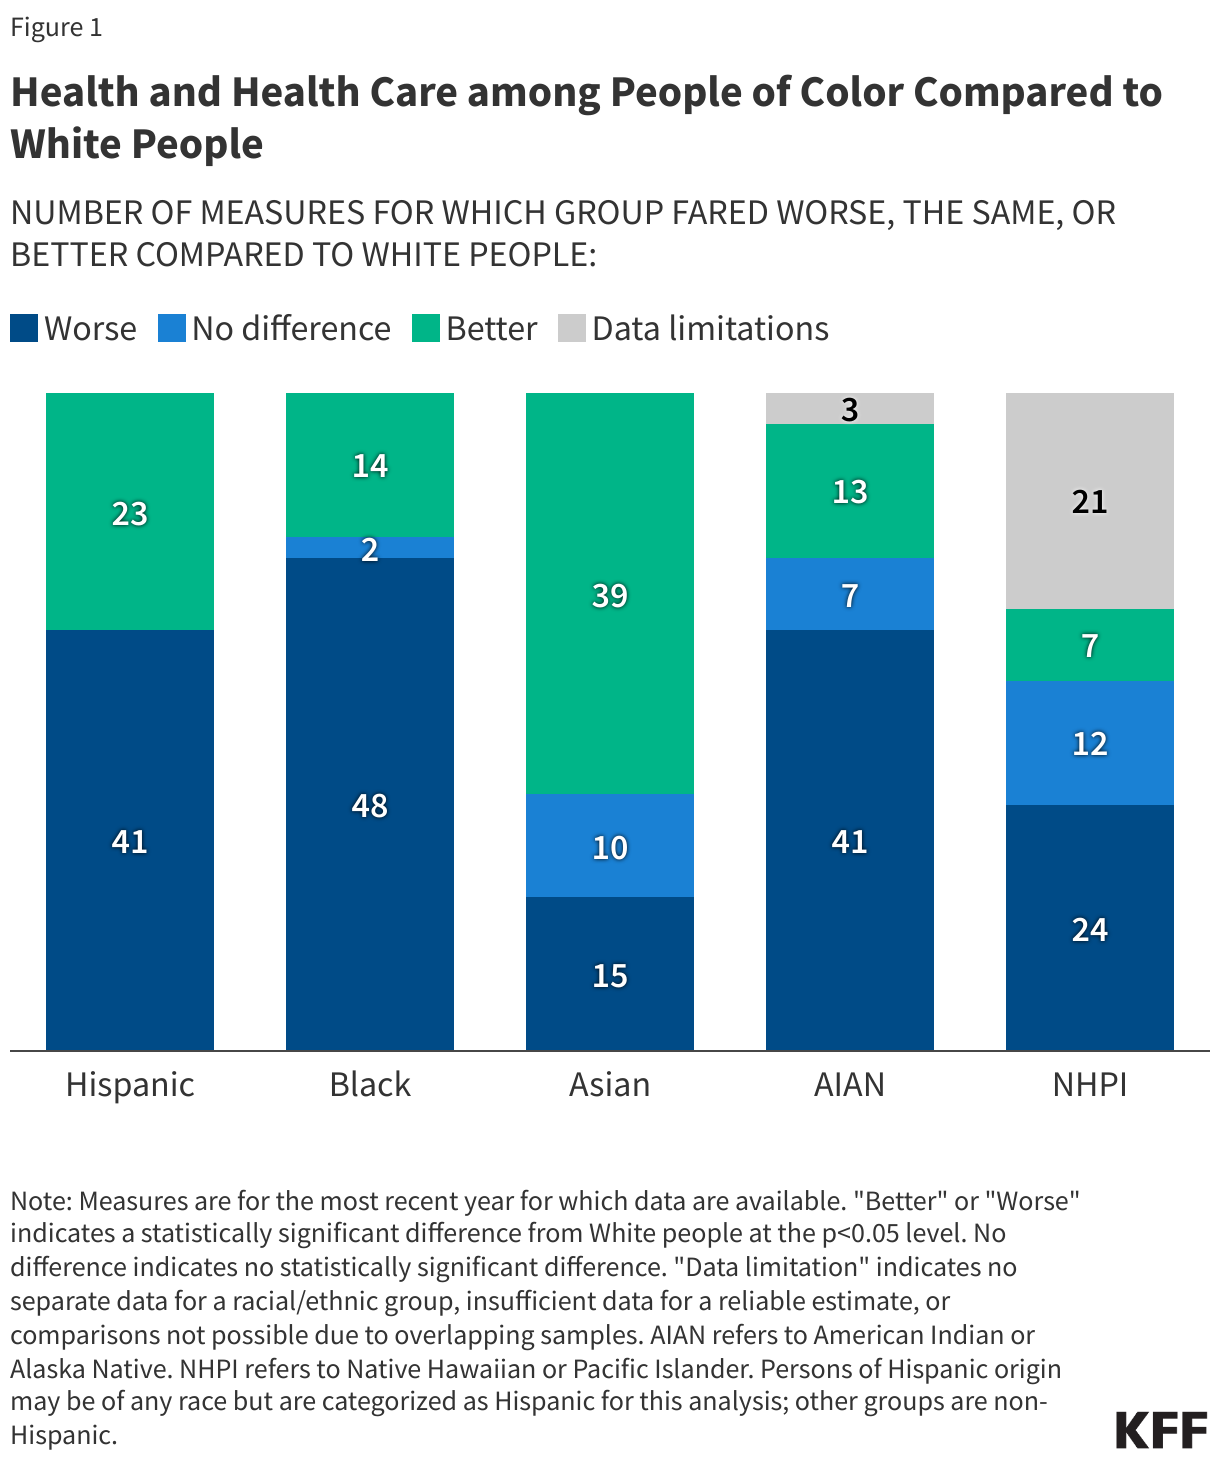
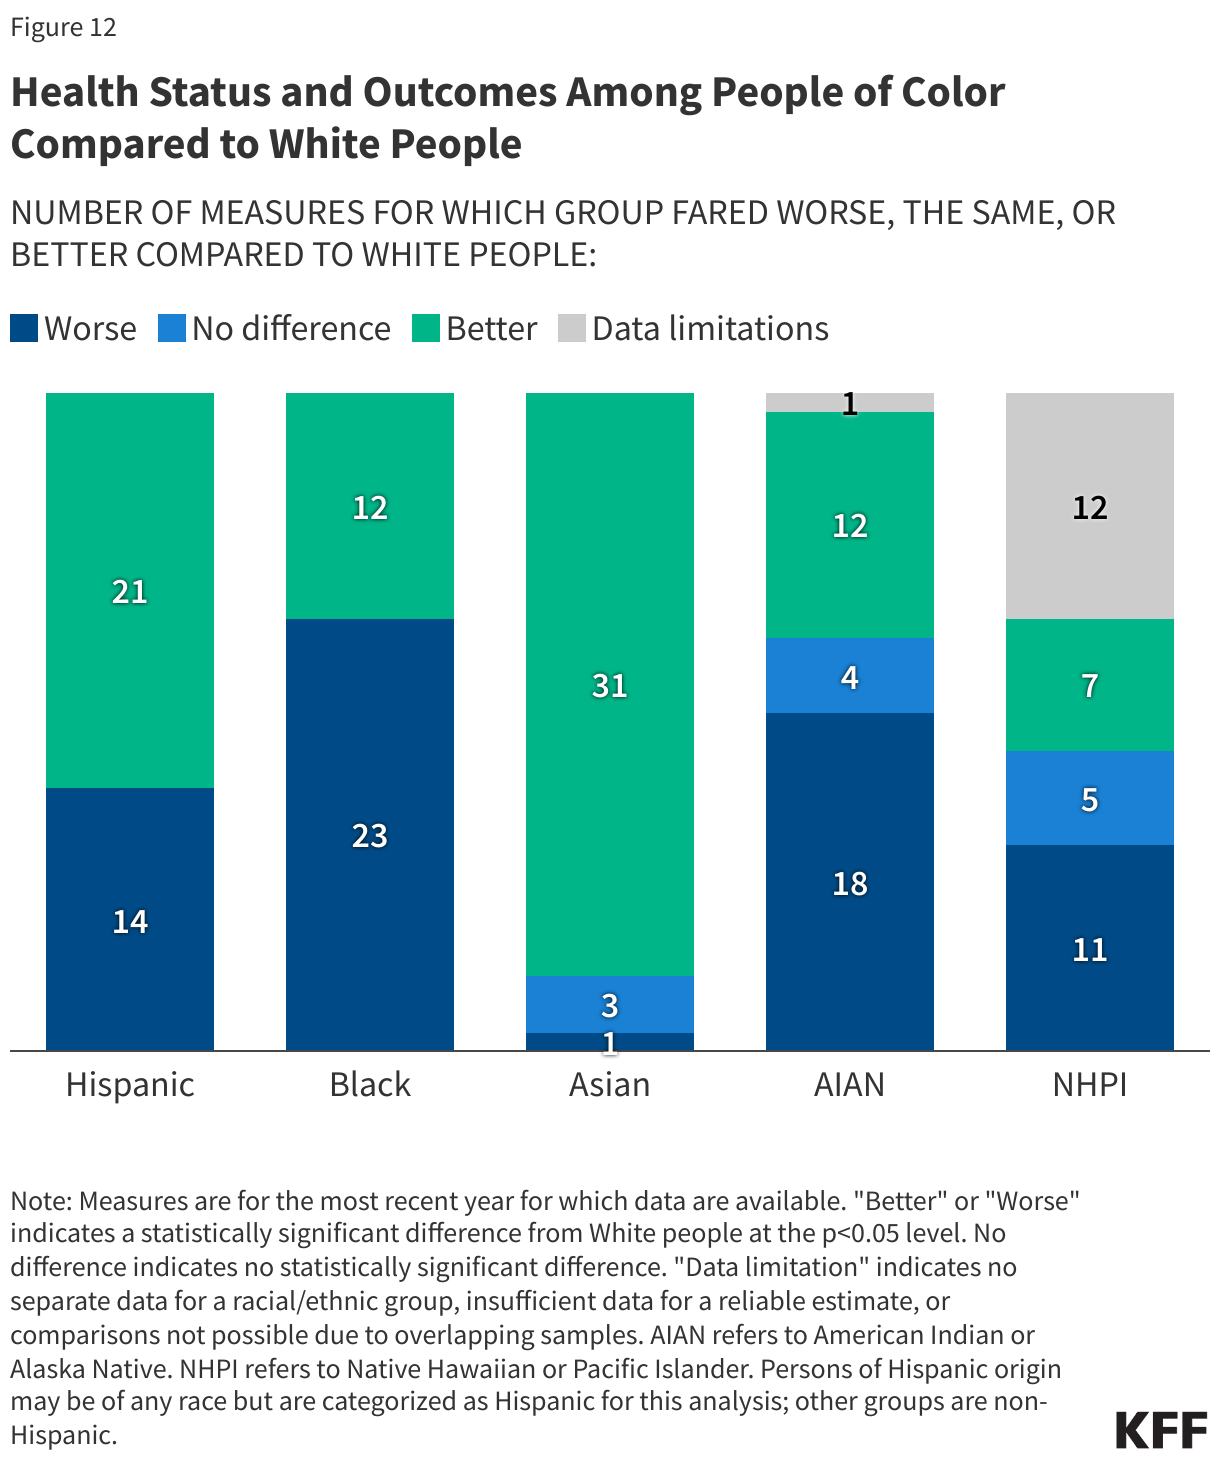
Black, Hispanic, and AIAN people fare worse compared to White people across most examined social and economic measures (Figure 29). Experiences for Asian people are more mixed relative to White people across these examined measures. NHPI people fare worse than White people for half of the measures, however, reliable or disaggregated data are missing for a number of measures.
Social Determinants of Health among People of Color Compared to White People
NUMBER OF MEASURES FOR WHICH GROUP FARED WORSE, THE SAME, OR BETTER COMPARED TO WHITE PEOPLE:
Measures are for the most recent year for which data are available. "Better" or "Worse" indicates a statistically significant difference from White people at the p<0.05 level. No difference indicates no statistically significant difference. "Data limitation" indicates no separate data for a racial/ethnic group, insufficient data for a reliable estimate, or comparisons not possible due to overlapping samples. AIAN refers to American Indian or Alaska Native. NHPI refers to Native Hawaiian and Pacific Islander. Persons of Hispanic origin may be of any race but are categorized as Hispanic for this analysis; other groups are non-Hispanic.
Work Status, Family Income, and Education
While most people across racial and ethnic groups live in a family with a full-time worker, disparities persist (Figure 30). AIAN (68%), Black (74%), NHPI (79%), and Hispanic (81%) people are less likely than White people (83%) to have a full-time worker in the family. In contrast, Asian people (86%) are more likely than their White counterparts (86%) to have a full-time worker in the family.
Percent of Under Age 65 Population With a Full-Time Worker in the Family by Race and Ethnicity, 2023
* Indicates statistically significant difference from White people at the p<0.05 level. Includes individuals ages 0-64. Persons of Hispanic origin may be of any race but are categorized as Hispanic for this analysis; other groups are non-Hispanic. AIAN refers to American Indian or Alaska Native. NHPI refers to Native Hawaiian or Pacific Islander.
KFF analysis of 2023 American Community Survey, 1-Year Estimates.
Despite the majority of people living in a family with a full-time worker, over one in five AIAN (25%) and Black (21%) people have family incomes below the federal poverty level, over twice the share as White people (10%). Rates of poverty were also higher among Hispanic (16%) and NHPI (15%) people (Figure 31).
Percent of Under Age 65 Population With Family Income Below Poverty by Race and Ethnicity, 2023
* Indicates statistically significant difference from White people at the p<0.05 level. Includes individuals ages 0-64. Persons of Hispanic origin may be of any race but are categorized as Hispanic for this analysis; other groups are non-Hispanic. AIAN refers to American Indian or Alaska Native. NHPI refers to Native Hawaiian and Pacific Islander.
KFF analysis of 2023 American Community Survey, 1-Year Estimates.
Black, Hispanic, AIAN, and NHPI people have lower levels of educational attainment compared to their White counterparts. Among people ages 25 and older, over two thirds (69%) of White people have completed some post-secondary education, compared to less than half (45%) of Hispanic people, just over half of AIAN (52%) and NHPI (54%) people, and about six in ten (58%) Black people (Figure 33). Asian people (75%) are more likely than White people (69%) to have completed at least some post-secondary education.
Educational Attainment by Race and Ethnicity, 2023
Includes individuals ages 25 and older. Persons of Hispanic origin may be of any race but are categorized as Hispanic for this analysis; other groups are non-Hispanic. AIAN refers to American Indian or Alaska Native. NHPI refers to Native Hawaiian and Pacific Islander. Totals may not sum to 100 due to rounding.
KFF analysis of 2023 American Community Survey, 1-Year Estimates.
Net Worth and Homeownership
Black and Hispanic families have less wealth than White families. Wealth can be defined using net worth, a measure of the difference between a family’s assets and liabilities. The median net worth for White households is $285,000 compared to $44,900 for Black households and $61,600 for Hispanic households (Figure 33). Asian households have the highest median net worth of $536,000. Data are not available for AIAN and NHPI people.
Family Median Net Worth by Race and Ethnicity, 2022
Persons of Hispanic origin may be of any race but are categorized as Hispanic for this analysis; other groups are non-Hispanic. Data were not available for American Indian or Alaska Native and Native Hawaiian or Pacific Islander people.
Changes in U.S. Family Finances from 2019 to 2022: Evidence from the Survey of Consumer Finances
People of color are less likely to own a home than White people (Figure 34). Nearly eight in ten (78%) White people own a home compared to 70% of Asian people, 61% of AIAN people, 56% of Hispanic people, about half of Black people (50%), and 43% of NHPI people.
Homeownership Rates by Race and Ethnicity, 2023
* Indicates statistically significant difference from White people at the p<0.05 level. Persons of Hispanic origin may be of any race but are categorized as Hispanic for this analysis; other groups are non-Hispanic. AIAN refers to American Indian or Alaska Native. NHPI refers to Native Hawaiian and Pacific Islander.
KFF analysis of 2023 American Community Survey.
Food Security, Housing Quality, and Internet Access
Hispanic, AIAN, and Black people are roughly twice as likely to experience food insecurity compared to their White counterparts (Figure 35). Asian and White people have similar rates of food insecurity (11% vs 12%, respectively).
Percent of Individuals in a Household Experiencing Food Insecurity by Race and Ethnicity, 2023
* Indicates statistically significant difference from White people at p<0.05 level. Food security is assessed at the household-level, with responses provided by the household respondent applying to the entire household, and the measure is based on the U.S. Department of Agriculture's Six-Item Short Form of the Food Security Survey Module. Persons of Hispanic origin may be of any race but are categorized as Hispanic for this analysis; other groups are non-Hispanic. AIAN refers to American Indian or Alaska Native. Data were not available for Native Hawaiian or Pacific Islander people.
KFF analysis of U.S Census Bureau, Survey of Income and Program Participation (SIPP), 2023.
People of color are more likely to live in crowded housing than their White counterparts (Figure 36). Among White people, 3% report living in a crowded housing arrangement, defined by the American Community Survey as having more than one person per room. In contrast, almost three in ten (28%) NHPI people, roughly one in five Hispanic (18%) and AIAN (16%) people, and about one in ten Asian (12%) and Black (8%) people report living in crowded housing. However, these differences may reflect cultural preferences for multigenerational living rather than a housing challenge.
Percent of Individuals Living in Crowded Housing by Race and Ethnicity, 2023
* Indicates statistically significant difference from White people at the p<0.05 level. Persons of Hispanic origin may be of any race but are categorized as Hispanic for this analysis; other groups are non-Hispanic. AIAN refers to American Indian or Alaska Native. NHPI refers to Native Hawaiian and Pacific Islander. Crowded housing is defined as housing units with more than one person per room.
KFF analysis of 2023 American Community Survey, 1-Year Estimates.
AIAN, Black, and NHPI people are less likely to have internet access than White people (Figure 37). Higher shares of AIAN (10%) and Black (5%) people say they have no internet access compared to their White counterparts (4%). In contrast, Asian (2%) and Hispanic (3%) people are less likely to report no internet access than White people (4%).
Percent of Individuals Without Internet Access by Race and Ethnicity, 2023
* Indicates statistically significant difference from White people at the p<0.05 level. Persons of Hispanic origin may be of any race but are categorized as Hispanic for this analysis; other groups are non-Hispanic. AIAN refers to American Indian or Alaska Native. NHPI refers to Native Hawaiian or Pacific Islander.
KFF analysis of 2023 American Community Survey, 1-Year Estimates.
Transportation
Black, Asian, AIAN, and Hispanic people are more likely to live in a household without access to a vehicle than White people (Figure 38). About one in eight (13%) Black people and about one in ten Asian (9%) and AIAN (9%) people live in a household without a vehicle available, followed by 7% of Hispanic people. The shares of NHPI (5%) and White (4%) people who report not having access to a vehicle in the household are similar.
Percent of Individuals Living in a Household Without Vehicle Access by Race and Ethnicity, 2023
* Indicates statistically significant difference from White people at the p<0.05 level. Persons of Hispanic origin may be of any race but are categorized as Hispanic for this analysis; other groups are non-Hispanic. AIAN refers to American Indian or Alaska Native. NHPI refers to Native Hawaiian and Pacific Islander.
KFF analysis of 2023 American Community Survey, 1-Year Estimates.
Citizenship and English Proficiency
Asian, Hispanic, NHPI, and Black people include higher shares of noncitizen immigrants compared to White people. Asian and Hispanic people have the highest shares of noncitizen immigrants at 24% and 20%, respectively (Figure 39). Asian people are projected to become the largest immigrant group in the United States by 2055. Noncitizen immigrants are more likely to be uninsured than citizens and face increased barriers to accessing health care.
Percent of Total Population Who is a Noncitizen by Race and Ethnicity, 2023
* Indicates statistically significant difference from White people at the p<0.05 level. Persons of Hispanic origin may be of any race but are categorized as Hispanic for this analysis; other groups are non-Hispanic. AIAN refers to American Indian or Alaska Native. NHPI refers to Native Hawaiian or Pacific Islander.
KFF analysis of 2023 American Community Survey, 1-Year Estimates
Asian and Hispanic people are more likely to have LEP compared to White people. Almost one in three Asian (31%) and Hispanic (28%) people report speaking English less than very well compared to 1% of White people (1%) (Figure 40). Adults with LEP are more likely to report worse health status and increased barriers in accessing health care compared to English proficient adults.
Percent of Individuals Ages Five and Older Who Have Limited English Proficiency by Race and Ethnicity, 2023
* Indicates statistically significant difference from White people at the p<0.05 level. Limited English Proficiency includes individuals ages five and older who speak a language other than English and who speak English less than very well. Persons of Hispanic origin may be of any race but are categorized as Hispanic for this analysis; other groups are non-Hispanic. AIAN refers to American Indian or Alaska Native. NHPI refers to Native Hawaiian or Pacific Islander.
KFF analysis of 2023 American Community Survey, 1-Year Estimates.
Experiences with Racism, Discrimination, and Unfair Treatment
Racism is an underlying driver of health disparities, and repeated and ongoing exposure to perceived experiences of racism and discrimination can increase risks for poor health outcomes. Research has shown that exposure to racism and discrimination can lead to negative mental health outcomes and certain negative impacts on physical health, including depression, anxiety, and hypertension.
AIAN, Black, Hispanic, and Asian adults are more likely to report certain experiences with discrimination in daily life compared with their White counterparts, with the greatest frequency reported among Black and AIAN adults. A 2023 KFF survey shows that at least half of AIAN (58%), Black (54%), and Hispanic (50%) adults, and about four in ten (42%) Asian adults say they experienced at least one type of discrimination in daily life in the past year (Figure 41). These experiences include receiving poorer service than others at restaurants or stores; people acting as if they are afraid of them or as if they aren’t smart; being threatened or harassed; or being criticized for speaking a language other than English. Data are not available for NHPI adults.
Percent of People Who Report Experiences of Discrimination by Race and Ethnicity, 2023
Percent who say they have experienced the following in their daily life at least a few times in the past year:
Black, Asian, and AIAN groups include multiracial and single-race adults of Hispanic and non-Hispanic ethnicity. Hispanic group includes those who identify as Hispanic regardless of race. White includes single-race non-Hispanic adults only. AIAN refers to American Indian and Alaska Native people. Data were not available for Native Hawaiian and Pacific Islander people. See topline for full question wording.
KFF Survey on Racism, Discrimination, and Health (June 6- August 14, 2023)
About one in five (18%) Black adults and roughly one in eight (12%) AIAN adults, followed by roughly one in ten Hispanic (11%), and Asian (10%) adults who received health care in the past three years report being treated unfairly or with disrespect by a health care provider because of their racial or ethnic background. These shares are higher than the 3% of White adults who report this (Figure 42). Overall, roughly three in ten (29%) AIAN adults and one in four (24%) Black adults say they were treated unfairly or with disrespect by a health care provider in the past three years for any reason compared with 14% of White adults.
Percent of People Who Report Experiences of Discrimination by a Health Care Provider by Race and Ethnicity, 2023
Percent who say that a doctor or other health care provider treated them unfairly or with disrespect in the past three years because of…
Among adults who have used health care in the past three years. Black, Asian, and AIAN groups include multiracial and single-race adults of Hispanic and non-Hispanic ethnicity. Hispanic group includes those who identify as Hispanic regardless of race. White includes single-race non-Hispanic adults only. AIAN refers to American Indian and Alaska Native people. Data were not available for Native Hawaiian and Pacific Islander people. See topline for full question wording.
KFF Survey on Racism, Discrimination, and Health (June 6- August 14, 2023)