KFF Health Tracking Poll: Prescription Drug Costs, Views on Trump Administration Actions, and GLP-1 Use
Findings
Key Takeaways
- With the Trump administration recently announcing several high-profile prescription drug pricing deals, the latest polling from KFF suggests that few think it is likely the Trump administration’s actions will lower their prescription drug costs, but his base remains more positive. Large majorities of Republicans (73%) and MAGA-supporting Republicans (83%) say they think it is either very or somewhat likely that the administration will lower prescription drug costs for people like them, while far fewer independents (33%) or Democrats (9%) say the same.
- One area where the Trump administration is aiming to reduce costs is for GLP-1 agonists – a class of drugs that includes brand names like Ozempic and Wegovy often used for weight loss and the treatment of diabetes and other chronic conditions. One in five (18%) adults now report having ever taken a GLP-1 agonist, including 12% who say they are currently taking this type of medication (a 6 percentage point increase from 18 months ago). Even though most GLP-1 users say their insurance covered at least some of the cost, over half (56%) of users say these drugs were difficult to afford, including one in four who say they were “very difficult” to afford. About a quarter (27%) of GLP-1 users report having insurance but paying the whole cost of the medication themselves.
- Nearly half of people who say they have been diagnosed with diabetes (45%) report currently using a GLP-1 medication, as do three in ten (29%) adults who say they’ve been diagnosed with heart disease and about a quarter (23%) of those who report being diagnosed as overweight or obese in the past five years. Across age groups, current GLP-1 use is highest among those ages 50-64 (22%) when compared to younger and older adults. Among adults 65 and older, 9% say they’re currently using these drugs – likely a reflection of Medicare’s lack of coverage for drugs specifically used for weight loss.
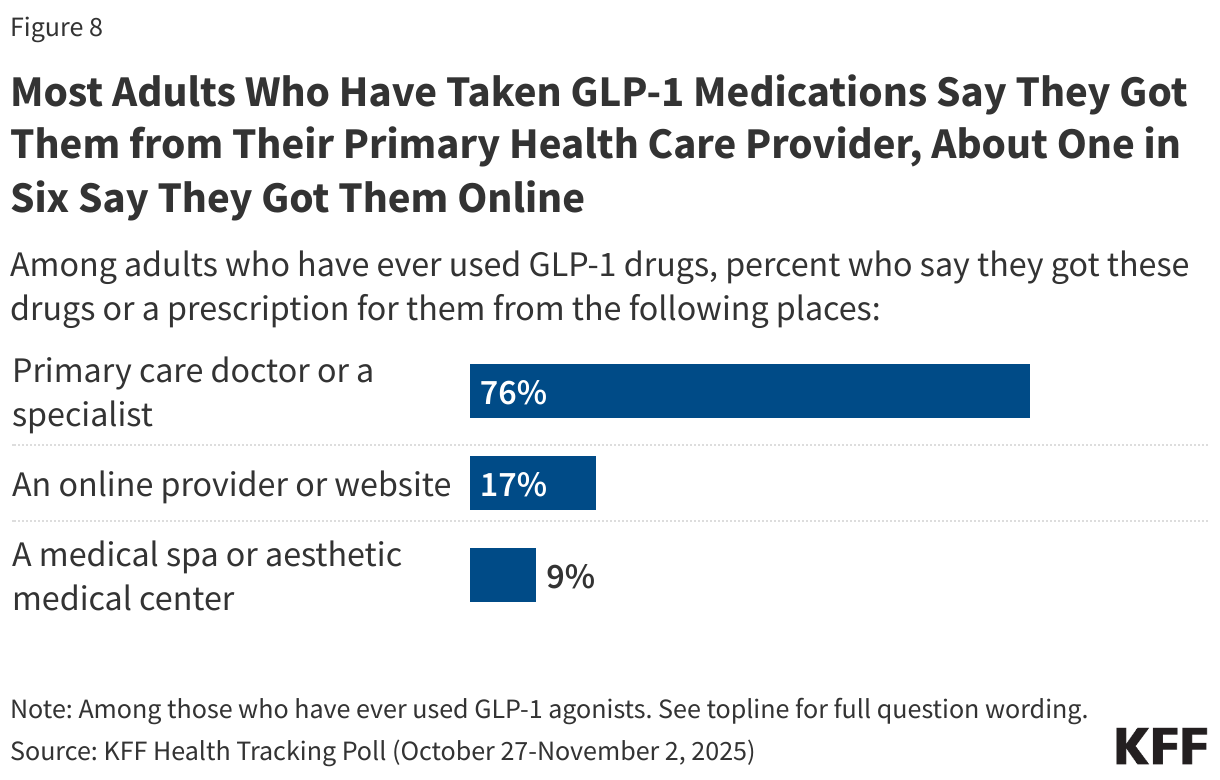
- With GLP-1 drugs widely available via direct-to-consumer websites and, increasingly, directly from drug manufacturers, most adults who have taken these medications say they got them from their primary health care provider or a specialist (76%), while about one in six (17%) report getting them from an online provider or website. Fewer say they got a GLP-1 from a medical spa or aesthetic medical center (9%).
Affordability of Prescription Drugs and Views on Trump Administration Actions
President Trump has recently announced several administrative actions aimed at tackling the issue of prescription drug costs. The latest KFF Health Tracking Poll – fielded prior to Trump’s most recent announcement related to cost and coverage of GLP-1 drugs – finds prescription drug costs remain a problem for many Americans, but few think it is likely that the Trump administration will lower their drug costs.
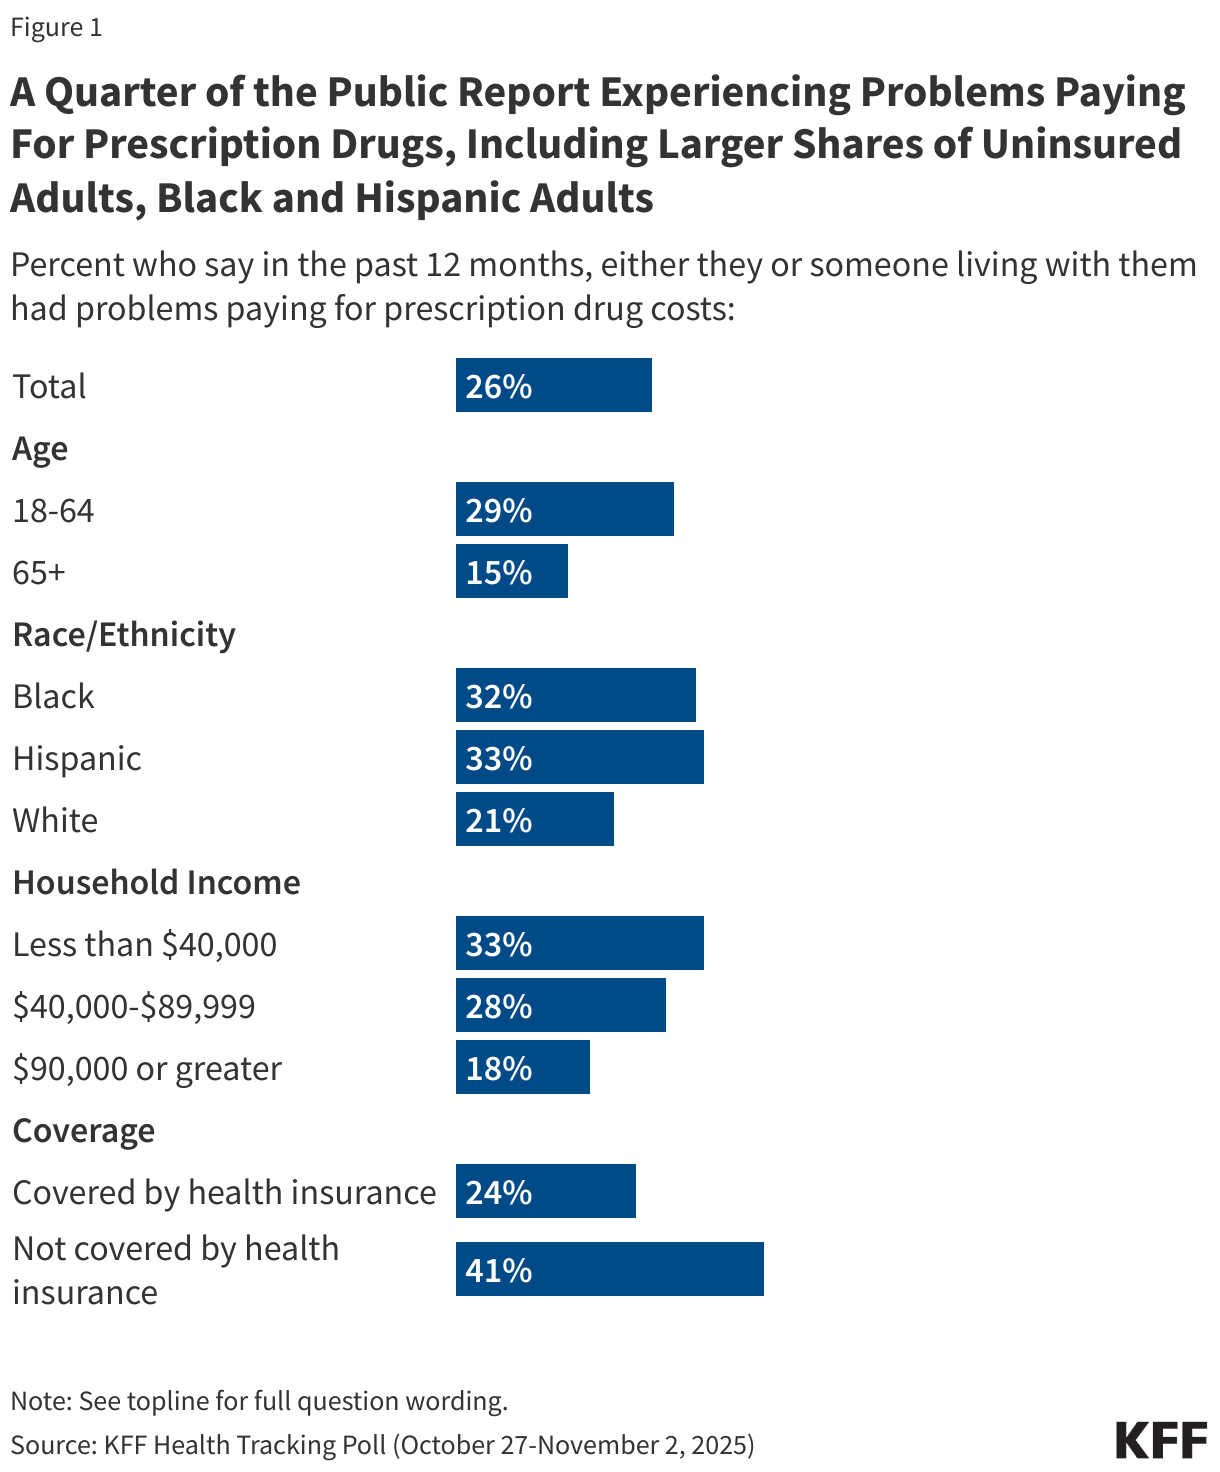
Overall, about one in four (26%) adults say they or someone living with them had problems paying for prescription drugs in the past 12 months, rising to four in ten (41%) among uninsured adults and about one-third among Hispanic adults (33%), Black adults (32%), and those with annual household incomes below $40,000 (33%).
In the past month, President Trump has announced several prescription drug pricing deals between his administration and different drugmakers, including deals with Pfizer and AstraZeneca related to what they charge state Medicaid programs for some of their drugs, and a subsequent deal with a maker of in vitro fertilization (IVF) drugs aimed at lowering the cost of these treatments. Alongside these deals, the administration announced the upcoming launch of TrumpRx, a website where the public could go to buy prescription drugs directly from manufacturers without using their health insurance. After this survey was fielded, the Trump administration announced additional deals with makers of GLP-1 weight loss drugs to lower their cost and expand coverage in some instances.
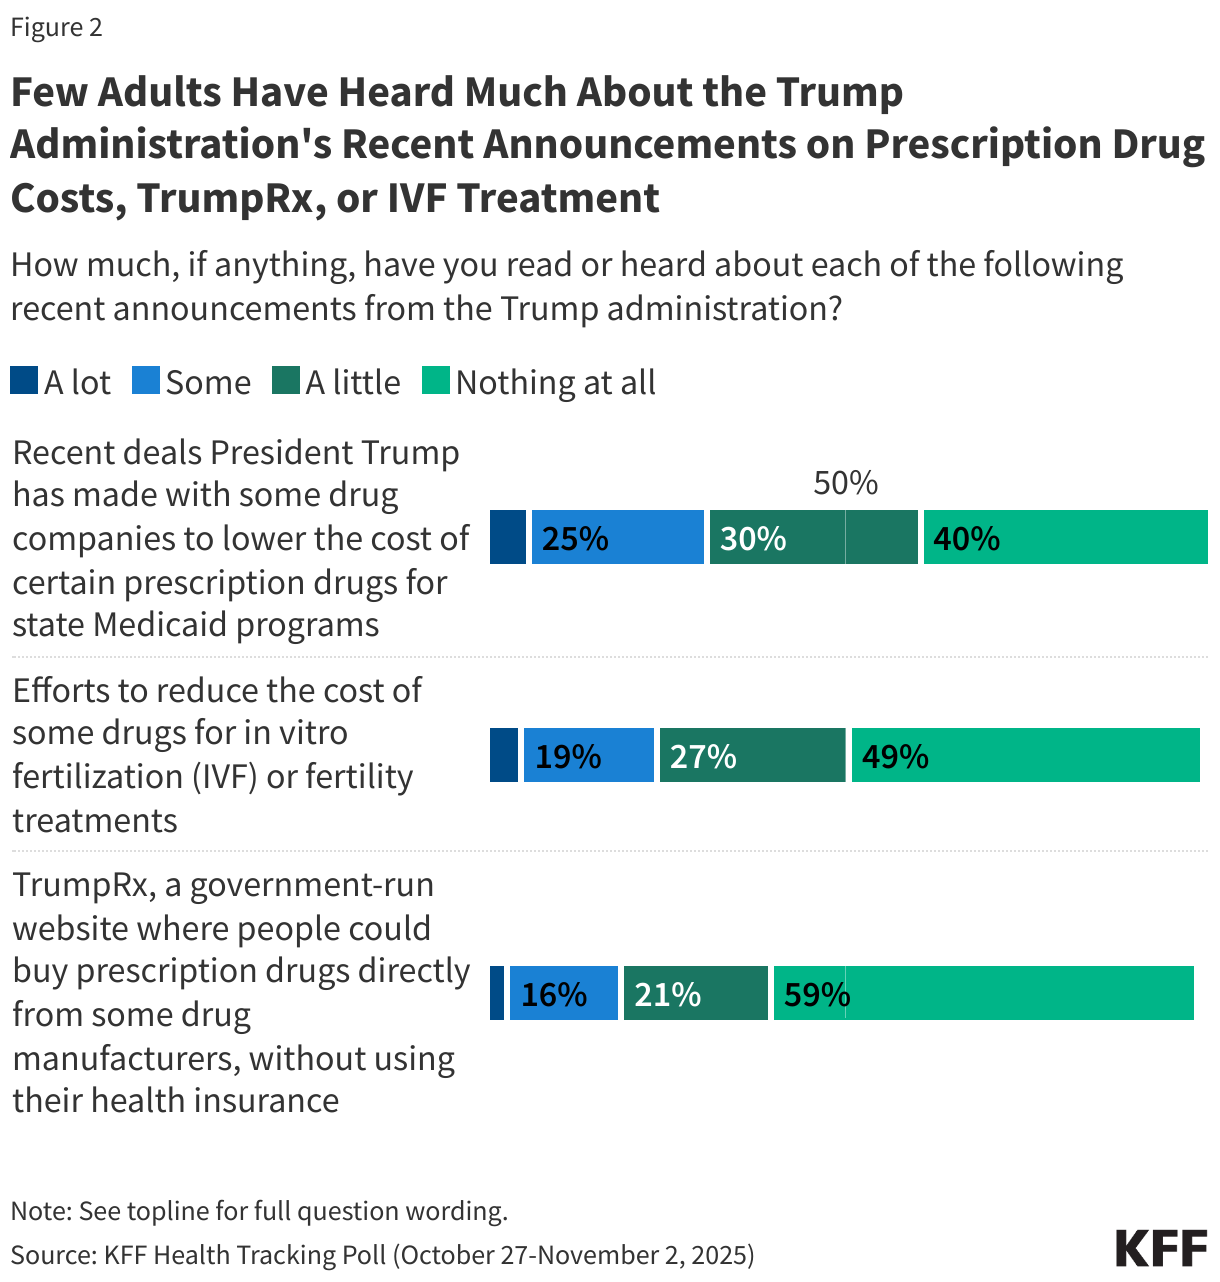
Most of the public is unaware of the Trump administration’s recent prescription drug announcements, with less than a third saying they’ve read or heard “a lot” or “some” about President Trump’s deals to lower the cost of certain drugs for state Medicaid programs (30%), efforts to reduce the cost of some IVF drugs (24%), or the planned TrumpRx website (20%). Public awareness of the launch of TrumpRx is particularly low, with most adults (59%) saying they’ve heard “nothing at all” about this.
Republicans are more likely than Democrats to say they’ve heard at least some about the administration’s recent deals with pharmaceutical companies to lower the cost of some prescription drugs for Medicaid (44% v. 22%) and efforts to reduce the cost of some drugs for IVF treatment (30% v. 19%), but similar shares across partisans say they’ve heard about TrumpRx.
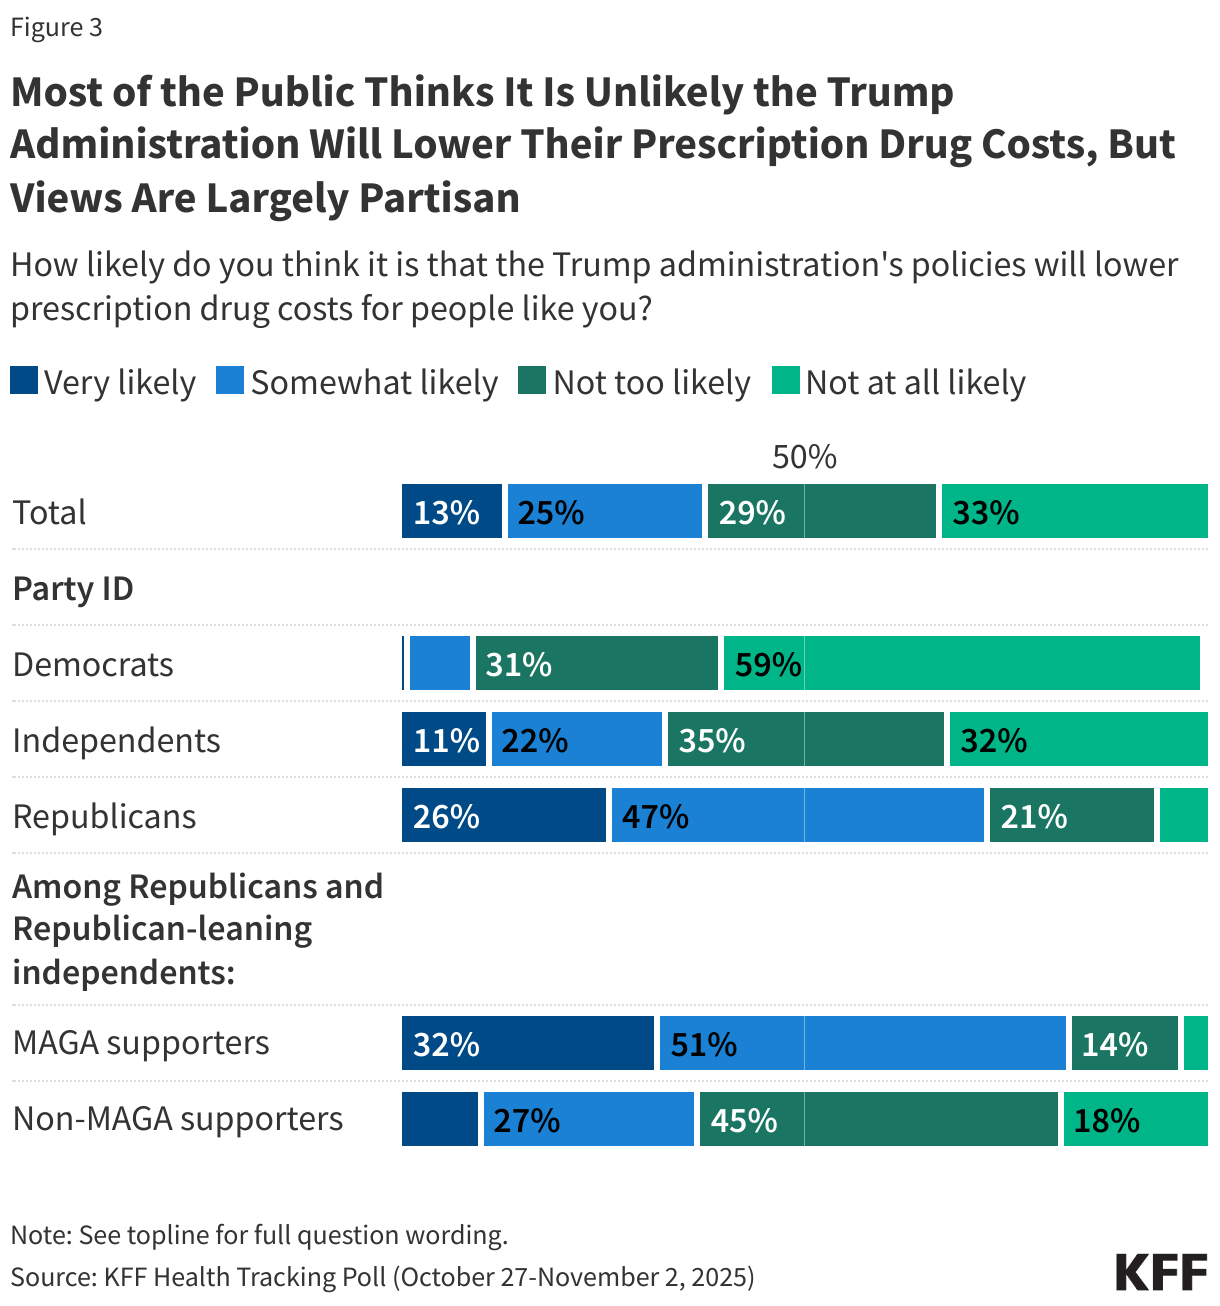
Overall, a majority (62%) of adults say it is either “not too” or “not at all likely” that the Trump administration’s policies will lower prescription drug costs for people like them, while about four in ten (38%) say they think it is “very” or “somewhat likely.”
These expectations are largely driven by partisanship, with large majorities of Republicans (73%) and MAGA-supporting Republican and Republican leaning independents (83%) saying it is likely the administration will lower drug costs for people like them. Comparably, much smaller shares of independents (33%) or Democrats (9%) say they think the administration will lower their prescription drug costs.
About half (49%) of adults ages 65 and older with Medicare say they think it is likely that the Trump administration will lower their prescription drug costs, compared to smaller shares of adults under age 65 with employer-sponsored insurance (34%) or Medicaid (32%). About four in ten (38%) adults under age 65 who purchase their own insurance say they think it is likely the administration will lower their drug costs.
Use, Access and Affordability of GLP-1 Drugs
KFF’s latest Health Tracking Poll provides an update to last year’s poll measuring public use of GLP-1 agonists, a group of prescription drugs including name brands like Ozempic, Wegovy, Zepbound and others commonly prescribed for weight loss, the treatment of diabetes, reduction of cardiovascular disease risk, and some other chronic conditions1.
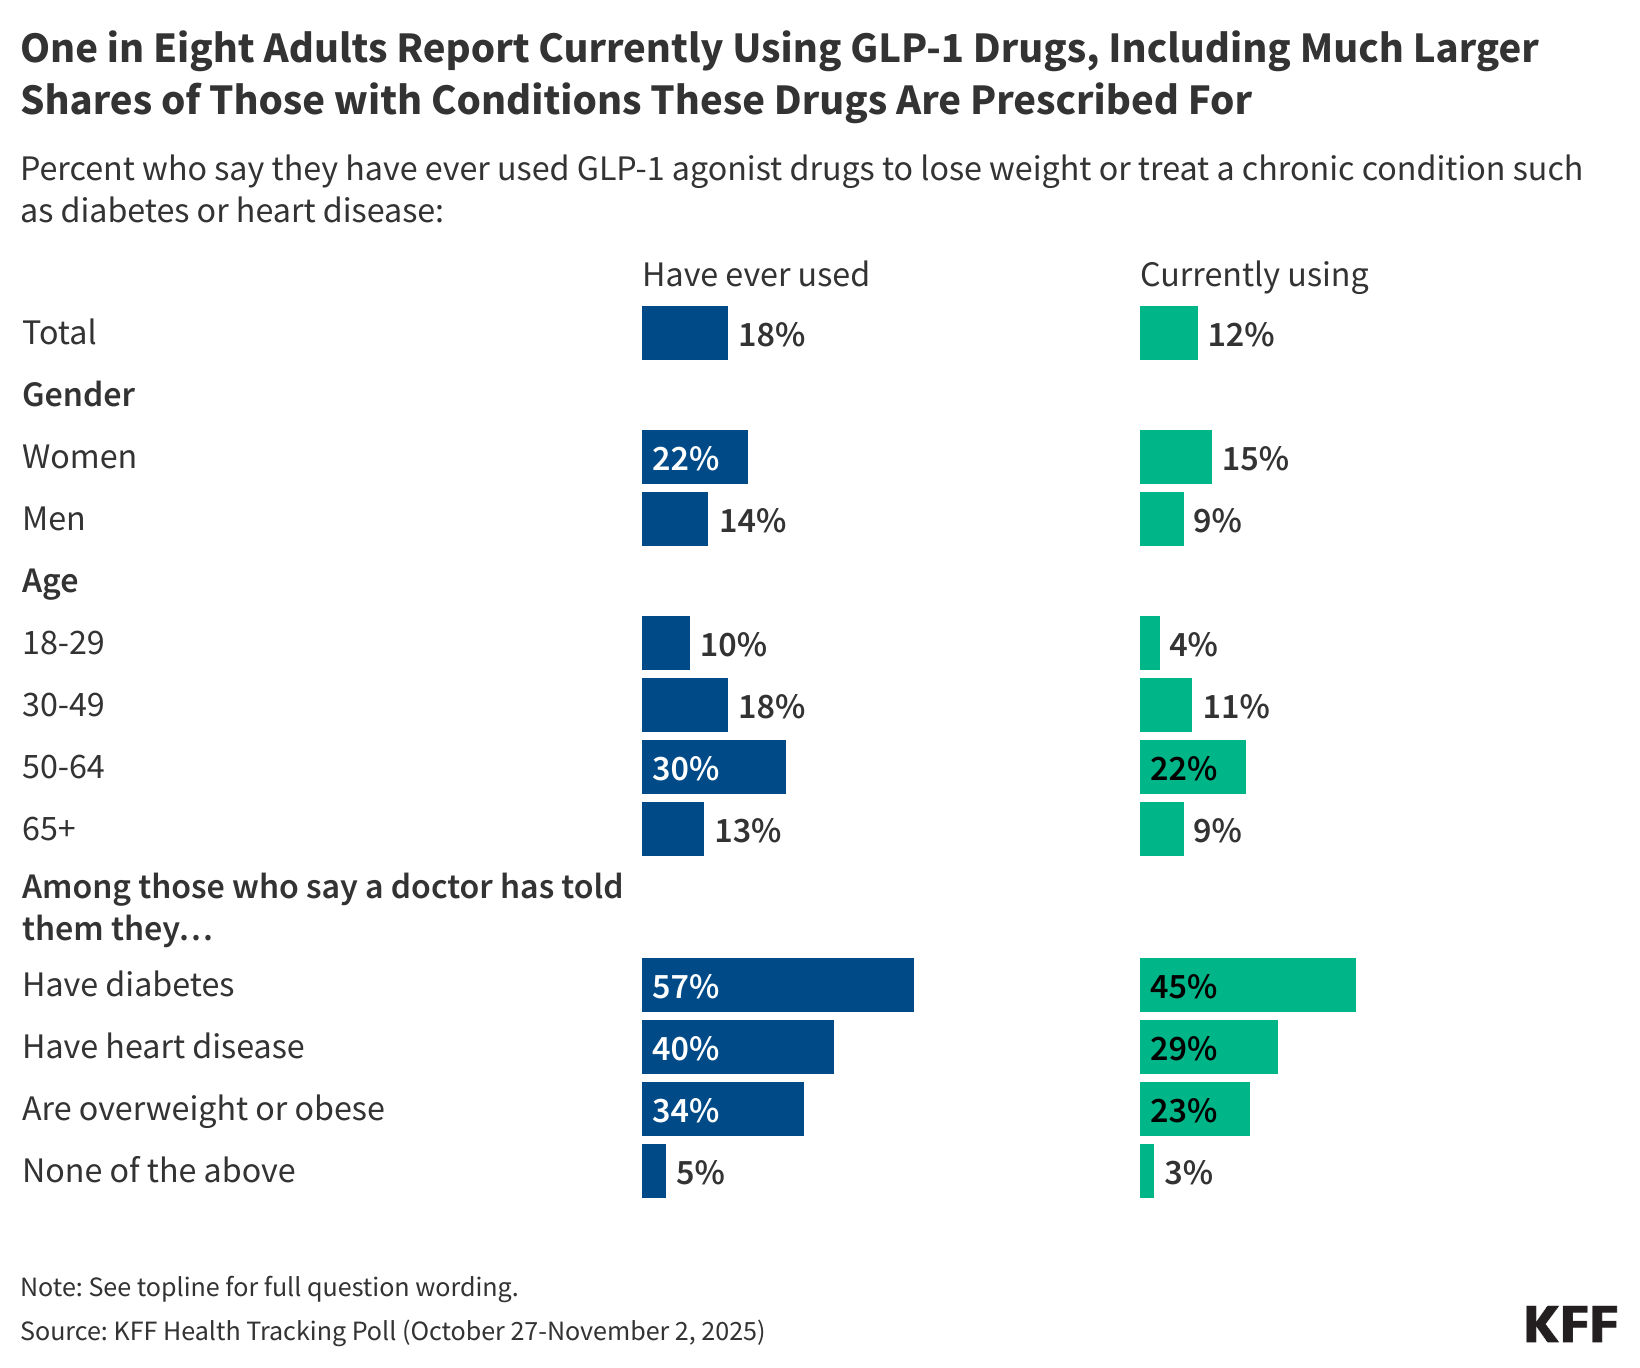
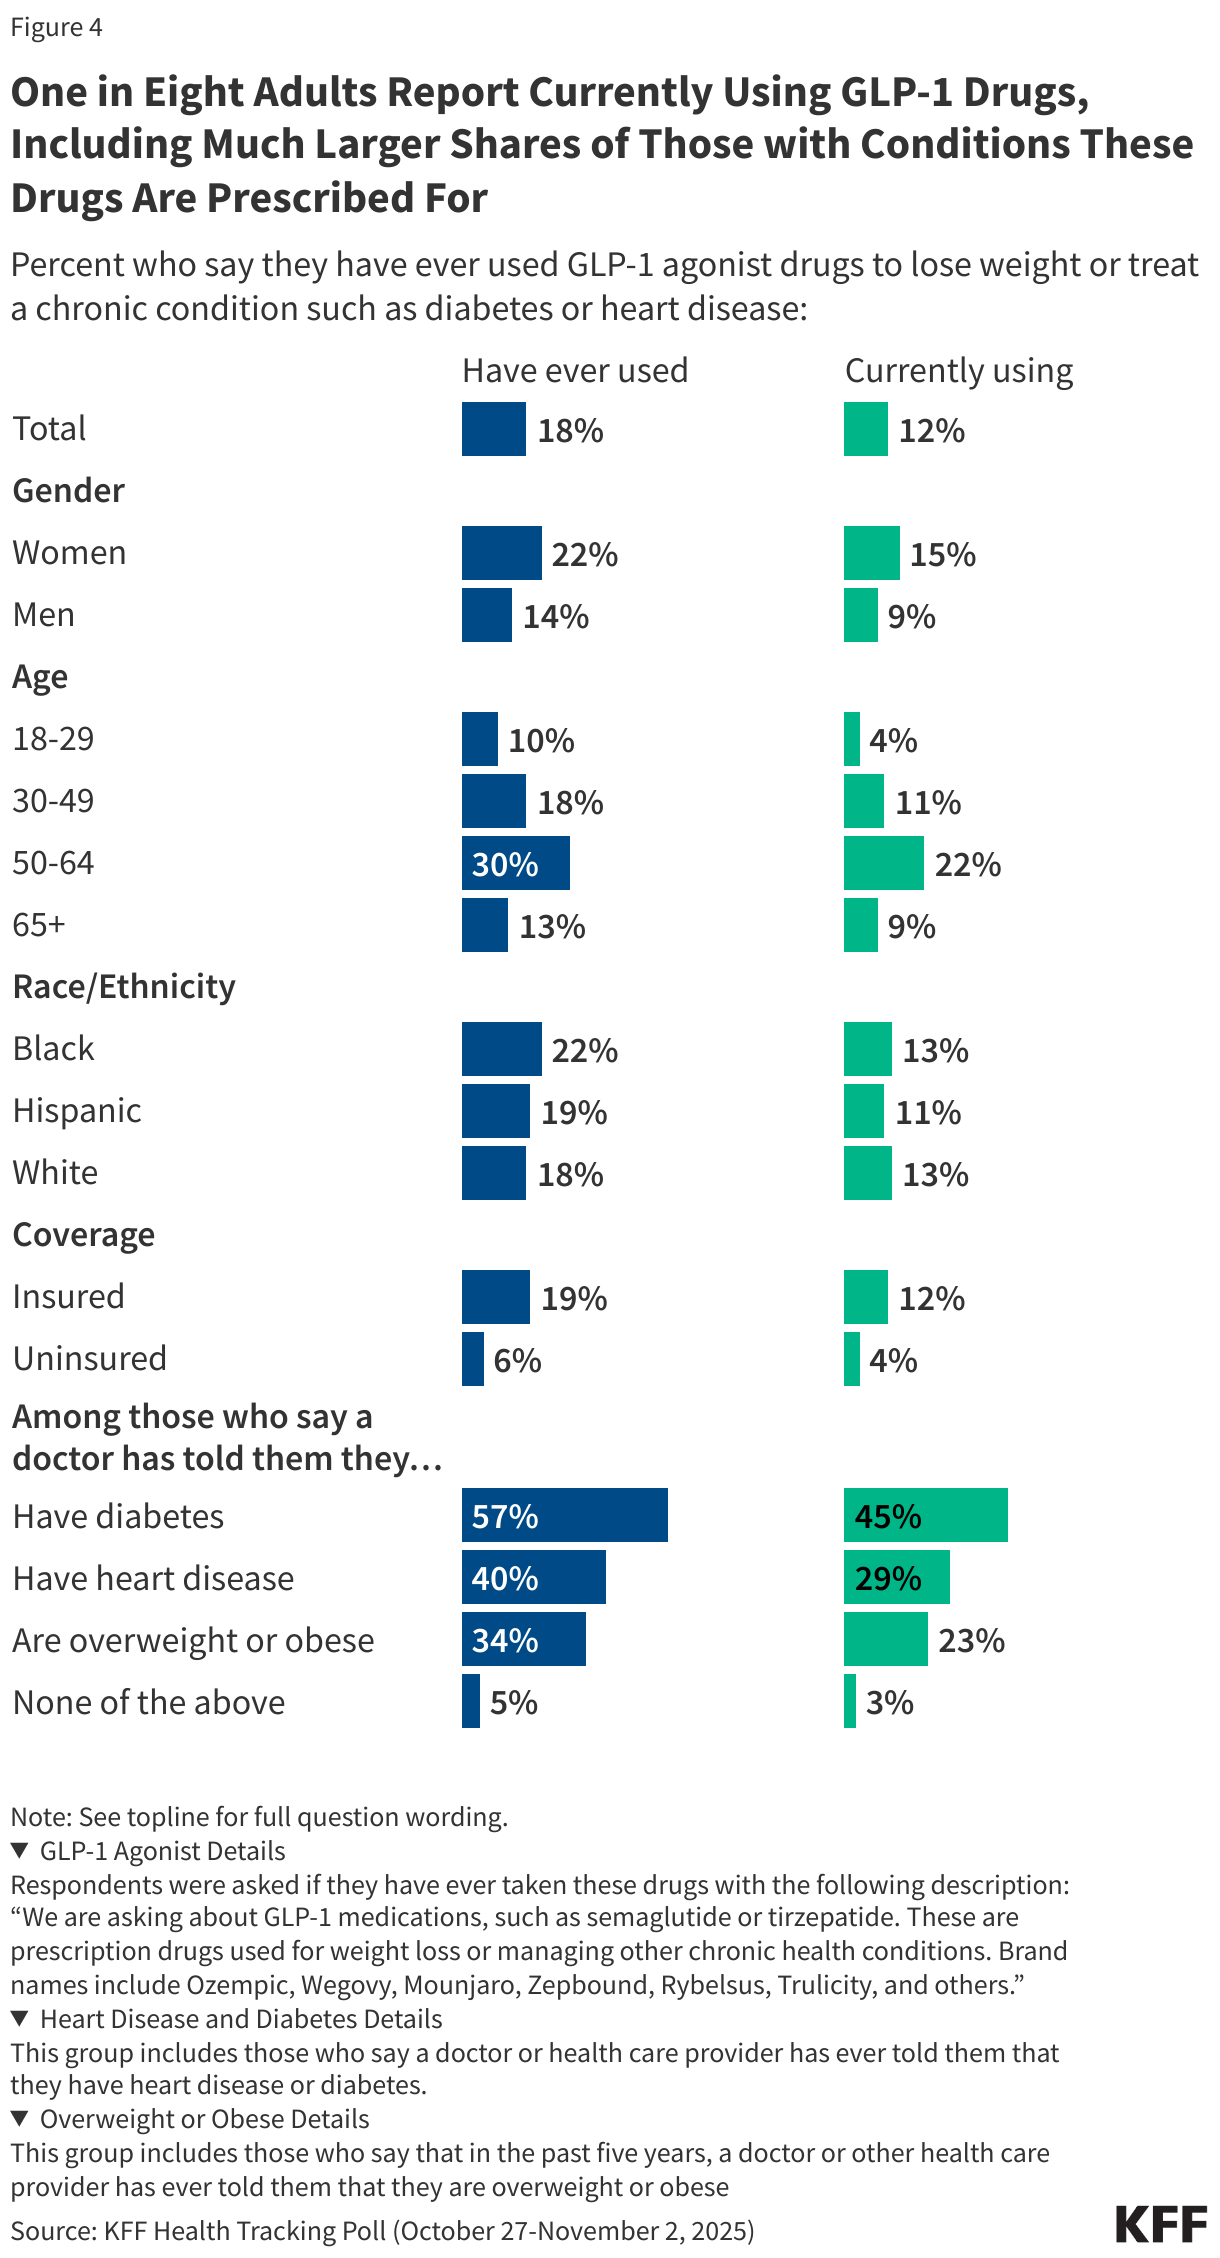
Overall, nearly one in five (18%) adults now say they have ever used GLP-1 agonist drugs either to lose weight or treat a chronic condition, including 12% who say they are currently using them (an increase of 6 percentage points from May 2024).
Use of GLP-1 drugs is highest among adults who report being diagnosed with conditions these drugs are prescribed to treat, including those who have ever been told by a doctor that they have diabetes (57% ever used, including 45% currently using), heart disease (40% ever, 29% currently), and those that have been told by a doctor that they are overweight or obese in the past five years (34% ever, 23% currently).
Across age groups, current GLP-1 use is highest among those who are between the ages of 50 and 64 (22%), with smaller shares of those ages 18-29 (4%), 30-49 (11%), or over age 65 (9%) saying they are currently using these drugs. Women are more likely than men to report using GLP-1 drugs while there are not significant differences in use across race and ethnicity. Use of these drugs is much higher among adults who are currently covered by health insurance compared to those who are uninsured (12% v. 4%).
Who are GLP-1 Users?
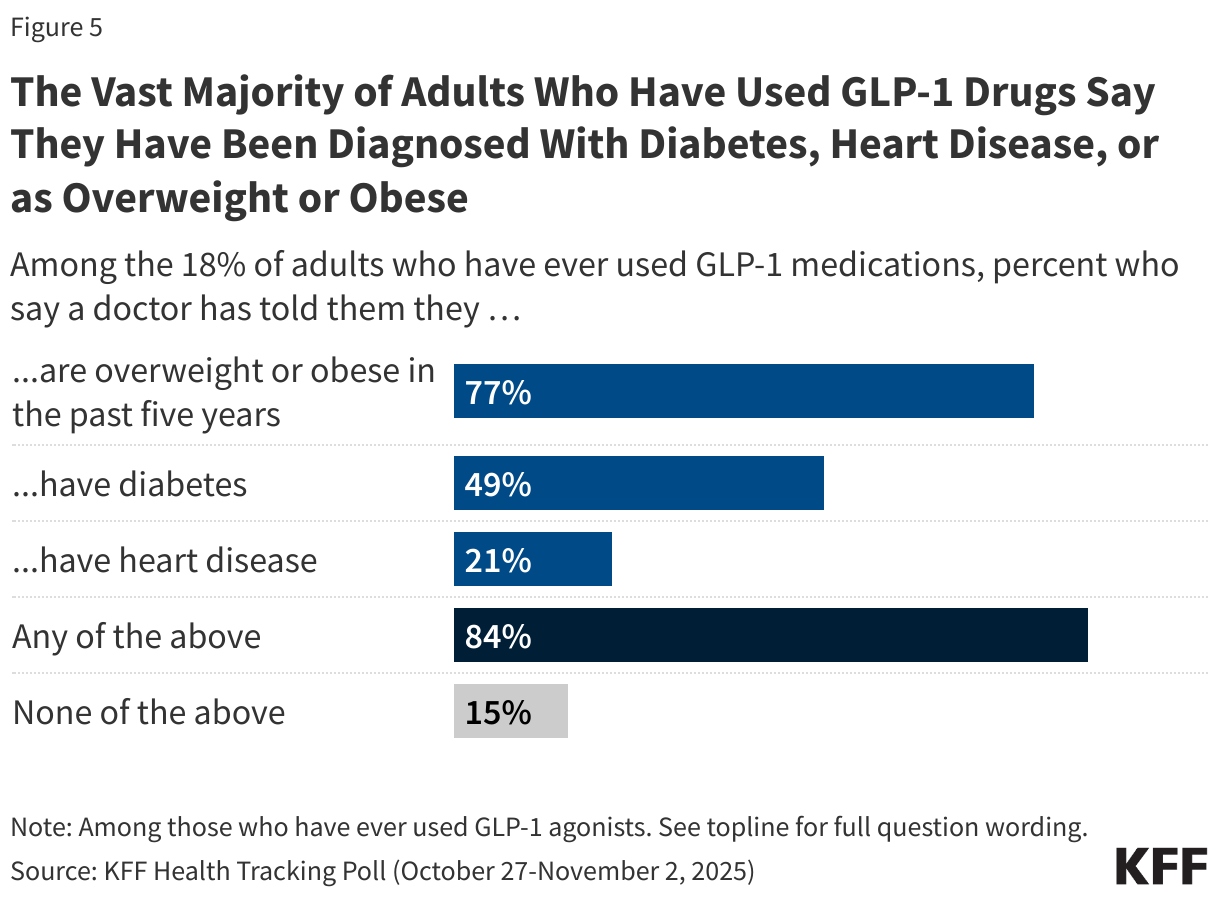
Among the 18% of adults who report having ever used GLP-1 drugs, the vast majority (84%) say they have been diagnosed with at least one of the predominant conditions these drugs are prescribed to treat, including obesity or being overweight in the past five years (77%), or ever being diagnosed with diabetes (49%) or heart disease (21%). Conversely, 15% of GLP-1 users say they have not been diagnosed with any of these conditions by a medical provider.
Among adults who have ever used GLP-1 drugs, the 15% who say they have not been diagnosed with diabetes, heart disease or as overweight or obese may nonetheless have taken these drugs for treatment of other chronic conditions that these drugs are approved for, such as certain types of liver disease or sleep apnea.
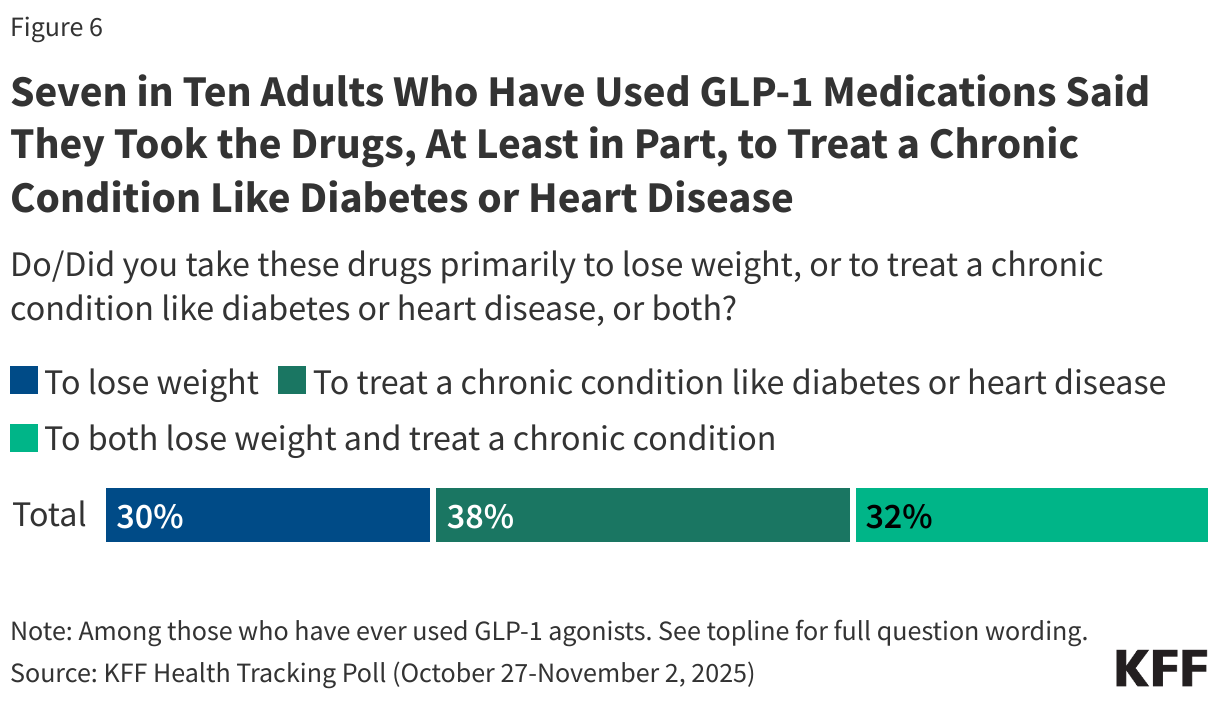
Looking at the 18% of adults who have ever used GLP-1 agonist drugs, most report using them to treat a chronic condition, while a smaller share say they used them solely to lose weight. Among adults who have used these drugs, seven in ten say they used them primarily to treat a chronic condition like diabetes or heart disease (38%) or to both treat a chronic condition and lose weight (32%), while three in ten GLP-1 users (30%) report using these drugs primarily to lose weight.
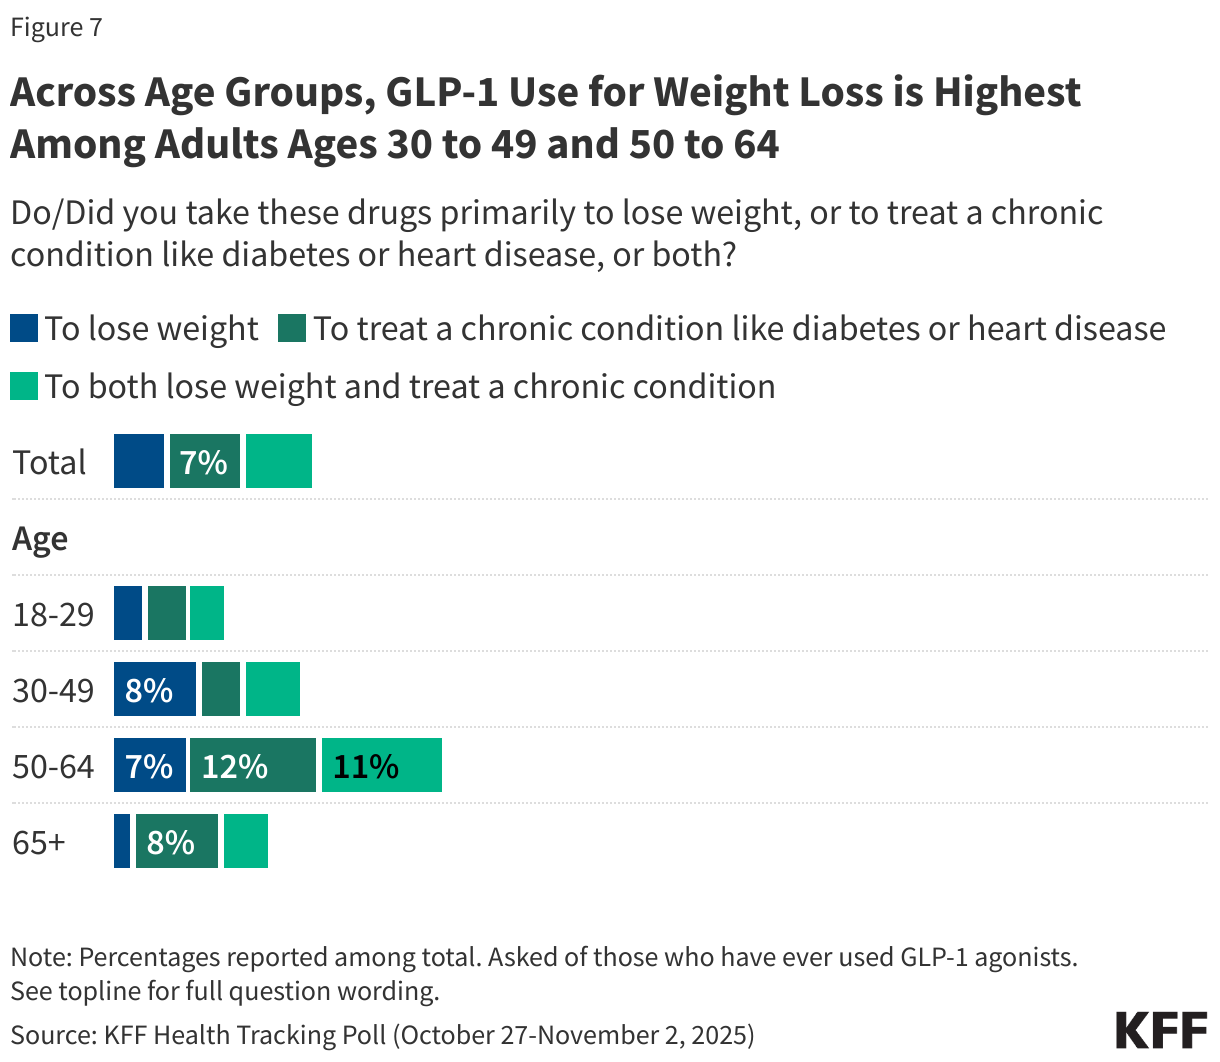
When looking at the public overall, 12% of all adults report ever taking these drugs at least in part to treat a chronic condition, including 7% of the public who say they took them primarily to treat a chronic condition and 6% who say they took these drugs to both treat a chronic condition and to lose weight. Overall, 5% of U.S. adults say they have taken these drugs primarily to lose weight.
Adults ages 30 to 49 and 50 to 64 are more likely than those under age 30 and older than 64 to report ever using these drugs primarily to lose weight. Lower GLP-1 use among adults ages 65 and older, including for weight loss, may reflect Medicare’s lack of coverage for prescription drugs used specifically for weight loss. In the past week, however, the Trump administration announced that some adults with Medicare will now be eligible for GLP-1 drugs as part of a pilot program, following a deal with drugmakers.
GLP-1 drugs have become widely available via online telehealth platforms, and in some cases, can be purchased directly from pharmaceutical companies’ websites where the public can buy these drugs without using their insurance. Compounded versions of these drugs that have not been vetted by the FDA are also available to consumers, even as the FDA recently called for an end to their sale and production.
Most adults who have taken GLP-1 drugs say they got them from their primary care doctor or specialist (76%), while about one in six (17%) say they got them from an online provider or website, and one in ten (9%) report getting them from a medical spa or aesthetic medical center.
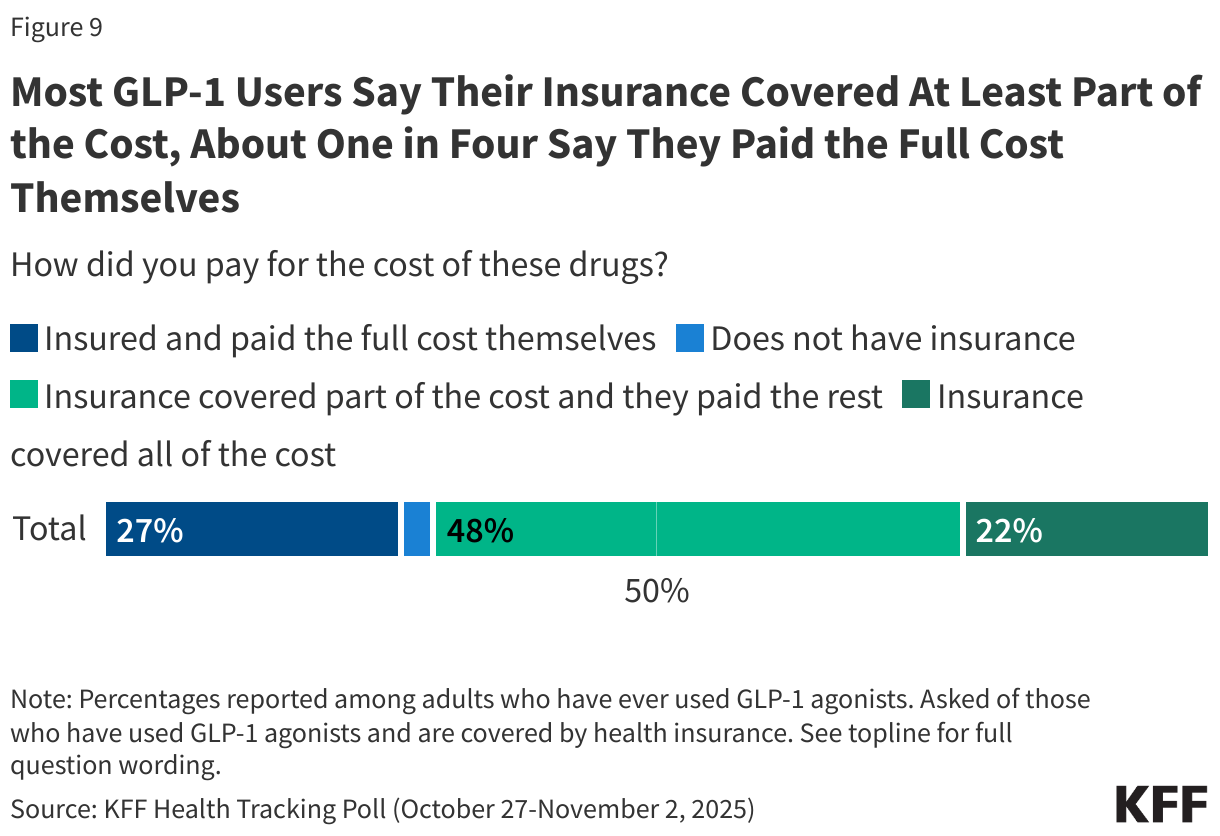
Most adults (70%) who have taken GLP-1 drugs say their insurance covered at least a part of the cost of these drugs, including about half (48%) who say their insurance covered part of the cost of these drugs and about one in five (22%) who say their insurance covered all of the cost.
About one in four (27%) GLP-1 users report having health insurance but say they paid the full cost themselves. The list prices for these drugs average about $1,000 per month in U.S; however, in the past week, President Trump announced deals with makers of GLP-1 drugs to offer their drugs at cheaper prices directly to consumers. In addition, the administration announced expanded coverage of these drugs for some people with Medicare and Medicaid as part of a pilot program. Health insurance coverage of GLP-1 drugs varies widely and may be more limited for those looking to take the drugs solely for weight loss2.
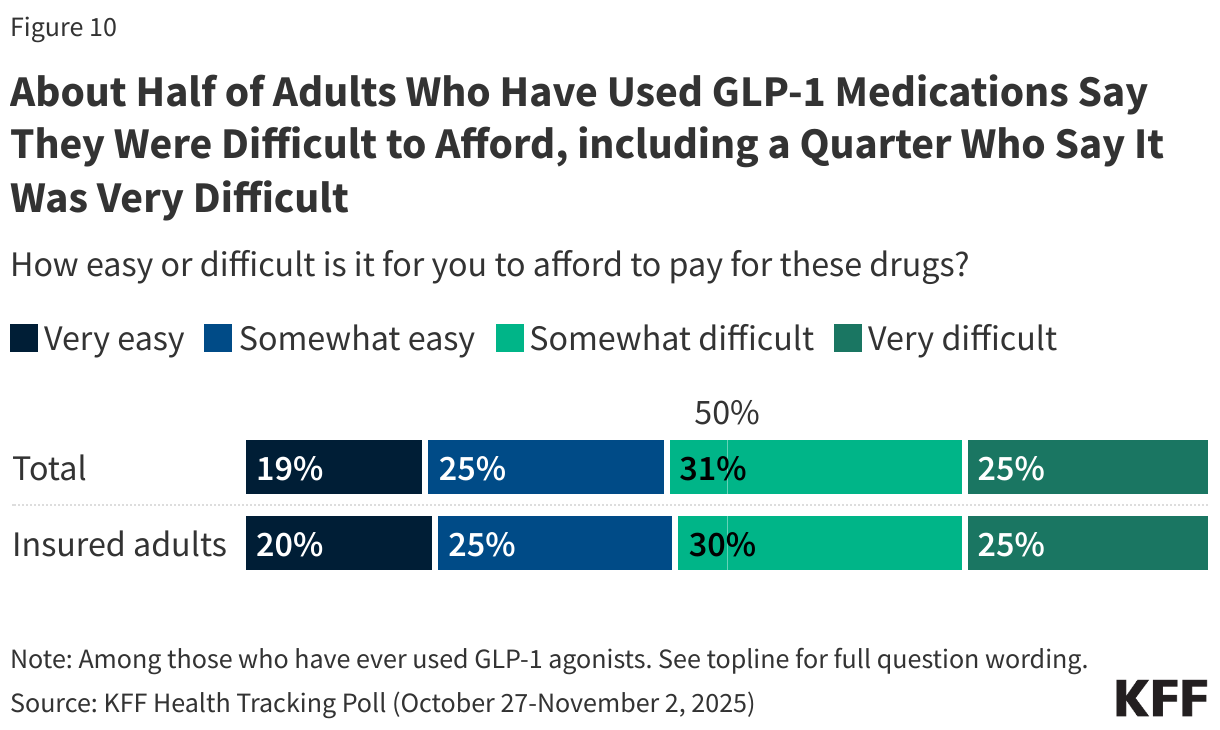
Even with health insurance covering at least part of the cost of GLP-1 medication for most users, many report difficulty affording them. Just over half (56%) of GLP-1 users – including 55% of those with health insurance – say it was difficult to afford these drugs, including one in four who say it was “very difficult.”
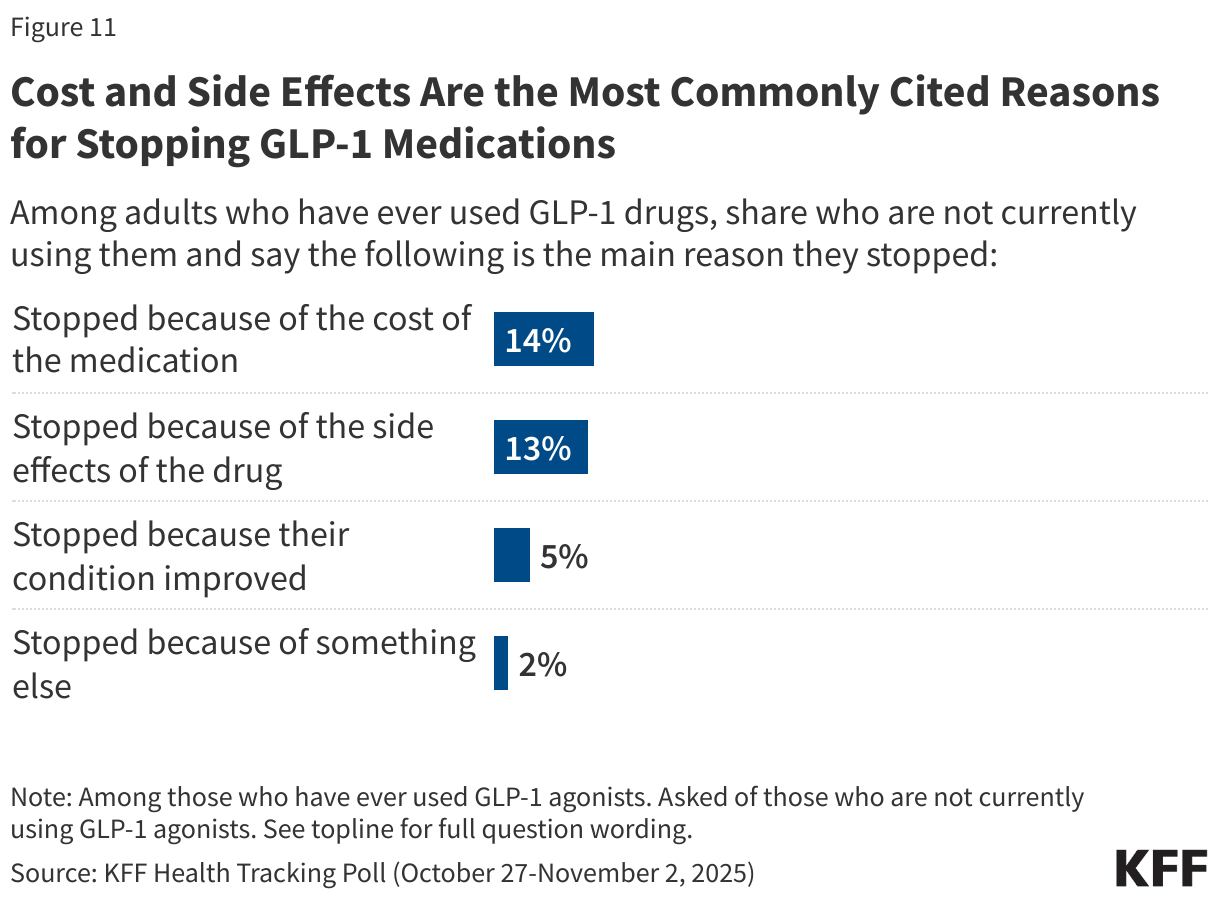
The cost of the medications as well as side effects are the most common reason given for discontinuing GLP-1 use. About one in seven adults who have ever used GLP-1 medications say they are no longer using these drugs because of the cost (14%), similar to the share who report no longer taking the medications because of side effects (13%). A smaller share of adults who have ever used these drugs say they stopped taking them because their condition improved (5%).
Public Interest in Using GLP-1 Drugs for Weight Loss
Beyond the share who have used these drugs, much of the public has encountered GLP-1 drugs, with about four in ten (37%) adults saying they have a close friend or family member who is using one to either lose weight or treat a chronic condition.
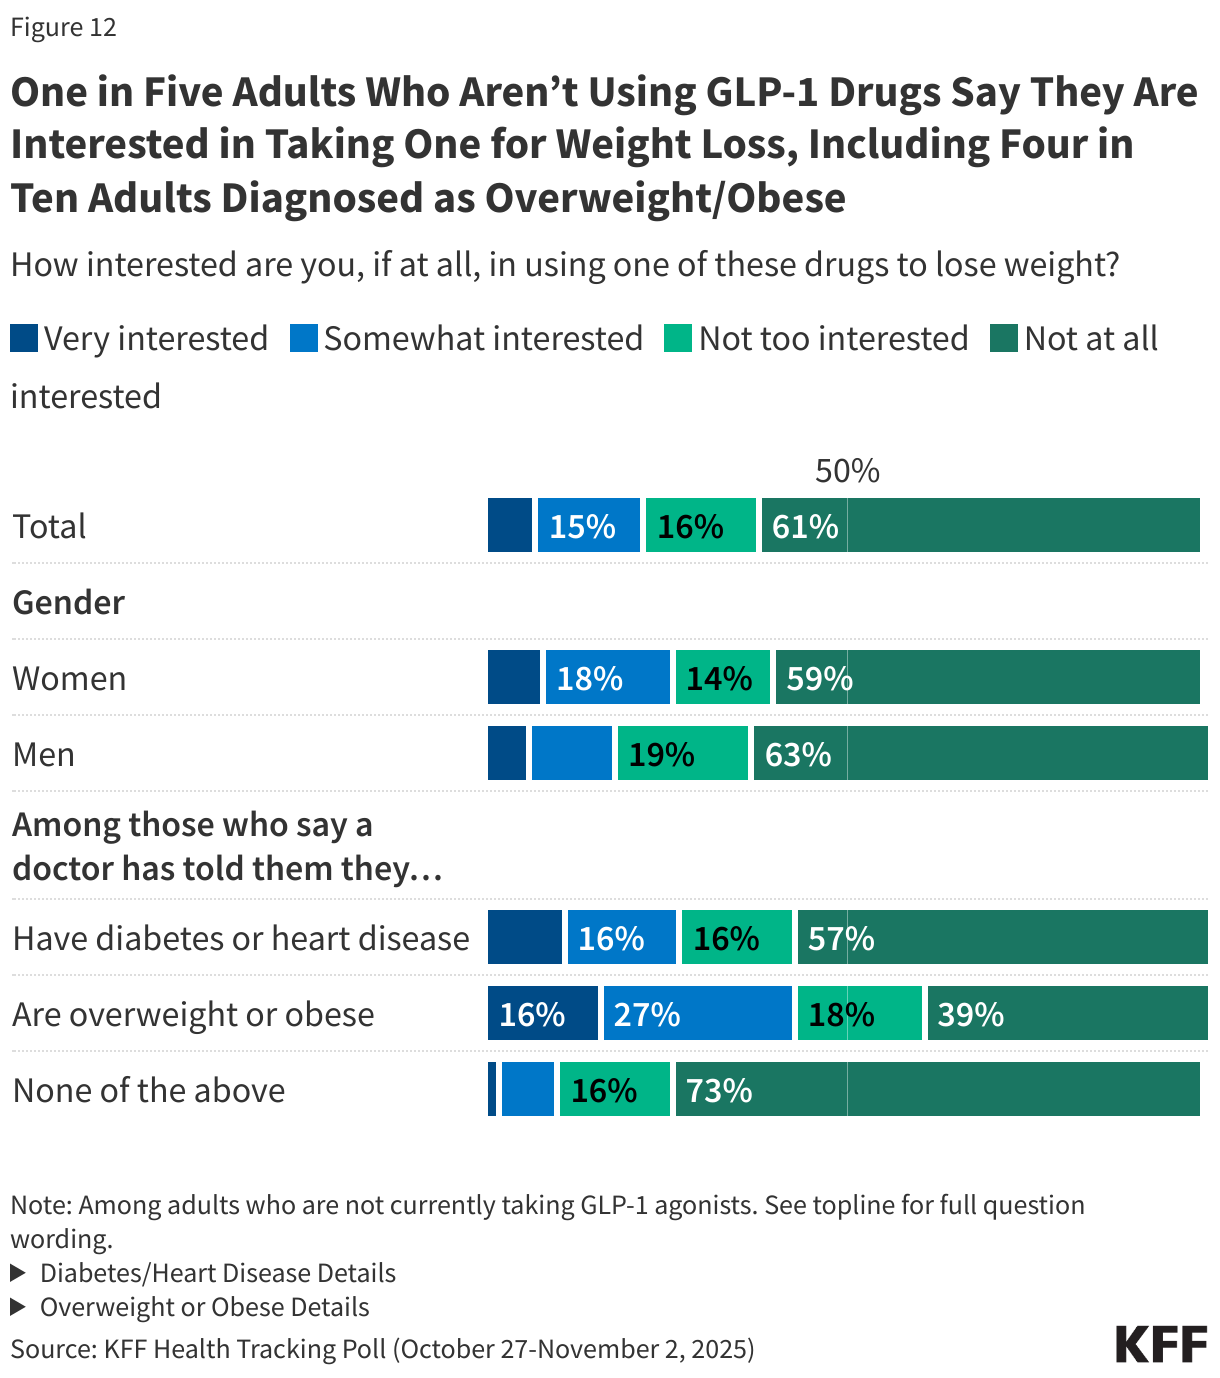
Overall, about one in five (22%) adults who are not currently taking GLP-1 drugs (88% of the public) say they would be interested in taking a GLP-1 drug to lose weight, including just 7% who say they would be “very interested.” This rises to four in ten (43%) among adults who are not currently taking a GLP-1 but report being diagnosed as overweight or obese in the past five years, and about one in four (27%) among those who say they have been diagnosed with diabetes or heart disease. Among adults who are not currently taking a GLP-1 medication, women are more likely than men to say they would be at least somewhat interested in taking these drugs to lose weight (27% v. 18%).
Methodology
This KFF Health Tracking Poll was designed and analyzed by public opinion researchers at KFF. The survey was conducted October 27-November 2, 2025, online and by telephone among a nationally representative sample of 1,350 U.S. adults in English (n=1,274) and in Spanish (n=76). The sample includes 1,031 adults (n=63 in Spanish) reached through the SSRS Opinion Panel either online (n=1,007) or over the phone (n=24). The SSRS Opinion Panel is a nationally representative probability-based panel where panel members are recruited randomly in one of two ways: (a) Through invitations mailed to respondents randomly sampled from an Address-Based Sample (ABS) provided by Marketing Systems Groups (MSG) through the U.S. Postal Service’s Computerized Delivery Sequence (CDS); (b) from a dual-frame random digit dial (RDD) sample provided by MSG. For the online panel component, invitations were sent to panel members by email followed by up to three reminder emails.
Another 319 (n=13 in Spanish) adults were reached through random digit dial telephone sample of prepaid cell phone numbers obtained through MSG. Phone numbers used for the prepaid cell phone component were randomly generated from a cell phone sampling frame with disproportionate stratification aimed at reaching Hispanic and non-Hispanic Black respondents. Stratification was based on incidence of the race/ethnicity groups within each frame. Among this prepaid cell phone component, 143 were interviewed by phone and 176 were invited to the web survey via short message service (SMS).
Respondents in the prepaid cell phone sample who were interviewed by phone received a $15 incentive via a check received by mail. Respondents in the prepaid cell phone sample reached via SMS received a $10 electronic gift card incentive. SSRS Opinion Panel respondents received a $5 electronic gift card incentive (some harder-to-reach groups received a $10 electronic gift card). In order to ensure data quality, cases were removed if they failed two or more quality checks: (1) attention check questions in the online version of the questionnaire, (2) had over 30% item non-response, or (3) had a length less than one quarter of the mean length by mode. Based on this criterion, one case was removed.
The combined cell phone and panel samples were weighted to match the sample’s demographics to the national U.S. adult population using data from the Census Bureau’s 2024 Current Population Survey (CPS), September 2023 Volunteering and Civic Life Supplement data from the CPS, and the 2025 KFF Benchmarking Survey with ABS and prepaid cell phone samples. The demographic variables included in weighting for the general population sample are gender, age, education, race/ethnicity, region, civic engagement, frequency of internet use and political party identification. The weights account for differences in the probability of selection for each sample type (prepaid cell phone and panel). This includes adjustment for the sample design and geographic stratification of the cell phone sample, within household probability of selection, and the design of the panel-recruitment procedure.
The margin of sampling error including the design effect for the full sample is plus or minus 3 percentage points. Numbers of respondents and margins of sampling error for key subgroups are shown in the table below. For results based on other subgroups, the margin of sampling error may be higher. Sample sizes and margins of sampling error for other subgroups are available on request. Sampling error is only one of many potential sources of error and there may be other unmeasured error in this or any other public opinion poll. KFF public opinion and survey research is a charter member of the Transparency Initiative of the American Association for Public Opinion Research.
| Group | N (unweighted) | M.O.S.E. |
|---|---|---|
| Total | 1,350 | ± 3 percentage points |
| Party ID | ||
| Democrats | 424 | ± 6 percentage points |
| Independents | 422 | ± 6 percentage points |
| Republicans | 412 | ± 6 percentage points |
| MAGA Republicans | 377 | ± 6 percentage points |
Endnotes
- These drugs are commonly prescribed for weight management, to treat type 2 diabetes, or to reduce the risk of heart attacks and stroke in people with cardiovascular disease. In August 2025, the U.S. Food and Drug Administration (FDA) approved the GLP-1 agonist Wegovy to treat MASH, a type of liver disease. ↩︎
- Medicare has long-been prohibited by law from covering medications used specifically for weight loss but covers GLP-1 drugs for other approved conditions like type 2 diabetes. However, the Trump administration recently announced plans to expand Medicare coverage for GLP-1s under a pilot program. Medicaid coverage of GLP-1s varies, with several states planning to restrict coverage amid the drugs’ high costs and recent cuts in federal health care spending. KFF’s 2025 Employer Health Benefits Survey found a notable increase in the share of the largest employers that cover GLP-1 medications for weight loss in the past year. Most of these employers reported that this led to increased spending, leading some to indicate they will not cover these drugs in the future. Affordable Care Act Marketplace plans often cover GLP-1 drugs, such as Ozempic, that have been approved for treatment of type 2 diabetes, but seldom cover those approved for obesity, like Wegovy and Zepbound. Marketplace plans often require prior authorization for coverage of these drugs. ↩︎