A Look at Federal Health Data Taken Offline

Published: Feb 2, 2025

On Friday January 31, 2025, several federal government datasets went offline. The datasets taken down included some widely used, large-scale national health surveys, indices, and data dashboards that inform research, policy making, and media coverage about health care and public health. For example, several Centers for Disease Control and Prevention (CDC) surveys and datasets were offline Friday and Saturday, with messages simply saying the page “was not found.” The homepage of the United States Census displayed an error message, but data.census.gov – where many datasets can be downloaded – was functioning.

By Sunday February 2, 2025, some of the landing pages started to come back online – now with a warning message: “CDC’s website is being modified to comply with President Trump’s Executive Orders,” suggesting there could be future changes. In some cases, survey data files are back online and appear to be intact, but the survey documentation (questionnaires and codebooks), which researchers use to analyze the data files, remained offline. Some related reports also remained offline. It is not yet clear whether all the datasets and their documentation that went offline will come back or remain online, and if they do, what changes, if any, will be made. It also remains to be seen what changes may be made to future data collection efforts.

The removal or modification of these data sources appears to be in response to executive orders issued by President Trump on his first day in office outlining the administration’s perspectives and approach to sex and gender and on racial equity and diversity equity and inclusion (DEI), as well as a pause on foreign assistance. An Office of Personnel Management (OPM) memorandum on the first EO directed departments and agencies to “take down all outward facing media (websites, social media accounts, etc.) that inculcate or promote gender ideology” and “withdraw any final or pending documents, directives, orders, regulations, materials, forms, communications, statements, and plans that inculcate or promote gender ideology.” Another OPM memorandum similarly directed departments and agencies to “Take down all outward facing media (websites, social media accounts, etc.) of DEIA offices”. None of these executive orders nor the OPM memos specifically mention datasets or survey data.

Federal surveys play a key role in the health surveillance system, which helps direct initiatives to address some of the most pressing health conditions and problems facing the country. For example, one of the affected datasets is CDC’s Behavioral Risk Factor Surveillance System (BRFSS), which is one of the most widely used national health surveys and has been ongoing for about 40 years. Datafiles for all years were temporarily offline and as of this writing have been reposted, but without questionnaires or codebooks. BRFSS is described on one federal website as a source of state-level “information about health risk behaviors, preventive health practices, and health care access primarily related to chronic disease and injury.” The survey has been used for decades to inform policymakers, the media, and the public on a wide range of health topics, such as obesity rates, access to breast cancer screenings, vaccination rates, and the share of people with pre-existing conditions. With sampling in every state, BRFSS data are particularly helpful for understanding health issues in low-population states and rural areas.

In reviewing KFF’s archives of the BRFSS core questionnaire, it did not include detailed questions about sexual orientation or gender identity. However, in recent years, BRFSS offered an optional module on sexual orientation and gender identity, which was implemented in most states. This supplemental data has been used by KFF to show that adults who identify as transgender are more likely than cisgender adults to be uninsured, experience depression, and report being in poor health. At the time of this writing, the BRFSS data file is back online and appears to be intact, including the question about gender identity, though the survey documentation is not online.

Another of the datasets taken offline was CDC’s Youth Risk Behavior Survey (YRBS), which, since 1990, has tracked high school students’ behaviors that can influence health and social outcomes, like smoking, drug and alcohol use, and dietary and exercise habits. Like BRFSS, the landing page and associated materials were offline but, as of the time of this writing, have returned without questionnaires or codebooks. This survey is particularly useful because it asks questions to teenagers directly, rather than surveying their parents, who may be unable or unwilling to answer questions accurately. KFF analysis of YRBS data has shown that large shares of teenagers experience persistent sadness and hopelessness, and that teenage girls experienced a sharp rise in suicidal ideation during the pandemic. Recently, the YRBS has asked respondents about their sexual orientation and gender identity, and the data has been used to highlight substantial mental health disparities among LGBTQ+ high school students, compared to their non-LGBTQ+ peers.

Several of the other datasets taken down (at least temporarily) relate to HIV/AIDS in the U.S. as well as global health efforts around the world in low and middle-income countries, including but not limited to:

  • CDC AtlasPlus: an interactive database with about 15 years of surveillance data for HIV, viral hepatitis, STD, and TB, as well as data on the social determinants of health. Additionally, CDC HIV surveillance reports dating back to the beginning of the epidemic were also removed.
  • PEPFAR Data Dashboards: PEPFAR, the U.S. global HIV/AIDS Program, comprehensive, up-to-date online data portal of program budgets and expenditures by country and service category, among other variables
  • Demographic and Health Surveys (DHS) databases: data downloads from the DHS, an ongoing set of nationally representative household surveys supported by USAID, the U.S. international development agency, with population, health, HIV, and nutrition data from more than 90 countries. Separately, the entire website for USAID has been taken down resulting in the removal of countless reports and other data sources.
  • foreignassistance.gov: The U.S. government’s website with all foreign assistance data by country, budget, expenditure, program, going back more than two decades and created to increase aid transparency.

Other federal dashboards and indices were also offline, at least temporarily, including but not limited to: Area Health Resource Files (a resource of data on health professionals, hospitals, and economic indicators), CDC’s Social Vulnerability Index (Census-based socioeconomic data used for disaster planning, response and recovery), and the Environmental Justice Index (Census tract-level data used to identify populations facing negative environmental, social and health factors).

While not the focus of this brief, other health information intended for the public has also been removed or changed, which could have implications for access to and receipt of services and other interventions.

Medicaid 1115 Waiver Watch: Round-up of Key Themes at the End of the Biden Administration

Published: Jan 31, 2025

Section 1115 Medicaid demonstration waivers offer states an avenue to test new approaches in Medicaid that differ from what is required by federal statute, so long as the approach is likely to “promote the objectives of the Medicaid program.” Waivers generally reflect priorities identified by states as well as changing priorities from one presidential administration to another. Section 1115 waivers generally are approved for an initial five-year period and can be renewed, typically for three-to-five-year periods. The Biden administration encouraged states to propose waivers that expand coverage, reduce health disparities, advance whole-person care, and improve access to behavioral health care. Some waiver initiatives, including using Medicaid to assist with reentry from incarceration, have been pursued by both Republican and Democratic governors. This waiver watch recaps key Biden administration 1115 waiver priorities and initiatives, and highlights states that received approval in each area. For the latest on Medicaid waiver activity (pending applications and approvals), visit KFF’s 1115 tracker.

Looking ahead, the new Trump administration’s waiver priorities will likely differ significantly from those of the Biden administration. However, it is unclear how the Trump administration will treat certain waivers promoted and approved by the Biden administration. The Trump administration could choose not to approve waivers that remain pending or come up for renewal (as many existing waivers are due to expire during the Trump administration) or rescind existing waiver guidance. Additionally, outlined in waiver approval terms and conditions, CMS reserves the right to withdraw 1115 waiver or expenditure authorities at any time (including those already in operation under an active/approved waiver). Although this authority has been infrequently used in the past, the Biden administration withdrew Medicaid work requirement waivers in all states that had approvals, concluding that the provisions do not promote the objectives of the Medicaid program. States can appeal withdrawal decisions to the HHS Department Appeals Board and/or challenge recissions in court.

The Biden administration approved 18 waivers authorizing evidence-based housing and nutrition services for specific high-need populations under a new “health-related social needs” (HRSN) 1115 framework. The Centers for Medicare and Medicaid Services (CMS) defines health-related social needs as an individual’s unmet, adverse social conditions (e.g., housing instability, homelessness, nutrition insecurity) that contribute to poor health and are a result of underlying social determinants of health (SDOH). In 2022, CMS announced a Section 1115 demonstration waiver opportunity to expand the tools available to states to address enrollee health-related social needs (building on guidance released at the end of the first Trump administration in 2021). In 2023, CMS issued a detailed Medicaid and CHIP HRSN framework accompanied by an Informational Bulletin, which was updated in 2024. Approvals under the HRSN framework include coverage of rent/temporary housing and utilities for up to 6 months and meal support up to three meals per day (for up to 6 months), departing from longstanding prohibitions on payment of “room and board” in Medicaid. North Carolina’s “Healthy Opportunities” pilots was originally approved during the first Trump administration (allowing the state to provide certain non-medical services targeting SDOH in limited regions of the state) but was recently renewed under the Biden administration’s HRSN framework (extending the scope of services and geographic reach). Some 1115 SDOH-related requests for housing and/or nutrition services remain pending with CMS, including Connecticut, DC, Maine, Nevada, and Rhode Island. Many HRSN waivers will face renewal during the Trump administration, with Colorado’s waiver set to expire at the end of 2025 and others (e.g., California, New York) due for renewal starting in late 2026/early 2027.

Health-Related Social Needs (HRSN) Waivers Approved as of January 20, 2025

Medicaid Pre-release Coverage for Individuals Who Are Incarcerated

The Biden administration approved 19 state waivers to facilitate reentry for individuals who are incarcerated. In April 2023, CMS released guidance encouraging states to apply for a new Section 1115 demonstration opportunity to test transition-related strategies to support community reentry for people who are incarcerated—as directed by the 2018 SUPPORT Act (which was signed into law during the first Trump administration). This demonstration allows states a partial waiver of the inmate exclusion policy, which prohibits Medicaid from paying for services provided during incarceration (except for inpatient services). Reentry services aim to improve care transitions and increase continuity of health coverage, reduce disruptions in care, improve health outcomes, and reduce recidivism rates. At a minimum, states must provide case management, medication-assisted treatment for all types of substance use disorders (with accompanying counseling), and a 30-day supply of prescription medications at the time of release. Nine states (including DC) have waivers to provide reentry services pending with CMS.

Medicaid Pre-release Waivers Approved as of January 20, 2025

Multi-year Continuous Eligibility for Children

The Biden administration approved 9 waivers that allow states to provide multi-year continuous eligibility for children (e.g., from birth to age six). The Consolidated Appropriations Act, 2023 required all states to implement 12-month continuous eligibility for children beginning on January 1, 2024. States may request Section 1115 waiver authority to provide continuous eligibility for children for longer than 12 months. Continuous eligibility has been shown to reduce Medicaid disenrollment and “churn” rates (rates of individuals temporarily losing Medicaid coverage and then re-enrolling within a short period of time). When individuals churn on and off coverage, the gaps in coverage may limit access to care or lead to delays in getting needed care, which can be especially problematic for young children who receive frequent screenings and check-ups. Most states with waivers are approved to provide continuous coverage for young children from birth to age six; some states are also approved to provide 24 months of continuous eligibility for children ages six to 19. While no additional multi-year continuous eligibility waivers for children are pending with CMS, some may remain under consideration at the state-level.

Multi-year Continuous Eligibility Waivers Approved as of January 20, 2025

How Does U.S. Life Expectancy Compare to Other Countries?

Published: Jan 31, 2025

Between 2019 and 2022, the U.S. experienced a sharper decline and a slower rebound in life expectancy than peer countries, on average, due to increased mortality and premature death rates in the U.S. from the COVID-19 pandemic. Updated life expectancy estimates in this chart collection show that in 2023, life expectancy in the U.S. returned to pre-pandemic levels, but remains lower than that of comparable countries.

This chart collection examines how life expectancy in the U.S. compares to that of other similarly large and wealthy countries in the Organisation for Economic Co-operation and Development (OECD). The countries included in the comparison are Australia, Austria, Belgium, Canada, France, Germany, Japan, Netherlands, Sweden, Switzerland, and the United Kingdom.

The analysis is available through the Peterson-KFF Health System Tracker, an information hub dedicated to monitoring and assessing the performance of the U.S. health system.

VOLUME 15

Skepticism About Vaccines and Response to Bird Flu

This is Irving Washington and Hagere Yilma. We direct KFF’s Health Information and Trust Initiative and on behalf of all of our colleagues at KFF, we’re pleased to bring you this edition of our bi-weekly Monitor.


Summary

This volume shares key findings from the latest KFF Tracking Poll on Health Information and Trust, along with updates from Robert Kennedy Jr.’s senate hearings. We also examine narratives that reflect distrust in public health messaging about bird flu, motivations for sharing information online, and how fraudulent research can sometimes inform AI chatbot models.


KFF’s latest Tracking Poll on Health Information and Trust shows declining public trust in key government health agencies with divisions along partisan lines, a continuation of a trend beginning during the COVID-19 pandemic. Compared to KFF polling from June 2023, fewer adults now say they have a “great deal” or a “fair amount” of trust in the CDC (from 66% to 61% in the latest poll), FDA (from 65% to 53%), or their state and local public health officials (from 64% to 54%) to make the right recommendations when it comes to health issues. Trust in government health agencies is divided along partisan lines, with Republicans far less likely than Democrats and independents to say they trust each of these agencies. On the other hand, about eight in ten Republicans trust President Trump, Robert F. Kennedy, Jr., and Dr. Mehmet Oz, compared to closer to one in ten Democrats.

While doctors remain the most trusted source of health recommendations among the public, this share has also decreased by eight percentage points overall, driven largely by declining trust among Republicans and independents.

Trust in Personal Doctors and Government Health Agencies Has Declined Since 2023

Recent Developments

Senate Questions Kennedy on Vaccine Views Amid Rising Parental Vaccine Hesitancy

Becky Wright / Getty Images

Robert F. Kennedy Jr. appeared before the Senate Finance Committee on Wednesday, January 29th and the Senate Committee on Health, Education, Labor, and Pensions on Thursday, January 30th for his confirmation hearings as the nominee for Department of Health and Human Services (HHS) Secretary. During the hearings, senators raised questions about Kennedy’s history of casting doubt on vaccines, including his past claims about the safety and efficacy of COVID-19, measles, and polio vaccines. Kennedy framed his position as pro-safety rather than an outright opposition to vaccines, stating that all his children are fully vaccinated. However, some senators challenged this characterization, citing his financial gains from lawsuits against vaccine manufacturers and suggesting political or financial motives for questioning vaccine safety. A KFF policy watch explains the influence Kennedy could have over vaccine approval processes, recommendations, and advisory committees as HHS Secretary. Kennedy would oversee a department that not only approves and recommends vaccines, but also one with programs providing health coverage to over half the population.

Polling Insight:

The concerns raised at the hearings come amid broader discussions about vaccine safety. While large shares of the public continue to express positive attitudes toward childhood vaccines and school vaccination requirements, KFF’s latest Tracking Poll on Health Information and Trust shows larger shares of parents now report delaying or skipping recommended vaccines for their children. Nearly one in five (17%) parents now say they have ever delayed or skipped some recommended vaccines, such as the MMR vaccine, for their children – an increase of seven percentage points since September 2023.

The false claim that the MMR vaccines have been proven to cause autism continues to persist, with most adults – including most parents – falling in the “malleable middle,” expressing some level of uncertainty about whether this claim is true or false. Parents who believe or are open to believing the falsehood that the MMR vaccines have been proven to cause autism are about four times as likely as those who say this myth is definitely or probably false to report delaying or skipping vaccines for their children (37% vs. 8%).

Parents Who Believe False Claim About MMR Vaccines Causing Autism Are More Likely To Have Skipped Some Routine Vaccines for Their Child

Vaccine Skepticism Towards Existing and Potential Bird Flu Vaccines

skodonnell / Getty Images

As bird flu spreads among animals and raises concerns about the potential for future human transmission, the Department of Health and Human Services, under the Biden Administration, announced that it is investing another $590 million to expedite the development of Moderna’s mRNA-based bird flu vaccines. However, misinformation and skepticism surrounding bird flu vaccines persist online, often misrepresenting data and undermining trust. KFF monitoring of online conversations about bird flu reveals narratives that have focused on Audenz, a bird flu vaccine that was approved by the FDA in 2020. Concerns that Audenz caused one in 200 clinical trial participants to die circulated widely on social media, pointing to a 2021 clinical trial that found some deaths (<1%) among adult participants but determined no link to the vaccine. The study’s researchers concluded, “No adult deaths were vaccine-related, and the frequency of these events was in line with U.S. mortality statistics for the age groups in question.” The misrepresentation of clinical data has stoked fear about vaccine safety before, as similar misrepresentations of deaths during COVID-19 clinical trials raised concern about the Pfizer’s COVID-19 vaccines in previous years.

In addition to misrepresenting data, online narratives often raise concerns about vaccine ingredients, reiterate resistance to bird flu vaccines, and oppose future public health measures. Some users also share anecdotes about alleged vaccine injuries from COVID-19 vaccines to argue that bird flu vaccines would cause similar harm. One online post, which received thousands of likes and reposts, said “We are not masking up. We are not PCR testing. We are not socially distancing. We are not getting mRNA vaccines. We are not locking down.” Many comments echoed this sentiment, questioned the need for public health measures, or expressed solidarity with those resisting public health guidance.

Polling Insight:

Misinformation and skepticism surrounding the bird flu vaccines echo those related to the COVID-19 vaccines. KFF’s latest Health Information and Trust poll shows that these myths have persisted, particularly among Republicans. While about one in four adults say the false claim that “more people have died from COVID-19 vaccines than have died from the COVID-19 virus,” is “definitely true” (8%) or “probably true” (18%), four in ten Republicans say it is “definitely” (13%) or “probably true” (27%), an increase from one in four Republicans who said this was at least probably true in June 2023.

Larger Shares of Republicans Now Say it is Probably or Definitely True That the COVID-19 Vaccine is More Deadly Than Virus 

Concerns About Bird Flu Reflect Distrust in Public Health Messaging

DIGICOMPHOTO/SCIENCE PHOTO LIBRARY / Getty Images

As the U.S. invests in vaccine development, along with other preventative measures, some have shared concerns beyond vaccine skepticism, suggesting that bird flu might be used as a pretext for lockdowns and food supply restrictions. KFF media monitoring research shows that these narratives are resonating with tens of thousands of people online. For example, a radio host garnered 80,000 likes and 29,000 reposts in 10 days when they shared a video on X making these claims with a caption describing bird flu as “A Plot To Shutdown Society” and an “Evil Psyop.” Many of the 2,800 comments on the post conveyed similar concerns. Skepticism is also expressed about health communicators aligned with federal health agencies. In early January, a video of Dr. Leana Wen discussing the bird flu response was captioned with an accusation that she trying to restart the “COVID-19 scam.” The post quickly attracted thousands of interactions, including comments accusing Wen, Dr. Anthony Fauci, and Bill Gates of criminal activity.

Contrary to these persistent claims, the CDC explains that the risk of bird flu to the general public remains low. However, the most common strain of bird flu can spread through contact with an infected animal’s saliva, mucus, feces, respiratory secretions, and other body fluids, so certain groups that work with livestock (e.g., farmers, backyard bird flock owners, veterinarians, and animal health responders) face increased risk due to their frequent exposure to potentially infected animals or animal byproducts. To prevent infection, the CDC recommends avoiding direct contact with infected animals, practicing good hygiene, and using personal protective equipment (PPE) when necessary. Despite the agency closely monitoring the situation, eroding trust in health institutions may undermine public confidence in these prevention strategies and guidance.

Polling Insight:

The latest KFF Tracking Poll on Health Information and Trust finds that forty-four percent of U.S. adults are “very” or “somewhat concerned” that there will be a widespread outbreak of bird flu in the U.S., while fewer (34%) say they are concerned that they or someone in their family will get sick. Majorities of Democrats, Hispanic adults, and adults in lower income households express concern about a widespread outbreak of bird flu, and each of these groups is more likely than their counterparts to say they are concerned they or their families will get sick.

Just Under Half Are Concerned About a Widespread Outbreak of the Bird Flu in the U.S., a Third Worried That They or Someone in Their Family Will Get Sick 

Research Insights

Desire for Power and Influence Linked to Increased Online Misinformation Sharing

Krongkaew / Getty Images

Research published in Computers in Human Behavior investigated how power motives influence social media behavior, particularly the spread of false or misleading information. Across four studies, individuals with strong power motives—those who prioritize influence, authority, and control—were found to actively share content, including fake news, driven by a desire to assert influence and control narratives within online networks. Power values were stronger predictors of misinformation sharing than dominance or context-specific power goals, meaning that people who value power are more likely to share misinformation, regardless of whether they are trying to dominate others or act strategically. While actual power had minimal impact, power-motivated individuals showed moral leniency by using misinformation to enhance visibility and network centrality. The findings suggest that power-motivated individuals use manipulable narratives to achieve social influence, although real-world dynamics and other contributing factors such as social skills and charisma warrant further exploration.

Source: Guinote, A., Kossowska, M., Jago, M., Idenekpoma, S., & Biddlestone, M. (2025). Why do people share (mis) information? Power motives in social media. Computers in Human Behavior162, 108453.

Monitoring and Addressing Misleading Ads for Alternative Cancer Treatments

Olena Malik / Getty Images

A study in the HKS Misinformation Review explored how alternative cancer clinics used Google search ads to target cancer patients seeking information about treatment, prognosis, and options. Between 2012 and 2023, these clinics spent more than $15 million on Google ads, resulting in millions of website visits. The ads often mimicked sensitive patient queries, such as those related to cancer survival rates and top treatment centers, only to redirect users to clinics offering unproven therapies. The research highlights the need for health communicators to monitor, pre-bunk, and debunk misleading ads promoting non-evidence-based cancer treatments. Understanding the types of alternative treatments being marketed through these ads is important to help address misinformation before patients encounter it.

Source: Zenone, M., Marcon, A., Kenworthy, N., van Schalkwyk, M., Caulfield, T., Hartwell, G., & Maani, N. (2024). Google allows advertisers to target the sensitive informational queries of cancer patients. Harvard Kennedy School Misinformation Review.


AI & Emerging Technology

Fraudulent Research Can ‘Poison’ LLM Training Datasets

Bill Hinton / Getty Images

Large Language Models (LLMs), such as ChatGPT, are trained on large datasets, often including publicly available information from the internet. However, the quality and reliability of these data sources can limit the accuracy and trustworthiness of the models. A recent study in Nature explored how the inclusion of fraudulent scientific papers in publicly available repositories can contribute to misinformation. These fraudulent studies, often produced by paper mills, mimic legitimate research but lack rigorous peer review. When such content is used to train LLMs, it risks perpetuating inaccuracies and false claims, particularly in sensitive areas such as health information. According to the study, even when only 0.01% of the training data was corrupted, 10% of the responses contained errors, including false claims about vaccine effectiveness and misidentified medications.

About The Health Information and Trust Initiative: the Health Information and Trust Initiative is a KFF program aimed at tracking health misinformation in the U.S., analyzing its impact on the American people, and mobilizing media to address the problem. Our goal is to be of service to everyone working on health misinformation, strengthen efforts to counter misinformation, and build trust. 


View all KFF Monitors

The Monitor is a report from KFF’s Health Information and Trust initiative that focuses on recent developments in health information. It’s free and published twice a month.

Sign up to receive KFF Monitor
email updates


Support for the Health Information and Trust initiative is provided by the Robert Wood Johnson Foundation (RWJF). The views expressed do not necessarily reflect the views of RWJF and KFF maintains full editorial control over all of its policy analysis, polling, and journalism activities. The Public Good Projects (PGP) provides media monitoring data KFF uses in producing the Monitor.

Medicaid Financing: The Basics

Published: Jan 29, 2025

Medicaid represents nearly $1 out of every $5 spent on health care in the U.S. and is the major source of financing for states to provide health coverage and long-term care for low-income residents. Medicaid is administered by states within broad federal rules and jointly funded by states and the federal government through a federal matching program with no cap. With Donald Trump returning to the presidency and Republican control of the Senate and House, discussions are ramping up about major cuts to federal spending, including federal Medicaid spending, through a new government efficiency initiative and to help pay for an extension of tax cuts in the 2017 Tax Cuts and Jobs Act. Restricting federal Medicaid spending could leave states with tough choices about whether to offset reductions with state dollars, limit Medicaid utilization or benefits, or reduce coverage. Amid uncertainty for Medicaid financing at the federal level, states have also reported uncertainty regarding post-unwinding Medicaid spending and enrollment trends and recent shifts in state fiscal conditions. This brief examines the following key questions ahead of potential proposals to change Medicaid financing:

  • How does Medicaid financing work?
  • How much does Medicaid cost and how are funds spent?
  • How does Medicaid relate to federal and state budgets?
  • What factors affect Medicaid spending changes?

How does Medicaid financing work?

Medicaid financing is shared by states and the federal government with a guarantee to states for federal matching payments with no pre-set limit. The percentage of costs paid by the federal government (known as the federal medical assistance percentage or “FMAP”) varies across states, for specific services and types of enrollees, and depending on whether the costs are for medical care or program administration. The match rate has also been temporarily adjusted during economic downturns and most recently during the COVID-19 pandemic.

The FMAP for services used by people eligible through traditional Medicaid, which includes individuals who are eligible as children, low-income parents, because of disability, or because of age (65+), is determined by a formula set in statute. The formula is designed so that the federal government provides a match rate of at least 50% and provides a higher match rate for states with lower average per capita income. The resulting FMAP varies by state and ranged from 50% (the FMAP “floor”) in ten states (California, Colorado, Connecticut, Maryland, Massachusetts, New Hampshire, New Jersey, New York, Washington, and Wyoming) to 77% in Mississippi for federal fiscal year (FFY) 2026 (Figure 1).

States With Lower Per Capita Incomes Have a Higher Federal Matching Rate for Medicaid

To participate in Medicaid and receive federal matching dollars, states must meet core federal requirementsStates must provide certain mandatory benefits (e.g., hospital, physician, and nursing home services) to core populations (e.g., low-income pregnant women, children, people with disabilities, and people ages 65 and older) without waiting lists or enrollment caps. States may also receive federal matching funds to cover “optional” services (e.g., adult dental care and home care, also known as home and community based services) or “optional” groups (e.g. people with income above the limits established for core populations). States also have discretion to determine how to purchase covered services (e.g., through fee-for-service or capitated managed care arrangements) and to establish provider payment methods and rates.

Medicaid also provides “disproportionate share hospital” (DSH) payments to hospitals that serve a large number of Medicaid and low-income uninsured patients to offset uncompensated care costs. DSH payments totaled over $17 billion in FFY 2023. Federal DSH spending is capped for each state and facility but within those limits, states have considerable discretion in determining the amount of DSH payments to each DSH hospital. The Affordable Care Act (ACA) called for a reduction in federal DSH allotments starting in FFY 2014 based on the assumption of reduced rates of uninsurance, but the cuts have been delayed several times (most recently delayed until April 1, 2025). DSH is one type of a broader set of “supplemental” payments that states make to supplement Medicaid “base” payment rates that often do not fully cover provider costs; unlike other supplemental payments, DSH payments can also be used to pay for unpaid costs of care for the uninsured.

There are special match rates for the ACA expansion group, administration, and other services. While the traditional FMAP applies to the vast majority of Medicaid spending, there are a few exceptions that provide higher match rates for specific services or populations, such as family planning and most notably people covered under the ACA Medicaid expansion. States that have implemented the expansion currently receive a 90% FMAP for adults covered through the ACA Medicaid expansion. States that had not adopted the expansion as of 2021 when the American Rescue Plan Act was enacted are eligible for a 5% increase in the state’s traditional FMAP for two years if they implement the expansion. Administrative costs incurred by states are usually matched by the federal government at a 50% rate, but some functions such as eligibility and enrollment systems receive higher match rates. Medicaid administrative costs are less than 4% of total Medicaid spending.

Unlike in the 50 states and D.C., annual federal funding for Medicaid in the U.S. territories is subject to a statutory cap and fixed matching rate. Once a territory exhausts its capped federal funds, it no longer receives federal financial support for its Medicaid program during that fiscal year. Over time, Congress has provided increases in federal funds for the territories broadly and in response to specific emergency events. Various pieces of legislation during the pandemic significantly increased the allotments for each of the territories and also raised the FMAP rates from the statutory level of 55% to 76% for Puerto Rico and 83% for the other territories. The 2023 Consolidated Appropriations Act extended the 76% FMAP for Puerto Rico through FFY 2027 and made the 83% match rate for other territories permanent.

Both the federal government and states are responsible for promoting program integrity. Program integrity broadly refers to the proper management and function of the Medicaid program to ensure it is providing quality and efficient care while using funds–taxpayer dollars–appropriately, with minimal waste. Improper payment reports in recent years have highlighted program integrity issues, and both the previous Trump Administration and the Biden Administration worked to advance program integrity, though through different means. Improper payments, which are often cited when discussing program integrity, are payments that do not meet Centers for Medicare and Medicaid Services (CMS) program requirements (they can be overpayments, underpayments, or payments with insufficient information to determine whether the payment was proper). Improper payments are not the same as criminal activities like fraud and abuse, which may be a subset of improper payments. CMS estimated the overall Medicaid improper payment rate was about 5% in 2024, the lowest rate since the COVID-19 pandemic began due, in part, to flexibilities granted during that time. Most improper payments (79%) were due to insufficient information (or missing administrative steps), not necessarily due to payments for ineligible enrollees, providers, or services (i.e., since they may have been payable if the missing information had been on the claim and/or the state had complied with requirements). The improper payment estimation process is not designed to detect or measure fraud. Program integrity efforts focused on areas identified as major contributors of improper payments, such as monitoring provider screening and enrollment for noncompliance, likely yield greater returns than focusing on reducing errors in eligibility determinations that could make it more difficult for eligible people to obtain and maintain coverage.

How much does Medicaid cost and how are funds spent?

Capitated payments to Medicaid managed care organizations (MCOs) accounted for more than half of Medicaid spending in FFY 2023 (Figure 2). Managed care and health plans accounted for the largest share (55%) of Medicaid spending, with capitated payments to comprehensive MCOs accounting for 52% of Medicaid spending in FFY 2023 and other Medicaid managed care (e.g., primary care case management (PCCM) arrangements or payments to specialty plans) accounting for another 3%. Smaller shares of total Medicaid spending in FFY 2023 were for fee-for-service acute care (21%), fee-for-service long-term care (19%), Medicaid spending for Medicare premiums on behalf of enrollees who also have Medicare (3%), and DSH payments (2%).

Payments to Comprehensive MCOs Account for More Than Half of Total National Medicaid Spending

Enrollees eligible based on disability or age (65+) comprise 23% of all enrollees but account for over half of total spending due to higher per person costs (Figure 3). Children account for 34% of enrollees but only 14% of spending. Adult enrollees (those made eligible under the ACA Medicaid expansion, as well as low-income parents) account for 43% of all enrollees and 34% of spending. The disproportionate spending on certain eligibility groups stems from variation in spending per enrollee across the eligibility groups, reflecting differences in health care needs and utilization. Spending per enrollee for individuals eligible based on age (65+) and disability, the two groups with the highest per enrollee costs, is approximately six times higher than spending per enrollee for children, who had the lowest spending of any eligibility group. Those eligible on the basis of age or disability tend to have higher rates of chronic conditions, more complex health care needs and are more likely to utilize long-term care than other enrollees, contributing to higher spending.

People Eligible for Medicaid Based on Disability or Age (65+) Accounted for 1 in 4 Enrollees but Over Half of All Spending in 2021

Total spending per full-benefit enrollee ranged from a low of $3,750 in Tennessee to $12,425 in the District of Columbia in 2021 (Figure 4). Variation in spending across the states reflects considerable flexibility for states to design and administer their own programs – including what benefits are covered and how much providers are paid — and variation in the health and population characteristics of state residents. Within each state, there is also substantial variation in the average costs for each eligibility group and within each eligibility group, per enrollee costs may vary significantly. Overall, Medicaid spending has experienced slower cumulative growth since 2008 compared to Medicare and private insurance on a per-enrollee basis.

Medicaid Spending Per Full-Benefit Enrollee Varies Across State

Overall, Medicaid spending totaled $880 billion in FFY 2023 with the federal government paying 69% ($606 billion) and states paying 31% ($274 billion). This share is slightly higher than historic shares due to the enhanced pandemic match rate, but there is variation across states (Figure 5). The combination of low per capita income and adopting the ACA expansion are both factors in determining the overall share of federal spending on Medicaid. While the federal share of Medicaid spending varies across states, so does the total amount of federal Medicaid dollars coming into the state. States with the largest populations (California, New York, Texas, Pennsylvania, Ohio) receive the most federal Medicaid funding.

The Federal Government Paid Over Two-Thirds of Total Medicaid Spending in FFY 2023 Though the Share and Amount Varies By State

How does Medicaid relate to federal and state budgets?

Social Security, Medicare, and Medicaid are the three main entitlement programs and accounted for 41% of all federal outlays in FFY 2024 (Figure 6). Of these three programs, Medicaid is smallest in terms of federal outlays, though it covers a larger number of people than Medicare or Social Security. Overall, federal spending on domestic and global health programs and services accounted for more than one-fourth of net federal outlays in FFY 2024, including spending on Medicare (12%), Medicaid and CHIP (8%), and other health spending (6%). It is expected that in 2025, the new Congress and Administration will leverage reconciliation to make major reductions in spending which can offset some of the costs of extending the expiring tax cuts. Budget reconciliation is a special legislative process used to make changes to taxes and mandatory spending that allows the Senate to pass legislation with only 50 votes rather than the customary 60 votes. To begin the reconciliation process, Congress must develop a budget resolution, which establishes spending levels including any large deficit or spending reduction targets. With President-elect Trump taking substantial cuts to Medicare and Social Security off the table, there will be significant pressure to reduce spending on Medicaid.

Medicaid Accounted for 8% of Net Federal Outlays in FFY 2024

Medicaid is a spending item and at the same time the largest source of federal revenues for state budgets. As a result of the federal matching structure, Medicaid has a unique role in state budgets as both an expenditure item and a source of federal revenue for states. According to data from the National Association of State Budget Officers (NASBO), in state fiscal year (SFY) 2023, Medicaid accounted for 30% of total state spending for all items in the budget (Figure 7). Medicaid accounted for only 15% of expenditures from state funds (including state general funds and other state funds), second to K-12 education (23%). On the other hand, Medicaid accounted for 57% of all expenditures from federal funds. States have an incentive to control Medicaid spending because they pay a share of Medicaid costs. At the same time, research shows that federal matching dollars from Medicaid spending have positive effects for state economies. A number of studies show that states that have adopted the ACA Medicaid expansion have realized budget savings, revenue gains, overall economic growth as well as observed positive effects on the finances of hospitals and other health care providers.

Medicaid is the Largest Single Source of Federal Funds for States

States can use provider taxes and IGTs (intergovernmental transfers) to help finance the state share of Medicaid. States have flexibility in determining how to finance the non-federal share of state Medicaid payments, within certain limits. In addition to state general funds appropriated directly to the Medicaid program, most states use funding from local governments or revenue collected from provider taxes and fees to help finance the state share of Medicaid. While data are limited, the Government Accountability Office (GAO) estimated that provider taxes accounted for approximately 17% of the non-federal share of total Medicaid payments in SFY 2018 though the share varies by state. All states (except Alaska) have at least one provider tax in place and many states have more than three (Figure 8). The most common provider taxes are on nursing facilities (46 states) and hospitals (45 states). As of July 1, 2024, 48 states including DC also reported at least one provider tax that is above 3.5% of net patient revenues, and 38 states including DC also reported at least one provider tax that is above 5.5%, which is close to the maximum federal safe harbor or allowable threshold of 6%. Provider taxes and funds from local governments are often used by states to help finance DSH payments, non-DSH supplemental payments like upper payment limit (UPL) payments, and MCO state directed payments (uniform payment increases through managed care that are similar to supplemental payments). New Medicaid managed care rules finalized in 2024 permit states to pay hospitals and nursing facilities at the average commercial payment rate (ACR) when using directed payments, contributing to expected increases in federal Medicaid spending projections.

All States but Alaska Had at Least One Provider Tax and Many States had Three or More Provider Taxes in SFY 2024

What factors affect Medicaid spending changes?

Medicaid enrollment and spending typically increase during recessions. Medicaid is a counter-cyclical program, meaning that more people become eligible and enroll during economic downturns. At the same time, states typically may face declines in revenues that make it difficult to finance the state share of funding for the program. As in past economic downturns, Congress enacted legislation during the recent pandemic-induced recession that temporarily increased the federal share of Medicaid spending to help states maintain their Medicaid programs. In exchange, states were required to keep individuals continuously enrolled in Medicaid, contributing to historic growth in Medicaid enrollment. High enrollment growth rates, tied first to the Great Recession, then ACA implementation, and later the pandemic, were the primary drivers of total Medicaid spending growth over the last decade (Figure 9). The continuous enrollment provision ended on March 31, 2023, and Medicaid enrollment growth has since declined and total spending growth has slowed.

The Pandemic and Pandemic-Era Policies Had Significant Implications for Medicaid Spending and Enrollment

Medicaid spending is also driven by other external factors and policy choices. Other external factors can include state fiscal conditions and the costs of providing health services and long-term care. In KFF’s latest annual budget survey, states reported inflation and workforce shortages were driving higher labor costs, resulting in pressure to increase provider rates. State policy choices include changes to eligibility, benefits, or provider reimbursement as well as delivery system reforms. Recent eligibility changes include the adoption of the ACA Medicaid expansion in seven states since 2020 as well as other expansions for children. KFF’s annual budget survey also found many states were implementing benefit enhancements, particularly for mental health and/or substance use disorder services, as well as authorizing a wide range of provider rate increases, particularly for direct care workers in nursing facilities and those providing home care to help address workforce shortages.

Medicare Advantage Insurers Made Nearly 50 Million Prior Authorization Determinations in 2023

Published: Jan 28, 2025

Virtually all enrollees in Medicare Advantage (99%) are required to obtain prior authorization for some services – most commonly, higher cost services, such as inpatient hospital stays, skilled nursing facility stays, and chemotherapy. This contrasts with traditional Medicare, where only a limited set of services, including certain outpatient hospital services, non-emergency ambulance transport, and durable medical equipment, require prior authorization (see Box 1).

Prior authorization requirements are intended to ensure that health care services are medically necessary by requiring approval before a service or other benefit will be covered. Medicare Advantage insurers typically use prior authorization, along with other tools, such as provider networks, to manage utilization and lower costs. This may contribute to their ability to offer extra benefits and reduced cost sharing, typically for no additional premium, while maintaining strong financial performance. At the same time, prior authorization processes and requirements, including the use of artificial intelligence to review requests, may result in administrative hassles for providers, delays for patients in receiving necessary care, and in some instances, denials of medically necessary services, such as post-acute care.

This analysis uses data submitted by Medicare Advantage insurers to the Centers for Medicare and Medicaid Services (CMS) to examine the trends in the number of requests for prior authorization determinations, denials, and appeals for 2019 through 2023, as well as differences across Medicare Advantage insurers. It does not include determinations or denials by type of service or plan because CMS does not collect or report this information, though such data could help inform consumers in choosing among plans. It also presents data from CMS about the use of prior authorization in traditional Medicare, including the number of reviews and denials for 2021 through 2023, and the share appealed and the outcome of the appeal for 2021 and 2022 (the 2023 data do not include this information).

Key Takeaways:

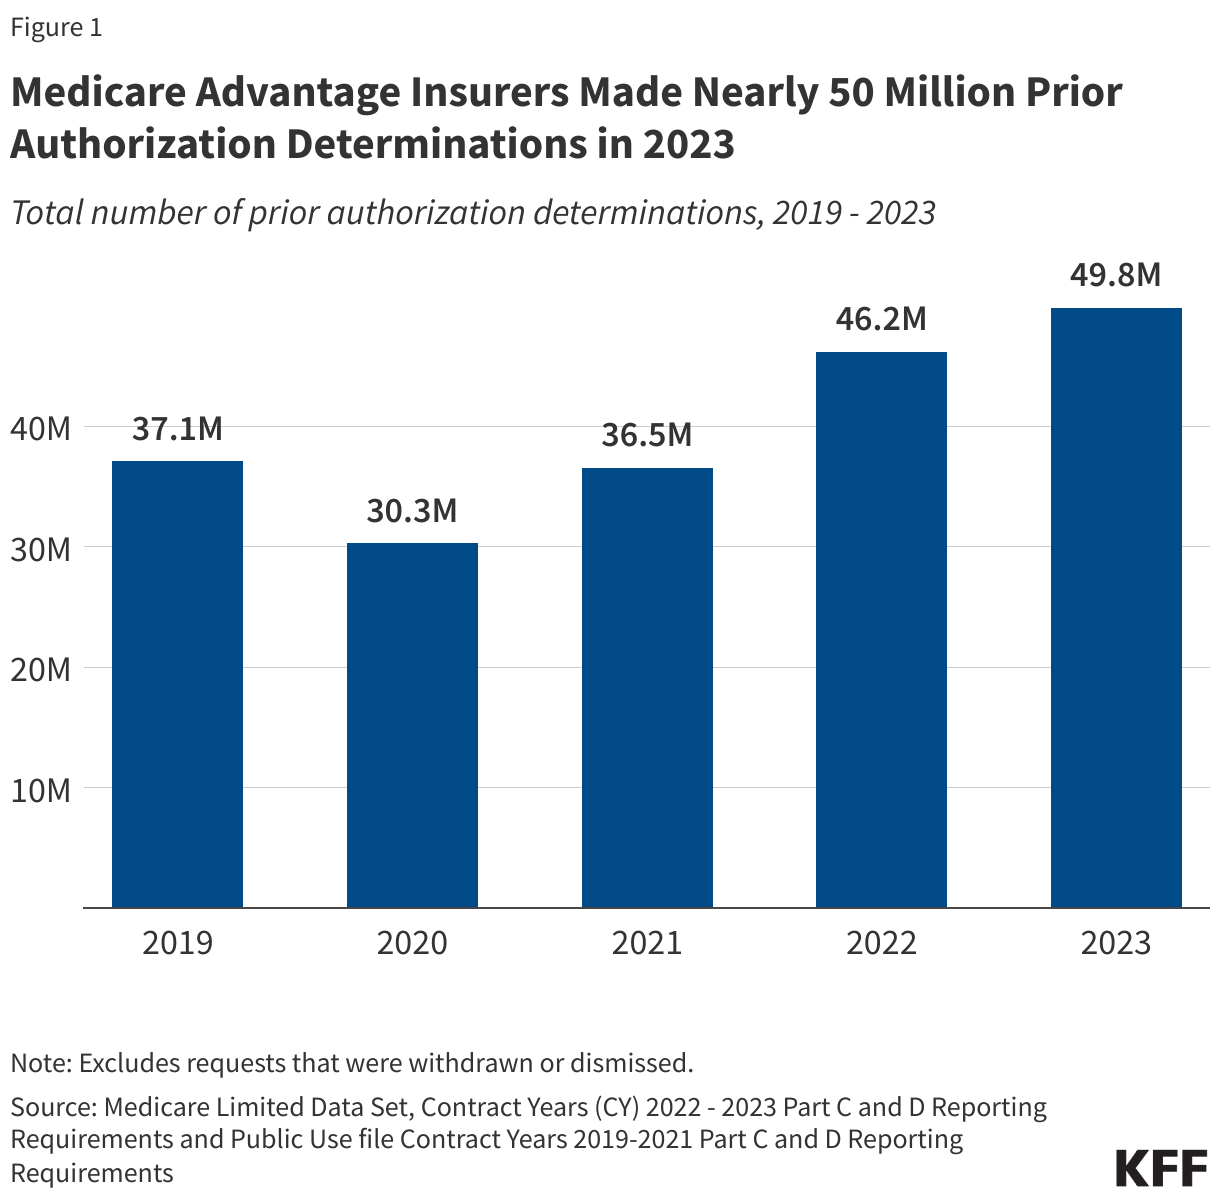
  • Medicare Advantage insurers made nearly 50 million prior authorization determinations in 2023, reflecting steady year-over-year increases since 2021 (37 million) and 2022 (46 million) as the number of people enrolled in Medicare Advantage has grown. The determinations represent requests for approval that providers are required to submit before providing a service. Substantially fewer prior authorization reviews for traditional Medicare beneficiaries were submitted to CMS – just under 400,000 in fiscal year 2023 – though the number of people enrolled in Medicare Advantage and traditional Medicare were similar in these years.
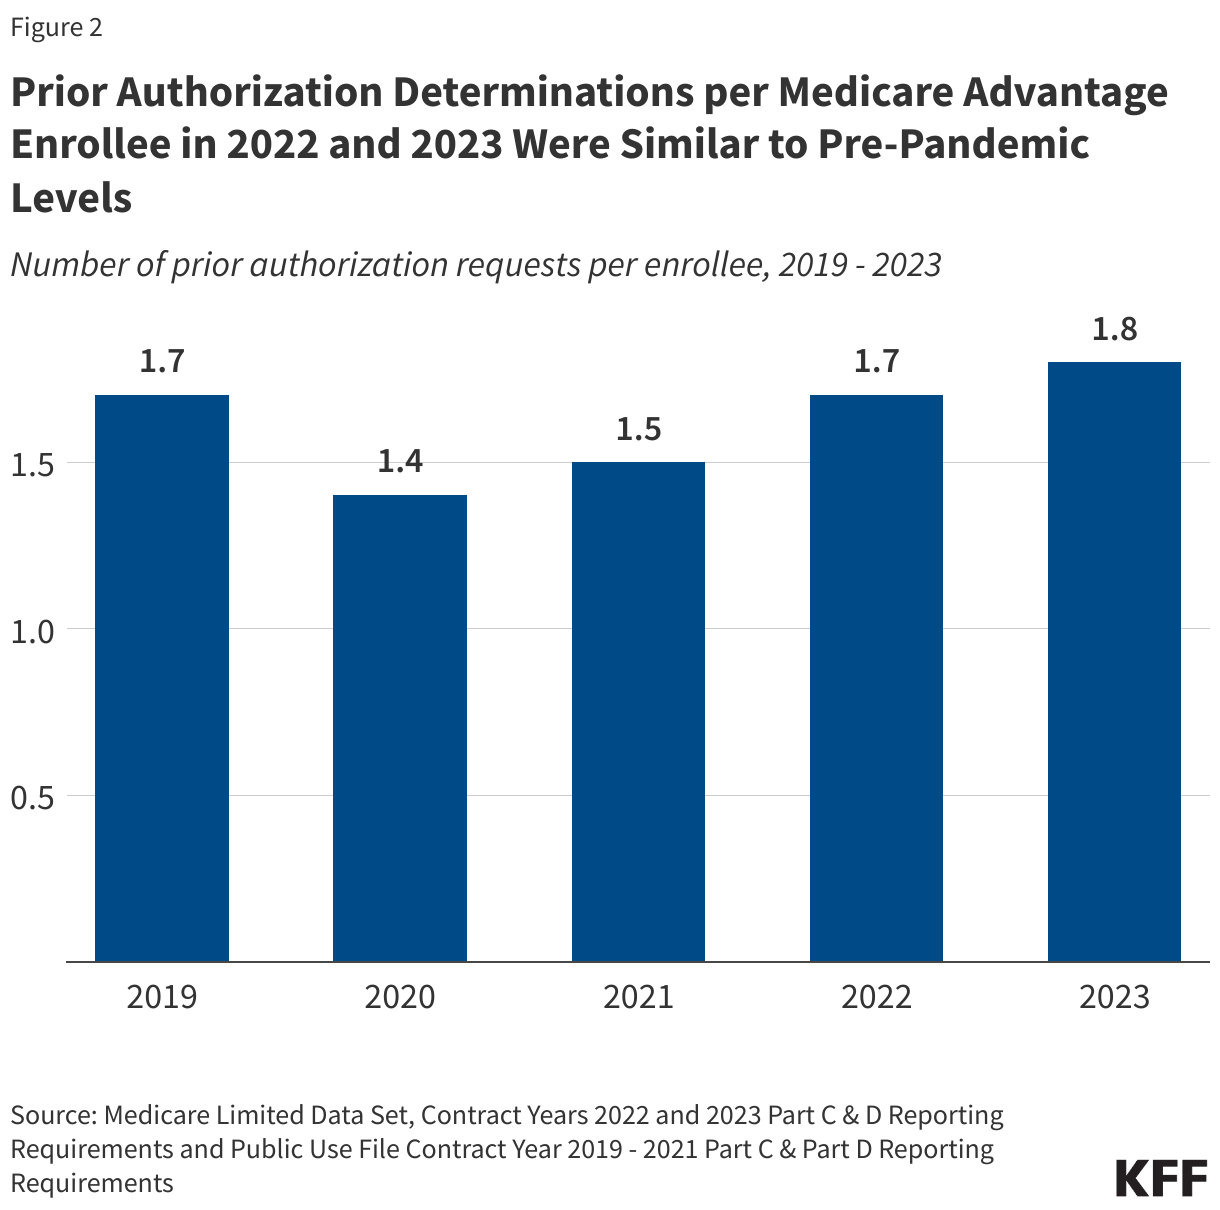
  • In 2023, there were nearly 2 prior authorization determinations on average per Medicare Advantage enrollee, similar to the amount in 2019. In contrast, in 2023, about 1 prior authorization review was submitted per 100 traditional Medicare beneficiaries – a rate of about 0.01 per person — which reflects the limited set of services subject to prior authorization in traditional Medicare.
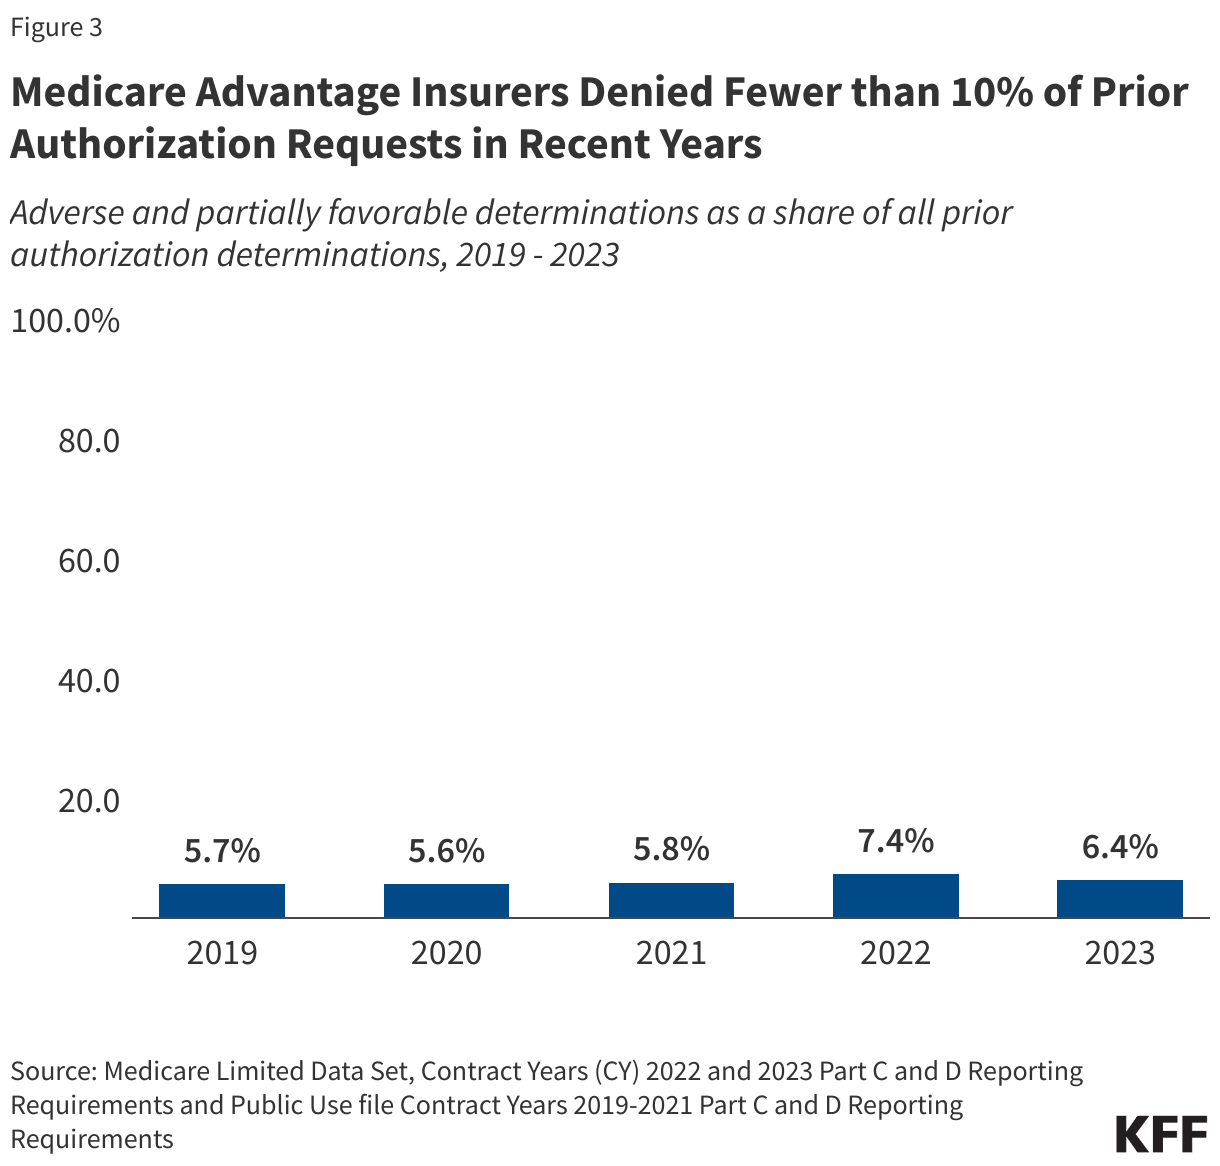
  • In 2023, insurers fully or partially denied 3.2 million prior authorization requests, which is a somewhat smaller share (6.4%) of all requests than in 2022 (7.4%). Though there were substantially fewer prior authorization reviews for traditional Medicare beneficiaries, a larger share was denied – 28.8% in 2023.  Denial rates varied across the limited set of services subject to prior authorization in traditional Medicare.
  • A small share of denied prior authorization requests was appealed in Medicare Advantage (11.7% in 2023). That represents an increase since 2019, when 7.5% of denied prior authorization requests in Medicare Advantage were appealed. A relatively small share of denied prior authorization reviews was appealed in traditional Medicare (6.4% in 2022) as well.
  • Though a small share of prior authorization denials were appealed to Medicare Advantage insurers, most appeals (81.7%) were partially or fully overturned in 2023. That compares to less than one-third (29%) of appeals overturned in traditional Medicare in 2022. These requests represent medical care that was ordered by a health care provider and ultimately deemed necessary but was potentially delayed because of the additional step of appealing the initial prior authorization decision. Such delays may have negative effects on a person’s health.

Prior authorization practices have gotten a fair amount of attention in recent years. During the Biden Administration, CMS finalized three rules related to the use of prior authorization in Medicare Advantage. Among other changes, the three rules clarify the criteria that may be used by Medicare Advantage plans to establish prior authorization policies, streamline the prior authorization process for Medicare Advantage and certain other insurers, and require Medicare Advantage plans to evaluate the effect of prior authorization policies on people with certain social risk factors. In December 2024, the outgoing Biden Administration proposed further changes, including clarifying coverage requirements in Medicare Advantage. The Trump Administration will have an opportunity to modify or finalize these proposed changes and may propose additional regulatory changes. Additionally, lawmakers in Congress have held hearings, requested detailed data from the largest Medicare Advantage insurers, and introduced several bills to improve transparency and reform other aspects of prior authorization (see Box 2). Despite bipartisan support encompassing a majority of members in both houses of Congress, legislation on the use of prior authorization has not been enacted.

Use of Prior Authorization in Medicare Advantage

As part of its oversight of Medicare Advantage plans, CMS requires Medicare Advantage insurers to submit data for each Medicare Advantage contract (which usually includes multiple plans) that includes the number of prior authorization determinations made during a year, and whether the request was approved. Insurers are additionally required to indicate the number of initial decisions that were appealed (reconsiderations) and the outcome of that process, including whether the initial decision was affirmed, partially overturned, or fully overturned. These data are useful for assessing overall trends and variations across insurers, but do not contain the information necessary to understand how the use of prior authorization varies by type of service or type of plan.

In 2023, Medicare Advantage insurers made nearly 50 million prior authorization determinations.

After dropping in 2020 amid the initial phase of the COVID-19 pandemic, prior authorization determinations increased steadily between 2021 and 2023 (Figure 1). The decline in 2020 was likely due to both a decline in utilization, as well as the option for insurers to temporarily pause prior authorization requirements during the public health emergency.

Nearly 50 Million Prior Authorization Requests Were Submitted to Medicare Advantage Insurers in 2023

The recent increase in the total number of prior authorization determinations since 2020 corresponds to an increase in Medicare Advantage enrollment. Between 2019 and 2023, the number of Medicare Advantage enrollees rose from 22 million people to 31 million people. In 2019, there were approximately 1.7 prior authorization determinations per Medicare Advantage enrollee. That number dropped at the onset of the COVID-19 pandemic to 1.4 in 2020 and 1.5 in 2021, before returning to the pre-pandemic level of 1.7 determinations per enrollee in 2022 and rising slightly to 1.8 in 2023 (Figure 2).

Prior Authorization Requests per Medicare Advantage Enrollee in 2022 and 2023 Were Similar to Pre-Pandemic Levels

Medicare Advantage insurers denied 3.2 million (6.4%) prior authorization requests in 2023.

Of the 49.8 million prior authorization determinations in 2023, more than 90% (46.6 million) were fully favorable, meaning the requested item or service was approved in full. However, the remaining 3.2 million prior authorization determinations (6.4%) were unfavorable, meaning they were denied in full or in part by Medicare Advantage insurers. This is slightly lower than the 7.4% of requests that were denied in 2022 (which amounted to 3.4 million denials) (Figure 3). Both the share and number of requests denied was higher in 2023 than in 2019. Across all years, most denials (81% in 2023, data not shown) were denied in full, while a minority of denials were determined to be partially favorable, meaning that only part of the request was approved. For example, the insurer may have approved 10 of 14 requested therapy sessions.

Medicare Advantage Insurers Denied Fewer than 10% of Prior Authorization Requests in Recent Years

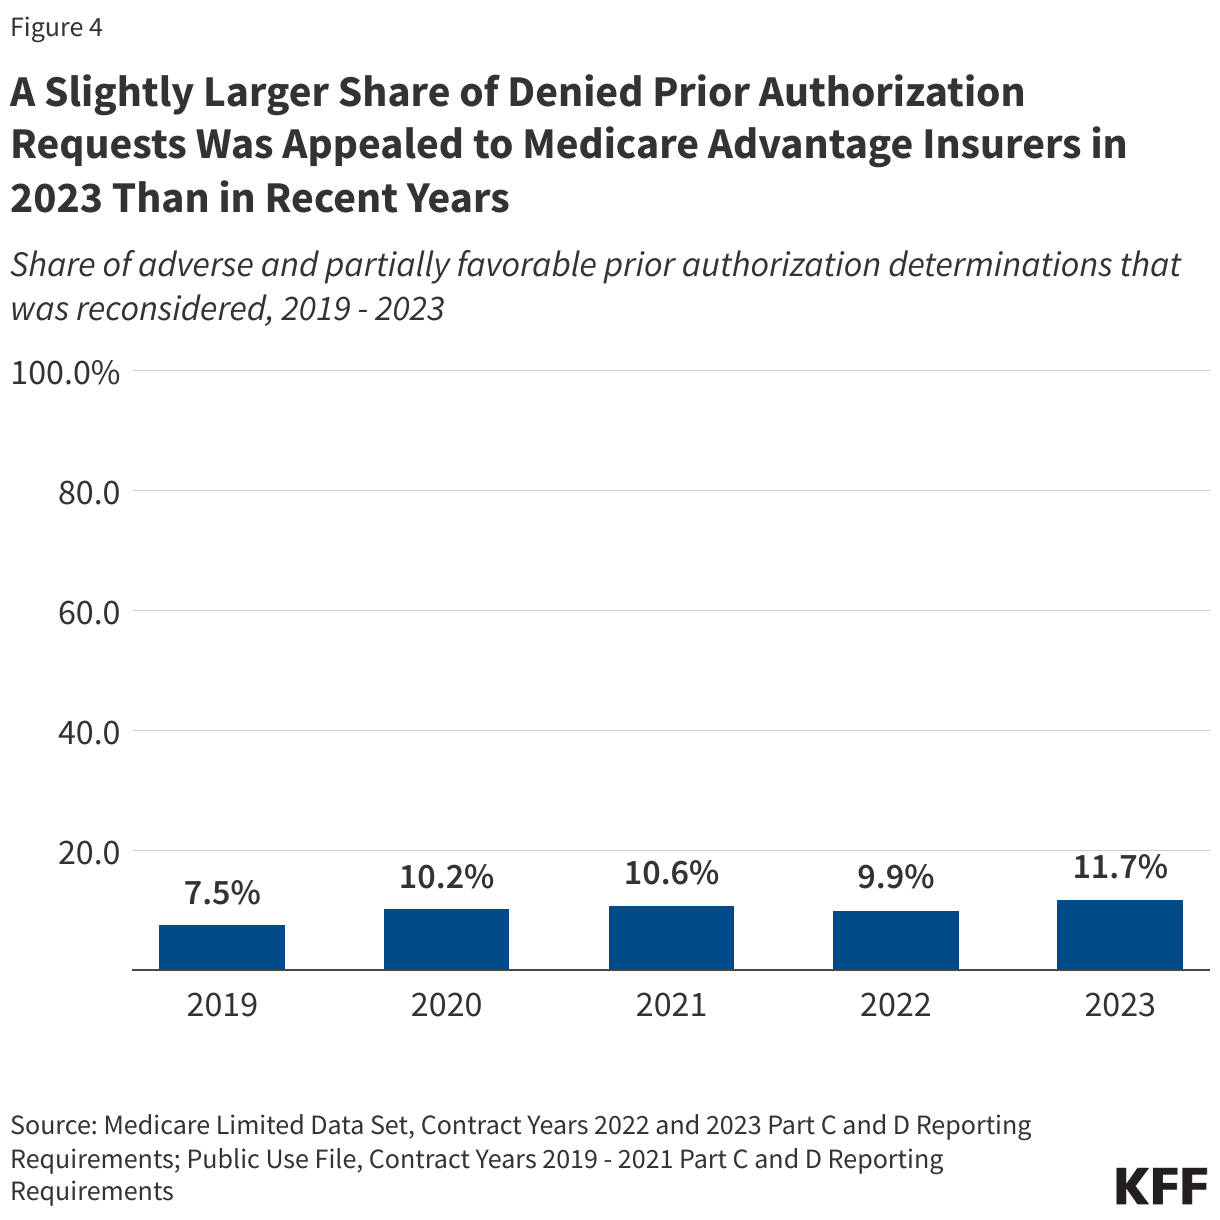
Just 11.7% of denied prior authorization requests were appealed to Medicare Advantage insurers in 2023.

The majority of the 3.2 million denied prior authorization requests were not appealed, similar to previous years. In 2019, just 7.5% of all denials were appealed. That share increased somewhat in 2020 to 10.2% and was relatively stable in 2021 (10.6%) and 2022 (9.9%) (Figure 4). These include appeals of determinations that were both fully and partially denied.

A Slightly Larger Share of Denied Prior Authorization Requests Was Appealed to Medicare Advantage Insurers in 2023 Than in Recent Years

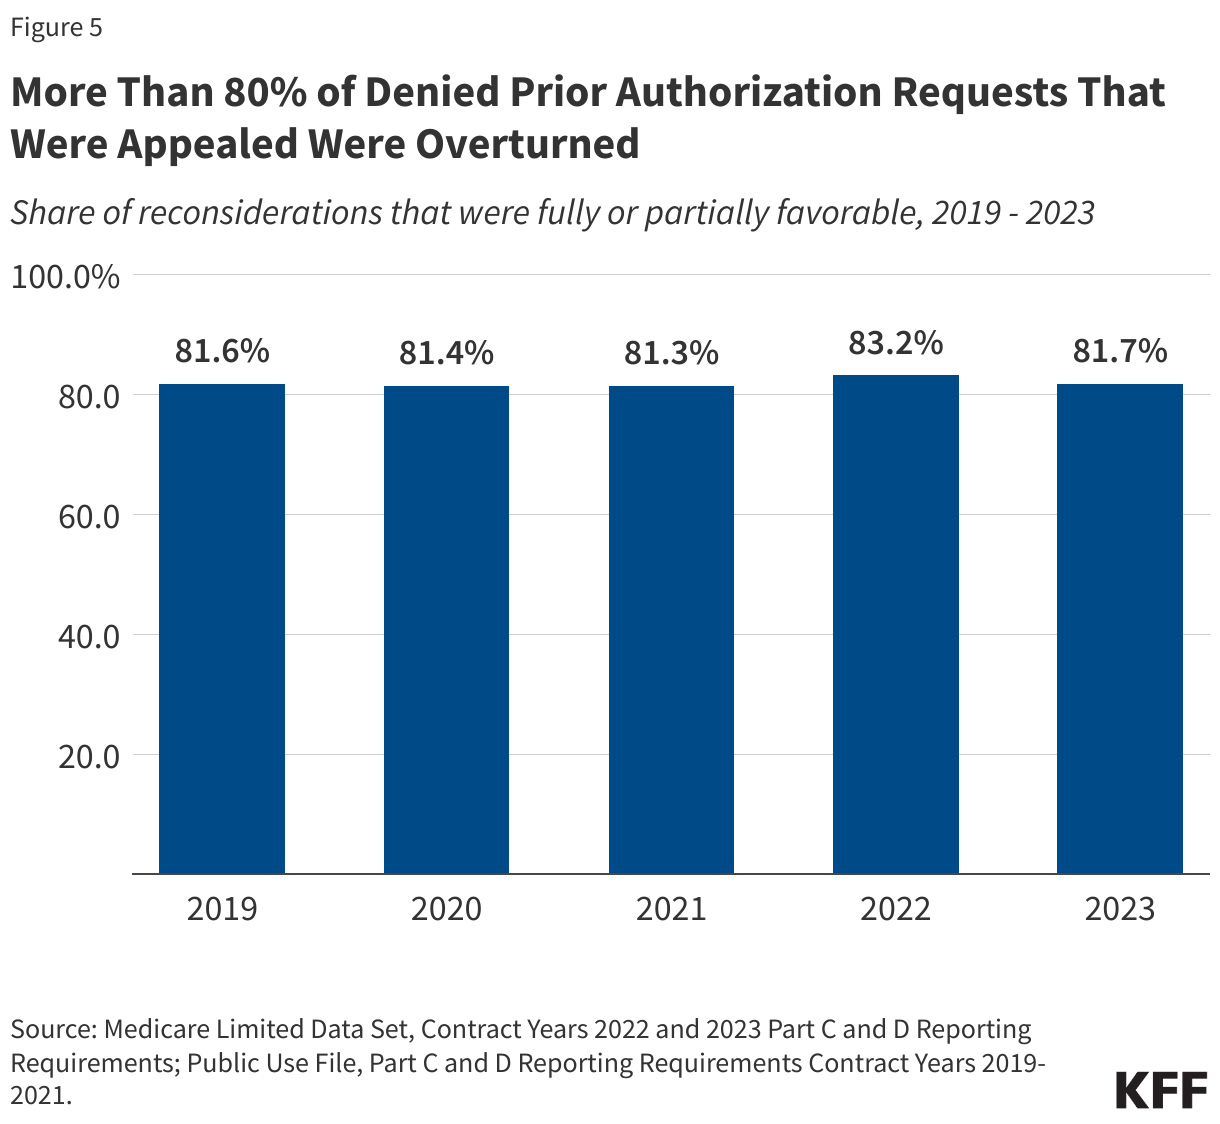
The vast majority of denied prior authorization requests that were appealed were subsequently overturned by Medicare Advantage insurers.

From 2019 through 2023, more than eight in ten (81.7%) denied prior authorization requests that were appealed were overturned (Figure 5). This raises questions about whether the initial request should have been approved, although it could also indicate that the initial request was missing the required documentation to justify the service. In either case, patients potentially faced delays in obtaining services that were ultimately approved because of the prior authorization process.

More Than 80% of Denied Prior Authorization Requests That Were Appealed Were Overturned

Variation in Use of Prior Authorization Across Medicare Advantage Insurers in 2023

In 2023, the volume of prior authorization determinations varied across Medicare Advantage insurers, as did the share of requests that were denied, the share of denials that were appealed, and the share of decisions that were overturned upon appeal, meaning people may have different experiences depending on the Medicare Advantage plan in which they enroll.

Across most insurers, a higher number of prior authorization determinations per enrollee was correlated with a smaller share of requests being denied and vice versa. For example, prior authorization determinations for UnitedHealthcare and Humana, the two largest Medicare Advantage insurers, were among the highest (Humana, 3.1 determinations per enrollee) and lowest (UnitedHealthcare, 1.0 determinations per enrollee) observed, and correspondingly, denial rates were below average (Humana, 3.5%) and above average (UnitedHealthcare, 9.1%) for these insurers.

While all Medicare Advantage insurers require prior authorization for at least some services, there is variation across insurers and plans in the specific services that are subject to these requirements. In addition, some insurers waive prior authorization requirements for certain providers, for example, as part of risk-based contracts or through “gold carding” programs that exempt providers with a history of complying with the insurer’s prior authorization policies.

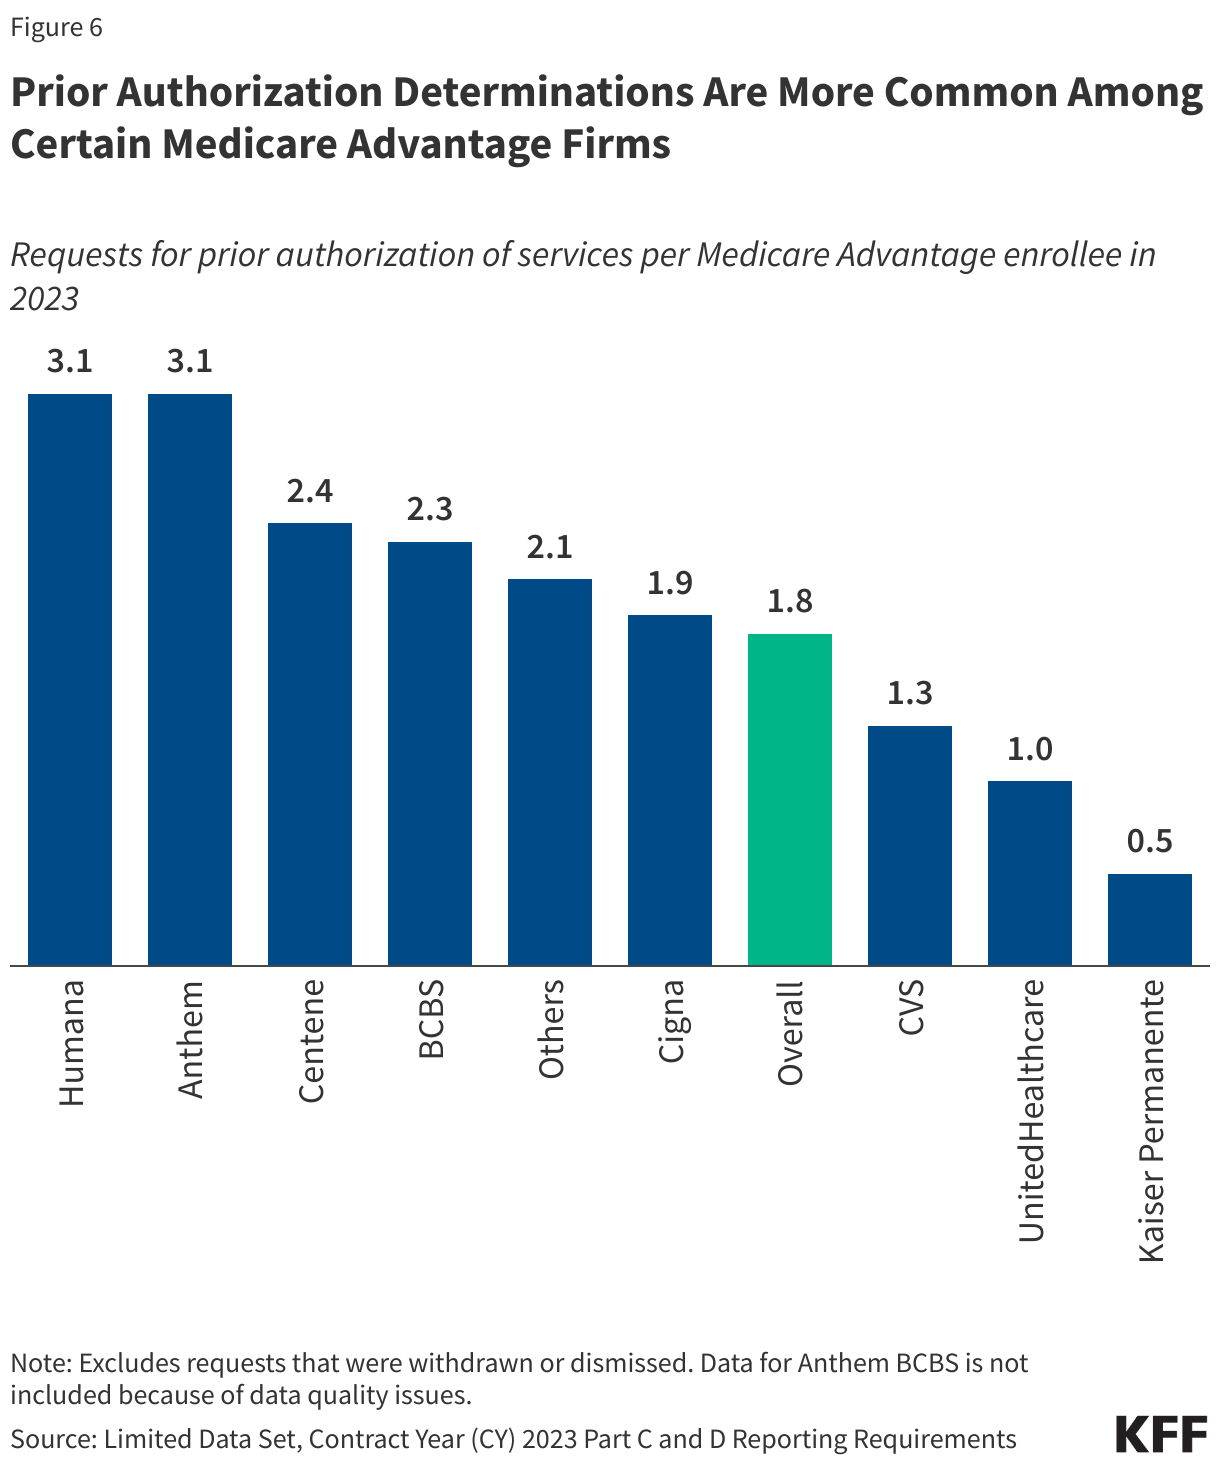
Prior authorization determinations were most common among Humana and Anthem plans.

The number of prior authorization determinations per enrollee ranged from a low of 0.5 determinations per enrollee in Kaiser Permanente plans to a high of 3.1 determinations per enrollee in Humana and Anthem plans (Figure 6). Kaiser Permanente is atypical among insurers in that it generally operates its own hospitals and contracts with an affiliated medical group. Looking across insurers that are more similar, the low end of the range was 1.0 determinations per enrollee in UnitedHealthcare plans. Differences across Medicare Advantage insurers in the number of prior authorization determinations per enrollee likely reflect some combination of differences in the services subject to prior authorization requirements, the frequency with which contracted providers are exempted from those requirements (which may be related to the extent to which providers are affiliated with the insurer), how onerous the prior authorization process is for a particular insurer relative to others, and differences in enrollees’ health conditions and the health care services they use.

Prior Authorization Requests Are More Common Among Certain Medicare Advantage Firms

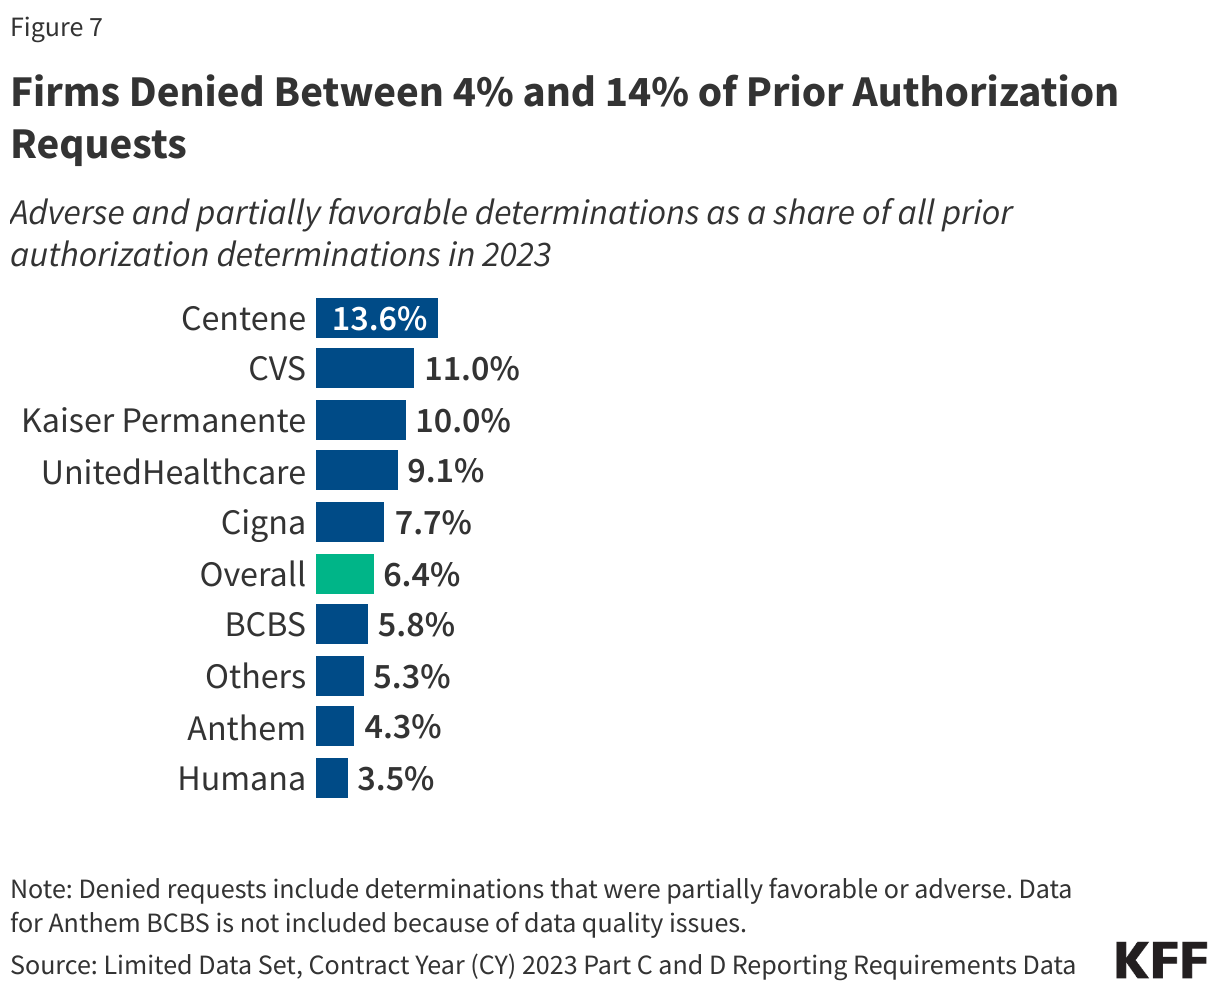
Centene denied the highest share or prior authorization requests while Humana denied the fewest.

The denial rate ranged from 3.5% of prior authorization requests for Humana plans to 13.6% of prior authorization requests for Centene plans (Figure 7). The overall denial rate includes requests that were both fully and partially denied (adverse and partially favorable determinations, respectively).

Most insurers that had more prior authorization determinations per enrollee than average denied a smaller share of  requests than average and vice versa. Centene was an exception with both a relatively high number of prior authorization determinations (2.4 per enrollee) and the highest denial rate (13.6%).

Firms Denied Between 4% and 14% of Prior Authorization Requests

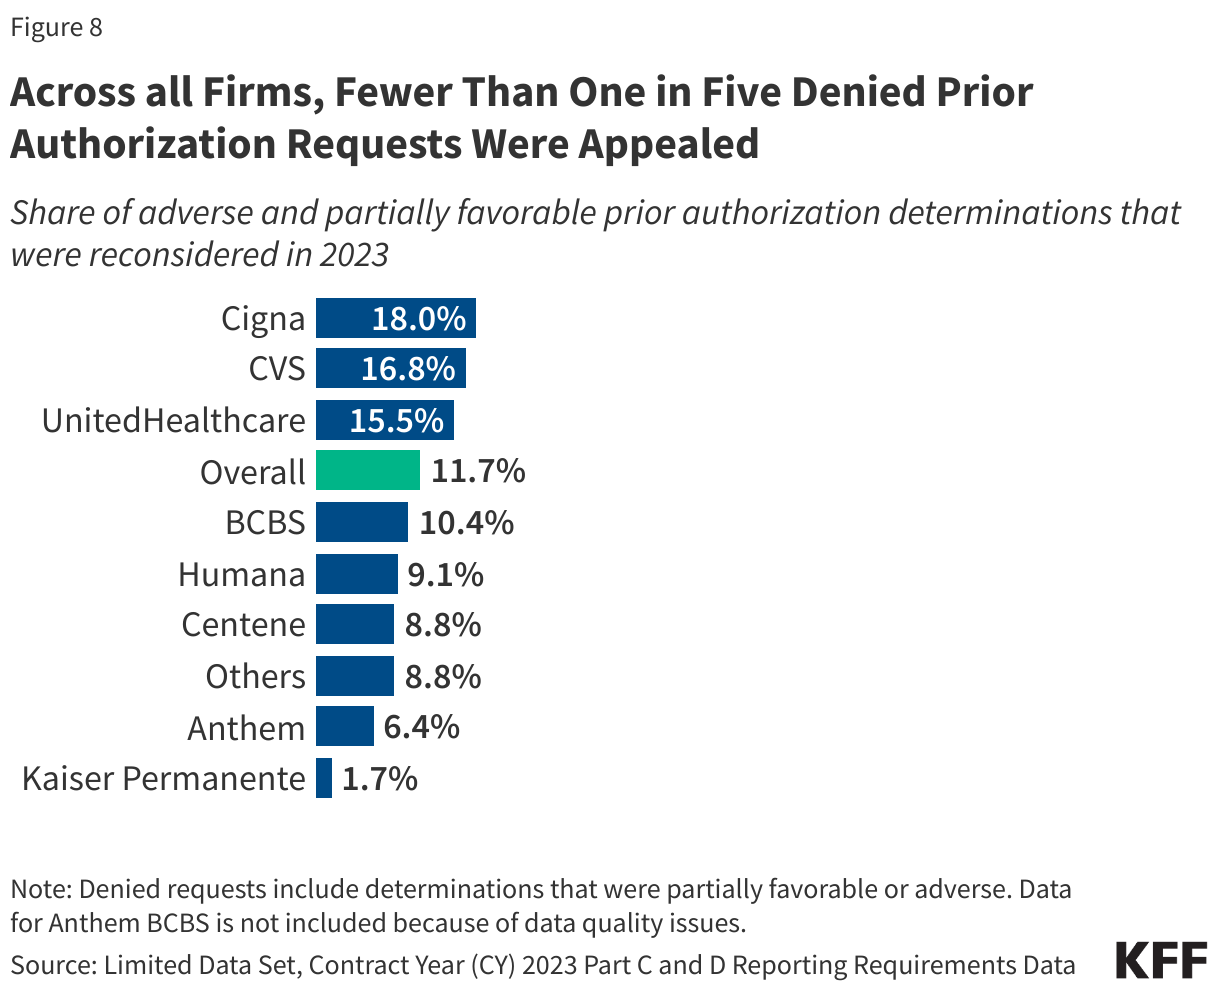
Across all insurers, a small share of denials was appealed.

Fewer than one in five denied prior authorization requests were appealed across all firms. The shares ranged from 1.7% for Kaiser Permanente to 18.0% for Cigna (Figure 8).

Across all Firms, Fewer Than One in Five Denied Prior Authorization Requests Were Appealed

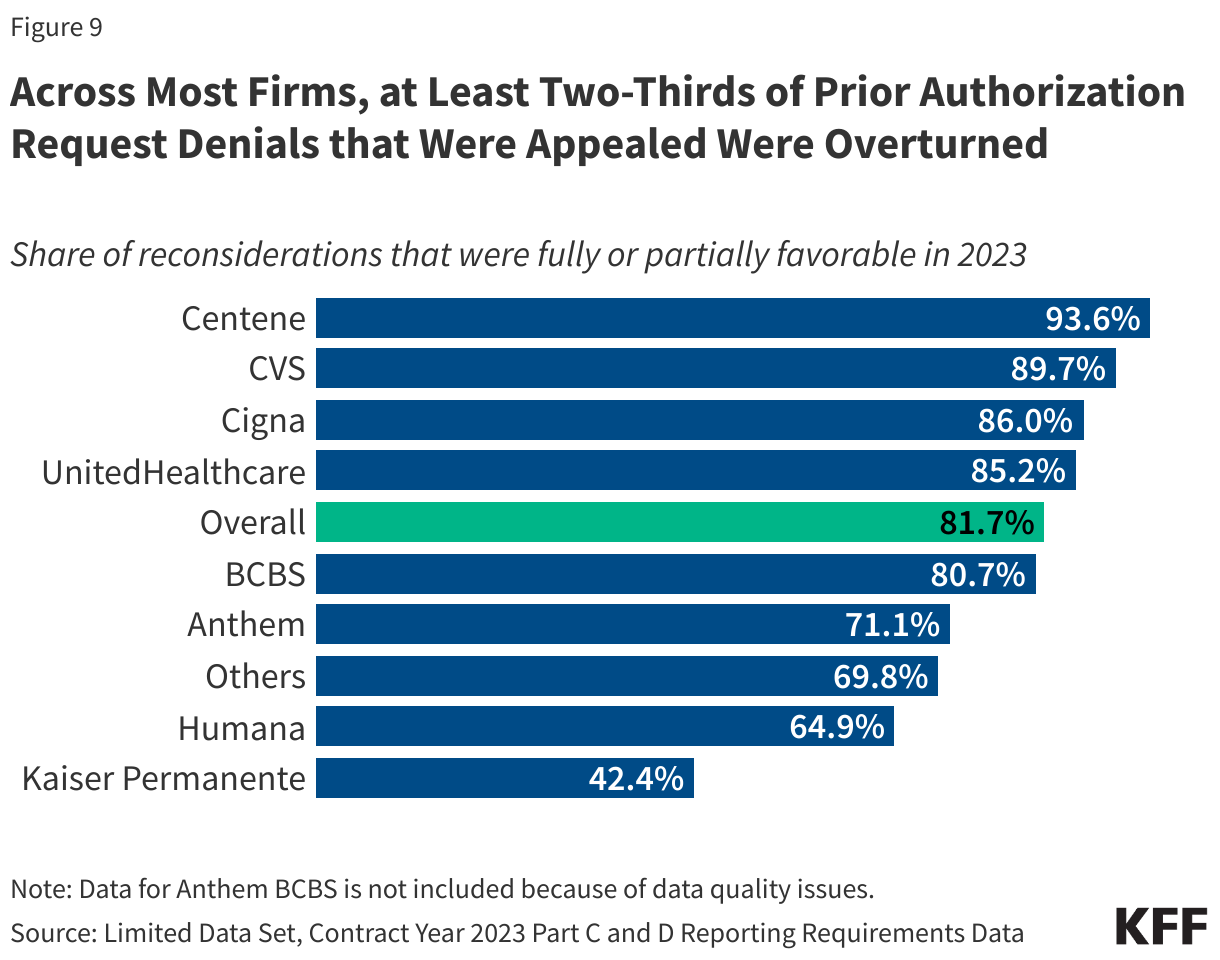
Across most firms, at least two-thirds of appeals were successful.

Even though most denials were not appealed, when they were, most of the initial decisions were partially or fully overturned. The share of appeals that resulted in favorable decisions was lowest for Kaiser Permanente (42.4%) and highest for Centene (93.6%), which also had the highest share of requests initially denied (Figure 9).

Across Most Firms, at Least Two-Thirds of Prior Authorization Request Denials that Were Appealed Were Overturned

The Use of Prior Authorization in Traditional Medicare

The use of prior authorization is relatively new to traditional Medicare and only used for a limited set of services, including certain outpatient hospital services, non-emergency ambulance transport, and durable medical equipment (see Box 1). The prior authorization process does not change any documentation requirements that are not already necessary for receiving Medicare payment – they are just required earlier in the process. CMS has recently published two reports presenting data on the use of prior authorization in traditional Medicare for fiscal years 2021, 2022, and 2023. These reports include information on the number of reviews completed and the number and share of reviews that were affirmed. For 2021 and 2022 only, the data also include information on appeals and the outcome of the appeal.

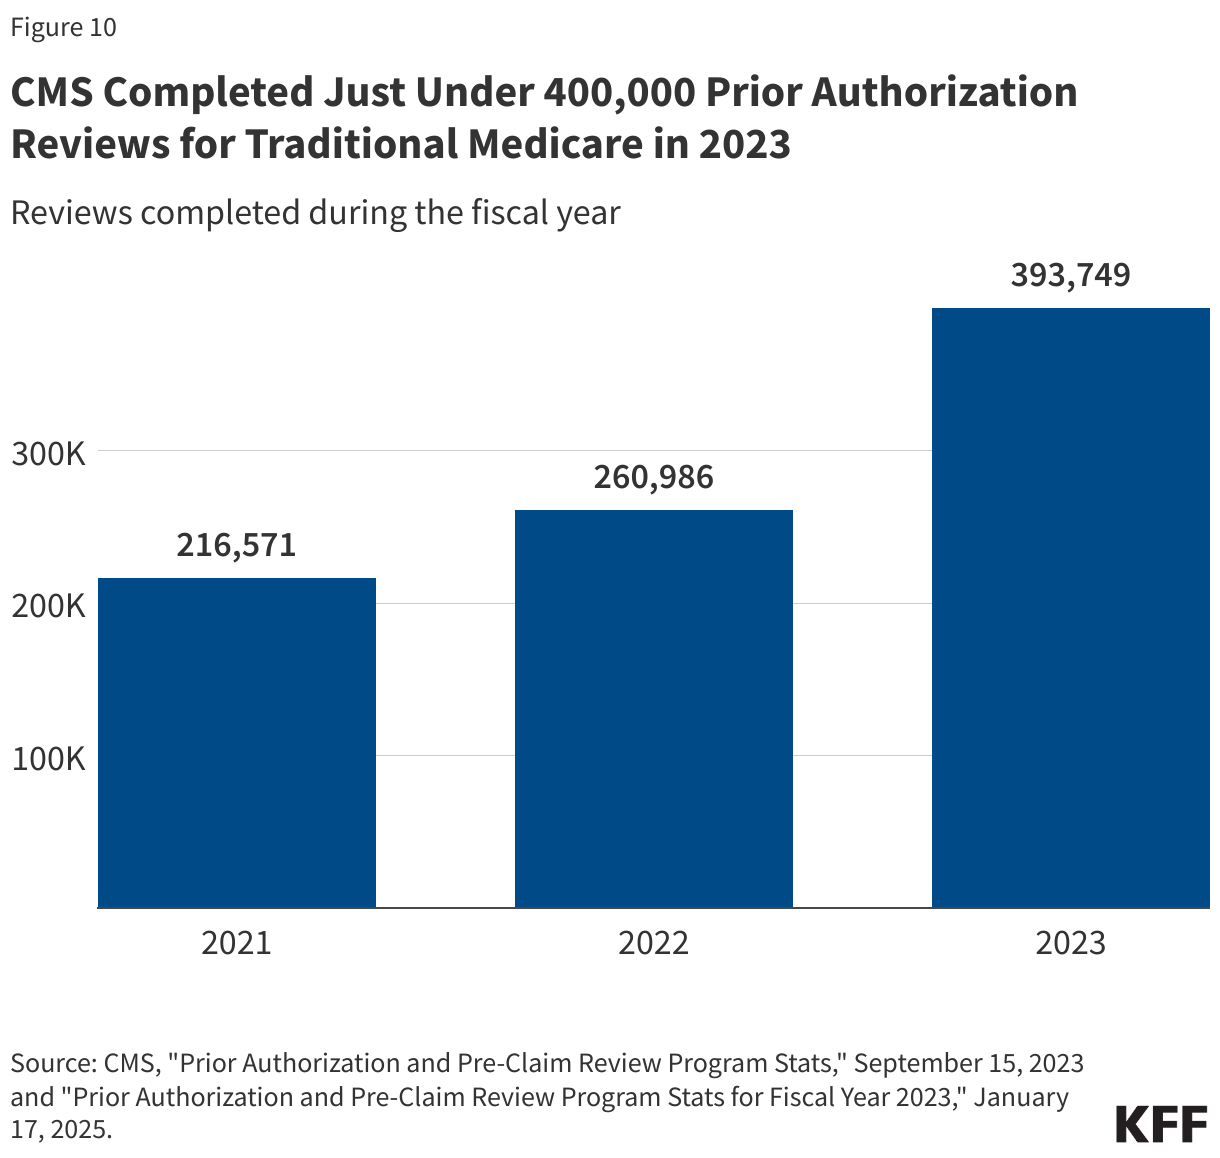
Just under 400,000 prior authorization reviews were completed by CMS for traditional Medicare in 2023.

Across the three categories of services that required prior authorization for certain services, there were 216,571 reviews completed in 2021, 260,986 reviews completed in 2022, and 393,749 reviews completed in 2023 (Figure 10). This translates to about 1 prior authorization review per 100 traditional Medicare beneficiaries in 2023 – a rate of about 0.01 per person.

CMS Reviewed Just Under 400,000 Prior Authorization Requests for Traditional Medicare in 2023

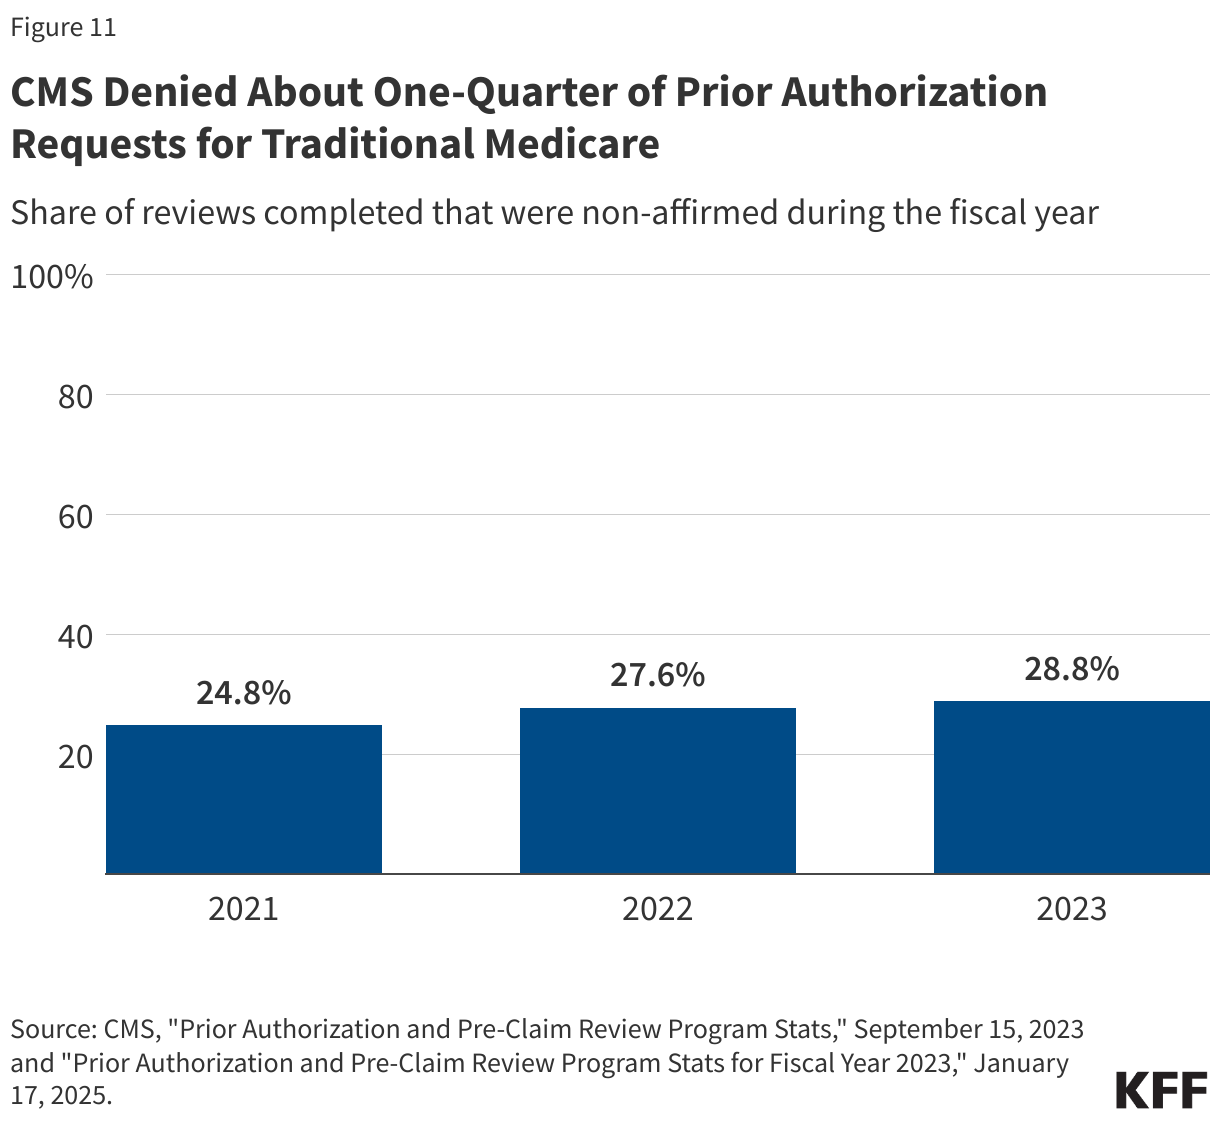
About one-quarter of prior authorization reviews in traditional Medicare denied coverage of the service.

CMS approved (or affirmed) coverage in the majority of prior authorization reviews it completed. CMS reported that 24.8% of requests were denied (or non-affirmed) in 2021, 27.6% of requests were denied in 2022, and 28.8% of requests were denied in 2023 (Figure 11). This reflects 53,680 denied requests in 2021, 72,029 denied requests in 2022, and 113,448 denied request in 2023.

CMS Denied About One-Quarter of Prior Authorization Requests for Traditional Medicare

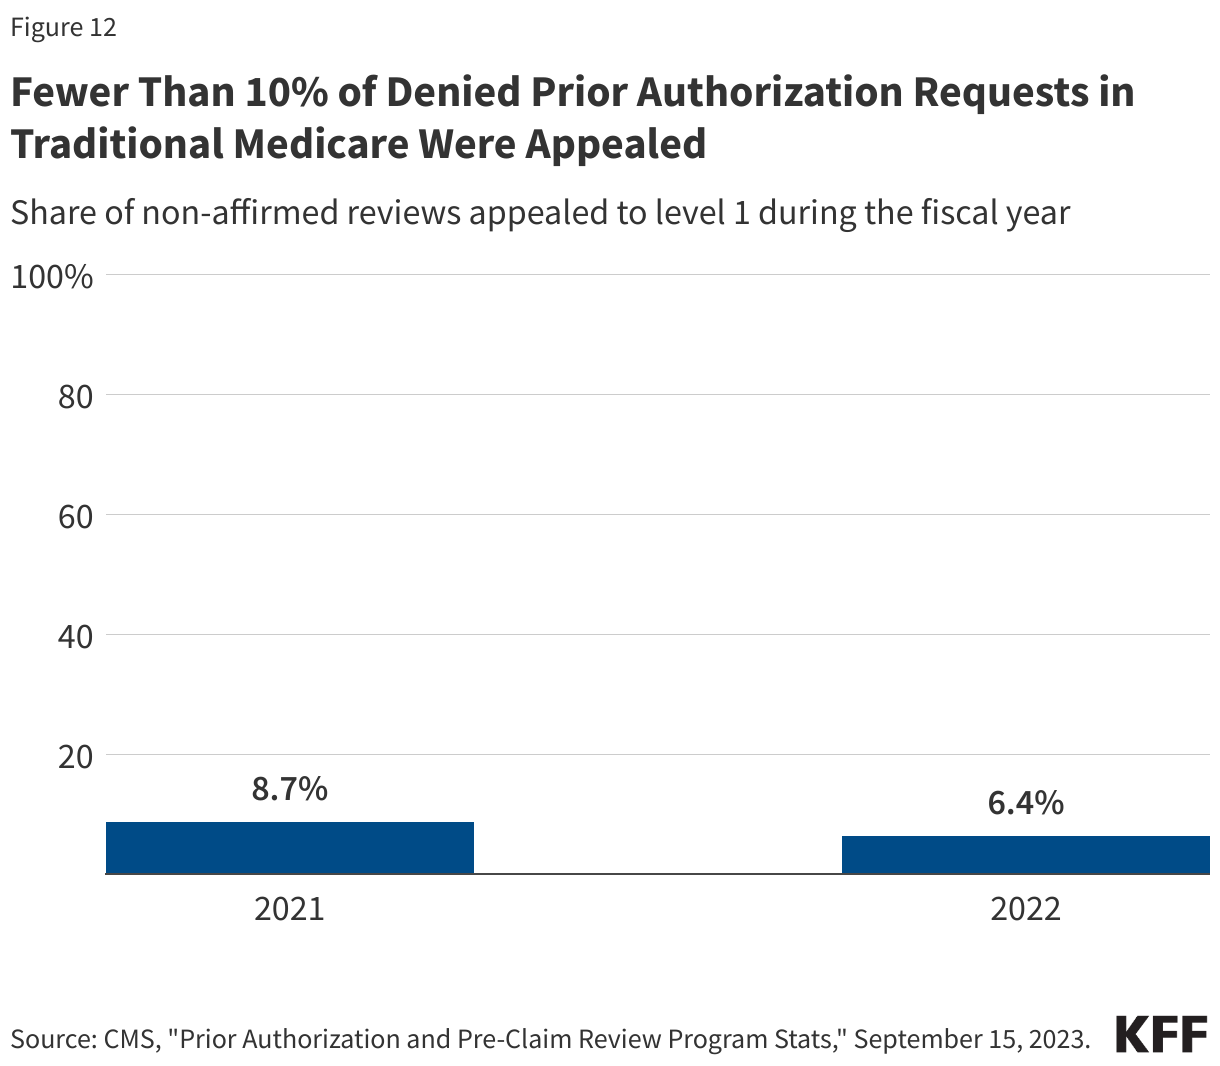
A small share of denied prior authorization requests in traditional Medicare was appealed to CMS.

In both 2021 and 2022, fewer than 5,000 denied prior authorization requests were appealed to the first level. As a share of all denied requests that translates into 8.7% appealed in 2021 and 6.4% appealed in 2022 (Figure 12). Appeals data are presented differently across the two CMS reports. Specifically, the 2023 report includes a separate claims and appeals section for each category of service, which appears to include a broader universe of reviews by Medicare Administrative Contractors, including those for payment of services rendered, than what is presented in the report for 2021 and 2022. Given the differences in the data reported, we present total appeals for 2021 and 2022 only.

Fewer Than 10% of Denied Prior Authorization Requests in Traditional Medicare Were Appealed

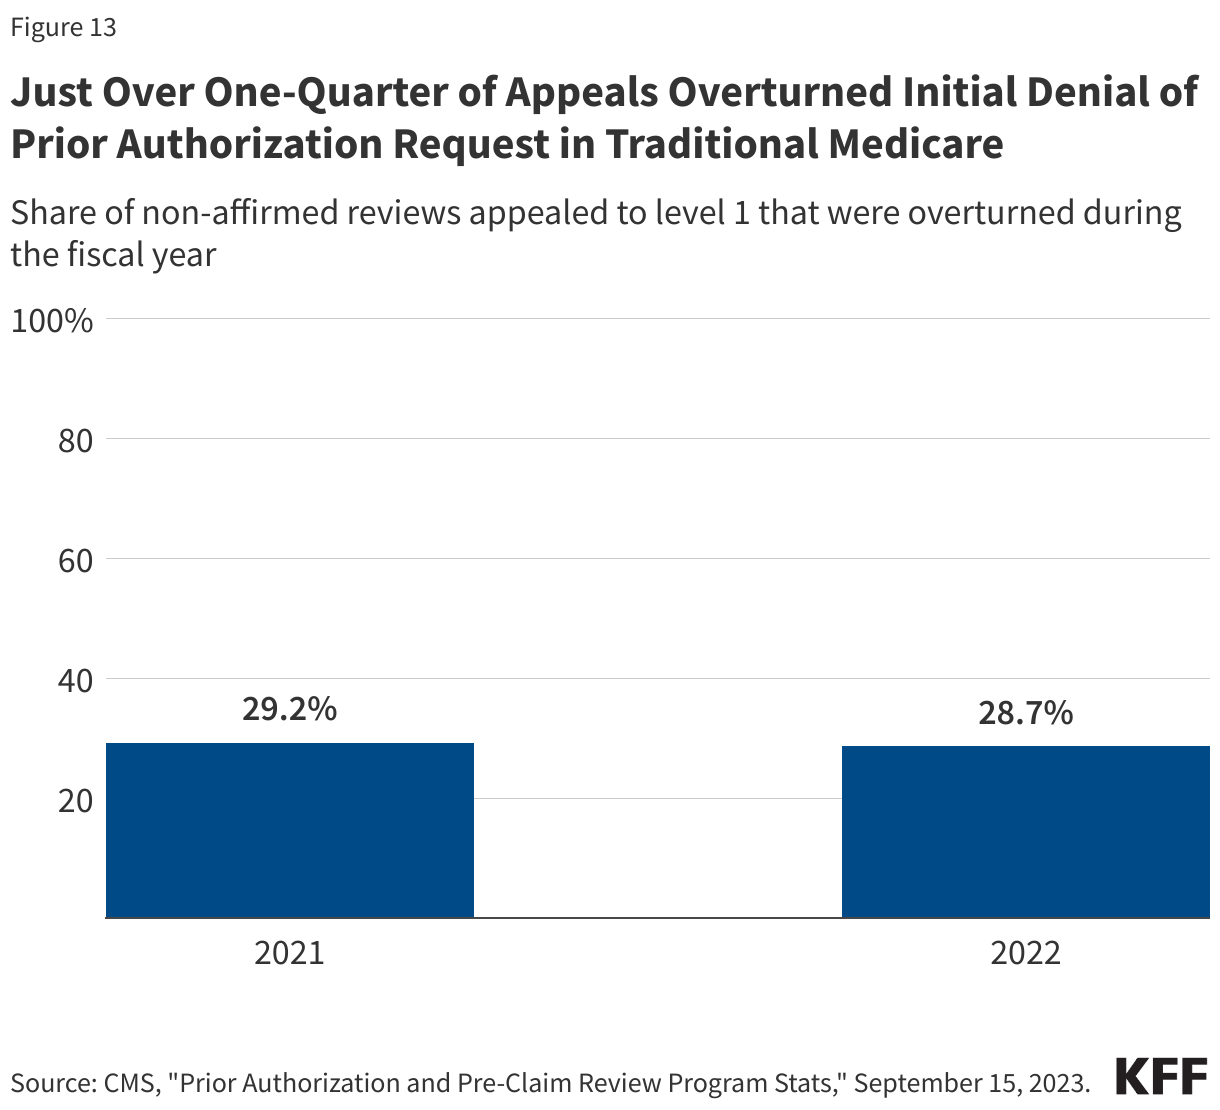
Just over one-quarter of appeals to CMS overturned the denied prior authorization request in traditional Medicare.

In 2021, 1,365 prior authorization denials were overturned upon appeal. In 2022, 1,323 prior authorization denials were overturned upon appeal. That represents 28.7% of all first level appeals in 2022 (Figure 13).

Just Over One-Quarter of Appeals Overturned Initial Denial of Prior Authorization Request in Traditional Medicare

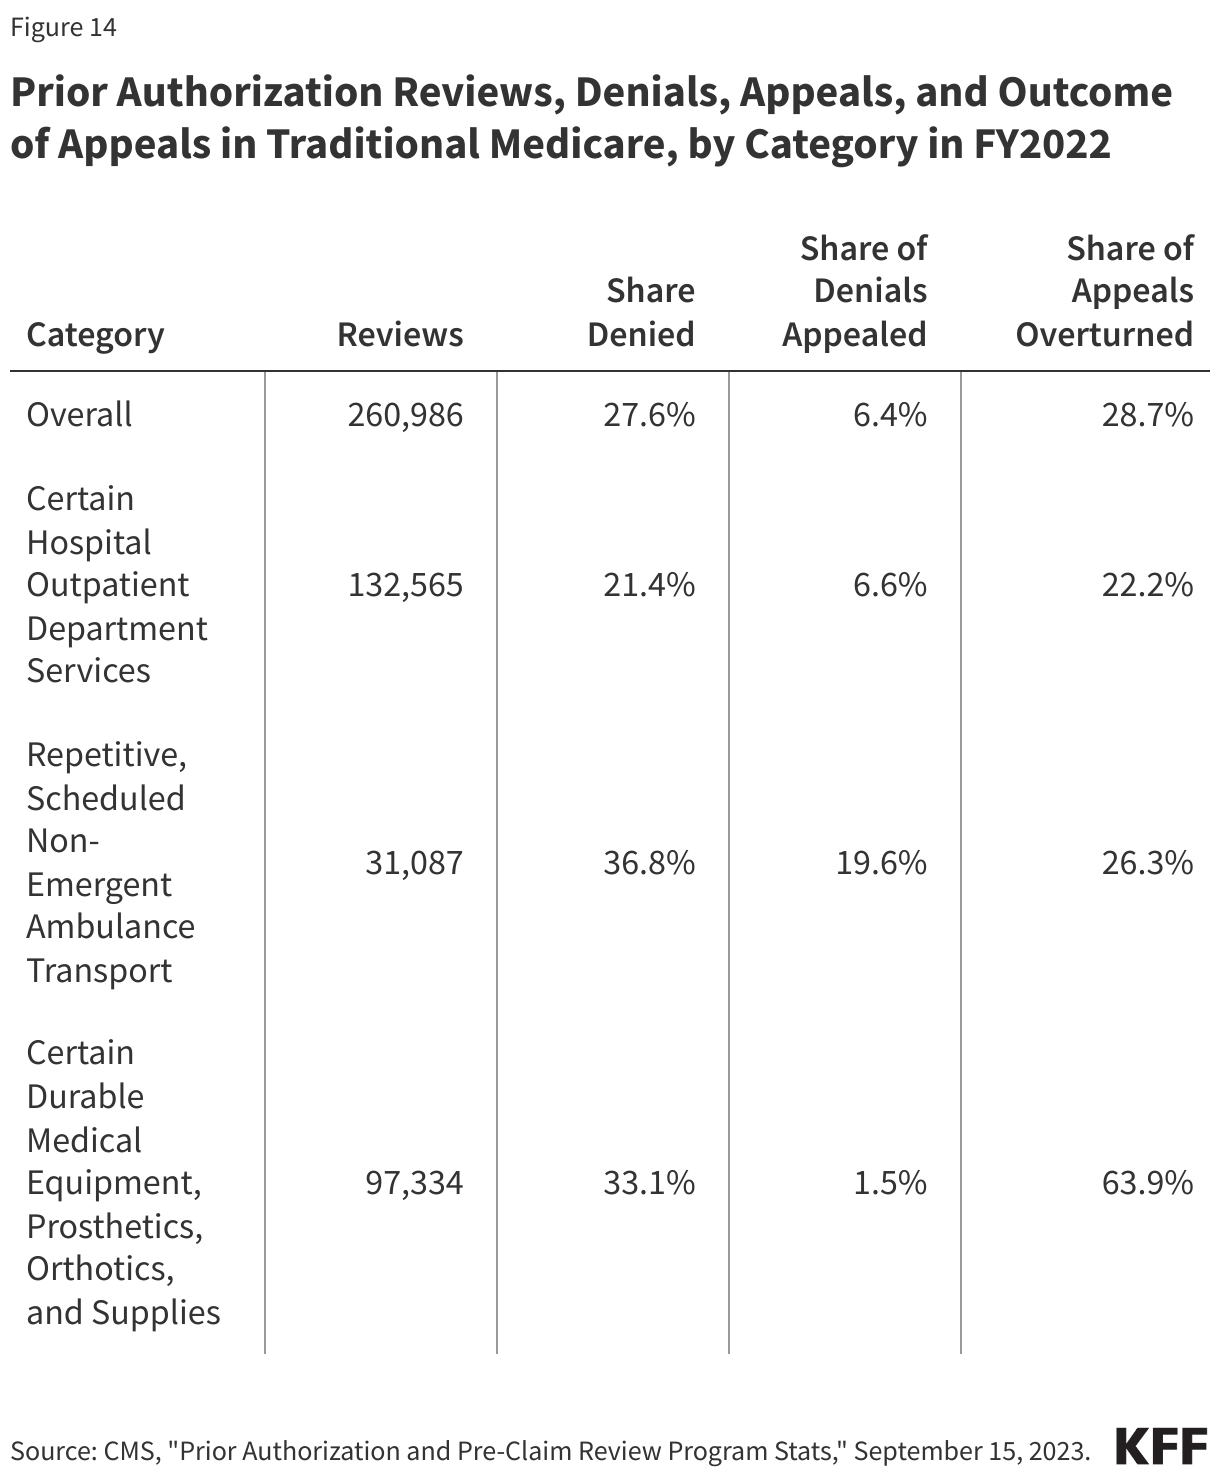
The share of prior authorization reviews that were denied, appealed, and overturned varied across service type in traditional Medicare.

In 2022, the largest number of prior authorization reviews in traditional Medicare were for certain hospital outpatient department services (132,565), followed by reviews for certain durable medical equipment, prosthetics, orthotics and supplies (97,334), which are both applied nationwide. Repetitive, scheduled non-emergent ambulance transport had the fewest number of requests (31,087), which in part may reflect that it became a nationwide program after expanding to additional jurisdictions in 2022, as well as the ability to approve multiple ambulance rides through a single request (Figure 14).

Across the three service categories, denials were most common for repetitive, scheduled non-emergent ambulance transport (36.8%), followed by certain durable medical equipment, prosthetics, orthotics and supplies (33.1%), and least common for certain hospital outpatient department services (21.4%). Denied requests for the ambulance transport services were also most often appealed (19.6%); just 6.6% of denials for certain hospital outpatient services and 1.5% of certain durable medical equipment, prosthetics, orthotics and supplies requests were denied (Figure 14).

The share of appeals that resulted in overturning the initial decision also varied widely. Nearly two-thirds (63.9%) of appeals for durable medical equipment, prosthetics, orthotics and other supplies were successful. That compares to 26.3% of appeals for the ambulance transport services and 22.2% of appeals for certain hospital outpatient services (Figure 14).

Prior Authorization Reviews, Denials, Appeals, and Outcome of Appeals in Traditional Medicare, by Category in FY2022

Box 1. Prior Authorization Requirements in Traditional Medicare

In 2015, CMS issued a final rule that established a prior authorization process for certain Durable Medical Equipment, Prosthetics, Orthotics, and Supplies (DMEPOS) items, with the goal of reducing the use of items that had been frequently subject to unnecessary utilization. Initial implementation began March 20, 2017, and items have been added and subtracted to the list over the following years through subsequent rulemaking. As of December 18, 2024, the DMEPOS items prior authorizations list includes over 60 items, including for pressure reducing support surfaces, power mobility devices, and lower limb prosthetics.

In a 2019 final rule (effective July 1, 2020), CMS established national prior authorization requirements for a set of hospital outpatient department services which had experienced significant increases in utilization and that are likely to be cosmetic procedures and not covered by Medicare, but may be combined with other therapeutic services, including blepharoplasty, botulinum toxin injections, panniculectomy, rhinoplasty, and vein ablation. In further rulemaking (effective July 1, 2021), CMS added implanted spinal neurostimulators and cervical fusion with disc removal to the list of services requiring prior authorization, and another rule (effective July 1, 2023) added facet joint interventions.

The CMS Repetitive, Scheduled Non-Emergent Ambulance Transport (RSNAT) Prior Authorization Model uses the authority provided through the Center for Medicare and Medicaid Innovation (CMMI, or Innovation Center) to test whether prior authorization for non-emergent ambulances for certain medical appointments would save money for Medicare while maintaining access and quality of care. The model was first implemented in select states in December 2014 and was ultimately expanded nationwide in September 2020 as it met the model requirements, saving Medicare about $650 million over four years.

Box 2. Recent Administrative Actions and Proposed Legislation on Prior Authorization

The Biden Administration finalized three rules related to prior authorization.

The first rule (effective date: June 5, 2023) clarifies the criteria that may be used by Medicare Advantage plans in establishing prior authorization policies and the duration for which a prior authorization is valid. Specifically, the rule states that prior authorization may only be used to confirm a diagnosis and/or ensure that the requested service is medically necessary and that private insurers must follow the same criteria used by traditional Medicare. That is, Medicare Advantage prior authorization requirements cannot result in coverage that is more restrictive than traditional Medicare. The rule also describes how private insurers may consider additional information when traditional Medicare does not have fully established coverage criteria. The rules apply to coverage beginning with plan year 2024.

The second rule (effective date: April 8, 2024) is intended to improve the use of electronic prior authorization processes, as well as the timeliness and transparency of decisions, and applies to Medicare Advantage and certain other insurers. Specifically, it shortens the standard time frame for insurers to respond to prior authorization requests from 14 to 7 calendar days starting in January 2026 and standardizes the electronic exchange of information by specifying the prior authorization information that must be included in application programming interfaces starting in January 2027. A bipartisan bill has also been introduced to codify pieces of this rule.

The third rule (effective date: June 3, 2024) will require Medicare Advantage plans to evaluate the effect of prior authorization policies on people with certain social risk factors (“health equity analysis”) starting with plan year 2025.

In December 2024, CMS issued a proposed rule that contained several provisions related to prior authorization. These include defining the term “internal coverage criteria,” revising the requirements of the health equity analysis to include metrics reported at the service level, and several other changes to further clarify coverage requirements.

Additionally, lawmakers in Congress have introduced several bills aimed at improving the timeliness of the prior authorization process, increasing transparency, clarifying the criteria that may be used in prior authorization decisions, and exempting some providers from prior authorization requirements in the Medicare Advantage program. Other lawmakers have proposed banning the use of prior authorization altogether.

Use of Prior Authorization by Medicare Advantage Insurers in 2021
Use of Prior Authorization by Medicare Advantage Insurers in 2022

Methods

The analysis of Medicare Advantage uses organization determinations and reconsiderations – Part C data from the Centers for Medicare and Medicaid Services (CMS) Part C and D reporting requirements public use file for contract years 2019 – 2021 and the limited data set for contract years 2022 and 2023. Medicare Advantage insurers submit the required data at the contract level to CMS and CMS performs a data validation check.

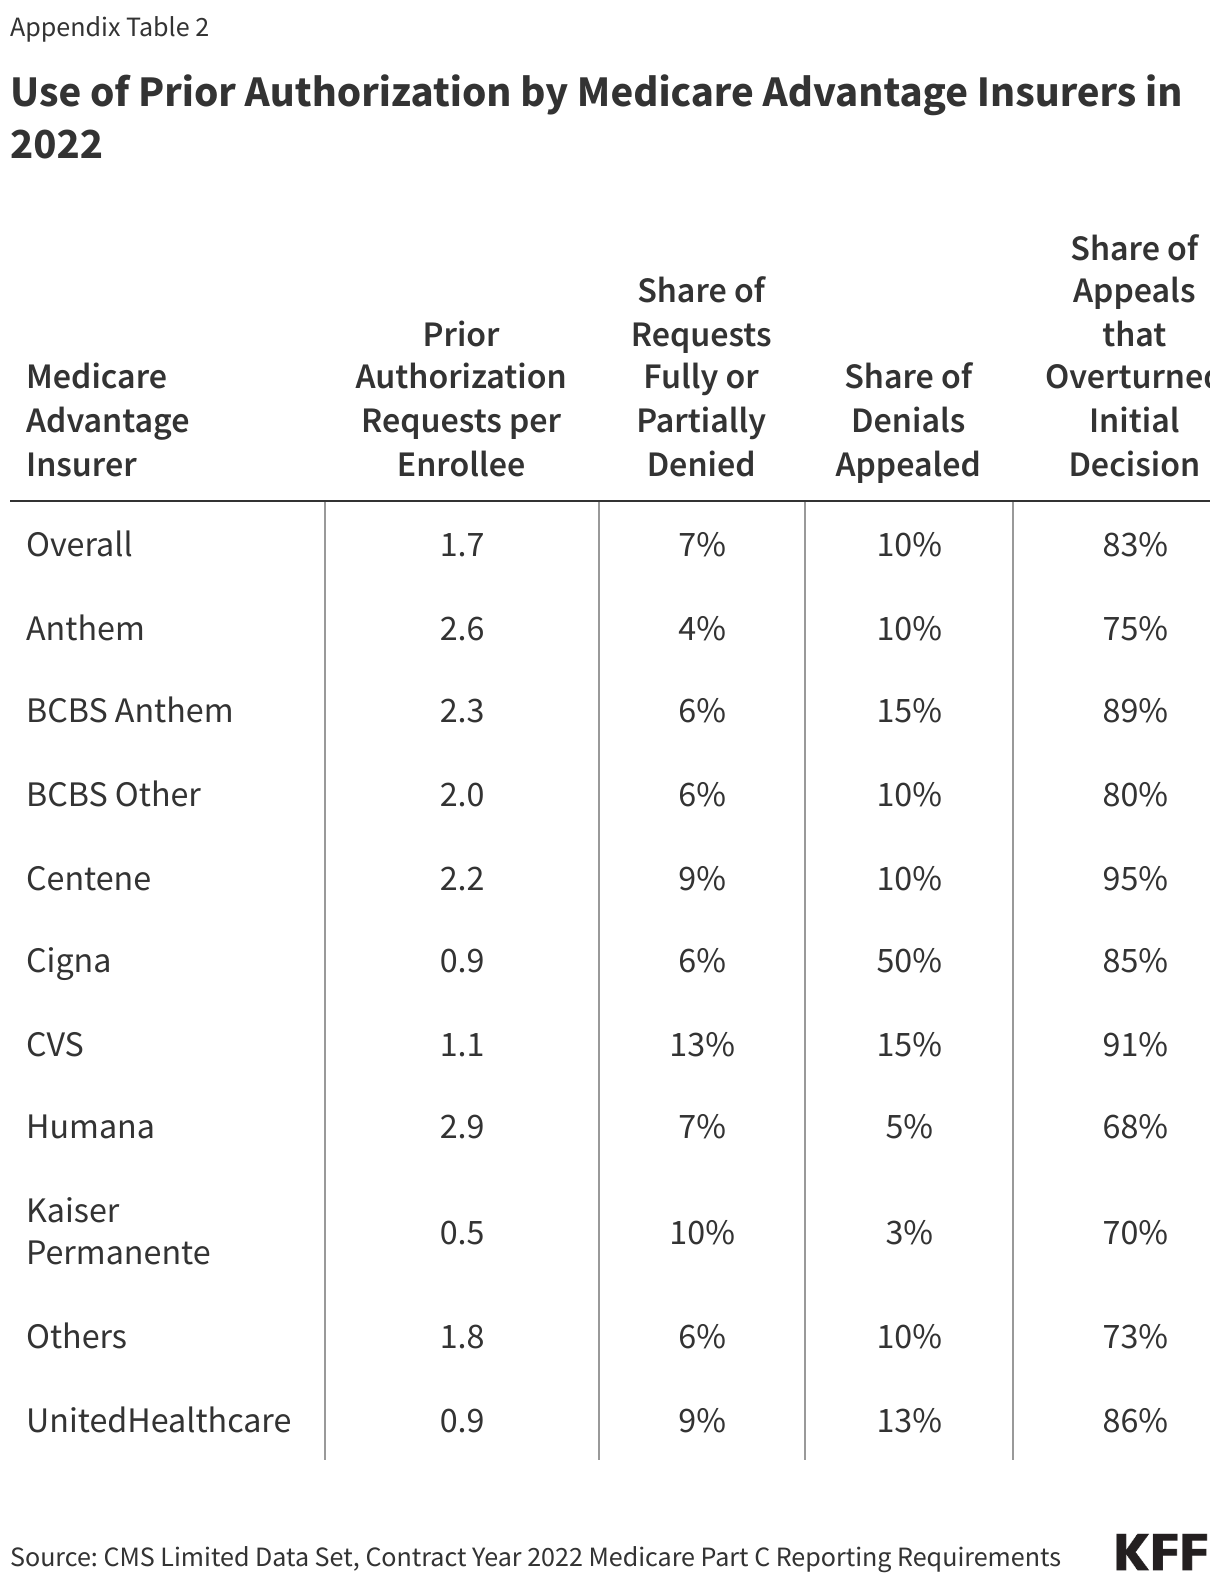
Data for Medicare Advantage contracts is aggregated to the parent company level. Insurers with less than 2% of total Medicare Advantage enrollment are combined into “others”. BCBS stands for Blue Cross Blue Shield. BCBS plans that are offered by Anthem (Elevance) are grouped together and those offered by all other parent companies are grouped together (BCBS Other). BCBS Anthem contracts are excluded for 2021 and 2023 because they did not pass the data validation checks.

This analysis reflects data on service determinations and does not include claims determinations (for payment for services already provided). We also do not include withdrawn or dismissed determination requests in this analysis.

The enrollment data are from the CMS Medicare Advantage enrollment file for March of each year at the contract-plan-county level. We then sum up to the contract level to merge with the determination and reconsideration data. Contract-plan-county combinations are not included if there are fewer than 11 enrollees.

The traditional Medicare analysis uses data included “Prior Authorization and Pre-Claim Review Program Stats,” published by CMS on September 15, 2023, which reflects prior authorization reviews completed in fiscal years 2021 and 2022, and “Prior Authorization and Pre-Claim Review Program Stats for Fiscal Year 2023,” published on January 17, 2025. The total number of traditional Medicare beneficiaries is from the Medicare Monthly Enrollment Dashboard for 2021 through 2023. While CMS published data on the use of prior authorization in traditional Medicare for FY2023, the information for appeals of are not comparable to FY2021 and FY2022 data and are therefore not included in this analysis.

This work was supported in part by Arnold Ventures. KFF maintains full editorial control over all of its policy analysis, polling, and journalism activities.

Emergency Contraception

Published: Jan 28, 2025

Note: This brief was updated on January 29, 2025 to incorporate new data and policy changes on emergency contraception.

Emergency Contraception

Emergency contraception (EC) is a form of backup birth control that can be used up to several days after unprotected intercourse or contraceptive failure and still prevent a pregnancy. In 1999, Plan B was the first oral product approved for use in the U.S. as an EC by the Food and Drug Administration (FDA). Since then, more EC products have been approved. Many have confused EC pills with mifepristone, the “abortion pill,” but EC pills do not cause abortion. EC pills prevent pregnancy by delaying or inhibiting ovulation and will not work if the pregnancy is established. This fact sheet reviews the methods of EC, known mechanisms of action, use of EC, and current national and state policies affecting EC access.

What is EC?

EC is used as a back-up birth control method to prevent pregnancy in the event of unprotected sex, sexual assault, or a contraceptive failure, such as a condom breaking. ECs do not terminate a pregnancy, stop the implantation of a fertilized egg, or affect a developing embryo. There are several methods of EC that are available in the U.S. including progestin-based pills, ulipristal acetate, and intrauterine devices (IUDs) (Table 1). The copper and levonorgestrel IUDs can be used after unprotected sex and as ongoing regular contraceptive methods. EC pills are only to be used after unprotected sex and are not intended for use as a regular method.

Major Methods of Emergency Contraception (EC), Availability and Policy in the U.S.

Progestin-Based Pills

  • Plan B was the first oral form of EC to be made available in the U.S. as a pre-packaged dose of pills containing the progestin, levonorgestrel. Now, there are generic alternatives available as well. Progestin-based EC pills use the same hormones found in daily oral contraceptives and are the most widely used form of EC. EC pills are marketed today under the brand name Plan B One-Step and generic names and are available over-the-counter, without a prescription/ (Table 1).
  • Progestin-based EC pills do not interrupt or adversely impact an established pregnancy, nor are they medical abortion drugs like mifepristone or methotrexate that end an established pregnancy. Plan B One-Step and the generic versions prevent pregnancy by inhibiting or delaying ovulation or by making it harder for sperm to reach an egg.
  • Progestin-based EC is to be taken within 72 hours of unprotected sex in order to be most effective and reduce the likelihood of pregnancy by 81% to 90% when taken in this timeframe.
  • There are no known serious side effects associated with progestin-based EC; side effects may include bleeding or spotting, headaches, nausea, and breast tenderness.
  • Some research has suggested that efficacy of progestin-based EC is lower among women with Body Mass Index (BMI) levels greater than 25. However, in May 2016 the FDA announced that it had reviewed the available scientific data regarding the effectiveness of EC pills in overweight and obese women, and that the data are inconclusive and did not recommend a labeling change.
  • Progestin-based pills can be stored for several years, with Plan B One Step having a shelf-life of four years when stored as directed. Consumers should always check the expiration date on the packaging prior to taking the pill.

Ulipristal acetate: ella

  • Ulipristal acetate, marketed as ella, was approved by the FDA in 2010 for sale and use in the U.S.
  • ella is a single-dose (30 mg) pill that is effective in preventing pregnancy up to five days after unprotected intercourse, giving women a longer timeframe to prevent unintended pregnancy than Plan B. Its mechanism of action is similar to that of progestin-based EC.
  • Study findings show that side effects for ella are comparable to those for Plan B, and some research suggests that its effectiveness appears to diminish at BMI thresholds above 35.
  • A 2025 study based on a small sample of women in Mexico suggests that when paired with misoprostol, one of the two drugs used in the FDA’s approved abortion medication regimen, higher doses of ulipristal acetate (60 mg) can terminate a pregnancy. It has already been demonstrated that misoprostol alone terminates early pregnancies. Prior research has shown that a 30 mg dose of ulipristal acetate alone, the dose that is used for emergency contraception in the U.S., does not disrupt an established pregnancy.

Combined/Combination Pills

  • Certain daily oral contraceptive pills can also act as EC when taken in doses four or five times higher than the daily dose, although they are not specifically sold as emergency contraception. Oral contraceptive pills contain progestin and estrogen and are taken in two doses 12 hours apart to be effective as EC.
  • Combined pills have been found to be safe and effective for preventing pregnancy within 5 days of intercourse.

Copper-T IUD: Paragard

  • Available to women since the 1970s, copper-T IUDs are the most effective forms of EC, reducing the risk of pregnancy by more than 99% when inserted within 5 days of unprotected intercourse. IUDs are inserted into the uterus by a health care provider and require a visit to a clinic or provider’s office. They also can be used to effectively prevent subsequent pregnancy for up to 10 years.
  • The hormone-free copper-T IUD works by interfering with egg fertilization by preventing sperm from reaching the egg. Previous research suggests the copper IUD inhibits implantation of a fertilized egg, but this mechanism of action has not been conclusively proven.
  • Efficacy of copper IUDs does not diminish in women who are overweight or obese.

Levonorgestrel IUD: Mirena and Liletta

  • Levonorgestrel IUDs are a type of hormonal IUD that contain the progestin levonorgestrel. To date, only levonorgestrel IUDs that contain 52 mg of levonorgestrel (LNG 52 mg IUDs) have been studied as a form of EC. LNG 52 mg IUDs are marketed under the brand names Mirena and Liletta.
  • Like copper-T IUDs, LNG IUDs are inserted into the uterus by a clinician and require a visit to a clinic. LNG IUDs can subsequently be used as a regular form of contraception for up to seven years.
  • Levonorgestrel IUDs recently started being used as a method of EC, and research has found that LNG 52 mg IUDs can be as effective as copper-T IUDs when inserted within five days after unprotected intercourse or contraceptive failure. The hormonal IUD prevents egg fertilization by making the cervical mucus impenetrable to sperm.
  • Efficacy of levonorgestrel IUDs does not diminish in women who are overweight or obese.

Women’s Use of EC Pills

There have been numerous public health and educational initiatives to increase use of EC. Use of EC pills has increased over the past 20 years. Between 2022 and 2023, the most recent years for which data are currently available, 33% of women ages 15 to 49 who have ever had sex with a male reported they had used EC pills at least once in their lives, an increase from 22% in 2015-2017 (Figure 1).

Use of Emergency Contraception Pills Has Increased Over the Past Eight Years

Younger women are more likely to report that they have ever used EC (Figure 2). More than four in ten women ages 15-24 (44%) and women ages 25-34 (40%) say they have taken EC pills, compared to 25% of women ages 35-49. One in four Hispanic women (40%) and approximately one in three Black and White women (30% and 33%, respectively) report ever taking EC.

Use of Emergency Contraception Pills, by Age and Race/Ethnicity

Access and Availability

At least one form of oral EC has been available in the U.S. for over a decade and there have been several efforts to broaden women’s access to EC, particularly since its effectiveness window is time-limited.

Over the Counter Access of EC Pills

  • Prior to 2006, a prescription was needed for all individuals seeking EC pills. Between 2006 and February 2014, Plan B and its generic equivalent were available without a prescription for men and women 17 and older, but adolescents under 17 needed a prescription.
  • In 2014, the FDA removed point-of-sale age requirements for Plan B obtained over the counter (OTC) and generic versions began to enter the OTC market. Currently, several generic brands of EC pills, including Next Choice One Dose, My Way, Fall Back Solo, Take Action, levonorgestrel tablet, and Aftera are available OTC to women of all ages.
  • A prescription is still required for ella for women of all ages.

Cost and Coverage

  • The Affordable Care Act (ACA) requires most new private health plans (individual and group) to cover without cost-sharing all FDA-approved contraceptive drugs and devices as prescribed, including emergency contraception. This means that although OTC formulations are available without a prescription, the pills are only required to be covered by insurance if they were prescribed. Private insurance plans must also cover the cost of IUDs, as well as services related to insertion, follow up and removal, without cost sharing. However, there have been numerous reports of individuals having to pay out-of-pocket for contraception that they believe should have been fully covered, including for services related to the insertion and removal of IUDs.
  • Seven states require private health insurance plans to cover some over-the-counter contraceptives, without any cost-sharing, including EC. For employer-sponsored plans, state coverage requirements generally apply only to fully-insured plans and not to self-funded plans.
  • Family planning services are a required benefit under Medicaid. The coverage requirements under Medicaid are different for states that have expanded eligibility under the ACA. These programs must cover all prescribed, FDA-approved contraceptives, meaning that they must cover EC pills if a woman has a prescription. States have discretion in deciding whether they include EC in their traditional full-scope Medicaid programs or family planning expansion programs. A 2021 survey of state Medicaid programs found that while all responding states cover at least one form of EC in their traditional Medicaid programs, some states impose quantity limits. To increase access to contraception, eight states have opted to use state-only funds to cover at least some methods of OTC contraception for their Medicaid enrollees, primarily emergency contraception, without a prescription.
  • Without a prescription or insurance, women in most states accessing EC OTC must pay the retail price. Plan B pills and the generic versions average can range from $10 to $50 when purchased OTC. Without insurance, the cost of IUDs can range from $500 to $1,300.
  • Individuals without health insurance or who are ineligible for Medicaid may be able to obtain free or low-cost EC (in addition to other reproductive health care services) through a clinic or community health center participating in the federal Title X family planning program. The Title X program may also be an option for lower-income individuals covered by employer-sponsored health insurance plans that are not required to cover contraception because they existed prior to the ACA (known as “grandfathered” plans) or because their employer excludes coverage of emergency contraception based on a religious or moral objection to it. Regardless of the pathway, eligibility for the program is based on the individual’s household income and costs are based on a sliding fee scale.

Online Contraceptive Platforms

  • New markets have emerged, particularly since the start of the COVID-19 pandemic, that allow people to obtain health care services without the need for an in-person visit, including several online reproductive health services platforms and smartphone apps where an individual can obtain hormonal contraceptives, including EC pills, outside of traditional health care settings. A 2023 KFF study on telecontraception found that 9% of survey respondents report getting a prescription for emergency contraception.
  • These online platforms and apps typically employ licensed medical professionals to determine a client’s eligibility and to prescribe contraception in a similar manner to a clinic. The patient is then either mailed their contraceptives or their prescription is sent to a nearby pharmacy for pick-up.
  • Some, but not all, of these platforms accept private insurance and/or Medicaid, and there is considerable variation in out-of-pocket costs for those who self-pay.

Provision of EC in Health Care Settings

  • Several major medical and public health organizations, such as the American Academy of Pediatrics, American College of Obstetricians and Gynecologists, and the American Public Health Association, endorse the use of EC and advocate for broader access to EC.
  • Counseling and coverage of EC is included as a standard of care in the federal requirements for providing Quality Family Planning Services (QFP). Providers are encouraged to discuss EC with their patients, inform them of its availability, and provide them with an advanced supply of EC pills if the patient requests them. Advance provision of EC can increase the chances that someone will have EC on hand and use it when needed, but research has found that few clinicians regularly provide advance provision of EC pills.
  • There have been ongoing efforts to make EC more readily available to survivors of sexual assault. Currently, 21 states and the District of Columbia require that emergency room staff provide EC to women after sexual assault (Figure 3). However, some studies have documented that a sizable share of clinicians are not fully informed about EC options, safety, and efficacy. Additionally, some community health centers have reported challenges stocking IUDs due to high costs.
  • In 2015, Indian Health Service (IHS) clarified its policy on access to the OC pill for Native American women, including that a prescription or age verification to access Plan B is not required.
More Than Half of States Do Not Require Emergency Rooms to Provide Emergency Contraception or Information on Emergency Contraception

Availability and Access in Pharmacies

  • Nine states have laws that allow pharmacists to directly prescribe and dispense EC to women of all ages without obtaining a clinician’s prescription.
  • Four states have measures that require pharmacies or pharmacists to fill all valid prescriptions. These policies have been enacted, in part, in response to reports of pharmacists refusing to fill prescriptions for EC pills because they oppose its use on moral or religious grounds.
  • Ten states have laws allowing pharmacies or pharmacists to refuse to dispense EC pills on the basis of moral or religious objections.
  • Pharmacies are not required to stock EC pills and some studies show that EC pills that may be sold OTC are not consistently stocked on store shelves and are sometimes kept behind the counter or in a locked display due to the high cost of the product. This report also documented misinformation regrading age and ID requirements among pharmacy staff and consumers.
Poll Finding

KFF Tracking Poll on Health Information and Trust: January 2025

Published: Jan 28, 2025

Findings

Key Takeaways

  • As Senate committee hearings begin for President Donald Trump’s nominees for key health positions, the latest KFF Tracking Poll on Health Information and Trust finds that public trust in government health agencies has fallen over the past 18 months, continuing a decline that began during the COVID-19 pandemic. The share who says they trust the U.S. Centers for Disease Control (CDC) “a great deal” or “a fair amount” to make the right recommendations on health dropped slightly from 66% in June 2023 to 61% now, while trust in the U.S. Food and Drug Administration (FDA) and state and local public health officials each dropped by double digits (from 65% to 53% and 64% to 54%, respectively). Individual doctors remain the most trusted source of health information, although the share saying they trust their own doctor “a great deal” or “a fair amount” to make the right health recommendations also declined from 93% to 85% over the same period.
  • Partisan differences in trust in government health agencies that emerged during the pandemic remain, as Democrats are about 30 percentage points more likely than Republicans to say they trust the U.S. Department of Health and Human Services (HHS) to make the right recommendations on health (73% vs. 42%), with similar partisan gaps in trust for agencies that fall under HHS including CDC, the FDA, the Centers for Medicare and Medicaid Services (CMS), and scientists working for the National Institutes of Health (NIH). The opposite pattern is true when it comes to trust in President Trump’s picks to run some of those agencies. Overall, about four in ten say they trust President Trump (42%), Robert F. Kennedy, Jr. (43%), and Dr. Mehmet Oz (43%) “a great deal” or “a fair amount” to make the right recommendations when it comes to health. This includes few Democrats (7%, 7%, and 14% respectively) compared to about eight in ten Republicans. In fact, similar shares of Republicans say they trust President Trump (84%), Dr. Oz (83%), and RFK Jr. (81%) as say they trust their own doctors (84%) to make the right recommendations on health issues.
  • While large shares of the public continue to express positive attitudes toward childhood vaccines and school vaccination requirements, some trends suggest the level of support may be eroding somewhat among Republicans and parents. About eight in ten (82%) parents say they normally keep their children up to date with recommended childhood vaccines like the MMR, while about one in six (17%) report delaying or skipping some shots, up from 10% in 2023. The change is most pronounced among Republican and Republican-leaning parents, about one in four (26%) of whom now report skipping or delaying some vaccines for their children, up from 13% in 2023.
  • The false claim that the MMR vaccines have been proven to cause autism continues to persist, with most adults – including parents – falling in the “malleable middle,” expressing some level of uncertainty about whether this claim is true or false. Parents who believe or are open to believing the falsehood that the MMR vaccines have been proven to cause autism are about four times more likely as those who say this myth is “definitely” or “probably false” to report delaying or skipping vaccines for their children (37% vs. 8%).
  • Despite some shifts in overall vaccine attitudes, the latest KFF Tracking Poll on Health Information and Trust finds strong support for public school vaccine requirements. Eight in ten (83%) U.S. adults say public schools should require some vaccines for students, allowing for health and religious exceptions, including large majorities of Democrats (93%), independents (85%), and Republicans (75%). At the same time, much of the public is confused about the federal government’s role in school vaccine requirements, with about a third correctly answering that the federal government makes recommendations for which vaccines schools should require. The remainder either incorrectly believe the federal government sets these requirements or say they are not sure.
  • Beyond childhood vaccines, myths about COVID-19 vaccines continue to persist and may be becoming entrenched among some Republicans. Four in ten Republicans now say it is “probably” or “definitely true” that “more people have died from COVID-19 vaccines than from the virus itself,” up from one quarter in 2023. In fact, the COVID-19 vaccine has been estimated to have prevented millions of hospitalizations and deaths in the U.S. alone.
  • When asked about the H5N1 bird flu in the U.S., most adults are not concerned about themselves or a family member getting sick, though 44% are “very” or “somewhat concerned” there will be a widespread outbreak in the U.S. Looking toward the future, four in ten adults say that compared to 2020, the U.S. government is now more prepared to deal with another pandemic or widespread health crisis, while about one in four (26%) say the U.S. is less prepared, and one-third (34%) say it is just as prepared as it was. Similar shares of adults across partisanship, age, race, and ethnicity say the government is more prepared than it was before.

Public Trust in Key Health Agencies Has Declined

At the start of President Trump’s second presidential term, the public is divided along partisan lines in their trust in key government health agencies. Over the past several months, President Trump and his political allies have publicly challenged these health-related agencies and discussed cutting some of their funding as part of an effort aimed at increasing government efficiency.

Trust in U.S. government health agencies declined during the COVID-19 pandemic, most notably following the rollout of the COVID-19 vaccines. KFF tracking polls between 2020 and 2022 showed declining trust, especially among Republicans, in the U.S. Centers for Disease Control (CDC), the U.S. Food and Drug Administration (FDA), local public health departments, and Dr. Anthony Fauci as sources of reliable information on COVID-19 and the vaccines. The latest KFF Tracking Poll on Health Information and Trust finds that when it comes to health information more generally, trust in the FDA, CDC, and state and local public health officials remains partisan and has continued to decline. The share who says they trust the CDC “a great deal” or “fair amount” has fallen slightly overall (from 66% in June 2023 to 61% in the latest poll), driven by a nine-percentage point drop among Republicans (from 48% to 39%). The public’s trust of the FDA to make the right recommendations on health has also fallen (from 65% to 53%), as has trust in state and local public health officials (from 64% to 54%), including similar decreases among Republicans, Democrats, and independents.

While large shares of adults continue to trust their own doctors to make the right recommendations when it comes to health issues, this share also decreased from June 2023 by eight percentage points overall (from 93% to 85%), driven by a drop among Republicans (from 94% to 84%) and independents (93% to 84%). Doctors continue to be the most trusted source of health information, but this decrease in trust may reflect a trend of declining trust in professions across industries.

Trust in Personal Doctors and Government Health Agencies Has Declined Since 2023

Despite some declining trust in government health agencies, two-thirds of adults say they trust scientists at the National Institutes of Health (NIH) (66%) to make the right recommendations on health, and about six in ten trust the CDC (61%). Slightly more than half say they trust the U.S. Department of Health and Human Services (HHS) (55%), the Centers for Medicare and Medicaid Services (CMS) (54%), their state and local public health officials (54%), and the FDA (53%) when it comes to health recommendations. Fewer – about four in ten – say they trust President Trump (42%) and his choices for key health-related positions, including Robert F. Kennedy, Jr., the nominee for Secretary of HHS (43%), and Dr. Mehmet Oz, President Trump’s choice to lead CMS (43%).

Notably, fewer than one in four U.S. adults say they trust any of these government agencies or individuals “a great deal” when it comes to making health recommendations.

Most Adults Trust Key Health Agencies at Least a Fair Amount, Though Fewer Than One in Four Trust Them “A Great Deal

Apart from individual doctors, who garner trust from a large majority of Democrats, independents, and Republicans, there are stark partisan differences in trust in government agencies and individuals on health issues. Democrats are much more likely than Republicans to express trust in government institutions and federal agencies, including HHS (73% vs 42%), CMS (75% vs 38%), CDC (85% vs. 39%), and the FDA (71% vs. 39%). On the other hand, much larger shares of Republicans compared to Democrats say they trust President Trump and his health care nominees to oversee these agencies. While few Democrats trust President Trump or his nominees, similar shares of Republicans say they trust President Trump (84%), Dr. Oz (83%), and RFK Jr. (81%) as the shares that say they trust their own doctors (84%) to make the right recommendations on health issues.

Majority of Democrats Trust Key Health Agencies, While Republicans are More Trusting of President Trump and His Health Secretary Nominees

Shifting Attitudes Toward Childhood Vaccines, Particularly Among Republican Parents

While large shares of the public continue to express positive attitudes toward childhood vaccines and school vaccination requirements, some trends in the latest KFF Tracking Poll on Health Information and Trust suggest that support may be eroding somewhat among Republicans and parents. In the latest poll, about eight in ten (82%) parents say they normally keep their child up to date with recommended childhood vaccines like the MMR, while about one in six (17%) report delaying or skipping some shots. This marks a slight change from KFF polls fielded from 2021 to 2023, when about nine in ten parents consistently reported staying on schedule. The share of parents who report skipping or delaying some vaccines has increased by seven percentage points since September 2023, driven largely by Republican-leaning parents. Now, about one in four (26%) Republican and Republican-leaning parents report vaccine delays for their children, about twice the 13% who said the same in 2023. The rise in reported vaccination delays among Republican parents mirrors a growing partisan divide on attitudes toward childhood vaccinations among the general public, and is consistent with a KFF analysis of data from the CDC that found that parents are increasingly seeking non-medical exemptions from school vaccine requirements.

Share Who Say They Keep Their Children Up-to-Date on Recommended Vaccines Has Dropped, Especially Among Republican Parents

Most of the public continues to believe that the benefits of childhood vaccines for measles, mumps, and rubella (MMR) outweigh the risks, though this share has declined since 2019. Currently, eight in ten adults say, “The benefits of childhood vaccines for measles, mumps, and rubella (MMR) outweigh the risks,” while about one in five (18%) say the risks of these vaccines “outweigh the benefits.”

While large shares of adults continue to say the benefits outweigh the risks, there has been a widening partisan gap on this question. Consistently since 2019, about nine in ten Democrats and Democratic-leaning independents say the benefits of MMR vaccines outweigh the risks, while Republicans and Republican-leaning independents are now 15 percentage points less likely than in 2019 to share this view (74% now vs. 89% in 2019).

Most Say Benefits of MMR Vaccines Outweigh Risks, but Shares Have Declined Since 2019 Among Republicans

Among parents of children under age 18, the large majority say the benefits of the MMR vaccine outweigh the risks, but one in four now say the risks outweigh the benefits, up from 17% in 2022. Like the public overall, parents are divided along partisan lines when weighing the risks and benefits of childhood vaccines. Republican and Republican-leaning parents are about twice as likely as Democratic and Democratic-leaning parents to say, “the risks of childhood vaccines for MMR outweigh the benefits” (15% vs. 33%).

More Parents Now Than in 2022 Say Risks of MMR Vaccines Outweigh Benefits, Driven by Shift Among Republicans

Most Parents are Uncertain About MMR Autism Myth

Amid shifting attitudes toward childhood vaccines, many adults – including parents – continue to report hearing myths that MMR vaccines are linked to autism, and many are uncertain about whether to believe this false claim. About two-thirds (63%) of adults overall and parents (67%) say they have heard the false claim that the MMR vaccines have been proven to cause autism in children, a claim that began with a since-retracted study in the 1990s and has recently been associated with Robert F. Kennedy, Jr. The share reporting they have heard this claim remains unchanged since 2023.

As previous KFF polls have found when it comes to health misinformation on a range of topics, many adults fall in the “malleable middle,” expressing some level of uncertainty about this false health claim. Just three percent of adults say it is “definitely true” that the MMR vaccines have been proven to cause autism in children. A larger share (20%) is open to believing the myth, saying it is “probably true,” while many lean toward the correct answer but still express uncertainty, saying the claim is “probably false” (41%). One-third of adults say it is “definitely false.” Most Republicans and independents fall into this malleable middle category, with substantial shares saying the claim is “probably false,” while half of Democrats say this claim is “definitely false.” Notably, just about one in ten parents who identify or lean Republican (11%) say this claim is “definitely false.”

About Six in Ten Adults Are Uncertain Whether the False Claim That MMR Vaccines Are Proven To Cause Autism Is True

Belief in the myth that the MMR vaccine causes autism is correlated with parents’ decisions about their children’s vaccinations. Among parents who say it is “probably” or “definitely” true that the MMR vaccines have been proven to cause autism, nearly four in ten (37%) say they have delayed or skipped some childhood vaccines for their children, compared to just eight percent of parents who say this myth is “probably” or “definitely” false.

Parents Who Believe False Claim About MMR Vaccines Causing Autism Are More Likely To Have Skipped Some Routine Vaccines for Their Child

COVID-19 Vaccine Myths Persist

In the five years since the start of the COVID-19 pandemic, myths related to the virus and the vaccine persist. First explored in the KFF Health Misinformation Tracking Poll, myths related to COVID-19 are widespread, and many adults are not confident in assessing their validity. The latest poll finds that nearly half (46%) of adults report hearing the falsehood that “more people have died from the COVID-19 vaccines than have died from the COVID-19 virus.” This share has increased slightly from about four in ten (41%) in 2023, driven by a large increase among Republicans. About half (52%) of Republicans say they have heard or read this false claim, up from about one in three (35%) in June 2023. Slightly more than four in ten Democrats reported hearing this myth in each poll.

The Share of Republicans Who Have Heard the False Claim That COVID-19 Vaccines Are More Deadly Than The Virus Has Increased Since 2023

Few adults (8%) say the false claim that “more people have died from COVID-19 vaccines than have died from the COVID-19 virus” is “definitely true,” but levels of certainty vary widely by partisanship, and an increasing share of Republicans is open to endorsing this false claim. About four in ten adults (43%) recognize this claim as “definitely false,” including one in five Republicans (20%) and more than three times as many Democrats (65%). While most Republicans lean toward this claim being false, four in ten say it is “definitely true” (13%) or “probably true” (27%), an increase from one in four in June 2023, when 7% of Republicans said this was “definitely true” and 18% said it was “probably true.”

Larger Shares of Republicans Now Say it is Probably or Definitely True That the COVID-19 Vaccine is More Deadly Than Virus

Views of School Vaccine Requirements

Despite some shifts in overall vaccine attitudes, the latest KFF Tracking Poll on Health Information and Trust finds strong support for public school vaccine requirements. Eight in ten (83%) U.S. adults say public schools should require some vaccines for students, allowing for health and religious exceptions, including large majorities of Democrats (93%), independents (85%) and Republicans (75%). One in six adults say public schools should not require any vaccinations, rising to one in four Republicans. Like the general public, parents are divided on this issue along partisan lines. Three in four (75%) parents overall say public schools should have some vaccine requirements, while one in four say public schools should not have any vaccine requirements, rising to one in three Republican or Republican-leaning parents (34%). The vast majority of Democratic-leaning parents (93%) say public schools should require some vaccines.

Although President Trump said on the campaign trail that he would cut federal funding to schools with vaccine mandates, a previously released report from this KFF survey found that few adults across partisans say this should be a priority for the Trump administration.

Majorities Across Partisanship Want Public Schools To Require Some Vaccinations

The Role of the Federal Government in School Vaccine Requirements

Despite strong support for school vaccine mandates, there are gaps in what the public understands about the role of the federal government in this arena. The public is split, with about one-third of adults aware the federal government makes recommendations for which vaccines school-age children should receive (36%), one-third incorrectly saying that the federal government currently sets requirements for which vaccines school-age children get (35%), and about three in ten unsure (28%). Parents and adults across partisans are similarly divided in their knowledge of the federal government’s role in providing vaccine recommendations for children.

Public and Parents Are Divided in Their Knowledge About the Role the Federal Government Plays in Vaccination Standards for Public School Children

While many are unsure about the federal government’s role in vaccine recommendations, a large majority of the public trust the CDC “a great deal” (30%) or “a fair amount” (39%) to make recommendations about childhood vaccines. As is the case with trust in government health agencies generally, partisans differ in how much they trust the CDC to make these recommendations, with nearly nine in ten Democrats saying they trust the CDC “a great deal” or “a fair amount” (87%) in this area, compared to just over half (54%) of Republicans.

Large Majorities Trust the CDC To Make Recommendations for Childhood Vaccines, Though Partisans Are Split

Pandemic Preparedness and Avian Flu

The COVID-19 pandemic illustrated the challenges that can arise when public health agencies are required to communicate rapidly evolving scientific information to a sometimes-skeptical public. Declining trust in government and health agencies, a trend that began during the COVID-19 pandemic and that this poll indicates is continuing today, suggests that these communication challenges are likely to continue and perhaps intensify the next time the U.S. is faced with a pandemic or widespread health crisis. Despite declining trust, larger shares of the public across partisans say the government is more prepared rather than less prepared for another pandemic than it was five years ago. Four in ten adults say that compared to 2020, the U.S. government is now more prepared to deal with another pandemic or widespread health crisis, while about one in four (26%) say the U.S. is less prepared and one-third (34%) say it is just as prepared as it was. Similar shares of adults across partisanship, age, race, and ethnicity say the government is more prepared than it was before.

About Four in Ten Think the U.S. Is More Prepared for a Pandemic Now Compared With 2020, Including Similar Shares Across Partisans

Since the spring of 2024, H5N1 avian influenza has impacted people and animals in the U.S. and Canada. At the time of this survey, CDC indicated the current public health risk of bird flu is low. Although there have been some cases of people infected with bird flu, there has yet to be human-to-human transmission. As of early January 2025, about half (49%) of the public has heard at least “some” about recent human cases of bird flu in the U.S., including one in ten (11%) who has heard “a lot.” One-third (33%) of adults has heard “a little” and one in five (18%) has heard “nothing at all.” Awareness is low across most demographic groups, though Democrats and those ages 65 and over are among those most likely to say they’ve heard “a lot” (15% and 17%, respectively).

Forty-four percent of U.S. adults are “very” or “somewhat concerned” that there will be a widespread outbreak of bird flu in the U.S., while fewer (34%) say they are concerned that they or a family member will get sick. While most adults are not concerned about bird flu, majorities of Hispanic adults (64%), Democrats (58%), and adults in lower income households (54%) express concern about a widespread outbreak of bird flu. Each of these groups is also more likely than their counterparts to be concerned that they and their families will get sick.

Just Under Half Are Concerned About a Widespread Outbreak of the Bird Flu in the U.S., a Third Worried That They or Someone in Their Family Will Get Sick

Methodology

This KFF Tracking Poll on Health Information and Trust was designed and analyzed by public opinion researchers at KFF. The survey was conducted January 7-14, 2025, online and by telephone among a nationally representative sample of 1,310 U.S. adults in English (1,233) and in Spanish (77). The sample includes 1,024 adults (n=48 in Spanish) reached through the SSRS Opinion Panel either online (n=999) or over the phone (n=25). The SSRS Opinion Panel is a nationally representative probability-based panel where panel members are recruited randomly in one of two ways: (a) Through invitations mailed to respondents randomly sampled from an Address-Based Sample (ABS) provided by Marketing Systems Groups (MSG) through the U.S. Postal Service’s Computerized Delivery Sequence (CDS); (b) from a dual-frame random digit dial (RDD) sample provided by MSG. For the online panel component, invitations were sent to panel members by email followed by up to three reminder emails.

Another 286 (n=29 in Spanish) interviews were conducted from a random digit dial telephone sample of prepaid cell phone numbers obtained through MSG. Phone numbers used for the prepaid cell phone component were randomly generated from a cell phone sampling frame with disproportionate stratification aimed at reaching Hispanic and non-Hispanic Black respondents. Stratification was based on incidence of the race/ethnicity groups within each frame.

Respondents in the phone samples received a $15 incentive via a check received by mail. SSRS Opinion panelists who completed the survey by phone were offered $10 via a mailed check and those who completed online received $5 via e-gift card. In order to ensure data quality, cases were removed if they failed two or more quality checks: (1) attention check questions in the online version of the questionnaire, (2) had over 30% item non-response, or (3) had a length less than one quarter of the mean length by mode. Based on this criterion, no cases were removed.

The combined cell phone and panel samples were weighted to match the sample’s demographics to the national U.S. adult population using data from the Census Bureau’s 2024 Current Population Survey (CPS), September 2023 Volunteering and Civic Life Supplement data from the CPS, and the 2024 KFF Benchmarking Survey with ABS and prepaid cell phone samples. The demographic variables included in weighting for the general population sample are sex, age, education, race/ethnicity, region, civic engagement, frequency of internet use, political party identification by race/ethnicity, and education. The weights account for differences in the probability of selection for each sample type (prepaid cell phone and panel). This includes adjustment for the sample design and geographic stratification of the cell phone sample, within household probability of selection, and the design of the panel-recruitment procedure.

The margin of sampling error including the design effect for the full sample is plus or minus 3 percentage points. Numbers of respondents and margins of sampling error for key subgroups are shown in the table below. For results based on other subgroups, the margin of sampling error may be higher. Sample sizes and margins of sampling error for other subgroups are available by request. Sampling error is only one of many potential sources of error and there may be other unmeasured error in this or any other public opinion poll. KFF public opinion and survey research is a charter member of the Transparency Initiative of the American Association for Public Opinion Research.

GroupN (unweighted)M.O.S.E.
Total1,310± 3 percentage points
Party ID
Democrats403± 6 percentage points
Independents383± 6 percentage points
Republicans383± 6 percentage points
Parents or guardians of a child under 18 years old396± 6 percentage points


News Release

Poll: Trust in Public Health Agencies and Vaccines Falls Amid Republican Skepticism

Share of Parents Who Say They Keep Their Children Up to Date on Their Vaccines Falls; 1 in 4 Republicans Parents Now Say They’ve Skipped or Delayed Some Childhood Vaccines

Published: Jan 28, 2025

As President Trump begins his second term, the public’s trust in health information from key health agencies has fallen over the past 18 months, continuing a decline that began during the COVID-19 pandemic, finds the new KFF Tracking Poll on Health Information and Trust. 

Just over half (53%) of the public now says they trust the Food and Drug Administration (FDA) to make the right recommendations on health issues at least “a fair amount,” down from nearly two-thirds (65%) in June 2023. The share who says they trust their state and local public health officials fell a similar amount (to 54% now from 64% in 2023). Trust in health recommendations from the Centers for Disease Control and Prevention (CDC) also dipped slightly from 66% in 2023 to 61% now. 

When asked about other health institutions, two-thirds (66%) of the public say they trust scientists at the National Institutes of Health, and just over half trust the Department of Health and Human Services (HHS) (55%) and the Centers for Medicare and Medicaid Services (CMS) (54%) to make the right recommendations on health issues. 

Republicans are far less trustful of each of these health institutions than Democrats, with independents in the middle.

An even larger partisan divide in the opposite direction exists in trust in health information from President Trump and Robert F. Kennedy Jr., his nominee to be HHS Secretary.

Less than half the public overall trust President Trump (42%) and Kennedy (43%) to make the right recommendations on health issues. Among Republicans, however, similar shares say they trust President Trump (84%) and Kennedy (81%) as say they trust their own doctors (84%). 

The public overall continues to place the most trust in their own doctors, though the share who say they trust their own doctors’ health recommendations “a great deal” or “a fair amount” is down from 93% in 2023 to 85% now, mostly due to declining trust among independents and Republicans.

Attitudes Toward Childhood Vaccines Remain Positive, Though Eroding Among Republicans

While large shares of the public continue to express positive attitudes toward childhood vaccines and school vaccination requirements, the poll reveals some erosion in support among Republicans and parents.

About eight in ten (82%) parents of children under age 18 now say they normally keep their child up to date with recommended childhood vaccines such as the one for measles, mumps, and rubella (MMR), down 8 percentage points from 2023.

About one in six (17%) now report delaying or skipping some shots, up from 10% in 2023. The shift is most pronounced among Republican parents: About one in four (26%) now report skipping or delaying some vaccines for their children, up from 13% in 2023.

A large majority of the public continues to believe that the benefits of the MMR vaccines outweigh the risks (80%), while about one in five (18%) say that the risks outweigh the benefits. Among parents, about seven in 10 (72%) say the vaccines’ benefits outweigh the risks, while a quarter (25%) say the risks outweigh the benefits. Republican-leaning parents are twice as likely as Democratic-leaning parents to say that the vaccines’ risks outweigh the benefits (33% vs. 15%), though large majorities of each group continue to say the benefits outweigh the risks.During his campaign, President Trump had vowed to cut federal funding to schools with vaccine mandates, though the poll suggests large majorities of the public and of parents across political parties support such requirements.

Among the public overall, 83% say public schools should require some vaccines for students, allowing for health and religious exceptions. This includes large majorities of Democrats (93%), independents (85%) and Republicans (75%).

Among parents, three-quarters (76%) say public schools should require vaccines, while one in four (24%) say they should not. Two-thirds (66%) of Republican and Republican-leaning parents favor schools requiring vaccines, while a third (34%) say that schools should not require any vaccines.

Other findings include:

  • About two-thirds (63%) of adults overall and parents (67%) say they have heard the false claim that the MMR vaccines have been proven to cause autism in children. Just 3% of adults say this false claim is “definitely true.” One-third (33%) say it is “definitely false.” The rest are somewhat uncertain what to believe, saying the claim is either “probably true” (20%) or “probably false” (41%).
  • Parents who say that the false claim that MMR vaccines are proven to cause autism is definitely or probably true are much more likely to say they have delayed or skipped some vaccines for their children than parents who say it definitely or probably false (37% and 8%, respectively).
  • When asked about the H5N1 bird flu in the U.S., about one in three (34%) say they are “very” or “somewhat” concerned that they or a family member will get sick. About four in 10 (44%) say they are “very” or “somewhat concerned” that there will be a widespread outbreak in the U.S.
  • Looking toward the future, a larger share of adults say the U.S. government is now more prepared (40%) rather than less prepared (26%) to deal with a pandemic or widespread health crisis than it was in 2020. Similar shares of adults across partisanship, age, race, and ethnicity say the government is more prepared than it was before.

Designed and analyzed by public opinion researchers at KFF, the survey was conducted Jan. 7-14, 2025, online and by telephone, among a nationally representative sample of 1,310 U.S. adults in English and in Spanish. The margin of sampling error is plus or minus 3 percentage points for the full sample. For results based on other subgroups, the margin of sampling error may be higher.

News Release

HealthCare.gov Insurers Denied Nearly 1 in 5 In-Network Claims in 2023, but Information About Reasons is Limited in Public Data

Enrollees Rarely Appeal Claims Denials; When They Do, Insurers Often Uphold the Original Denial

Published: Jan 27, 2025

HealthCare.gov insurers denied nearly one out of every five claims (19%) submitted for in-network services and an even larger share (37%) share of claims for out-of-network services in 2023, a new KFF analysis finds.

The analysis examines the main source of publicly available data on claims denials and appeals for individual-market plans available through the federal HealthCare.gov marketplace. The Affordable Care Act requires certain entities to report data about claims denials and appeals to encourage transparency about how insurance coverage works for enrollees. The publicly available data does not include marketplace plans sold on state-based marketplaces or employer health plans, the nation’s primary source of private health coverage.

The analysis finds a huge variation across HealthCare.gov insurers, which had in-network denial rates as low as 1% and as high as 54% in 2023 in some states. Nationwide, high-volume insurers with higher in-network denial rates across HealthCare.gov states included Blue Cross Blue Shield of Alabama (35% for its 12 plans in that state), UnitedHealth Group (33% across 274 plans in 20 states), Health Care Service Corporation (29% across 915 plans in four states), Molina Healthcare (26% across 72 plans in nine states), and Elevance Health (23% across 154 plans in seven states).

Of limited information available on in-network claims denial reasons, the most common reason for denial was a general “other” reason (34%), while 16% involved excluded services, 9% involved lack of prior authorization or referral, and 6% involved medical necessity. Other common reasons for denials included administrative issues (18%) and exceeding benefit limits (12%).

Consumers appealed about 1% of denied in-network claims in 2023. Following those appeals, insurers often upheld their initial denials (56%), and consumers rarely took the next step to file an external appeal.

The analysis examines data from the Centers for Medicare and Medicaid Services on 425 million claims submitted to 175 insurers selling marketplace coverage in 2023, the most recent year available. Additional data files with insurer- and state-specific information are available at kff.org.