Classifying Misoprostol and Mifepristone as Controlled Substances: Implications for the Management of Non-Abortion Related Conditions

Published: Apr 3, 2025

Key Takeaways

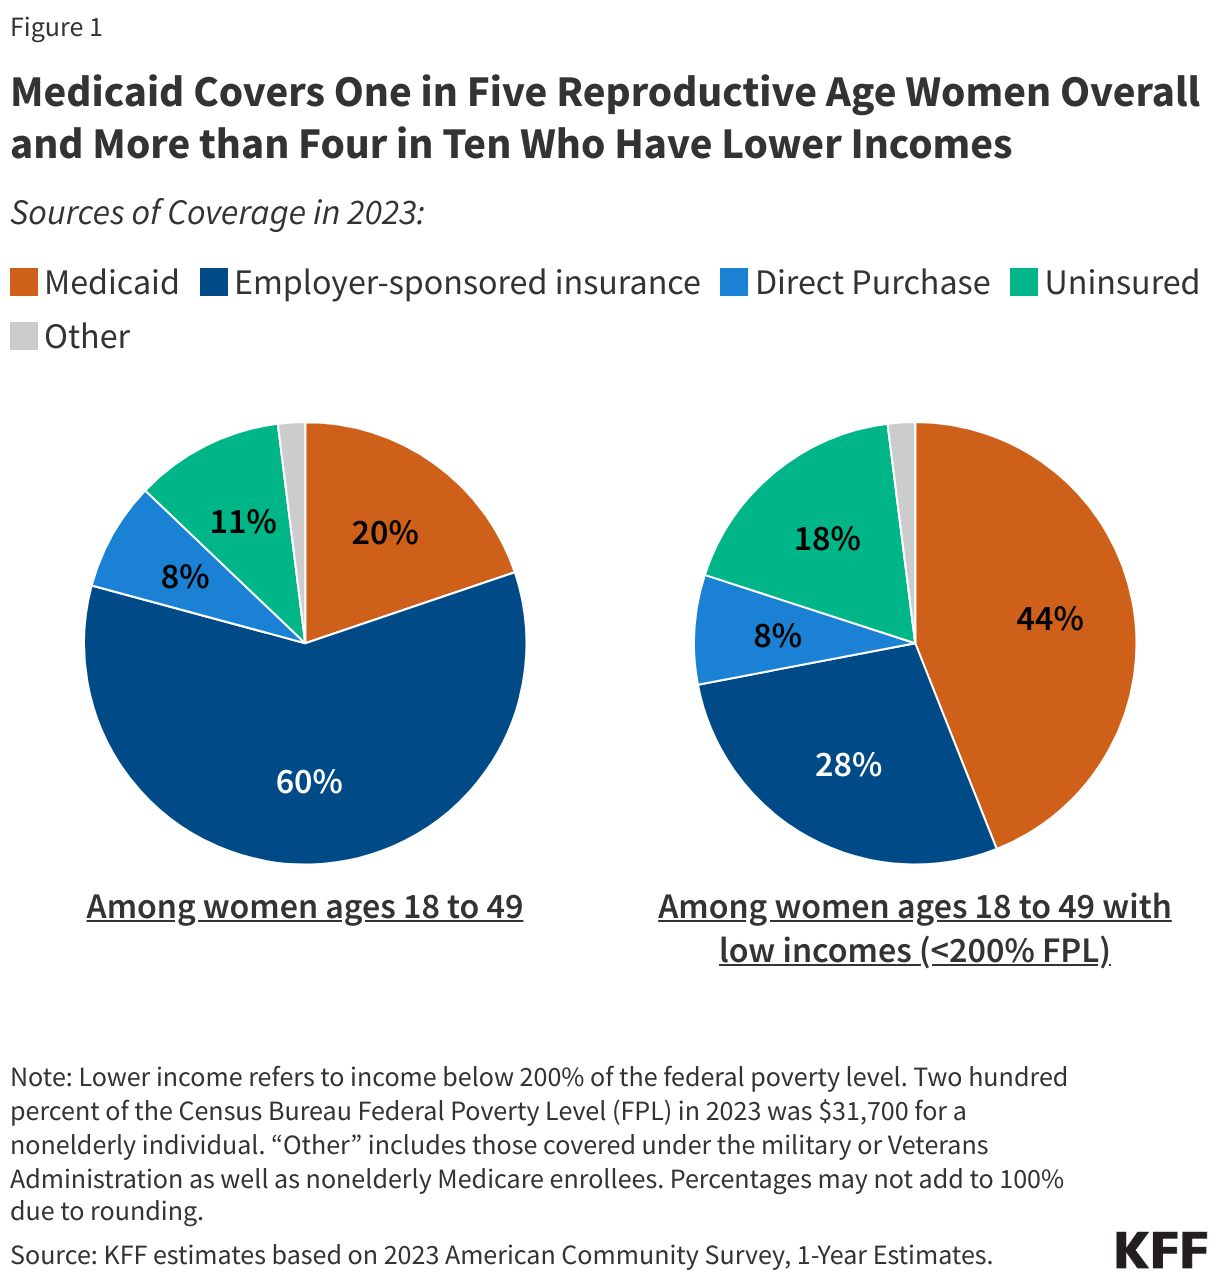
  • Misoprostol and mifepristone, the two drugs used as part of the FDA approved medication abortion regimen, also have a wide range of clinical applications and are used to manage the reproductive health of millions of women across the nation that include but are not limited to abortion.
  • Louisiana has enacted and implemented a law reclassifying mifepristone and misoprostol as Schedule IV controlled substances. Similar legislation has been introduced in Texas, Missouri, and Kentucky.
  • Among a sample of claims weighted to represent people with employer sponsored insurance, over half of reproductive age women with an outpatient claim for misoprostol unrelated to abortion did not have a pregnancy related diagnosis and 28% were prescribed the medication to manage a miscarriage.
  • About half of outpatient claims for misoprostol in Texas and Missouri Medicaid, and a third in Kentucky and Louisiana were used to manage miscarriages. About one in five were used for other pregnancy-related reasons, such as induction of labor or to manage pregnancy-related hemorrhages in Texas, Missouri, and Louisiana Medicaid.
  • States seeking to reclassify mifepristone and misoprostol as controlled substances to limit access to medication abortion may impede access to medications that impact the health and safety of women who rely on these medications to manage a wide range of conditions.

On October 1, 2024, Louisiana enacted a new law that reclassifies two drugs commonly used for medication abortion, mifepristone and misoprostol, as Schedule IV controlled substances. Soon after, lawmakers in Texas, Missouri, and Kentucky proposed similar legislation to designate these medications as controlled substances. Typically, only drugs with the potential for dependency or abuse are classified as controlled substances, with their scheduling (I-V) determined by their level of abuse risk. Examples of Schedule IV drugs include Ambien and Xanax. In addition to abortion care, mifepristone and misoprostol are used to treat several medical conditions. As controlled substances in Louisiana, they require special storage, ordering, and documentation procedures, which could result in delays in access to emergency and routine outpatient care. The other impact of these kinds of laws is to cause clinicians and pharmacists to be hesitant to prescribe or dispense these medications for non-abortion related care as to avoid becoming a formal part of the state record tracked through the Louisiana Prescription Monitoring Program (PMP).

Using data from both a convenience sample of claims weighted to be representative of people with employer sponsored health insurance and Medicaid claims from Texas, Missouri, Kentucky, and Louisiana, this analysis finds that these medications are often provided for many reasons other than abortion. Laws that limit access to these drugs could particularly affect women who rely on these medications to manage miscarriages, get IUDs, manage ulcers or autoimmune conditions as well as the clinicians that serve them.

Indications for Use of Misoprostol and Mifepristone

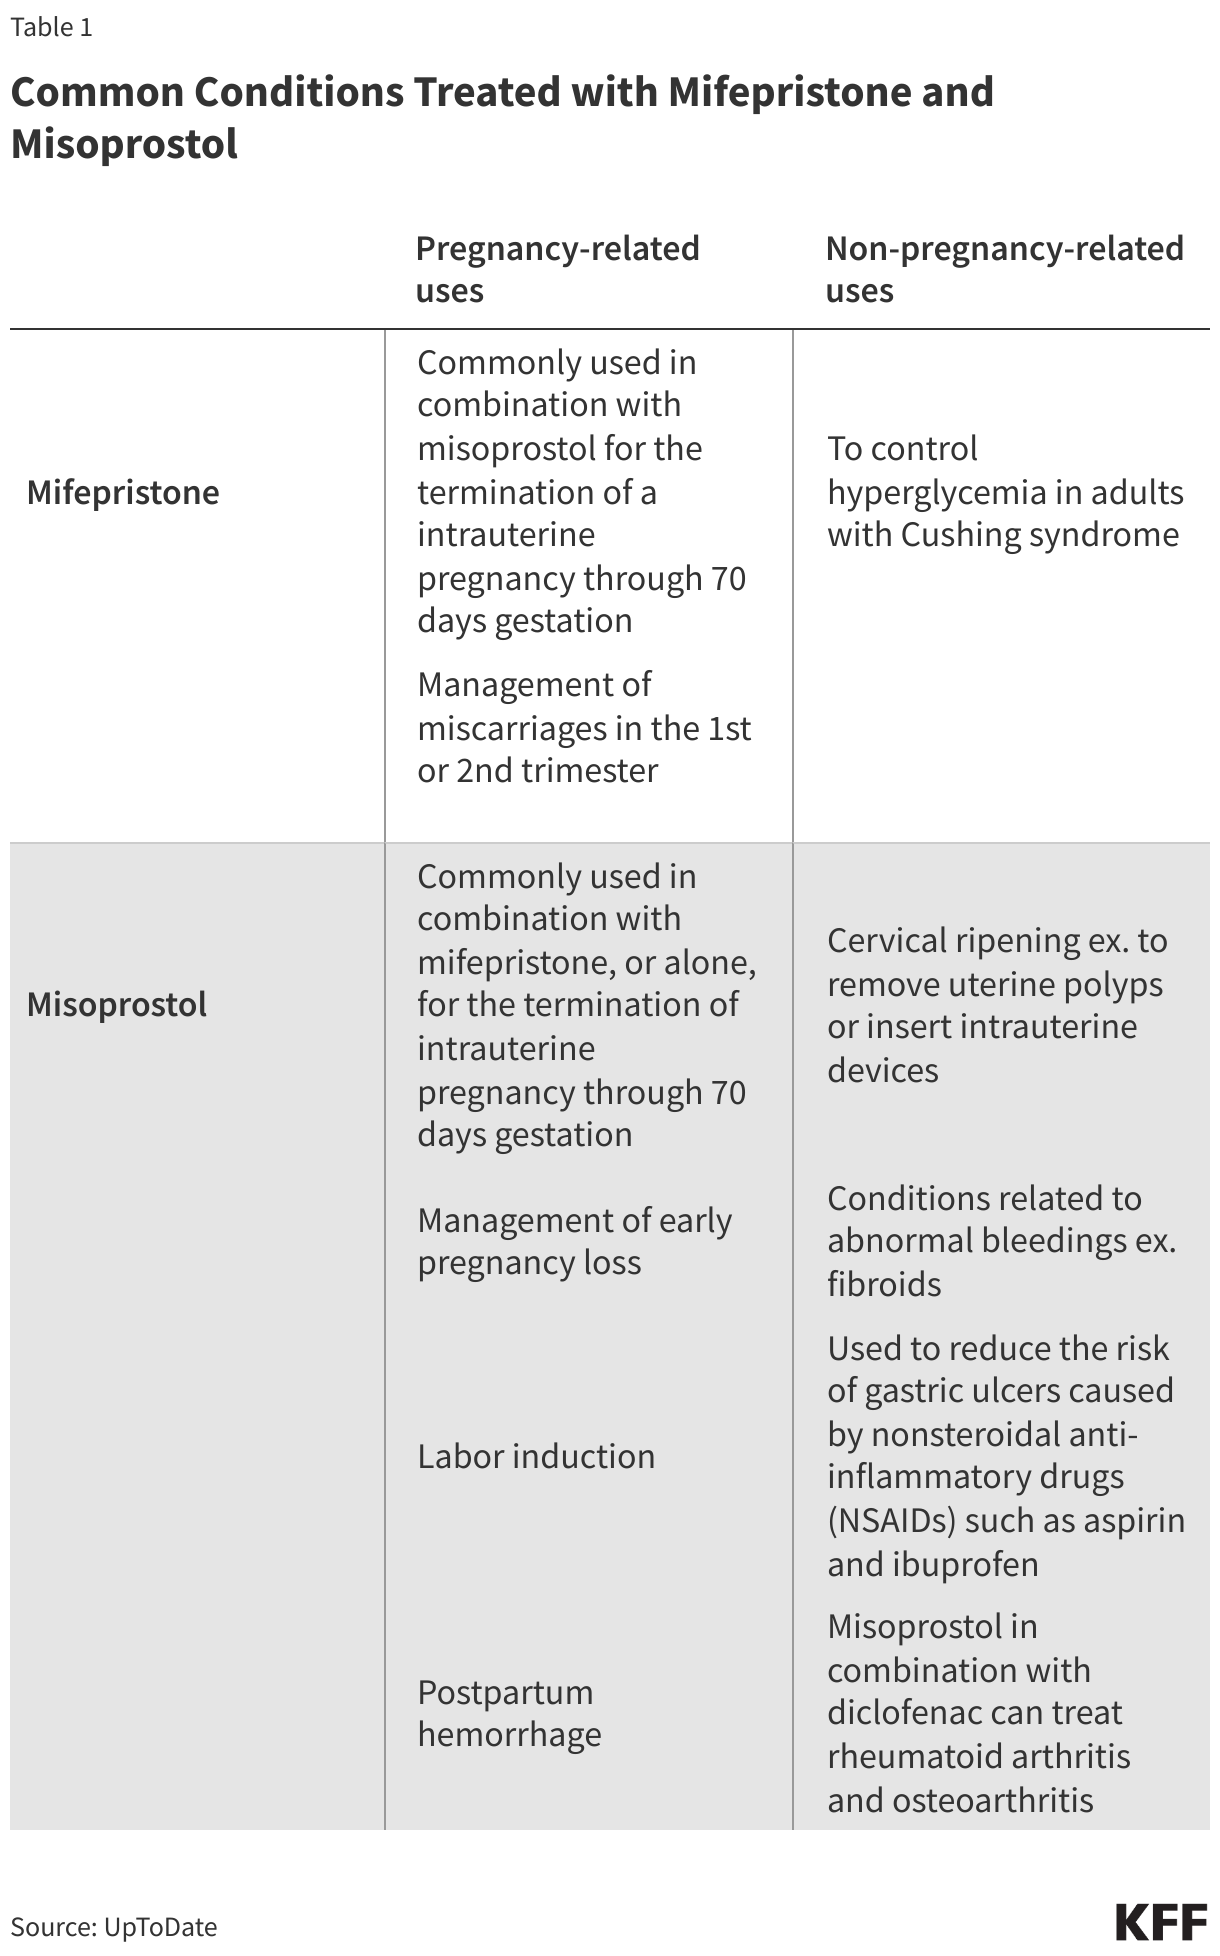
Both misoprostol and mifepristone are classified as essential medicines by the World Health Organization (WHO). Misoprostol is frequently used in obstetrics and gynecology for procedures like the medical management of miscarriage, induction of labor, cervical ripening before surgical procedures, and the treatment of postpartum hemorrhage. It is a prostaglandin that causes cervical softening and dilation, as well as uterine contractions. It is also indicated for reducing the risk of nonsteroidal anti-inflammatory drug (NSAIDs like aspirin and ibuprofen) induced gastric ulcers in patients at high risk of complications. Either alone or in combination with mifepristone, misoprostol can be used to terminate an intrauterine pregnancy in early stages.

Mifepristone, the other drug included in the abortion medication regimen approved by the Food and Drug Administration (FDA), works by blocking the hormone progesterone. And while most patients who receive medications for miscarriage management are given misoprostol alone, the combination of mifepristone and misoprostol has been shown to be more effective in miscarriage management and is the recommended protocol by The American College of Obstetricians and Gynecologists (ACOG). In addition, mifepristone is also indicated for controlling hyperglycemia in adults with Cushing syndrome.

Common Conditions Treated with Mifepristone and Misoprostol

Use of Misoprostol and Mifepristone

The analysis examines the outpatient diagnoses of reproductive aged females, ages 15-49, who had a non-abortion related misoprostol or mifepristone prescription or outpatient claim using the 2023 Merative MarketScan Encounter Database and 2021 Medicaid claims. These medications are often used for inpatient pregnancy-related procedures, such as miscarriage management, labor and delivery, as well as emergency situations such as hemorrhage. However, a limitation of this analysis was that it was not able to identify misoprostol or mifepristone use in an inpatient setting due to the bundling of drug claims along with other inpatient procedures for reimbursement purposes. The findings in this analysis thus include only the provision of the medications in an outpatient setting. Additionally, the claims used in this analysis only include medications for which there were claims that were submitted to the benefit plan and do not include services for which a claim was not filed. As this most directly impacts circumstances when mifepristone and misoprostol were used for medication abortions that were paid for out-of-pocket without using insurance and could result in an underestimate of the share of individuals using these drugs for the purposes of terminating a pregnancy, this analysis focuses only on medications provided via prescription or outpatient claim for non-abortion related care.

Among those with a non-abortion related mifepristone or misoprostol claim, the following outpatient diagnoses were flagged if they were within 90 days of the mifepristone or misoprostol claim because these drugs can be provided a month or two prior to a procedure:

  • miscarriage
  • other pregnancy-related conditions (including hemorrhage, induction of labor, delivery)
  • non-pregnancy related cervical ripening (IUD insertions, polyps, noninflammatory disorders of cervix uteri)
  • other non-pregnancy-related conditions for which misoprostol or mifepristone are used (including rheumatoid arthritis, fibroids, gastric ulcers, dermatitis, low back pain, osteoarthritis, and Cushing syndrome)

Because some patients had diagnoses in more than one of these categories, a hierarchy was applied to classify health plan enrollees into one category: miscarriage, other pregnancy-related, non-pregnancy-related cervical ripening, and other non-pregnancy-related conditions. Individuals with a mifepristone or misoprostol claim that did not have a diagnosis from one of these categories within 90 days of their claim or individuals that only had prescription claims for mifepristone or misoprostol without outpatient claims within 90 days were classified as “unexplained.”

Misoprostol Use

Among the reproductive aged women enrolled in employer-sponsored plans who had a non-abortion related outpatient misoprostol claim, 65% had no indication of pregnancy within 90 days of their misoprostol claim date (Figure 1). Diagnoses for conditions where misoprostol would be indicated for non-pregnancy-related cervical ripening, such as for an IUD insertion, made up the largest share of those with a non-abortion related outpatient or prescription misoprostol claim (42%). Another 14% had a diagnosis for another non-pregnancy related reason for which misoprostol can be used, such as gastric ulcers, rheumatoid arthritis, fibroids, or other conditions related to abnormal bleedings. More than one in four (28%) had a miscarriage diagnosis within 90 days and 7% had an outpatient diagnosis for another pregnancy-related condition, such as maternal hemorrhage or labor induction. The remaining 9% of women with an outpatient misoprostol claim did not have a diagnosis related to one of these conditions within 90 days and were categorized as unexplained.

Non-Abortion Related Outpatient Diagnoses Among Employer-Sponsored Insurance Claims for Misoprostol

Similarly, about three in ten Medicaid beneficiaries in Kentucky and Louisiana had a miscarriage diagnosis within 90 days of their misoprostol claim. In contrast, among Texas and Missouri Medicaid beneficiaries, around half of misoprostol claims had a miscarriage diagnosis within 90 days of the claim, likely because misoprostol is commonly used to expedite the expulsion of nonviable pregnancy tissue in miscarriage management (Figure 2). About one in five beneficiaries in Texas, Missouri, and Louisiana had another pregnancy-related diagnosis within 90 days, which could have included hemorrhage or labor induction.

About a third of beneficiaries in Texas and Missouri did not have a pregnancy diagnosis within 90 days of their misoprostol claim, while over half of beneficiaries in Kentucky and Louisiana did not. Around one in ten beneficiaries in Texas, Missouri, and Louisiana had a claim for non-pregnancy-related cervical ripening typically indicated for an IUD insertion or stricture or stenosis of the cervix for which misoprostol may be used to facilitate IUD insertion. However, over a quarter of beneficiaries in Kentucky had a claim for non-pregnancy-related cervical ripening within 90 days of their misoprostol claim. One in five beneficiaries in Kentucky had other non-pregnancy-related diagnoses for which misoprostol is used, such as gastric ulcers, fibroids, and abnormal bleeding, while this share was smaller in Texas, Missouri, and Louisiana, but still around 10%.

Non-Abortion Related Outpatient Diagnoses for Misoprostol Among Medicaid Beneficiaries in States Moving to Make It a Controlled Substance

Mifepristone Use

In contrast to misoprostol, the vast majority of women with non-abortion related outpatient claims for mifepristone (94%) had a miscarriage diagnosis within 90 days of their mifepristone claim (Figure 3). The remaining 6% had a diagnosis for another condition, such as Cushing syndrome.

Non-Abortion Related  Outpatient Diagnoses Among Women With Employer-Sponsored Claims for Mifepristone

Implications for Access

Misoprostol and mifepristone have clinical applications that are used to manage the reproductive health of millions of women across the nation. Despite their use as effective medications for terminating pregnancies, they are also frequently prescribed to manage many other conditions outside of abortion. Laws that seek to restrict access to these drugs will also impact healthcare for reproductive aged women who rely on them to treat a range of non-abortion related conditions, especially in states where abortion is already banned. Because controlled substances require specific prescribing and dispensing protocols and documentation outside of clinical records, health care providers, and pharmacies may choose not to stock or dispense them to avoid the risk of penalties or criminalization. Healthcare providers must also be licensed with the Drug Enforcement Administration (DEA) in order to prescribe controlled substances which could cause a further chilling effect in their use, despite the robust evidence of their effectiveness and safety. This could affect women who are prescribed misoprostol for procedures such as IUD insertion or uterine polyp removal, but it also jeopardizes effective and potentially life-saving miscarriage management for the up to one-in-five pregnancies that are estimated to result in early pregnancy loss.

Beyond outpatient care, these barriers could also result in treatment delays in emergency situations such as hemorrhage during labor and delivery, which accounts for 14% of pregnancy-related deaths in the United States. Under the new Louisiana law, hospitals must now securely lock away mifepristone and misoprostol or use a passcode-protected dispensing system. Some resource-limited hospitals, such as rural or community hospitals, may also lack the capacity to stock controlled substances, making these medications unavailable to patients at those facilities. States like Louisiana, Texas, Kentucky and Missouri that seek to reclassify mifepristone and misoprostol as Schedule IV controlled substances may not only limit access to medication abortion, but they may also have consequences that impact the health and safety of many who need these medications for reasons other than terminating a pregnancy.

Methods

The analysis is based on prescription drug and outpatient medical claims from the 2023 Merative MarketScan Commercial Claims and Encounters Database, which contains claims information provided by employer-sponsored plans, and 2021 Transformed Medicaid Statistical Information System Analytic File (TAF) data from Texas, Missouri, Kentucky, and Louisiana. There were 6,106,254 total women of reproductive age in the 2023 Merative MarketScan Commercial Claims and Encounter Database representing a weighted population of 47,235,846 women of reproductive age. The 2021 Transformed Medicaid Statistical Information System Analytic File included women of reproductive age from Texas (n = 1,625,479), Missouri (n = 337,305), Kentucky (n = 501,500), and Louisiana (n = 551,103).

Reproductive aged women, ages 15-49, were included if they had a non-abortion related misoprostol or mifepristone prescription or outpatient claim. National Drug Codes (NDC) were used to identify misoprostol and mifepristone in prescription claims, while Healthcare Common Procedure Coding System (HCPCS) codes S0190 and S0191 were used to identify outpatient provision. International Classification of Diseases, Tenth Revision, Clinical Modification (ICD-10-CM) diagnosis codes and Current Procedural Terminology (CPT)/HCPCS procedure codes were used to classify conditions from outpatient claims within 90 days of a misoprostol or mifepristone claim date. We chose 90 days because misoprostol can often be prescribed a month or two before a procedure, especially prior to LARC insertions. Women with a misoprostol or mifepristone claim who had multiple diagnoses within this period were categorized according to a mutually exclusive hierarchy as follows: miscarriage, other pregnancy-related conditions, cervical ripening, other non-pregnancy-related conditions. If no diagnosis from one of these categories was found within 90 days of the drug claim, they were included in the unexplained category. A small group of women (1%) with a misoprostol prescription claim who did not have an outpatient claim within 90 days were also included in the unexplained category. To make MarketScan data representative of enrollment in employer-sponsored insurance health plans nationally, weights were applied to match counts in the Current Population Survey for enrollees and their dependents employed by firms of a thousand or more workers by sex, age and state.

Appendix

Codes Used to Identify Misoprostol and Mifepristone Provision and Associated Non-Abortion Related Diagnoses

Potential Impacts of Increased Immigration Enforcement on School Attendance and Funding

Published: Apr 3, 2025

Introduction

Immigrants and their children form a growing share of the U.S. population and, as of 2023, there were over 47 million immigrants residing in the country, accounting for 14% of the total population. Regardless of their countries of birth, about three in four (77%) immigrant adults say they moved to the U.S. for a better future for their children. Research shows that children of immigrants attain higher educational outcomes than the children of U.S.-born parent(s), play an outsized role in the U.S. health care workforce, and contribute more in taxes on average than the rest of the U.S.-born population. Actions being undertaken by the federal government to restrict immigration, including attempts to end birthright citizenship, rescission of protections from immigration enforcement in schools, and plans to carry out mass deportation, could negatively impact children living in immigrant families and have longer-term ramifications for the U.S. workforce and economy. Some states have also proposed actions to verify student immigration status in schools, which could further exacerbate fears and challenges among children in immigrant families.

Recent reports indicate that immigrant families are scared to send their children to school and that there have been declines in school attendance among children in immigrant families since President Trump took office. Declines in school participation and performance may not only negatively influence children’s educational outcomes and health but may also have impacts on school funding. This brief presents research on the impacts of immigration enforcement on children, including school attendance and performance; provides data on the share and number of school-aged children by state who live in immigrant families based on KFF analysis of the 2023 American Community Survey (ACS); and discusses potential implications of declines in school enrollment and/or attendance among these children on school funding. Key takeaways include:

  • Increased immigration enforcement can increase absenteeism and negatively impact academic outcomes and student health. Research shows that increased immigration enforcement in schools is associated with chronic absenteeism, drops in school enrollment, exacerbation of racial and/or ethnic disparities in student outcomes, and negative physical and mental health outcomes among children in immigrant families, who are predominantly U.S.-born. Negative impacts on education may also have consequences for children’s long-term health. Adults with higher educational attainment tend to have longer life spans and be healthier than their counterparts with lower educational attainment. High educational attainment also is associated with better jobs that are more likely to provide employer-sponsored health coverage and higher incomes which, in turn, improve access to health care and resources to support health.
  • Nationwide, about one in six (17%) or 9 million, school-aged children (5 to 17 years old) live in a household with at least one noncitizen adult, who could be impacted by immigration enforcement fears. This share increases to one in three (32%) school-aged children in California and about one in four in Texas (25%), New Jersey (24%), and Nevada (23%).
  • Increases in absenteeism or decreased enrollment arising from enhanced immigration enforcement activity could lead to decreases in school funding. Public schools in the U.S. are primarily funded through a combination of state and local funding. Each state has its own formula for funding school districts, but they all are directly or indirectly based on the number of students served by a school district as determined through student attendance or enrollment. Schools in states that use attendance-based models to determine student counts for school funding may be particularly affected by increases in absenteeism or decreases in enrollment due to immigration-related fears. These states include California and Texas, which are home to the largest shares of school-aged children living in immigrant families. While the overall decrease in funding may be relatively small, school districts that serve large shares of students from immigrant families may be more heavily impacted by funding cuts.
  • Schools may also face increased challenges addressing fears among children in immigrant families to prevent declines school performance and negative impacts on health. Some teachers and schools are working to mitigate negative impacts of increased immigration-related fears among families by preparing safety plans, establishing policies for dealing with ICE encounters, and providing families information about their legal rights.

Background

President Trump has increased immigration enforcement efforts, which have impacts across immigrant families, including the millions of U.S. citizen children living in them. These efforts include a slew of immigration policy changes focused on restricting both lawful and unlawful immigration into the U.S., increasing interior enforcement to support mass deportation, attempts to end birthright citizenship for the children of noncitizen immigrants, and rescinding protections against enforcement action in previously protected areas such as schools and health care facilities. KFF analysis shows that one in four, or 19 million, children in the U.S. have an immigrant parent, and the vast majority of these children are U.S. citizens. About one in ten (12%) children in the U.S. are citizen children with a noncitizen parent. Other analysis estimates that about 4.4 million U.S.-born children live with an undocumented immigrant parent.

Research shows that enhanced immigration enforcement actions have a wide array of impacts on children, including on school attendance and performance and mental and physical health. Specifically, research shows that increased immigration enforcement can lead to chronic absenteeism, drops in school enrollment (including among U.S.-born students), as well as increases in students’ moving out of school districts with high enforcement. Further, increased immigration enforcement is associated with “declines in academic achievement”, an exacerbation of racial and ethnic gaps in educational outcomes, feelings of lack of safety in schools, and negative mental and physical health outcomes among children of immigrants. Negative impacts on education may also have consequences for children’s long-term health. Adults with higher educational attainment tend to have longer life spans and be healthier than their counterparts with lower educational attainment. High educational attainment also is associated with better jobs that are more likely to provide employer-sponsored health coverage and higher incomes which, in turn, improve access to health care and resources to support health.

Recent reports indicate that immigrant families are scared to send their children to school and that there have been declines in school attendance among children in immigrant families since President Trump took office. Schools, which were historically considered to be “safe” spaces, are now within the purview of immigration enforcement following the Trump administration rescinding protections against enforcement action there. Recent reports suggest declines in school attendance due to immigration-related fears. In the Boston-area, reports suggest that over 1,000 students did not show up to school following news of Immigration and Customs Enforcement (ICE) activity nearby, similar to Fresno, where attendance dropped by around 1,000 per day following President Trump’s inauguration. In Chicago, one educator serving immigrant families noted a nearly 50% drop in school attendance in the days immediately following President Trump’s inauguration. In some cases, there have been reports of school officials sharing information with parents about potential ICE encounters on school property which later turned out to be false. In response to growing fears among immigrant families, a number of teachers and schools are working to prepare safety plans, establishing policies for dealing with ICE encounters, and providing families information about their legal rights.

Fears and attendance declines among children in immigrant families may be exacerbated by other state-level actions. For example, Tennessee is in the process of advancing a bill “that would require public K-12 and charter schools to verify student immigration status and… bar children who cannot prove they lawfully reside in the United States unless they pay tuition.” Oklahoma also has proposed a rule that would require parents or legal guardians to provide proof of citizenship and/or immigration status for children enrolled in the state’s public schools. While Oklahoma’s proposed rule does not explicitly bar enrollment for students who may be undocumented, it is likely to cause fear among immigrant families about their immigration status being recorded and may lead to drops in student enrollment due to chilling effects. Similar bills have also been proposed by lawmakers in Texas, Indiana, and New Jersey, but it is unclear if there is a clear pathway to passage for such legislation.

Findings

This analysis uses 2023 ACS data to identify school-aged children living in a household with a noncitizen adult who could be impacted by immigration-related fears overall and by state. Additionally, it provides an overview of state school funding models based on data from the Education Commission of the States to give insight into where schools may be at particular risk for decreased funding due to declines in school attendance or enrollment.

Nationwide, about one in six (17%), or 9 million, school-aged children (5 to 17 years) live in a household with at least one noncitizen adult, who could be impacted by immigration enforcement fears. This share rises to nearly one in three (32%) or 2 million school-aged children in California and about one in four school-aged children in Texas (25%), New Jersey (24%) and Nevada (23%) (Figure 1 and Appendix Table 1). By region, the West has the highest share (24%) of school-aged children in a household with at least one noncitizen adult, followed by about one in six school-aged children in the Northeast (17%) and the South (16%); and about one in ten school-aged children in the Midwest (9%). As noted, five states (Indiana, New Jersey, Oklahoma, Tennessee, and Texas) have introduced bills to verify student immigration status. Over 2 million school-aged children in these states live with at least one noncitizen adult in the household, including about one in four school-aged children in Texas (25%) and New Jersey (24%), and about one in ten in Oklahoma (11%), Tennessee (10%), and Indiana (9%).

One in Six, or About 9 Million, School-Age Children in the U.S. Live with a Noncitizen Adult

All state school funding models are directly or indirectly tied to the number of students served by a school district. Most (35) states plus DC fund schools on a per student basis (Figure 2). In these states “districts receive a base amount of funding per student.” Nine states use a resource-based funding model, in which districts receive funds based on the resources they anticipate needing (such as teachers and supplies) depending on how many and what types of students the school districts serve. Four states use hybrid models that combine aspects of student- and resource-based funding, and two states use a guaranteed tax base model that allows districts to determine per student spending on a state-guaranteed tax base.

Most States Fund Schools on a Per Student Basis

States employ a variety of methods to determine a district level student count for their funding models, including attendance averages, single or multiple student counts, or enrollment averages. To determine the student count that goes into funding models, six states use the average daily attendance in school districts over a year, also known as an attendance average; 20 states plus DC use student enrollment or attendance from a single day or multiple days, also known as single or multiple counts; and 24 states use the average daily enrollment in school districts over a year (or over a 20-day period in the fall in Alaska), also known as enrollment average (Figure 3). Districts in states that base student counts on attendance are more likely to have their school funding negatively impacted by short-term absenteeism among children in immigrant families due to increased immigration enforcement. These states include California and Texas, which are home to the largest shares of school-aged children in households with a noncitizen adult. Districts in states that base student counts on enrollment could also be impacted if, over the longer-term, immigrant families disenroll their children from school or move out of school districts due to immigration-related fears. While the overall decrease in funding may be relatively small, school districts that serve large shares of students from immigrant families may be more heavily impacted by funding cuts.

States Use Attendance or Enrollment Counts to Determine Student Counts for School Funding

Appendix

Share and Number of School-Aged Children in Immigrant Families and School Funding and Student Count Models by State

What Role Do Immigrants Play in The Direct Long-Term Care Workforce?

Published: Apr 2, 2025

Introduction

President Trump has made a slew of immigration policy changes focused on restricting entry at the border and increasing interior enforcement efforts to support mass deportation. While these actions are focused on undocumented immigrants, they likely will have ripple effects across immigrants of all statuses and millions more people living in immigrant families.

Mass deportations could negatively impact the U.S. economy and workforce, given the role immigrants play, particularly in certain industries. Deportation of immigrants may exacerbate health care workforce shortages as immigrants and their adult children play outsized roles in the health care workforce. To increase understanding of how shifting immigration policies may affect the direct care workforce providing long-term care services, this data note uses the 2023 American Community Survey (ACS) to provide an overview of the role that immigrants play in the direct care workforce for long-term care (LTC) services (see Methods). Key takeaways include:

  • Immigrants make up 28% of the overall direct care workforce for LTC services. As of 2023, there were over 820,000 immigrants working as direct care workers providing long-term care in the U.S. (including over 500,000 naturalized citizens and over 300,000 noncitizen immigrants).
  • Immigrants play a particularly large role in the home care workforce, making up one in three workers (32%) in home care settings. They also make up 21% of workers in nursing facilities and 24% of workers in residential care settings.
  • Immigrants have made up an increasing share of the direct care LTC workforce over time. The share of direct care workers providing LTC services who are immigrants increased from 24% in 2018 to 28% in 2023.

Together the data show that immigrants comprise a large and growing role of the direct care workforce providing LTC services, particularly in home care settings. Restrictions on immigration and mass deportations could lead to reductions in immigrants available to fill these roles, which would exacerbate workforce shortages, making it harder for people to find caregivers for themselves and their loved ones.

Background

Direct care workers play a pivotal role in providing long-term care services in both home care and institutional care settings. Direct care workers provide a broad range of paid and unpaid medical and personal care services that assist with activities of daily living (such as eating, bathing, and dressing) and instrumental activities of daily living (such as preparing meals, managing medication, and housekeeping). More than 6 million people use paid LTC delivered in home care settings and more than 2 million people use LTC delivered in institutional settings, according to CBO estimates. This workforce performs demanding, high-stress work for low wages and often no benefits.

Prior research shows that immigrants help fill workforce shortages in the direct care LTC workforce and contribute to improvements in care. There is historic demand for long-term care services, with particularly high demand for workers who can help people age at home. One study found that communities that have increased immigration have a greater share of adults that are able to age in place. Other research finds that the home care workforce is declining relative to the number of adults needing these services. Analysis of the Secure Communities immigration enforcement program found that the program reduced direct care staff hours, suggesting that stringent immigrant enforcement exacerbates health care worker and direct care worker shortages in the U.S. Research also finds that immigration increases the local supply of workers in nursing fields, with the largest effect on the number of nurse aides. Similarly, increased immigration significantly raises the staffing levels of nursing homes in the U.S., particularly in full time positions.

Immigrants also provide culturally competent care to an increasingly diverse population of older adults. In particular, some older adults may feel more comfortable with direct care workers who share or understand their language, race, ethnicity, or other cultural characteristics. A KFF focus group of family caregivers noted that a challenge to finding paid care was a language barrier. One caregiver described the difficulty of finding culturally competent care because her father only spoke Spanish.

Key Findings

Using 2023 ACS data, this analysis identifies immigrants as a share of the direct care workforce providing LTC, how this share varies by setting, and how this share changes over time. The direct care workforce includes aides (home health aides, personal care aides, and nursing assistants) and nurses (licensed practical nurses and registered nurses). We define the direct care workforce as all individuals 18 and older who earned at least $1,000 during the year and indicated that their job was in both the long-term care industry and their occupation fell under the category of either aide or nurse (see Methods for more details). The ACS does not include unpaid LTC caregivers, such as relatives and friends, who provide the majority of home-based long-term care in the U.S.

Immigrants make up 28% of the overall direct care workforce providing LTC services, higher than the share of all adult workers in the U.S. who are immigrants (17%) (Figure 1). This includes 17% who are naturalized citizens and 11% who are noncitizen immigrants. Immigrants make up a higher share of aides (30%) than nurses (20%). The large majority of immigrants in nursing roles are naturalized citizens. Most immigrants working as aides also are naturalized citizens, although there is a more mixed distribution of naturalized citizens and noncitizen immigrants. Aides provide hands-on assistance to older adults and people with disabilities and include home health aides, personal care aides, and nursing assistants.

Immigrants Make Up 28% of the Overall Direct Long-Term Care Workforce

Immigrants play a particularly large role in the home care workforce, making up one in three workers (32%) in home care settings (Figure 2). Immigrants make up 21% of workers in nursing facilities and 24% of workers in residential care settings. The share of workers that are immigrants is highest in home care settings when compared to other settings because aides (who are more likely to be immigrants when compared to other direct care workers) make up the majority of workers in home care settings. Reflecting this pattern, noncitizen immigrants make up a larger share of immigrants working in home care settings compared to nursing facilities and residential care settings.

Nearly One-Third of Direct Long-Term Care Workers In Home Care Settings Are Immigrants

Immigrants make up a growing share of the direct care workforce, increasing from 24% of direct care workers in 2018 to 28% in 2023 (Figure 3). This growth reflects increases in the share of workers who are naturalized citizens; the share who are noncitizen immigrants remained relatively stable during this time period. Immigrants’ role in the direct care workforce grew in both home care and residential care facilities. The share of the total direct care workforce who are immigrants increased from 28% to 32% in home care and from 19% to 24% in residential care facilities between 2018 and 2023 (data not shown). The share of the direct care workforce who are immigrants has remained relatively stable over time in nursing facilities (data not shown).

The Share of Direct Long-Term Care Workers Who Are Immigrants Has Increased Over Time

Methods

Data: These findings are based on KFF analysis of the 2018-2023 American Community Survey (ACS) 1-year Public Use Microdata Sample (PUMS) files. The ACS includes a 1% sample of the U.S. population, and the subset of direct care workers used here includes an average of 27,840 observations for each year included (ranging from 26,947 to 29,094). 2020 data are excluded from Figure 3 because the ACS experienced significant disruptions to data collection brought on by the coronavirus pandemic.

Identifying Direct Care Workers in ACS: Direct care workers are those who fall into the following occupation codes: Registered nurses (3255); Licensed practical and licensed vocational nurses (3500); Home health aides (3601); Personal care aides (3602); and Nursing assistants (3603). Registered nurses and licensed practical and vocational nurses are collapsed into “nurses” for this analysis. Home health aides, personal care aides, and nursing assistants are collapsed into “Aides” in this analysis. This analysis only includes those who work in the following industries: Home Health Care (8170), Nursing Care Facilities (8270), Residential Care Facilities (8290), and Individual and Family Services (8370). Home health care and individual and family services are collapsed into “Home care” for this analysis.

We define the direct care workforce as all individuals 18 and older who earned at least $1,000 during the year and indicated that their job was in both the long-term care industry and occupation codes listed above. The comparison group “All Adult Workers in the U.S.” in Figures 1 and 2 includes all individuals 18 and older who earned at least $1000 during the year.

The ACS does not include unpaid LTC caregivers, such as relatives and friends, who actually provide the majority of home-based long-term care in the U.S.

Identifying Immigrants in ACS: Immigrants are identified as those who report their citizenship status (variable name: CIT) in ACS as being a “U.S. citizen by naturalization” or as “not a citizen of the U.S.”, with the former being grouped under “naturalized citizens” and the latter being grouped under “noncitizen immigrants” for the purpose of this analysis.

The USAID List of Terminated Global Health Awards – What Does it Tell Us?

Author: Jennifer Kates
Published: Apr 2, 2025

It was recently reported that a list was sent to Congress of awards to be terminated at USAID, an agency already effectively shuttered as part of the administration’s foreign aid review and funding freeze. The list generally confirms what has been in administration court filings and other announcements – that most awards at the agency are slated to be terminated. Specifically, it indicates that of more than 6,200 awards, 5,341 or 86% will be terminated, representing $27.7 billion in unobligated funds. Of this, $7.4 billion in unobligated funds falls directly under USAID’s global health bureau and billions more are for global health activities funded through other bureaus or at the individual country mission level. While the situation does appear to be fluid, with Congress having yet to weigh in and with litigation ongoing, the list does raise several questions:

  • Despite a waiver continuing “life-saving humanitarian assistance,” including core life-saving medicine and medical services, several such projects are on the USAID terminated list. Shortly after the foreign aid review and funding freeze were initiated, putting a stop to most bilateral foreign assistance activities, Secretary of State Rubio issued an emergency waiver stating that “Implementers of existing life-saving humanitarian assistance programs should continue or resume work if they have stopped.” This was followed by specific waivers for some PEPFAR services and a subset of other health services. Despite these waivers, however, several projects that seem to meet the definition of life-saving as indicated in the waiver language and are interventions that have been shown to reduce morbidity and mortality, are on the terminated list. These include, for example, efforts to strengthen and deliver malaria diagnosis and treatment services as part of the President’s Malaria Initiative (PMI) in Cambodia, Ethiopia, and The Gambia and TB projects focused on diagnosis and treatment in Nigeria and South Africa. Also on the terminated list is a contract for Gavi, the vaccine alliance, an international public-private partnership that provides routine vaccines to more than half of the world’s children helping to avert almost 19 million childhood deaths.
  • Several awards on the terminated list are already spent in full. According to the list, there are several awards for which all funding has already been obligated and, per USASPENDING, the government’s funding database, fully spent. In global health, for example, these include funding for COVAX, the COVID-19 vaccine mechanism that was housed at Gavi (all funding was already disbursed in 2021), an award for CEPI, the Coalition for Epidemic Preparedness Innovations, and an award for the Pandemic Fund (housed at the World Bank). These may be on the list because their awards are technically still open.
  • Other awards on the terminated list appear to be for broader contract arrangements, listing outstanding obligations for funding that has yet to be appropriated by Congress. This appears to be the case for Gavi, for example, which is listed as having $1.7 billion in unspent obligations through 2030. However, of this, only $300 million has been appropriated by Congress (for FY 2025) and the remaining amount appears to be a projection of future funding. This also seems to be the case for polio and immunization funding at the World Health Organization (WHO), for which $781 million is listed as unobligated but is likely an estimate of future appropriations.
  • The list confirms other reports and administration statements about what is not being supported, including several projects related to HIV prevention and interventions for key populations, family planning projects, and support for WHO. This includes, for example, a project in Zambia focused on voluntary medical male circumcision to reduce the risk of HIV, one in Malawi focused on preventing new HIV infections among men and women including adolescent boys and young men, and one in Namibia focused HIV prevention and treatment among key populations; family planning projects in Ghana, Kenya, and Zimbabwe; and projects that sought to integrate family planning with maternal health and others services in several countries. Support for WHO is also on the terminated list.
  • There are many awards on the terminated list that worked to strengthen host country government, civil society, and private sector capacity to deliver services. While these awards are not directly life-saving, they are designed to support country ownership and sustainability, to help reduce the reliance on the U.S. government, such as an HIV project in Uganda and a malaria project in Uganda. As such, canceling these projects could set back such efforts.
  • Finally, it is unclear if this list is final, or just the most recent one circulating. There have been at least three other lists circulating thus far with different sets of terminated awards. Given that this list is reported to have just gone to Congress, it is possible some negotiation may still be underway. In particular, while the administration typically has the authority to choose which specific implementing organizations it will work with, in global health, Congress provides agencies with specific funding instructions including amounts for different program areas (e.g., HIV, TB, malaria, maternal health and others) and for certain international institutions (e.g., The Global Fund to Fight AIDS, Tuberculosis and Malaria, Gavi). As such, Congress may evaluate the list of terminations against these directives. Indeed, the FY 2025 funding bill that was just signed into law requires the administration to report to Congress within 45 days regarding its spending plans for foreign assistance.
News Release

ACA Marketplace Enrollment Has More Than Doubled Since 2020, with the Fastest Growth Occurring in States Won by President Trump in 2024

Published: Apr 2, 2025

Enrollment in Affordable Care Act (ACA) Marketplace health plans reached a record 24.3 million people, more than double the total in 2020, with most of the growth occurring in states won by President Trump in the 2024 election, a new KFF analysis finds. 

Almost all states have seen increases in enrollment since 2020, including six states where enrollment has more than tripled: Texas (up 255%), Mississippi (up 242%), West Virginia (up 234%), Louisiana (up 234%), Georgia (up 227%), and Tennessee (up 221%). Only New York (down 19%), Oregon (down 4%) and the District of Columbia (down 3%) experienced enrollment declines over the past five years.

The growth in enrollment since 2020 has been concentrated in states that President Trump carried in the 2024 election. Those 31 states accounted for 88% of the increase in enrollment during the past five years. Put another way, since 2020, enrollment grew by an average of 157% in states carried by President Trump but only 36% in states carried by former Vice President Harris. 

Much of the enrollment growth stems from the enhanced premium aid first made available in 2021 that helped to make Marketplace coverage more affordable for many people. The extra assistance is set to expire at the end of this year unless Congress acts to extend it. 

Enrollment Growth in the ACA Marketplaces

Published: Apr 2, 2025

ACA Marketplace enrollment has reached a record-high for a fourth year in a row, totaling 24.3 million people in 2025. Much of this growth can be attributed to the enhanced subsidies first made available by the American Rescue Plan Act (ARPA) in 2021 and later extended through the end of 2025 by the Inflation Reduction Act (IRA). Since 2020, enrollment in the Marketplaces has more than doubled, growing by 12.9M (a 113% increase) from 11.4M to 24.3M.

ACA Marketplace Enrollment Hits Another Record High During 2025 Open Enrollment Period

Where Have ACA Marketplaces Grown the Most?

Almost all states have seen increases in enrollment, but some have seen more growth than others. Enrollment has more than tripled in Texas (255% growth), Mississippi (242%), West Virginia (234%), Louisiana (234%), Georgia (227%), and Tennessee (221%). In total, 20 states since 2020 have seen their Marketplaces more than double.

A few states (New York, Oregon, and the District of Columbia) saw their Marketplaces shrink since 2020. These states are unusual because they have expanded programs (e.g. Basic Health Plan, high Medicaid eligibility). Low-income enrollees who would typically be part of the ACA Marketplace instead receive coverage from one of these expanded programs.

Affordable Care Act (ACA) Marketplace Enrollment More than Doubled in 20 States from 2020 to 2025

As of 2025, 88% of the total growth in the Marketplaces since 2020 (11.4M out of 12.9M new enrollees) is from states President Trump won during the 2024 election. On average, states that voted for President Trump have seen Marketplace enrollment grow by 157% while states that voted for former Vice President Harris saw a 36% increase in Marketplace enrollment.

Affordable Care Act Marketplaces Have Grown Faster Since 2020 in States Won by President Trump in 2024

The top 15 states with the most growth in the ACA Marketplace since 2020 were all won by President Trump in 2024. An earlier KFF analysis showed that states that had not expanded Medicaid and those that started off with high uninsured rates saw the most growth in ACA Marketplace enrollment. In states that currently have not expanded Medicaid, Marketplace enrollment has grown 188% from 2020 to 2025 compared to 65% growth in expansion states. In states where uninsured rates for children and adults under 65 were at least 10% in 2019, ACA Marketplace enrollment increased by 168% since 2020, whereas states with lower uninsured rates saw enrollment grow by 50%.

What is Next for the Enhanced Premium Tax Credits?

Enhanced tax credits, which have fueled much of the growth in the Marketplaces, are set to expire at the end of this year unless Congress votes to extend them. The enhanced tax credits have increased the affordability of coverage and newly extended financial assistance to middle-income enrollees making above 400% of poverty. Had it not been for the enhanced subsidies, annual premium payments for subsidized enrollees in 2024 would have been $705 (79%) higher, on average, up from $888 to $1,593.

The CBO estimates that the cost of permanently extending the enhanced subsidies would be $335 billion over a 10 year period. If the enhanced subsidies are not renewed, it is expected that 3.8 million more people would become uninsured. Additionally, CBO projects that the loss of enhanced subsidies would prompt healthy enrollees to leave the ACA Marketplace and, consequently, insurers to increase the sticker price of premiums.

Since 2020, the ACA Marketplace Has More Than Doubled in Size

Medicaid and CHIP Eligibility, Enrollment, and Renewal Policies as States Resume Routine Operations

Following the Unwinding of the Pandemic-Era Continuous Enrollment Provision

Authors: Tricia Brooks, Jennifer Tolbert, Anna Mudumala, Amaya Diana, Allexa Gardner, Aubrianna Osorio, and Shoshi Preuss
Published: Apr 1, 2025

Executive Summary

In 2024, almost all states completed renewals for the 94 million individuals who were enrolled in Medicaid following the pandemic-era three-year pause on disenrollments that was lifted on March 31, 2023. By October 2024, based on the most recent Centers for Medicare and Medicaid Services (CMS) enrollment data, the process known as unwinding had resulted in a net decline in Medicaid and CHIP enrollment of 15 million individuals, including about five million children, but enrollment remained above pre-pandemic levels.

The focus on Medicaid renewal processes during the unwinding revealed their complexity. With states facing an unprecedented volume of work and eligibility worker shortages, CMS provided new options to streamline enrollment and renewal processes, emphasizing automation and the use of reliable data sources to increase accuracy and efficiency. States broadly adopted these strategies, and many emerged from the unwinding with more efficient processes by maximizing the use of technology to verify income, reduce returned mail, and improve communications with enrollees. However, some states continue to struggle with older systems that limit the adoption and effectiveness of some of the new strategies.

Medicaid agencies are now turning their attention to ensuring that state policy aligns with existing and new federal requirements. At the same time, there is significant uncertainty about how potential changes to federal Medicaid financing and policy under consideration by Congress and the Administration will impact states and Medicaid enrollees in the future. Congress is debating cuts to Medicaid of up to $880 billion or more over ten years, citing a desire to curtail spending to help pay for tax cuts and address “fraud, waste, and abuse”. While several proposals would fundamentally restructure who is covered by the program and how it is financed, repeal of regulations finalized in the last administration, including the Eligibility & Enrollment (E&E) rule finalized in April 2024, are also under consideration. The E&E rule included provisions to streamline and enhance the administrative efficiency of Medicaid eligibility and enrollment processes and to make it easier for eligible individuals to retain coverage. The rule also clarified documentation and recordkeeping requirements, providing the first update to these requirements since 1986, to reduce payment errors based on insufficient documentation. By eliminating some barriers to enrollment and reducing churn among people who are eligible but lose coverage for paperwork reasons, the rule is expected to increase Medicaid and CHIP enrollment (CMS projected enrollment would increase by 1.5 million in 2028.) The Congressional Budget Office estimated that rescinding this rule along with a related rule that reduces barriers to enrollment among people eligible for Medicare Savings Plan (MSP) coverage would reduce federal Medicaid spending by $164 billion over ten years.

The 23rd annual survey of state Medicaid and CHIP program officials conducted by KFF and the Georgetown University Center for Children and Families provides a baseline of state Medicaid and CHIP eligibility, enrollment, and renewal policies in place as of January 2025 as states return to routine operations following the unwinding. The report focuses on policies for children, pregnant individuals, parents, and other non-elderly adults whose eligibility is based on Modified Adjusted Gross Income (MAGI) financial eligibility rules. Overall, 49 states and the District of Columbia responded to the survey, although response rates for specific questions varied (Florida did not respond). For the purposes of this report, the District of Columbia is counted as a state.

Key Takeaways

  • Building on strategies adopted during the unwinding, most states are continuing to implement policies to increase ex parte, or administrative, renewal rates. During the unwinding period, states employed new approaches to using data and automation to streamline processes for verifying eligibility. Over two-thirds of states plan to continue or newly adopt at least one strategy to facilitate ex parte renewals. While 29 states report that over half of ex parte renewal rates are conducted automatically by their systems, the share of eligibility determinations at application that are automated and conducted in real-time (within 24 hours) lag. Close to half of states say they cannot conduct automated real-time eligibility determinations on new applications or report that less than 10% of these eligibility determinations are automated.
  • States increasingly rely on data from trusted sources to automate manual tasks and improve accuracy of Medicaid eligibility, enrollment, and renewal processes. By advancing the use of information from other programs such as SNAP and TANF, states have improved the accuracy of income verification while reducing administrative burden associated with mailing renewal forms and manually processing information submitted by mail or phone. At the same time, periodic checks of income data sources coupled with limited time for enrollees to respond to information requests can increase procedural disenrollments and churn.
  • States have incorporated new strategies for updating contact information and communicating with enrollees into routine operations, and some are using artificial intelligence (AI) to assist with the application and renewal processes. Access to the US Postal Service National Change of Address (NCOA) Database and other program data allows states to routinely update mailing addresses, tackling the longstanding problem of returned mail. Nearly all states proactively check available data sources for updated contact information or accept updated addresses from managed care plans or providers. To increase renewal response rates, states contact enrollees multiple times before and after sending renewal notices using multiple modes including email and text. States have also enhanced online tools–online accounts and mobile apps–to provide additional ways to communicate with enrollees and to give enrollees the ability to more easily manage their coverage. A few states use AI to answer consumer questions at different points during the application or renewal process, and a small number have begun using AI to assist with reviewing applications and renewals.
  • Continuing a trend over the past few years, two states increased income eligibility for pregnancy coverage. Alaska and Washington state expanded income eligibility for pregnancy and Colorado adopted the From Conception to the End of Pregnancy coverage option in CHIP. Since 2023, five states (Alaska, Nevada, North Dakota, Tennessee, and Washington) have increased pregnancy eligibility levels, but one state (Iowa) is seeking approval to reduce pregnancy income eligibility. The median eligibility level for children (255%) is the highest of all MAGI groups. Eligibility levels for all MAGI groups are lower in non-expansion states compared to expansion states.
  • States have taken steps to remove administrative barriers to enrollment and renewal for children and seniors and people with disabilities (non-MAGI groups). Almost all states with separate CHIP programs have eliminated required periods of uninsurance (waiting periods) and lock-out periods following nonpayment of premiums, both of which contribute to gaps in coverage. The E&E rule requires states to phase out waiting and lock-out periods by June 2025. Two states (Utah and Delaware) permanently eliminated CHIP premiums in 2024, and premiums remain temporarily or indefinitely suspended in Arizona and Vermont while Georgia reinstated CHIP premiums after pausing them during the COVID pandemic. All states have taken steps to align non-MAGI renewal rules with those in place for MAGI groups such as conducting annual renewals, eliminating in-person interviews, and giving enrollees more time than 10 days to respond to requests for information. The E&E rule requires states to align non-MAGI renewal policies by June 2027.

Report

Post-Unwinding and Resuming Routine Operations

Renewal Policies

Over half of states report that 50% or more of ex parte renewals are processed automatically by the eligibility system, but only a quarter of states report that 50% or more of eligibility determinations at application are automated. By adopting more efficient processes relying on technology and data from trusted sources, states can automate manual tasks, reduce administrative costs, and improve accuracy. During the unwinding period, ex parte renewal rates increased as states made systems improvements to enhance automation of renewal processes. However, not all ex parte renewals can be processed automatically by the system, and for those ex parte renewals that are not automated, workers manually check data sources to confirm ongoing eligibility. Nearly all states (45) report that 10% or more of ex parte renewals are processed automatically by the eligibility system and over half (29 states) report that processing of more than 50% of ex parte renewals is automated (Figure 1). However, automation of eligibility determinations at application lags automation of ex parte renewals. Thirteen states lack the ability to automatically process eligibility determinations at application in real-time and eight states report that less than 10% of applications are processed by the system without worker intervention. Some states that rely on the FFM to determine eligibility are able to process enrollment in real time since the FFM has already determined eligibility.

Share of Ex Parte Renewals That Are Automated, January 2025

Most states are continuing or newly adopting automated processes for verifying income and taking other steps to increase ex parte renewals. All states must verify income eligibility for Medicaid and CHIP. During the unwinding, states facing system and operational challenges had the option to seek authority under section 1902(e)(14)(A) of the Social Security Act (the Act) to try new approaches to use data to confirm income eligibility. Several of those strategies proved to be effective in increasing state ex parte renewal rates and were made permanently available as state plan options. Over two-thirds of states (34) are continuing or newly adopting one of the new state plan options (Figure 2). In addition, over two-thirds of states are taking other steps to increase ex parte rates; refining system programming (24 states) and expanding data sources (18 states) are the top two strategies.

Adoption or Continuation of Policies Allowed As 1902(e)(14)(A) Waivers, January 2025

States are doing more to communicate with enrollees during the renewal process. States increased their communication touch points with enrollees during the unwinding period and many have kept that increased communication in place as they return to routine operations. For enrollees whose ongoing eligibility cannot be verified via ex parte processes, 20 states send an advance notice to alert enrollees to an upcoming renewal and 42 states remind enrollees before the end of the renewal period to complete their renewal (Figure 3). They are using multiple ways of reaching enrollees, including relying on cost-effective and timely email and text messages.

States are also taking steps to help eligible individuals regain coverage following procedural disenrollments. States are required to provide a 90-day reconsideration period when an enrollee has been procedurally disenrolled, or disenrolled because they did not complete the renewal process and not because they were determined ineligible. During this reconsideration period, eligible individuals may submit renewal information for redetermination without completing a new application. Half of states (25) include information about the 90-day reconsideration period in termination notices and 12 states provide lists of members who have been procedurally disenrolled to MCOs so they can follow up with those individuals (Figure 3). When an enrollee is determined eligible during the reconsideration period, 31 states reinstate coverage back to the termination date while 12 states reinstate coverage to the first day of the month in which information is received.

States Using Alerts, Reminders, and Strategies to Help Individuals Maintain/Regain Coverage, January 2025

Most state eligibility systems automatically close cases on or shortly after the renewal date. Auto-closures are used by states to automate the disenrollment process for enrollees whose renewal or other missing information has not been received by the end of the renewal period. Over half of states (28) close the case on the eligibility end date, while auto-closures occur shortly after the end date in 15 states (Figure 4). In the remaining six states, workers must manually close cases. Auto-closures avoid keeping a case open past the end of an eligibility period and prevent unnecessary capitation payments in MCO states. However, if states experience delays in processing documents received by mail or fax or uploaded through online accounts and mobile apps, enrollees can be disenrolled despite submitting required documents on time. To avoid unnecessary terminations, 33 of the 43 states that automatically close cases have implemented routine processes to flag the receipt of documents through one or more modes and exclude those cases from an auto-closure.

State Use and Timing of Automatic Case Closures, January 2025

States are expediting alignment of renewal policies for seniors and people with disabilities (non-MAGI groups) with those in place across MAGI groups. No reporting state requires in-person interviews; most states allow at least 30 days for all enrollees to respond to renewal requests (48 states) and provide a 90-day reconsideration period for both MAGI and non-MAGI enrollees (47 states). However, only 38 states send a pre-populated renewal form to non-MAGI enrollees (Figure 5). Aligning processes not only removes barriers to enrollment for seniors and people with disabilities but also makes it easier to program eligibility systems, train workers, and explain the rules to applicants and enrollees. The E&E rule requires states to align these policies by June 2027.

States Aligning Renewal Policies for Non-MAGI and MAGI Populations, January 2025

Streamlining Enrollment and Renewal Processes in Medicaid and CHIP Final Rule: Select Provisions, Implementation Dates, and Number of States Already in Compliance

On April 2, 2024, the CMS published the second part of a two-part final E&E rule that simplifies the eligibility and enrollment processes for Medicaid, the Children’s Health Insurance Program (CHIP), and the Basic Health Program (BHP). The rule streamlines application and enrollment processes, aligns renewal policies for all Medicaid enrollees, facilitates transitions between programs, and eliminates certain barriers in CHIP. Deadlines for states to implement vary across provisions, but many states are already in compliance with certain provisions.

In the table below, select provisions in the final rule include those for which there was a question on the survey that provided information on state policies.

Streamlining Enrollment and Renewal Processes
in Medicaid and CHIP Final Rule: Selected Provisions and Implementation Dates

Updating Contact information and handling returned mail

During the unwinding, states implemented new processes to update mailing addresses, reducing the cost and administrative burden of handling returned mail. Returned mail has been a longstanding and costly problem in Medicaid. States offer multiple ways for enrollees to update their contact information, including through their online account (45 states) or mobile app (11 states), through a simple online change of address form (27 states), and/or by calling a dedicated phone number or option on the state’s interactive voice response system (13 states). States also proactively conduct data matches with the USPS National Change of Address (NCOA) database (27 states) and accept updates to mailing addresses from reliable sources (40 states), including managed care organizations and navigators/assisters (Figure 6). The final E&E rule requires states to accept and act on address updates provided by specific reliable sources by December 2025.

States with Actions to Proactively Update Addresses, January 2025

Nearly all states follow up on returned mail by checking available data sources or attempting to contact the enrollee, continuing strategies deployed during the unwinding. One third of states (17) check the USPS NCOA database and 35 states check SNAP/TANF for updated contact information when mail is returned, and all but two reporting states (47) attempt to reach the enrollee by phone, email, or text (Figure 6). The final E&E rule requires states, by December 2025, to make a good faith effort to contact enrollees using different communication modes when mail is returned without an in-state forwarding address. Mail returned with an in-state forwarding order is considered a reliable source that does not require redundant verification and can be automatically updated.

Changes in Circumstances

As they return to routine operations, most states use information from SNAP and TANF and/or periodically check other data sources to identify and act on potential changes in eligibility between renewals. States are required to follow up on reported changes that potentially affect eligibility and give individuals an opportunity to respond before taking adverse action. Over two-thirds (35) of states use verified information from SNAP or TANF to identify changes that may affect Medicaid eligibility (Figure 7). Fifteen states periodically check other external data sources, including quarterly wage and unemployment data, and 11 states do both. If information from the other programs confirms ongoing eligibility, 19 states extend the renewal date by 12 months; four states do the same if external income data sources confirm ongoing eligibility. When documentation from the enrollees is required to avoid termination, 14 states give enrollees only 10 days to respond. Periodic data checks and insufficient response times can exacerbate churn particularly given regular mail disruptions and delays.

Use of Verified Data for Routine Income Checks, January 2025

(Back to top)

Systems and Online Tools

The 49 reporting states operate a total of 64 eligibility systems. While 35 states operate a single eligibility system, 13 states operate two systems, and one state operates three systems. Over two-thirds of state systems (44 of 64) are at least ten years old.

Over half of states that operate their own Marketplace eligibility systems (11 of 20 SBM states) have integrated eligibility for MAGI Medicaid into their SBM systems (Figure 8). The remaining nine SBM states as well as the two SBM states that use the Federally-facilitated Marketplace (FFM) have separate eligibility systems for determining eligibility for MAGI Medicaid and CHIP. Of the 29 reporting states that rely on the Federally-facilitated Marketplace (FFM) for all marketplace functions, 9 allow the FFM to determine Medicaid eligibility while the FFM assesses eligibility in 20 states.

Integration of Marketplace and MAGI-Medicaid/CHIP Eligibility Systems in States With a State-Based Marketplace (SBM), January 2025

Many states have integrated Medicaid systems that determine eligibility for both MAGI Medicaid and CHIP and non-MAGI Medicaid as well as non-health programs including SNAP, TANF and childcare subsidies. Of the 38 reporting states that have Medicaid eligibility systems that are not integrated with the SBM, 34 have systems that also determine eligibility for non-MAGI Medicaid; 24 states have integrated SNAP and TANF eligibility; and 13 states have systems that also determine eligibility for child care subsidies (Figure 9).

Non-Marketplace Integrated States That Have Integrated Non-MAGI Medicaid, CHIP, and Non-Health Programs Into the System That Determines MAGI-Medicaid Eligibility, January 2025

States have developed online tools, including multi-benefit applications, online accounts, and mobile apps to make it easier for people to apply for, renew, and manage their Medicaid coverage. All states have an online application, and most states have multi-benefit applications that incorporate non-MAGI Medicaid (40 states), SNAP (31 states); TANF (29 states); and childcare subsidy (18 states). Medicaid applications in 15 states allow individuals to apply for premium tax credits, all are SBM states. With one exception, all reporting states have an online account that enables people to apply for or renew their coverage, report changes in circumstances, view notices, or upload verification documents. Eight states have also created mobile apps through which people can submit a MAGI-based Medicaid application. These mobile apps also include many of the same features for managing Medicaid coverage as online accounts but are specifically designed to function well on smartphones and tablets. An additional six states report having a mobile app that allows users to manage their coverage but does not include application functionality (Figure 10).

States with Multi-Benefit Online Medicaid Applications, January 2025

States vary in their approaches to online account security and resetting passwords. Over half the states (29) require identity verification to set up an online account while 30 states use multi-factor authentication for one or more actions. Multi-factor authentication is required to set up the account in 26 states, reset passwords in 24 states, and every time the account is accessed in 15 states (Figure 11). Remembering passwords to access accounts can be challenging, especially when the accounts are not accessed frequently. Most states (41) offer at least two ways for online account users to reset passwords. Most often users can request a link be sent via email or text (41 states) or by answering security questions (33 states). Individuals in most states (30 states) may contact the Medicaid call center for a password reset, but it is the only way to reset a password in one state.

States Requiring Identify Verification and Multi-Factor Authentication for Online Accounts, January 2025

About a quarter of states are using artificial intelligence (AI) to support consumer assistance. States use AI to answer consumer questions on the website (12 states), during the application (6 states) and renewal (7 states) processes, and on using online accounts (8 states) (Figure 12). A couple of states also use chatbots to update contact information and collect information on newborns. A smaller number of states (5) report using AI to assist with eligibility and enrollment processes, including by using bots to read information from certain documents submitted by MAGI applicants and to assist with reviewing non-MAGI ex parte renewals and other case renewals.

States That Use Artificial Intelligence (AI) to Support Consumers, January 2025

(Back to top)

Eligibility and Enrollment Policies

Eligibility Policies

While child eligibility remains the highest for all MAGI eligibility groups, the median eligibility limit for pregnancy coverage in Medicaid and CHIP increased from 210% to 213% of the federal poverty level (FPL) with eligibility expansions in two states. In 2025, the median child eligibility remained unchanged at 255% FPL, or $67,957 for a family of three. Alaska and Washington expanded pregnancy eligibility and Colorado adopted the From Conception to End of Pregnancy (FCEP) CHIP option in 2025, becoming the 25th state to adopt this coverage. Since 2023, five states (Alaska, Nevada, North Dakota, Tennessee, and Washington) have increased pregnancy eligibility levels, but one state (Iowa) is seeking approval to reduce pregnancy income eligibility from 380% FPL to 215% FPL.

In states that have not implemented Medicaid expansion, median eligibility for parents is 33% FPL (Figure 13). Half of the ten non-expansion states base eligibility for parents on dollar thresholds that are not routinely updated and erode over time with inflation. Among non-expansion states, only Wisconsin covers adults without dependent children. Through a section 1115 waiver, Georgia provides coverage to parents who do not qualify for section 1931 parent eligibility and childless adults with incomes up to 100% FPL with initial and continued enrollment conditioned on meeting work requirements. Non-expansion states have lower median eligibility levels for all MAGI Medicaid groups compared to expansion states, including for children (234% FPL in non-expansion states compared to 266% FPL in expansion states); for pregnancy coverage (203% FPL compared to 213% FPL), and for parents (33% FPL compared to 138% FPL).

Median Medicaid Income Eligibility Limits Based on Implementation of Medicaid Expansion, January 2025

Two-thirds of states cover lawfully-residing immigrant children and pregnant individuals. Thirty-eight states use federal funds authorized under the Immigrant Child Health Insurance Act (ICHIA) to cover lawfully-residing children in both Medicaid and CHIP without requiring the 5-year waiting period. Thirty-two states also provide pregnancy coverage for lawfully-residing immigrant individuals without the 5-year wait.

Enrollment Policies

Just over half of states have a separate web portal or protected access to the application portal for certain entities to assist individuals in enrolling and managing their account (Figure 14). The entities authorized to use the portals include health care providers (community health centers, hospitals, and pharmacists), community-based organizations, navigators and application assisters, and MCOs. In all 27 states with portals, authorized assisters can submit facilitated applications; they also have access to many of the features available in online accounts to help individuals report changes and stay enrolled. Seventeen states provide financial support to authorized assisters, primarily through grants and contracts.

States with Online Portals for Community Assisters, January 2025

Most states suspend, rather than terminate, Medicaid eligibility for adults during incarceration. Although benefits during incarceration are limited to in-patient hospital stays, 46 states suspend Medicaid coverage when an adult is incarcerated (Figure 15). Nearly all of these states suspend coverage in prisons and jails (43 states) while two states suspend coverage in prisons only, and the District of Columbia, which does not operate any prisons, only suspends coverage in jails. Twelve states employ an automated process for suspending coverage while 5 states use a combination of automated and manual processes. Currently 25 states use only a manual process, and 3 states use some other process, but many states indicated they are working to build automated data interfaces. The Consolidated Appropriations Act, 2023 requires all states to suspend rather than terminate Medicaid coverage when people are incarcerated beginning in 2026. Suspended eligibility makes it easier for states to reactivate reimbursement for inpatient services and take advantage of reentry waiver opportunities. A growing number of states are using reentry waivers to provide access to prescription drugs and mental health and substance use disorder services prior to release to facilitate the transition back into the community and to reduce recidivism.

State Suspension of Medicaid for Incarcerated Adults in Prisons and Jails, January 2025

States use presumptive eligibility to expedite enrollment primarily for children and pregnant people. More than half of states authorize qualified entities to screen for eligibility and make a presumptive eligibility (PE) determination to temporarily enroll the individual while the regular application is being processed. PE is a long-standing state policy option designed to expedite immediate access to needed health care services. Twenty-eight states have implemented PE for pregnant people while 19 states have adopted PE for children in Medicaid and 8 use PE for children in their separate CHIP program (Figure 16). PE is used for other adult populations in 17 states and for former foster youth in 9 states. States have flexibility in selecting which types of entities are authorized to make PE determinations. However, all states must also allow hospitals to make presumptive determinations for all populations if the hospital elects to do so.

States With Presumptive Eligibility for Certain Populations, January 2025

Fewer states (8) use Express Lane Eligibility (ELE) to automatically enroll and/or renew Medicaid eligibility based on data and eligibility findings from other public benefit programs. ELE policy is limited to children unless a state receives waiver authority to include parents; two states (Massachusetts and Maryland) use ELE to renew coverage for parents to facilitate renewal for the family (Table 2). Information from SNAP is most commonly used for ELE, but some states use information from other programs, including TANF, WIC, and state tax data. ELE can be particularly useful in states without eligibility systems that are integrated with non-health programs by eliminating duplication of data collection and verification processes used by other programs.

Express Lane Eligibility Policies by State and Program, January 2025

Most states have eliminated waiting periods in separate CHIP programs. Only four states continue to require children to be uninsured for a certain period before they can enroll in CHIP, down from 13 states with waiting periods in 2020. Three states require a waiting period of 90 days and one has a waiting period of 2 months. Two of the states plan to phase out the waiting periods by July 2025. All states are required to phase out waiting periods by June 2025, based on new requirements in the E&E rule.

Eighteen states currently charge premiums for children; two of those states impose a lockout period of up to 90 days if premiums are unpaid (Figure 17). Two states (Utah and Delaware) permanently eliminated CHIP premiums in 2024, while Georgia reinstated CHIP premiums after pausing them during the COVID pandemic. Premiums are suspended temporarily or indefinitely in Arizona and Vermont. States may not charge premiums in Medicaid or M-CHIP programs for children with incomes below 150% FPL, but separate CHIP programs may impose premiums on children with household incomes at or above 133% FPL. Premiums can be charged on a monthly, quarterly, or annual basis (also known as an enrollment fee) and can be family-based or per-child, with or without a family cap. The maximum premium or enrollment fee amount for one child ranges from $15 in Idaho to $192 in Missouri, with some states varying premiums based on income. If premiums are unpaid in Kansas or Louisiana, children are locked out of coverage at the end of their 12-month continuous eligibility period for a period of 90 days or until the premium is paid. States are required to phase out nonpayment lockouts by June 2025, based on new requirements in the E&E rule.

Premiums for Children in Medicaid and CHIP,  January 2025

Appendix Tables

Income Eligibility Limits for Children's Health Coverage as a Percent Of The Federal Poverty Level, January 2025

(Back to top)

Selected Policy Options in CHIP, January 2025

(Back to top)

Medicaid and CHIP Coverage for Pregnant Individuals and Medicaid Family Planning Coverage, January 2025

(Back to top)

State Adoption of Options to Cover Immigrant Populations, January 2025

(Back to top)

Medicaid Income Eligibility Limits for Adults as a Percent of the Federal Poverty Level, January 2025

(Back to top)

Suspension of Medicaid for Incarcerated Adults, January 2025

(Back to top)

Presumptive Eligibility, January 2025

(Back to top)

System Automation of Real-Time Determinations and Ex Parte Renewals, January 2025

(Back to top)

MAGI-Medicaid Eligibility System Integrated with Marketplace Eligibility System, January 2025

(Back to top)

Multi-Benefit Online Medicaid Applications, January 2025

(Back to top)

Online Medicaid Accounts, January 2025

(Back to top)

Multi-Factor Authentication for Online Medicaid Accounts, January 2025

(Back to top)

Options for Resetting Passwords of Online Medicaid Accounts, January 2025

(Back to top)

Viewing Notices and Submitting Renewal Information Through Online Accounts, January 2025

(Back to top)

Features of Online Portals for Community Assisters, January 2025

(Back to top)

State Actions to Update Mailing Addresses, January 2025

(Back to top)

State Strategies for Returned Mail, January 2025

(Back to top)

Modes to Submit Verification Documentation, January 2025

(Back to top)

Recent Actions to Increase Ex Parte Renewal Rates, January 2025

(Back to top)

Advance Notice of  Renewals, January 2025

(Back to top)

Reminders to Respond to Renewal Notice, January 2025

(Back to top)

Access to Enrollee Renewal Dates, January 2025

(Back to top)

State Actions to Help Individuals Maintain or Regain Coverage, January 2025

(Back to top)

Automatic Case Closures, January 2025

(Back to top)

Procedures to Align Renewal Policies for Non-MAGI and MAGI Populations, January 2025

(Back to top)

Adoption or Continuation of Policies Allowed As 1902(e)(14)(A) Waivers, January 2025

(Back to top)

Use of Periodic Data Checks to Identify Changes in Income that May Affect Eligibility, January 2025

(Back to top)

Premiums and Enrollment Fees for Children, January 2025

(Back to top)

What’s at Stake in the Supreme Court Case Medina v. Planned Parenthood South Atlantic?

Published: Apr 1, 2025

On April 2nd, the Supreme Court of the United States will hear oral arguments in Medina v. Planned Parenthood South Atlantic. The case addresses whether Medicaid beneficiaries can seek relief in federal court to enforce Medicaid’s “free-choice of provider provision,” which allows Medicaid beneficiaries to seek care from any provider that is qualified and willing to participate in the program. While the case focuses on this specific question, it has its origins in broader efforts by anti-abortion policymakers to exclude Planned Parenthood clinics from the Medicaid program and, ultimately, eliminate all federal payments to Planned Parenthood centers. In this brief, we describe the case, the Medicaid policies underlying it, and potential implications for Medicaid beneficiaries’ access to reproductive health services.

What is the case in front of the Supreme Court about?

The Supreme Court’s review of this case is limited to one question: Can a Medicaid beneficiary bring a civil action to enforce the Medicaid Act’s free choice of provider? This question is similar to one that the Court decided in 2023 (Health and Hospital Corp of Marion County v. Talevski ) when it ruled (7-2) that patients do have a private right of action to enforce certain conditions that federal Medicaid law imposes on states and health care providers. However, the current case involves a different provision of federal law relating to free choice of provider under the Medicaid Act. Planned Parenthood and the individual beneficiary who has brought this case take the position that Medicaid beneficiaries meet the requirements to sue in order to enforce the free choice of provider provision. The Trump administration has weighed in on the side of South Carolina, contending that Medicaid beneficiaries should not be permitted to bring an action to enforce this provision.

In 2018, South Carolina’s Governor McMaster (R) issued an executive order prohibiting any clinic that provides abortion care from participating in the state’s Medicaid program. The order states that the state funds used to reimburse providers could be used to indirectly subsidize abortion care even though Medicaid only pays for non-abortion family planning services. The executive order had a direct impact on the Planned Parenthood clinics that offer abortion services in the state (South Carolina limits abortion to up to six weeks of pregnancy) but also offer enrollees other Medicaid-covered services including contraceptive care and STI screening and treatment. The state has historically reimbursed these providers for the non-abortion medical care they provide to Medicaid enrollees just like it pays for all other medical care. The federal Hyde Amendment bans the use of federal funds (including Medicaid) from being used to pay for abortions unless the pregnancy is a result of rape or incest or endangers the life of the pregnant person.

States operate Medicaid programs under federal guidance, and one of the federal provisions of the Medicaid law is known as free choice of provider. This provision states that “A State plan for medical assistance must… provide that any individual eligible for medical assistance… may obtain such assistance from any institution, agency, community pharmacy, or person, qualified to perform the service or services required… who undertakes to provide him such services.” Additionally, because many states require Medicaid beneficiaries to enroll in managed care, limiting their care to a defined network of providers, federal law states that beneficiaries may seek care from any Medicaid provider for family planning services specifically, even those outside the plan network.

The larger context for this case involves how a state determines who is a qualified provider, even though the Supreme Court is more narrowly focusing on private right of action. The statute does not define the word “qualified,” but longstanding federal regulations, recognize states’ authority to “set reasonable standards relating to the qualifications of providers.” The final lines of the regulation say that States need not provide payments to providers with certain felony convictions. The regulations and a separate provision contemplate that “[i]n addition to any other authority, a State may exclude” any provider from Medicaid for certain reasons “for which the Secretary could exclude” the provider from participating in Medicaid.

In 2016, in a “Dear Medicaid Director letter” issued during the Obama administration, CMS wrote that states have the authority to set standards that providers must meet, but to disqualify a willing provider, the state must have a legitimate reason such as concerns about the fitness of the provider to meet the standards or evidence of fraud. It went on to say that states cannot target a specific provider and “The failure of a state to apply otherwise reasonable standards in an evenhanded manner may suggest such targeting.” CMS went on to say that “states may not deny qualification to family planning providers…solely because they separately provide…abortion or another service that the state does not approve of.” This letter was rescinded by the Trump administration in 2018. Whether it be through the Courts or through administrative actions, this issue will likely continue to be debated and legally challenged for the foreseeable future.

The Supreme Court, however, is only considering whether Medicaid beneficiaries have the right to bring a case to enforce their right to choose their provider. The Court is not considering whether South Carolina acted properly when it excluded Planned Parenthood from its Medicaid program, deeming them “unqualified” because they provide abortion services as well as other reproductive health care services. If the Supreme Court finds that Medicaid beneficiaries have the right to bring an action to enforce their right to choose any provider, the case will then go back down to the district court to determine whether South Carolina acted within its authority to exclude Planned Parenthood as a nonqualified provider. If the Supreme Court rules that Medicaid beneficiaries do not have a private right of action, then Planned Parenthood itself could appeal South Carolina’s decision that found them to be an unqualified provider.

How have courts ruled about private right of action for Medicaid beneficiaries in other cases?

A civil rights statute, Section 1983, has long provided a mechanism for individuals to enforce the rights provided to them under federal programs, including Medicaid. There is a long history of litigation related to private enforcement of the Medicaid Act. While courts have affirmed the authority for individuals to use Section 1983 to protect Medicaid rights, the Supreme Court has issued decisions that have narrowed this authority. Currently there is a three-pronged test (pursuant to the cases Blessing v Freestone (1997), Gonzaga University v. Doe (2002), and Health & Hosp. Corp of Marion County v. Talevski (2023)) based on legal precedent that courts use to evaluate whether a federal law establishes an enforceable right:

  1. whether the plaintiff is an intended beneficiary of the statute;
  2. whether the plaintiff’s asserted interests are specific enough to be enforced; and
  3. whether the statute imposes a binding obligation on the State.

In Talevski, the most recent Supreme Court case to consider this right, the high court reaffirmed the holdings in Gonzaga that a statutory provision is enforceable under Section 1983 when the provision is “phrased in terms of the persons benefits” and contains “right-creating individual centric language with an unmistakable focus on the benefited class.”

Federal circuit courts have generally upheld private enforcement of rights for Medicaid enrollees. Before the Supreme Court Talevski ruling in 2023, there was a split among circuit court rulings. In 2019 there were four circuit court opinions that all ruled in favor of beneficiaries’ right to enforce Medicaid provisions. However, in 2020, three of four circuit court decisions did not rule in favor of Medicaid enrollees, including one decision from the 5th Circuit Court of Appeals which ruled in favor of Texas’ decision to exclude Planned Parenthood. Until the Medina case, the Supreme Court had previously refused to review multiple cases in which Planned Parenthood patients were found to have an enforceable right. An earlier version of the Medina case, Planned Parenthood South Atlantic v. Baker, went up to the Supreme Court but was denied review. This is the first time the current configuration of the Supreme Court will hear a case involving Planned Parenthood.

While this case is narrowly focused on whether Medicaid beneficiaries have the right to sue to enforce their right to choose any willing, qualified provider, the Supreme Court’s decision will have implications for the many states wishing to exclude providers, such as Planned Parenthood, based on abortion politics and not based on clinical qualifications to provide medical services. If Medicaid beneficiaries cannot bring an action to enforce the free choice of provider provision, then states will have greater latitude to exclude providers, such as Planned Parenthood, based on political objections.

What does this case mean for Medicaid beneficiaries?

This case has the potential to curtail low-income individuals’ access to preventive reproductive health care in South Carolina and potentially in many states in the nation. The Medicaid program covers one in five reproductive age women and is the largest source of coverage for women with low incomes, covering over four in ten (Figure 1). All state Medicaid programs must cover family planning services, which includes contraceptive care plus a range of related services such as physical exams, cancer screenings, pregnancy testing and counseling, and screenings for other conditions. Medicaid is an essential source of financing for safety-net clinics and is widely considered to be the largest single public payer of family planning services. KFF research has found that specialty reproductive health care clinics such as Planned Parenthood centers offer a broader range of services to their patients compared to non-specialized clinics.

Medicaid Covers One in Five Reproductive Age Women Overall and More than Four in Ten Who Have Lower Incomes

Other states are likely to follow suit if the Court rules in South Carolina’s favor. In fact, several other states, such as Texas, Arkansas, Indiana, and Missouri have tried to keep Planned Parenthood clinics out of their Medicaid networks, and while some of these efforts were blocked by CMS and courts because they violate the free choice of provider requirements, there have been exceptions. Federal courts upheld Arkansas and Texas decisions excluding Planned Parenthood from their Medicaid programs. South Carolina filed a waiver application to CMS during the first Trump Administration to exclude Planned Parenthood clinics from their Medicaid program, and Tennessee also has a similar waiver pending. No action has been taken to date on these waivers.

Blocking Planned Parenthood from receiving Medicaid reimbursements or other public funds has been shown to reduce low-income women’s access to contraceptives. In 2013, Texas replaced its Medicaid family planning program with a 100% state funded program that excluded Planned Parenthood as a participating provider. Following the policy change, there was a sizable drop in Medicaid claims for long-acting contraceptives such as IUDs or implants, and injectable contraceptives and an increase in Medicaid-funded births.

What is next?

The federal Solicitor General was granted approval to participate in oral arguments and has taken the position of South Carolina in this case. The Supreme Court will hear oral arguments on April 2nd and is expected to issue a ruling by the end of the term in June 2025.

5 Key Facts About Medicaid Coverage for People with HIV

Published: Apr 1, 2025

Medicaid is the primary source of insurance coverage for people with HIV, playing a key role in financing HIV care and prevention efforts. Despite the importance of Medicaid for people with HIV, they represent a very small share of program enrollees overall (less than one-half of a percent). Most Medicaid enrollees with HIV qualify for the program through the Affordable Care Act (ACA)’s Medicaid expansion and disability-related pathways.

Policy proposals being considered by Congress to reduce federal spending for the Medicaid program could have negative implications for people with HIV and those at risk. It is unclear what specific policies might be implemented to achieve federal reductions and a range of options are being considered, but reductions in federal Medicaid funding would shift costs to states and could result in coverage losses, reduction in benefits, cost-shifting to HIV safety-net programs, and/or reductions in payment rates to providers, if states do not offset federal dollars. Policies imposing Medicaid work requirements, which could happen through the Congressional budget process or via waiver approvals, would impact people with HIV as well, likely leading to coverage losses. Coverage losses among people with HIV would likely increase demand on the nation’s HIV safety-net program, the Ryan White Program (which could also face cuts in Congress though the program’s funding has already not kept pace with inflation or growing need). Loss of Medicaid coverage could result in interruptions in HIV care and treatment, which could lead to increased morbidity and mortality as well as HIV transmission.

1. Medicaid is the primary source of insurance coverage for people with HIV.

Medicaid is the single largest source of coverage for adults with HIV in the U.S., with four in ten estimated to be covered by the program (40%). By comparison, only 15% of adults in the general population have Medicaid coverage (Figure 1). Medicaid has helped to provide HIV care since the HIV epidemic began in the early 1980s. Coverage and benefits have grown over time as people with HIV are living longer, new infections continue to occur, and due to the Medicaid program’s expansion under the Affordable Care Act (ACA). Higher rates of Medicaid coverage reflect the fact that people with HIV have lower-incomes (33% of adults with HIV have incomes below 100% FPL compared to 11% of adults overall). Additionally, a large share of people with HIV have a disability (42%) and one in four (25%) people with HIV on Medicaid are dually eligible for Medicare, compared to 14% of enrollees without HIV.

Medicaid is the primary source of insurance coverage for people with HIV

2. Medicaid is the primary payer for HIV care and treatment

While Medicaid spending on people with HIV is a small share of all Medicaid spending, it accounts for an estimated 45% of all federal spending on HIV care and is the largest source of public financing for HIV care in the U.S, followed by Medicare. Still, in FY 2022, CMS estimates federal Medicaid spending on HIV represented less than 2% of total federal Medicaid spending. In addition, states also contribute to Medicaid spending on HIV (Medicaid is jointly financed by state and federal governments). Medicaid spending on HIV has increased over time, reflecting growing numbers of enrollees with HIV and the rising costs of care and treatment. In this way, it differs from the Ryan White Program, which is dependent on Congressional appropriations and funding levels do not automatically adjust to meet the needs of a growing population and increasing medical costs.

Medicaid is the primary payer for HIV care and treatment

3. Medicaid expansion is the most common pathway to program eligibility for people with HIV.

Over four in ten (42%) Medicaid enrollees with HIV have coverage through the ACA’s Medicaid expansion, making it the primary pathway to Medicaid eligibility for this population. In Medicaid expansion states, over half (51%) of adults with HIV have coverage through the expansion. This pathway was created under the ACA to provide coverage to low-income adults on the basis of income without other categorical requirements like disability or pregnancy. Individuals with HIV who qualify through the expansion pathway may be able to access early treatment that could help stave off disability and significantly improve health outcomes. However, not all states offer the expansion pathway and today over one-third (35%) of people with HIV live in one of ten states that has not opted to expand Medicaid. Medicaid enrollees with HIV continue to enroll through the disability pathway at much higher rates than those without HIV (36% v 15%) and it remains the primary entry point to coverage for adults with HIV in non-expansion states, two-thirds (66%) of whom have disability- related coverage (compared to 30% in expansion states).

Medicaid Expansion is the Most Common Pathway to Program Eligibility for Adults with HIV

4. Medicaid enrollees with HIV are more likely to have substance use disorders, mental health conditions, and other chronic conditions relative to those without HIV.

Medicaid enrollees with HIV experience comorbidities at higher rates than those without HIV, including those related to mental health and substance use disorders. Nearly three-quarters (73%) of Medicaid enrollees with HIV have one of 34 other chronic conditions, compared to 42% of enrollees without HIV (see Figure 4 notes for details). Enrollees with HIV are more than twice as likely to be medically complex than enrollees without HIV, with about one-third (32%) having three or more chronic conditions in addition to HIV, compared to 13% of enrollees without HIV (data not shown). Adult enrollees with HIV are also twice as likely to have either a substance use disorder or mental health condition diagnosis (44% v 23%) compared to those without HIV. Enrollees with HIV are nearly ten times more likely than enrollees without HIV to have a hepatitis diagnosis. However, likely reflecting curative treatments now available, that share has declined from 14% of enrollees in 2013 to 6% in 2021 (data not shown). These differences between enrollees with HIV and without HIV likely reflect a range of both medical and social factors that combine to increase the risk and prevalence of these co-occurring conditions.

Adult Medicaid Enrollees with HIV are More Likely Than Those Without HIV to Have Substance Use Disorder, a Mental Health Condition, and Other Chronic Conditions

5. Spending for Medicaid enrollees with HIV is nearly three times higher than spending for those without HIV.

Spending on people with HIV enrolled in Medicaid is substantially higher than on those without HIV, reflecting higher health needs and costs of care. Average Medicaid spending per adult enrollee with HIV was about $24,000 in 2021, nearly three times that of adult Medicaid enrollees without HIV (about $9,000 per enrollee). While spending on enrollees with HIV was higher across all spending categories, the difference was especially marked in the drug/treatment category reflecting the relatively high cost of HIV medications (though notably, the drug spending data reflects pre-rebate amounts). Still, because people with HIV represent less than one-half of a percent of Medicaid enrollees overall, the net impact on Medicaid spending is small (less than 2%, see point 2 above).

Spending for Adult Medicaid Enrollees with HIV is Over Three Times Higher Than Spending for Those Without HIV

Methods

Medicaid Claims Data: Figures 3-5 in this analysis use the 2021 T-MSIS Research Identifiable Demographic-Eligibility and Claims Files (T-MSIS data) to identify Medicaid enrollees with HIV.

Identifying HIV in Medicaid Claims Data: Enrollees with HIV were flagged if they had a relevant ICD 9 or ICD 10 code, any drug claims for a single tablet regiment (STR), or two or more other non-STR ARVs. A list of diagnosis and drug codes that were used for this analysis are available upon request.

Enrollee Inclusion Criteria: Enrollees were included if they were ages 18 or older and had at least one month of Medicaid coverage. Figure 4, which identifies rates of chronic conditions among those with and without HIV, also excludes those who had at least one month of Medicare coverage. These enrollees were excluded from these calculations since they may not have had sufficient claims in T-MSIS to identify chronic conditions.

State Inclusion Criteria in Medicaid Claims Data: To assess the usability of states’ data, the analysis examined quality assessments from the DQ Atlas for service users in the “Other Services” and Drug files for 2021. 49 states and D.C. were included in this analysis. Mississippi was excluded since it received an “Unusable” rating on these measures.

Defining Chronic Conditions (Figure 4): This analysis used the CCW algorithm for identifying chronic conditions (updated in 2020), excluding its definition for mental illness, which was pulled from a different source. This analysis also included in its definition of chronic conditions substance use disorder, mental illness, obesity, hepatitis C, and intellectual and developmental disabilities (ASPE definition).

Calculating Spending (Figure 5): Average annual per capita spending calculations include fee-for-service spending, payments to managed care plans, and payments to Medicare. Spending was calculated by summing the total spending of all claims per enrollee in the T-MSIS claims files and manually adds Medicare premiums for those who are also enrolled in Medicare. Estimates here do not include prescription drug rebates and most supplemental payments to providers.