VOLUME 22

Public Trust in Vaccine Information, Misrepresented Vaccine Studies, and HIV and PrEP Stigma


Summary

This volume examines findings about trusted sources of vaccine information from the latest KFF Tracking Poll on Health Information and Trust. It also explores how the misrepresentation of scientific studies, legal developments, and evolving public health guidance are contributing to the spread of false health narratives around vaccines, HIV and PrEP. Lastly, it summarizes new research on the use of generative AI to counteract vaccine misinformation, highlighting both its potential and limitations.


Featured: Latest KFF Tracking Poll on Health Information and Trust Finds Trust in Doctors for Vaccine Information Remains High, With Partisans Divided on Trust in Other Sources

The latest KFF Tracking Poll on Health Information and Trust finds that individual doctors remain the most trusted sources of reliable vaccine information among the public, while trust in other sources is lower and often characterized by large partisan gaps.

Large majorities of adults and parents say they have at least a “fair amount” of trust in their own doctor (83%) or their child’s pediatrician (81%) to provide reliable information about vaccines. Fewer, but still majorities, trust vaccine information from government health agencies including their local public health department, the CDC, and the FDA, while about half trust pharmaceutical companies and half of parents trust their children’s school or daycare.

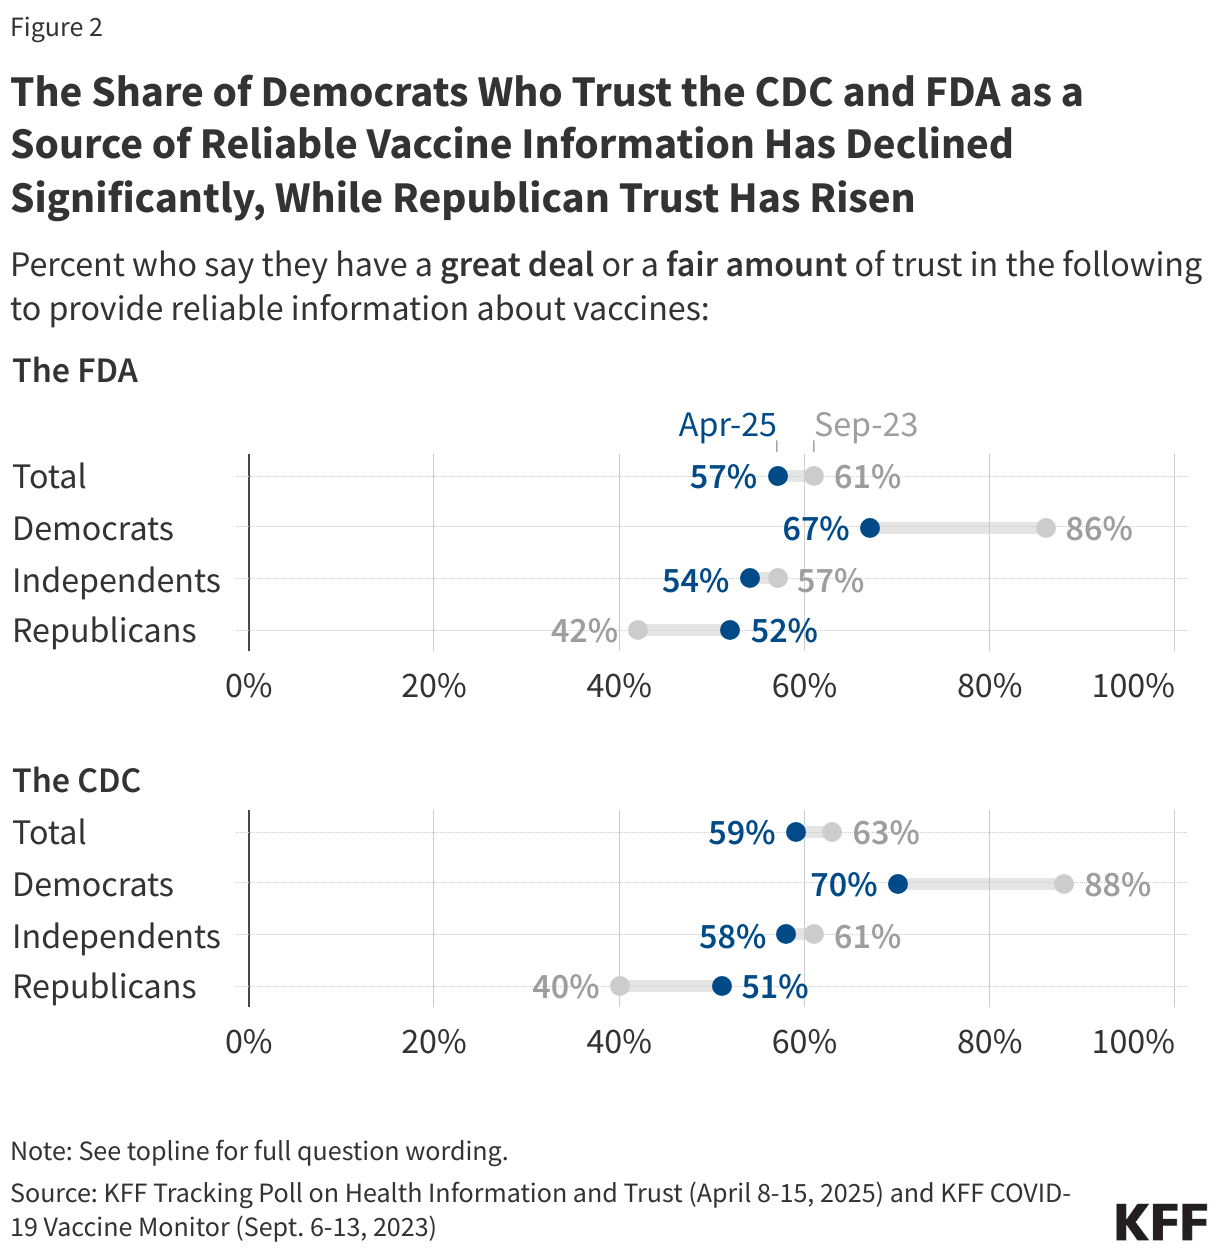
While majorities across partisans express trust in their doctor or child’s pediatrician to provide vaccine information, Democrats are more likely than Republicans to trust their doctor (93% v. 78%) or, among parents, their child’s pediatrician (91% v. 73%) as a source of reliable vaccine information. Additionally, larger shares of Democrats compared to Republicans express trust in vaccine information from government health agencies, though this gap has narrowed since the start of President Trump’s second term as trust has declined among Democrats and risen among Republicans. For example, 70% of Democrats and 51% of Republicans now say they trust the CDC for reliable vaccine information, a gap of 19 percentage points. In 2023 under the Biden administration, that gap stood at 48 percentage points (88% of Democrats vs. 40% of Republicans).

Republicans, in turn, are much more likely than independents and Democrats to trust President Trump and HHS Secretary Robert F. Kennedy, Jr. on vaccines. Three quarters of Republicans say they trust President Trump (74%) and Secretary Kennedy (73%) to provide reliable information about vaccines, making Republicans as likely to trust President Trump and Secretary Kennedy as they are to trust their own doctor on the subject.

Most Democrats Trust Government Health Agencies To Provide Reliable Vaccine Information, While Republicans Are More Trusting of Trump and RFK Jr.

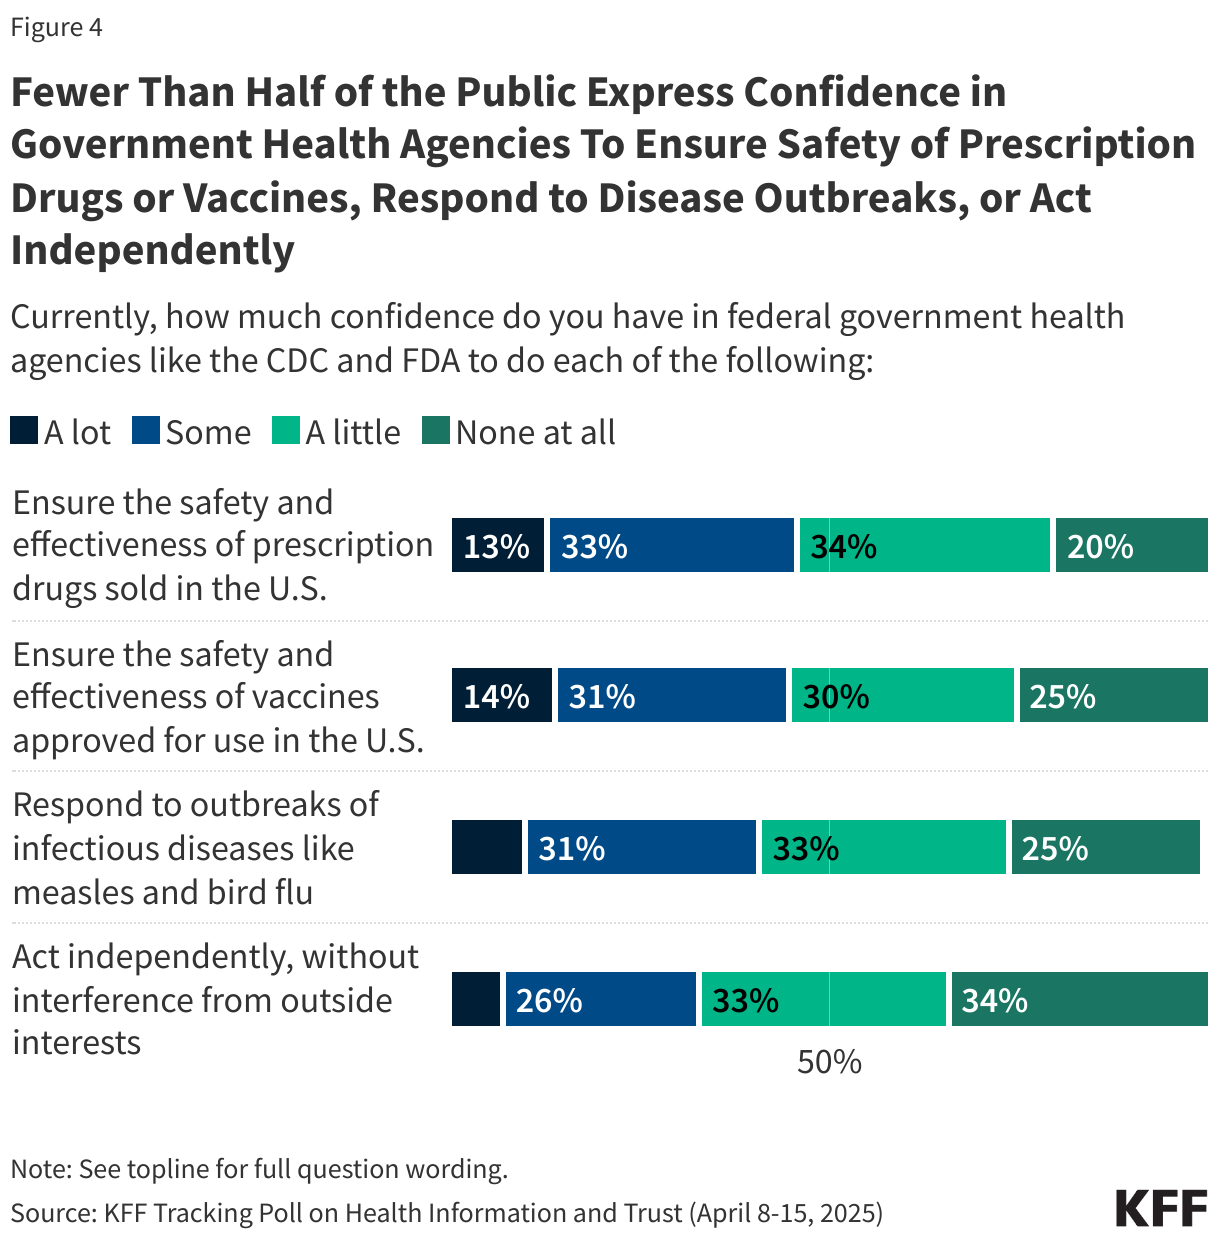
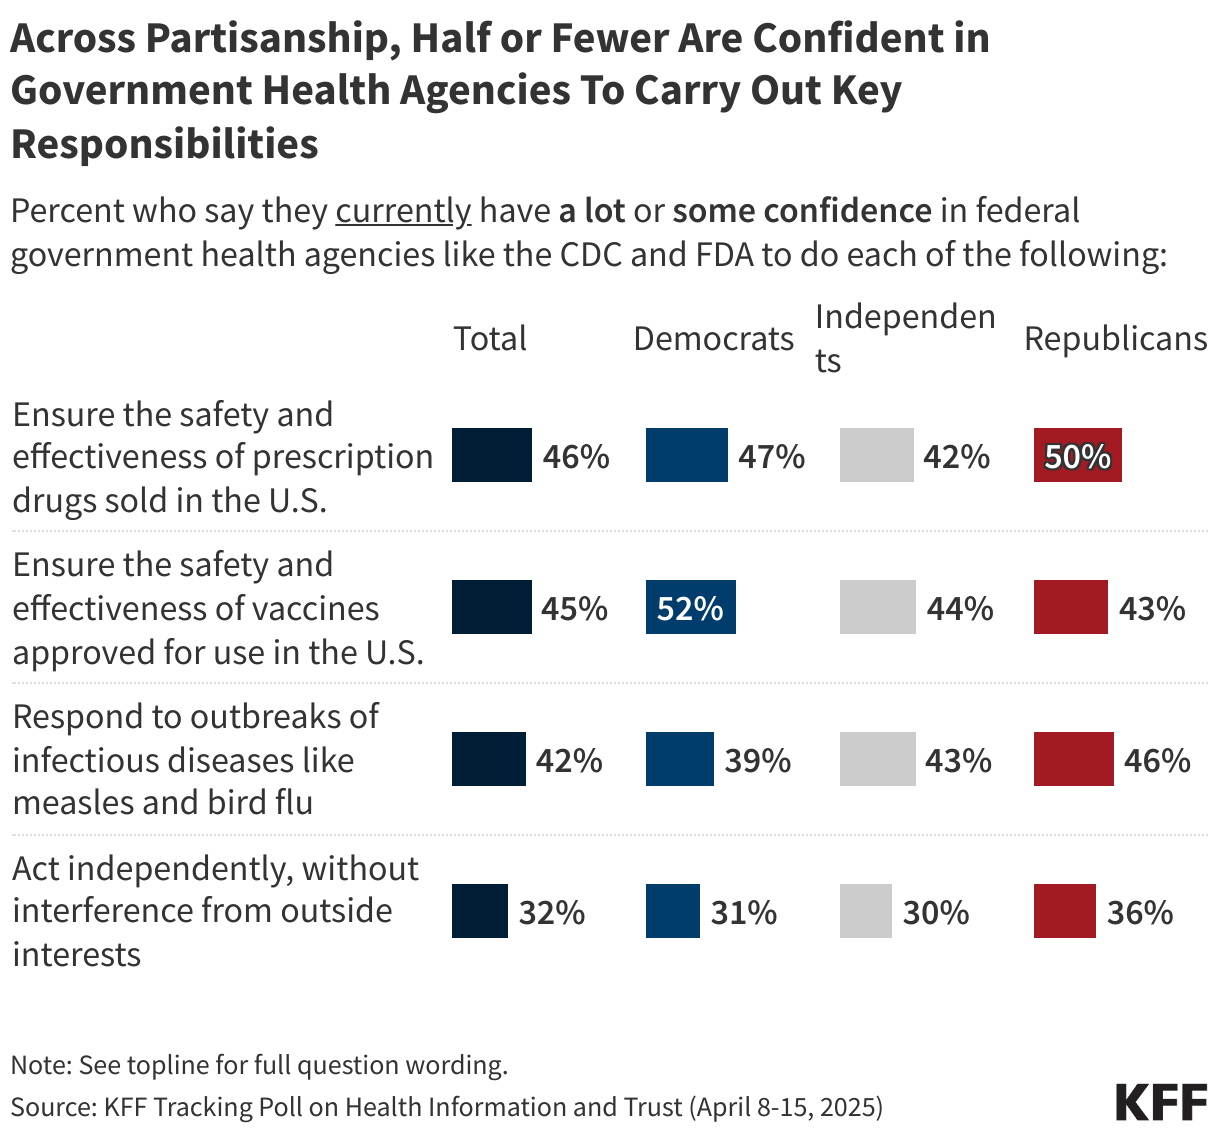
The poll also finds that fewer than half the public express “a lot” or “some” confidence in government health agencies to carry out key responsibilities, including ensuring the safety and effectiveness of prescription drugs (46%) or vaccines (45%), responding to outbreaks of infectious diseases (42%), or acting independently without interference from outside interests (32%). Across partisans, half or fewer express at least “some” confidence in these agencies to carry out each of these responsibilities.

Across Partisanship, Half or Fewer Are Confident in Government Health Agencies To Carry Out Key Responsibilities

Recent Developments

Flu Vaccine Study Misrepresented Online Amid Severe Season

SimonSkafar / Getty Images

Influenza deaths in the United States during the 2024-2025 flu season are higher than in previous years. Although the flu vaccine can prevent severe illness, hospitalization, and death, rates of vaccination have declined since 2020. The effectiveness of seasonal flu vaccines can vary year-to-year based on how similar the vaccine is to the circulating virus, but vaccines can offer protection against severe outcomes even when they are not well-matched to circulating strains. Data from the CDC supports the effectiveness of this season’s vaccine to protect against serious outcomes, and past data show that protecting against these outcomes is a primary benefit of the flu vaccine. As influenza deaths rise, the CDC continues to recommend that everyone 6 months of age and older receive a flu vaccine every season, with rare exceptions.

But some social media posts are sharing findings from a preprint study from researchers at the Cleveland Clinic to suggest that the flu vaccine is unsafe or ineffective without sharing context about the outcomes evaluated. The study, which has not yet been peer-reviewed, looked at more than 53,000 healthcare workers during the 2024-2025 flu season and found a higher rate of infection among those who were vaccinated. However, the authors explain that flu vaccine effectiveness depends on how closely the vaccine strains match the circulating virus in a given year. The study also did not evaluate the severity of illness, such as hospitalization or death, which are the primary outcomes vaccines are intended to prevent. Protection against infection with the flu can vary, but vaccines are consistently shown to reduce the risk of serious illness. After the study was posted online, a Cleveland Clinic spokesperson clarified to PolitiFact that the study did not represent the general public and does not suggest that flu vaccination increases the risk of flu.

After the study appeared on medRxiv, social media posts began circulating with misleading claims that the flu vaccine is ineffective or harmful. For example, one account that has previously shared false claims about vaccines online wrote, “Just like the COVID jabs and pretty much any other ‘vaccine’ it appears that the flu shot is an abject failure. In a preprint study from the Cleveland Clinic, employees that got the flu shot had a 27% HIGHER chance of contracting the flu.” Another post called for the removal of the flu vaccine from the market, “pending large prospective studies of their safety and effectiveness.” These posts do not acknowledge that the study did not evaluate severe outcomes. Their claims about the vaccine’s effectiveness, therefore, are misleading and unsupported by the study’s findings.

Despite these claims, most Americans remain confident in the flu vaccine’s safety. KFF’s latest April Tracking Poll on Health Information and Trust shows that most of the public (74%) is at least “somewhat confident” in the safety of the flu vaccines. While majorities across partisans express confidence in the safety of the flu vaccines, Democrats are more likely than Republicans to say they are “very” or “somewhat confident” vaccines for the flu are safe (88% v. 68%).

Misleading Claims About HIV and PrEP Resurface Amid Preventive Care Challenge

YinYang / Getty Images

Stigmatizing claims about HIV and PrEP, a medication that can be taken to prevent HIV, continue to circulate online, reinforcing barriers to prevention. Such rhetoric has resurfaced in response to the Supreme Court case Kennedy v. Braidwood Management last month. The case challenges the Affordable Care Act’s preventive services mandate, which requires PrEP (as a highly rated preventive service) be covered without cost-sharing for most people with private insurance.

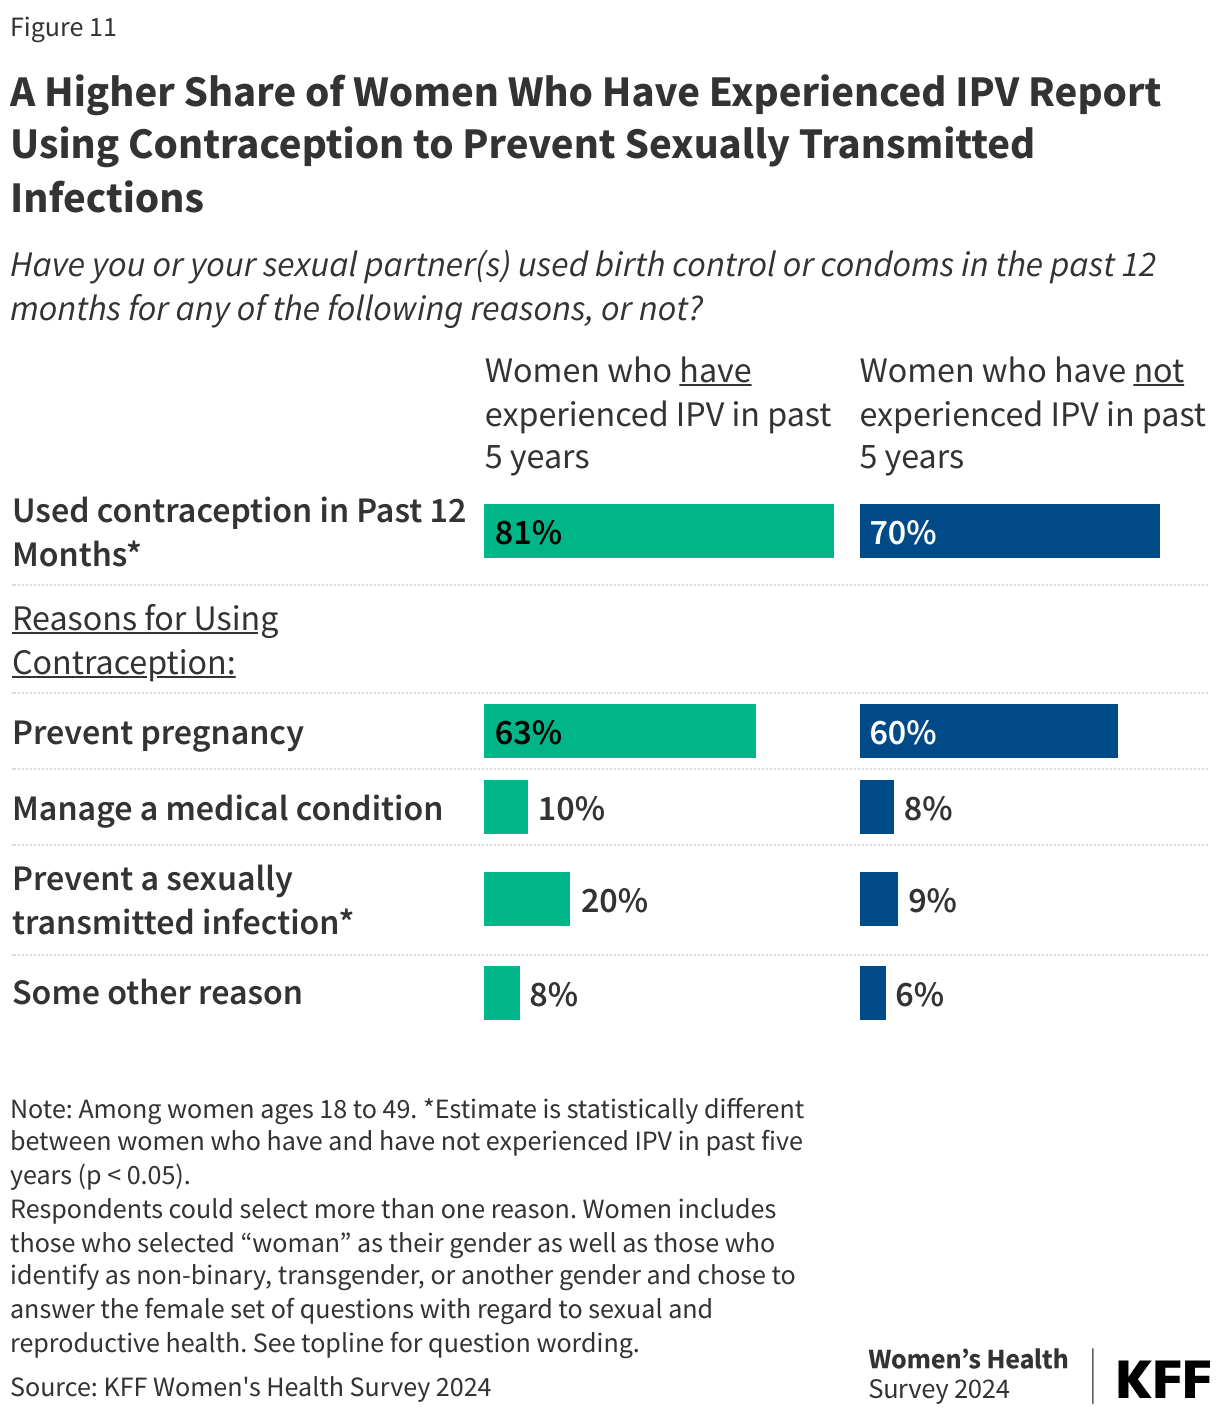
In their filings, the plaintiffs argue that requiring insurers to cover PrEP violates their religious beliefs “by making them complicit in facilitating homosexual behavior, drug use, and sexual activity outside of marriage between one man and one woman,” and that it promotes “homosexual behavior, prostitution, sexual promiscuity, and intravenous drug use.” A 2021 scoping review published in AIDS and Behavior found that PrEP-related stigma is common, often focusing on judgments about having sex without a condom or having multiple sex partners. Such beliefs may contribute to low uptake: in 2023, only 31.3% of people aged 16 and older with indications for PrEP were prescribed the drug.

However, the body of research around PrEP use and sexual risk behaviors is mixed as limitations make it difficult to draw generalizable conclusions. A 2018 systematic review found no conclusive evidence that PrEP use leads to increased sexual risk behaviors. On the contrary, the review found that offering PrEP services provides an opportunity for at-risk populations to access sexual health care, testing, treatment, and counseling that they would not otherwise receive. Multiple studies have shown that when taken as prescribed, PrEP reduces the risk of acquiring HIV through sex by about 99% and through injecting drug use by at least 74%. 

Polling Insight: A 2023 KFF poll found that about eight in ten adults (82%) say it would be more difficult to reduce the number of new HIV infections in the U.S. if PrEP were no longer required to be covered by insurance. The share who say PrEP no longer being covered will make it more difficult to reduce new HIV infections includes majorities across partisanship, and a majority of lesbian, gay, bisexual, and transgender adults.

A Majority Of U.S. Adults Say It Will Be More Difficult To Reduce New HIV Infections If Cost Of PrEP Is Not Covered

In addition, most adults (76%) – including majorities across party and race and ethnicity — view HIV/AIDS as a serious issue in the U.S., and almost two-thirds of adults (63%) are not sure if people in the U.S. who need medication to prevent getting HIV are able to get it.

Fast Track Designation for Bird Flu Vaccine Contributes to Claims that Threat of Bird Flu is Manufactured

Lu ShaoJi / Getty Images

Online conversations about bird flu spiked on April 10 after a vaccine manufacturer announced that the FDA had granted Fast Track designation to its mRNA vaccine candidate. The designation is meant to speed up the development and review process for promising vaccines targeting major public health threats. In this case, it will help accelerate clinical trials for the vaccine, which began Phase 1 in November 2024 with federal funding.

The day before the announcement, a self-described news account with over 369,000 followers on X posted that Pfizer and Moderna were in talks with the government to develop bird flu vaccines. Although HHS had previously awarded $590 million to Moderna to support development, Pfizer has not received the same designation or funding. Still, among the more than 10,000 comments on the post, many of the most-engaged-with responses amplified the idea that preparing for a potential outbreak suggests the threat is exaggerated or manufactured. Others have misrepresented the meaning of “fast track,” falsely suggesting that the vaccine is being rushed without proper safety testing, when, in reality, the designation allows for more frequent communication with the FDA and eligibility for priority and rolling review—it does not mean safety protocols are bypassed.


AI & Emerging Technology

AI-Generated Messages Show Mixed Results in Correcting Vaccine Misinformation

Delmaine Donson / Getty Images

A study from a researcher at the University of Michigan explored how generative AI can help public health communicators craft messages tailored to specific audiences. The experiment tested AI-generated corrections for vaccine misinformation, customized to match personality traits like extraversion or beliefs in pseudoscience. Participants rated their agreement with vaccine misbeliefs before and after receiving a correction, which was either AI-generated or drawn from real-world examples.

Messages tailored to extraversion performed as well as high-quality generic messages, especially among those who scored high in extraversion. But, messages aimed at people with strong pseudoscientific beliefs were ineffective and, in some cases, backfired, reinforcing skepticism. The study’s author concluded that while well-targeted AI-generated messages show promise, some messages may be counterproductive, underscoring the need for human oversight. The study adds to research examining the use of AI in public health communication. A 2023 systematic review in Journal of Medical Internet Research found that conversational AI tools can be effective in vaccine communication, especially when messages are personalized.

The findings highlight both the potential and limitations of using AI in public health messaging. KFF polling has shown that trust in AI-generated content remains low: most of the public (56%) – including half of adults who use AI — are not confident that they can tell the difference between what is true and false when it comes to information from AI chatbots.

About The Health Information and Trust Initiative: the Health Information and Trust Initiative is a KFF program aimed at tracking health misinformation in the U.S., analyzing its impact on the American people, and mobilizing media to address the problem. Our goal is to be of service to everyone working on health misinformation, strengthen efforts to counter misinformation, and build trust. 


View all KFF Monitors

The Monitor is a report from KFF’s Health Information and Trust initiative that focuses on recent developments in health information. It’s free and published twice a month.

Sign up to receive KFF Monitor
email updates


Support for the Health Information and Trust initiative is provided by the Robert Wood Johnson Foundation (RWJF). The views expressed do not necessarily reflect the views of RWJF and KFF maintains full editorial control over all of its policy analysis, polling, and journalism activities. The Public Good Projects (PGP) provides media monitoring data KFF uses in producing the Monitor.

Poll Finding

KFF Survey of Immigrants: Views and Experiences in the Early Days of President Trump’s Second Term

Published: May 8, 2025

Findings

During his second term, President Trump has implemented an array of immigration policy changes focused on restricting immigration and increasing interior enforcement efforts. While these policies have been a frequent topic of political discourse, the perspectives and experiences of immigrants themselves are often overlooked. To address this gap, this report includes new insights from a KFF Survey of Immigrants about their views and experiences during the early days of President Trump’s second term. This survey builds on the 2023 KFF/LA Times Survey of Immigrants and a KFF Survey of Immigrants in 2024 which examined claims about immigrants that circulated during the presidential election cycle. A companion report based on focus groups with Hispanic immigrants who are undocumented or living with an undocumented family member highlights the broad impacts of shifting immigration policies on this group.

Key Terms and Groups

Immigrants: In this report, immigrants are defined as adults residing in the U.S. who were born outside the U.S. and its territories. This includes naturalized citizens, lawfully present immigrants, and immigrants who are likely undocumented. Likely undocumented immigrants are included in total but cannot be reported separately due to insufficient sample size.

Naturalized citizens: Immigrants who said they are a U.S. citizen.

Lawfully present immigrants: Immigrants who said they are not a U.S. citizen but currently have a green card (lawful permanent status) or a valid work or student visa.

Key Takeaways

  • Immigrants’ worries about detention or deportation have risen sharply since 2023, even among lawfully present immigrants and naturalized citizens, and many say these worries are affecting their health. Four in ten immigrants overall (41%) now say they worry about the possibility that they or a family member could be detained or deported, up 15 percentage points from 2023 (26%). Six in ten lawfully present immigrants report being worried about immigration enforcement, as do about a quarter of naturalized citizens. About six in ten (59%) Hispanic immigrants (many of whom are noncitizens) say they worry about detention or deportation, roughly three times the share of Asian immigrants (19%) who say the same. These immigration-related fears have negatively affected immigrants’ health and well-being, with one-third of immigrants overall saying they’ve experienced worsening health conditions, increased stress and anxiety, or problems eating or sleeping since January due to concerns about their or a family member’s immigration status, rising to 41% among lawfully present immigrants.
  • As the Trump administration ramps up immigration enforcement across the country, some lawfully present immigrants report avoiding their normal activities. About one in eight (13%) immigrants overall, including one in five lawfully present immigrants, say they or a family member have limited their participation in at least one day-to-day activity like going to a community event, work, or seeking medical care due to concerns about drawing attention to someone’s immigration status. Amid increased immigration enforcement, about one-third of immigrants say they have seen or heard reports of ICE (Immigration and Customs Enforcement) presence in their community. About a third of immigrants are unsure whether ICE and CBP (Customs and Border Protection) can make arrests at “sensitive locations” such as schools, hospitals, and churches.
  • Amid confusion and fears, some immigrants have taken precautionary actions to prepare for possible immigration enforcement. Three in ten immigrants overall say they have taken at least one precautionary step like seeking out information about immigrants’ rights or consulting an immigration attorney to prepare for possible immigration enforcement, rising to 46% among lawfully present immigrants. One in twelve (8%) immigrants say they personally know someone who has been detained, deported, or arrested because of their immigration status since January, rising to about one in seven (14%) among lawfully present immigrants.
  • Four in ten immigrants say they feel “less safe” since President Trump took office, and a similar share expect their financial situation to worsen in the coming year. Substantial shares of both lawfully present immigrants (44%) and naturalized citizens (34%) report feeling less safe. More broadly, two-thirds of immigrants disapprove of how President Trump is handling his job, and a similar share say things in the U.S. have gotten off on the wrong track. Immigrants also convey unease about the future in open-ended responses describing how President Trump has affected their lives, expressing concerns about the cost of living and the availability of work.
  • Immigrants who identify with the Republican Party have generally positive views of President Trump and life in the U.S., though some express concerns. A majority of Republican immigrants say they approve (75%) of President Trump’s job performance, with substantial shares saying they feel safer since he took office (52%) and that they expect their financial situation to improve in the coming year (40%). However, there are some signs of discontent among Republican immigrants; while four in ten (42%) say President Trump’s actions so far have been “better” than they expected, about one-third (36%) say his actions have been “worse” than expected, and one-quarter disapprove of his job performance.
  • Most immigrants disapprove of President Trump’s handling of key policy areas and many of his immigration-related measures, but about half approve of his handling of border security (54% approve) and the decision to send additional military forces to the U.S.-Mexico border (53% approve). President Trump’s worst approval rating among immigrants is on his handling of inflation (75% disapprove), and majorities also disapprove of his performance on foreign policy (66%), and immigration (62%). A large majority oppose the administration’s efforts to end birthright citizenship (79%), and a smaller majority oppose efforts to deport more people living the U.S. illegally (57%). Immigrants who are Republican or lean toward the party are much more approving of President Trump’s performance and his policies, but 41% of Republican immigrants disapprove of his handling of inflation, and this group is split on his efforts to end birthright citizenship (52% approve, 48% disapprove).

Worries about being detained or deported are much higher among immigrants now than in 2023, including among lawfully present immigrants and naturalized citizens. Fielded largely before President Trump invoked the Alien Enemies Act to deport people to El Salvador and the legal case involving Kilmar Abrego Garcia made national headlines,1  the latest KFF Survey of Immigrants finds that overall, four in ten (41%) immigrants worry they or a family member could be detained or deported, up from 26% in 2023. As the Trump administration expands its focus beyond undocumented immigrants, the latest KFF Survey of Immigrants finds worries about detention and deportation have also risen among immigrants who are naturalized citizens and those who are lawfully present. About six in ten (61%) lawfully present immigrants now say they are worried about being detained or deported, roughly twice the share (33%) who said this in 2023. About twice as many naturalized citizens also say they now worry that they or a family member could be detained or deported compared to 2023 (23% vs. 12%). Worries about being detained or deported have also increased substantially among Hispanic immigrants (59% vs. 41%) and parents (50% vs. 32%). Hispanic immigrants are about three times as likely as Asian immigrants to say they worry about themselves or a family member being detained or deported (59% vs. 19%), likely reflecting the fact that a larger share of Hispanic immigrants are noncitizens.

In addition to these worries, one in twelve immigrants (8%) say they personally know someone who has been arrested, detained, or deported due to their immigration status since President Trump took office in January, rising to 14% among lawfully present immigrants and 13% among Hispanic immigrants.

Immigrants' Worries About Being Detained or Deported Are Higher Now Than in 2023, Including Among Naturalized Citizens

In addition to worries about detention and deportation, about four in ten (43%) immigrants overall say they worry they or a family member could have their legal immigration status revoked, rising to six in ten (63%) lawfully present immigrants. About half of Hispanic immigrants (54%) and immigrant parents (52%), and about a quarter of naturalized citizens (25%) and Asian immigrants (27%), say they worry about their own or a family member’s legal immigration status being revoked. Overall, about half of all immigrants (48%), rising to seven in ten (72%) lawfully present immigrants, say they worry that they or someone in their family could either be detained or deported or have their legal status revoked. While the survey does not have sufficient sample size to report on the worries of likely undocumented immigrants, recent focus groups with Hispanic immigrants who are undocumented or have an undocumented family member detail how immigration-related fears and worries are affecting their daily lives.

About Half of Immigrants Say They Have Worried About Detention, Deportation, or Revocation of Legal Status for Themselves or a Family Member

About a third (32%) of immigrants overall say they have experienced negative health repercussions due to worries about their own or a family member’s immigration status since January, rising to four in ten (41%) lawfully present immigrants. This includes about three in ten (31%) immigrants who report increased stress, anxiety, or sadness, one in five (20%) who report problems sleeping or eating, and one in eight (12%) who report worsening health conditions such as diabetes or high blood pressure as a result of immigration-related worries. Lawfully present immigrants are about twice as likely as naturalized citizens to report at least one of these negative health impacts (41% vs. 20%), as are Hispanic immigrants compared to Asian immigrants (43% vs. 17%). About four in ten (38%) immigrant parents of children under 18 say they have experienced at least one of these negative health effects due to concerns about immigration status since January. These negative effects on health are echoed in a companion report about the experiences of Hispanic immigrants living in an undocumented family, many of whom reported health impacts for themselves and their children, such as insomnia, feelings of isolation and stress, and avoiding medical care.

About One-Third of Immigrants Say They Have Experienced Negative Health Impacts Due to Worries About Immigration Status, Rising to Four in Ten Lawfully Present Immigrants

Impacts of Immigration Enforcement on Activities and Community

One in five (21%) lawfully present immigrants say they or a family member have limited their participation in activities outside the home since January due to concerns about drawing attention to someone’s immigration status. This includes about one in five lawfully present immigrants who say they or a family member have avoided traveling (18%), one in ten who have avoided going to church or other community spaces or activities (9%) or seeking medical care (9%), and smaller shares who have avoided applying for a government program that helps pay for food, housing, or health care (7%), going to work (5%), or taking a child to school or attending school events (2%). Even among immigrants who are naturalized citizens, about 5% say they or a family member have avoided at least one of these things. About one-third (35%) of immigrants overall say they know anyone (including non-family members) who has done at least one of these things, including about almost half (45%) of lawfully present immigrants and a quarter of naturalized citizens. In focus groups among Hispanic adults who are undocumented or living in a family with an undocumented family member, many participants told stories about how they are avoiding doing these activities and generally seeing fewer people out in their neighborhoods, while some said they try to avoid leaving their homes entirely due to fears about immigration enforcement.

One in Five Lawfully Present Immigrants Say They or a Family Member Have Limited Their Participation in Activities Due to Concerns About Immigration Status

Amid heightened immigration enforcement under the Trump administration, about one-third (36%) of immigrants say they’ve seen or heard reports of ICE in their community, even if they’re unsure those reports are true. About one in five immigrants say they saw or heard ICE being at store or business (22%) or a workplace employing immigrants (19%). Fewer said they heard about ICE being at or near a school (13%) or at a health care facility (6%).

About One-Third of Immigrants Say They Have Seen or Heard Reports About ICE in Their Community

As immigrants report avoiding some activities, many say they are unsure whether immigration enforcement activity can take place at “sensitive locations” such as hospitals, schools, and churches. As legal challenges continue over the Trump administration’s authority to do so, about a third (36%) of immigrants say they’re unsure whether ICE or CBP can arrest people at these “sensitive locations.” Four in ten (43%) say they think immigration enforcement arrests can take place at these places, while an additional one in five (21%) say they cannot. Confusion about this policy was echoed in KFF focus groups with Hispanic immigrants living with an undocumented family member, some of whom reported avoiding these places amid fears of immigration enforcement activity. In addition to confusion about this specific policy, one-third (36%) of immigrants say they feel they don’t have enough information about U.S. immigration policy to understand how it affects them and their family, though most (63%) say they do.

About One-Third of Immigrants Are Unsure Whether ICE and CBP Can Arrest Immigrants at Schools, Hospitals, and Churches

Amid confusion and worries, three in ten (30%) immigrants say they or a family member have taken steps to understand their rights or prepare for possible interactions with immigration authorities, rising to nearly half (46%) of lawfully present immigrants. This includes one in five immigrants who say they or a family member have sought out information about immigrants’ legal rights (20%) or who have started carrying proof of immigration status (17%). About one in ten say they or a family member have made a plan in case someone in the family is detained or deported (13%) or consulted an immigration attorney or other professional (9%). Lawfully present immigrants are more than twice as likely to say they or a family member have done at least one of these things compared to naturalized citizens (46% vs. 17%). In focus groups with Hispanic immigrants who are likely undocumented or have undocumented family members, some participants said they spoke with their children about potential scenarios involving detention, deportation, and/or family separation and said that they had assigned a local guardian for their children in case of such an event.

Three in Ten Immigrants Say They or a Family Member Have Taken Steps To Understand Their Rights or Prepare for Interactions With Authorities, Rising to Nearly Half of Lawfully Present Immigrants

Four in ten (40%) immigrants say most people in the U.S. are not welcoming to immigrants, and one in ten report experiencing discrimination or mistreatment since January. While majorities of immigrants say most people in their neighborhood (72%) and in their state (68%) are welcoming to immigrants, far fewer (31%) say the same about most people in the U.S. overall. Further, about one in seven immigrants (14%) say they have experienced discrimination or mistreatment based on their race or ethnicity, appearance, accent, or immigration status since January, and similar shares say they have been criticized or insulted for speaking a language other than English (12%) or have been told they should “go back to where they came from” (12%).

Majorities of Immigrants Say Most People in Their Neighborhood and State Are Welcoming to Immigrants, but Four in Ten Say Most People in the U.S. Are Not

Despite ongoing changes to U.S. immigration policy, most immigrants say they want to stay in the U.S. Overall, most (59%) immigrants say that, thinking about the future, they want to stay in the U.S., while one in eight (12%) say they want to move back to the country they were born in, 5% want to move to another country, and a quarter (24%) say they are “not sure.”

Immigrants’ Views of the U.S. Three Months into President Trump’s Second Term

Two-thirds (65%) of immigrants feel things in the U.S. have gotten off on the wrong track, while a third (34%) say things are going in the right direction. Most immigrants, regardless of citizenship status, say things in this country are on the wrong track, with majorities of both naturalized citizens (63%) and lawfully presents immigrants (73%) alike saying this. Similar to the public as a whole, immigrants’ views about where the country is headed are driven largely by partisan identification. About nine in ten (87%) immigrants who are Democrats or lean toward the party say things are on the wrong track, while about seven in ten (71%) who identify as Republicans or lean that way say the opposite—that things are going in the right direction.

Most Immigrants Say Things in the U.S. Are on the Wrong Track

About four in ten (43%) immigrants overall expect their financial situation to get worse in the coming year, while about a fifth expect it to get better and one-third expect it to stay the same. Fielded both before and after President Trump’s announcement and subsequent 90-day pause of widespread tariffs, the latest KFF Survey of Immigrants finds that how immigrants view their economic futures varies widely by partisanship. A majority (57%) of immigrants who are Democrats think their financial situation will get worse, whereas a plurality of Republicans (40%) think it will get better. Yet, on this question, even three in ten (30%) Republican immigrants say they think their financial situation will get worse in the coming year.

About Four in Ten Immigrants Expect Their Financial Situation in the Coming Year To Get Worse

About two-thirds (64%) of immigrants overall disapprove of Trump’s handling of his job as president, but there are wide divides by party identification. Similar to U.S. adults overall, nearly nine in ten (87%) immigrants who are Democrats disapprove of the way President Trump is handling his job as president, whereas three-quarters (75%) of immigrants who are Republican say they approve. Overall, majorities of both immigrants who are naturalized citizens (60%) and those who are lawfully present immigrants (70%) say they disapprove of the way President Trump is handling his job.

About Two-Thirds of Immigrants Overall Disapprove of How Donald Trump is Handling His Job as President, but Disapproval is Highest Among Democrats

A majority (57%) of immigrants say the Trump administration’s actions are worse than they expected, including about a third (36%) who say they are a lot worse.” While immigrants who identify as Democrats are much more likely to say the Trump administration’s actions have been worse than they expected, even among Republicans, about one-third (36%) say the Trump administration’s actions at are least “a little worse” than they expected.

A Majority of Immigrants Say the Trump Administration’s Actions So Far Are Worse Than They Expected

About half (49%) of immigrants say President Trump’s actions have had a generally negative impact on them and their family, while one in seven (14%) report a positive impact and about a third (36%) say they have had no real impact.” About seven in ten (69%) immigrants who are Democrats say the president’s actions have had a generally negative impact on them and their family, whereas about four in ten (45%) Republicans say his actions have had a generally positive impact. Across citizenship status, partisanship, and race and ethnicity, about three in ten or more immigrants say President Trump’s actions since taking office have had “no real impact” on them and their families.

About Half of Immigrants Say President Trump’s Actions Have Had a Generally Negative Impact on Them, About One-Third Say They Have Had “No Real Impact

When asked to describe how they have been negatively affected by President Trump’s actions, the largest share express concerns about the economy and impacts to their financial situation, including inflation and rising prices as well as job losses (57% among those who report a negative impact). Some (18%) say the president’s actions have caused increased stress and anxiety, while others say his actions have caused immigration-related fears (17%) like worrying about deportation or experiencing more hostility because they are an immigrant. Among immigrants who say they have been positively affected by President Trump’s actions, many (27%) said they feel more secure because of the administration’s actions on the border and immigration, or that they generally like President Trump (20%).

In Their Own Words: How Immigrants Have Been Affected By President Trump’s Actions 

In a few words, can you describe how Trump’s actions as President have affected you and your family?

Among those who said generally negative impact and mentioned the economy:

“The way he has acted has brought down the economy such as food, gas, education, and healthcare.”— 56 year-old Vietnamese immigrant man in California

“Cost of living is going up. I’m a small business owner and the current sense is that our material cost will substantially increase and our customer base is shrinking due to cost.”—60 year-old Norwegian immigrant man in California

“Although we don’t bear the brunt of these negative impacts, it’s clear Trump is actively making things harder for a middle class family like mine by imposing high tariffs and dealing with economic issues badly.” —20 year-old Chinese immigrant man in California

“Cost of everything is even higher, economy is able to crash, my retirement account is going the wrong way.” —42 year-old Indian immigrant man in California

Among those who said generally negative impact and mentioned immigration-related fears:

“Now my entire family feels unsafe and worried that the police will stop us and have negative behavior and/or be aggressive with us. Additionally, we’re very worried that the tariffs for Mexico and Canada will make the prices in the United States go up a lot.” —55 year-old Colombian immigrant woman in Texas

“It has significantly increased the uncertainty despite me being here legally. It often feels like my status is constantly at risk, making it difficult to feel truly secure in this country. There’s always the looming fear of complications when reentering from another country, adding an extra layer of stress and unpredictability. The ever-changing immigration landscape has made the process more complicated, creating a sense of anxiety and instability. This uncertainty has reached a point where America no longer feels like a safe, secure, or reliable place to build a future, forcing many to question whether staying here is truly sustainable in the long run.” —27 year-old Indian immigrant woman in Pennsylvania

“Every day there’s anxiety, frustration because of not knowing where the country is heading toward. There’s a lot of sadness and indignation. My children are scared by what they hear at school.” —40 year-old Mexican immigrant woman in California

“The fear that my husband or I will be detained by ICE and not knowing what will happen to our children is our greatest fear.” —35 year-old Mexican immigrant woman in California

“I couldn’t travel outside the US to see my parents at my home country, because of changing laws everyday.” —33 year-old Indian immigrant woman in North Carolina

Among those who said generally positive impact:

“Given us a sense of security against the criminal illegal alien; we are thankful for holding to the rule of law and protecting the US against this invasion” —53 year-old Salvadorian immigrant woman in California

“Seeing all the work that he [President Trump] has done in the short time that he has been office is absolutely amazing. I am feeling so much better about our country now that he is our President.” —54 year-old Sri Lankan immigrant woman in California

Four in ten (40%) immigrants, including 44% of lawfully present immigrants and a third (34%) of naturalized citizens, say they feel “less safe” since President Trump took office, but most (52%) Republican immigrants say they feel safer. Overall, about four in ten immigrants (42%) say they feel “about the same in terms of safety,” while 18% report feeling “safer” since President Trump took office. Feelings about safety are strongly shaped by partisanship, with about half of immigrants who are Republicans (52%) saying they feel “safer” and a similar share of immigrants who are Democrats saying they feel “less safe” (57%) since President Trump took office.

Four in Ten Immigrants Say They Feel Less Safe Since President Trump Took Office, but Half of Republican Immigrants Feel Safer

Immigrants’ Views of President Trump’s Performance and Policies

Most immigrants disapprove of the way President Trump is handling inflation (75%), foreign policy (66%), and immigration (62%), but a slim majority (54%) say they approve of how he is handling border security. Recent polls of the general public similarly find that President Trump gets his lowest marks for handling inflation and somewhat higher approval on immigration-related issues.

Majorities of Immigrants Disapprove of How President Trump is Handling Immigration, Foreign Policy, and Inflation, But More Than Half Approve of His Handling of Border Security

President Trump’s job approval among immigrants across various domains varies widely by partisanship, but across groups his lowest marks are on handling inflation. Large shares of Republican immigrants approve of how President Trump is handling border security (97%), immigration (81%), and foreign policy (75%). A smaller majority (59%) of Republican immigrants approve of how he is handling inflation. Large shares of immigrants who are Democrats say they disapprove of how President Trump is handling border security (68%), immigration (81%), foreign policy (87%), and inflation (92%). On most policy areas, the views of immigrants who are lawfully present immigrants are similar to those who are naturalized citizens, but lawfully present immigrants are more likely to disapprove of how President Trump is handling immigration than naturalized citizens (72% vs. 54%). Slim majorities of naturalized citizens (54%) and lawfully present immigrants (55%) alike approve of how he is handling border security.

Across Partisans, President Trump's Job Approval Among Immigrants Is Lowest on Handling Inflation

Majorities of immigrants disapprove of the administration’s efforts to end birthright citizenship (79%) and to deport more people living in the U.S. illegally (57%), but many approve of sending additional military forces to the U.S. border (53% approve). A Pew Research Center survey conducted earlier this year found that among the public overall, majorities disapproved of the Trump administration’s efforts to end birthright citizenship, but majorities approved of increasing deportations and sending more troops to the U.S. Mexico border.

Majorities of Immigrants Disapprove of Ending Birthright Citizenship and Deporting People Living in the U.S. Illegally, Narrowly Approve of Sending Additional Military to the U.S.-Mexico Border

Republican immigrants are more likely than those who identify as Democrats to support the Trump administration’s immigration policies but remain divided on ending birthright citizenship. On each of the three immigration policies polled, immigrants who are Republican are much more likely than Democrats to say they approve of the administration’s efforts. Notably, while about eight in ten or more Republican immigrants say they approve of the administration’s efforts to deport more people and send additional troops to the U.S.-Mexico border, Republican immigrants are split on efforts to end birthright citizenship (52% approve, 48% disapprove). Immigrants who are naturalized citizens and lawfully present immigrants have similar views on all three of the immigration policies polled.

Immigrants’ Views of President Trump’s Immigration Policies Are Shaped by Partisanship

Methodology

The KFF Survey of Immigrants: Views and Experiences in the Early Days of President Trump’s Second Term was designed and analyzed by public opinion researchers at KFF. The survey was conducted March 6-April 13, 2025, online and by telephone among a nationally representative sample of 511 U.S. immigrants in English (394), Chinese (20), Spanish (83), Korean (13), and Vietnamese (1). The sample was reached through the SSRS/KFF Immigrants Panel either online (n=469) or over the phone (n=42). The SSRS/KFF Immigrants Panel is a nationally representative probability-based panel of immigrants where panel members were recruited randomly in one of three ways: (a) Through invitations mailed to respondents randomly sampled from an Address-Based Sample (ABS) provided by Marketing Systems Groups (MSG) through the U.S. Postal Service’s Computerized Delivery Sequence (CDS); (b) a random digit dial telephone sample of prepaid cell phone numbers obtained through MSG from a dual-frame random digit dial (RDD) sample provided by MSG or (c) calling back telephone numbers from recent SSRS RDD polls whose final disposition was “language barrier,” meaning the person answering the phone spoke a language other than English or Spanish.

An initial invitation letter to the survey was sent to panel members via USPS asking them to take the survey online or by calling a toll-free number. Invitation letters were also sent via email to panelists who provided an email address during registration. Outbound call attempts were also made to panelists who provided a phone number. Online respondents received a $10 electronic gift card incentive, and phone respondents received a $10 incentive check by mail.

The sample was weighted to match the sample’s demographics to the national U.S. adult immigrant population using data from the 2023 American Communities Survey. The demographic variables included in weighting are home ownership, number of adults in household, presence of children in household, census region, length of time in the U.S., English proficiency, citizenship status, gender, age, race/ethnicity, education, and country of origin. Weights account for recontact propensity and the design of the panel recruitment survey.

In order to ensure data quality, cases were removed if they failed both quality checks: (1) had over 30% item non-response, and (2) had a length less than one quarter of the mean length by mode. In addition, respondents were asked their country of birth, and if they stated they were born in the U.S., they were asked to re-confirm that response. A small percentage of respondents (n=7; 1%) re-confirmed that they were born in the U.S. Based on this last criterion, 7 cases were removed.

The margin of sampling error including the design effect for the immigrant adults sample is plus or minus 7 percentage points. Numbers of respondents and margines of sampling error for key subgroups are shown in the table below. For results based on other subgroups, the margin of sampling error may be higher. Sample sizes and margins of sampling error for other subgroups are available by request. Sampling error is only one of many potential sources of error and there may be other unmeasured error in this or any other public opinion poll. KFF Public Opinion and Survey Research is a charter member of the Transparency Initiative of the American Association for Public Opinion Research.


GroupN (unweighted)M.O.S.E.
Total Immigrant adults511± 7 percentage points
Party ID
Democrat/Lean Democrat250± 9 percentage points
Independent/Other126± 13 percentage points
Republican/Lean Republican131± 13 percentage points
.
Immigration status
Naturalized citizen334± 8 percentage points
Lawfully present immigrant142± 12 percentage points

Endnotes

  1. Most (n=322) interviews were completed before deportation flights began on March 15, 2025 and before Kilmar Abrego Garcia’s case made national news. Abrego Garcia’s court case was filed on April 1, 2025 when 474 interviews had been completed. Since the bulk of survey interviews were conducted before President Trump invoked the Alien Enemies Act to deport immigrants to El Salvador, it’s possible that views on his handling of immigration may have shifted since the poll was conducted.   ↩︎

Living in an Undocumented Immigrant Family Under the Second Trump Administration: Fear, Uncertainty, and Impacts on Health and Well-Being

Published: May 8, 2025

Findings

Introduction

During his second term, President Trump has implemented an array of immigration policy changes focused on restricting immigration and increasing interior immigration enforcement efforts. These policy changes include restrictions on both lawful and unlawful immigration into the U.S., increased interior enforcement activities to support mass deportation, attempts to end birthright citizenship for the children of noncitizen immigrants, and rescinding protections against enforcement action in previously protected areas such as schools, churches, and health care facilities. These actions have broad impacts across immigrant families of all statuses, including the millions of U.S. citizen children living in them.

To better understand how the shifting policy environment is affecting immigrant families, KFF conducted four focus groups in March 2025 with 29 Hispanic adults who were likely undocumented or living with a likely undocumented family member in California, Texas, New Jersey and New York, and parts of the Midwest (Kansas, Missouri, North Carolina, and Nebraska) (see Methodology). These findings provide deeper understanding of experiences reported in a KFF survey of immigrant adults. The focus group participants’ experiences highlight the broad impacts of shifting immigration policies on their lives, including negative impacts on work as well as their and their children’s daily lives and routines, health, and well-being. Research suggests that many of these impacts may have long-term negative effects on health, including the health of their children. They may also have broader impacts on the nation’s economy and workforce, given the role immigrants play, particularly in certain industries such as health care, agriculture, and construction.

Major Concerns Among Immigrant Families Today

Most participants expressed major concerns about the economy and their financial situation today despite being employed. When asked about how things are going in the U.S. for them and their family, participants frequently cited concerns about the economy and its impact on their family’s finances. Like immigrant adults overall, most participants said they came to the U.S. for improved economic and/or educational opportunities for themselves and their children and talked about the significant contributions they make to the U.S. workforce. However, participants shared growing concerns about their financial situation amid the current economy, noting that it is becoming increasingly difficult to make ends meet due to rising costs. Business owners and service workers also said they were experiencing declines in income due to lower spending by consumers.

In Their Own Words: Concerns About the Economy

“Considering the financial situation that we are seeing, for example my wife and her parents came here years ago..[the] economy was different, it was a different economy, stronger, people could buy their houses more easily, etc. and you don’t see that [now]…- 38-year-old Venezuelan immigrant man in California

“Before, everything flowed differently. Now, the economy, for me, being in business…it’s super slow. People don’t spend like before. Before, they would go to the store and spend $100, but now people think twice before spending $1 because there’s no more. Before we had a bit more financial breathing room, now, we don’t.”- 42-year-old Mexican immigrant woman in Texas

“But the United States, I can speak from my experience since I arrived in 2019, before the pandemic. I can say that the little I earned back then was enough, and I could save. Currently, I earn more, and it’s still not enough. It’s very difficult to meet all the monthly needs.” – 34-year-old Ecuadorian immigrant woman in New Jersey

“I also think that this issue of tariffs that Trump is imposing is also stressing everyone out because everything is getting more expensive. Food is getting more expensive, cars are going to get more expensive, acquiring a home, work materials are also getting more expensive. So, in one way or another, that’s going to affect all of us as a society.” – 30-year-old Colombian immigrant man in New York

Participants also noted that it has become much harder to be an immigrant in the U.S. due to the changes in immigration policy and shifting attitudes towards immigrants. Many focus group participants expressed that it is much harder to be an immigrant in the U.S. due to the Trump administration’s changes to immigration policy and growing economic challenges, with one participant expressing that “The American Dream… is not like before.” Additionally, some participants reported experiencing increasing levels of discrimination and unfair treatment. Some felt they were experiencing growing levels of discrimination not only due to their immigration status but also due to their Hispanic background. Several focus group participants expressed that they feel less welcome in their communities and/or the country, with one saying that they are being made to feel like Hispanic people “shouldn’t exist”. Several participants said that they no longer feel wanted in the country even though they are following all the rules and contributing to the economy, often doing jobs that U.S.-born citizens don’t want to do.

In Their Own Words: Immigration Concerns and Shifting Attitudes Towards Immigrants

“The situation is even worse now. The “American Dream,” I think, is not like before. Before we used to say, ‘I want to go to the United States because life is better there.’ I think everything has changed now, and it’s all so difficult.” – 42-year-old Mexican immigrant woman in Texas

“It’s like the government is against us [Latinos]. We are the workforce, and I don’t understand why. We are really good people, we are workers. The point is that, for them we are not, and it seems like we’re not wanted like we were before.” – 51-year-old Colombian immigrant woman in Iowa

“We come here to work. Since I arrived, I’ve followed all the rules to the letter to be in good standing with the country. I don’t do anything wrong, and they don’t focus on that. They don’t focus on the fact that we come to work, to get ahead, to prosper, and to help the country too.” – 55-year-old Mexican immigrant woman in Kansas

“I feel like if they see you and realize you’re Mexican or [Latino], it’s like they even look at you badly, like they don’t want us here, obviously. So that part makes us feel uncomfortable.” – 29-year-old Mexican immigrant woman in Kansas

“I do feel very much feel threatened, like [Latinos] shouldn’t exist.” – 24-year-old Colombian immigrant man in Missouri

“I grew up in a very Republican community in Missouri…. In those places I’ve visited, a month ago or so, but there, you really don’t feel welcome… they realize you’re Latino or they can see it on your face, and it seems like everything changes in those kinds of communities.” – 24-year-old Mexican immigrant man in Missouri

“Currently this President, the truth I think is that he has imposed a lot of racism, even the students at schools are a little afraid, other students harass them sometimes, it’s difficult.”- 50-year-old Mexican immigrant woman in California

“I work at Taco Bell. A lot of people come in, and they’re from here, and they like it, but when they hear you speak Spanish, they look at you, and they say, ‘I don’t understand you. You have an accent.’ Before, in all the time I worked there, that didn’t happen, but now, they feel more free to get on top of you.”- 34-year-old Ecuadorian immigrant woman in New Jersey

Knowledge of Immigration Policies and Rights

Many participants said they have received information about their rights as immigrants, with a number referencing the “Know Your Rights Red Card,” although awareness varied by region. Most focus group participants in California, New Jersey, New York, and Texas reported hearing or receiving information about “Know Your Rights Red Cards.” The “Red Card” is a pocket-sized card available in numerous languages that contains information about constitutional rights during encounters with immigration enforcement officials that have been widely shared by immigrant-serving community-based organizations (Figure 1). However, most focus group participants in the Midwest were not aware of “Know Your Rights” cards, and many said that they didn’t believe they had any rights as immigrants, suggesting less outreach and education in some areas of the country.

Figure 1

Image of card available for download on RedCardOrders.com. Card reads: You have constitutional rights: 1. Do not open the door if an immigration agent is knocking. If you are inside of your house, show the card through the window or slide it under the door. 2. Do not answer any questions from an immigration agent if they try to talk to you. You have the right to remain silent. 3. Do not sign anything without first speaking to a lawyer. You have the right to speak to a lawyer. 4. If you are outside of your house, show this card to the agent. Ask the agent if you are free to leave and if they say you can, leave calmly.

Source: www.redcardorders.com

Despite many participants receiving information on immigrant rights, most remain confused and say they do not have enough information about their rights or U.S. immigration policies. Like immigrant adults overall, focus group participants said they do not have enough information to understand how U.S. immigration policies impact them and their families. Participants reported using a variety of sources to obtain information about immigration policies including but not limited to social media such as TikTok, immigration attorneys, government websites, friends and family, and English as well as Spanish-language news. However, several participants noted that they were concerned about misinformation being spread through social media. Participants expressed a need for increased availability of clear and accurate information related to immigration policy from trusted sources.

In Their Own Words: Knowledge of Immigrant Rights and Immigration Policies

“My source of information is my daughter. There’s a red paper, I think she put it in my wallet. She looked for proof that I’ve been here for so long and put it in my wallet too. She said ‘Dad, keep this, put it with your insurance,’ and she said, ‘if [ICE] stops you, read this paper.’ So I learned a little about the rights I had.”- 40-year-old Mexican immigrant man in Texas

“In the church I go to, they gave us a flyer telling us our rights in case we encounter ICE, or they come to our house or we encounter them in the street, in the office. They gave us something to read for reference.” – 54-year-old Colombian immigrant woman in New York

“I follow many social media pages and associations that are pro-immigrant. They sometimes organize meetings with immigration lawyers, where they provide advice on what should be done and offer tips to people. So, I try to follow that to get valid information, mainly coming from actual lawyers to inform myself that way.” – 34-year-old Ecuadorian immigrant woman in New Jersey

“All of that [information about immigration policies] confuses me because I don’t know who is right, and I don’t know the truth. If something happens to me, I don’t know what I’m going to do because I don’t know who is credible.” – 55-year-old Mexican immigrant woman in Kansas

“You see a lot of things on the platforms, TikTok, Instagram, Facebook, some say one thing, other say another thing, it’s very difficult to believe in a lot of things that you see, that is why I say that the information is not adequate as it should be.” – 51-year-old Mexican immigrant man in California

“One of the questions and fears of certain friends, and also mine, for being an immigrant, we have the same rights than a resident or a citizen from here? That is the question, do we have the same rights? Can we remain silent when they stop us? Can we say that we are under the United States constitution?” – 51-year-old Mexican immigrant man in California

“There’s a problem, sorry, I say there’s a problem, because there’s information, but there’s also misinformation. A lot of false news comes out. But there should be some kind of mechanism to provide information about what to do in these cases.” – 30-year-old Colombian immigrant man in New York

“I would like to know all the rights that could defend me, to defend myself, in case one day I find myself in that situation. Because, honestly, I’m not prepared for it, and I don’t even want to imagine it.” – 28-year-old Salvadoran immigrant man in Texas

Some participants said they have sought legal advice from attorneys but noted concerns about costs and potentially fraudulent immigration attorneys or notarios. Some participants said they have consulted immigration attorneys to better understand their rights as an immigrant and/or to discuss adjusting their immigration status. Participants who consulted or who had considered consulting an attorney said that the costs associated with legal services were a major barrier, with one immigrant noting they were charged a one-time, $10,000 cash payment from a lawyer. A few participants also noted concerns about “notarios”, who may represent themselves as licensed or qualified to provide immigration assistance, but are not and take advantage of the Hispanic immigrant community.

Nearly all participants said that they are experiencing resounding levels of fear and uncertainty due to shifting policies under the Trump administration. These fears extended beyond those who were undocumented to those with lawful status. Some participants noted that, during the campaign, President Trump said enforcement activity would focus on criminals, but now it feels like everyone is at risk since the administration is focusing enforcement activity on all undocumented immigrants, even if they have not committed crimes, and has eliminated lawful status and protections for some groups. Some participants were uncertain about who is and who is not at risk for deportation and the implications of registering with the Department of Homeland Security as an undocumented immigrant under the new requirement established by President Trump. A few participants noted that they heard about or previously experienced terrible conditions in detention centers, making them feel like they will take whatever steps necessary to avoid detention. Participants also noted a lot of uncertainty about the future given continually shifting policies and worried whether they or their family members may be at risk for deportation in the future. Some participants also noted growing fears among children about their parents being detained or deported.

In Their Own Words: Immigration-Related Fears and Uncertainty

“I mean, all kinds of things can happen, so you live with that fear when you go out, because obviously, as I said, you don’t know what will happen. Especially in my case, I have a six-year-old child, and that worries me a lot, mostly because of the immigration issue.” – 49-year-old Costa Rican immigrant woman in New Jersey

“Even the children worry. ‘Mom, did you get home safely?’ They’re already thinking that something is going to happen to us on the street. So that also makes me very nervous, knowing that there might come a time when they could be left here alone. That’s something, you die, and they die from sadness. An unthinkable thing.” – 54-year-old Colombian immigrant woman in New York

“You think, ‘OK, I don’t know how long I’ll really be able to stay here. I don’t know if I’ll get deported.’ And I’m also thinking about my daughter’s future because now it’s not just about me; it’s about her too. So yes, it’s really worrying.” – 39-year-old Venezuelan immigrant woman in Iowa

“And the issue is that, as far as I know, ICE has a daily quota they need to meet…so they pick up whoever, whether they have papers or not. That’s why there are also cases where they even pick up citizens in their desperation to take everyone….” – 54-year-old Colombian immigrant woman in New York

“… [the news was] saying that the immigrants had to register, and they even were given the immigration page, and they were showing supposedly the steps to follow… it gave me a lot of anxiety because… a record is saying here I am openly, you can come to look for me whenever you want.” – 52-year-old Mexican immigrant woman in California

“At the border, immigration took my visa because that day they started investigating why I had a child here and was here illegally. They took it away, and with lies, they made me sign a paper in English…that said I didn’t want my visa back. It was impossible for me to sign that I didn’t want my visa, but they lied to me and told me that if I didn’t sign, they would send me for detention here…So, out of fear, I signed, and they sent me back to Mexico.” – 42-year-old Mexican immigrant woman in Texas

In some cases, participants’ fears have been amplified by increases in enforcement activity in their communities as well as by news and social media reports of immigration raids. Participants living in border areas in California and Texas were particularly likely to report a large presence of ICE agents in their communities and noted that there was this presence before President Trump took office. However, some participants, particularly those in Texas, reported that the atmosphere was different now with ICE agents having “their weapons” or being “dressed in civilian clothes.” Several participants said they know someone who was detained or deported since President Trump took office, including neighbors and family members. Many participants noted that news stories and social media posts about enforcement activity can stoke fears, but that sometimes the social media posts about raids in the community are false. Some participants indicated that they knew that enforcement activity can now happen in places that were previously protected, such as schools and churches, further adding to their fears.

In Their Own Words: Experiences with Immigration Enforcement

“It’s very different for us, those of us who live on the border. For me, it’s normal. I can go into a store, a convenience store, and I might run into an immigration agent, a border patrol agent in green, and I can see them anywhere here in the Valley. I’m not afraid of them, but it’s very different now with ICE agents because they wear their vests, their weapons, and we already know that ICE agents will go after anyone, anyone who looks Latino.”- 40-year-old Mexican immigrant man in Texas

“Here where I live is very quiet, but [the influencers] scare you on social media.” – 41-year-old Mexican immigrant woman in California

“I think social media makes us very scared, but up until now, from everything I’ve heard, I haven’t seen anything.” – 42-year-old Mexican immigrant woman in Texas

“The friend said, that [ICE] go around dressed in civilian clothes and stand on the corner, but I already saw a case like that with my neighbor. They took the neighbors, but they were dressed in civilian clothes. I didn’t think it was ICE until later, when a daughter came and told me ‘Didn’t you see that they took my parents?’ and I told her I had seen it but I thought it was someone, a friend.” – 58-year-old Mexican immigrant man in Texas

“My cousin’s wife contacted me to ask how we were doing and how everything was around me because they deported her older nephew, but he was a person with valid TPS [Temporary Protected Status]. She says that it was simply because he had a tattoo, and he ended up in El Salvador.” – 39-year-old Venezuelan immigrant woman in Iowa

“…here where I live, when everything first started, in the Walmart that is five minutes from here, [ICE] supposedly did a raid. I don’t know if they took someone specific but just knowing that they were nearby scares me. Even if it’s the regular police I get scared.” – 34-year-old Ecuadorian immigrant woman in New Jersey

“They now even went into churches when before they used to say they couldn’t.” – 29-year-old Mexican immigrant woman in Kansas

“I also see a lot of TikToks where [immigration enforcement officials] are looking in churches and in all the restaurants, they’re looking around. So, yes, you live with that fear.” -29-year-old Mexican immigrant woman in Kansas

“…We live with fear… you see a lot of things on TV and in the news. I’m afraid when my daughter goes to university, afraid that she might not come back. You go out and as we say in my country, you’re “paniqueado” [panicked] looking around everywhere if you see something strange.” – 54-year-old Dominican immigrant woman in New York

Some participants said they have planned for the care of their children or other family members in case they are detained or deported. Some participants said they spoke with their children about potential scenarios involving detention, deportation, and/or family separation and said that they had assigned a local guardian for their children in case of such an event. A few also reported making plans for their homes or businesses in case they are detained or deported. However, others said they were avoiding talking to their children and other loved ones about potential deportation so as not to create more fear and stress.

In Their Own Words: Plans for Potential Detention or Deportation

“I spend my time thinking about scenarios of how to solve things, who’s going to take care of my son, who’s going to take care of my mom, how can I take them with me. I mean, I spend my time thinking about it, and sometimes I can’t sleep.” – 49-year-old Costa Rican immigrant woman in New Jersey

“A friend of mine, who is a citizen, told me ideally, my daughter should have a guardian. They told me to give her a power of attorney because in case I were to be deported.” – 57-year-old Colombian immigrant man in Iowa

“We have talked with the children, to be prepared, options… financial matters and all that, this situation has accelerated the process to have options, A, B, C and D, then, things that before we didn’t focus on too much, we are focusing on today because it’s more likely, so we have to be prepared with the children regarding housing, finances, family, or people to go to, in case God forbids that something happen.” – 40-year-old Mexican immigrant man in California

Impacts of Fears on Workplaces and Employment

Some participants said they have become increasingly fearful of going to work and/or that they have noticed fewer workers showing up at their workplaces due to immigration-related fears. Those working in restaurants or transportation also reported declines in income due to fewer people leaving their homes to eat or travel. Those employed in factories, construction work, and field work said they were working longer hours and more shifts since some coworkers had left. While this resulted in higher incomes for some, others felt stressed about the increases in hours and some of those working in management roles said that they were struggling to find new workers to replace those who left, with one noting that, “no one wants to work right now… they’re really scared”. While one participant said her employer had offered to provide support and resources to help protect her, another said that her employer had told her there was nothing the company could do if there was a raid at the workplace.

In Their Own Words: Impacts of Immigration-Related Fears on Work

“Once Trump came in with immigration, with the idea of wanting to kick everyone who’s not from this country, companies are deciding 100% American first. So, they’re getting rid of all Hispanic people, leaving many without jobs…Many Hispanics do the hard work, the work that Americans don’t want to do. So, [Hispanics] have been left without jobs, which is why the economy has gone down. There are no people filling those gaps.” – 34-year-old Ecuadorian immigrant woman in New Jersey

“I work in a restaurant, and we depend on tips. So, there are fewer clients because of the fear that they might get caught [by ICE]. Many prefer to bring their lunch and not go out from work, from home to work and from work to home. …They no longer go to restaurants because, supposedly, there were going to be raids on restaurants too.” – 29-year-old Mexican immigrant woman in Texas

“I’m a driver, and people that always use transportation has decreased a lot, they don’t use the transportation or they haven’t gone to work, so it has changed.” – 51-year-old Mexican immigrant man in California

“In my case, I had six workers, and three of them quit because of fear. They stopped working. Once all the raids started, they left. They left me with the work unfinished because of fear. Now people don’t want to work, they’re scared, they don’t want to go to work because they are scared. I honestly am struggling a lot because no one wants to work right now in business like this. They’re really scared.” – 42-year-old Mexican immigrant woman in Texas

“I work in the fields, and in fact, days ago when they said immigration was in Bakersfield a lot of people stopped going to work…” – 41-year-old Mexican immigrant woman in California

“My bosses are American too, and they’ve told me that if I need anything, they even told me that they need me so much and that if possible, they would try to figure out what they had to do, but that they would not let me leave. I also feel a lot of protection from them.” – 42-year-old Mexican immigrant woman in Texas

“[I feel] fear because [ICE] can come in if they want to, they are not respecting anything. For example, in my job, I asked my boss, the boss who really commands, what the corporation would do if [ICE] came. Their answer was that, if they come, they can come in, and we have no backup. If they come, they come in and ask for documents without a warrant.” – 34-year-old Ecuadorian immigrant woman in New Jersey

Impacts of Fears on Daily Lives

Participants reported stark changes in their daily lives due to immigration related fears. Many said they were limiting their time outside the home and avoiding a range of activities, such as driving, traveling, and participating in community and recreational activities, including attending church or events. One participant said she had started attending church virtually and a few others said they were no longer going to church due to fear. Many reported seeing empty restaurants, streets, and parks in their neighborhoods. Some participants noted that these changes are leading to feeling isolated and alone and spending long hours inside the home. Many said, when they do go out, they are constantly on edge and looking around the environment because they do not feel safe.

Some participants also described impacts on children’s daily lives and routines, noting that they or others in their community were scared to send their children to school, particularly in the days immediately following the election. Other participants talked about no longer being able to take their children to parks in their neighborhoods or on other outings or vacations and expressed sadness about not being able to explain to their young children why. Some participants also described instances of their children taking on more family responsibilities. For example, one participant said his U.S.-born daughter has taken on primary responsibility for running the household errands to limit the parents’ time outside the home. The participant also said that his daughter was considering joining the Army because she was told it helps her father adjust his immigration status.

In Their Own Words: Impacts of Immigration-Related Fears on Daily Lives and Routines

“We are no longer going to be able to renew our cars, for example, I used to renew it with my passport, and this will affect me because my little truck is in my name, and now we won’t be able to do that anymore.” – 29-year-old Mexican immigrant woman in Texas

“So, it’s like we’re in a constant winter, you know? Like what my colleague said, we’re always at home. So, now that summer is here, now that all of this started this year, everyone is kind of holding back when it comes to going outside, to any type of activity, whether it’s working or having some kind of business activity or any leisure activity. So, that affects you physically, emotionally, mentally as well…. You don’t feel free. You feel like you’re in a cage.” – 30-year-old Colombian immigrant man in New York

“A week before the stores were full, and the following week they were completely empty. I mean, that’s how I saw the impact [the election] had.” – 24-year-old Mexican immigrant man in Missouri

“Living under the radar, not raising alarms, staying out of situations, even staying away from a ticket, just in case they stop you for a ticket. Basically, living under the radar, as if you don’t exist.” – 30-year-old Colombian immigrant man in New York

“In the church that I visit, many Mexicans go there. …I’m almost not going to mass anymore because of…the fear. There were a lot of Mexicans, and lately the church is empty, and they’re scared.” – 54-year-old Dominican immigrant woman in New York

“Socializing… going places, whether it’s restaurants or malls because of the uncertainty of not knowing when they will do a raid. People prefer to stay home instead of exposing themselves.” – 34-year-old Ecuadorian immigrant woman in New Jersey

“I have coworkers who, when all of this started, stopped taking their children to school out of fear. So the children stayed home and missed days until they felt a little more at ease.” – 55-year-old Mexican immigrant woman in Kansas

“Yes, [fears] affected my children because… I told them about the reason for my behavior, I didn’t want to go to the store; I would just leave work, work is just two or three minutes away, right here close by, and I would lock myself up. I didn’t go out. I stayed like that. I went into this horrible fear, something awful, because I thought ‘I’m not going to fall again’…. I talked to my children, and my children cried, and it’s really sad, all of this.” – 50-year-old Honduran immigrant woman in Texas

“In my case, I have a six-year-old child. Honestly, I’m afraid to take him to the park, and he asks me, ‘Mom, why don’t we go to the park?’ How do I tell him? I’m scared. How do I tell him that we’re at risk? He doesn’t understand, he just wants to go to the park, but for me, it breaks my heart.” – 49-year-old Costa Rican immigrant woman in New Jersey

Impacts on Health and Well-Being

Immigration-related fears have taken a toll on the mental health and well-being of many focus group participants, as well as their children. Many participants described feeling anxious, stressed, depressed, isolated, and lonely due to the changes in their daily lives and constantly having to be on high alert. Participants described suffering from insomnia, loss of appetite, and symptoms such as stomach problems and migraine headaches due to fears and stress. For example, one participant said that she had lost “almost ten pounds in two weeks.” Participants also talked about how the environment has impacted children, with them experiencing increased fears and feelings of sadness.

In Their Own Words: Impacts of Immigration-Related Fears on Health and Well-Being

“I’ve realized that now I have a lot of fear at night, I think and think about what’s going to happen, what’s going to happen to me; I have insomnia now, which I didn’t have before.” – 55-year-old Mexican immigrant woman in Kansas

“Emotionally, well, it makes you feel sad, feel alone, I mean, not feeling part of anything, not feeling part of a community. I mean, you don’t interact with anyone, you don’t have anyone to talk to, no one to share your stories with, no one to listen to, you feel sad, you feel depressed, anxiety.” – 34-year-old Ecuadorian immigrant woman in New Jersey

“They [kids] were terrified when they saw what was on the news, hearing families talk, and it created fear in the kids. They’d start crying, and yes, it affects them too, especially when they’re at an age when they’re aware and can understand what’s going on.” – 55-year-old Mexican immigrant woman in Kansas

“I’ve had insomnia for two weeks. I’ve been going to sleep at 2, 3, 4, or 5 in the morning, and I have to wake up at 6. So yes, it’s affecting me. I’m more nervous, my sleep is very disturbed. I’ve lost almost ten pounds in two weeks, and it wasn’t really from January or February, we’re talking about just March.” – 40-year-old Mexican immigrant man in Texas

“A while ago, I had some stomach problems, and stress and anxiety make it worse. For me, it’s like it damaged my health.” – 24-year-old Mexican immigrant man in Missouri

Many participants report avoiding seeking health care due to concerns about costs and fears. Some participants said they are more fearful of seeking health care due to heightened fears, with a few saying that they had heard on the news that hospitals may be sharing patient information with ICE. While hospitals in Texas and Florida request information on immigration status under recent state laws, at the time the focus groups were conducted, such information was not shared with immigration officials for enforcement purposes. However, beyond fears, costs continue to be a major barrier to health care, particularly amid growing financial challenges. A few participants said that when they do seek care, they prefer to go to smaller Hispanic-serving community clinics or pop-up medical fairs as those are more affordable and that they trust those places more than larger health care facilities. Some focus group participants said they prefer to use “natural” or home health remedies instead of seeking mainstream health care in the U.S., in part due to immigration-related fears as well as challenges paying for health care in the U.S. Several participants also said that they relied on medicines that they or a family member brought from their home countries instead of purchasing medicines or seeking health care in the U.S.

In Their Own Words: Barriers to Health Care

“For the 21 years I’ve been here, the times I’ve gone to the doctor have been very few, and honestly when I go to the doctor, it’s because I feel like I’m dying or can’t bear some kind of pain.” – 40-year-old Mexican immigrant man in Texas

“I have really bad arthritis, and I’ve been to the hospital many times, but now I don’t even want to go. I don’t take my medicine, I don’t buy it because I don’t have much money. The help to get a doctor is just bad.” – 43-year-old Mexican immigrant woman in Texas

“Personally, I’ve never gone to typical American clinics, like the regular ones. I always go to places recommended by other Latinos… so at least, I don’t feel like they’re keeping a record of me or asking for papers or anything like that.” – 31-year-old Colombian immigrant woman in North Carolina

“Yesterday, I was in a car accident. I was hit, so I felt really bad. When the police officer asked me if I wanted an ambulance to take me to the doctor, I started thinking, ‘Should I go to the doctor?’ I had already heard that doctors might call immigration or ask about your status in the hospitals.” – 43-year-old Mexican immigrant woman in Texas

“…I prefer to stay at home, cure myself with natural remedies, with medicine from my country, and try to take care of my health so I don’t have to expose myself.” – 34-year-old Ecuadorian immigrant woman in New Jersey

“I also try home remedies that I know work… But yes, I’ve gone like two or three times to clinics where I feel safe… where they don’t take my personal information.” – 29-year-old Mexican immigrant woman in Kansas

Many focus group participants are fearful of accessing public programs, including health coverage, and there is persistent confusion and misunderstanding around whether participating in these programs can negatively impact immigration status. Most participants said that they were not using public assistance programs due to immigration-related fears and/or a preference to be self-reliant. A number indicated that they believe that using such programs may negatively affect their ability to adjust their immigration status in the future or put them at risk for deportation, although under public charge policy as of the time the focus groups were conducted, use of non-cash assistance programs does not negatively affect immigration status and programs cannot share information for immigration enforcement purposes. Some participants indicated that they were receiving health coverage or other assistance for their children, most of whom are U.S. citizens. Some participants also said they received health coverage for themselves through Medi-Cal, which offers state-funded coverage to immigrants regardless of status in California, or a local program in Harris County, Texas, knows as the “Gold Card.”

In Their Own Words: Concerns about Participating in Public Programs

“I prefer to not ask for anything, to avoid leaving a record or trace.”- 31-year-old Colombian immigrant woman in North Carolina

“From what I’ve heard from other people, they’re afraid that if they apply today, they might not be able to fix their immigration status in the future because they’ve received help from the government. That’s why I’ve never applied.” – 50-year-old Honduran immigrant woman in Texas

“Yes, in my case, I try not to [apply for public programs] because I feel like I don’t want to be on any list, like I’m a burden to the government. The only thing I do receive is, of course, medical insurance for my son, but I don’t think I’ll apply for food stamps or any other benefits because of the fear that I don’t want to be a burden.” – 49-year-old Costa Rican immigrant woman in New Jersey

Future Outlook

Several participants said they are considering leaving the U.S. or are uncertain about their future plans due to the current environment. KFF survey data found that most immigrants would still choose to move to the U.S. knowing what they know now. In contrast, several focus group participants said they would not choose again to move to the U.S., in part due to the strong anti-immigrant rhetoric in society and in part due to the economy. Some participants also said that they were making plans to move back to their countries of birth in the future while others expressed uncertainty and said that they were going to “wait and see what happens with this government.” Participants who were considering moving back to their countries of birth also noted challenges associated with a potential move, such as no longer being familiar with their country of birth, not knowing where to go back to, and not having any family left there since their lives, livelihoods, home, and families are in the U.S.

In Their Own Words: Future Outlook

“I spend all the time thinking because I’ve been here for 40 years, I came when I was 19, so I only know this place. So going back to a country I don’t know, I don’t know what’s going to happen, where I’m going to go, or even if I have family there.” – 49-year-old Costa Rican immigrant woman in New Jersey

“… we have started to study options, studying possibilities, there’s not a set plan, but we have the idea.” – 38-year-old Venezuelan immigrant man in California

“I already spoke to my children, and I told them that if anything happens to me again, I won’t return to the United States. I have a house, I have everything. I don’t care anymore. I’m OK because my kids have their houses, I left them everything. Now I can leave in peace, but I won’t come back here.” – 42-year-old Mexican immigrant woman in Texas who had past experience with detention

“It’s like one day we saw a life here, now we just have to wait and see what happens with this government, and if things become very hard we could end up having to go back.” – 31-year-old Colombian immigrant woman in North Carolina

Methodology

KFF conducted four focus groups with 29 Hispanic adults who are themselves a likely undocumented immigrant or living with a likely undocumented immigrant across the country to provide deeper insights into the experiences of these families amid the current environment. The four groups were conducted in March 2025 virtually in Spanish and each lasted two hours. Each group was mixed gender and included six to eight participants from several regions in the U.S.: California, Texas, New Jersey and New York, and parts of the Midwest (Kansas, Missouri, North Carolina, Nebraska).

For each group, participants were chosen based on the following criteria: Must be at least 18 years of age, identify as Hispanic, and either they or someone living with them are a noncitizen immigrant without lawful permanent resident status (a “green card”) and without a valid work or student visa, meaning they were likely undocumented. In addition, groups were chosen to represent a mix of household composition, including at least some participants who are parents; a mix of areas of employment; and a preference for recruiting participants who had sought health care in the U.S. and have someone in their household with an ongoing health condition. Participants had a variety of countries of birth including: Mexico (14), Colombia (4), Ecuador (3), El Salvador (2), Venezuela (2), Costa Rica (1), Argentina (1), Dominican Republic (1), and Honduras (1).

PerryUndem recruited and hosted the focus groups. The screener questionnaire and discussion guides were developed by researchers at KFF in consultation with PerryUndem. Groups were audio and video recorded with participants’ permission. Transcripts and recordings were de-identified and are used for research purposes only; they will be deleted after use. Each participant was given $200 after participating.

Congressional District Interactive Map: People with Medicare and Medicaid (Dual-Eligible Individuals)

Published: May 7, 2025

The recently passed budget resolution targets cuts to Medicaid of up to $880 billion or more over a decade to help pay for tax cuts. Major cuts to Medicaid may impact coverage for the almost 1 in 5 Medicare beneficiaries (11.9 million) who are also enrolled in Medicaid. For people covered under both programs (“dual-eligible individuals”), Medicare is the primary payer and covers medical acute and post-acute care, including skilled nursing facility services and home health care. Medicaid wraps around Medicare coverage by paying Medicare premiums and in most cases, cost sharing. Most dual-eligible individuals (8.5 million people in 2025) are “full-benefit” enrollees, which means they are eligible for Medicaid benefits that are not otherwise covered by Medicare, including long-term carevision, and dental. The remaining 3.4 million dual-eligible individuals, “partial-benefit” enrollees, are eligible for Medicare premiums and often, cost sharing assistance, but not for full Medicaid benefits.

It is unclear what policies might be included in the reconciliation proposals, but significant reductions in Medicaid spending would have potential implications for Medicare beneficiaries who account for nearly 30% of Medicaid spending. The interactive maps below illustrate how many people are enrolled in Medicare and Medicaid in each congressional district, including the number of people receiving full Medicaid and partial Medicaid benefits. Key takeaways include:

  • There are at least 7,300 dual-eligible individuals living in each of the 435 congressional districts, with enrollment as high as 81,300 in some districts.
  • In each congressional district, there are at least: 4,100 full-benefit dual-eligible individuals and 100 partial-benefit dual-eligible individuals.
  • The average number of dual-eligible individuals is 24,700 in Republican districts and 30,000 in Democratic districts.
  • The share of dual-eligible individuals with full Medicaid benefits varies across congressional districts, ranging from 30% to 100%.
  • The top 10 Republican districts with the highest number of dual-eligible individuals are: FL26 (58,800); KY05 (58,000); FL27 (56,300); NY11 (53,000); FL28 (51,100); WV01 (48,500); CA01 (46,300); NY21 (45,700); CA22 (41,500); and AR01 (40,900).
  • The top 10 Democratic districts with the highest number of dual-eligible individuals are: NY13 (81,300); NY15 (73,700); NY08 (71,600); NY06 (64,800); ME02 (63,300); NY14 (57,800); NY09 (57,300); CA34 (56,500); MA01 (56,400); and NY10 (55,600).
Dual-Eligible Individuals by Benefit Type and Congressional District, 2025
Share of Dual-Eligible Individuals with Full Medicaid Benefits by Congressional District, 2025

Methods

Data: To calculate Medicaid enrollment by eligibility group and congressional district, this analysis uses the KFF analytic file that merged the 2021 Master Beneficiary Summary File (MBSF) Base and the 2021 Transformed Medicaid Statistical Information System (T-MSIS) Analytic Files (TAF) Research Identifiable Files (RIF) file using a Chronic Conditions Warehouse (CCW) beneficiary identifier crosswalk and Centers for Medicare & Medicaid Services Medicare Monthly Enrollment data for January 2025 (downloaded in April 2025).

Dual-Eligible Individual Inclusion criteria: Estimates include dual-eligible individuals in 50 states and the District of Columbia if (1) they were in both the MBSF and T-MSIS files using the CCW crosswalk, and (2) Dual-eligible individuals are assigned full-benefit status and partial benefit status using an “ever” approach and a hierarchy by giving priority to the full-benefit status. Individuals were a full-benefit dual-eligible individual in each year using the Medicare monthly DUAL_STUS_CD with values of 02,04,08 or the Medicaid monthly code DUAL_ELGBL_CD with values of 02,04,08 or the monthly code RSTRCTD_BNFTS_CD_03 values of 1,A,D,4,5,7. If not a full-benefit dual-eligible and the individual had DUAL_STUS_CD with values of 01,03,05,06 or the Medicaid monthly code DUAL_ELGBL_CD with values of 01,03,05,06 or the monthly code RSTRCTD_BNFTS_CD_03 values of 2,3,C,6,E,F they were assigned partial-benefit status. For this analysis, we excluded dual-eligible individuals who only had CHIP eligibility in the year.

Assigning Dual-Eligible Individuals to Congressional Districts: This analysis used the Missouri Census Data Center’s Geocorr 2022 tool to create a zip code-to-congressional district crosswalk and a county-to-congressional district crosswalk. Using those crosswalks, we assigned dual-eligible individuals to 119th congressional districts in the T-MSIS data.

In some cases, a county or a zip code can be split among multiple congressional districts. In those cases, enrollees were randomly assigned to a congressional district based on an allocation factor from the Geocorr 2022 tool that is calculated using the 2020 decennial census.

For each state, we calculated the percentage of people living in a zip code that aligned with a single congressional district and the percentage of people living in a county that aligned with a single congressional district. In most states, the zip code alignment was better, and we used the zip code crosswalk. In 9 states (AL, IA, KY, MS, MT, NC, NE, RI, and WV), the county alignment was better, so we used the county code crosswalk.

We applied the T-MSIS distributions of dual-eligible individuals by benefit status and congressional district to the CMS Medicare administrative enrollment data. Those data report monthly enrollment for dual-eligible individuals.

The sum of full-benefit and partial-benefit dual-eligible individuals enrolled may not add to total dual-eligible enrollment due to rounding. The sum of dual-eligible individuals across congressional districts may not add to state and national totals published in other KFF resources due to rounding.

This work was supported in part by Arnold Ventures. KFF maintains full editorial control over all of its policy analysis, polling, and journalism activities.

Women’s Experiences with Intimate Partner Violence

Published: May 6, 2025

Introduction

Intimate partner violence (IPV) is a persistent public health crisis that affects many women in the United States. IPV affects disproportionately affects women but also affects people of all genders. It has a wide range of negative effects on women’s physical and mental health, such as physical injuries, pregnancy complications, and substance use. IPV also has psychosocial impacts, affecting women’s safety, economic security and freedom, isolation, and ability to care for themselves and their children.

The 2024 KFF Women’s Health Survey provides data on women experiencing IPV in the past five years. This group includes women who said that in the past five years a current or former partner did at least one of the following: made them fear for their or their family’s safety, tried to control most or all of their daily activities, hurt them physically, forced them into sexual activity. However, this population does not include those who had experiences with IPV at earlier points in their lives or other forms of IPV and should not be used as an estimate of overall lifetime IPV prevalence Many women, particularly those who are older, may have experienced IPV prior to the last five years.

This analysis reports on a range of health topics affecting women who experienced IPV in the past five years, including their health care needs and use, barriers, and mental health. The impact on women who have been historically marginalized by society and health care systems, including those who are LGBTQ+, experience physical and mental disabilities, and those who are low-income is also examined. The survey was conducted from May 13 – June 18, 2024, online and by telephone among a nationally representative sample of 5,055 women ages 18 to 64.

Key Takeaways

  • One in five (19%) women ages 18 to 64 say they have experienced intimate partner violence (IPV) in the last five years. Higher shares of women with lower incomes, LGBT+ women, and those who identify as disabled report recent IPV.
  • Many women who have experienced IPV in the past five years contend with health challenges. Large shares characterize their physical (27%) and mental (46%) health as fair or poor. One in four say that a health condition keeps them from fully participating in work or other activities. Almost half of women who have experienced IPV in the past five years incurred a physical injury as a result.
  • Over one in ten (14%) women who have experienced IPV in the past five years say that at some point they did not receive health care services they needed related to IPV. Privacy concerns, fear, and intimidation are leading reasons why people experiencing IPV do not obtain health care.
  • There are differences in where women affected by IPV usually get health care. More than a third (35%) say their usual site of care is a clinic or health center. One in ten (9%) say it is the emergency room.
  • IPV is a major concern during women’s reproductive years. Among women who experienced IPV in past five years, four in ten said they experienced violence during their most recent pregnancy or in the year before or after the pregnancy.
  • Emergency contraception is an important back-up contraceptive for reproductive age women affected by IPV. One in five report using emergency contraception in the past year. One in ten also say they have obtained it since the Dobbs ruling in case they need it. These shares are approximately double the rates reported by women who have not experienced IPV in past five years.

Rates of IPV

One in five women ages 18 to 64 say they have experienced IPV in the past five years.

IPV presents in many forms, including physical, sexual, emotional, coercion, and online. The KFF Women’s Health Survey asked about a subset of IPV experiences that women have reported experiencing in the past five years. Approximately one in ten women say that in the past five years, a current or former partner has made them fear for their or their family’s safety (11%), tried to control most or all of their daily activities (11%), hurt them physically (9%), or forced them into sexual activity (9%) (Figure 1). In total, one in five (19%) women ages 18 to 64 said they have experienced at least one of these forms of IPV in the past five years.

Throughout this brief, this is the group referenced when discussing women who have experienced IPV.

One in Five Women ages 18 to 64 Report Experiencing Some Form of Intimate Partner Violence (IPV) in Past Five Years

Larger shares of women who are younger and have lower incomes consistently report experiencing IPV compared to those who are older and have higher incomes. Conversely, women who are Asian American or Pacific Islander report lower rates of IPV compared to women of other racial and ethnic groups. While women of all subpopulations experience IPV, rates are higher among some groups (Figure 2). More than one in four (27%) women who have lower incomes say they have experienced IPV in the past five years, about twice the share of those with higher incomes (14%). One in ten (9%) AAPI women report IPV in the past five years, which is lower than women of other racial/ethnic backgrounds.

One-third of women who are LGBT+ and one in four who identify as disabled report experiencing IPV in the past five years. Rates of all the IPV questions in the survey are higher among LGBT+ women compared to those who are not LGBT+ (Figure 2). Approximately one in five LGBT+ women said that in the past five years a current or former partner has made them fear for their or family’s safety (19%), tried to control most or all of their daily activities (20%), hurt them physically (18%), or forced them into sexual activity (18%). In total, twice as many LGBT+ women (32%) said they have experienced one of these forms of IPV in the past five years compared to non-LGBT+ women (16%). One in five women with a disability say they have feared for their or their family’s safety at the hands of a current or former partner (19%).  Overall, one in four (27%) women who identifies as disabled reports experiencing at least one form of IPV in the past five years.

Higher IPV Rates Among Women Who Are Black, Hispanic, Disabled, LGBT+, Have Lower Incomes. Rates are Lower Among Asian or Pacific Islander Women.

On average, women who have experienced IPV in the past five years have lower incomes and lower rates of private health insurance.

More than half (54%) of women affected by IPV in the past five years have low incomes, compared to one-third of those who have not (Figure 3). Insurance profiles also differ between women affected by IPV and those who have not, with a lower rate of private insurance coverage and higher rate of Medicaid coverage among those who have experienced IPV in the past five years compared to those who have not.  Almost half (45%) of women who have experienced IPV in the past five years have young children, and half (54%) are not married. This is in part a reflection of the fact that many women experience IPV at young ages.

More Than Half of Women Reporting IPV in Past Five Years Have Low Incomes and One-Third Are Covered by Medicaid

Women who have experienced IPV report higher rates of some health challenges, including disability and poorer health status. One in four women who have experienced IPV in the past five years rates their health as “fair” or “poor” (Figure 4). One in four (25%) also report having a chronic condition that keeps them from participating fully in work, school, or other activities. One in five (19%) say they identify as disabled. IPV may be a cause or contributor to these conditions or could exacerbate any of them.

One in Four Women Who Have Experienced IPV in Past Five Years Have a Health Condition that Limits Work, School and Activity

Health Care Access and Barriers

Women who have experienced IPV in the past five years have heavier reliance on clinics and emergency rooms for their health care. Just under half (47%) of women who have experienced IPV in the past five years say they usually get health care in a private doctor’s office, whereas this is the site of care for the majority (62%) of those who have not experienced IPV recently (Figure 5). Three in ten (31%) women who have experienced IPV in the past five years say they usually obtain health care at a neighborhood clinic or health center, and one in ten (9%) usually get care at an emergency room. These differences in site of care may be driven by income, given that women who have experienced IPV are disproportionately lower-income.

One in Ten Women Who Have Experienced IPV in Past Five Years Usually Seek Care in an Emergency Room

Almost half of women who have experienced IPV in the past five years incurred a physical injury as a result. Some of the most common injuries reported by people who experience IPV include head trauma, gynecologic conditions, and fractures. Overall, 45% of women who experienced IPV in the past five years say that their IPV experience resulted in physical injury, which translates to about one in ten (9%) among all women ages 18 to 64 (Figure 6). Among women who experienced IPV in the past five years, majorities of those who identify as having a disability (61%) and have lower incomes (52%) report having physical injuries from IPV. The shares are similar across White, Black, and Hispanic women.

Almost Half of Women Who Reported Experiencing IPV in Past Five Years Say They Had A Physical Injury As a Result

Over one in ten (14%) women who have experienced IPV in the past five years did not receive health care services they needed. Women who experience IPV may need a wide range of health care services related to the impact of IPV. However, 14% of women who recently experienced IPV were not able to get medical or mental health care services related to IPV (Figure 7). Three in ten women say they needed health care services and did obtain them, and more than half (56%) of women who experienced IPV in the past five years say they did not need health services related to their IPV experience.

Among Women Who Experienced IPV in Past Five Years, 14% Did Not Receive Health Care They Needed

Privacy concerns, fear, and intimidation are leading reasons why women experiencing IPV do not get care. People who experience IPV are typically dealing with multiple, complicated circumstances that can affect whether, when, and if they can disclose IPV and seek and obtain care. Among women who experienced IPV in the past five years and did not receive care that they needed, nearly six in ten (58%) say it is because they did not want anyone to find out (Figure 8). For some, fear of retribution from a partner is too high to seek care. Almost four in ten (37%) women who did not receive care say they feared the police or child protective services would get involved. Prior research finds that some women affected by IPV report that involvement of police authorities can backfire on them because they lose care of their children or are accused of crimes they did not commit. Health system barriers affect women experiencing IPV too. Almost four in ten (38%) say they could not afford to get care and one in ten (12%) say services were unavailable, which may be tied to their higher rates of uninsurance. Medical billing practices can make confidentiality challenging as violent partners may get a hold of billing statements and patient records.

Concerns About Privacy, Fear, and Intimidation Keep Many Women Experiencing IPV From Obtaining Needed Health Care

IPV and Mental Health Care

Violence, control, and coercion have severe negative effects on an individual’s mental health and well-being.  IPV is associated with higher rates of depression, anxiety, and substance use.  Mental health care has been identified as one of the essential health services needed for women affected by IPV.

Women who have been affected by IPV in the past five years have poorer self-reported mental health status and emotional well-being than those who have not. Almost half (46%) of women who have experienced IPV in the past five years describe their mental health and emotional well-being as “fair” or “poor,” twice the share of those who have not (Figure 9). Conversely, 42% of women who have not been affected by IPV in the past five years describe their mental health as “excellent” or “very good,” over twice the share of women affected by IPV (18%). Just over one-third of each group rates their health as “good.”

Nearly Half of Women Who Have Experienced IPV in Past Five Years Rate Their Mental Health as Fair or Poor

Many women encounter barriers to mental health care, particularly those affected by IPV. Among women who have experienced IPV in the past five year who rate their health as fair or poor, two-thirds (66%) say that in the past year they did not obtain mental health care they thought they needed. This is also the case for half (50%) of women with fair or poor mental health who have not experienced IPV recently.

IPV and Reproductive Health

IPV often begins during women’s reproductive years, and research has documented associations between IPV and several sexual and reproductive health challenges, including higher risk for sexually transmitted infections, inconsistent use of contraception, and high rate of unplanned pregnancies.

Among reproductive age women who experienced IPV and were pregnant in the past five years, four in ten say they experienced violence around the time of pregnancy. Pregnancy can be a risky period for people experiencing IPV, as some people report that violence increases or intensifies during and after pregnancy. Experiences with IPV have been linked with greater risk for negative maternal and fetal health complications, including preterm birth, low birthweight, as well as maternal and fetal death in the most severe cases.  Among women of reproductive age (18 to 49 years old) who were pregnant and experienced IPV in the past five years, one in five say they experienced IPV in the year prior to their last pregnancy (21%), during their most recent pregnancy (22%), and in the year after (20%). Overall, four in ten women of reproductive age who have experienced IPV say they experienced IPV during one of these periods (Figure 10).

Four in Ten Reproductive Age Women Who Report Experiencing IPV in Past Five Years Said They Experienced Violence Around the Time of Pregnancy

Among women who were pregnant in the past five years, a higher share of those who also experienced IPV (65%) said they needed mental health services during or within the first year after pregnancy, compared to those who were not affected by IPV (44%).

Eight in ten women of reproductive age who have experienced IPV in the past five years report using contraception in the past year. Preventing pregnancy is the leading reason for using contraception for this group, but one in five women who have experienced IPV in the past five years use it to prevent an STI.

The majority of reproductive age women who have experienced IPV, as well as those who have not, used contraception in the past year (Figure 11).  For most contraceptive methods, rates of use are similar between women who have experienced IPV in the past five years and those who have not. However, more women affected by IPV report using condoms (38%, 33% respectively) and withdrawal (32%, 21%) compared to those not affected by IPV, which is surprising given that these methods are controlled by men. One in four women affected by IPV report they have had a sterilization procedure, one in five use IUDs and one in five say they used EC. One notable difference is why women use contraception. One in five women who have experienced IPV in the past five years say they use it to prevent an STI, twice the share among women who have not experienced IPV in the past five years (9%).

Reproductive coercion, control by an intimate partner over reproductive health issues such as use of contraception or an abortion, is also a form of IPV. More than one in ten (13%) women who have experienced other forms of IPV in the past five years also report that a partner has tried to stop them from using contraception so they would become pregnant against their will (data not shown).

A Higher Share of Women Who Have Experienced IPV Report Using Contraception to Prevent Sexually Transmitted Infections

One in four reproductive age women who have experienced IPV in past five years says they or their partner made a change in contraception practices because of the overturning of Roe v. Wade. Since the 2022 Supreme Court ruling that overturned Roe v. Wade, many states have banned or severely restricted abortion access, which has prompted some people to make changes in their use of contraception. Overall, nearly twice as many women affected by IPV (26%) say they’ve made a change than those who have not recently experienced IPV (14%). In particular, 10% of reproductive age women who have experienced IPV in the past five year has obtained EC to have on hand in case they need it. Almost one in ten (8%) report starting contraception or switching to a more effective method (Figure 12).

One in Four Reproductive Age Women Who Have Experienced IPV in the Past Five Years Report Changing Contraceptive Practices Because of Overturn of Roe

U.S. Department of Health and Human Services Report on Pediatric Gender Dysphoria and Gender Conversion Efforts

Author: Lindsey Dawson
Published: May 6, 2025

On May 1, 2025, the Department of Health and Human Services (HHS) released Treatment for Pediatric Gender Dysphoria: Review of Evidence and Best Practices, a report issued following the Executive Order, “Protecting Children From Chemical and Surgical Mutilation,” which directed the HHS Secretary to publish an evidence review related to gender dysphoria in young people within 90 days.

Access to gender affirming care has becoming increasingly contested political territory in the United States. A growing number of states have laws that ban youth access (27 to date), and there are numerous legal challenges underway, including a case that is before the Supreme Court. The issue also figured prominently in the presidential election cycle, with President Trump campaigning on promises to end access to such care. The Executive Order and report are in line with a range of other executive actions that question evidence around gender affirming care, aim to limit access to these medical services, particularly for youth, and, in some cases, promote misinformation or deny the existence of transgender people.

The report states that it is a review of the evidence and best practice regarding information about treatment of gender dysphoria. Its main conclusion is that the quality of evidence on the effects of any intervention is low, and evidence on harms is “sparse.” Still the report cites what it identifies as significant risks of medical transition, marking a departure from most medical associations and widely used guidelines in the U.S. Instead, the report supports the use of psychotherapeutic approaches, including an approach termed “exploratory therapy”, which can include conversion therapy.

Shortly after its release, the review received criticism by researchers, advocates, and medical association for its methods, lack of alignment with current guidance, promotion of misinformation, support of certain practices, and decision not to disclose the authors. A particular concern was raised about the review’s support of “exploratory therapy” Other groups including the Christian legal advocacy group Alliance for Defending Freedom and the Center for American Liberty supported the review’s assessment.

This policy brief reviews the main points raised by the report regarding its emphasis on psychotherapy, and recommendations around “exploratory therapy”, which could include gender conversion practices, as well as the current legal and policy environment across the country.

What does the report say about psychotherapy as treatment for gender dysphoria and conversion practices?

Psychotherapy is one of five dedicated parts in the review and a theme that receives significant attention is support for gender identity conversion based practices, sometimes called “conversion” or “reparative” “therapy,” which the report calls “exploratory therapy.” The report counters this description stating that “equating ‘exploratory therapy’ with ‘conversion therapy’ is misguided and that equating any “approach focused on reducing a minor’s distress about their body or social role [with conversion therapy] is a problematic.” Other reasons provided include: pointing to Dutch practices, stating that all therapy is exploratory, and noting that the label “conversion therapist” is damaging.

Conversion practices aim to “suppress or alter an individual’s sexual orientation or gender to align with heterosexual orientation, cisgender identity, and/or stereotypical gender expression. [These]…efforts are premised on or motivated by the belief that diversity in sexual orientation and/or gender identity and expression is a deficit, mental illness, or pathology.” Major medical associations (described in detail below) in the U.S. conclude that conversion practices lack evidence and are, at best, unfair or ineffective and at worst, harmful. The United Kingdom’s Cass Review, like the HHS report, reviewed evidence around gender affirming care for minors and made recommendations to the National Health Service. While it ultimately led to restrictions on access to this care in the UK, in discussing psychotherapy, it stated “that no LGBTQ+ group should be subjected to conversion practice.”

The review describes “exploratory psychotherapy,” in part, as “trying to help children and adolescents come to terms with their bodies” and goes on to equate the distress related to gender dysphoria with general “discomfort with the sexed body or with societal sex-based expectations is common during puberty and adolescence.” This goes against identified best practice which encourages clinicans to recognize to recognize that transgender and gender non-conforming people “are more likely to experience positive life outcomes when they receive social support or trans-affirmative care.”

The report promotes therapeutic approaches as first line treatment and suggests that they can be an “alternative to endocrine and surgical interventions for the treatment of pediatric gender dysphoria.” This runs contrary to guidelines which suggest a range of approaches to gender affirming care, which is highly individualized, to be delivered as clinically appropriate. The review presents therapeutic modalities and describes how they can be applied to treat gender dysphoria, noting especially their potential to interrogate the wish for gender transition. For example, of psychodynamic therapy, the review states that this modality “can help patients gain deeper understanding of their personal identity, including any external factors that may contribute to their cross-sex identification and desire for medical/surgical interventions…”

The report, and the Executive Order, also question Standards of Care issued by the World Professional Association for Transgender Health (WPATH), which are widely relied on guidelines that providers look to in delivering evidence based best practice gender affirming care. These standards are regularly referenced by major medical associations including the American Psychological Association. While the report suggests that psychotherapy is not common in delivering gender affirming care to minors, psychological wellbeing is promoted within WPATH’s guidance. WPATH recommends “health care professionals working with gender diverse adolescents undertake a comprehensive biopsychosocial assessment of adolescents who present with gender identity-related concerns and seek medical/surgical transition-related care, and that this be accomplished in a collaborative and supportive manner.”

What is the aim of conversion efforts and what does evidence say about them?

Gender conversion practices are based on the premise that non-cisgender identities are a pathology and that transgender people would benefit from changing their gender identity. Medical evidence does not support this and, as noted below, most major medical associations have concluded that such interventions stand to cause harm. Yet, the efficacy of and ability to provide these services, due to local regulations, remains somewhat contested.

Research has shown that lifetime exposure to gender identity conversion efforts are associated with adverse mental health outcomes, including higher odds of depression, suicidality, and suicide attempts and substance abuse.

Where does the medical establishment stand on conversion practices?

Sexual orientation and gender identity have a long history of being pathologized, including in the mental health field. It was not until 1994 that “transsexualism” was removed from the Diagnostic and Statistical Manual of Mental Disorders (DSM) when it was replaced with “gender identity disorder.” This diagnosis was then replaced with “gender dysphoria” in 2013. Today, it is widely accepted by established medical groups that the full spectrum of sexual orientations and gender identities are not pathologies and do not need treatment. The American Academy of Pediatrics, for example writes “variations in gender identity and expression are normal aspects of human diversity, and binary definitions of gender do not always reflect emerging gender identities.” Rather, some gender diverse people experienced distress “caused by the body and mind not aligning and/or societal marginalization of gender-variant people.” Thus, care is typically provided to relieve distress, not to try to treat certain gender identities.

Broadly, gender affirming care is supported by practically all major medical associations in the U.S., including, the American Medical AssociationAmerican Academy of Pediatrics, and the American Psychological Association. It is also supported through guidance from the Endocrine Society and the World Professional Association for Transgender Health (WPATH).

Specifically, conversion approaches to gender dysphoria contrast with recommendations from these medical associations, which criticize conversion practices, stating that they lack evidence, are ineffective, and can create harm. In August 2023, 28 medical and mental health associations signed onto a joint statement opposing conversion practices. Additionally, many have provided independent statements addressing their concerns regarding these practices. For example:

  • An American Academy of Pediatrics (AAP) policy statement (reaffirmed in 2023) states that “reparative approaches have been proven to be not only unsuccessful but also deleterious and are considered outside the mainstream of traditional medical practice. The AAP described reparative approaches as ‘unfair and deceptive.’”
  • In a 2018 policy statement The American Academy of Child and Adolescent Psychiatry (AACAP) wrote of “conversion therapies” that “these interventions are provided under the false premise that homosexuality and gender diverse identities are pathological. They are not; the absence of pathology means there is no need for conversion or any other like intervention. Further, there is evidence that ‘conversion therapies’ increase risk of causing or exacerbating mental health conditions in the very youth they purport to treat…AACAP asserts that such ‘conversion therapies’ (or other interventions imposed with the intent of promoting a particular sexual orientation and/or gender as a preferred outcome) lack scientific credibility and clinical utility. Additionally, there is evidence that such interventions are harmful. As a result, ‘conversion therapies’ should not be part of any behavioral health treatment of children and adolescents.”
  • The American Psychological Association (APA) writes that “to consider …[gender identity change efforts (GICE)]…as therapies or treatments is inaccurate and inappropriate because, the incongruence between sex and gender in and of itself is not a mental disorder…so, any behavioral health or GICE technique or treatment that seeks to change an individual’s gender identity or expression is not indicated; thus, any behavioral health or GICE effort that attempt to change an individual’s gender identity or expression is inappropriate.”
  • National Association of Social Workers (NASW) states that “NASW upholds that sexual orientation, gender identity, and gender expression are real and irrefutable forms of identity. Thus, NASW condemns any and all forms of conversion practices, as they are harmful to the mental health and well-being of LGBTQIA2S+. These practices stand in direct conflict with NASW’s professional code of ethics, and these practices represent a significant risk of harm by subjecting individuals to forms of treatment.”

How common is it for transgender people to experience conversion practices?

While conversion practices are widely discredited, KFF polling finds that one-in-ten transgender adults report having attended “conversion” or “reparative” therapy that tried to change their sexual orientation or gender identity as a teen or child. Since the share is much lower among LGBT adults as a group (1%), it is likely that many of these experiences were aimed at gender identity. Similarly, the Trevor Project finds that “13% of LGBTQ+ young people reported being threatened with or subjected to conversion therapy.”

One in Ten Transgender Adults Attended "Conversion" or "Reparative" Therapy That Tried to Change Their Sexual Orientation or Gender Identity as a Teen or Child

As noted, while medical consensus is against the use of conversion practices, this matter has not been settled in the policy realm. States have increasingly stepped in to regulate the practice in clinical settings, with almost half banning it in full or in part. According to data from the Movement Advancement Project, currently:

  • 19 states and DC have bans on the practice of conversion therapy.
  • 4 states have a partial ban in their state (e.g. banning the practice among those with only certain licenses or banning the use of state funds in the provision conversion therapy).
  • 4 states prohibit local level bans on conversion therapy either via state law or a court ruling.
  • 19 states have no policy.

Beyond these state actions, some cities and counties have enacted policies prohibiting at least certain conversion practices.

Notably, states currently have the ability to regulate therapeutic practice and prohibit conversion efforts by certain mental health professionals but conversion efforts also take place within religious settings and those are not included in these prohibitions. KFF polling finds that 25% of transgender adults report that they attended religious services that tried to change their sexual orientation or gender identity as a child or teen.

The ability of states to ban conversion therapy will soon be reviewed by the Supreme Court, which, on March 10, 2025, granted certiorari in Chiles v. Salazar, a case challenging Colorado’s conversion therapy ban for minors. The state’s ban, which prohibits mental health professionals from attempting or purporting to change a minor’s sexual orientation or gender identity, was upheld by the Tenth Circuit Court of Appeals in September 2024. Chiles, a Christian counselor, has appealed this decision and asked the Supreme Court to review “whether a law that censors certain conversations between counselors and their clients based on the viewpoints expressed regulates conduct or violates the Free Speech Clause.” A decision in Chiles’ favor could limit the ability of states to regulate such practices.

This review could be used as support for other actions the administration seeks to take (some described here) aimed at limiting minor access to gender affirming care. With respect to therapeutic practices, it could shift how some practitioners approach gender affirming care or potentially provide support to those using conversion related approaches. The report could also fuel misinformation in other areas, particularly around regret rates and the share of transgender young people seeking a medical transition.

Access and Coverage for Mental Health Care for Women

Published: May 6, 2025

Mental health continues to be a growing area of health concern for people, with 90% of Americans saying there is a mental health crisis in the U.S. in a 2023 KFF-CNN poll. Women’s mental health often differs from men’s, with women experiencing some mental health symptoms more commonly than men but also conditions that are unique to women, such as perinatal and perimenopausal depression.

This brief analyzes data from the 2024 KFF Women’s Health Survey (WHS), a nationally representative survey of 6,246 adults ages 18 to 64, including 5,055 women and 1,191 men, conducted from May 15 to June 18, 2024. In addition to several topics related to reproductive health and well-being, the survey asked respondents about their mental health and their experiences accessing mental health services in the past year. This issue brief presents KFF WHS data on access to mental health services among women and men ages 18 to 64, and it also takes a closer look at mental health coverage among women. See the Methodology section for details.

Key Takeaways

  • Nearly three in ten women ages 18 to 64 (28%) describe their mental health or emotional well-being as “fair” or “poor”, including higher shares of women with low incomes (38%) and those who identify as LGBT+ (45%). Nearly three quarters of those who say they have a mental health-related disability (73%) report having “fair/poor” mental well-being.
  • Three in ten (29%) women say they received mental health services in the past 12 months. About half of women who describe their mental health as “fair/poor” say they received mental health care in the past year (48%). While eight in 10 ten women with a self-reported mental health-related disability (81%) say they received care, one in five did not.
  • Among women who report receiving mental health services, the most commonly reported services are one-on-one care with a provider, in-person (60%) and/or via telehealth (55%). Just over half of this group report receiving a prescription for medication (52%). Few women say they received care through a mental health therapy app (7% of those who report receiving services) or other services like in-patient hospitalization or group therapy (8%).
  • Four in ten women overall (38%) say it is difficult for women to get mental health services in their state. One-third (32%) of all women say they did not get mental health services despite needing them, citing barriers such as cost, stigma, or inability to get time off from work.
  • Among women who were able to get mental health care, half (50%) say it is difficult for women to access mental health services in their state, and more than half say they experienced barriers during care-seeking (55%). These challenges include trouble finding a provider that was accepting new patients (25%) or one that accepted their insurance (21%). The large majority of women with Medicaid say their most recent mental health care visit was covered completely by Medicaid (85%), whereas most women with private insurance had to pay some (48%) or all (14%) costs out-of-pocket.
  • Cost is a significant barrier to obtaining mental health services. More than one in ten women 18 to 64 (13%) say they did not get mental health care or could not continue to afford the mental health care they were receiving because of cost. More than twice as many women without insurance (29%) cite cost as a reason for not getting care.

Self-Described Mental Health

In general, slightly larger shares of women describe their mental health status as “fair” or “poor” compared to men (28% vs. 23%). Most women (72%) and men (77%) describe their mental health as either “good” or “excellent/very good” (Figure 1).

As other research has found, younger adults report mental health challenges at higher rates than older adults. Over one third of younger women ages 18 to 25 describe their mental health status as “fair” or “poor” (36%), compared to a smaller share of women ages 50 to 64 (21%). A higher share of 50 to 64 — about half (49%) – describe their mental well-being as “excellent” or “very good,” which is considerably higher than just three in ten (30%) younger women ages 18 to 25.

About 4 in 10 women (38%) who have low incomes (below 200% of the federal poverty level (FPL)) report fair or poor mental health status, nearly double the rate reported by those with higher incomes (21%). Nearly two times as many women who identify as LGBT+ (45%) say their mental health is “fair” or “poor” compared to those who do not identify as LGBT+ (24%). Not surprisingly, nearly three-quarters of women who identify as having a mental health-related disability (73%) say they have “fair” or “poor” mental health, three times the rate of those who do not identify as being disabled (24%) or who have another non-mental health disability (27%).

Nearly Three Quarters of Women Who Identify as Having a Mental Health-Related Disability Report Fair/Poor Mental Health

Mental Health Care Utilization

Not only do a slightly larger share of women than men report poorer mental health status, but compared to men, a somewhat larger share of women report receiving mental health care in the past 12 months (Figure 2). Roughly three in the ten women (29%) say they received mental health services from a mental health professional, compared to 22% of men.

Younger women are also more likely to use mental health services than older women. One in three women under the age of 50 say they received professional mental health care in the past year, compared to just 22% of women between age 50 and 64. Compared to their White counterparts (31%), smaller shares of Asian (19%) and Hispanic (24%) women say they received mental health care in the past year, consistent with previous mental health findings from KFF polling. Black (30%) and White women report obtaining mental health care at similar rates.

Consistent with the findings on self-described mental well-being, nearly twice as many women who identify as LGBT+ (45%) than those who do not (27%) say they received mental health care in the past 12 months. Similarly, eight in ten women who identify as having a mental health-related disability (81%) say they received mental health services, compared to 27% of women who identify as having another disability and 18% of women who do not identify as disabled.

Higher shares of women with lower incomes and those covered by Medicaid say they obtained mental health services compared to their higher income and privately insured counterparts. While mental health services can be very costly and private insurance coverage is often limited and associated with high out-of-pocket costs, Medicaid, a program designed for people with low incomes, typically has nominal or very low out-of-pocket costs for enrollees.

While use of mental health services is higher among many of the subpopulations that rate their mental health lower, still about half (48%) of women who rate their mental health as “fair” or “poor” say they obtained mental health care, suggesting that many women with “fair” or “poor” mental health who could benefit from care are not getting it. The survey also shows that mental health services are used by people across the mental health continuum. Three in ten (31%) women who rate their mental health as “good” and more than one in ten (13%) who describe it as “excellent” or “very good” say they received care in the past year.

Less Than Half of Women With Fair or Poor Mental Health Report Receiving Mental Health Services in the Past 12 Months

When asked what kind of mental health services they received in the past 12 months, most women who say they received care say they received 1-on-1 care with a provider, either in-person (60%) or via telehealth (55%). About half of women who say they received mental health care in the past year report getting a prescription for a medication (52%).

Fewer than one in ten women who report receiving care (7%) say they received care through a mental health therapy app, like BetterHelp or Talkspace, which connect patients to a clinician for virtual appointments but outside of the traditional medical system, or through another avenue (8%) such as inpatient hospitalization or group therapy (Table 1).

The types of mental health services women use vary by demographics. While similar shares of women across all age groups say they received in-person 1-on-1 care with a provider, larger shares of women ages 26 to 35 compared to women ages 50 to 64 say they used digital services for care, such as telehealth services (59% vs. 49%, respectively) and care through a mental health therapy app (8% vs. 3%, respectively). One in ten women ages 18 to 25 who say they received care say they received care through a mental health therapy app. There were no statistically significant differences by age for prescription medications and other mental health services.

Among those who report receiving mental health services in the past year, nearly six in ten (59%) women who rate their mental health as “fair” or “poor” report receiving a prescription medication, as do half (50%) of women who describe their mental health as “good” and more than a third (37%) of those who rate it as “excellent/very good.”

Among those who report receiving mental health care, larger shares of women who identify as LGBT+ than those are not LGBT+ say they accessed mental health care through telehealth service (65% vs. 52%) or through a mental health therapy app (12% vs 6%). More women who identify as LGBT+ also say they received a prescription for a medication compared to their non-LGBT+ counterparts (60% vs. 50%).

Over half of women say they received more than one type of mental health service in the past 12 months (58%). Higher shares of women with “fair” or “poor” mental health (65%) and/or who identify as having a mental health-related disability (73%) say they received more than one type of service in the past year.

Mental Health Services Used By Women 18 to 64

Coverage of Mental Health Services

While federal laws require parity for insurance coverage of mental health care, gaps in coverage remain. All state Medicaid programs provide coverage for mental health services for beneficiaries with low incomes, and the Affordable Care Act (ACA) requires most individual and small group insurance insurers to cover behavioral health care, which includes mental health services. However, the scope of coverage varies, provider networks are limited in many plans, and mental health providers may not accept all insurance plans or in some cases, any insurance.

The large majority of women with Medicaid coverage who access care say their most recent visit was completely covered by Medicaid (85%) (Figure 3). Of the remaining 15%, 4% say they received free services at a clinic or health center. Medicaid is the single largest payer of behavioral health services, which includes mental health care and substance use services. By design, Medicaid charges very little cost-sharing.

Most women with private insurance say they had to pay at least some out-of-pocket costs for their most recent mental health care. Nearly half (48%) paid some of the cost out-of-pocket while their insurance covered part of the cost and 14% paid the full cost out-of-pocket. About one in three (32%) women with private insurance say their most recent visit was completely covered by their insurance plan.

Only One Third of Women With Private Insurance Say Their Insurance Covered the Full Cost of Their Most Recent Mental Health Service

Barriers to Accessing Mental Health Care

Overall, four in ten women (38%) say it is difficult to access mental health services in their state, but this share rises to half (49%) among women who say they recently received mental health care in the past year (Figure 4).

Among Women Who Say They Received Mental Health Care in the Past 12 Months, Half Say It Is Difficult to Get Mental Health Services in Their State

One in three women (32%) say they did not get mental health services in the past year even though they needed them (Figure 5). More than one third of women younger than 50 say they did not get the care they needed compared to 22% of women 50 to 64. Four in ten uninsured women (40%) say they needed mental health care but did not get it, compared to 31% of women with private insurance. Half of women who identify as LGBT+ (50%) say they needed mental health care but did not get it, compared to three in ten who do not identify as LGBT+ (29%). Similarly, nearly half of women with a mental health disability (47%) say they did not get mental health care even though they needed it. More than half of women with “fair” or “poor” mental health did not get the care they say they needed (55%).

One in Three Women Say They Did Not Get Mental Health Services Even Though They Needed Them, Including Over Half of Those Who Describe Their Mental Health as Fair or Poor

When asked to indicate the reason(s) why they did not get the care they needed, many women say they did not get care because they felt better or dealt with their mental health issues by themselves (38%) (Figure 6). However, three in ten women who say they did not get needed care cite cost (32%), being unable to take time off from work or being too busy (29%), or feeling afraid, embarrassed, or ashamed to seek care (31%). A small share of women cites some other reason (8%), such as transportation barriers or challenges with reaching providers to coordinate a visit.

While Some Women Say They Dealt With Their Mental Health Themselves, Many Cite Cost, Time-off From Work, and Shame as Reasons They Did Not Receive Care

It is not uncommon for those who receive care to also experience challenges while trying to find care. Among women who received mental health care in the past 12 months, more than half (55%) say they experienced a barrier during their care seeking journey (Figure 7). One in four women who say they received care say they had trouble finding a provider that was accepting new patients (25%) and about one in five had trouble finding a provider that accepted their insurance (21%). One in four women who received mental health care in the past year say they had trouble scheduling an appointment in a reasonable amount of time (24%).

There were few differences between women of different subgroup, with the exception of higher shares of LGBT+ women experienced challenges getting mental health services (66%) compared to 52% of women who do not identify as LGBT+, including trouble finding a provider, and affording the cost. These findings reflect well documented shortages, burnout, and high demand among clinicians in the mental health profession.

More Than Half of Women Say They Experienced Barriers When Trying To Get Care

While only 5% of all women say they had difficulty finding a provider who spoke their language or one from a similar racial or ethnic background as themselves, these findings vary by race/ethnicity. Significantly larger shares of Hispanic (11%) and Black (8%) women report facing this challenge, compared to just 1% of White women (Figure 7). These findings are consistent with previous KFF polling, underscoring the additional and disproportionate challenges people of color face when accessing mental health care.

Larger Shares of Women of Color Say They Had Difficulty Finding a Mental Health Care Provider From a Similar Racial/Ethnic Background As Themselves

Cost continues to be a commonly reported barrier to mental health care. More than one in ten women 18 to 64 (13%) say they did not get mental health care or could not continue to afford the mental health care they were receiving because of cost (Figure 9). Thirteen percent (13%) of women with private insurance say they did not get care because of cost, and more than twice as many women without insurance (29%) cite cost as reason for not getting care. The share is lower among women with Medicaid, reflecting the program’s important role in providing access to mental health services, but still 8% cite cost as a barrier. The barriers are multi-pronged. Insurance networks can be very narrow for mental health care, and a significant portion of mental health clinicians do not participate in insurance networks. These findings on cost barriers underscore the ongoing challenges with affordable mental health care, especially among the uninsured, but even for those with coverage.

Cost Of Mental Health Services Is A Barrier to Care Especially For Uninsured Women, But Also For Those With Insurance
Poll Finding

KFF Tracking Poll on Health Information and Trust: Vaccine Safety and Trust

Published: May 6, 2025

Findings

Key Findings

  • As the Trump administration attempts to overhaul many government health agencies, the latest KFF Tracking Poll on Health Information and Trust finds that partisans’ trust in these agencies as sources of reliable vaccine information has shifted from where it stood under the Biden administration with trust declining among Democrats and rising among Republicans. While Democrats remain more likely than Republicans to trust the U.S. Centers for Disease Control and Prevention (CDC) and U.S. Food and Drug Administration (FDA), the share of Republicans who have a “great deal” or “fair amount” of trust in these agencies to provide vaccine information has increased by about 10 percentage points from 2023. Concurrently, trust in these agencies as reliable sources of vaccine information has fallen among Democrats by double digits, including for the CDC (70% now v. 88% in 2023) and the FDA (67% v. 86%).
  • Less than half of the public express confidence in government health agencies like the CDC and FDA to carry out many of their core responsibilities, including just three in ten (32%) who have confidence in them to act independently without interference from outside interests. Six in ten adults — including three in four Democrats and nearly half of Republicans — say these agencies are not paying enough attention to science when it comes to making decisions and recommendations about vaccines. In addition, at least three in ten say these agencies are paying “too much attention” to the beliefs of officials running the agencies (34%) and the interests of pharmaceutical companies (30%) when making vaccine-related decisions.
  • Most adults say they are at least “somewhat confident” in the safety of many routine vaccines, including those for measles (83%), the flu (74%), and — among adults ages 50 and older for whom these vaccines are recommended — pneumonia (82%) and shingles (79%). The public, however, remains less confident in the safety of the COVID-19 vaccine amid continued partisan disagreement. Just over half (56%) of adults say they are at least “somewhat confident” that the COVID-19 vaccines are safe, including nearly nine in ten Democrats (87%), about half of independents (55%), but just three in ten Republicans.
  • With the public split in their confidence of the safety of COVID-19 vaccines, the oft-politicized mRNA technology that many of these vaccines rely on remains obscure to much of the public. About twice as many adults think vaccines that use mRNA technology are “generally safe” (32%) as say they are “generally unsafe” (16%), but about half (52%) report not knowing enough about this technology to say. In addition, nearly half of the public (45%) report having heard the false claim that mRNA vaccines can alter a person’s DNA – a myth related to COVID-19 vaccines that began circulating early in the pandemic. While just 3% think this claim is “definitely true,” most are uncertain, saying it is either “probably true” (26%) or “probably false” (45%). However, there are important differences by party identification and ethnicity when it comes to believing or leaning toward believing the myth that mRNA vaccines alter DNA, with at least one-third of Republicans (37%), independents (33%), and Hispanic adults (38%) saying the claim is either “definitely true” or “probably true.”

Partisan Trust in Government Health Agencies and Officials as Reliable Sources of Vaccine Information

The latest Tracking Poll on Health Information and Trust finds that partisan trust in government health agencies on vaccines has shifted notably since the Biden administration, with trust declining among Democrats and rising among Republicans.

Overall, doctors remain the most trusted source of reliable vaccine information among the public with eight in ten adults (83%) saying they trust their doctor or health care provider a “great deal” or “fair amount” to provide reliable information about vaccines and a similar share (81%) of parents saying they trust their child’s pediatrician. Smaller shares of the public, but still a majority, say they trust government health agencies, including their local public health department (66%), the U.S. Centers for Disease Control and Prevention, or CDC (59%), or the U.S. Food and Drug Administration, or FDA (57%) to provide reliable information about vaccines. About half of the public (51%) say they trust pharmaceutical companies at least a “fair amount” as source of reliable vaccine information. Fewer than half of adults – or about four in ten – say they trust Health and Human Services Secretary Robert F. Kennedy Jr. (41%) or President Trump (37%) to provide reliable information about vaccines.

Doctors and Pediatricians Are the Most Trusted Sources of Vaccine Information Among the Public and Parents, While Fewer Than Half Trust Trump or RFK Jr. on Vaccines

The share of adults who say they have a “great deal” or “fair amount” of trust in the CDC and the FDA to provide reliable information about vaccines is similar to the share who said so in September 2023. However, this apparent stability masks some notable shifts in partisan trust amid a change in leadership at these agencies. Fewer Democrats – though still a majority — now say they have a “great deal” or “fair amount” of trust in the CDC (70% now v. 88% in 2023) and the FDA (67% v. 86%) to provide reliable information on vaccines. Conversely, the share of Republicans who express trust in these agencies has risen by about ten percentage points, with about half of Republicans now saying they trust the CDC (51% now up from 40% in 2023) and the FDA (52% v. 42%) to provide information on vaccines.

While Democrats are still more likely than Republicans to trust either the CDC or FDA as a source of vaccine information, the shifts in trust mark a notable reversal in partisan trends first observed during the start of the COVID-19 pandemic. In 2022, KFF tracking polls showed declining trust in government health agencies to provide information about COVID-19 vaccines – a change largely driven by declining trust among Republicans alongside consistently higher levels of trust among Democrats. More recent KFF polling has shown declining trust in government agencies to provide health information in general among the public, with trust declining among both Democrats and Republicans in some cases. The most recent uptick among Republicans and decline among Democrats in trust of the CDC and FDA may be a reflection of polarized views on the Trump administration’s efforts to overhaul government health agencies and shift vaccine policy and messaging, including the way vaccines are tested.

The Share of Democrats Who Trust the CDC and FDA as a Source of Reliable Vaccine Information Has Declined Significantly, While Republican Trust Has Risen

While individual doctors garner the highest shares of trust across partisan groups, there are partisan gaps in trust in nearly all sources of vaccine information. At least eight in ten Democrats, independents and Republicans say they trust their own doctor or health care provider “a great deal” or “fair amount” to provide reliable information about vaccines; however, Democrats are more likely than Republicans to say this (93% v. 78%). Similarly, while majorities of parents regardless of partisanship trust their child’s pediatrician at least a fair amount to provide reliable vaccine information, Democratic parents are more likely than Republican parents to say so (91% v. 73%). Notably, about one in four (27%) Republican parents say they trust their child’s pediatrician “not much” or “not at all” to provide reliable information about vaccines.

Beyond the CDC and FDA, there are additional divides in trust between Democrats and Republicans on the share who trust their local public health department (83% of Democrats v. 51% of Republicans), pharmaceutical companies (69% v. 39%), and among parents, their child’s school or day care (71% v. 33%). These partisan divides in trust are consistent with findings from previous KFF polling.

Republicans are much more likely than both independents and Democrats to say they trust President Trump and Health and Human Services Secretary Robert F. Kennedy Jr. as reliable sources of vaccine information. Three quarters of Republicans say they have a “great deal” or “fair amount” of trust in President Trump (74%) and Robert F. Kennedy Jr. (73%) to provide reliable information about vaccines. This is considerably larger than the share of independents and Democrats who say they trust either as reliable sources of vaccine information: 30% of independents and 10% of Democrats say they trust President Trump, while 35% of independents and 16% of Democrats say they trust Secretary Kennedy.

Notably, Republicans are as likely to say they trust President Trump and Secretary Kennedy as they are to say they trust their own doctor as a source of reliable vaccine information.

Interactive DataWrapper Embed

Confidence in Federal Government Health Agencies To Carry Out Responsibilities

Even as majorities of the public express trust in government health agencies to provide information on vaccines, less than half of the public express at least some confidence in agencies like the CDC and FDA to carry out many of their responsibilities, such as ensuring the safety and effectiveness of prescription drugs (46%) or to ensure the safety and effectiveness of vaccines approved for use in the U.S. (45%). About four in ten (42%) have confidence in government health agencies to respond to outbreaks of infectious diseases. Even fewer, or one-third (32%), express at least “some” confidence in government health agencies to act independently without interference from outside interests. Fewer than one in five adults say they have “a lot” of trust in these agencies to fulfill each of these tasks.

Fewer Than Half of the Public Express Confidence in Government Health Agencies To Ensure Safety of Prescription Drugs or Vaccines, Respond to Disease Outbreaks, or Act Independently

Less than half of Democrats, independents, and Republicans have at least “some” confidence in government health agencies to ensure the safety of prescription drugs, respond to infectious disease outbreaks, or act independently without outside interference. Democrats, however, are more likely than Republicans to say they have “some” trust in government health agencies to ensure the safety and effectiveness of vaccines (52% v. 43%). However, similar shares of Democrats and Republicans express confidence in these agencies to ensure the safety of prescription drugs, respond to infectious disease outbreaks, or act independently.

Across Partisanship, Half or Fewer Are Confident in Government Health Agencies To Carry Out Key Responsibilities, but Democrats Are More Likely Than Republicans To Express Confidence on Vaccine Safety

One reason behind a lack of confidence in government health agencies may be that most of the public, including larger shares of Democrats, say that under the Trump administration, government health agencies like the CDC and FDA are not paying enough attention to science when making decisions about vaccines. Six in ten adults say these agencies are not paying enough attention to science when making decisions about vaccines, while one-third say they are paying “about the right amount of attention” (34%) and fewer than one in ten say they pay “too much attention” to science (6%). The share of adults who now say government health agencies are not paying enough attention to science when making decisions about vaccines is higher than the share who expressed similar sentiments in September 2020, when just under half of adults said that under the Trump administration, the CDC and FDA were not paying enough attention to science when reviewing and approving treatments for coronavirus.

Health and Human Services Secretary Robert F. Kennedy Jr. has raised question about pharmaceutical companies’ influence and conflicts of interest within government health agencies, while Kennedy himself has faced criticisms over how his own views on vaccines might influence government policy. The public is split over whether government health agencies are paying the right amount of attention to pharmaceutical companies or the beliefs of officials running the agencies when making decisions about vaccines. Three in ten adults say government health agencies are paying “too much attention” to the interests of pharmaceutical companies and similar shares say they are paying “about the right amount of attention,” while four in ten say they are paying “not enough attention.” Adults are similarly divided over whether government health agencies are paying the right amount of attention to the beliefs of officials running these agencies, with similar shares saying they’re either paying “too much attention” (34%), “not enough attention” (36%) or “about the right amount of attention” (29%) when it comes to making decisions or recommendations about vaccines.

Six in Ten Adults Say Government Health Agencies Like the CDC and FDA Are Not Paying Enough Attention to Science

Democrats are much more likely than Republicans to say government health agencies like the CDC and FDA are not paying enough attention to science when making decisions about vaccines (73% v. 45%). On the other hand, Republicans are more than twice as likely as Democrats to say government health agencies are paying about the “right amount of attention” to the beliefs of officials running these agencies (45% v. 19%).

Most Democrats and Independents Say Government Health Agencies Are Not Paying Enough Attention to Science Compared to Just Under Half of Republicans

Confidence in Vaccine Safety and Views of mRNA Vaccines

A majority of the public continues to express confidence in the safety of most routine vaccines; however, nearly four years since they were first approved for use, views on the COVID-19 vaccines remain divisive and largely partisan, consistent with prior KFF polling.

At least three in four adults, including majorities across partisans, say they are either “very confident” or “somewhat confident” that vaccines for measles, mumps, rubella (83%) or the flu (74%) are safe. Among adults ages 50 and older – for whom the CDC currently recommends both the pneumonia and shingles vaccines – eight in ten say they think vaccines for pneumonia (82%) or shingles (79%) are safe, including majorities across partisans.

However, confidence in the safety of the COVID-19 vaccine is much lower than these other routine vaccines. About half (56%) of adults say they are at least “somewhat confident” that the COVID-19 vaccines are safe, including nine in ten (87%) Democrats compared to just three in ten Republicans. The share of the public and partisans who express confidence in the safety in the flu and COVID-19 vaccines has not changed notably since September 2023. For more information on the public’s views on measles and the MMR vaccines, see KFF’s prior release from the April Tracking Poll on Health Information and Trust.

Majorities Are Confident in the Safety of Many Routine Vaccinations, but the Safety of COVID-19 Vaccines Remain Divisive

Many of the COVID-19 vaccines – including other vaccines under development for diseases including cancer – rely on a vaccine technology known as messenger-RNA (mRNA). COVID-19 vaccines that use mRNA technology have been proven safe and effective but have long been the subject of misinformation and recently come under attack, with Republican legislators in some states recently attempting to ban or limit the use of mRNA vaccines and the National Institutes of Health (NIH) reportedly urging scientists to remove references to the technology from their grant applications.

The latest poll finds that while few adults think mRNA vaccines are unsafe, many say they don’t know enough about the technology to have an opinion. Overall, one-third (32%) of adults say vaccines that use mRNA technology are “generally safe” compared to about one in six (16%) who say they are “generally unsafe.” But at the same time, about half of the public (52%) say they do not know enough about this technology to say. At least one in five Republicans (23%) and independents (18%) say they think mRNA vaccines are “generally unsafe” compared to far fewer Democrats (3%), but still, most Republicans (61%) and roughly half of independents and Democrats say they do not know enough to say whether mRNA vaccines are safe or not.

At Least Half of the Public and Partisans Don’t Know Enough About mRNA Vaccines To Say Whether They Are Safe, Though Democrats Are Less Likely To Believe They Are Unsafe

Large shares of the public report having heard the false claim that mRNA vaccines alter your DNA – a persistent myth that began circulating early on during the COVID-19 pandemic — and while few think this is definitely true, most are uncertain. Exposure to and uncertainty surrounding this false claim has existed since early on in the COVID-19 pandemic, when KFF polling found that about one in five adults who had heard the claim believed or were unsure whether COVID-19 vaccines could change your DNA.

About half of the public (45%) say they have read or heard the false claim that mRNA vaccines can change your DNA, including about half of Republicans (48%) and independents (47%) and four in ten Democrats (38%). Exposure to the false claim also differs across race and ethnicity. About half (51%) of White adults say they have heard the myth that mRNA vaccines can alter DNA compared to fewer Hispanic adults (35%) and Black adults (27%).

About Half of the Public Say They Have Heard the False Claim That mRNA Vaccines Can Change Your DNA, Including Larger Shares of Republicans, Independents, and White Adults

With about half the public saying they have heard the myth that mRNA vaccines alter your DNA, just 3% of all adults say they think this claim is “definitely true,” and a quarter (24%) say it is “definitely false.” However, as previous KFF polling has found on a wide array of misinformation topics, most adults express uncertainty and fall in the “malleable middle” with seven in ten saying it is either “probably true” (26%) or “probably false” (45%) including majorities of Republicans and independents, and about half of Democrats.

While at least four in ten across party and race and ethnicity say they think this false claim is “probably false,” larger shares of Republicans, independents, and Hispanic adults believe or lean toward believing it, saying it is “probably true” or “definitely true.” Overall, three in ten adults say it is “definitely” or “probably true” that mRNA vaccines can change your DNA, but this increases to 37% of Republicans and one in three independents (compared to 13% of Democrats). About four in ten (38%) Hispanic adults believe or lean toward believing the myth that mRNA technology alters DNA, compared to about a quarter of White adults (28%) and Black adults (26%).

Large Majorities of the Public and Partisans Are Uncertain if the Myth That mRNA Vaccines Can Change Your DNA Is True

Believing or leaning toward believing the myth that mRNA vaccines can alter your DNA is tied to negative perceptions of the COVID-19 vaccines’ safety. Among those who say it is “definitely true” or “probably true” that mRNA vaccines change your DNA, a large majority (77%) say they are not confident that the COVID-19 vaccines are safe, including half (51%) who say they are “not at all confident.” While the vast majority of those who say it is “definitely false” that mRNA vaccines alter DNA in turn express confidence in the safety of the COVID-19 vaccines (86%), confidence drops among those who lean toward thinking this is false, with just six in ten (63%) of those who say this myth is “probably false” expressing confidence in the COVID-19 vaccine’s safety.

Adults Who Believe or Lean Toward Believing the Myth That mRNA Vaccines Alter Your DNA Largely Lack Confidence in the COVID-19 Vaccine's Safety

Methodology

This KFF Health Tracking Poll/KFF Tracking Poll on Health Information and Trust was designed and analyzed by public opinion researchers at KFF. The survey was conducted April 8-15, 2025, online and by telephone among a nationally representative sample of 1,380 U.S. adults in English (1,322) and in Spanish (58). The sample includes 1,022 adults (n=48 in Spanish) reached through the SSRS Opinion Panel either online (n=997) or over the phone (n=25). The SSRS Opinion Panel is a nationally representative probability-based panel where panel members are recruited randomly in one of two ways: (a) Through invitations mailed to respondents randomly sampled from an Address-Based Sample (ABS) provided by Marketing Systems Groups (MSG) through the U.S. Postal Service’s Computerized Delivery Sequence (CDS); (b) from a dual-frame random digit dial (RDD) sample provided by MSG. For the online panel component, invitations were sent to panel members by email followed by up to three reminder emails.

Another 358 (n=17 in Spanish) adults were reached through random digit dial telephone sample of prepaid cell phone numbers obtained through MSG. Phone numbers used for the prepaid cell phone component were randomly generated from a cell phone sampling frame with disproportionate stratification aimed at reaching Hispanic and non-Hispanic Black respondents. Stratification was based on incidence of the race/ethnicity groups within each frame. Among this prepaid cell phone component, 194 were interviewed by phone and 164 were invited to the web survey via short message service (SMS).

Respondents in the prepaid cell phone sample who were interviewed by phone received a $15 incentive via a check received by mail. Respondents in the prepaid cell phone sample reached via SMS received a $10 electronic gift card incentive. SSRS Opinion Panel respondents received a $5 electronic gift card incentive (some harder-to-reach groups received a $10 electronic gift card). In order to ensure data quality, cases were removed if they failed two or more quality checks: (1) attention check questions in the online version of the questionnaire, (2) had over 30% item non-response, or (3) had a length less than one quarter of the mean length by mode. Based on this criterion, no cases were removed.

The combined cell phone and panel samples were weighted to match the sample’s demographics to the national U.S. adult population using data from the Census Bureau’s 2024 Current Population Survey (CPS), September 2023 Volunteering and Civic Life Supplement data from the CPS, and the 2024 KFF Benchmarking Survey with ABS and prepaid cell phone samples. The demographic variables included in weighting for the general population sample are sex, age, education, race/ethnicity, region, civic engagement, frequency of internet use, political party identification by race/ethnicity, and education. The weights account for differences in the probability of selection for each sample type (prepaid cell phone and panel). This includes adjustment for the sample design and geographic stratification of the cell phone sample, within household probability of selection, and the design of the panel-recruitment procedure.

The margin of sampling error including the design effect for the full sample is plus or minus 3 percentage points Numbers of respondents and margins of sampling error for key subgroups are shown in the table below. For results based on other subgroups, the margin of sampling error may be higher. Sample sizes and margins of sampling error for other subgroups are available on request. Sampling error is only one of many potential sources of error and there may be other unmeasured error in this or any other public opinion poll. KFF public opinion and survey research is a charter member of the Transparency Initiative of the American Association for Public Opinion Research.

GroupN (unweighted)M.O.S.E.
Total1,380± 3 percentage points
Parents of children under 18457± 6 percentage points
Party ID
Democrats469± 6 percentage points
Independents466± 5 percentage points
Republicans361± 6 percentage points


News Release

As COVID-19 Divisions, Attacks, and Misinformation Take Their Toll, Less Than Half of the Public Is Confident That the CDC and FDA Can Carry Out Core Functions 

Under the Trump Administration, Democrats’ Confidence in Federal Agencies’ Vaccine Information Falls Sharply, While Republicans’ Trust Increases

Published: May 6, 2025

Five years after the start of  COVID-19 pandemic and the communications challenges, divisions, and false claims that followed, less than half of the public say they have at least some confidence in the federal government’s health agencies like the Centers for Disease Control and Prevention (CDC) and the Food and Drug Administration (FDA) to carry out many of their core responsibilities, a new KFF Tracking Poll on Health Information and Trust finds.The low levels of confidence apply to federal agencies’ ability to ensure the safety and effectiveness of prescription drugs (46% express at least some confidence) and vaccines (45%), and to respond to outbreaks of infectious diseases (42%). Even fewer (32%) express at least “some” confidence in the agencies to act independently without interference from outside interests. 

When it comes to vaccines specifically, close to six in 10 adults have at least “a fair amount” of trust in either the FDA (57%) or CDC (59%) to provide reliable information. That leaves about four in 10 who say they trust the two institutions “not much” or “not at all” when it comes to vaccines (43% for the FDA, 41% for the CDC).The overall level of trust in each case is similar to where it stood in September 2023, though the poll reveals significant partisan shifts as the second Trump administration and Health and Human Services Secretary Robert F. Kennedy Jr. have started to change vaccine policies and messaging.The shares of Democrats who say they trust the FDA and CDC have fallen by nearly 20 percentage points since 2023, while the shares of Republicans who trust each of the agencies have increased by about 10 points. While those shifts have narrowed a partisan divide on trust, Democrats remain more likely than Republicans to say they trust each agency’s vaccine information.

“There are remarkably low levels of trust in the nation’s scientific agencies, shaped by partisan perspectives, and that presents a real danger for the country if and when another pandemic hits,” KFF President and CEO Drew Altman said. 

Amid the Trump administration’s ongoing changes to vaccine policy that could affect COVID-19 vaccines relying on mRNA technology, the poll finds that nearly half (45%) of the public say they’ve heard or read about the false claim that the mRNA vaccines such as those used for COVID-19 can change their DNA. 

Very few (3%) say the false claim is “definitely true,” while a quarter (24%) say it is “definitely false.” Most are unsure, saying the claim is “probably true” (26%) or “probably false” (45%).

About a third (32%) of adults say vaccines that use mRNA technology are “generally safe” compared to about one in six (16%) who say they are “generally unsafe.” At the same time, about half of the public (52%) say they do not know enough about this technology to say. At least one in five Republicans (23%) and independents (18%) say they think mRNA vaccines are unsafe compared to far fewer Democrats (3%).

Other findings include:

  • Six in 10 adults (60%) say that under the Trump administration, federal health agencies are not paying enough attention to science. This includes most Democrats (73%) and independents (63%) but less than half of Republicans (45%).
  • Large majorities of the public are at least somewhat confident in the safety of most vaccines, including those for measles, mumps and rubella (83%), the flu (74%), and, among those ages 50 and older, pneumonia (82%) and shingles (79%). A narrower majority (56%) has confidence in the safety of COVID-19 vaccines, reflecting low confidence among Republicans (30%). 

The poll is part of KFF’s Health Information and Trust Initiative, which is aimed at tracking health misinformation in the U.S., analyzing its impact on the American people, and mobilizing media to address the problem. 

Designed and analyzed by public opinion researchers at KFF, this survey was conducted April 8-15, 2025, online and by telephone among a nationally representative sample of 1,380 U.S. adults in English and in Spanish. The margin of sampling error is plus or minus 3 percentage points for the full sample. For results based on other subgroups, the margin of sampling error may be higher.

Key Global Health Positions and Officials in the U.S. Government

Published: May 5, 2025

This tracker is updated periodically and currently reflects major positions known to be filled or likely to be retained thus far in the second Trump administration (other key roles will be added as filled). Some of the officials noted in this tracker may be on administrative leave and not performing the duties of their roles under direction from the Trump administration.

PositionOfficial
WHITE HOUSE/EXECUTIVE OFFICE OF THE PRESIDENT
National Security Advisor/Assistant to the President for National Security Affairs, National Security Council (NSC)Marco Rubio
Director, Office of National AIDS Policy (ONAP)Vacant
Director, Office of Management and Budget (OMB)Russ Vought
U.S. Trade Representative, Office of the United States Trade Representative (USTR)Jamieson Greer
Director, Office of Science and Technology Policy (OSTP)Michael Kratsios
Director, Office of Pandemic Preparedness and Response Policy (OPPR)Gerald Parker Jr.
DEPARTMENT OF STATE
Secretary of StateMarco Rubio
Permanent U.S. Representative to the United Nations, U.S. Mission to the United NationsMike Waltz (Designate)
Dorothy Shea
U.S. Global AIDS Coordinator and Senior Bureau Official for Global Health Security, Bureau of Global Health Security and DiplomacyJeffrey Graham
Principal Deputy Coordinator for PEPFAR, Bureau of Global Health Security and DiplomacyRebecca Bunnell
Principal Deputy Coordinator for Global Health Security & Diplomacy, Bureau of Global Health Security and DiplomacyJeffrey Graham
Director, Office of U.S. Foreign Assistance ResourcesJeremy Lewin
Principal Deputy Director, Office of Global Women’s IssuesKatrina Fotovat
Senior Bureau Official, Bureau of International Organization AffairsMcCoy Pitt
Assistant Secretary of State for Oceans and International Environmental and Scientific Affairs (OES)Tony Fernandes
Under Secretary for Civilian Security, Democracy, and Human RightsAlbert Gombis
Senior Bureau Official, Bureau of Democracy, Human Rights, and LaborRiley Barnes
Assistant Secretary of State for Population, Refugees, and MigrationAdam Zerbinopoulos
U.S. AGENCY FOR INTERNATIONAL DEVELOPMENT (USAID)*
AdministratorMarco Rubio
DEPARTMENT OF HEALTH AND HUMAN SERVICES (HHS)
SecretaryRobert F. Kennedy Jr. 
Assistant Secretary for Global Affairs, Office of Global Affairs (OGA)Vacant
Assistant Secretary for HealthDorothy Fink
Surgeon GeneralCasey Means (Designate)
Principal Deputy Assistant Secretary for Preparedness and Response, Office of the Assistant Secretary for Preparedness and Response (ASPR)John Knox
Director, Center for the Biomedical Advanced Research and Development Authority (BARDA), ASPRGary Disbrow
HHS/CENTERS FOR DISEASE CONTROL AND PREVENTION (CDC)
DirectorSusan Monarez
(Designate and Acting)
Principal Deputy DirectorVacant
Director, Office of Readiness and ResponseHenry Walke
Director, Washington OfficeJeff Reczek
Director, Global Health Center (GHC)Paige Alexandra Armstrong
Director, Division of Global Health Protection, GHCBenjamin Park
Director, Division of Global HIV and TB, GHCHank Tomlinson
Director, Global Immunization Division, GHCJohn Vertefeuille
Director, Division of Parasitic Diseases and Malaria, National Center for Emerging and Zoonotic Infectious Diseases (NCEZID)Simon Agolory
Director, Influenza Division, National Center for Immunization and Respiratory Diseases (NCIRD)Vivien Dugan
HHS/NATIONAL INSTITUTES OF HEALTH (NIH)
DirectorJay Bhattacharya
Director, National Institute of Allergy and Infectious Diseases (NIAID)Jeffrey Taubenberger
Director, Office of Global Research, NIAIDJoyelle Dominique
Director, Division of AIDS, NIAIDCarl Dieffenbach
Director, Division of Microbiology and Infectious Diseases (DMID), NIAIDEmily Erbelding
Director, Vaccine Research Center, NIAIDTed Pierson
Director, Office of AIDS Research (OAR); NIH Associate Director for AIDS ResearchGeri Donenberg
Director, Fogarty International Center (FIC); NIH Associate Director for International ResearchKathleen Maletic Neuzil
Director, Center for Global Health, Office of the Director, National Cancer InstituteSatish Gopal
Director, Office of Global Health, Office of the Director, National Institute of Child Health and Human DevelopmentVesna Kutlesic
Director, Center for Global Mental Health Research, National Institute of Mental HealthLeonardo Cubillos
HHS/FOOD & DRUG ADMINISTRATION (FDA)
CommissionerMarty Makary
Deputy Commissioner for Policy, Legislation, and International AffairsGrace Graham
Associate Commissioner for Global Policy and StrategyMark Abdoo
HHS/HEALTH RESOURCES AND SERVICES ADMINISTRATION (HRSA)
AdministratorThomas Engels
Associate Administrator, Bureau of HIV/AIDSHeather Hauck
Director, Office of Global Health, Office of Special Health InitiativesMelissa Ryan Kemburu
DEPARTMENT OF DEFENSE (DoD)
SecretaryPete Hegseth
Assistant Secretary of Defense for Health Affairs, Personnel and Readiness (P&R)Keith Bass (Designate)
Steve Ferrara
Commander, Naval Medical Research Command (NMRC)Franca Jones
Director, DoD HIV/AIDS Prevention Program (DHAPP)Brad Hale
Commander, Walter Reed Army Institute of Research (WRAIR)Eli Lozano
Director, U.S. Military HIV Research Program (MHRP)Julie Ake
Chief, Armed Forces Health Surveillance Division (AFHSD)Richard Langton
Chief, Global Emerging Infections Surveillance (GEIS), AFHSDVacant
OTHER AGENCIES AND DEPARTMENTS
Peace Corps*: DirectorAllison Greene
Council of the Inspectors General on Integrity and Efficiency*: Chair, Pandemic Response Accountability CommitteeMichael Horowitz
Council of the Inspectors General on Integrity and Efficiency*: Executive Director, Pandemic Response Accountability CommitteeKenneth Dieffenbach
Department of Agriculture (USDA): SecretaryBrooke Rollins
Environmental Protection Agency (EPA)*: Assistant Administrator for International and Tribal AffairsVacant
Department of Homeland Security (DHS): Chief Medical OfficerHerbert Wolfe
Department of the Treasury: Special Inspector General for Pandemic RecoveryVacant
Notes: * indicates an independent or quasi-independent agency. Acting officials in italics. Officials who the White House has signaled it intends to nominate or who are formally awaiting Senate confirmation are noted as “Designate.” tbd means to be determined. As of May 2, 2025. Also see NIH/FIC, Global Health Initiatives at NIH, available at: https://www.fic.nih.gov/Global/Global-Health-NIH/Pages/institute-center-ics-global-health.aspx.