Make American Health Care Affordable Again

Author: Larry Levitt
Published: Jun 5, 2025

In this JAMA Health Forum column, Larry Levitt highlights how the Make America Healthy Again agenda aimed at chronic disease does little to address the affordability of health care and that efforts to lower federal spending on health care may worsen the problem, raising out-of-pocket costs for many people with Medicaid and Affordable Care Act coverage.

Allocating CBO’s Estimates of Federal Medicaid Spending Reductions and Enrollment Loss Across the States: House Reconciliation Bill

Published: Jun 4, 2025

Note: KFF’s analysis was updated on July 1, 2025 to include Wisconsin in the allocation of spending reductions due to the work requirement provision and to include Delaware in the allocation of spending reductions due to changes in state-directed payments (see Methods).

On May 22, the House passed a reconciliation bill, the One Big Beautiful Bill Act. The Congressional Budget Office’s (CBO) latest cost estimate shows that the bill would reduce federal Medicaid spending by $793 billion and that the Medicaid provisions would increase the number of uninsured people by 7.8 million. Previous CBO estimates show that 10.3 million fewer people would be enrolled in Medicaid. Building on prior KFF analysis, this analysis allocates CBO’s federal spending reductions and enrollment losses across the states. The Medicaid reconciliation provisions are numerous and complicated, but the majority of federal savings stem from work requirements for the expansion group, increasing barriers to enrolling in and renewing Medicaid coverage, and limiting states’ ability to raise the state share of Medicaid revenues through provider taxes.

This analysis allocates the CBO’s estimated reduction in federal spending across states based on KFF’s state-level data and where possible, prior modeling work; and shows the federal spending reductions relative to KFF’s projections of federal spending by state under current law. KFF allocates the spending reductions provision-by-provision, pulling in a variety of data sources on which states are estimated to be most affected by each provision (see Methods). The analysis then uses KFF’s state-by-state estimates of reduced federal spending to allocate the reduction in Medicaid enrollment across the states. KFF only includes provisions expected to reduce Medicaid enrollment in that component of the analysis (see Methods).

This analysis does not predict how states will respond to federal policy changes, and anticipating how states will respond to Medicaid changes is a major source of uncertainty in CBO’s cost estimates. Instead of making state-by-state predictions, CBO generates a national figure by estimating the percent of the affected population that lives in states with different anticipated types of policy responses. For example, different states might choose to implement a work requirement with reporting requirements that are easier or harder to comply with. In estimating the costs of the legislation, CBO assumes that in aggregate, states would replace half of reduced federal funds with their own resources in response to provisions that reduce the resources available to states, such as limits on provider taxes. For provisions that reduce enrollment but don’t affect the division of costs between the federal and state governments, such as work requirements, CBO estimates that the federal and state governments would share those savings. However, those assumptions reflect states’ responses as a whole and are likely to vary and may not apply in all states.

To the extent that states’ responses are far different from the overall average response, changes in federal Medicaid spending and Medicaid enrollment will be larger or smaller than what is shown here. States could make further Medicaid cuts, which would result in enrollment loss and spending reductions greater than is estimated here and further reduce states’ Medicaid spending. Alternatively, states could increase their spending on Medicaid to mitigate the effects of federal cuts, which could result in enrollment loss and spending reductions that are smaller than is estimated here.  This analysis illustrates the potential variation by showing a range of spending and enrollment effects in each state, varying by plus or minus 25% from the CBO estimated midpoint.

Key Take-Aways

  • After accounting for CBO’s estimated interactions, KFF estimates that the House-passed reconciliation bill would reduce federal Medicaid spending by $793 billion. (Without accounting for interactions, the total is $863 billion, see Methods).
  • The five biggest sources of Medicaid savings in the House-passed reconciliation bill sum to $736 billion in savings, which is 85% of the uninteracted total, and include:
  • Mandating that adults who are eligible for Medicaid through the ACA expansion meet work and reporting requirements ($344 billion),
  • Repealing the Biden Administration’s rule simplifying Medicaid eligibility and renewal processes ($167 billion),
  • Establishing a moratorium on new or increased provider taxes ($89 billion),
  • Revising the payment limit for state directed payments ($72 billion), and
  • Increasing the frequency of eligibility redeterminations for the ACA expansion group ($64 billion).
  • Provisions that would only apply to states that have adopted the ACA expansion account for $427 billion, roughly half of the total amount of federal spending reductions.
  • Federal cuts to states of $793 billion over 10 years would represent 12% of federal spending on Medicaid over the period. By state, the cuts range from 5% in Wyoming and Alabama to 17% in Washington.
  • CBO’s estimated 10.3 million loss of Medicaid enrollment in 2034 represents 12% of projected enrollment in that year. The most heavily affected states include Washington and Virginia where Medicaid enrollment could decrease by 26% and 21%, respectively.
CBO Estimates of Potential Federal Medicaid Cuts in the House Reconciliation Bill
Federal Medicaid Cuts From the House Reconciliation Bill, By State
Estimated Medicaid Enrollment Loss From the House Reconciliation Bill, By State

Methods

Data: This analysis uses the latest data available from various data sources to illustrate the potential impact of a $793 billion cut to federal Medicaid spending across states. Data sources include:

Estimating Total Federal Funding Reductions After Interactions: CBO’s cost estimate provided the reduction in federal outlays for Medicaid provisions, which summed to $863 billion not accounting for interactions. (KFF summed CBO’s estimated changes in outlays and not budget authority. The analysis does not include associated reductions in federal revenues associated with the Medicaid provisions, which reflect reduced federal income taxes stemming from a small number of people who would newly have private health insurance after losing Medicaid.) The Medicaid provisions are part of the Energy and Commerce title of the bill, which was estimated to reduce federal outlays by $982 before accounting for interactions and $902 billion after accounting for interactions. KFF assumed that 88% of the reduction in outlays due to interactions was attributable to Medicaid because the Medicaid provisions accounted for 88% of the overall reduction in outlays. The interaction reduced the effects of the Medicaid provisions by $70 billion so the total estimated reduction in Medicaid spending is $793 billion.

Allocating Federal Funding Reductions Across States: This analysis allocates the ten-year federal Medicaid cut across states as follows:

  • Changes that would affect the Affordable Care Act (ACA) expansion group, including work requirements, were allocated across expansions states proportionally to federal spending on people eligible through the ACA expansion in FY 2024.
    • Wisconsin is a non-expansion state, but adults eligible for Medicaid through their waiver could be subject to the work requirements provision. KFF estimated the percentage of spending that was Wisconsin’s “ACA-equivalent” by comparing the percentage of total federal spending that paid for adults ages 19-64 who were not eligible on the basis of disability in Wisconsin to that of other non-expansion states (24% and 11% respectively). KFF assumed that the “extra” spending on adults in Wisconsin comprised the state’s “ACA-equivalent” spending.
  • Ending the increased share of federal spending for states that adopt the Medicaid expansion in future years is allocated across the states that had not adopted the expansion as of May 2025, proportionally to total federal spending.
  • Reducing expansion FMAP for certain states providing payments for health care for undocumented immigrants is allocated across the states that offer state-funded coverage for people regardless of immigration status proportionally to federal spending on people eligible through the ACA expansion in FY 2024.
  • Changing the requirements for state-directed payments was allocated across states that have state-directed payments in place in FY 2024 (according to KFF’s budget survey), proportionally to KFF’s estimates of federal spending on managed care in FY 2023 (which are calculated using total managed care spending in FY 2023 divided by the federal percentage of Medicaid spending in FY 2023).
  • Waiving the uniform tax requirement for Medicaid provider taxes is similar to a recent proposed rule that would require changes to provider taxes in California, Massachusetts, Michigan, and New York. Thus, 50% of the CBO estimate for this provision was allocated to those states. The remainder of the CBO estimate was allocated proportionally to federal spending on managed care among states that have taxes on Medicaid managed care organizations in FY 2025.
  • Reducing the maximum home equity limit was allocated based on federal spending for Medicaid enrollees who used long-term care in 2021 (the most recent year of data) among states that have home equity limits greater than $1 million as of 2025.
  • All other provisions were allocated across states proportionally to their share of federal spending in FY 2024.

For all estimates, the federal share of spending in FY 2024 is estimated using a 90% match rate for the ACA expansion group and the FY 2024 traditional federal match rates plus a 1.5 percentage point increase for the first quarter of FY 2024 (accounting for the final phase out quarter of the pandemic-era enhanced federal match rate) for the remaining eligibility groups.

Estimating Enrollment Effects: CBO’s estimated enrollment effects are allocated across the states proportionally to states’ estimated reduction in federal funding. However, only provisions that are estimated to reduce Medicaid enrollment are included in this allocation. The allocation includes the following provisions:

  • Provisions for which 100% of the spending reduction reflects enrollment loss: Sections 44101-14104, 44108 – 44111, 44122, 44131, 44141; and
  • Provisions for which 50% of the spending reduction reflects enrollment loss and 50% of the spending reduction is expected to stem from other changes such as reduced Medicaid benefits and lower payment rates to providers: Sections 44107, 44131 – 44135, 44142.

Limitations: This analysis allocates the CBO’s estimated reduction in federal spending and coverage across states based on KFF’s state-level data and where possible, prior modeling work. The most significant limitations of this approach are as follows.

1. CBO’s estimated reduction in federal spending is distributed across states based on the policies they had in place at the time of enactment and their Medicaid spending in the most recent year for which data were available (usually FY 2024). The analysis does not account for future changes in state Medicaid policy. For example, the analysis does not account for the enrollment effects in states that had not expanded the ACA as of FY 2025 but would have done so in future years.

2. The analysis does not attempt to predict state behavior and to the extent that states respond in ways that differ greatly from the expected national effects, the spending estimates or enrollment estimates may be outside of the range reported in this analysis.

Which Federal Agencies Make Medicare Work and How Were They Affected by Recent Changes Made by the Trump Administration?

Published: Jun 4, 2025

At the start of each administration, U.S. presidents often use their executive authority to reorganize the federal government in ways that reflect their priorities, and in his second term in office, President Trump is no exception. The Trump administration’s actions include sweeping reorganizations and large-scale staff reductions at virtually every department in the federal government, including a “dramatic restructuring” within the U.S. Department of Health and Human Services (HHS) and changes at other agencies that have responsibilities for various aspects of the Medicare program.

Medicare, the program that provides health coverage to more than 68 million adults ages 65 and older and younger people with disabilities, is administered primarily by the Centers for Medicare & Medicaid Services (CMS), an agency within HHS, but a number of other federal agencies within and outside of HHS, such as the Social Security Administration, the U.S. Department of Justice, and the U.S. Department of Treasury also play key roles in supporting the operations of the Medicare program.

While both President Trump and Speaker Johnson have vowed to not cut Medicare benefits, it is not clear how the reorganizations, staff reductions, resignations and retirements, along with budget cuts within these federal agencies will impact the administration of the program, or have spillover effects on coverage and benefits for people with Medicare.

This brief highlights some of the key federal agencies and offices that play a role in making Medicare work and, to the extent possible, describes the recent staffing and organizational changes that could affect the operations of Medicare in the future, based on publicly available information. Data related to staff reductions are likely to be conservative to the extent that they do not take into account employees who resigned as part of the “Fork in the Road” deferred resignation program or other voluntary departures or resignations, including early retirements, leaving unfilled positions within their respective offices. The information may also not reflect some number of employees who were let go and then asked to return to work, and do not account for potential increases in staff if federal courts intervene.

Centers for Medicare & Medicaid Services (CMS)

CMS, a federal agency within HHS, administers the Medicare program. CMS functions as an insurance payer and regulator, implementing and enforcing laws that affect Medicare beneficiaries, health plans, and providers, including approximately 380,000 Medicare-certified providers (such as hospitals and skilled nursing facilities), 1.5 million physicians and non-physician practitioners, and dozens of private insurers offering Medicare Advantage and Part D drug plans.

Within the scope of its statutory authority, CMS sets provider payment rates, makes coverage decisions, and coordinates benefits for beneficiaries. Its Center for Medicare serves as the central office for these policies and operations. Through its Center for Clinical Standards & Quality, CMS develops and enforces quality and safety standards that providers must meet in order to participate in the Medicare and Medicaid programs. The agency also contracts with State Survey Agencies to enforce nursing home standards and, through its Center for Program Integrity, works on efforts to combat fraud and abuse—often in collaboration with other entities, such as the HHS Office of Inspector General and the Department of Justice.

Through its Innovation Center, CMS implements various health care and service delivery models designed to improve the quality and affordability of patient care and reduce health care costs. Additionally, through its Medicare-Medicaid Coordination Office, CMS works with states and other entities to coordinate and streamline the delivery of Medicare and Medicaid benefits for people with both types of coverage (known as dual-eligible individuals). Further, the CMS Office of Minority Health has undertaken efforts to advance health equity in Medicare and other programs, such as the rural health initiative.

CMS is also responsible for consumer information and protections, including managing the 1-800-MEDICARE helpline, distributing the Medicare & You handbook, and supporting the Medicare Beneficiary Ombudsman, which assists beneficiaries with complaints, grievances, appeals, and other Medicare-related inquiries.

Many of these CMS activities are subject to notice-and-comment rulemaking, a process that involves review by the White House’s Office of Management and Budget (OMB).

Recent staffing and organizational changes within CMS

According to a March 27, 2025 HHS document, CMS has reduced its workforce by 300 federal employees since the start of the Trump administration—about 4% of its staff. At the time, the agency did not clarify whether this figure includes employees who voluntarily accepted buyouts or elected early retirement. The Trump administration’s FY 2026 budget justification for CMS, released May 30, 2025, estimates 192 fewer full-time equivalent employees (FTEs) compared to FY 2025. The document acknowledges that these FTE levels are subject to change per the planned HHS reorganization.

While HHS has not publicly disclosed how these staffing reductions were distributed across CMS offices, media reports indicate that affected staff include those from the Medicare-Medicaid Coordination Office (about a third of its staff), Office of Minority Health (closure of the entire office), Office of Equal Opportunity and Civil Rights (entire office), and the Office of Program Operations and Local Engagement. Additionally, HHS eliminated half of its 10 regional offices—including those in Boston, Chicago, New York City, San Francisco, and Seattle—which serve 22 states and include CMS division offices. These regional offices enable HHS to maintain closer contact with state, local, and tribal governments in implementing HHS programs and policies, and develop and maintain partnerships with local organizations, including beneficiary coalitions and professional associations. According to an op-ed by HHS Secretary Robert Kennedy, their functions will be transferred to HHS’ remaining regional offices and staff in Washington D.C.

Further, the Trump administration proposes in its FY 2026 HHS budget to shift the 340B Drug Pricing Program from the Health Resources and Services Administration (HRSA) to CMS. The 340B Program requires drug manufacturers participating in Medicaid to provide discounts on outpatient prescription drugs to certain safety net providers that treat low income and uninsured patients.

Social Security Administration

The Social Security Administration (SSA) plays a central role in determining Medicare eligibility and enrolling individuals into the program. In 2021, SSA enrolled 3.8 million new Medicare beneficiaries, including one in seven (14%) who qualified for Medicare on the basis of receiving Social Security Disability Insurance benefits. SSA also handles automatic deductions of monthly Medicare Part B (and in some cases, Part D) premiums from Social Security benefit payments, and receives data from the Internal Revenue Service to determine income-related monthly adjustment amounts for higher-income beneficiaries.

SSA also provides support to low-income Medicare beneficiaries by processing applications for the Medicare Part D Low-Income Subsidy (also called “Extra Help”), which helps to cover Part D premiums and cost sharing for nearly 14 million Medicare beneficiaries with limited incomes and resources. The agency then sends Extra Help eligibility data to state Medicaid programs to initiate enrollment into the Medicare Savings Program, which helps to cover Medicare premiums and, in many cases, cost sharing, for more than 10 million low-income Medicare beneficiaries. Finally, SSA is responsible for processing name changes, and, along with CMS, can mail Medicare replacement cards. Disruptions to these administrative processes can affect beneficiary access to care, for example, by resulting in claims denials.

Recent staffing and organizational changes at SSA

The Social Security Administration announced plans to reduce its workforce by 7,000 federal employees (roughly 12% of its workforce) and to eliminate 6 of its 10 regional offices. According to the agency, the 7,000 employees will include a limited number of employees offered buyouts and voluntary retirement. In addition, the agency issued (and later rescinded) a proposal that would have reduced access to its national 1-800 number by requiring individuals, including those applying for Medicare, to verify their identities in person. This proposal prompted significant phone wait times and additional strain on the agency’s website, resulting in slowdowns and crashes, according to media reports. Although the proposal was withdrawn, it highlighted the potential negative implications of changes to the agency’s operations on older adults and people with disabilities, including Medicare beneficiaries.

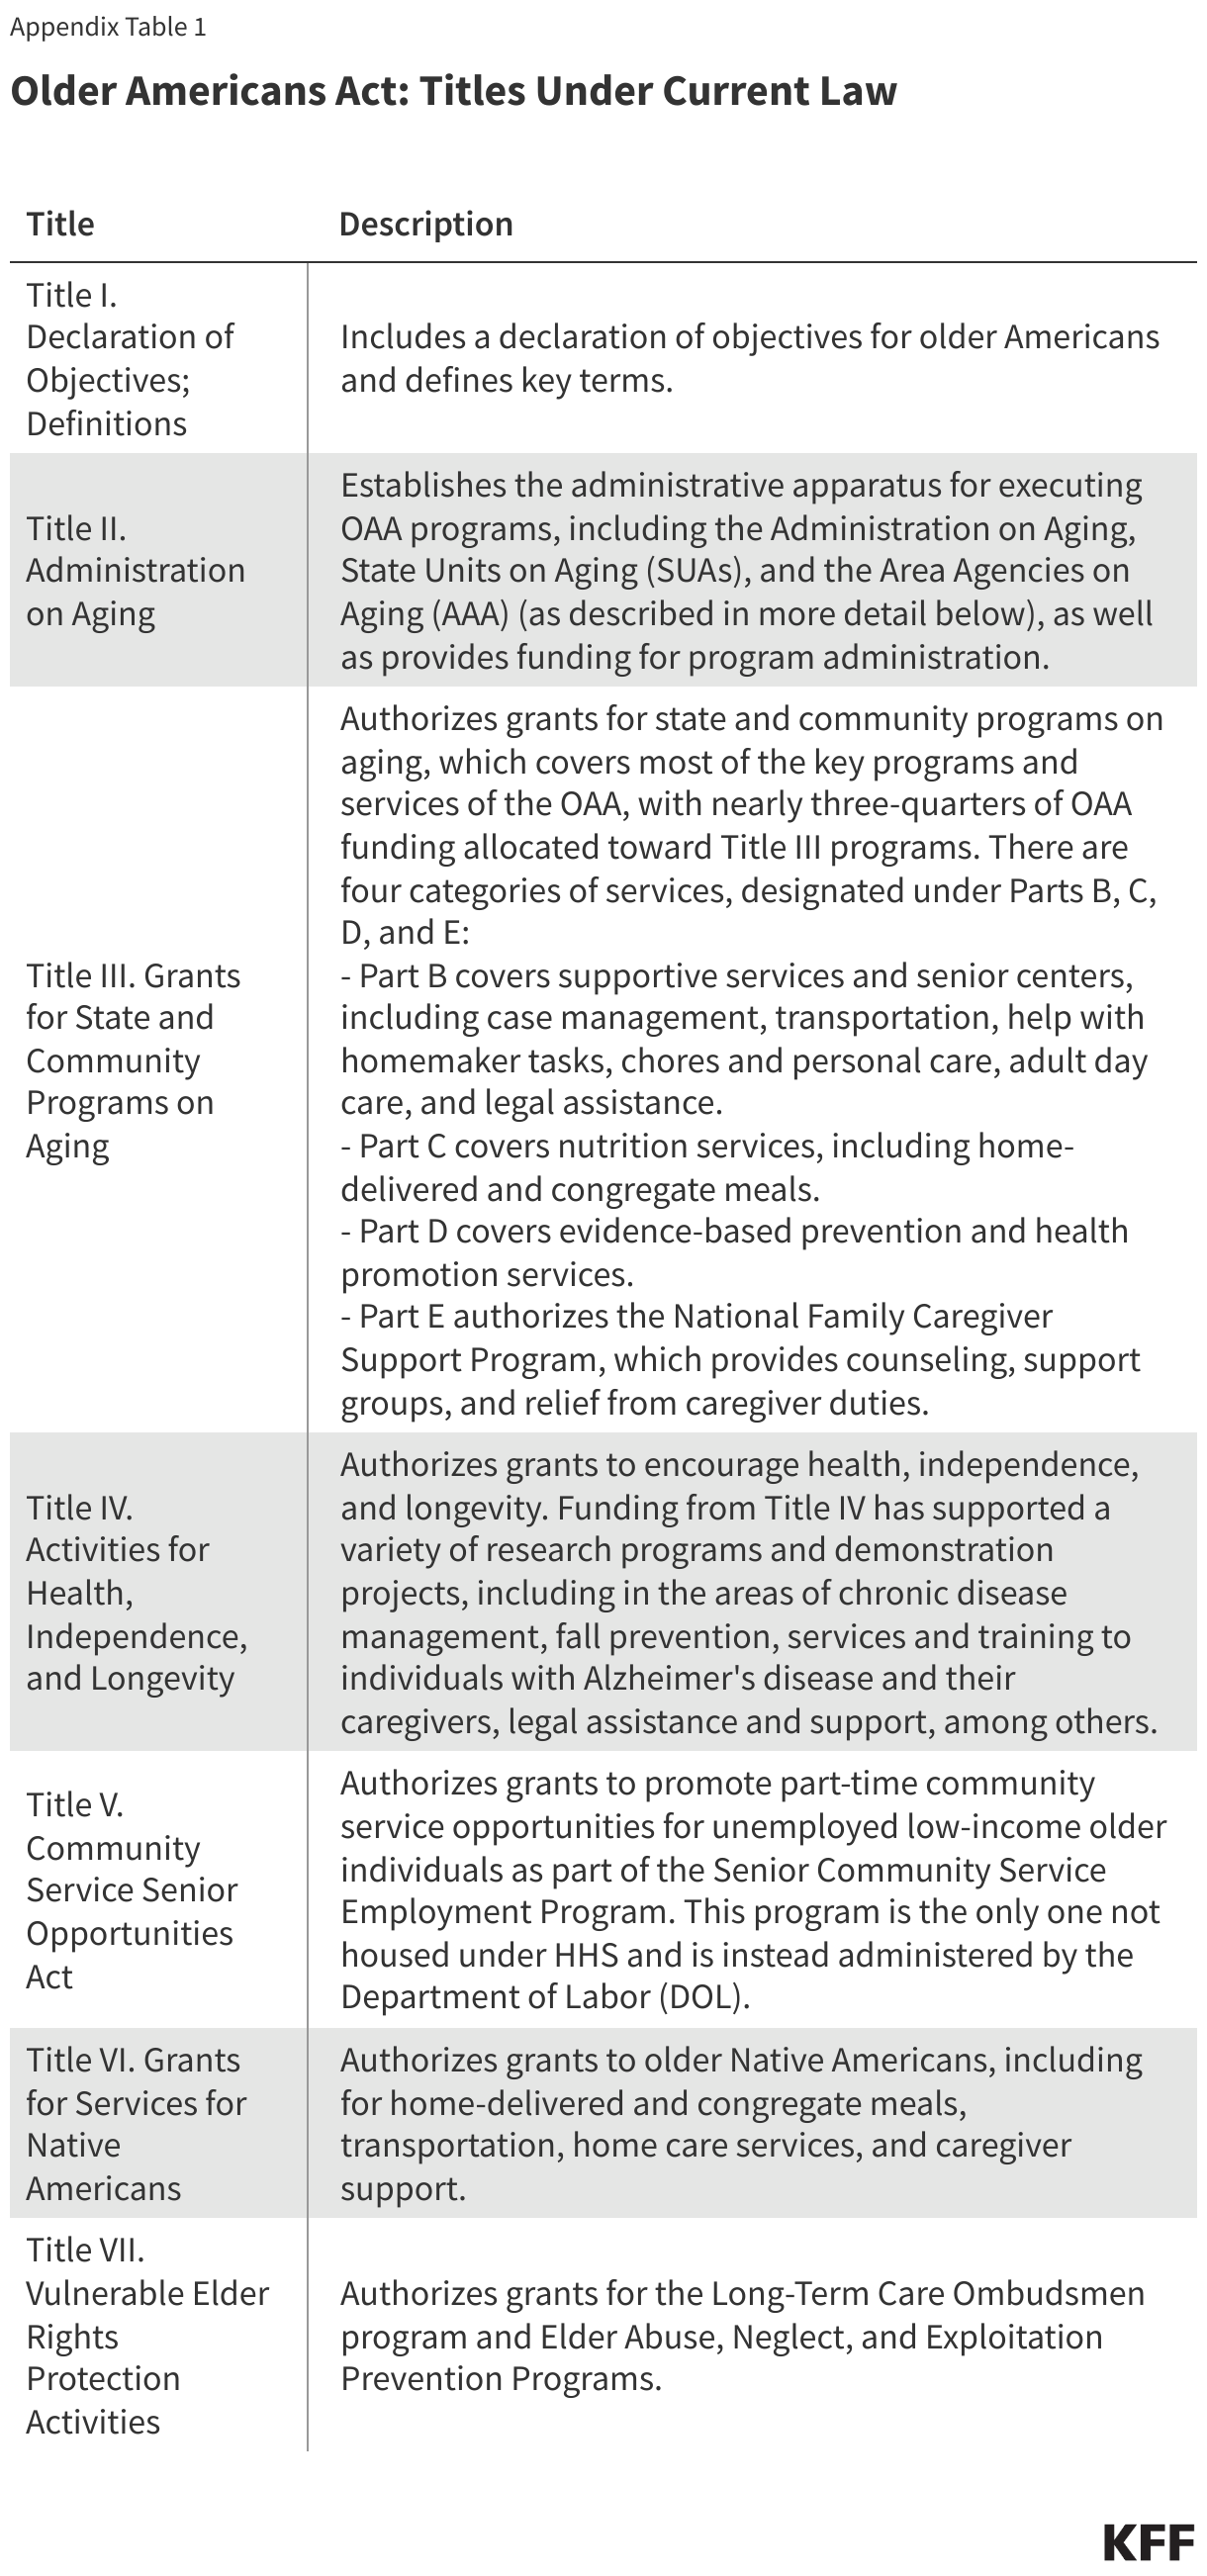
The Administration for Community Living (ACL): Through its Administration on Aging, ACL has administered programs under the Older Americans Act, a federal law that funds community social services for older adults, such as home-delivered and congregate meals, family caregiver support, the Long-Term Care Ombudsman program, and the National Center on Elder Abuse. Additionally, the ACL has administered:

  • The State Health Insurance Assistance Program (SHIP), which provides one-on-one counseling, outreach, and education to Medicare beneficiaries. More than 4 million Medicare beneficiaries, their families, and caregivers received one-on-one counseling from SHIPs in 2022.
  • The Senior Medicare Patrol program (SMP), which helps Medicare beneficiaries detect and report health care fraud, errors, and abuse. In 2023, 2 million people were reached through educational and outreach events under the SMP, with Medicare recovering more than $100 million in fraudulent claims (separate from recoveries under other fraud and abuse activities).

HHS announced that ACL will be dissolved, and the programs it administers will be absorbed into a newly-established Administration for Children, Families, and Communities. During the recent HHS staffing changes, four in 10 (40%) staff at ACL were either laid off or offered early retirement and buyouts to leave the agency, according to media reports.

The Assistant Secretary for Planning and Evaluation (ASPE): ASPE advises the HHS Secretary on various health policy matters, including analyzing issues to support the Secretary’s role as Trustee of the Medicare Trust Funds; supporting the Physician-Focused Payment Model Technical Advisory Committee; and providing analyses on several Medicare policy areas, including prescription drugs (e.g., the Medicare Drug Price Negotiation Program), federal spending on Medicare Advantage plans, and the impact of the CMS Innovation Center models and the Medicare Shared Savings Programs on Medicare spending and quality. Additionally, ASPE issues the annual U.S Federal Poverty Guidelines, which are used to determine eligibility for various federal programs including Medicaid, the Medicare Savings Program, and the Medicare Part D Low-Income Subsidy program.

HHS plans to merge ASPE with the Agency for Healthcare Research and Quality (AHRQ), the Office of Research Integrity, and the National Center for Health Statistics (formerly in the CDC) to create a new Office of Strategy. About 70% of ASPE’s 140 staff members have either been laid off or offered buyouts and early retirement during the recent staffing changes, according to reports in the media, but the President’s FY 2026 budget justification for HHS estimates 91 FTEs for planning and evaluation within the new Office of Strategy. AHRQ, which oversees the largest survey on U.S health care expenditures, including Medicare, and manages CAHPS, a set of survey tools used by Medicare Advantage and other plans to measure patient experience, reportedly laid off about half of its staff, according to media reports.

HHS Office of Inspector General: The HHS OIG is an independent body that oversees HHS’s programs with a focus on preventing and reducing waste, fraud, and abuse, including in Medicare. Its activities include auditing health care providers and grantees (e.g., reviewing diagnoses submitted by Medicare Advantage plans for use in CMS’ risk adjustment program), collaborating with the Department of Justice to operate the Health Care Fraud and Abuse Control Program (HCFAC), and enforcing penalties against entities that have been convicted of violations. In FY 2023, efforts by the HCFAC program returned nearly $1 billion to the Medicare Trust Funds.

At the HHS OIG, the Trump administration fired the former HHS Inspector General as well as other Inspectors General in January. It is unclear how many of HHS OIG’s 1,600 staff were laid off or accepted buyouts or early retirements during the recent HHS layoffs.

Newly-created Assistant Secretary for Enforcement: As part of the restructuring within HHS, a new Assistant Secretary for Enforcement has been created to oversee four existing offices: 1) Office of Medicare Hearings and Appeals, which handles disputes and appeals raised by Medicare beneficiaries and providers related to coverage and payments, 2) the Departmental Appeals Board, which provides a final administrative review of disputed Medicare claims, 3) the HHS Office for Civil Rights, which enforces various federal civil rights laws (e.g., the Age Discrimination Act) and HIPAA rules, and 4) the Office for Human Research Protections, which protects the rights of individuals who volunteer for biomedical and behavioral research. The Office of Medicare Hearings and Appeals currently adjudicates approximately 46,000 appeals annually, while the Departmental Appeals Board oversaw nearly 13,000 cases at the end of 2024.

Other HHS offices: In addition to the agencies and offices listed above, there are other offices that support Medicare operations, such as the HHS Office of the General Counsel, which provides legal counsel and supports enforcement and compliance functions in Medicare and other federal programs.

Other Federal Agencies Beyond HHS

The Department of Justice (DOJ): The DOJ supports Medicare in various ways, including representing and defending HHS in litigations, such as lawsuits challenging the Medicare drug price negotiation program and a case against Medicare Advantage plans alleging unlawful kickbacks and discrimination. Through its Health Care Fraud Unit, the DOJ enforces anti-fraud and abuse laws. In FY 2023, efforts by the Health Care Fraud and Abuse Control Program—a joint effort between DOJ and HHS OIG—resulted in nearly $1 billion transferred to the Medicare Trust Funds.

Additionally, the DOJ’s Antitrust Division, in coordination with the Federal Trade Commission, enforces federal antitrust laws that address anticompetitive practices among health care providers and within the Medicare Advantage program.

An internal memorandum proposes a major overhaul at the DOJ but does not mention changes or staffing reductions in the Department’s Health Care Fraud Unit or Antitrust Division.

The U.S Treasury Department: The U.S Treasury manages two trust fund accounts with $1 trillion in revenue that finance Medicare: the Hospital Insurance Trust Fund and the Supplementary Medical Insurance Trust Fund. In addition, the Internal Revenue Services (IRS), an agency within the Treasury Department, provides income data to the Social Security Administration to help determine income-related monthly adjustments for Medicare Part B and Part D premiums. The Treasury also helps to administer the Medicare Secondary Payer program, which outlines the circumstances in which private or other health insurance plans serve as the primary payer and Medicare acts as the secondary payer for beneficiaries with other forms of health insurance.

The Treasury Department is expected to eliminate approximately 20% of its workforce, according to a report submitted to the U.S. Office of Personnel Management (OPM) and obtained by the media. It is unclear whether, or how, these cuts would affect the oversight and investment of the Medicare Trust Funds.

Administration Releases Additional Details of Fiscal Year 2026 Budget Request

Published: Jun 4, 2025

On May 30, 2025, the administration released additional details of its Fiscal Year 2026 budget request, including more specific information on funding for global health activities at the State Department, U.S. Agency for International Development (USAID), Centers for Disease Control and Prevention (CDC), and the National Institutes of Health (NIH). The proposed budget includes significant reductions in global health funding including the elimination of some programs and activities as follows:

State/USAID:

  • Global Health Programs (GHP) Account: The main account that supports global health programs totals $3.8 billion in the request, $6.2 billion below the FY 2025 amount ($10.0 billion).
  • Funding for Bilateral Programs:
    • Reducing Funding: The request provides funding for HIV/AIDS, tuberculosis (TB), malaria, polio, and global health security (GHS), but at significantly reduced levels (see table below), except for polio, which is maintained at the prior year level.
    • Eliminated Funding: The request eliminates bilateral funding for family planning & reproductive health (FP/RH), the Global Health Workforce Initiative (GHWI), maternal and child health (MCH; except for polio), neglected tropical diseases (NTDs), nutrition, and vulnerable children.
  • Funding for Multilateral Organizations:
    • The Global Fund to Fight AIDS, Tuberculosis and Malaria (Global Fund): The request does not include a specific funding amount for the Global Fund in FY 2026, but states that funding can be provided through either the GHP account or the newly created “America First Opportunity Fund” (A1OF) and that the amount provided cannot exceed 20% of total contributions during the 8th Replenishment for a total of up to $2.4 billion over the three year period.
    • Eliminated Multilateral Funding: The request eliminates funding for Gavi, the Vaccine Alliance (Gavi), the Pan American Health Organization (PAHO), the United Nations Children’s Fund (UNICEF), the United Nations Population Fund (UNFPA), and the World Health Organization.

Centers for Disease Control and Prevention (CDC):

  • CDC’s Global Health Center: The request eliminates CDC’s Global Health Center and funding for most of its bilateral programs.
    • Maintained Programs & Funding: The request maintains funding for “Disease Detection & Emergency Response” at the prior year level ($293 million), but places it under CDC’s “Crosscutting Activities and Program Support”. The request also continues support for “Parasitic Diseases and Malaria,” placing it under “Emerging and Zoonotic Infectious Diseases,” but does not specify a funding amount.
    • Eliminated Funding: The request eliminates funding for global HIV/AIDS, global tuberculosis, global immunizations (which includes polio), and parasitic diseases.

National Institutes of Health (NIH):

  • Fogarty International Center (FIC): Eliminates FIC, which was funded at $95 million in FY2025.
  • Global Research: While detailed funding amounts are not yet available, the request proposes significant cuts to NIH research funding, which will likely affect global research.

Additional Resources:

Summary Table: KFF Analysis of Global Health Funding in the FY 2026 Budget Request by Program Area
Detailed Table: KFF Analysis of Global Health Funding in the FY 2026 Budget Request by Department / Agency and Program Area

Early Indications of the Impact of the Enhanced Premium Tax Credit Expiration on 2026 Marketplace Premiums

Published: Jun 3, 2025

Every summer, health insurers submit rate filings to state regulators detailing expectations and justifying premium rate changes for ACA-regulated health plans for the coming year. With the enhanced premium tax credits set to expire at the end of 2025, consumers can expect increases in how much they pay for coverage.

KFF examines 23 early insurer premium filings from Vermont, Oregon, Washington, and Washington, DC, which include an additional 4 percent increase in premiums, on average, due to the expected expiration of the credits. While not a complete picture and insurer responses differ, these filings provide early insights into how insurers are expecting premiums to change in 2026.

This analysis is available through the Peterson-KFF Health System Tracker, an online information hub dedicated to monitoring and assessing the performance of the U.S. health system.

U.S. Global Health Legislation Tracker

Published: Jun 3, 2025

This tracker provides a listing of global health-related legislation being considered by the 119th Congress (Jan. 3, 2025 – Jan. 3, 2027). Currently, there are 19 pieces of legislation related to global health. They address topics ranging from global health security to reproductive health to the World Health Organization (WHO). Sometimes a bill may address broader topics, but this tracker focuses on the global health aspects of the legislation.

The tracker includes the bill title, sponsor(s), current status, and topic, as well as a short description of its global health-related provisions. The tracker includes bills only; resolutions are not included. Legislation is listed in alphabetical order by short title. In certain cases, identical bills have been introduced in both chambers of Congress (often referred to as companion bills). For example, the Global Health, Empowerment and Rights Act and the WHO is Accountable Act were each introduced in both chambers. Such companion bills are listed separately in the tracker.

The tracker will be updated periodically.

Global Health Legislation During the 119th Congress  (as of May 28, 2025)

What to Know About the Older Americans Act and the Services it Provides to Older Adults

Published: Jun 3, 2025

Since the enactment of Medicare and Medicaid in 1965, the federal government has played a central role in providing support to older adults and people with low incomes, with health insurance coverage under Medicare for those 65 and older and Medicaid for those with low incomes, including older adults. The Older Americans Act, enacted that same year, is perhaps lesser known than Medicare and Medicaid but also provides important support for older adults through a broad range of community-based social services programs, including home-delivered and congregate meals, transportation services, caregiver support, chronic disease prevention services, and the Long-Term Care Ombudsman program. These programs and services may face some disruption, however, in light of the Trump administration’s organizational changes and staffing reductions at the Department of Health and Human Services (HHS), which houses the Administration for Community Living (ACL), the agency that has administered the programs and services authorized by the Older Americans Act.

According to a recent HHS press release, ACL is releasing over $1 billion of Fiscal Year (FY) 2025 funding for Older Americans Act programs to state, local, and Tribal grant recipients – funds that had already been appropriated by Congress but withheld by the Trump administration. At the same time, the Trump administration recently announced a restructuring within HHS, including budget cuts for several divisions and layoffs of 10,000 employees, with the stated goal of saving money and reducing inefficiencies. As part of this effort, the President’s proposed HHS FY 2026 budget outlines the Trump administration’s plans to dissolve ACL and integrate its functions within a newly established Administration for Children, Families, and Communities (ACFC).

The reorganization and staffing reductions at HHS create some uncertainty about the potential effect on older adults that could result from dissolving the agency at the center of administering programs and services authorized under the Older Americans Act. While the Trump administration generally can make organizational changes of this nature at federal agencies, Congress typically has the final say in determining agency funding levels and appropriating funds. The most recent reauthorization of the Older Americans Act in 2020 appropriated funds through FY 2024, with funding for FY 2025 provided through continuing resolutions at FY 2024 levels.

With the changes to ACL and other restructuring at HHS as context, this brief provides an overview of programs and services provided under the Older Americans Act, the role that was played by ACL in administering Older Americans Act programs, and trends in Older Americans Act program funding and service utilization by older adults.

What programs and services are provided under the Older Americans Act?

The Older Americans Act was signed into law in 1965 with the goal of providing older adults with home and community-based social services to support independent living as long as possible. Unlike Medicaid, the Older Americans Act does not have explicit income criteria used to determine who can qualify to receive services funded under the Act. Instead, the law aims to support people age 60 and older with the greatest economic or social need, including older adults with limited English proficiency and older individuals at risk for institutional placement.

The Older Americans Act authorizes grants from the federal government to states to provide community social services to older adults and established the Administration on Aging, an office within ACL, to administer these grant programs. The scope of Older Americans Act programs has been expanded over time and now includes home-delivered and congregate nutrition services, transportation services, state Long-Term Care Ombudsman programs, elder abuse prevention, caregiver support, elder rights and legal assistance, employment training, chronic disease prevention, and several other activities. Through this wide array of programs and thousands of service providers across states, territories, and Tribal organizations, the Older Americans Act serves millions of older adults each year.

The Older Americans Act statute includes seven titles that describe the administration and funding of the programs (Appendix Table 1). Most of the funding for Older Americans Act services falls under Title III of the Act, which authorizes grants for state and community programs on aging to provide:

  • supportive services and senior centers, including case management, transportation, help with homemaker tasks, chores and personal care, adult day care, and legal assistance,
  • nutrition services, including home-delivered and congregate meals,
  • evidence-based prevention and health promotion services, and
  • the National Family Caregiver Support Program, which provides counseling, support groups, and relief from caregiver duties.

Separately, the law also provides funding for grants to encourage health, independence, and longevity, including research programs and demonstration projects in the areas of chronic disease management and fall prevention, for example; grants to promote part-time community service employment opportunities for unemployed low-income older individuals; grants for the provision of nutrition, supportive services, and caregiver support services to older American Indians, Alaska Natives, and Native Hawaiians; grants for the Long-Term Care Ombudsman program and Elder Abuse, Neglect, and Exploitation Prevention Programs, and funding for Aging and Disability Resource Centers. (Most but not all of these programs have been administered by the Administration on Aging within ACL; the community service program is administered by the Department of Labor, while Aging and Disability Resource Centers have been administered by the Center for Innovation and Partnership within ACL.)

How is the Older Americans Act administered and what has been the role of ACL?

Under the organizational structure that existed prior to the Trump administration’s restructuring at HHS, the Administration on Aging within ACL was the office that authorized Older Americans Act grant funds to 56 State Units on Aging and hundreds of Tribal organizations. The State Units on Aging are state- and territorial-level agencies that use funds to carry out policy and development responsibilities and the administration of Older Americans Act activities. The State Units on Aging in turn work with and distribute funding to over 600 local Area Agencies on Aging, which operate within a designated planning area within the state or territory. The Area Agencies on Aging are local entities that either directly, or through contracts with nearly 30,000 local service providers, oversee a system for the delivery of Older Americans Act services.

While not part of the Older Americans Act, the State Health Insurance Assistance Program (SHIP) has also been administered by ACL through its Office of Healthcare Information and Counseling. The SHIPs provide local, in-depth, and objective counseling and assistance to Medicare beneficiaries and their families to help them make informed decisions about their care and benefits. There are 54 SHIPs, organized at the state and territory level, which may have different names in different areas. SHIP staff and volunteers provide unbiased one-on-one counseling, information, and education about Medicare benefits, how Medicare works, different Medicare coverage options, low-income assistance programs, and other types of information. The provision of SHIP services is free and not limited by income or other beneficiary demographic criteria.

How many people are helped by Older Americans Act programs?

Millions of older adults are helped by programs funded by the Older Americans Act each year – one in six, according to HHS. Focusing in on programs and services funded under Title III, which represent nearly three-quarters of total Older Americans Act funding in FY 2024, more than 12 million individuals were served by select Title III programs in FY 2023 (the most recent year available), according to data from ACL (Figure 1).

Millions of Older Adults Receive Services Provided Under the Older Americans Act

Among the programs funded under Title III of the Older Americans Act, the number of older adults served and services provided in 2023 include:

  • Nutrition counseling and education: Nearly 2 million individuals received some type of nutrition counseling and education, including 1.9 million individuals who received nutrition education to support food and nutrition choices, with 2.8 million education sessions provided, and 23,000 individuals who received nutrition counseling, which includes one-on-one counseling provided by a registered dietitian who provides options and methods for improving nutrition, with 37,000 hours of nutritional counseling provided.
  • Meals: Well over 1 million older adults benefited from home-delivered or congregate meals provided through the Older Americans Act, including 1.3 million who received home-delivered meals and 1.3 million who received congregate meals, with 181 million home-delivered meals and 57 million congregate meals provided to these individuals.
  • Case management: 413,000 older adults received case management services, such as developing care plans, coordinating services among providers, and conducting follow-ups as needed, with 3 million hours of case management provided to these individuals.
  • Legal assistance: 216,000 individuals received legal assistance, including legal advice and counseling, with 1 million hours of legal assistance provided.
  • Homemaker services: 116,000 people received homemaker services, which include assistance with routine tasks such as preparing meals, shopping for personal items, managing money, or doing light housework, with 12.4 million homemaker hours provided.
  • Personal care: 77,000 older adults received personal care services, which include services that help individuals with activities of daily living, with 11.3 million hours of personal care provided to these individuals.
  • Assisted transportation services: 34,000 individuals received assistance with transportation services, which include escorts for people who have difficulties using regular transportation, with 1.2 million one-way assisted transportation trips provided.
  • Chore services: 27,000 people were provided with chore services, including assistance with such activities as heavy housework, yard work, or sidewalk maintenance, with 599,000 hours of assistance provided to these individuals.
  • Adult day care services: 8,300 individuals received adult day care services, which include personal care for dependent older adults in a supervised group setting, such as social and recreational activities, training, and counseling, with 2.6 million hours of adult day care services provided to these individuals.
  • Caregiving services: The National Family Caregiver Support Program provides help to thousands of caregivers. According to the HHS FY 2024 Congressional Budget Justification for ACL, 779,000 caregivers were served by the National Family Caregiver Support Program in 2021 (data not shown). In addition, the National Family Caregiver Support Program provided 50,245 family caregivers with nearly 4.9 million hours of temporary relief from their caregiving responsibilities and provided an estimated 1.5 million contacts to caregivers, assisting them in locating services from various agencies. Furthermore, the program provided an estimated 92,865 family caregivers with counseling, peer support, and training to better cope with the stresses of caregiving.
  • Other services: that are provided under Title III include transportation, such as to medical appointments or the grocery store; information and assistance, such as about opportunities and services that are available in the community; and outreach on how to use existing services and benefits. Data on the number of people who used each of these services are not collected but data on the number of services provided is collected. According to ACL, in 2023, 13.1 million one-way transportation trips were provided from one location to another, and nearly 11 million contacts for information and assistance were provided.

Among older adults receiving select Title III services in 2023, 39% were living below the poverty level, 33% were people of color, and 29% lived in rural areas, according to data from ACL (Figure 2).

Among People Receiving Select Title III Services, Nearly 40% Were Living in Poverty and Around One-Third Were People of Color and Living in Rural Areas

In addition to the programs mentioned above that are provided under Title III, the Older Americans Act provides funding for other programs that help older adults, including:

  • Long-Term Care Ombudsman program: Each state is required to operate a statewide Office of the Long-Term Care Ombudsman to improve the quality of life and care of residents of long-term care facilities, including individuals living in nursing homes and assisted living facilities, and advocate on behalf of residents. In 2024, paid and volunteer staff conducted nearly 380,000 visits to over 50,000 long-term care facilities, investigated over 205,000 complaints, and provided more than 710,000 instances of information and assistance to individuals and facility staff. These services help support the 6 million people on Medicaid who live in institutional settings.
  • Social supports for older American Indians, Alaska Natives, and Native Hawaiians: As part of the social supports provided to older American Indians, Alaska Natives, and Native Hawaiians under the Older Americans Act, in 2022, nearly 600,000 transportation services were provided, including for visits to medical providers, picking up prescriptions, and staying active within their communities, an estimated 4 million home-delivered and 2.1 million congregate meals were provided, and nearly 780,000 hours of information, referral, and outreach services were provided including help with navigating health care systems and payers, making appointments, and coordinating access to services.

Federal funding for all Older Americans Act services was $2.37 billion for FY 2024, the most recent year of fully appropriated funding, with nearly three-quarters (72%) devoted to grants to states and community providers for nutrition services, caregiver support services, and other social services (Figure 3).

Close to Three-Quarters (72%) of Older Americans Act Funding Provides Grants to States and Community Providers for Nutrition Services, Caregiver Services, and Other Social Services

This is roughly the same as funding from the prior fiscal year ($2.38 billion in FY 2023) but an increase of 23% since FY 2014, when Older Americans Act funding totaled $1.92 billion – or average annual growth of 2.1% (not adjusted for inflation; Figure 4). (Congress provided temporary increases in supplemental funding to Older Americans Act programs due the COVID-19 public health emergency in FY 2020 and FY 2021.)

However, the growth of overall funding for Older Americans Act programs and services has not kept pace with the growth in the older adult population in the U.S. Between 2014 and 2024, the number of people ages 60 and older increased by 28% (2.5% average annual growth), from 64.7 million to 82.5 million. As a result, Older Americans Act funding per person age 60 or older decreased slightly over these years by 3%, though this reduction would be larger in inflation-adjusted dollars, with general prices rising by 33% (2.9% annually, on average) over this period.

Funding for Older Americans Act Programs Has Increased Somewhat Over the Last 10 Years, But the Rate of Funding Growth Has Not Kept Pace with Growth in the Number of Older Americans

Based on the president’s proposed FY 2026 HHS budget, the Trump administration is proposing level funding for most Older Americans Act programs and services, including home and community-based supportive services, nutrition programs, caregiver and family support services, and programs for the protection of vulnerable older adults, like the Long-Term Care Ombudsman program. This would mean another year with no funding increases for these programs, unless Congress provides funding above current levels in new appropriations legislation or in reauthorizing the Older Americans Act. The Trump administration proposes a reduction in funding for the Alzheimer’s disease program, from $32 million in FY 2025 to $17 million in FY 2026, along with the elimination of chronic disease self-management education.

The Older Americans Act has been reauthorized and amended several times since its passage in 1965, including most recently through the Supporting Older Americans Act of 2020, which authorized appropriations for Older Americans Act programs through FY 2024. On December 10, 2024, the Senate unanimously passed the Older Americans Act Reauthorization Act of 2024, which would have reauthorized the Act for another 5 years. The House introduced legislation that included the Older Americans Act reauthorization but this funding deal fell apart under pressure from then President-elect Donald Trump. Subsequent legislation passed by Congress to keep the government funded until March 14, 2025, and then again through September 30, 2025, did not include reauthorization of the Older Americans Act.

How could the Trump Administration’s reorganization of HHS affect Older Americans Act programs?

According to the HHS FY 2026 Budget in Brief, ACL is being dissolved and its functions integrated into the newly established Administration for Children, Families, and Communities (ACFC). Programs being shifted include home and community based supportive services, nutrition programs, aging network support activities, family caregiver support services, caregiver support services for American Indians, Alaska Natives, and Native Hawaiians, Alzheimer’s disease supportive services, and prevention of elder abuse and neglect. The administration has not yet released a detailed budget justification for the new ACFC, which makes it difficult to assess whether funding for any of the former ACL’s functions will be scaled back or terminated.

Staffing reductions within HHS and at the former ACL specifically could hinder the ability of remaining staff to oversee Older Americans Act programs. Staff cuts reported to have occurred within ACL’s budget office, evaluation and policy teams, and regional offices could impede the effective administration of Older Americans Act programs, the provision of grant funding to state and local entities, and the direct delivery of services to older adults.

This work was supported in part by The John A. Hartford Foundation. KFF maintains full editorial control over all of its policy analysis, polling, and journalism activities.

Appendix

Older Americans Act: Titles Under Current Law

The Performance of the Federal Independent Dispute Resolution Process through Mid-2024

Authors: Matt McGough, Nisha Kurani, and Michelle Long
Published: May 30, 2025

The No Surprises Act, which was signed into law by President Trump during his first term and took effect in 2022, aims to protect consumers from certain surprise medical bills. The law established processes to keep the patient out of the payment negotiations between the provider and the plan. In the event of an unsuccessful negotiation, providers and payers enter an independent dispute resolution (IDR) process in which a designated third-party arbitrator examines eligible evidence from both parties to decide on a final payment rate.

KFF’s analysis examines the implementation status of the IDR process and discusses some of the impacts on providers, payers, and ultimately, consumers, with some key findings, including that nearly two in three disputed services involved care that was furnished in an emergency room. The top 10 dispute-initiating parties are all providers or their billing consultants, and the top three parties (all of which are backed by private equity firms) accounted for 53% of payment disputes from the beginning of 2023 through mid-2024.

The analysis is available through the Peterson-KFF Health System Tracker, an online information hub dedicated to monitoring and assessing the performance of the U.S. health system.

Understanding the Intersection of Medicaid and Work: An Update

Published: May 30, 2025

Issue Brief

Work requirements in Medicaid have resurfaced as part of a broader legislative package of potential changes to Medicaid designed to significantly reduce federal Medicaid spending. A draft budget outline from Congressional Republicans includes requiring Medicaid enrollees to work or look for work as a condition of receiving coverage. While the details of the current proposal are not yet available, an analysis of an earlier proposal by the Congressional Budget Office shows that Medicaid enrollment would drop and that federal spending on Medicaid would be reduced substantially, but that the policy would not increase employment.

Data show the majority of Medicaid enrollees are working. The first Trump administration encouraged states to apply for Section 1115 waivers that included work and reporting requirements as a condition of Medicaid eligibility. For the first time in the history of the program, the administration approved waivers in 13 states. Arkansas was the only state to implement the policy with consequences for noncompliance, resulting in 18,000 losing coverage for failure to meet work or reporting requirements. Courts struck down many of the waiver approvals, including in Arkansas, and the Biden administration rescinded the remaining waivers, or they were withdrawn by the states. Currently, Georgia is the only state with a work requirement waiver in place (following a legal challenge to the Biden administration’s move to rescind it); however, several other states are pursuing work requirement waivers, anticipating a change in policy by the incoming Trump administration.

This brief updates an earlier analysis of work status and characteristics of Medicaid enrollees to show that in 2023, nearly two-thirds of adults ages 19-64 covered by Medicaid were working and nearly three in ten were not working because of caregiving responsibilities, illness or disability, or due to school attendance, reasons that counted as qualifying exemptions from the work requirements under previous policies. Based on the data, only a small share of Medicaid adults were not meeting work requirements or would not have qualified for an exemption qualifying exemptions: however, many more Medicaid enrollees who would remain eligible would be at risk of losing coverage because of the administrative burden and red tape related to reporting requirements.

What is the work status of Medicaid adults?

In 2023, most Medicaid adults under age 65 were working (Figure 1). Among adults under age 65 with Medicaid who do not receive benefits from the Social Security disability programs, Supplemental Security Income (SSI) and Social Security Disability Insurance (SSDI), and who are not also covered by Medicare (referred to hereafter as “Medicaid adults”), 92% were working full or part-time (64%), or not working due to caregiving responsibilities, illness or disability, or school attendance. The remaining 8% of Medicaid adults reported that they are retired, unable to find work, or were not working for another reason.

Work Status & Barriers to Work Among Medicaid Adults, 2023

Those in better health and with more education are more likely to be working (Figure 2). Health status, age, and education level were all strong predictors of work. Seven in ten people in excellent health, ages 30-39, and who have a college degree were working compared to just four in ten (44%) people in fair health, less than half of older adults ages 55-64 (48%), and 56% of those who did not complete high school. In addition, parents were more likely to be working than adults without a dependent child in the home (72% vs. 58%), in part, because parents are younger and less likely to have a disability. Rates of work additionally vary by geographic region, metro status, and race/ethnicity but not all variation is statistically significant (Appendix Table 1).

Work Status of Medicaid Adults by Key Demographics, 2023

Medicaid adults with disabilities face greater barriers to participating in employment. Disability is defined as having at least one serious difficulty with hearing, vision, cognitive functioning (concentrating, remembering, or making decisions), mobility (walking or climbing stairs), independent living (doing errands, such as visiting a doctor’s office or shopping, alone), or self-care (dressing or bathing). Of Medicaid enrollees ages 19-64 with a disability, about one third (32%) receive disability income (SSI or SSDI) leaving nearly seven in ten (68%) adults on Medicaid with a disability who do not receive disability income. Medicaid adults with a disability are less likely to work than Medicaid adults with no disability (37% vs. 68%) (Figure 3).

Both the number of functional limitations as well as the type of limitation affect workforce participation. While nearly half (48%) of Medicaid adults with one disability were working, fewer than one in five (17%) Medicaid adults with four or more disabilities were working (Figure 3). Similarly, over four in ten Medicaid adults with visual or hearing disabilities were working while those with disabilities related to independent living and self-care, difficulties that often result in the need for long-term care services, had the lowest rates of employment (21% and 16%, respectively). Medicaid offers a variety of services designed to help people with these needs work, so losing Medicaid could make employment harder or impossible for these adults.

Share of Medicaid Adults Who Are Working, by Disability Status, Type, and Number of Disabilities, 2023

What do we know about Medicaid adults who are working?

Most Medicaid adults who work are working full-time (at least 35 hours per week), but those who work part-time face challenges to full-time employment (Figure 4). Among Medicaid adults who work, nearly seven in ten (69%) worked full-time and half worked full-time for the entire year (at least 50 weeks) (Appendix Table 2). Many Medicaid adults who work part-time (31% of all workers) cited that reasons for working part-time include work limits like shorter work weeks (less than 35 hours per week) (16%), slack work/business conditions (12%), or inability to find full-time work (7%) (Figure 4). Part-time workers also pointed to childcare problems (9%) and other family or personal obligations (22%).

Reasons for Working Part-Time Among Medicaid Adults, 2023

Many Medicaid adults who work are employed by small firms and are not eligible for employer-sponsored health insurance at their job. In 2023, nearly five in ten (46%) Medicaid workers were employed in firms with fewer than 50 employees, which are not subject to ACA penalties for not offering affordable health coverage and are less likely to offer health insurance to their workers than larger firms (Figure 5). In 2022, just over half (53%) of firms with fewer than 50 employees offered health insurance to their workers compared to 98.7% of firms with 100 or more employees. In addition, many Medicaid workers are employed in industries with historically low ESI offer rates, such as the agriculture and service industries (46%). Among all workers employed in farming, fishing, and forestry occupations, only about four in ten (41.4%) were eligible for insurance at their job in 2023, and among those in service occupations, just over half (55.6%) were eligible (Figure 6). Access to job-based insurance for part-time workers is even more limited. Fewer than four in ten (38.4%) of all part-time workers were eligible for insurance through their job in 2023.  But, even if eligible for job-based insurance, some workers, especially low-wage and part-time workers, may not take up the offer because it is not affordable to them.

Work Characteristics of Medicaid Adults, 2023

Share of Workers Ages 18-64 Who Are Eligible for Employer-Sponsored Health Insurance (ESI) at Job, by Occupation and Full-Time/Part-Time Status

Medicaid adults who work full-time are eligible for Medicaid in expansion states because they work low-wage jobs and meet income eligibility criteria. An individual working full-time (35 hours/week) for the full year (50 weeks) at the federal minimum wage ($7.25 per hour) earns an annual salary of $12,688, which is well below the Medicaid eligibility limit of 138% of the Federal Poverty Level ($15,650 for an individual; $32,150 for a family of four) for adults ages 19-64 in states that have expanded Medicaid under the Affordable Care Act (ACA) (Figure 7). Thus, an adult with this income would be eligible for Medicaid in an expansion state. However, working adults may be ineligible for Medicaid in non-expansion states where the median eligibility limit for parents as of May 2024 was 35% of the FPL (and ranges from 15% in Texas to 100% in Wisconsin) and childless adults are not eligible (except in Wisconsin, where they are covered under a Section 1115 waiver).

Annual Earnings at Minimum Wage Compared to Annual Poverty Guidelines, 2025

Appendix

Own Work Status of Adult Medicaid Enrollees, 2023

Characteristics of Working Adult Medicaid Enrollees, 2023

Work Status and Family Work Status of Adult Medicaid Enrollees, 2023

Characteristics of Working Adult Medicaid Enrollees, 2023

Reason for Not Working Among Adult Medicaid Enrollees, 2023

Industries and Occupations with Largest Number of Working Adult Medicaid Enrollees, 2023

Work Status & Barriers to Work Among Medicaid Adults Ages 55-64, 2023

Work Status & Barriers to Work Among Medicaid Adults Without Dependent Children, 2023

Work Status of Medicaid Adults Without Dependent Children by Age Group, 2023

Expansions to Health Savings Accounts in House Budget Reconciliation: Unpacking the Provisions and Costs to Taxpayers 

Authors: Meghan Salaga and Kaye Pestaina
Published: May 29, 2025

The 2025 federal budget reconciliation bill passed by the House aims to promote the use of health savings accounts (HSA) through a variety of changes to the HSA provisions included in the 2003 law that created HSAs. While these changes could provide more incentives for individuals to use HSAs, they would cost the federal government almost $45 billion over 10 years, according to an estimate from the Congressional Budget Office. This Policy Watch provides an overview of HSAs and examines key HSA-related provisions in the House-passed budget reconciliation bill and their costs to the federal budget.

What Are HSAs?

HSAs are tax-advantaged spending accounts designed to help enrollees in high-deductible plans (HDHPs) pay out-of-pocket medical costs. Individuals can contribute amounts and later make withdrawals to pay for unreimbursed qualified medical expenses (e.g., deductibles, copays, coinsurance, services not covered by insurance). There are annual contribution limits for individuals (for 2025, the contribution limit is $4,300 for individual coverage, $8,550 for a family). Employers are also eligible to make contributions to their employees’ HSAs, as well as family members on behalf of an individual with an HSA. HSAs are owned by the individual, not the employer. These accounts are characterized as “portable,” meaning they can be carried to a new job or retained upon retirement or loss of work.

A key feature of these accounts is that an individual must be enrolled in an HSA-eligible HDHP with a deductible of at least $1,650 for an individual or $3,300 for a family in 2025. HSA enrollees must pay all medical costs out-of-pocket until they reach the deductible, except for specified preventive services and certain insulin products, which insurance can start paying for before the deductible is met.

Also, an individual cannot have other health coverage in addition to the HDHP to be eligible for an HSA. So, receipt of medical services outside of the HDHP may jeopardize eligibility for an HSA. Additionally, once an individual is enrolled in Medicare, they can no longer contribute to an HSA (although they can still access funds in an existing HSA).

Health savings accounts are unique in offering a “triple-tax advantage”: contributions are tax deductible, growth of funds via investment is tax-free and account balances roll over, and withdrawals are tax-free if they are used for qualified medical expenses (e.g., doctor visits, prescription drugs, medical equipment) incurred after the HSA is established.

How Have HSAs Been Used?

According to the KFF 2024 Employer Health Benefits Survey, 22% of firms offering health benefits offered a high-deductible health plan (HDHP) paired with an HSA to their employees. Larger firms offering health benefits are much more likely than smaller firms to offer an HSA-qualified HDHP (50% for offering firms with 200 or more workers compared to 21% for firms with 3-199 workers). In addition to the contributions that enrollees can make to their HSA, employers are also permitted to contribute to covered workers’ HSAs. Among firms that contribute, the average employer contribution is $842 for single coverage and $1,539 for family coverage.

HSA-qualified HDHPs are also offered on the Affordable Care Act (ACA) Marketplace; however, the share of total health plans offered on the Marketplace that are HSA-eligible HDHPs has decreased from 7% in 2017 to 3% in 2023, and total enrollment in these plans has fallen from 8% in 2017 to 5% in 2022. Even though the deductibles of most HDHPs offered on the ACA Marketplace well exceed the minimum deductible requirements for HSAs, some HDHPs sold on the Marketplace cover services before the deductible in addition to the specific health service designs that the IRS does not permit for HSA-eligible plans. As a result, some Marketplace HDHPs cannot be paired with an HSA. The drop in HSA availability on the Marketplace could also be because the Centers for Medicare and Medicaid Services (CMS) limits insurers on the exchange to offering no more than two non-standardized plans for each standardized plan they offer in a metal level for a given product/network type (e.g., HMO, PPO).

There are disparities in HSA contributions and balances across race and income groups. Research has found that higher-income individuals are more likely than those with lower incomes to be enrolled in an HSA. One explanation for this difference could be that those with higher incomes have more means to pay for out-of-pocket expenses for medical care received pre-deductible. Additionally, the tax advantages of HSAs may be particularly attractive to higher-income individuals, who may have more disposable income to maximize contributions than individuals with lower-incomes, who may not be able to afford to contribute to an HSA. Because they are in a higher tax bracket, the reduction of taxable income by making HSA contributions is also of greater value to a higher-income family than to a family with a household income in a lower tax bracket (or that earns too little to file a federal tax return). For instance, a married couple with a household income of $600,000 saves 35 cents for every dollar they contribute to their HSA, while a married couple making a combined $80,000 saves 22 cents per dollar contributed to their HSA.

Research also finds that HSA enrollment is skewed more towards White HDHP enrollees than their Black and Hispanic counterparts, which might be exacerbating existing racial income disparities and financial barriers to health care. In an analysis conducted by the Employee Benefits Research Institute (EBRI) in 2022, accountholders living in disproportionately Black or Hispanic zip codes had, on average, lower HSA balances and lower contributions than accountholders living in disproportionately White zip codes.

Investing HSA balances provides a unique, untaxed wealth-building vehicle for those who are aware of this option and have the means to do so. Despite the appeal of the tax-free investment option though, only 9% of HSA holders in 2024 invested a portion of their funds, according to a Devenir report. However, investments made up a more substantial portion of HSA assets that same year, representing a little over two-fifths of total assets. Separately, EBRI found that disproportionately White and Asian zip codes, as well as zip codes with a higher median household income, had a higher propensity to invest HSA funds in 2022.

How Have Standards for HSAs Changed in Recent Years?

The first Trump administration was a proponent of expanding access to HSAs. In 2019, an Executive Order and subsequent guidance expanded the list of services allowed to be covered pre-deductible by HSA-qualified HDHPs to include preventive services that help maintain health status for those with certain chronic conditions. This definition was further expanded in IRS guidance from 2024. Congress in COVID-relief legislation permitted telehealth services to be covered by HDHPs pre-deductible up until the end of last year. In the Inflation Reduction Act, Congress changed the HSA law to allow individuals to access certain insulin products pre-deductible.

How Would the House-Passed Budget Reconciliation Bill Expand HSAs?

If passed by the Senate and signed into law, key changes to HSAs would include:

Making gym memberships a qualified medical expense that individuals can pay for with their HSA. The reconciliation bill would allow HSA distributions to pay for certain sports and fitness expenses, such as gym memberships and participation/instruction in physical activities. Annual HSA distributions for these expenses would be capped at $500 for single taxpayers and $1,000 for joint or head of household filers. This is the costliest provision in the budget reconciliation bill: $10.5 billion from 2025 to 2034.

Allowing individuals to qualify for an HSA even if they are covered by a direct primary care arrangement or an on-site employee clinic. Direct primary care (DPC) is a different model of primary care delivery in which patients pay a periodic fee to a practice that covers unlimited primary care services (e.g., vaccines, lab work, office visits, consultive services) without cost-sharing. DPC does not usually cover specialized and other services and is therefore not generally considered comprehensive coverage. Some HDHP enrollees and others choose to add DPC to meet their primary care needs. The budget reconciliation bill stipulates that DPCs that meet specific requirements will not be treated as a health plan. In addition, the legislation would also treat dollars used to pay DPC fees as an HSA-specific qualified medical expense. This would allow HSA holders to add it on as a complement to their HDHP and use their HSA funds to pay DPC membership fees, with the caveat that these fees cannot exceed $150 monthly ($1,800 annually) in order to not be considered a health plan. This provision is projected to cost about $2.8 billion from 2025 to 2034.

On-site employee sponsored health clinics are health care facilities on an employer’s premises (or facilities used primarily for the same employer) that provide free or reduced cost services to employees. Current law makes an individual ineligible to use an HSA if they have access to an on-site employee clinic that provides significant health benefits (i.e., providing care for all medical needs for free or waiving copays and deductibles) in addition to disregarded coverage and preventive services. The budget reconciliation bill proposes to not treat on-site employee clinics offering qualified items and services as health plans for purposes of determining HSA eligibility if the services provided at the clinic meet certain parameters. This provision is projected to cost about $2.4 billion from 2025 to 2034.

Increasing the amount certain individuals can contribute to their HSAs in a year and allowing contributions that the law currently restricts. For example:

  • The annual contribution limit to a health savings account for an individual would increase by $4,300 for individuals with self-only coverage and by $8,550 for family coverage, which doubles the 2025 basic limits on annual contributions. This increase would phase out at certain income levels ($75,000 to $100,000 of adjusted gross income; for joint filers with family coverage, $150,000 to $200,000 of adjusted gross income). This provision is projected to cost about $8.4 billion from 2025 to 2034.
  • Individuals who are age 65 or older and enrolled only in Medicare Part A (not Part B) would be allowed to still make HSA contributions. This provision is projected to cost about $7.4 billion from 2025 to 2034. Other tax code changes would also apply to these individuals.

Treating Marketplace bronze plans and catastrophic plans as a high-deductible plan that can be paired with an HSA. To increase accessibility of HSAs in the individual market, bronze plans and catastrophic plans would be treated as HDHPs. Bronze plans have the highest cost-sharing and lowest premiums among metal-tier plans, while catastrophic plans have lower premiums than bronze plans and deductibles are equal to the ACA annual limit on out-of-pocket costs ($9,200 for individual coverage in 2025 and $10,150 in 2026). This provision is projected to cost about $3.6 billion from 2025 to 2034.

If passed by the Senate and signed into law, HSA tax deductions would cost the federal government almost $14.8 billion in lost revenue in fiscal year (FY) 2025, and if eligibility and regulations governing the accounts remained the same, they would cost an estimated $180.9 billion from 2025 to 2034. The House-passed budget reconciliation bill contains ten reforms that broaden the range of HSA-eligible qualified medical expenses, loosen restrictions on individual contributions, and increase access to HSAs. According to the Congressional Budget Office’s estimated revenue effects for this bill, these expansions would increase the total projected cost of HSAs by approximately $44.3 billion over the next ten years (Figure 1).

HSA Expansions Are Projected To Cost Taxpayers $44.3 Billion Over the Next 10 Years

Looking Forward

Efforts to expand HSAs would mean new large government expenditures, at a time when proposed tax cuts and significant changes to Medicaid and ACA programs will leave more people without coverage. Congress arguably created HSAs in 2003 to be paired with HDHPs as a tool to pay for current health care costs and to incentivize price shopping for anticipated health services. Today, expansions to HSAs appear to focus less on cost-conscious shopping, as federal rules have added more pre-deductible coverage of certain items and services and expand the items that can be treated as medical services, but only for consumers with health savings accounts. Proposals aimed at promoting “choice and control” would allow more individuals to use funds in an HSA to pay directly for certain services. Although some pre-deductible items and services are aimed at managing specific chronic illnesses, these provisions do not reach all consumers who could benefit from other types of specialized items and services, which often come at a high cost, to manage and treat their chronic condition.