Medicaid Financing: The Basics

Published: Mar 4, 2026

Introduction

Medicaid represents nearly $1 out of every $5 spent on health care in the U.S. and is the major source of financing for states to provide health coverage and long-term care for low-income residents. Medicaid is administered by states within broad federal rules and jointly funded by states and the federal government through a federal matching program with no cap. States are facing substantial Medicaid financing changes and historic reductions in federal funding following the passage of the 2025 reconciliation law, though the timing of the changes and the impacts vary by state. In addition, administrative actions related to financing and more aggressive oversight of potential fraud by health care providers, including withholding federal Medicaid operating funds, contribute to fiscal uncertainty for states. Amid federal policy changes, states are also experiencing a more tenuous fiscal climate due to slowing revenue growth and increasing spending demands. Medicaid is often central to state budget decisions as it is simultaneously a significant spending item as well as the largest source of federal revenues for states. This issue brief examines key questions about Medicaid financing and explores the impact of recent policy changes.

How does Medicaid financing work?

Medicaid financing is shared by states and the federal government with a guarantee to states for federal matching payments with no pre-set limit. The percentage of costs paid by the federal government (known as the federal medical assistance percentage or “FMAP”) varies across states, for specific services and types of enrollees, and depending on whether the costs are for medical care or program administration. Congress has enacted legislation to temporarily increase federal matching payments during economic downturns and, most recently, during the COVID-19 pandemic, because Medicaid is a counter-cyclical program. During economic downturns, more people become eligible and enroll, but states typically face declines in revenues that make it difficult to finance the state share of funding for the program.

The FMAP for services used by people eligible through traditional Medicaid, which includes individuals who are eligible as children, low-income parents, because of disability, or because of age (65+), is determined by a formula set in statute. The formula is designed so that the federal government provides a match rate of at least 50% and provides a higher match rate for states with lower average per capita income. The resulting FMAP varies by state and ranges from 50% (the FMAP “floor”) in ten states (California, Colorado, Connecticut, Maryland, Massachusetts, New Hampshire, New Jersey, New York, Washington, and Wyoming) to 77% in Mississippi for federal fiscal year (FFY) 2027 (Figure 1).

States With Lower Per Capita Incomes Have a Higher Federal Matching Rate for Medicaid (Choropleth map)

There are special match rates for the Affordable Care Act (ACA) expansion group, administration, and other services. While the traditional FMAP applies to the vast majority of Medicaid spending, there are a few exceptions that provide higher match rates for specific services or populations, such as family planning and most notably people covered under the ACA Medicaid expansion. States that have implemented the expansion receive 90% FMAP for adults covered through the ACA Medicaid expansion. Administrative costs incurred by states are usually matched by the federal government at a 50% rate, but some functions such as eligibility and enrollment systems receive higher match rates. Medicaid administrative costs are about 4% of total Medicaid spending.

Unlike in the 50 states and D.C., annual federal funding for Medicaid in the U.S. territories is subject to a statutory cap and fixed matching rate. Once a territory exhausts its capped federal funds, it no longer receives federal financial support for its Medicaid program during that fiscal year. Over time, Congress has provided increases in federal funds for the territories broadly and in response to specific emergency events. Various pieces of legislation during the pandemic significantly increased the allotments for each of the territories and also raised the FMAP rates from the statutory level of 55% to 76% for Puerto Rico and 83% for the other territories. The 2023 Consolidated Appropriations Act extended the 76% FMAP for Puerto Rico through FFY 2027 and made the 83% match rate for other territories permanent.

To participate in Medicaid and receive federal matching dollars, states must meet core federal requirementsStates must provide certain mandatory benefits (e.g., hospital, physician, and nursing home services) to core populations (e.g., low-income pregnant women, children, people with disabilities, and people ages 65 and older) without waiting lists or enrollment caps. States may also receive federal matching funds to cover “optional” services (e.g., adult dental care and home care, also known as home- and community-based services) or “optional” groups (e.g. people with income above the limits established for core populations). States also have discretion to determine how to purchase covered services (e.g., through fee-for-service or capitated managed care arrangements) and to establish provider payment methods and rates.

Both the federal government and states are responsible for promoting program integrity. Program integrity broadly refers to the proper management and function of the Medicaid program to ensure it is providing quality and efficient care while using funds–taxpayer dollars–appropriately, with minimal waste. Program integrity efforts, historically, have worked to prevent and detect fraud, waste, and abuse; to increase program transparency and accountability; and to work on corrective action plans and recover improperly used funds. Improper payments, which are often cited when discussing program integrity, are not a measure of fraud but payments that do not meet Centers for Medicare and Medicaid Services (CMS) program requirements. CMS’s Medicaid Payment Error Rate Measurement (“PERM”) program estimated the overall Medicaid improper payment rate was about 6% in 2025. Most improper payments (77% in 2025) are due to insufficient information (or missing administrative steps), not necessarily due to payments for ineligible enrollees, providers, or services (i.e. since they may have been payable if the missing information had been on the claim and/or the state had complied with requirements).

How much does Medicaid cost and how are funds spent?

Overall, Medicaid spending totaled $919 billion in FFY 2024 with the federal government paying nearly two-thirds (65% or $594 billion) and states paying over one-third (35% or $325 billion) (Figure 2). The overall share of federal spending on Medicaid depends on states’ per capita income (lower income states receive a higher match) and whether they adopted the ACA expansion (which has a 90% match).

The Federal Government Paid for Nearly Two-Thirds of Total Medicaid Spending in FFY 2024 (Donut Chart)

Capitated payments to Medicaid managed care organizations (MCOs) accounted for half of Medicaid spending in FFY 2024 (Figure 3). Managed care and health plans accounted for the largest share (53%) of Medicaid spending, with capitated payments to comprehensive MCOs accounting for 50% of Medicaid spending in FFY 2024 and other Medicaid managed care (e.g., primary care case management (PCCM) arrangements or payments to specialty plans) accounting for another 3%. Smaller shares of total Medicaid spending in FFY 2024 were for fee-for-service acute care (22%), fee-for-service long-term care (20%), Medicaid spending for Medicare premiums on behalf of enrollees who also have Medicare (3%), and disproportionate share hospital (DSH) payments (2%).

Payments to Comprehensive MCOs Account for Half of Total National Medicaid Spending (Pie Chart)

Enrollees eligible based on disability or age (65+) comprise about one in five of all Medicaid enrollees but account for over half of total spending due to higher per person costs (Figure 4). Children account for 33% of enrollees but only 15% of spending. Adult enrollees (those made eligible under the ACA Medicaid expansion, as well as low-income parents) account for 45% of all enrollees and 34% of spending. The disproportionate spending on certain eligibility groups stems from variation in spending per enrollee across the eligibility groups, reflecting differences in health care needs and utilization. Spending per enrollee for individuals eligible based on age (65+) and disability, the two groups with the highest per enrollee costs, is approximately six times higher than spending per enrollee for children, who had the lowest spending of any eligibility group. Those eligible on the basis of age or disability tend to have higher rates of chronic conditions, more complex health care needs and are more likely to utilize long-term care than other enrollees, contributing to higher spending.

People Eligible for Medicaid Based on Disability or Age (65+) Accounted for 1 in 5 Enrollees but Over Half of All Spending in 2023 (Stacked column chart)

Total spending per full-benefit enrollee ranged from a low of $4,780 in Alabama to $12,295 in D.C. in 2023 (Figure 5). Variation in spending across the states reflects considerable flexibility for states to design and administer their own programs – including what benefits are covered and how much providers are paid — and variation in the cost of living and the health and population characteristics of state residents. Within each state, there is also substantial variation in the average costs for each eligibility group and within each eligibility group, per enrollee costs may vary significantly. Overall, Medicaid spending has experienced slower cumulative growth since 2008 compared to private insurance on a per-enrollee basis.

Medicaid Spending Per Full-Benefit Enrollee Varies Across States (Choropleth map)

Medicaid spending includes payments to providers, particularly hospitals, that include base rates as well as supplemental payments. Supplemental payments generally add on to “base” payments from fee-for-service Medicaid or from Medicaid managed care organizations, both of which don’t always cover the costs of providing services. There are various types of supplemental payments (see Box 1), and their use varies by state.

Box 1: Types of Medicaid Supplemental Payments

“Disproportionate share hospital” (DSH) payments ($15 billion in FFY 2024) pay hospitals that serve a large number of Medicaid and low-income uninsured patients to offset uncompensated care costs. Federal DSH spending is capped for each state and facility but within those limits, states have considerable discretion in determining the amount of DSH payments to each DSH hospital. The ACA called for a reduction in federal DSH allotments starting in FFY 2014 based on the assumption of reduced rates of uninsurance, but the cuts have been delayed several times and have yet to go into effect. DSH payments are intended to supplement Medicaid payment rates and to help defray the costs of care provided to people without health insurance.

States may make other non-DSH supplemental payments to providers ($39 billion in FFY 20241). Upper payment limits (UPLs) are the most common, and permit states to make up the difference between Medicaid fee-for-service payments and what Medicare would pay for comparable services. As such, the maximum payment rate for UPLs is what Medicare would pay in most cases. Other types of supplemental payments include payments for graduate medical education and those authorized under various demonstration programs. Most supplemental payments are made to hospitals, but some go to mental health facilities, nursing facilities, intermediate care facilities, physicians and other practitioners. For physician and other practitioners, UPLs are set at average commercial rates, which tend to be much higher than Medicare rates.

Subject to CMS approval, states may implement “state directed payments” that require managed care plans to make certain types of payments to health care providers (estimated to be well over $100 billion each year). State directed payments are generally aimed at bolstering provider payment rates to increase access to or quality of care. Prior to passage of the 2025 reconciliation law, the total payment made through state directed payments and base MCO payments was capped at average commercial rates for hospital services, nursing facility services, and professional services at academic medical centers.

How does Medicaid relate to federal and state budgets?

Social Security, Medicare, and Medicaid are the three main entitlement programs and accounted for 41% of all federal outlays in FFY 2024 (Figure 6). Of these three programs, Medicaid is smallest in terms of federal outlays, though it covers a larger number of people than Medicare or Social Security. Overall, federal spending on domestic and global health programs and services accounted for more than one-fourth of net federal outlays in FFY 2024, including spending on Medicare (12%), Medicaid and CHIP (8%), and other health spending (6%). (The numbers in Figure 6 come from the FFY 2025 budget request. The FFY 2026 budget request did not include full data on prior years’ spending, and the FFY 2027 budget request has not been posted as of the writing of this issue brief.)

Medicaid and CHIP Accounted for 8% of Net Federal Outlays in FFY 2024 (Donut Chart)

Medicaid is often central to state fiscal decisions as it is simultaneously a significant spending item as well as the largest source of federal revenues for states due to the federal matching structure. According to data from the National Association of State Budget Officers (NASBO), in state fiscal year (SFY) 2024, Medicaid accounted for 30% of total state spending for all items in the budget (Figure 7). Medicaid accounted for only 16% of expenditures from state funds (including state general funds and other state funds), second to K-12 education (24%). On the other hand, Medicaid accounted for 57% of all expenditures from federal funds. States have an incentive to control Medicaid spending because they pay a share of Medicaid costs, though states must reduce total Medicaid spending by more than one dollar to achieve a dollar in savings due to the federal matching structure. At the same time, research shows that federal matching dollars from Medicaid spending have positive effects for state economies. A number of studies show that states that have adopted the ACA Medicaid expansion have realized budget savings, revenue gains, overall economic growth as well as observed positive effects on the finances of hospitals and other health care providers.

Medicaid is the Largest Single Source of Federal Funds for States (Stacked column chart)

States can use a variety of methods to pay for the state share of Medicaid spending. States have flexibility in determining how to finance the state (or non-federal) share of Medicaid payments, within certain limits. In addition to state general funds appropriated directly to the Medicaid program, most states also rely on funding from health care providers and local governments generated through provider taxes and donations, intergovernmental transfers (IGTs), and certified public expenditures (CPEs). KFF’s 2025 Medicaid budget survey found that general funds accounted for a median of 70% of the non-federal share in SFY 2026 enacted budgets, while provider taxes accounted for 18% and funds from local governments or other sources accounted for 6%, though there was considerable variation across states.

All states (except Alaska) have at least one provider tax in place and many states have more than three (Figure 8). Medicaid provider taxes are defined as those for which at least 85% of the tax burden falls on health care items or services or entities that provide or pay for health care items or services. Provider taxes fall on a wide range of provider types but are most common for institutional providers including hospitals (47 states), nursing facilities (45 states), and intermediate care facilities for people with intellectual or developmental disabilities (33 states). States use provider tax revenues to fund Medicaid “base” rates as well as supplemental payments (including state directed payments); to finance eligibility expansions (including the ACA Medicaid expansion); or to more generally support the Medicaid program. Smaller sources of state share funding include IGTs, CPEs, and provider donations (see Box 2).

All States but Alaska Use Provider Taxes To Help Finance the State Share of Medicaid Spending (Choropleth map)

Box 2: State Share Funding Sources Beyond Provider Taxes

Intergovernmental transfers (IGTs) are transfers of public funds between governmental entities (such as county government or state university hospital transferring funding to the state Medicaid agency). Similar to provider taxes, IGTs may be used to finance payments for providers but also finance overall Medicaid spending.

Provider donations are voluntary contributions from health care providers or related entities to the state or local government, which are only permissible if they are “bona fide” and not related to the payments the provider receives from Medicaid. (Provider donations of up to $5,000 per year for an individual provider and up to $50,000 per year for health care organizations are presumed to be bona fide.) Similar to provider taxes and IGTs, provider donations may be used to finance various types of Medicaid spending.

Certified public expenditures (CPEs) are certifications by a governmental entity (such as a county hospital or schools) that authorized funds were spent on Medicaid expenses. Unlike other types of Medicaid financing, CPE funds are not transferred from a governmental entity to the state for use as a non-federal funding source. Instead, the government entity that provides the services certifies that it has expended the dollars on Medicaid-covered services. CMS provides states with the federal share of the total amount paid by the government entity and encourages (but does not require) states to reimburse the provider for the federal share of costs

What factors affect Medicaid spending and what is the impact of recent policy changes?

Medicaid spending is driven by multiple factors, including the number and mix of enrollees, their use of health care and long-term care, and the prices of Medicaid services. High enrollment growth rates, tied first to the Great Recession, then ACA implementation, and later the pandemic-era continuous enrollment provision, were the primary drivers of total Medicaid spending growth over the last two decades (Figure 9). However, by SFY 2026, the pandemic-era federal support and policies had ended, and states were projecting flat enrollment growth but increasing total Medicaid spending growth due to several cost pressures including provider and managed care rate increases, greater enrollee health care needs, and increasing costs for long-term care, pharmacy benefits, and behavioral health services.

Line graph of percent change in Medicaid enrollment and total spending shows Medicaid enrollment is expected to flatten, growing by 0.2%, as total spending grows by 7.9% in FY 2026.

Medicaid spending is also affected by federal policy changes like those included in the 2025 reconciliation law, which made historic reductions in federal Medicaid spending. The 2025 reconciliation law, signed by President Trump on July 4, 2025, will have a significant impact on Medicaid spending and enrollment trends. Overall, the Medicaid provisions in the new law are expected to reduce federal Medicaid spending by $911 billion (or by 14%) over a decade and increase the number of uninsured people by 7.5 million, though the impacts vary by state.

Changes to Medicaid financing in the 2025 reconciliation law, in particular, are expected to reduce federal Medicaid spending by about $400 billion over a decade. Those changes include:

  • Establishing new restrictions on states’ ability to generate Medicaid provider tax revenue, including prohibiting all states from establishing new provider taxes or from increasing existing taxes; reducing existing provider taxes for states that have adopted the ACA Medicaid expansion; and changing the requirements for states to receive waivers that implement various provider taxes.
  • Revising the payment limit for state directed payments.
  • Imposing a financial penalty for states with eligibility-related improper payment error rates greater than 3%.
  • Eliminating the temporary 5% increase in a state’s traditional FMAP for two years to incentivize states to adopt the Medicaid expansion.

Beyond the changes to Medicaid financing, states will be working to implement other major changes to Medicaid, most notably work requirements for adults eligible for Medicaid through the ACA expansion.

Other federal Medicaid financing changes beyond the 2025 reconciliation law will also have implications for Medicaid spending. These include the following.

  • CMS has an enhanced focus on addressing fraud, waste, and abuse in Medicaid that differs from prior practices by: increasing the use of deferrals (which require states to prove expenditures are allowable before CMS will pay for the federal share of spending), potentially withholding federal funding when future fraud is expected as was done recently in Minnesota (rather than the historic process of identifying fraud, working with a state on a corrective action, and then retroactively denying payment for disallowed expenditures), and publishing provider-level spending data to spur analysis of potential fraud, waste, and abuse by private individuals and organizations.
  • There will be additional regulations coming to implement requirements in the 2025 reconciliation. For example, a proposed rule is under review at the Office of Management and Budget to implement new requirements governing provider taxes.
  • CMS has indicated interest in potentially changing requirements governing how states finance the state share of Medicaid, including a recent request for information about ways CMS can “improve the prevention, identification, and resolution of fraud, waste, and abuse related to non-federal share financing sources, including intergovernmental transfers.”
  • Puerto Rico’s FMAP will revert to 55% from 76% after FFY 2027 without further legislative action.

As states respond to federal Medicaid cuts and shifting state fiscal conditions, changes to benefits, provider payment rates, and eligibility could further limit Medicaid spending. Amid federal funding cuts and policy changes, states are experiencing a more tenuous fiscal climate due to slowing revenue growth and increasing spending demands. The challenging fiscal climate across many states and the magnitude of federal Medicaid cuts will make it difficult for states to absorb or offset the reductions, and states may seek to restrict Medicaid provider reimbursement rates, benefits, or eligibility in response to reduce state Medicaid spending. Even though many provisions in the reconciliation law do not take effect immediately, a few states have already implemented Medicaid spending cuts for SFY 2026 or are proposing cuts for SFY 2027.

Endnotes

  1. This includes non-DSH other supplemental payments to inpatient and outpatient hospitals as well as other providers. Total based on FFY 2024 data downloaded from CMS (Form 64) for the following service categories: Clinic Services - Sup. Payments, Critical Access Hospitals Inpatient – Sup. Payments, Critical Access Hospitals Outpatient – Sup. Payments, Inpatient Hospital - Sup. Payments, Inpatient Hospital – GME Sup. Payments, Intermediate Care Facility - Individuals with Intellectual Disabilities (ICF/IID): Supplemental Payments, Non-Emergency Medical Transportation – Sup. Payments, Nursing Facility Services - Sup. Payments, Other Practitioners Services - Sup. Payments, Outpatient Hospital Services - Sup. Payments, and Physician & Surgical Services - Sup. Payments. Total may not match other estimates of non-DSH supplemental payments due to differences in included provider types and/or types of payments. ↩︎

The Global HIV/AIDS Epidemic

Published: Mar 3, 2026

Editorial Note: Originally published in June 2001, this resource is updated as needed to reflect the latest developments.

Key Facts

  • HIV, the virus that causes AIDS (acquired immunodeficiency syndrome), is one of the world’s most serious health and development challenges. Approximately 40.8 million people are currently living with HIV, and tens of millions of people have died of AIDS-related causes since the beginning of the epidemic.
  • Many people living with HIV or at risk for HIV infection do not have access to prevention, treatment, and care, and there is still no cure.
  • In recent decades, major global efforts, PEPFAR (the President’s Emergency Plan for AIDS Relief, the U.S. government’s global HIV initiative), and the Global Fund to Fight AIDS, Tuberculosis and Malaria (Global Fund) have been mounted to address the epidemic, and despite challenges, significant progress has been made in addressing HIV. Current global health goals are to end AIDS as a public health threat by 2030.
  • PEPFAR, in particular, has helped to change the trajectory of the HIV epidemic, and the U.S. is the single largest donor to international HIV efforts in the world, including the largest donor to the Global Fund. PEPFAR has directed over $130 billion toward HIV prevention, care, and treatment efforts since launched in 2003.
  • Since the beginning of the second Trump administration, the U.S. global health response has undergone significant change, fundamentally altering the global health landscape and U.S. global HIV efforts, including through PEPFAR.

Global Response

HIV, the virus that causes AIDS (see box), has become one of the world’s most serious health and development challenges since the first cases were reported in 1981. Approximately 91.4 million people have become infected with HIV since the start of the epidemic.1 Today, there are approximately 40.8 million people currently living with HIV, and tens of millions of people have died of AIDS-related causes since the beginning of the epidemic.2 

HIV: A virus that is transmitted through certain body fluids and weakens the immune system by destroying cells that fight disease and infection, specifically CD4 cells (often called T cells). Left untreated, HIV reduces the number of CD4 cells in the body, making it more difficult for the immune system to fight off infections and other diseases. HIV can lead to the development of AIDS, “acquired immunodeficiency syndrome,” also known as Advanced HIV Disease.3

AIDS: Advanced HIV Disease (AIDS), used to be seen as an issue of late diagnosis and treatment of HIV, and while that remains a concern, AIDS is now most common in people who have received treatment (antiretroviral therapy) but have stopped.4

Over the past two decades in particular, major global efforts have been mounted to address the epidemic, and significant progress has been made. The number of people newly infected with HIV, especially children, and the number of AIDS-related deaths have declined over the years, and the number of people with HIV receiving treatment increased to 31.6 million in 2024.5

Still, remaining challenges continue to complicate HIV control efforts. Many people living with HIV or at risk for HIV infection do not have access to prevention, treatment, and care, and there is still no cure. HIV primarily affects those in their most productive years, and it not only affects the health of individuals, but also impacts households, communities, and the development and economic growth of nations. Many of the countries hardest hit by HIV also face serious challenges due to other infectious diseases, food insecurity, and additional global health and development problems.

Latest Estimates6

  • Global prevalence among adults (the percent of people ages 15-49 who are infected) has leveled since 2001 and was 0.7% in 2024, though prevalence was higher for certain groups of people, including key populations (i.e., men who have sex with men, sex workers, people who inject drugs, transgender people, and people in prisons).
  • There were 40.8 million people living with HIV in 2024, up from 32 million in 2010, the result of continuing new infections and people living longer with HIV. Of the people living with HIV in 2024, 39.4 million were adults and 1.4 million were children under age 15.
  • Although HIV testing capacity has increased over time, enabling more people to learn their HIV status, about one in eight people with HIV (13%) are still unaware they are infected.
  • While there have been significant declines in new infections since the mid-1990s, there were still about 1.3 million new infections in 2024, or about 3,500 new infections per day. The pace of decline varies by age group, sex, race, and region, and progress is unequal within and between countries.7
  • HIV remains a leading cause of death worldwide and the leading cause of death globally among women of reproductive age.8 However, AIDS-related deaths have declined, due in part to antiretroviral treatment (ART) scale-up. 630,000 people died of AIDS in 2024, a 55% decrease from 1.4 million in 2010 and a 70% decrease from the peak of 2.1 million in 2004. Among women and girls, mortality has declined by 58% since 2010.
  • Sub-Saharan Africa,9 home to approximately two-thirds of all people living with HIV globally, is the hardest hit region in the world, followed by Asia and the Pacific. Latin America, Western and Central Europe and North America, as well as Eastern Europe and Central Asia are also heavily affected.

Affected/Vulnerable Populations

  • Most HIV infections are transmitted heterosexually, although risk factors vary. In some countries, men who have sex with men, people who inject drugs, sex workers, transgender people, and prisoners are disproportionally affected by HIV.
  • Women and girls represent over half (53%) of all people living with HIV worldwide, and HIV (along with complications related to pregnancy) is the leading cause of death among women of reproductive age.10 Gender inequalities, differential access to service, and sexual violence increase women’s vulnerability to HIV, and women, especially younger women, are biologically more susceptible to HIV. In many countries in sub-Saharan Africa, HIV incidence among adolescent girls and young women ages 15-24 is more than three times that among adolescent boys and young men.
  • Young people in particular face barriers to accessing HIV and sexual and reproductive health services, including age-appropriate comprehensive sexuality education.
  • Globally, in 2024, children accounted for 1.4 million people living with HIV; among children, there were 75,000 AIDS-related deaths and 120,000 new infections, the lowest number of new infections in children since the 1980s. Since 2010, new HIV infections among children have declined by 62%, though progress has stalled in recent years.

HIV & TB

HIV has led to a resurgence of tuberculosis (TB), particularly in Africa, and TB is a leading cause of death for people with HIV worldwide.11 In 2024, approximately 6% of new TB cases occurred in people living with HIV.12 However, between 2010 and 2024, TB deaths in people living with HIV declined substantially, largely due to the scale-up of joint HIV/TB services.13 (See the KFF fact sheet on TB.)

Prevention and Treatment14

Numerous prevention interventions exist to combat HIV, and new tools such as vaccines, are currently being researched.15

  • Effective prevention strategies include behavior change programs, condoms, HIV testing, blood supply safety, harm reduction efforts for injecting drug users, and male circumcision.
  • Additionally, recent research has shown that engagement in HIV treatment not only improves individual health outcomes but also significantly reduces the risk of transmission (referred to as “treatment as prevention” or TasP). Those with undetectable viral loads (known as being virally suppressed) have effectively no risk of transmitting HIV sexually.16
  • Pre-exposure prophylaxis (PrEP) has also been shown to be an effective HIV prevention strategy in individuals at high risk for HIV infection. In 2015, the World Health Organization (WHO) recommended PrEP as a form of prevention for high-risk individuals in combination with other prevention methods.17 Further, in 2016, the U.N. Political Declaration on HIV/AIDS stated PrEP research and development should be accelerated, and in 2022, WHO released guidelines for the use of long-acting PrEP.18 Most recently, WHO released new guidelines recommending the use of a twice-a-year, long-acting injectable PrEP.19 These products signal an expansion and diversification of HIV prevention options.
  • Experts recommend that prevention be based on “knowing your epidemic” (tailoring prevention to the local context and epidemiology), using a combination of prevention strategies, bringing programs to scale, and sustaining efforts over time. Access to prevention, however, remains unequal, and there have been renewed calls for the strengthening of prevention efforts, particularly as funding cuts from donors threaten progress on prevention.20

HIV treatment includes the use of combination antiretroviral therapy (ART) to attack the virus itself, and medications to prevent and treat the many opportunistic infections that can occur when the immune system is compromised by HIV. In light of research findings, WHO released a guideline in 2015 recommending starting HIV treatment earlier in the course of illness.21 Further, research on long-acting ART is currently underway.22

  • Combination ART, first introduced in 1996, has led to dramatic reductions in morbidity and mortality, and access has increased in recent years, rising to 31.6 million people (77% of people living with HIV) in 2024.
  • The percentage of pregnant and breastfeeding women receiving ART for the prevention of mother-to-child transmission of HIV increased to 84% in 2024, up from 49% in 2010.
  • While access to ART among children has increased, treatment gaps still remain, and children are less likely than adults to receive ART; treatment coverage in children was 55% compared to 77% among adults in 2024.
  • Approximately 73% of all people living with HIV are virally suppressed, which means they are likely healthier and less likely to transmit the virus. Viral suppression varies greatly by region, key population, age, and sex.

Global Goals

International efforts to combat HIV began in the first decade of the epidemic with the creation of the WHO’s Global Programme on AIDS in 1987. Over time, new initiatives and financing mechanisms have helped increase attention to HIV and contributed to efforts to achieve global goals; these include:

  • the Joint United Nations Programme on HIV/AIDS (UNAIDS), which was formed in 1996 to serve as the U.N. system’s coordinating body and to help galvanize worldwide attention to HIV/AIDS; and
  • the Global Fund to Fight AIDS, Tuberculosis and Malaria (Global Fund), which was established in 2001 by a U.N. General Assembly Special Session (UNGASS) on HIV/AIDS as an independent, international financing institution that provides grants to countries to address HIV, TB, and malaria (see the KFF fact sheet on the Global Fund).

The contributions of affected country governments and civil society have also been critical to the response. These and other efforts work toward achieving major global HIV/AIDS goals that have been set through:

  • the Sustainable Development Goals (SDGs). Adopted in 2015, the SDGs aim to “end the AIDS epidemic,” or end AIDS as a public health threat,23 by 2030 under SDG Goal 3, which is to “ensure healthy lives and promote well-being for all at all ages.”24
  • UNAIDS targets to end the epidemic by 2030. On World AIDS Day 2014, UNAIDS set targets aimed at ending the AIDS epidemic by 2030. To achieve this, countries are working toward reaching the interim “95-95-95” targets—95% of people living with HIV knowing their HIV status; 95% of people who know their HIV positive status on treatment; and 95% of people on treatment with suppressed viral loads—by 2025.25 These targets are successors to the earlier 90-90-90 targets for 2020, which were missed.26 Based on the 2024 data and trends (the latest data available),27 87% of people living with HIV knew their status; among those who knew their status, 89% were accessing treatment; and among those accessing treatment, 94% were virally suppressed.28 Additional interim “95-95-95” targets have also been set for 2025, which place a greater emphasis on social services and reducing stigma and discrimination to address inequalities that hinder the HIV response.29

Over the past decade, world leaders reaffirmed commitments to end AIDS by 203030 and adopted a Political Declaration with global commitments and targets for 2025 to address inequalities that impede the AIDS response.31 The next Global AIDS Strategy for the period 2026-2031 is currently under development.32

Global Resources

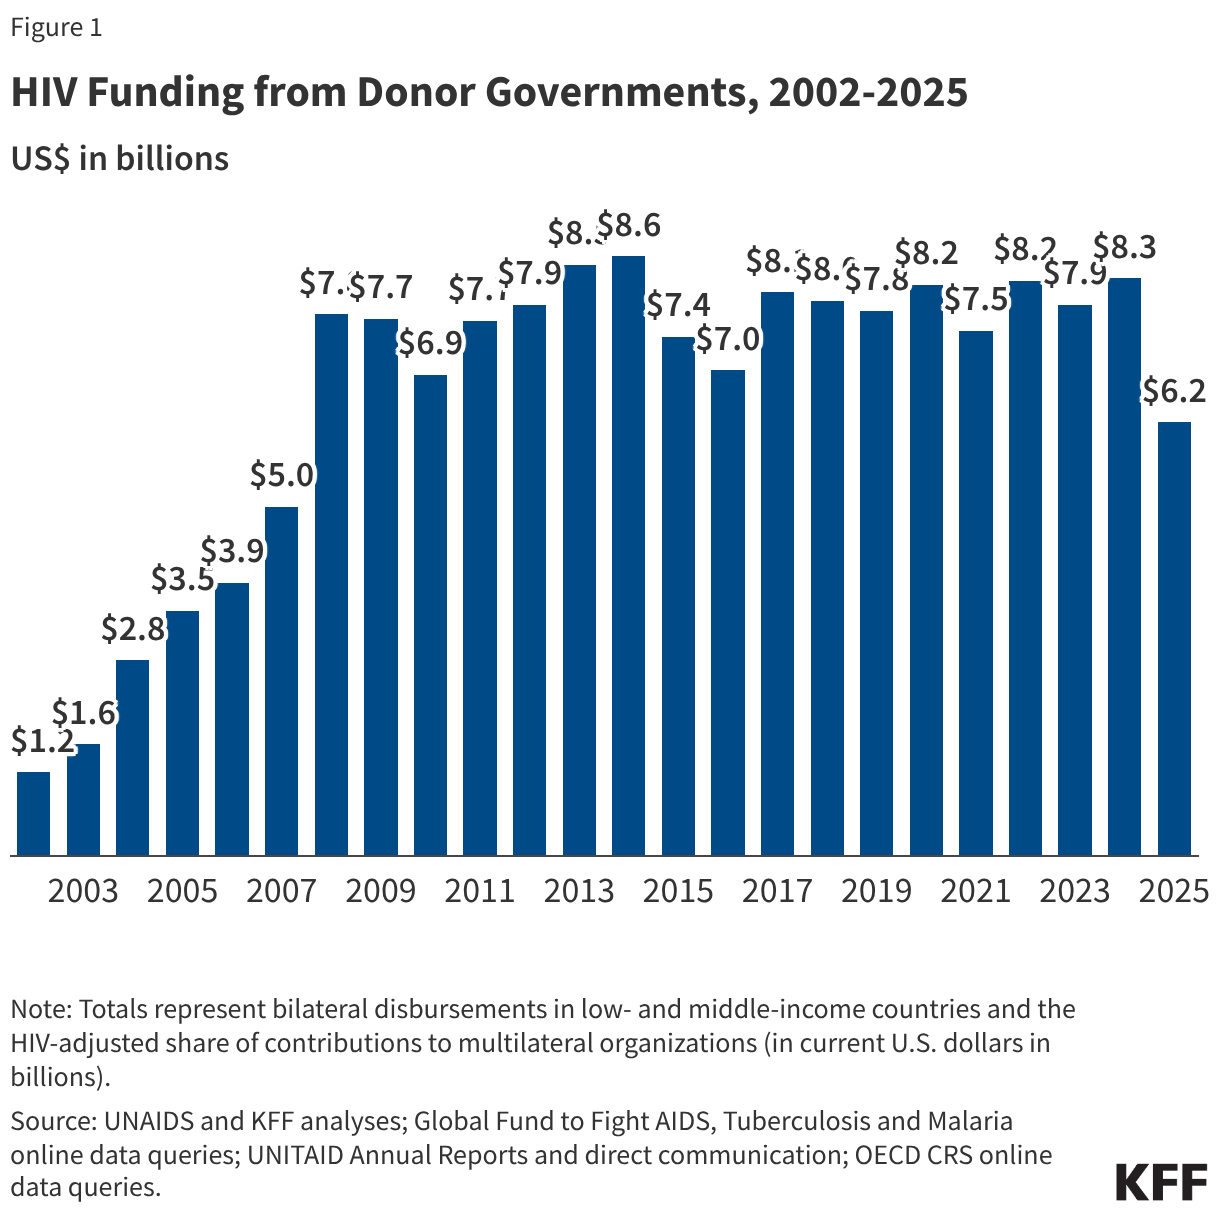
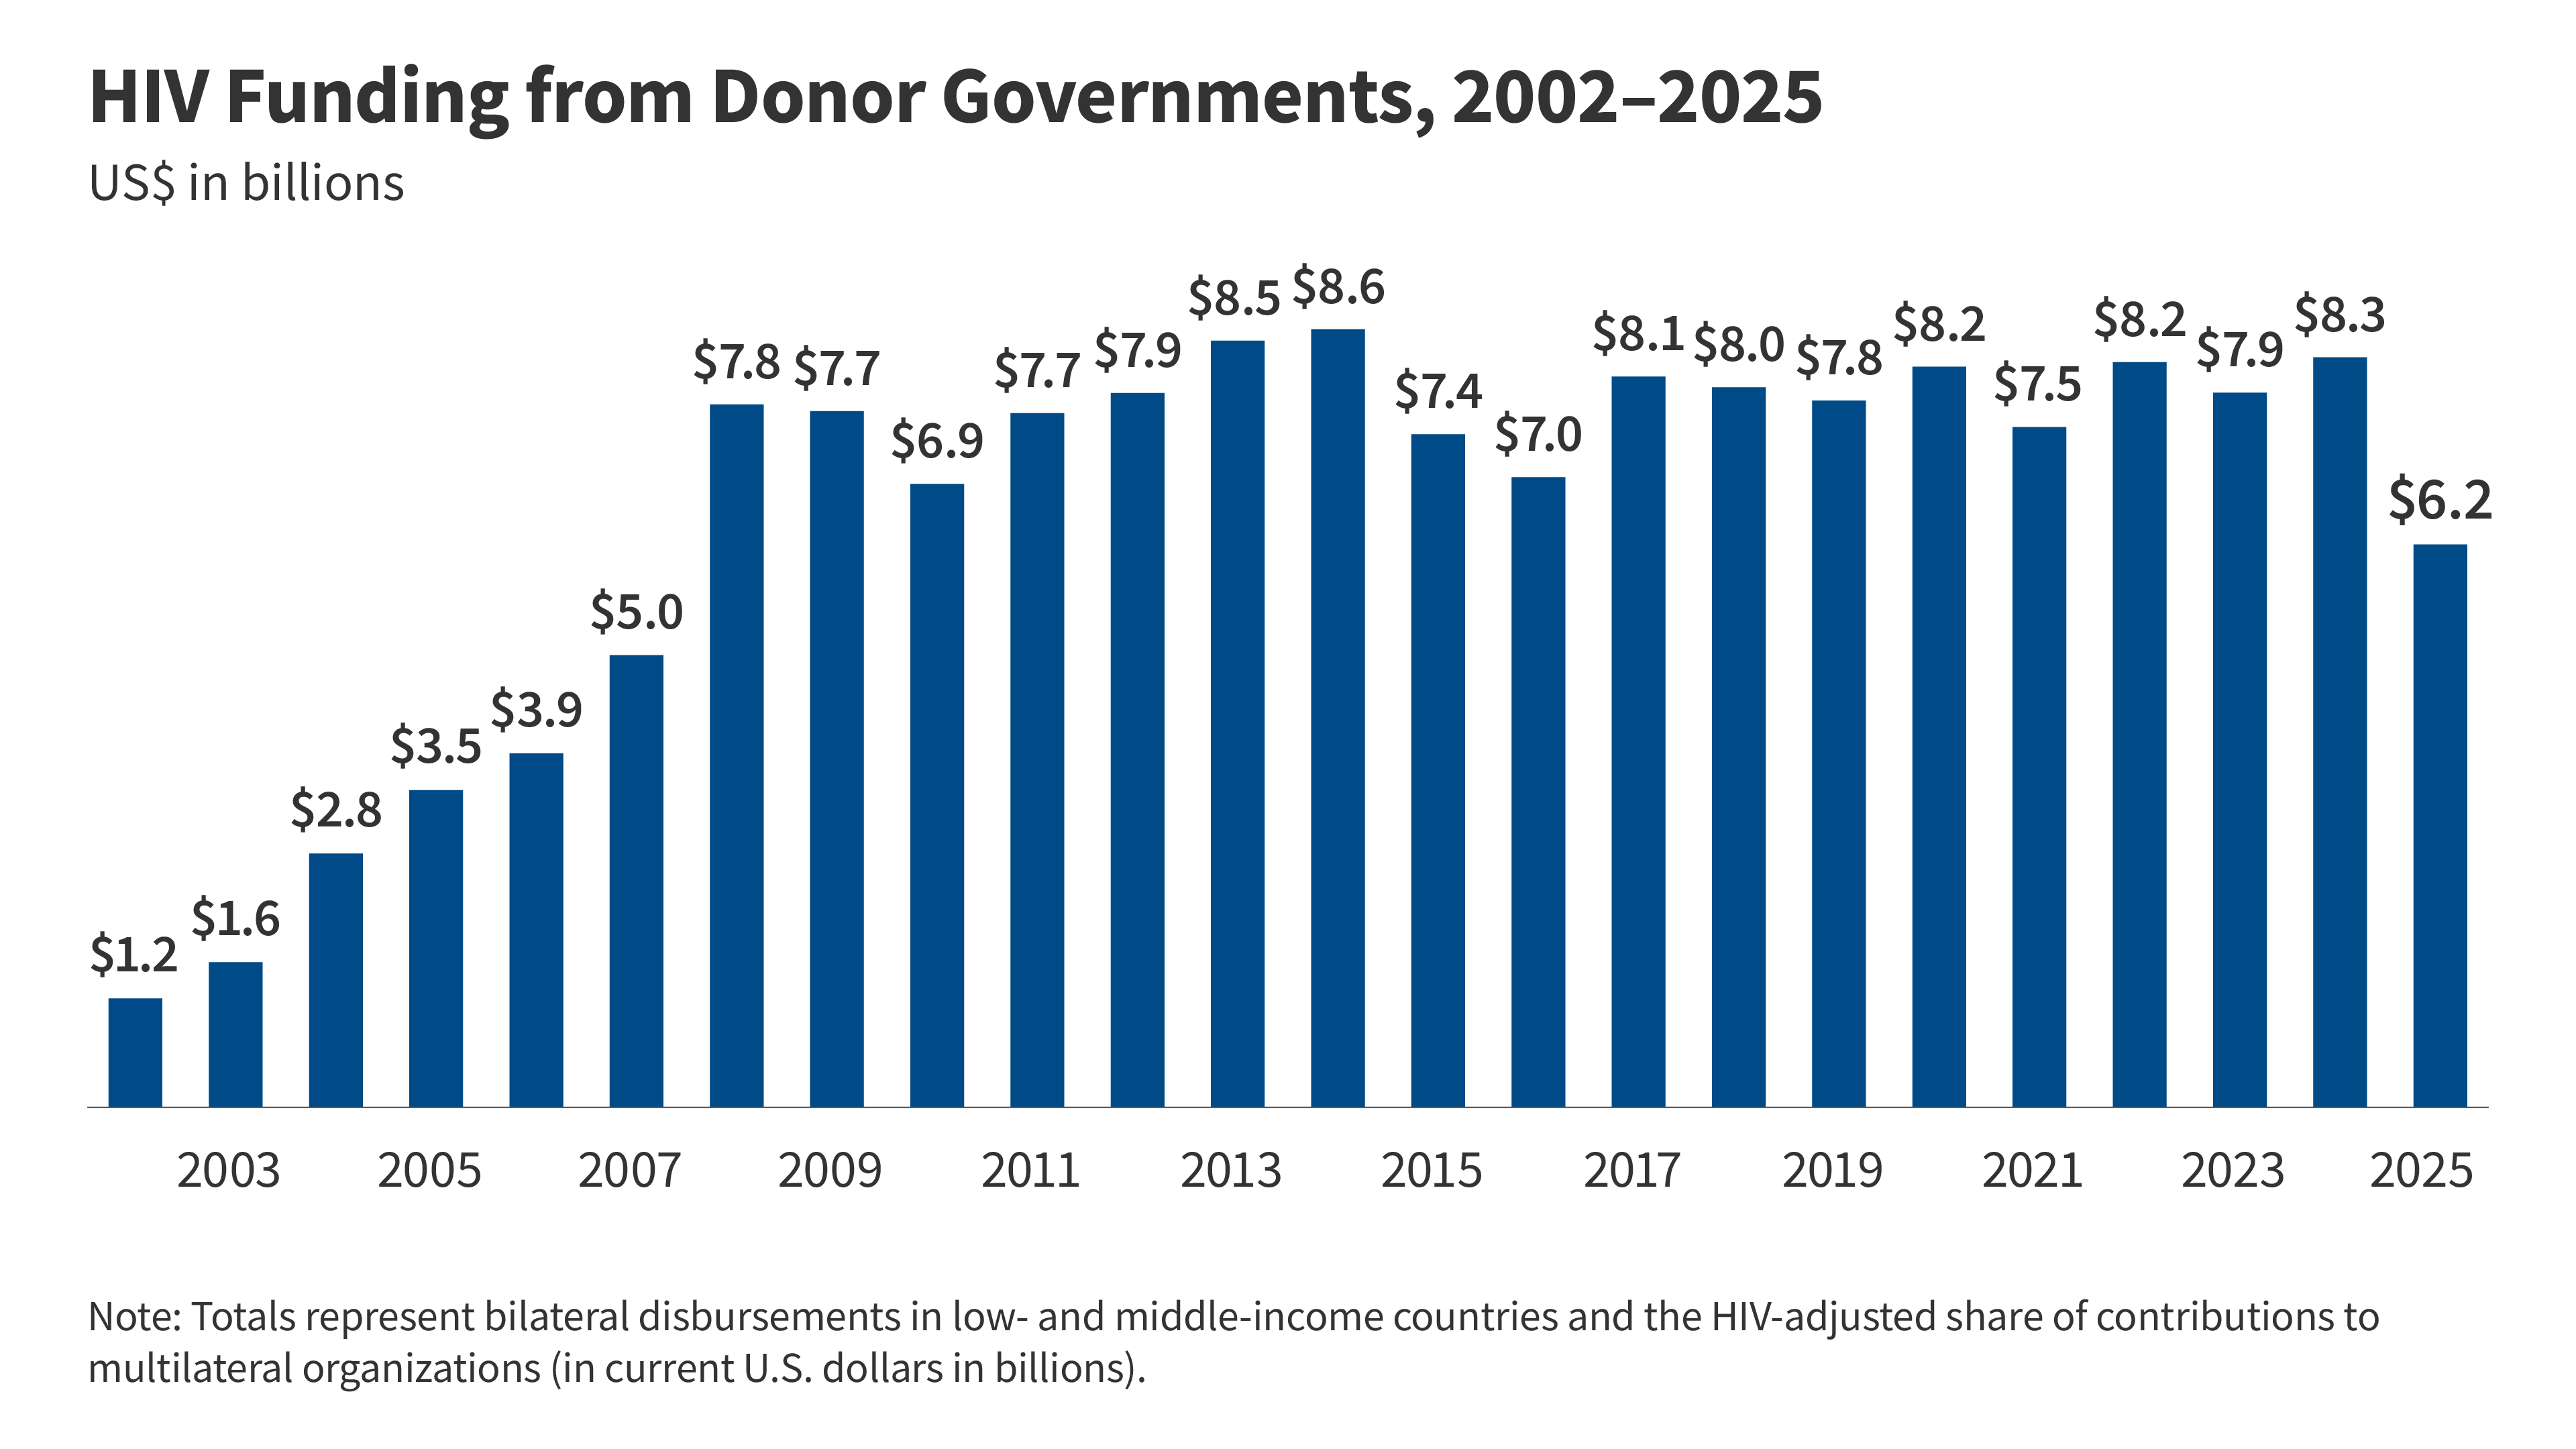
UNAIDS estimates that $18.7 billion was available from all sources (domestic resources, donor governments, multilaterals, and foundations) to address HIV in low- and middle-income countries in 2024. Of this, donor governments provided $8.4 billion (or 44% of total available resources) (see Figure 1).33 Other governments and organizations that contribute substantially to funding the global response include:

  • hard-hit countries, which have also provided resources to address their epidemics;
  • the Global Fund, which has approved over $29 billion for HIV efforts in more than 100 countries to date;34 and
  • the private sector, including foundations and corporations, which also plays a major role (the Gates Foundation, for one, has committed more than $3 billion in HIV grants to organizations addressing the epidemic, as well as provided additional funding to the Global Fund).35

Looking ahead, UNAIDS estimates at least $21.9 billion annually will be needed to meet global targets to end AIDS as a global public health threat by 2030.36 

HIV Funding from Donor Governments, 2002-2024

U.S. Government Efforts

The U.S. has been involved in HIV efforts since the 1980s and is the single largest donor to international HIV efforts in the world, including the largest donor to the Global Fund.37 The U.S. first provided funding to address the global HIV epidemic in 1986. U.S. efforts and funding increased slowly over time through targeted initiatives to address HIV in certain countries in Africa, South Asia, and the Caribbean, but they intensified with the 2003 launch of the President’s Emergency Plan for AIDS Relief (PEPFAR), which brought significant new attention and funding to address the global HIV epidemic, as well as TB and malaria.38 Since the beginning of the second Trump administration, however, the U.S. global health response has undergone significant shifts, disruption, and retraction, fundamentally altering the global health landscape and U.S. global HIV efforts through PEPFAR in particular.

PEPFAR

Created in 2003, PEPFAR is the U.S. government’s global effort to combat HIV. PEPFAR has historically involved multiple U.S. departments, agencies, and programs, particularly USAID and CDC, although that has changed (see below for more details). The program had also been carried out in close coordination with host country governments and other organizations, including multilateral organizations such as the Global Fund and UNAIDS and non-governmental organizations, including civil society.39 U.S. bilateral HIV activities spanned more than 50 countries in Asia, West Africa, and the Western Hemisphere, with U.S. support for multilateral efforts reaching even more countries.40 (For more information, see the KFF fact sheet on PEPFAR.)

Since its creation, PEPFAR, which includes all bilateral funding for HIV as well as U.S. contributions to the Global Fund and UNAIDS, has totaled over $130 billion.41 For FY 2026, Congress appropriated $6 billion in total funding for PEPFAR, including $4.7 billion for bilateral HIV programs, $45 million for UNAIDS, and $1.25 billion for the Global Fund, matching funding levels for FY 2025.42 (For more details on historical appropriations for U.S. global HIV/AIDS efforts, see the KFF fact sheets on the U.S. Global Health Budget: Global HIV, Including PEPFAR and the U.S. Global Health Budget: The Global Fund, as well as the KFF budget tracker.)

Currently, PEPFAR faces significant change, brought on by a re-evaluation of U.S. foreign assistance, the dissolution of USAID (the main PEPFAR implementing agency), and the cancellation of most PEPFAR awards. While U.S. policymakers had been increasingly looking at when and how to transition PEPFAR services and financing to country governments, the Trump administration has sought to narrow PEPFAR’s scope and significantly accelerate this timeline. Per a new U.S. strategy, the America First Global Health Strategy, the administration is developing bilateral agreements with countries to integrate PEPFAR programming with other global health areas and is planning to scale down funding over the next few years, with country governments required to increasingly co-finance these activities. (See the KFF fact sheet on the status of PEPFAR for more information.)

Endnotes

  1. UNAIDS, Global HIV statistics 2025 fact sheet; July 2025. ↩︎
  2. UNAIDS, 2025 Global AIDS Update: AIDS, Crisis and the Power to Transform; July 2025. UNAIDS, AIDSinfo website; accessed November 2025, available at: http://aidsinfo.unaids.org/. UNAIDS, 2025 Core epidemiology slides; July 2025. ↩︎
  3. AIDS is the last and most severe stage of HIV infection, during which the immune system is so weak that people with AIDS acquire an increasing amount of severe illnesses. CDC HIV Website, https://www.cdc.gov/hiv/about/. ↩︎
  4. UNAIDS, 2025 Global AIDS Update: AIDS, Crisis and the Power to Transform; July 2025. ↩︎
  5. UNAIDS, Global HIV statistics 2025 fact sheet; July 2025. ↩︎
  6. UNAIDS, 2025 Global AIDS Update: AIDS, Crisis and the Power to Transform; July 2025. UNAIDS, AIDSinfo website; accessed November 2025, http://aidsinfo.unaids.org/. UNAIDS, 2025 Core epidemiology slides; July 2025. UNAIDS, Global HIV statistics 2025 fact sheet; July 2025; UNAIDS, UNAIDS data 2025; July 2025. ↩︎
  7. UNAIDS, 2025 Global AIDS Update: AIDS, Crisis and the Power to Transform; July 2025. ↩︎
  8. UNAIDS, Women and HIV – A spotlight on adolescent girls and young women; March 2019. UNAIDS, We’ve got the power — Women, adolescent girls and the HIV response; March 2020. ↩︎
  9. Sub-Saharan Africa constitutes as East and Southern Africa and West and Central Africa. ↩︎
  10. UNAIDS, 2025 Global AIDS Update: AIDS, Crisis and the Power to Transform; July 2025. UNAIDS, Global HIV statistics 2025 fact sheet; July 2025. UNAIDS, UNAIDS 2021-2026 Strategy; Mar. 2021. ↩︎
  11. WHO, Tuberculosis, fact sheet, https://www.who.int/news-room/fact-sheets/detail/tuberculosis. ↩︎
  12. WHO, Global Tuberculosis Report 2025; 2025. ↩︎
  13. WHO, Global Tuberculosis Report 2025; 2025. ↩︎
  14. UNAIDS, 2025 Global AIDS Update: AIDS, Crisis and the Power to Transform; July 2025. UNAIDS, AIDSinfo website; accessed July 2025, http://aidsinfo.unaids.org/. UNAIDS, 2025 Core epidemiology slides; July 2025. UNAIDS, Global HIV statistics 2025 fact sheet; July 2025; UNAIDS, UNAIDS data 2025; July 2025. ↩︎
  15. UNAIDS, Get on the Fast Track; 2016. Global HIV Prevention Working Group, Behavior Change for HIV Prevention: (Re) Considerations for the 21st Century; Aug. 2008. WHO, WHO recommends long-acting cabotegravir for HIV prevention, July 2022. WHO, WHO recommends injectable lenacapavir for HIV prevention, July 2025. ↩︎
  16. UNAIDS, UNAIDS Explainer: Undetectable = untransmittable; July 2018. ↩︎
  17. WHO, Guideline on When to Start antiretroviral Therapy and on Pre-Exposure Prophylaxis for HIV; Sept. 2015. WHO, WHO expands recommendation on oral pre-exposure prophylaxis of HIV infection (PrEP); Nov. 2015. ↩︎
  18. United Nations, Political Declaration on HIV and AIDS: On the Fast-Track to Accelerate the Fight Against HIV and to End the AIDS Epidemic by 2030; June 8, 2016. WHO, WHO recommends long-acting cabotegravir for HIV prevention, July 2022. ↩︎
  19. WHO, WHO recommends injectable lenacapavir for HIV prevention, July 2025. ↩︎
  20. UNAIDS, 2025 Global AIDS Update: AIDS, Crisis and the Power to Transform; July 2025. United Nations, Reinvigorating the AIDS response to catalyse sustainable development and United Nations reform: Report of the Secretary-General; June 2017. ↩︎
  21. UNAIDS, Get on the Fast Track; 2016. WHO, Guideline on When to Start antiretroviral Therapy and on Pre-Exposure Prophylaxis for HIV; September 2015. WHO, Press Release: NIAID START Trial confirms that immediate treatment of HIV with antiretroviral drugs (ARVs) protects the health of people living with HIV; May 28, 2015. NIAID, Starting Antiretroviral Treatment Early Improves Outcomes for HIV-Infected Individuals; May 27, 2015. ↩︎
  22. NIH, News release: Long-acting HIV treatment demonstrates efficacy in people with challenges taking daily medicine as prescribed, February 21, 2024. ↩︎
  23. UNAIDS states that endings AIDS as a public health threat requires a 90% reduction in HIV incidence and mortality by 2030, compared to 2010. UNAIDS, Fast-Track: ending the AIDS epidemic by 2030; 2014. ↩︎
  24. United Nations, Transforming our world: the 2030 Agenda for Sustainable Development; 2015. ↩︎
  25. UNAIDS, Fast-Track: ending the AIDS epidemic by 2030; 2014. ↩︎
  26. These goals and targets were reiterated in the UNAIDS 2016-2021 Strategy, which also aligns with the SDGs. UNAIDS, Fast-Track: ending the AIDS epidemic by 2030; 2014. UNAIDS, UNAIDS 2016-2021 Strategy; Aug. 2015. ↩︎
  27. UNAIDS, 2025 Global AIDS Update: AIDS, Crisis and the Power to Transform; July 2025. See also KFF Dashboard: Progress Toward Global HIV Targets in PEPFAR Countries, September 2023. ↩︎
  28. UNAIDS, Global HIV statistics 2025 fact sheet; July 2025. ↩︎
  29. UNAIDS, Press Release: UNAIDS calls on countries to step up global action and proposes bold new HIV targets for 2025; November 26, 2020. UNAIDS, “2025 AIDS Targets,” webpage, https://aidstargets2025.unaids.org/#. UNAIDS, World AIDS Day Report 2020: Prevailing Against Pandemics by Putting People at the Centre; November 2020. ↩︎
  30. The 2016 U.N. General Assembly High-Level Meeting on Ending AIDS reaffirmed commitments made in the 2001 Declaration of Commitment on HIV/AIDS and the 2006 and 2011 political declarations on HIV/AIDS. UNAIDS, Declaration of Commitment on HIV/AIDS; 2001, https://www.unaids.org/sites/default/files/sub_landing/files/aidsdeclaration_en_0.pdf. UNAIDS, 2006 Political Declaration on HIV/AIDS; 2006, https://www.unaids.org/sites/default/files/sub_landing/files/20060615_hlm_politicaldeclaration_ares60262_en_0.pdf. UNAIDS, 2011 Political Declaration on HIV/AIDS; 2011, http://www.unaids.org/en/aboutunaids/unitednationsdeclarationsandgoals/2011highlevelmeetingonaids/. United Nations, 2016 Political Declaration on HIV and AIDS; 2016, https://www.unaids.org/sites/default/files/media_asset/2016-political-declaration-HIV-AIDS_en.pdf. UNAIDS, Press Release: Bold Commitments to Action Made at the United Nations General Assembly High-Level Meeting on Ending AIDS; June 10, 2016. UNAIDS, Reinvigorating the AIDS response to catalyse sustainable development and United Nations reform; 2017. ↩︎
  31. These commitments and targets align with the more recent UNAIDS 2021-2026 Global AIDS Strategy, which is focused on reducing inequalities. UNAIDS, Global AIDS Strategy 2021-2026 – Ending Inequalities. End AIDS.; March 2021. United Nations, Political Declaration on HIV and AIDS: Ending Inequalities and Getting on Track to End AIDS by 2030; June 2021. UNAIDS, Press release: United Nations High-Level Meeting on AIDS draws to a close with a strong political declaration and bold new targets to be met by 2025; June 2021. ↩︎
  32. UNAIDS, UNAIDS launches the development of the new Global AIDS Strategy 2026-2031, February 2025. ↩︎
  33. KFF/UNAIDS, Donor Government Funding for HIV in Low- and Middle-Income Countries in 2024; July 2025. UNAIDS, 2025 Global AIDS Update: AIDS, Crisis and the Power to Transform; July 2025. ↩︎
  34. Global Fund, The Global Fund Data Explorer, accessed November 2025, https://data.theglobalfund.org. ↩︎
  35. Gates Foundation, HIV Strategy Overview, accessed November 2025, http://www.gatesfoundation.org/What-We-Do/Global-Health/HIV#OurStrategy. ↩︎
  36. According to UNAIDS, the $21.9 billion estimate is down from the previous estimate of $29.3 billion because of cost efficiencies that were achieved across the HIV response.  UNAIDS, 2025 Global AIDS Update: AIDS, Crisis and the Power to Transform; July 2025. ↩︎
  37. KFF analysis of data from the Office of Management and Budget, Agency Congressional Budget Justifications, and Congressional Appropriations Bills. KFF/UNAIDS, Donor Government Funding for HIV in Low- and Middle-Income Countries in 2024; July 2025. ↩︎
  38. U.S. Congress, P.L. 108-25, May 27, 2003. KFF analysis of data from the Office of Management and Budget, Agency Congressional Budget Justifications, and Congressional Appropriations Bills. ↩︎
  39. KFF, The U.S. Government and Global Health, Sep. 2022. CRS, PEPFAR Reauthorization: Key Policy Debates and Changes to U.S. International HIV/AIDS, Tuberculosis, Malaria and Programs and Funding; Jan. 2009. ↩︎
  40. KFF analysis of data from congressional budget justification documents; PEPFAR, “Where We Work” webpage, https://www.state.gov/where-we-work-pepfar/; PEPFAR 2024 Country Operational Plan Guidance for all PEPFAR Countries; and CDC’s “Where We Work” webpage, https://www.cdc.gov/global-hiv-tb/php/where-we-work/. ↩︎
  41. KFF analysis of data from the Office of Management and Budget, Agency Congressional Budget Justifications, and Congressional Appropriations Bills. Totals include funding for bilateral HIV and contributions to multilateral organizations (specifically, the Global Fund and UNAIDS) through regular appropriations and emergency funding for COVID-19 in FY 2021. ↩︎
  42. Totals represent funding specified by Congress in annual appropriations bills and/or identified by agencies for the Department of State, USAID, CDC, and DoD. In addition, international HIV research activities are supported by the NIH Office of AIDS Research (OAR) through its annual appropriated budget, but these amounts are not considered part of PEPFAR. See KFF's “Breaking Down the U.S. Global Health Budget by Program Area” for additional information. ↩︎

Analyzing Changes in Medicare Part D Enrollment for 2026

Enrollment in Part D Stand-Alone Prescription Drug Plans Increased, Mainly Due to Growth in Employer Group Plans

Published: Mar 3, 2026

For people with Medicare, the Medicare Part D outpatient prescription drug benefit is provided by private plans, either Medicare Advantage plans that offer Part D drug coverage (MA-PDs) or, for those in traditional Medicare, stand-alone prescription drug plans (PDPs). While most beneficiaries are enrolled in Medicare private plans on an individual basis, some have coverage through a group plan sponsored by an employer or union providing retiree health benefits, either group MA plans that cover Medicare Part A and B benefits, which can also include Part D coverage, or group PDPs that cover prescription drugs only.

Analysis of recently released data from the Centers for Medicare & Medicaid Services (CMS) shows that 56.1 million people are enrolled in Medicare Part D as of February 2026, including both non-group and group plan enrollment, with more than half of Part D enrollees (56%) in MA-PDs and 44% in stand-alone PDPs, reflecting higher overall enrollment in Medicare Advantage than in traditional Medicare (Figure 1).

Between February 2025 and February 2026, enrollment growth in non-group MA-PDs (including both individual plans and special needs plans, or SNPs) exceeded growth in non-group PDP enrollment, which has flattened out but still increased modestly for 2026 (1 million and 0.5 million, respectively). Reflecting the availability of lower-premium PDPs and likely also shifts in enrollment from higher-premium to lower-premium PDPs, the average monthly enrollment-weighted premium for non-group PDPs fell from $39 to $36 between February 2025 and February 2026 (premiums for employer group plans are not available).

Over the same period, enrollment in group MA-PDs declined for the first time since 2010 and enrollment in group PDPs increased by the largest amount since 2013 (-1.2 million and 1.2 million, respectively). Overall, PDP enrollment increased by 1.7 million between 2025 and 2026, mainly due to the increase in employer group PDP enrollment.

More Medicare Part D Enrollees Are in Medicare Advantage Plans Than in Stand-Alone Prescription Drug Plans, Reflecting Overall Trends in Medicare Enrollment (Stacked Bars)

A Total of 56 Million Medicare Beneficiaries Are Enrolled in Part D, Including Both MA-PDs and PDPs, as of Early 2026

As of February 2026, 56.1 million Medicare beneficiaries are enrolled in Part D plans, with more than half (56% or 31.3 million) enrolled in MA-PDs. Enrollment in MA-PDs has generally increased steadily over time, although there was a modest reduction in overall MA-PD enrollment between February 2025 and February 2026 (from 31.4 million to 31.3 million) (Figure 1). This appears to reflect a shift in enrollment among employer group plan enrollees from group MA-PD plans to group MA-only plans with separate PDPs (as discussed below; for more details on Medicare Advantage enrollment in 2026, see KFF analysis “Medicare Advantage Enrollment Grew by About 1 Million People, Mainly Due to Special Needs Plans”).

PDP enrollment now stands at 24.9 million, including beneficiaries in both non-group PDPs and employer group PDPs, or 44% of all Part D enrollees (up slightly from 42% in 2025) (Figure 1). The overall number of PDP enrollees increased for the third year in a row and is up by 1.7 million between February 2025 and February 2026, with most of the growth (1.2 million or 70%) in employer group PDPs.

Growth in Non-Group MA-PDs Continues To Outpace Growth in Non-Group PDPs

Among non-group Part D plans, enrollment in non-group MA-PDs stands at 28.6 million as of February 2026, up 1.0 million from 2025, while enrollment in non-group PDPs now stands at 18.6 million, up by 0.5 million from 2025 (Figure 2). Enrollment in non-group PDPs is lower than its peak of 20.6 million in the late 2010s but modestly higher than in 2024, when 17.9 million enrollees were in non-group PDPs. Modest growth in non-group PDP enrollment for 2026 occurred even as the overall number of PDPs fell for the third year in a row and the number of non-group PDP options for the average Medicare beneficiary dropped from 14 in 2025 to 11 in 2026. (By comparison, the average Medicare beneficiary has 32 non-group MA-PD options in 2026, excluding SNPs.)

Enrollment in Non-group Medicare Advantage Drug Plans Has Increased Steadily While Enrollment in Non-group Medicare Part D Stand-alone Prescription Drug Plans Has Flattened Out in Recent Years (Line chart)

Among Employer Group Plans, Enrollment Decreased in Group MA-PDs and Increased in Group PDPs

Among employer group Part D plans, enrollment in group MA-PDs decreased by 1.2 million between 2025 and 2026 (down from 3.9 million to 2.7 million), while group PDP enrollment increased by 1.2 million (from 5.1 million to 6.3 million) (Figure 3). This was the first year-over-year reduction in employer group MA-PD enrollment since 2010, and the largest year-over-year increase in employer group PDP enrollment since 2013. That year, employer group PDP enrollment increased by 2.2 million (from 2.1 million to 4.3 million) as a result of the ACA’s elimination of the tax deductibility of federal subsidies for retiree drug coverage and the availability of manufacturer price discounts during the coverage gap in employer group plans, which changed the financial incentives around traditional retiree drug coverage and prompted a shift to employer group PDP coverage.

Between 2025 and 2026, Enrollment in Group Medicare Advantage Drug Plans Dropped for the First Time Since 2010, While Group PDP Enrollment Increased by the Largest Amount Since 2013 (Line chart)

The decline in employer group MA-PD enrollment and concurrent growth in employer group PDP enrollment for 2026 may reflect a strategy among employer/union groups of converting retiree health benefit offerings from contracts with MA-PDs that combine both medical and prescription drug benefits to contracting separately for medical benefits from MA-only plans and prescription drug benefits from stand-alone PDPs. This strategy would enable groups to take advantage of the Part D premium stabilization demonstration and receive additional premium subsidies provided by the federal government, which are available only to PDPs that choose to participate, not MA-PDs. For employer group PDPs, participation in the demonstration in 2026 provides a $10 per member per month premium subsidy.

Humana and Centene Saw the Largest Increases in PDP Enrollment in 2026

Part D enrollees faced wide PDP premium changes and variation across plans for 2026, as in previous years, triggering shifts in PDP enrollment. Several national PDPs are charging premiums well below $10 in many regions in 2026, giving current beneficiaries, as well as people new to Medicare, options for relatively low-cost drug coverage if they want to remain in (or choose to enroll in) traditional Medicare. This is the case even as some PDPs charged premium increases of up to $50 for 2026, the maximum increase allowed for plans participating in the Part D premium stabilization demonstration. Reflecting the availability of lower-premium PDPs and likely also shifts in enrollment from higher-premium to lower-premium plans, the average monthly enrollment-weighted premium for non-group PDPs fell from $39 to $36 between February 2025 and February 2026 (premiums for employer group plans are not available).

Humana and Centene (sponsor of WellCare PDPs) gained the most PDP enrollees between February 2025 and February 2026, likely due to reducing monthly premiums for some or all of their PDPs in many regions between 2025 and 2026 and offering low or zero premium PDP options in several regions. Enrollment in Humana’s PDPs increased by 61% (1.4 million) from 2.3 million to 3.7 million, while Centene’s PDP enrollment increased by 11% (0.9 million) from 7.8 million to 8.7 million (Figure 4, “Enrollment” tab). (Humana also gained the most Medicare Advantage enrollees overall for 2026 among all Medicare Advantage plan sponsors.) Both Humana and Centene have lower average enrollment-weighted premiums across their non-group PDP offerings in 2026 than in 2025 (Figure 4, “Average premiums” tab).

Other plan sponsors experienced smaller changes in enrollment over this period. CVS Health and Health Care Service Corporation, which lost PDP enrollees between 2025 and 2026, and UnitedHealth Group, which had a modest increase in PDP enrollment, have higher enrollment-weighted average premiums across their non-group PDP offerings in 2026 than in 2025.

Humana and Centene Gained the Most PDP Enrollees Between 2025 and 2026, With Lower Average PDP Premiums in 2026 Than in 2025 (Arrow Plot)

How Do Health Expenditures Vary Across the Population?

Published: Mar 2, 2026

In a given year, a small portion of the population is responsible for a very large percentage of total health spending. This collection of charts explores the variation in health spending across the population through an analysis of 2023 Medical Expenditure Panel Survey (MEPS) data. The analysis finds that five percent of the population accounted for nearly half of all health spending, spending an average of $72,918 annually in 2023. People with health spending in the top one percent spent an average of $150,467 per year.

The analysis also examines spending variation by age, gender, race, insurance coverage status and presence of certain health conditions. Adults who have been diagnosed with a serious or chronic disease have significantly higher out-of-pocket spending.

The chart collection is part of the Peterson-KFF Health System Tracker, an online information hub dedicated to monitoring and assessing the performance of the U.S. health system.

Health and Health Care Experiences of Immigrant Parents and Their Children During the Second Trump Term

Published: Mar 2, 2026

Summary

Actions taken by the Trump administration and Congress will likely have major impacts on health and health care for immigrant families, including children. About one in four children in the U.S. has at least one immigrant parent, and the vast majority of these children are U.S. citizens. President Trump’s increased immigration enforcement activity has contributed to significant levels of fear and uncertainty among the immigrant community, which can negatively affect the health and well-being of immigrant families and make them more reluctant to access health coverage as well as health care. Longstanding research also shows that such fears can have lifelong negative impacts on the physical and mental health of children.

This brief provides data on the health and health care experiences of immigrant parents and their children in the U.S. amid the current policy environment. Immigrant parents include naturalized citizens, lawfully present immigrants, and likely undocumented immigrants who report having a child under age 18 living in the home with them. As noted, the vast majority of children with an immigrant parent are citizens (in some cases by birthright citizenship, which President Trump has sought to restrict in a case currently before the Supreme Court). This brief is based on a KFF survey conducted in partnership with The New York Times in Fall 2025, prior to the recent ramp up of public Immigration and Customs Enforcement (ICE) activity in Minneapolis and several other areas of the country. It builds on the 2023 KFF/LA Times Survey of Immigrants and two additional surveys conducted by KFF in 2024 and  2025. Separate reports from the Fall 2025 survey examine immigrants’ health care experiences overall, experiences amid increased immigration enforcement, and the political implications of immigrant voters’ views on immigration enforcement.

Key takeaways include:

  • Immigrant parents report experiencing increased economic challenges, including paying for health care. About half (52%) of immigrant parents say that it has been harder to earn a living since January 2025. Additionally, over half (55%) say they have had problems paying for health care, housing, or food in the past 12 months, with these shares increasing since 2023.
  • Immigration-related fears are negatively impacting the health of immigrant parents and their children, including citizens and lawfully present immigrants. About a quarter of immigrant parents (27%), including six in ten (60%) likely undocumented immigrant parents, say that any of their children have expressed worries or concerns about the possibility of something bad happening to someone in their family because they are an immigrant.Nearly half (47%) of immigrant parents report experiencing negative health impacts due to immigration-related worries since January 2025, and about one in five (18%) say that their child’s well-being has been impacted.
  • Immigrant parents report health care access challenges for themselves and their children. About one in five (22%) immigrant parents report being uninsured, twice the share of those without a child in the home (11%). About one in seven (15%) immigrant parents say they have a child who is uninsured, with this share rising to about a quarter (27%) among parents who are likely undocumented and to about one in five of those with lower incomes (annual household income of less than $40,000)  (22%) or limited English proficiency (LEP) (21%).
  • Three in ten (30%) immigrant parents say any of their children missed, delayed, or skipped health care in the past 12 months due to immigration-related fears (14%), not being able to find services at a convenient time or location (13%), or cost or lack of insurance (12%). This includes about six in ten (58%) likely undocumented immigrant parents as well as 23% of naturalized citizen parents and 26% of lawfully present immigrant parents who say any of their children missed, delayed, or skipped care.

Economic Challenges

About half (52%) of immigrant parents say that it has been harder to earn a living since January 2025, and over half (55%) say that they have had problems paying for health care, housing, or food in the past 12 months. These shares are higher compared to those without a child in the home, among whom 45% say it has been harder to earn a living and 42% report problems paying for health care, housing, or food. Among immigrant parents, the shares reporting problems paying for basic needs increased between 2023 and 2025, rising from 22% to 42% for health care, from 22% to 36% for rent or mortgage, and from 21% to 32% for food.

Over Half of Immigrant Parents Report Problems Paying for Health Care, Housing, or Food in the Last 12 Months (Range Plot)

About a quarter of immigrant parents (27%), including about one in five naturalized citizens (20%) and lawfully present immigrants (23%), say that any of their children have expressed worries or concerns about the possibility of something bad happening to someone in their family because they are an immigrant (Figure 2). Among likely undocumented parents, the share rises to 60%. Additionally, about four in ten Hispanic immigrant parents (39%) as well as those with household incomes of less than $40,000 per year (41%) say their children have expressed these worries or concerns.

About a Quarter of Immigrant Parents Say Their Children Have Expressed Worries About Something Bad Happening to Family Due to Immigration Status (Split Bars)

Nearly half (47%) of immigrant parents say they have experienced negative health impacts due to immigration-related worries since January 2025 (Figure 3). These negative health impacts include increased stress, anxiety, or sadness (47%); problems sleeping or eating (29%); or worsening health conditions like diabetes or high blood pressure (19%) due to immigration-related worries.Reported negative health impacts are higher among parents (47%) compared to those without a child in the home (35%).

Nearly Half of Immigrant Parents Say They Have Experienced Negative Health Impacts Due to Immigration-Related Worries Since January 2025 (Split Bars)

About one in five (18%) immigrant parents say their child’s well-being has been negatively impacted by immigration-related worries since January 2025 (Figure 4). These impacts include problems sleeping or eating (14%); changes in school performance or attendance (12%); or behavior problems (12%). Reports of impacts on children are particularly high among likely undocumented immigrant parents (46%), parents with lower incomes (30%), and immigrant parents with LEP (24%), although over one in ten naturalized citizen (12%) and lawfully present immigrant (15%) parents report their children experienced at least one negative impact.

About One in Five Immigrant Parents Report Negative Impacts on the Well-Being of Their Child Due to Immigration-Related Worries Since January 2025 (Split Bars)

Health Coverage and Access to Health Care

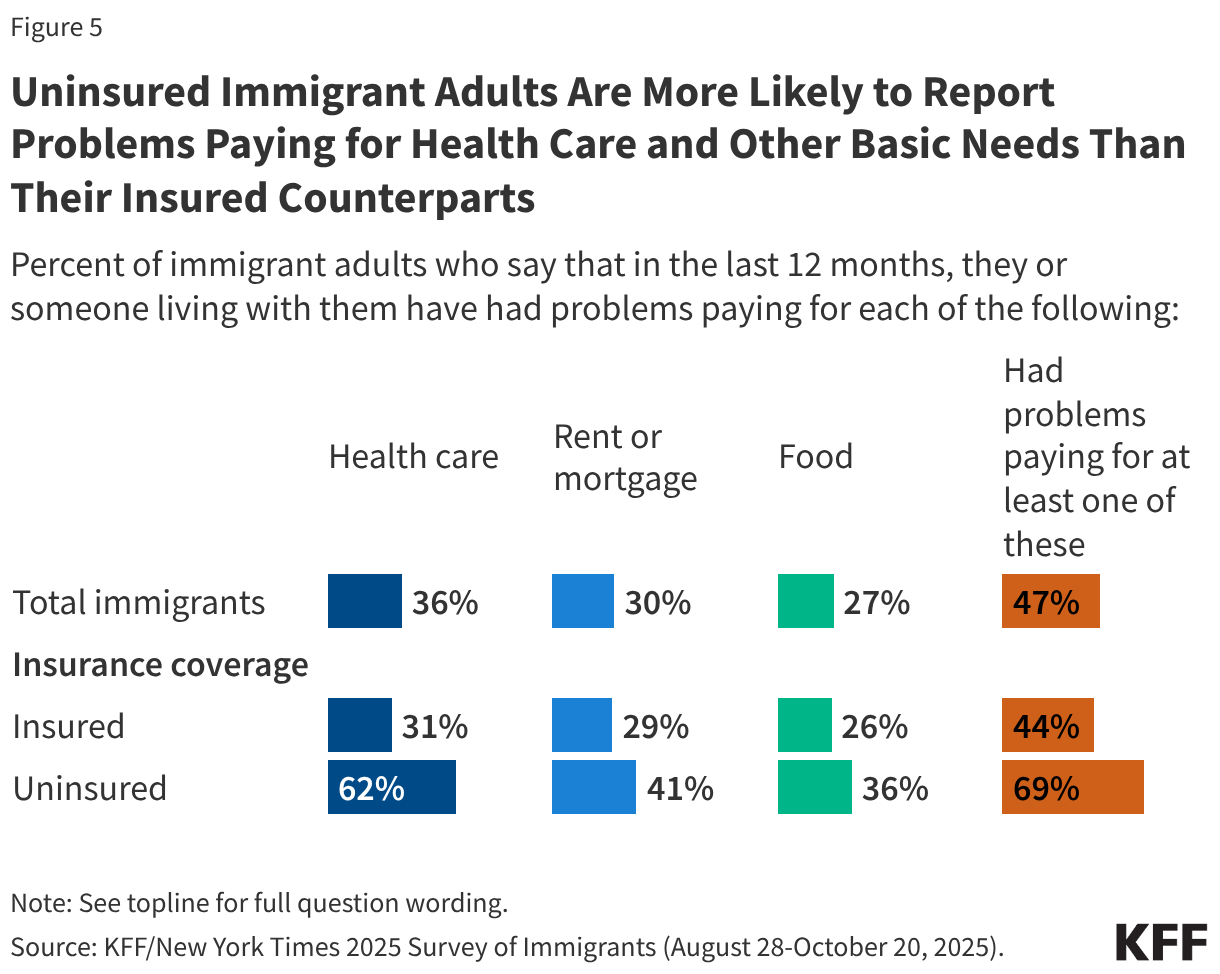
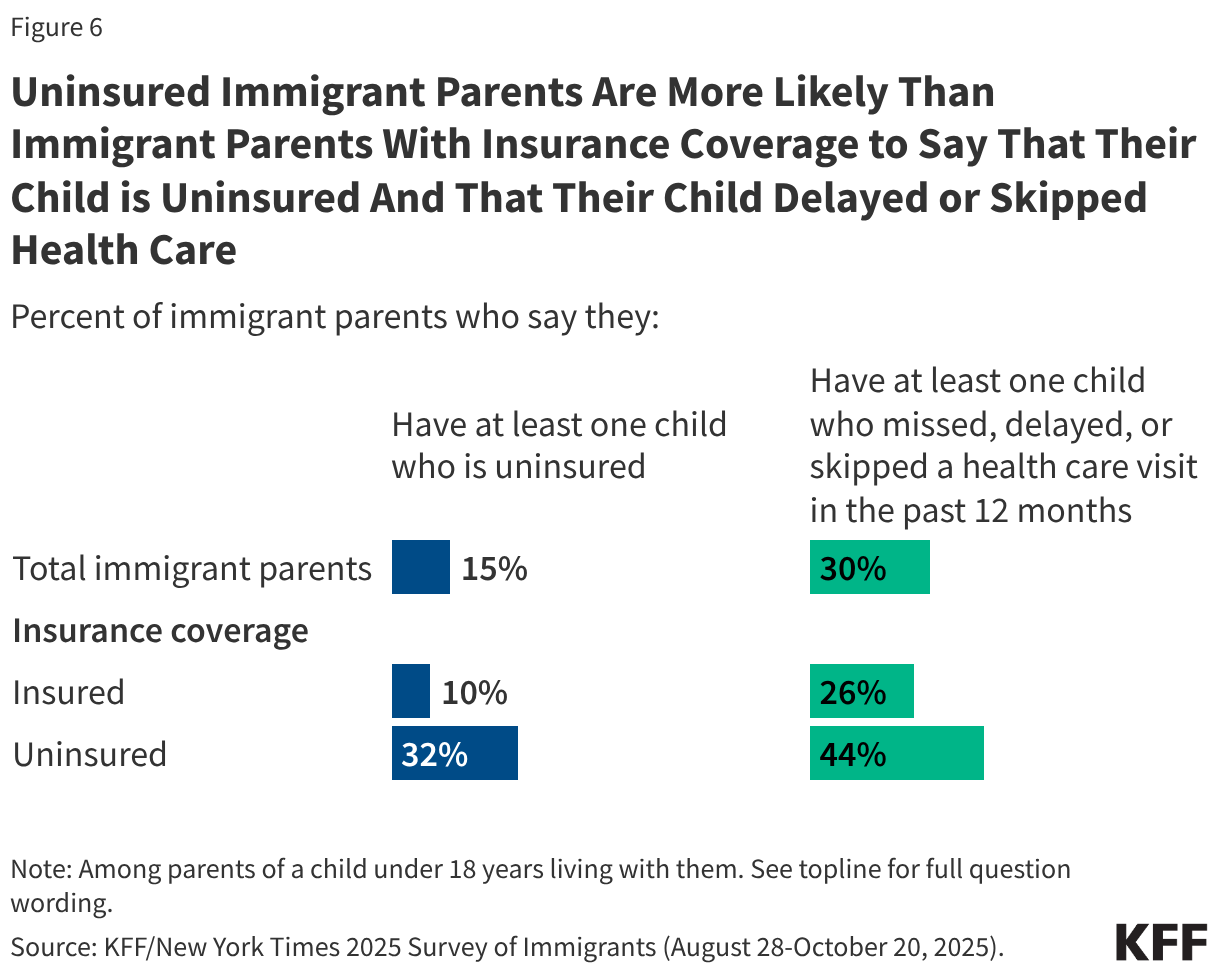
Immigrant parents are twice as likely to be uninsured as their counterparts without a child in the home (22% vs. 11%), and 15% of immigrant parents report having at least one uninsured child as of 2025. The share of immigrant parents who report having an uninsured child rises to about a quarter (27%) among those who are likely undocumented and about one in five of those with lower incomes (22%) or LEP (21%) (Figure 5). 

About One in Seven of Immigrant Parents Say That Their Child Is Uninsured (Bar Chart)

Three in ten (30%) immigrant parents say any of their children missed, delayed or skipped health care in the past 12 months due to immigration-related fears (14%), not being able to find services at a convenient time or location (13%), or cost or lack of insurance (12%) (Figure 6). While rates of delayed or skipped health care for children are higher among immigrant parents who are likely undocumented (58%), with 43% citing immigration concerns, about one in four naturalized citizen (23%) and lawfully present (26%) parents also say their children delayed or skipped care, with about one in ten identifying immigration concerns as a reason (8% and 10%, respectively).

Three in Ten Immigrant Parents Say That Their Child Skipped or Delayed Health Care in the Past 12 Months (Split Bars)

Further, one in five (20%) immigrant parents say they or a family member have avoided seeking medical care since January 2025 due to immigration-related concerns (Figure 7). This is twice the share of those who are not parents (9%). There have been reports of increased presence of ICE (Immigration and Customs Enforcement) at health care facilities following the Trump administration’s  reversal of previous policy that had protected against enforcement in these and other “sensitive locations” like schools and places of worship. These actions could further exacerbate fears among immigrant families and may lead to greater avoidance of medical care and other activities going forward for parents and children.

One in Five Immigrant Parents Say They or a Family Member Have Avoided Seeking Medical Care Since January 2025 Due to Immigration-Related Concerns (Bar Chart)

Constrained Budgets Lead States to Restrict HIV Drug Access Through Ryan White

Published: Mar 2, 2026

States are facing constrained budgets, putting pressure on HIV care and prevention programs, including the Ryan White HIV/AIDS Program. Ryan White, the nation’s HIV safety-net, is funded each year through discretionary federal appropriations, state dollars, and other sources. However, funding does not necessarily match the number of people who need support or the cost of services.

The largest component of Ryan White provides grants to states, including for their AIDS Drug Assistance Programs (ADAPs), which provide HIV treatment and insurance assistance for people with HIV. In the past, ADAPs have used waiting lists and other cost-containment measures when programs could not meet the needs of all those eligible, and in the early 2000s, waiting lists were common. Significant waiting lists were last cleared with an influx of emergency federal funding in 2013 and then were used occasionally for a few years. They have not been used for over a decade and, to date, have not returned. However, several states facing budget pressures have recently moved to institute other cost-containment measures, including restricting eligibility and scope of services, and some are considering waiting lists for the future.  This represents the first time such broad cost-containment measures have been taken since the waitlist era.

Ultimately, such changes could result in people with HIV losing access to care and treatment, which could worsen health outcomes (increasing morbidity and mortality) and leading to new HIV infections (four in ten new HIV transmissions are associated with someone who is aware of their HIV status but not in care).

State ADAPs Respond to Strain by Limiting Enrollment and Services Offered

Florida recently announced changes to its ADAP, which would dramatically limit eligibility and scope of assistance. Specifically, the state plans to reduce income1 eligibility for the program from 400% of the federal poverty level (FPL) to 130% FPL (for an individual, which is the equivalent of eligibility decreasing from a maximum income of $63,840 to $20,748 annually).

Additionally, the state plans to remove Biktarvy from its formulary. Biktarvy is the most widely prescribed antiretroviral (ARV) medication nationally (accounting for 52% of the U.S. ARV market) and the only single tablet regimen (STR) included among the national HIV treatment guidelines list of recommended initial treatment regimens. Some studies have shown that STRs improve adherence by reducing pill burden.

The state also plans to roll back its insurance assistance program. ADAPs can help cover insurance costs in addition to directly purchasing medications. Ending insurance assistance poses unique challenges, as insurance coverage allows individuals to meet both HIV-related and other health care needs and helps protect clients in the face of unexpected medical costs (e.g. through out-of-pocket maximums).2 With expiration of enhanced Affordable Care Act premium tax credits, out-of-pocket premiums for people in ACA plans are increasing substantially this year.

The changes in Florida have received significant push back from advocates, patients, and providers, and the state was sued for proceeding with these changes without formal rule making. (The state then issued a proposed rule which it followed with emergency rulemaking. Litigation continues seeking to block implementation).

Florida, however, is not alone. New data from the National Association of State and Territorial AIDS Directors (NASTAD) indicate that 23 states (including Washinton, D.C.) have implemented or are considering ADAP cost-containment measures.3 Eighteen (18) ADAPs, including Florida‘s, have already made or are making changes and five additional states report that they are considering introducing such measures in the future. Further, 12 of the 18 states already implementing cost-containment measures are considering additional changes for the future.

For example, in addition to Florida, Pennsylvania, Kansas, Delaware, and Rhode Island have also reduced income eligibility for their programs (though to a lesser degree). Other changes states are exploring or implementing include reducing formularies (though, so far, none as consequential as removing Biktarvy), reducing funding for medical and support services, making recertification more stringent (which can create churn and lead to program disenrollment), implementing annual client spending caps, and restricting or ending health insurance assistance.

At Least 18 ADAPs Have Taken Cost-Containment Actions, 5 More Are Considering Future Action (Choropleth map)

To date, no state has implemented a waiting list, a measure widely seen as a last resort. However, Arkansas, Louisiana, and New Jersey report considering implementing one as a future cost-containment measure.

Multiple Factors Are Exerting Budget Pressures on ADAP

There are a range of factors affecting ADAP budgets. These include, but are not limited to, the following:

Federal ADAP Funding Not Keeping Pace With Inflation

Since 1996, Congress has allocated (or “earmarked”) a set amount of funding for ADAPs during the annual appropriations process. After modest funding levels in the late 1990s, followed by significant growth in the early 2000s, ADAP inflation-adjusted appropriations have declined by 31% since 2005.4 The decline is largely attributable to more than a decade of flat funding in nominal dollars. When adjusted to 1996 dollars, the FY25 appropriation ($438.8 million) has similar purchasing power as the program’s FY1999 funding level ($434.0 million).5 In other words, in the last 20 years, ADAP funding has not kept pace with inflation, even before accounting for enrollment growth and increased costs (discussed below).

ADAP Earmark in Nominal Dollars and Adjusted for Inflation (1996 dollars) (Line chart)

In the NASTAD report ADAPs identified growing client enrollment, growing drug costs, and rising insurance costs as the top three drivers of budget concerns. These concerns are explored further below:

Increased Client Enrollment

While modern era federal ADAP funding has not kept pace with inflation, the number of ADAP clients served has increased significantly. The number of clients served increased by 56% from 2007 (the first year with available data for the full year) to 2024 (the most recent year with available data), rising from 165,3826 to 257,644 clients served. Adjusted for inflation, appropriations per client served dropped from about $3,600 in 2007 to approximately $1,700 in 2024. Additionally, the national HIV treatment guidelines have evolved to recommend HIV treatment at the time of diagnosis -as opposed to starting at signs of disease progression- which has led to more people with HIV having an indication for treatment.

Rising HIV Drug Costs

Another factor impeding the reach of ADAP dollars is the increasing cost of drugs for HIV treatment. A recent analysis found that the average wholesale price (AWP) of recommended initial antiretroviral regimes in 2012 ranged from an AWP of $24,970 to $35,160, increasing to $36,080 to $48,000 in 2018. Costs have generally increased since then. Data in the treatment guidelines show that the AWP for Biktarvy (again the number one treatment regimen for people with HIV and only STR recommended by the treatment guidelines start list) was $61,000 in 2025. The 2025 AWP for other recommended (two-pill) regimens ranged from $34,320 to $65,196. While ADAPs do not pay the full AWP because they have access to price discounts through the 340B drug pricing program and supplemental manufacturer rebates, increasing drug prices may still affect them; it is a main concern cited by ADAPs regarding cost challenges. Additionally, ADAPs ability to generate rebates (which make up a growing share of their budgets) through Medicare have diminished due to programmatic changes, including adoption of the out-of-pocket cap in Part D – by introducing the cap, ADAPs and other 340B entities, have less opportunity to generate rebates on claims because they make fewer cost-sharing payments.

Increased Insurance Premium Costs and Expiration of Enhanced Tax Credits

As mentioned above, ADAPs can also purchase health insurance for eligible clients. However, the cost of individual market coverage is on the rise, with the expiration of the enhanced premium tax credits being a particular driver and premium increases also playing a role.

ACA premium tax credits help make marketplace plans more affordable for people with low to moderate incomes. They were first enhanced as part of the American Rescue Plan Act in 2021 and extended by Congress through 2025, but have since expired due to the lack of a bipartisan Congressional agreement to continue them. The enhanced tax credits had improved insurance affordability for ADAPs purchasing coverage on behalf of clients, including for those previously eligible for the less generous ACA subsidies and, newly, for those with incomes over 400% FPL, a group for whom premium costs were limited to 8.5% of income. Without the enhanced credit those 100-400% FPL revert to the original, less generous, ACA tax credits and those over 400% FPL have lost financial assistance altogether. For enrollees keeping the same plan, expiration of the enhanced premium tax credits is estimated to more than double what subsidized enrollees previously paid annually for premiums—a 114% increase from an average of $888 in 2025 to $1,904 in 2026.

Additionally, after holding relatively steady since 2020, premiums increased steeply between 2025 and 2026, with the average premium cost for benchmark plans increasing by 26%7, with significant variation across states. Some southern states with high HIV prevalence saw especially large average increases (e.g. 33% in Florida and 35% in Texas). These premium increases occurred for a range of reasons including, but not limited to, higher health care costs, use of expensive GLP-1 drugs, the threat of tariffs, and the expiration of the enhanced premium tax credits. While the vast-majority of ADAP clients have modest incomes, these costs will be borne out most acutely for the 7% of clients served by insurance purchasing who have incomes over 400% FPL, a group who lost the enhanced tax credits that previously capped premium costs as a share of their income. ADAPs covering individuals in this higher income group face a two-fold setback – loss of enhanced tax credits and no protections against rising premiums. 

Additionally, individuals who lose ADAP insurance coverage due to cost-containment measures may find financing coverage independently more challenging due to reduced tax credit generosity and increases in premiums.

Looking Ahead

While ADAPs have sought to leverage additional state funds, drug rebates, and capture limited emergency and supplemental funding, these efforts have not remedied budget shortfalls, leading many to institute cost-containment measures. ADAPs may increasingly face budget pressures that could lead to additional such measures in the future. This could leave growing numbers of people with HIV ineligible for safety-net services, particularly if states further lower income eligibility limits or institute waiting lists. The expiration of enhanced tax credits amplifies these challenges, both increasing costs for programs and leaving those who are ineligible for ADAPs with fewer affordable alternatives. Limiting access to Ryan White services will in turn affect the ability of people with HIV to stay engaged in HIV treatment, a cornerstone of national efforts to address the HIV epidemic.

Endnotes

  1. Except for cost-sharing assistance which will remain available for those up to 400% FPL. ↩︎
  2. It is a federal requirement that insurance purchased through Ryan White be cost-effective compared to direct drug purchasing and  allows programs to generate 340B revenue.  ↩︎
  3. 44 states, including DC, responded to the survey. In addition, information on FL was publicly available. It is possible, but unknown if, the remaining states are implementing or considering cost-containment measures. ↩︎
  4. Adjusted using annualized CPI-U. ↩︎
  5. Full year CPI-U data for 2026 not yet available. ↩︎
  6. KFF and NASTAD. National ADAP Monitoring Project. 2009. https://www.kff.org/wp-content/uploads/2013/01/7861_es.pdf ↩︎
  7. The second-lowest-cost silver (benchmark) premium for a 40-year-old in each county and weighted by county plan selections. ↩︎

How Will the Loss of Enhanced Premium Tax Credits Affect Older Adults?

Published: Feb 26, 2026

With the expiration of the Affordable Care Act (ACA) Marketplace’s enhanced premium tax credits as of December 31, 2025, the average ACA enrollee who received a premium tax credit faces a doubling of their premium payments for the same plan. Older adults, who make up a large share of Marketplace enrollees, are disproportionately affected by the loss of enhanced premium tax credits. About one-third of all Marketplace enrollees (8 million people) were between ages 50 and 64 in 2023 (the most recent year of data available), constituting a sizeable portion of those purchasing Marketplace plans. The number of people with ACA Marketplace coverage generally increases with age, peaking at age 64, as the chart below shows.

Marketplace enrollees between the ages of 50 and 64 are disproportionately affected by the expiration of the enhanced premium tax credits, not just because they make up a large number of Marketplace enrollees, but also because the cost of Marketplace premiums tend to rise with age. Older ACA enrollees with annual incomes just above 400% of the federal poverty line (FPL) are expected to see the largest increases in premium payments.  Older adults also make up a relatively large share of ACA Marketplace enrollees with incomes above 400% FPL, who will no longer be eligible for any assistance with the expiration of the enhanced premium subsidies.

Distribution of Enrollees by Age in the ACA Marketplace, 2023 (Column Chart)

Why do older adults purchase ACA Marketplace plans?

People in their late 50s and early 60s rely on the ACA Marketplace for health insurance coverage for a variety of reasons. Across all ages, most Marketplace enrollees are working, but they often work in fields that frequently do not offer employer health insurance, are self-employed, or own or work at small businesses. Among direct purchase insurance enrollees in their early 60s, nearly half (45%) are working full or part time, but about a third (35%) are retired, and 21% are not working because of a disability, have caregiving responsibilities, or other reasons.

Many Adults In Their Early 60s Purchasing Their Own Health Insurance Are Working (Bar Chart)

While people in the U.S. have been retiring at later ages in recent years, on average, many people retire earlier than expected and often do so involuntarily (e.g., because they are too sick to work, can no longer do physically demanding work, or were laid off and could not find new employment). A survey by the Employee Benefit Research Institute found that most people who retire early do so for reasons beyond their control, while two in five retired early because they felt they could afford to do so.

As the number and share of employers offering retiree health benefits to pre-Medicare retirees continues to shrink, fewer people who leave the workforce before age 65 have access to retiree health benefits through their former employers. In 2025, only 27% of large firms (with 200 or more workers) that offered health benefits also provided retiree coverage to at least some employees under age 65. For older adults without access to an employer-based plan, ACA coverage may be their only insurance option until they become eligible for Medicare at age 65.   

Why have older adults been disproportionately impacted by the expiration of enhanced premium tax credits?

Across all ages, on average, premium payments for subsidized enrollees are estimated to have more than doubled in 2026 for enrollees wanting to keep the same plan, rising an average of 114%, because of the expiration of the enhanced premium tax credits. However, some enrollees could have switched to a plan with a lower premium but higher deductible to lessen their premium payment increases. Around nine in 10 ACA enrollees have annual incomes less than 400% FPL and will therefore continue to receive some tax credit without the enhanced tax credits, but at a lower level of federal financial assistance; most enrollees over age 50 will likely continue to receive tax credits.

However, older, middle- and upper-income ACA enrollees are disproportionately affected by the spike in premium payments. This is for three main reasons. First, people ages 50-64 make up about half of individual market enrollees with incomes above 400% FPL, meaning they will not be eligible for any federal financial assistance without the enhanced premium tax credits. Second, because premiums in the ACA marketplace are higher for older than younger adults, this group faces unsubsidized premiums that are up to three times higher  than for younger enrollees. In 2026, unsubsidized benchmark premiums increased by 26% on average, the largest increase in eight years, driven in part by an expectation that healthier enrollees would drop coverage as the enhanced tax credits expire. As a result, older, middle- and upper-income enrollees faced a “double whammy” of both the loss of all federal premium financial assistance and an increase in the cost of unsubsidized premiums that is larger than other age groups.
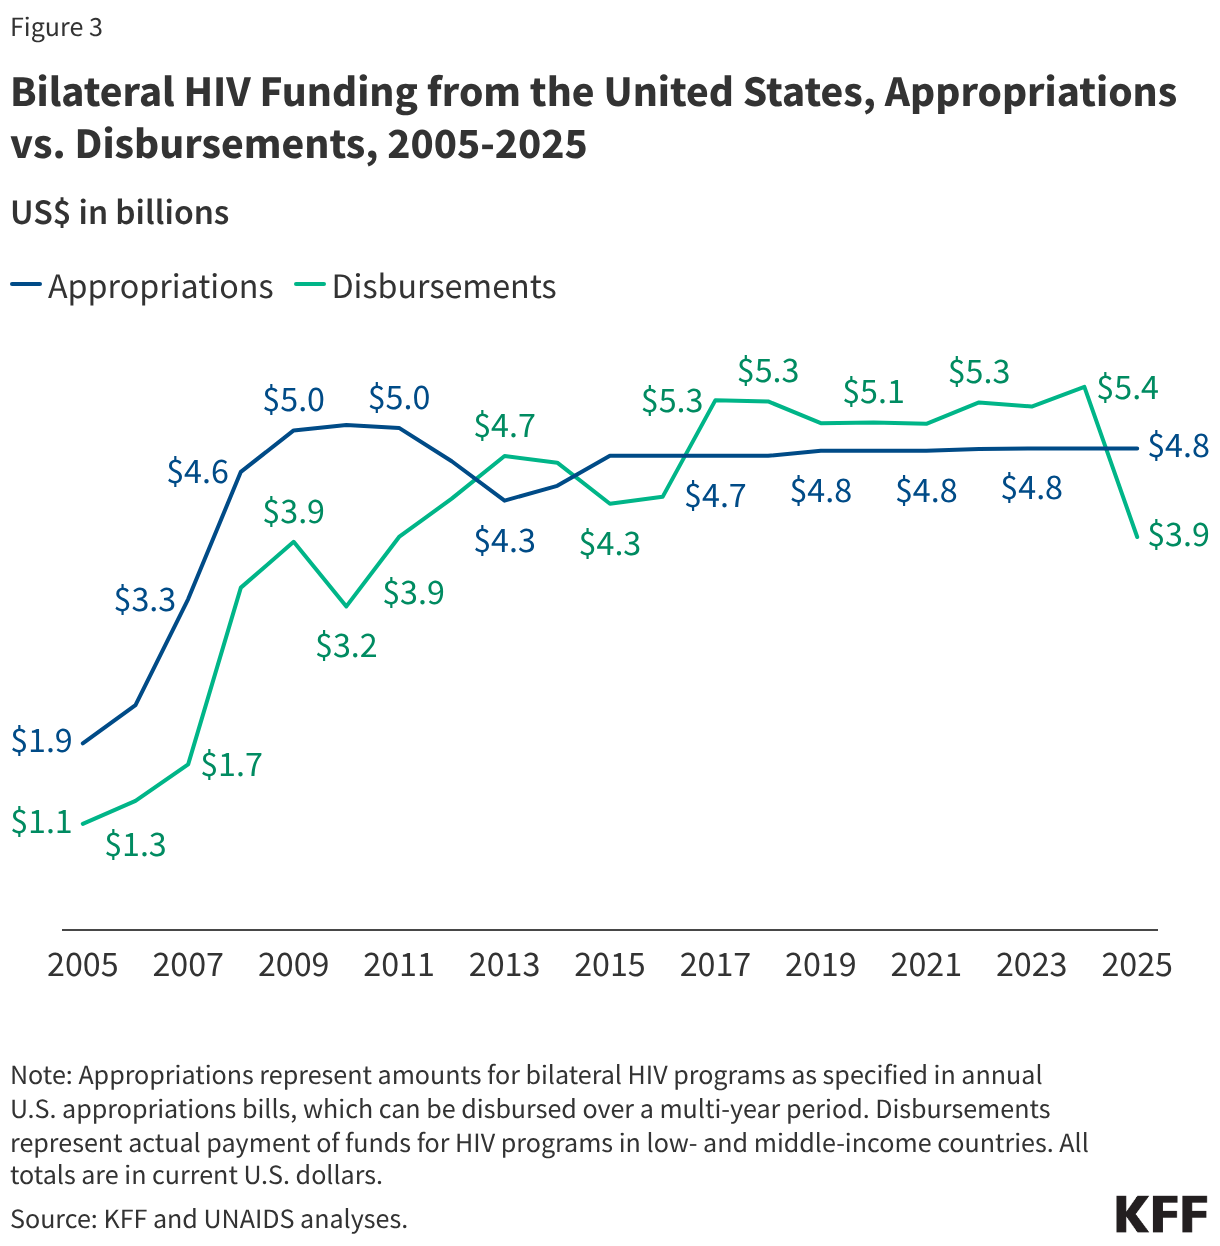
Third, many ACA enrollees in their 50s and early 60s were already signed up for one of the lowest-premium plans available to them and therefore had limited options to switch to a lower-premium plan for the 2026 plan year. Of ACA Marketplace enrollees aged 50-64 not receiving cost-sharing reductions (and therefore likely with incomes over 250% of poverty), most (64%) were already enrolled in a bronze plan, 22% were in a gold plan, and just 13% were in a silver plan for the 2023 plan year. Those in a silver or gold plan in 2025 could have switched to a bronze plan for 2026 to mitigate the increase in premium payments but would then have a deductible much higher than their previous plan.

For 2026 health coverage, the average gold plan deductible is $1,722, the average silver plan deductible (without cost-sharing assistance) is $5,304, and the average bronze plan deductible is $7,476.

How much have premium payments increased for older ACA enrollees, now that enhanced tax credits expired?

Middle-Income Adults in Their Early 60s Could Pay Thousands More Toward Their Insurance Premiums Without Enhanced Tax Credits (Stacked Bars)

On average, a 60-year-old with an income of $65,000 (just over four times the poverty level) pays $10,389 more annually ($865 per month) toward their premium now that enhanced premium tax credits have expired.

The national average annual unsubsidized premium payment for a 60-year-old in 2026 is $11,625 for the lowest-cost bronze plan, $15,914 for the benchmark silver plan, and $15,672 for the lowest-cost gold plan. (Due to “silver loading” unsubsidized silver plans are often priced similarly to gold, which is why few middle- or higher-income people, who are ineligible for cost-sharing reductions, are enrolled in silver plans).

On average, with enhanced premium tax credits, a 60-year-old spent 2% of their annual income of $65,000 on a bronze plan. However, without enhanced premium tax credits, the average bronze plan costs the same 60-year-old 18% of their annual income. Similarly, with enhanced premium tax credits, the average silver and gold plan would each cost a 60-year-old making $65,000 per year about 8.5% of their income. However, with the expiration of the enhanced premium tax credits, the average silver and gold plan would now cost nearly one-quarter (24%) of the same 60-year-old’s annual income.

Depending on location, some older enrollees could expect to pay less or more. The average annual unsubsidized 2026 premium for the lowest-cost bronze plan for a 60-year-old is highest in Wyoming ($20,005), West Virginia ($19,747), and Alaska ($17,045). By contrast, Maryland ($7,215), New York ($7,318), and Massachusetts ($8,002) have the lowest average unsubsidized bronze premiums for a 60-year-old.

Enhanced Premium Tax Credits Reduced the Financial Impact of Premiums the Most for Enrollees Nearest Subsidy Cliff (Choropleth map)

An annual income at 401% FPL represents an annual salary of $62,757 for an individual in the contiguous United States. Because the cost of living is higher in Alaska and Hawaii, 401% of federal poverty is $78,396 and $72,140 for individuals there, respectively. In 46 states and the District of Columbia, a 60-year-old at 401% of poverty will see their average annual premium payment for a benchmark silver plan at least double without enhanced tax credits.

As seen in Figure 4, in 19 states, this person would see their premium payment at least triple on average for a benchmark silver plan, consuming more than 25% of annual income. States with the highest premium payment increases due to expired enhanced tax credits for a 60-year-old at 401% of poverty purchasing a benchmark silver plan are Wyoming ($22,452 increase per year), West Virginia ($22,006), and Alaska ($19,636). The smallest increases caused by the loss of enhanced tax credits for what enrollees pay annually for the benchmark silver plan are in New York ($4,469), Massachusetts ($4,728) and New Hampshire ($4,877).

Methods

Age of ACA Marketplace enrollees was obtained using the 2023 Enrollee Data Gathering Environment (EDGE) Limited Data Set from CMS. Enrollees were restricted to those whose longest enrollment during the year was in an on-exchange individual plan. When determining whether enrollees received cost-sharing reductions, the longest enrollment during the year was considered. Employment status by age and income come from the 2025 Current Population Survey Annual Social and Economic Supplement (ASEC). Those with direct purchase insurance exclude respondents age 65 or older and are dually insured with employer-sponsored coverage, Medicaid, or Medicare. Insurance status refers to current year and employment status pertains to the full preceding year. Retired individuals may have worked for part of the year; working includes full- and part-time employment for the entire year.

This work was supported in part by The John A. Hartford Foundation. KFF maintains full editorial control over all of its policy analysis, polling, and journalism activities.

VOLUME 41

How AI Can Both Detect and Enable Fraudulent Research


Highlights

Nearly 10% of cancer research papers showed signs of being fabricated by “paper mills” that sell manuscripts at industrial scale, with the share increasing exponentially over time, according to new research. The problem may intensify as generative AI becomes more sophisticated, prompting lawmakers to demand information from federal agencies about safeguards in place.

And, persistent claims that physicians are financially incentivized to promote vaccines may be contributing to vaccine hesitancy and declining trust, even as recent analyses show doctors typically break even or lose money when administering vaccines.


AI & Emerging Technology

Machine Learning Can Help Detect “Paper Mills,” Even as Generative AI May Contribute to Rise in Fraudulent Papers

What does new research show about the prevalence of fraudulent papers?

  • As generative AI makes it easier to produce fraudulent papers, researchers are turning to AI-powered detection methods in response. A study published in BMJ developed a machine learning model to identify cancer research papers with similarities to known “paper mill” publications that write and sell manuscripts at industrial scale. When applied to millions of cancer research papers published between 1999 and 2024, the model found that nearly 10% showed signs of coming from these paper mills, sharing textual characteristics with retracted publications.
  • The number of flagged papers increased exponentially over time, rising from about 1% in the early 2000s to over 15% of annual cancer research output by the 2020s. Flagged papers were not limited to low-impact journals, with the share of these papers in high-impact journals also increasing over time to over 10% in recent years.

Lawmakers demand safeguards

The study comes as trust in medical institutions, including scientific journals, becomes increasingly politicized, with officials questioning the legitimacy of leading medical journals. House Republicans sent oversight letters in February 2025 to five federal agencies, demanding information on safeguards to prevent falsified or fraudulent studies from influencing federal grants and research. The letters specifically raised concern about paper mills linked to the Chinese Communist Party, arguing that pressures imposed on Chinese researchers have increased demand for fabricated research. The letters note that major publishers have retracted thousands of papers linked to paper mill activity, with some forced to shut down journal subsidiaries after discovering widespread fraud.

Why this matters

The findings suggest that paper mills represent a large and growing threat to research integrity, with generative AI potentially exacerbating the problem through automated text generation. As AI tools become more sophisticated and accessible, fraudulent paper mill activity may increase, requiring ongoing development of detection methods and stronger institutional safeguards to protect research integrity. Fabricated research entering the scientific literature can misdirect research funding and erode public trust in medical research at a time when confidence in scientific institutions is already declining.


What We’re Watching

Pediatricians Do Not Receive Illegal Financial Incentives to Vaccinate, Despite Persistent Claims

Claims that pediatricians receive illegal financial incentives to vaccinate children have continued to circulate by lawmakers in February, despite federal laws that prohibit pharmaceutical companies from paying providers to administer vaccines. Last month, Texas Attorney General Ken Paxton announced a formal investigation into “unlawful financial incentives” related to childhood vaccine recommendations, alleging that doctors are paid based on the number of vaccines they administer. Similar claims have circulated on social media for months and have been echoed by federal health officials, including Robert F. Kennedy Jr., who stated last summer that doctors were being “paid to vaccinate, not to evaluate.” While quality-of-care incentive programs from insurance companies do exist, these are legal programs, not offered by vaccine manufacturers, and are based on dozens of health metrics beyond vaccines. Recent analyses have shown that pediatricians typically break even or lose money when administering vaccines, particularly when serving people who are uninsured or who rely on Medicaid.

What To Watch Out For: Despite these persistent false claims, the KFF/Washington Post Survey of Parents found that children’s pediatricians were the most trusted source of vaccine information among parents, including across partisanship. KFF will continue to monitor whether the persistence of these unfounded claims may contribute to declining confidence in providers’ recommendations.

Stacked bar chart showing percent who say they trust specific people and institutions a great deal, a fair amount, not much, or not at all to provide reliable information about vaccines.

Claims that the Keto Diet Can Cure Mental Illness Draw Attention, Despite Lack of Robust Evidence

Health and Human Services (HHS) Secretary Robert F. Kennedy Jr. claimed earlier this month that the ketogenic diet, which emphasizes higher consumption of fats and proteins while limiting carbohydrate intake, could “cure” schizophrenia. Kennedy cited research from a Harvard researcher, who has since challenged the characterization. The researcher emphasized that he has not claimed to “cure” schizophrenia or other mental illnesses and does not advise patients to try the diet without close medical supervision. Kennedy’s claims overstate preliminary research into whether the diet might help people with mental health disorders. Early research has explored whether ketogenic diets may influence biomarkers and metabolic factors associated with severe mental health conditions, but the current body of evidence does not establish the diet as a cure for schizophrenia or other mental illnesses. A 2025 American Psychiatric Association (APA) policy paper describes the approach as controversial and lacking robust, evidence-based research. Kennedy’s comments were followed by a spike in online discussion about the ketogenic diet as people reacted to his statements and similar claims. KFF’s monitoring of social media (X, Reddit, and Bluesky) found that posts, reposts, or comments that contained variations of the phrase “ketogenic diet” along with “schizophrenia” reached the highest point of the past year in early February. The response to Kennedy’s comments in public discourse included both skepticism and belief in the claim, reflecting broader uncertainty that adults might have when facing false or misleading claims.

What To Watch Out For: The spike is decreasing, but the impact of these claims might linger; when senior health officials make unfounded claims that overstate or misrepresent early research, they risk undermining public understanding of how medical evidence develops. Patients with mental health conditions who encounter these claims may be confused about whether established treatments remain appropriate and whether these unproven approaches should replace evidence-based care.

There Was a Large Spike in Mentions of Ketogenic Diets and Schizophrenia at the Start of February (Line chart)

Older Adults See More Low-Quality Health Information Online, Study Shows

A new study published in Nature Aging found that, among the study’s participants, exposure to low-credibility health content online increased with age and was not solely driven by how often users viewed health-related content. The research showed that older participants consumed less content on YouTube overall, in line with KFF’s July 2025 Tracking Poll on Health Information and Trust, which showed that about half (49%) of adults ages 65 and over reported using social media to find health information and advice at least occasionally, compared to larger shares of adults ages 18-29 (76%). Despite lower overall use, the Nature Aging study found that a higher share of what older participants viewed came from low-credibility sources. Participants who believed false or misleading health claims were also more likely to encounter low-credibility health content, indicating a link between beliefs and exposure.

What To Watch Out For: As health information increasingly moves online, understanding these age-related disparities in exposure to and belief in false claims becomes more important for designing effective public health communication strategies.

About The Health Information and Trust Initiative: the Health Information and Trust Initiative is a KFF program aimed at tracking health misinformation in the U.S., analyzing its impact on the American people, and mobilizing media to address the problem. Our goal is to be of service to everyone working on health misinformation, strengthen efforts to counter misinformation, and build trust. 


View all KFF Monitors

The Monitor is a report from KFF’s Health Information and Trust initiative that focuses on recent developments in health information. It’s free and published twice a month.

Sign up to receive KFF Monitor
email updates


Support for the Health Information and Trust initiative is provided by the Robert Wood Johnson Foundation (RWJF). The views expressed do not necessarily reflect the views of RWJF and KFF maintains full editorial control over all of its policy analysis, polling, and journalism activities. The data shared in the Monitor is sourced through media monitoring research conducted by KFF.

Filling in the Gap in Federal Medicaid Funding to Planned Parenthood: State Responses

Published: Feb 25, 2026

Editorial Note

This brief was updated on February 25, 2026, to reflect additional state commitments to entities effected by Section 71113. 

In a major victory long sought after by abortion opponents, the federal government now has codified a ban on Medicaid funds that support care provided at Planned Parenthood clinics and other locations. Section 71113 of the 2025 Federal Budget Reconciliation Law, prevents Medicaid payments to certain reproductive health care entities that provide abortion care for one year from the date of enactment. This ban includes all services including contraceptive care, preventive care, and other services, not only abortion. Based on the criteria in the law, three entities, Planned Parenthood affiliates, Maine Family Planning and Health Imperatives—providers in 39 states—have been blocked from receiving federal Medicaid revenue. A handful of states, however, have announced they will fill in current gaps created by losses in federal funding to support access to care for their residents. These funds will enable providers to keep serving enrollees they care for in these states to differing degrees, but in the remaining states, the loss of Medicaid revenues will greatly limit their ability to continue to see Medicaid patients. This brief reviews the status of state commitments to funding reproductive health care providers affected by Section 71113 to date.  

While there is ongoing litigation challenging Section 71113, the provision is currently in effect but a final decision on the merits of these cases might come after July 2026, when the one-year funding ban is no longer in effect. After the enforcement of Section 71113 became effective for Planned Parenthood in September 2025, some Planned Parenthood affiliates offered services to Medicaid beneficiaries on a free or reduced-fee basis, allowing patients to continue receiving care regardless of their ability to pay. However, federal Medicaid funds are not flowing into the clinics, and only a handful of states have stepped in to provide funding to support care. In September 2025, Planned Parenthood said they covered the costs of care provided to most of their patients who use Medicaid — an estimated $45 million in care. However, the organization stated that these efforts are unsustainable over the long run. 

Planned Parenthood’s Role in Providing Family Planning Services to Medicaid Enrollees 

Planned Parenthood is a large provider of family planning services nationwide. Planned Parenthood affiliates maintain health centers in 46 states and the District of Columbia and provide services to over 2 million patients per year. Over half of Planned Parenthood’s patients rely on Medicaid for their health coverage, and a KFF analysis finds that nearly one in five (18%) Medicaid enrollees got their contraceptive care from a Planned Parenthood clinic in 2023 (Figure 1). This share is greater in states like California, and Wisconsin where nearly half and one third of female Medicaid enrollees who got contraceptive care went to a Planned Parenthood health clinic, respectively. Planned Parenthood health clinics are primarily located in rural or medically underserved communities, and sometimes are the only clinic in a community offering sexual and reproductive health care services including contraception. Due to the unique role Planned Parenthood plays in offering sexual and reproductive health care, research shows that Medicaid enrollees would be harmed if they were excluded from Medicaid reimbursement because they would face increased difficulties in accessing contraceptive methods, primary care, and other sexual and reproductive health care.  

Place of Service for Last Contraceptive Care Encounter for Female Medicaid Enrollees Ages 15 to 49, 2023 (Stacked Bars)

State Efforts to Limit Harm to Medicaid Enrollees Who Receive Care at Planned Parenthood Health Centers 

Due to Planned Parenthood’s large role in providing family planning services to Medicaid enrollees, some states have committed to filling in gaps created by losses in federal revenues. In response to proposed budget cuts facing Planned Parenthood, eleven states (CA, CO, CT, IL, MA, ME, NJ, NM, NY, OR, WA) have allocated millions in funding to Planned Parenthoods to maintain access to care for their enrollees. All eleven of these states are also plaintiffs in a lawsuit challenging Section 71113. State responses have ranged from agreeing to cover the full cost of Medicaid services to allocating a specific amount of money for the year.  
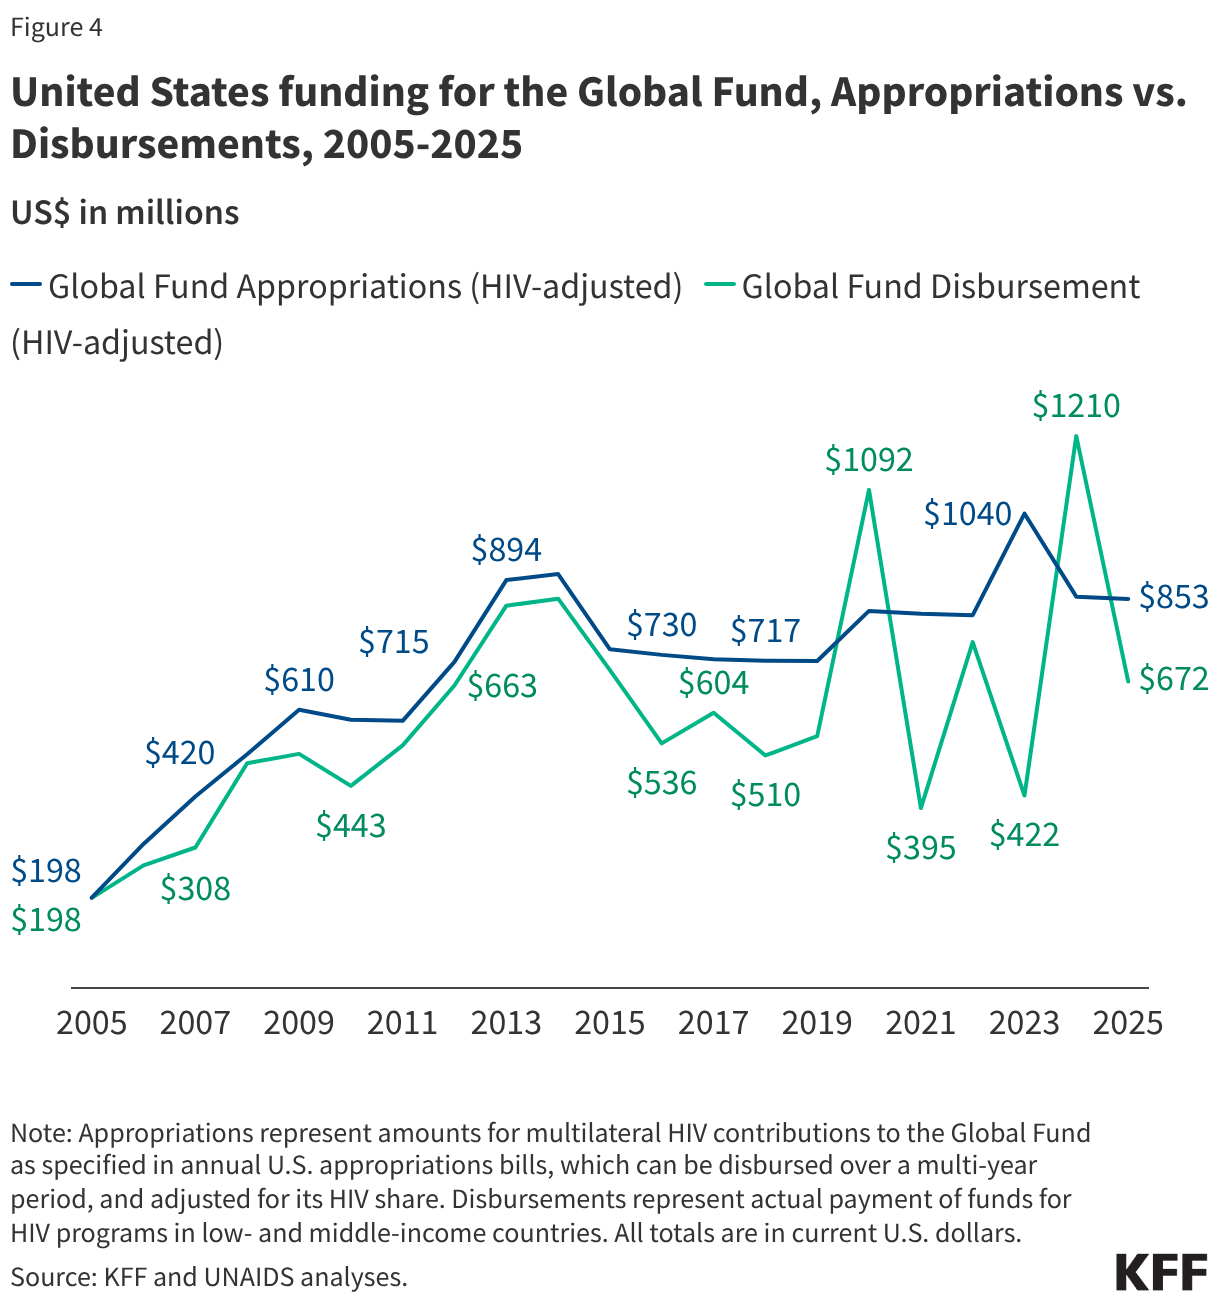
California

On October 23, 2025, California Governor Newsom announced a plan to allocate over $140 million in state funds to assist Planned Parenthood health centers due to losses in federal funding caused by Section 71113. California has over 7 Planned Parenthood affiliates who maintain over 100 health centers. At California Planned Parenthoods, over 80% of patients rely on public health insurance such as Medi-Cal and the Family Planning, Access, Care and Treatment Program (FPACT). KFF estimates that in 2023, 47% of California female Medicaid recipients received who received their last contraceptive visit of 2023 went to a Planned Parenthood clinic for that care. On February 11, 2026, Governor Newsom signed legislation that allocates $90 million in the form of an emergency one-time grant to Planned Parenthood and other clinics providing reproductive health care services.   

Colorado 

In August 2025, Colorado Governor Polis signed legislation (Senate Bill 25B-2) which does not appropriate a specified dollar amount to Planned Parenthood but instead asserts that Colorado will reimburse an organization designated as a “prohibited entity” under the 2025 Federal Budget Reconciliation Law using state funds. This guarantees state funding for Planned Parenthood clinics in Colorado providing care to Medicaid enrollees without placing a specific dollar amount on the allocation. 

Connecticut  

On December 18, 2025, Governor Lamont announced an allocation of $8.5 million to Planned Parenthood of Southern New England to make up for lost federal reimbursement for the period that Section 71113 is in effect.  

Illinois

On December 23, 2025, the Illinois Department of Healthcare and Family Services announced a $4 million investment in Medicaid family planning services to offset the loss of federal Medicaid reimbursement for Planned Parenthood due to Section 71113. The Department estimates that Planned Parenthood received $4 million in federal Medicaid reimbursement in 2024 for services like contraception, sexual transmitted infection testing and treatment, cancer screenings, and other family planning services Illinoisans rely on.  

Massachusetts

 On July 24, 2025, Governor Healey announced a plan to provide $2 million in state funds to Planned Parenthood League of Massachusetts to support continued access to sexual and reproductive health including cancer screenings, contraception, and STI testing and treatment. These state funds are not sufficient to completely make up for the loss of federal funds. In 2023, Planned Parenthood League of Massachusetts received approximately $4.7 million in Medicaid payments in 2023, and the federal match in Massachusetts varies between 50% and 90% with a 90% match for family planning services. Massachusetts has not allocated any funds to Health Imperatives, another family planning provider in Massachusetts currently blocked from receiving federal Medicaid reimbursements. 

Maine

The Maine Legislature passed two bills ( LD 143, LD210), shortly before Section 71113 became effective, allocating over $6 million to family planning providers, including Planned Parenthood of Northern New England and Maine Family Planning. This funding was allocated to fill financial gaps these organizations face due to their ongoing provision of free and discounted reproductive health care. On January 27, 2026, Governor Mills proposed providing an additional $2.25 million in state supplemental funding to offset the impact of Section 71113 on Maine Family Planning and Planned Parenthood. The legislature will review the Governor’s proposed biennial budget, which requires approval in both the House and Senate.      

New Jersey 

In fiscal year 2023, the two Planned Parenthood affiliates in New Jersey collectively billed $6.9 million to New Jersey’s Medicaid program. The state paid $1.4 million of these claims and the federal government paid the remaining $5.4 million. On December 24, 2025, Governor Murphy announced an allocation of $8 million to reproductive health care providers who have been blocked from receiving federal Medicaid funds. The allocation will cover both the state and federal Medicaid reimbursements that the Planned Parenthood affiliates would have received if not for Section 71113.  

New Mexico

On October 3, 2035, New Mexico, Governor Grisham, signed emergency legislation that allocates $3 million to contract with Planned Parenthood for health services provided to Medicaid patients. Any unexpended balance remaining at the end of fiscal year 2026 will revert to the general fund.  

New York

On October 24, 2025, New York Governor Hochul announced that the state will cover any funding gap Planned Parenthood experiences due to Section 711113. The state has instructed Medicaid providers who would be considered “Prohibited Entities,” to continue to submit claims, and they will be paid with state only dollars. Planned Parenthood has five affiliates that operate 48 clinics in the state. 

Oregon 

In Oregon, Planned Parenthood of Columbia Willamette received over $15 million of state and federal Medicaid dollars in 2024. In November 2025, their legislature allocated $7.5 million to Planned Parenthood affiliates in an emergency session for this coming fiscal year while Section 71113 is in effect. 

Washington

Washington estimated that they paid over $23.8 million to Planned Parenthood in 2023 for services to Medicaid enrollees with $11.8 million of those funds coming from the federal government. On July 9, 2025, Governor Ferguson announced that the state would cover any gap in Medicaid funds Planned Parenthood experienced because they would no longer be eligible to receive funding from the federal government.  

Understanding Medicaid Home Care Amid CMS Focus on Potential Fraud and Abuse

Published: Feb 24, 2026

Potential fraud in state Medicaid programs is getting renewed attention, with a recent emphasis on home care, also known as personal care or in-home supportive services. Home care helps with self-care activities such as bathing, dressing, and eating for older adults and people with disabilities. KFF estimates that over 5 million people use Medicaid home care, which allows individuals to receive long-term care without moving into an institution. The Trump administration has recently pointed to Medicaid home care as a source of fraud. Medicaid home care is susceptible to fraud because services are provided in people’s homes to vulnerable individuals who may be less able to advocate for themselves, including some with Alzheimer’s and other dementias. However, there are also additional safeguards against fraud in Medicaid home care compared to other types of Medicaid services. This issue brief describes how Medicaid home care operates, including who is eligible, the various systems in place to promote program integrity in its delivery, and challenges using data newly released by the Centers for Medicare and Medicaid Services (CMS). Key takeaways include the following.

  • All states provide optional home care services to people whose needs are sufficient to warrant institutionalization. An institutional level of care is generally beyond what family members are capable of providing.
  • Recognizing the higher risk of fraud in Medicaid home care, federal and state governments have implemented additional tools to identify and detect home care fraud. States, along with the federal government, use provider credentialing and enrollment and data analytics to help prevent fraud. There has been new attention on fraud in Minnesota’s Medicaid program recently, but the fraud, and the state’s work to root it out, date back at least 18 months. 
  • On February 14, 2026, CMS released a dataset with provider-level spending data that the agency suggests could be used to identify unusual billing patterns for specific services, states, or providers, but the limited data could result in mistaken conclusions. Home care is a major emphasis of the new dataset, which stems from the fact that second to hospital spending, long-term care is the second-largest source of Medicaid spending. Although Medicaid long-term care was historically provided primarily in nursing facilities, most enrollees who use long-term care now receive home care.

Why does Medicaid cover home care and who is eligible for services?

All states provide optional home care services. Under Medicaid, states are required to cover long-term care provided in nursing facilities, but not home care, which has been referred to as the “institutional bias” in Medicaid. States may only provide home care if they can demonstrate that providing the services would cost no more than institutional care would cost for an individual. All states choose to provide optional home care to people who would otherwise require institutionalization. The increased availability of home care reflects people’s preferences to remain in their homes. Expansions of Medicaid home care services also followed the 1999 Supreme Court ruling in Olmstead v. L.C., which declared that unjustified institutionalization of people with disabilities by a public entity (including Medicaid) is a form of discrimination and not permissible under the 1990 Americans with Disabilities Act. Even though nearly all of the benefits are optional for states to provide, the majority of people who use long-term care now do so at home.

Medicaid home care use is limited by eligibility criteria that generally make it only available to people whose needs are sufficient to warrant institutionalization. To be eligible for Medicaid home care, applicants must meet both financial and “functional” eligibility criteria. Functional eligibility for Medicaid home care, which is evaluated by assessment tools developed by states, generally requires individuals to demonstrate that they need an institutional level of care. There are no recent data available about states’ specific definitions for an institutional level of care, but it generally indicates that people would require 24-hour services and assistance with multiple activities of daily living (ADLs), which include bathing, dressing, eating, toileting, continence, and transferring between bed and other settings.

An institutional level of care is generally beyond what family members are capable of providing. People who require an institutional level of care generally have complex needs that require both skilled and unskilled services and often require services to be provided around the clock. In some cases, family caregivers may not have the medical expertise to provide services, but there are also challenges related to the physical demands of the job and having time to provide such intensive services. Helping family members to bathe, dress, and toilet themselves often requires the strength to lift them, which not all family members have. The time required to provide such intensive services also makes it difficult for family caregivers to provide this level of care and maintain employment or take care of their own health needs. KFF’s focus groups with paid and unpaid family caregivers provide detail that caregiving is physically, mentally, and emotionally challenging; and that family caregivers cannot provide an institutional level of care without supports. To help people requiring an institutional level of care remain at home, Medicaid supports family caregivers by providing supplemental paid care and with direct supports, such as respite care, training, and in some cases payments to the family caregivers to reflect the fact that caregiving makes it impossible to maintain outside employment.

What program integrity tools for Medicaid home care exist?

Recognizing the higher risk of fraud in Medicaid home care, federal and state governments have implemented additional tools to identify and detect home care fraud. In 2016, Congress passed the 21st Century Cures Act, which requires states to implement electronic visit verification for all Medicaid personal care and home health services if a visit is made to a person in the home. State’s electronic visit verification must include six data elements: member receiving the services, caregiver providing the service, type of service, location of the service delivery, date of the service, and time the service begins and ends. Electronic visit verification was established to help promote fiscal integrity for Medicaid home care, and states had until 2023 to fully implement the requirements. The Health and Human Services Office of Inspector General (HHS OIG) has an active project underway to evaluate the availability and completeness of the electronic visit verification data and how states are using the data to promote program integrity.

An HHS OIG report finds that in fiscal year 2024, there were 298 fraud convictions “involving personal care service attendants” from the Medicaid fraud control units, which was 36% of all fraud convictions through the Medicaid fraud control unit, more than that of any other provider type. Although significant, the number of fraud convictions (total and as a percentage of all convictions) is notably lower than the average from 2015-2022 before electronic visit verification was fully in place. During the prior years, fraud convictions involving personal care service attendants averaged well over 400 each year and 43% of all convictions. The amount of money recovered from all convictions is small ($961 million in FY 2024 or $536 million on a 5-year average basis) relative to Medicaid spending.

States, along with the federal government, use provider credentialing and enrollment and data analytics to help prevent fraud. Providers must meet certain state and federal requirements to be eligible to participate in the Medicaid program. Additionally, states use data analytics to confirm that providers have not previously been convicted of committing Medicare fraud or fraud in a different state’s Medicaid program, and to identify unusual billing patterns for specific services or by specific providers. When Minnesota uncovered fraud in its Medicaid home care programs in 2024, the state undertook a series of actions to address that fraud, including targeting specific providers and specific types of services (Box 1).

Box 1: Minnesota’s Actions Towards Maintaining Program Integrity for Medicaid Home Care

In January 2026, CMS administrator Dr. Mehmet Oz issued a letter to Minnesota governor Tim Waltz notifying him that the state of Minnesota’s Medicaid program was not in compliance with federal requirements that help to prevent, detect, and address fraud, waste, and abuse. The letter noted that CMS would start withholding a minimum of $515 million each quarter until CMS determined that the state had satisfactorily met federal requirements.

There has been fraud in Minnesota’s home care programs, and the state has taken steps to address it. On December 5, 2026, CMS gave the state 26 days to send a corrective action plan to address fraud. CMS rejected the plan within one week of receiving it. Minnesota is appealing CMS’ decision and submitted a revised corrective action plan on January 30, 2026.

The state outlines taking the following actions in response to combating home care fraud:

  • Terminating the Housing Stabilization Services program entirely (one of the recent sources of fraud),
  • Auditing autism services providers and conducting onsite visits (another source of recent fraud),
  • Adding new licensure requirements for autism centers,
  • Pausing admission of any new providers into 13 high-risk Medicaid services,
  • Conducting unannounced site visits for providers of high-risk services as part of the regular revalidation process,
  • Enhancing review of claims before they are paid including with increased use of data analytics and Artificial Intelligence (AI),
  • Increasing training for Medicaid providers and employees, and
  • Increasing oversight over Medicaid managed care organizations.

CMS’ approach towards fraud in Minnesota is a significant departure from prior practice. Historically, CMS has used disallowances to deny claims for payments that have been deemed impermissible and has worked collaboratively with states to recoup the funds. Under its new process — known as the “compliance process” — CMS can withhold future payments if the Administrator determines that there is a “failure to comply substantially” with one or more Medicaid requirements. In Minnesota’s case, CMS is effectively withholding funds in anticipation of future fraud.

What do newly released data about home care spending mean?

On February 14, 2026, CMS released a dataset with provider-level spending data that the agency suggests could be used to identify unusual billing patterns for specific services, states, or providers, but the limited data could result in mistaken conclusions. The data include seven fields, including the number of beneficiaries seen, counts of services, and the total spending for each procedure that is included in the data, but they omit significant elements important for pursuing meaningful analyses. With the data release, CMS posted figures to illustrate how the data could be used, with one of the figures displaying total spending among the top 20 procedures in the Medicaid data. The data show that personal care (the primary home care benefit) is the top procedure in terms of spending. However, the personal care “procedure” encompasses a wide range of services that may vary in complexity, difficulty, and length of visit (ranging from less than 30 minutes up to an entire day). In comparison, spending on emergency department visits is split among multiple procedure codes based on the complexity of the case and spending on psychotherapy is split based on the length of the visit (e.g., 30-minute visits and 45-minute visits are considered separate procedures). The data exclude all institutional records and all information about prescription drugs, which are significant shares of Medicaid spending, with hospital care accounting for 37% and being the single largest source of Medicaid spending.

Understanding the context for increases in home care spending is important context for interpreting spending data. Increased spending on Medicaid home care reflects state and federal policy choices to increase the availability of home care in lieu of institutional care when feasible. Analyses of federal spending on long-term care show that home care has grown from 1% of all long-term care spending in 1981 to 64% in 2023. Although the shift away from institutional care dates to the 1980s, the COVID-19 pandemic shone a new spotlight on the challenges of institutional care and illuminated the extent of unmet need for home care. In response, states expanded the availability of home care, increased payment rates for workers in home care settings, and made other efforts to help people remain at home rather than institutional settings. Between 2019 and 2023, the number of Medicaid home care users increased by over 750,000 people. In general, expansions of home care have garnered bipartisan support, with both 2024 presidential candidates expressing support for investments in family caregivers and more at-home services for people who need long-term care.

This work was supported in part by Arnold Ventures. KFF maintains full editorial control over all of its policy analysis, polling, and journalism activities.