Poll Finding

KFF COVID-19 Vaccine Monitor: September 2022

Authors: Grace Sparks, Lunna Lopes, Liz Hamel, Alex Montero, Marley Presiado, and Mollyann Brodie
Published: Sep 30, 2022

Findings

Key Findings

  • The new, updated, bivalent COVID-19 boosters are now available for use, but the latest KFF COVID-19 Vaccine Monitor survey finds that awareness of the updated boosters is relatively modest, with about half of adults saying they’ve heard “a lot” (17%) or “some” (33%) about the new shots. About a third of all adults (32%) say they’ve already gotten a new booster dose or intend to get one “as soon as possible.”
  • Intention is somewhat higher among older adults, one of the groups most at risk for serious complications of a coronavirus infection. Almost half (45%) of adults ages 65 and older say they have gotten the bivalent booster or intend to get it “as soon as possible.”
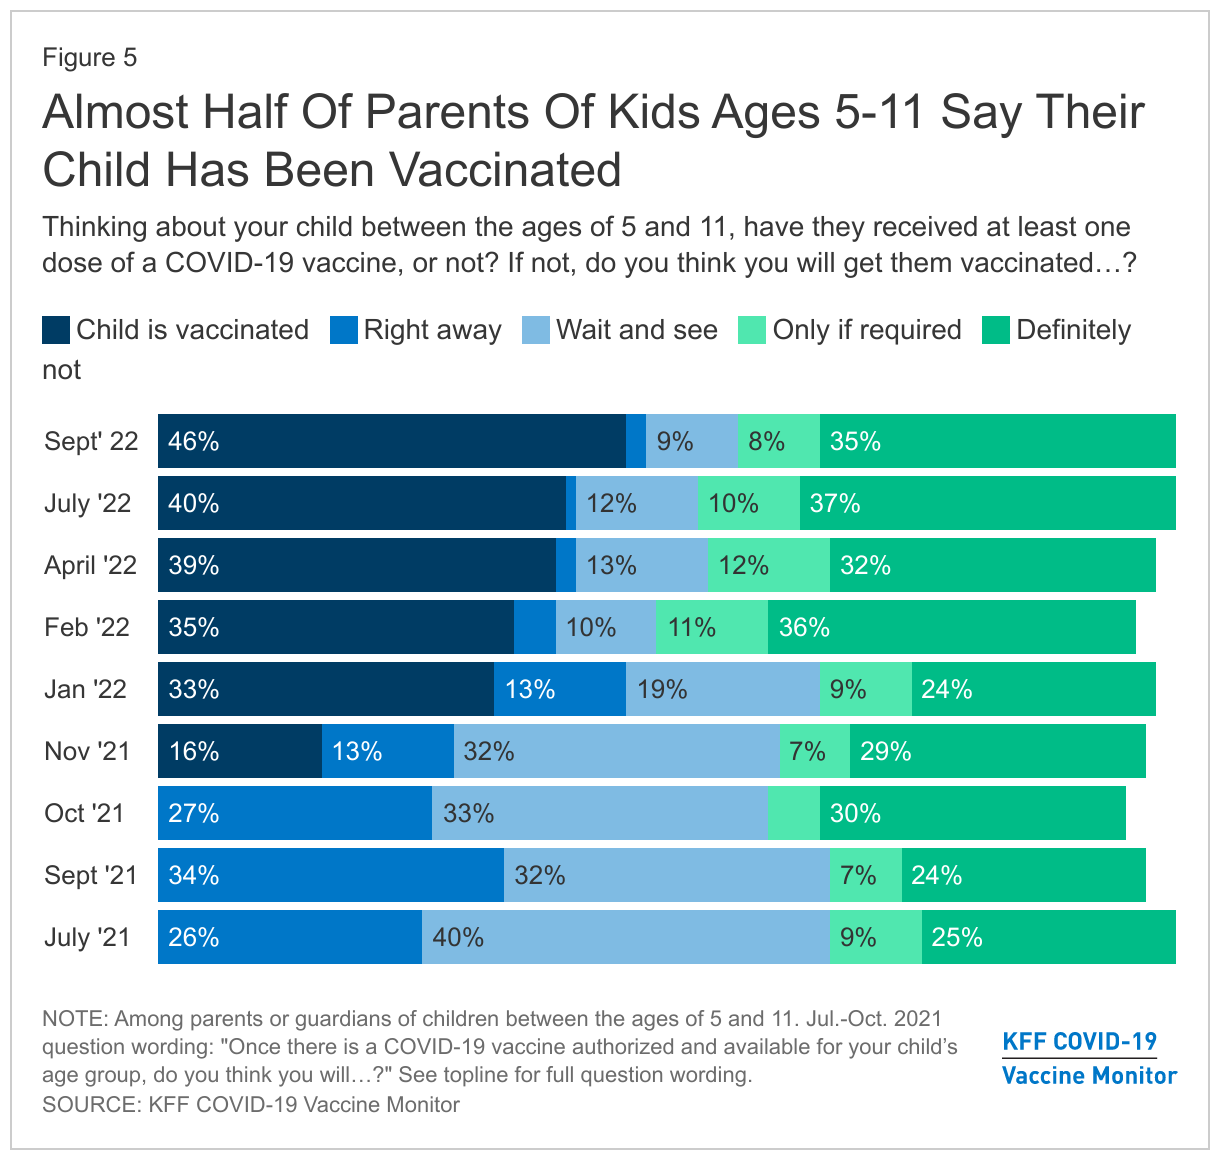
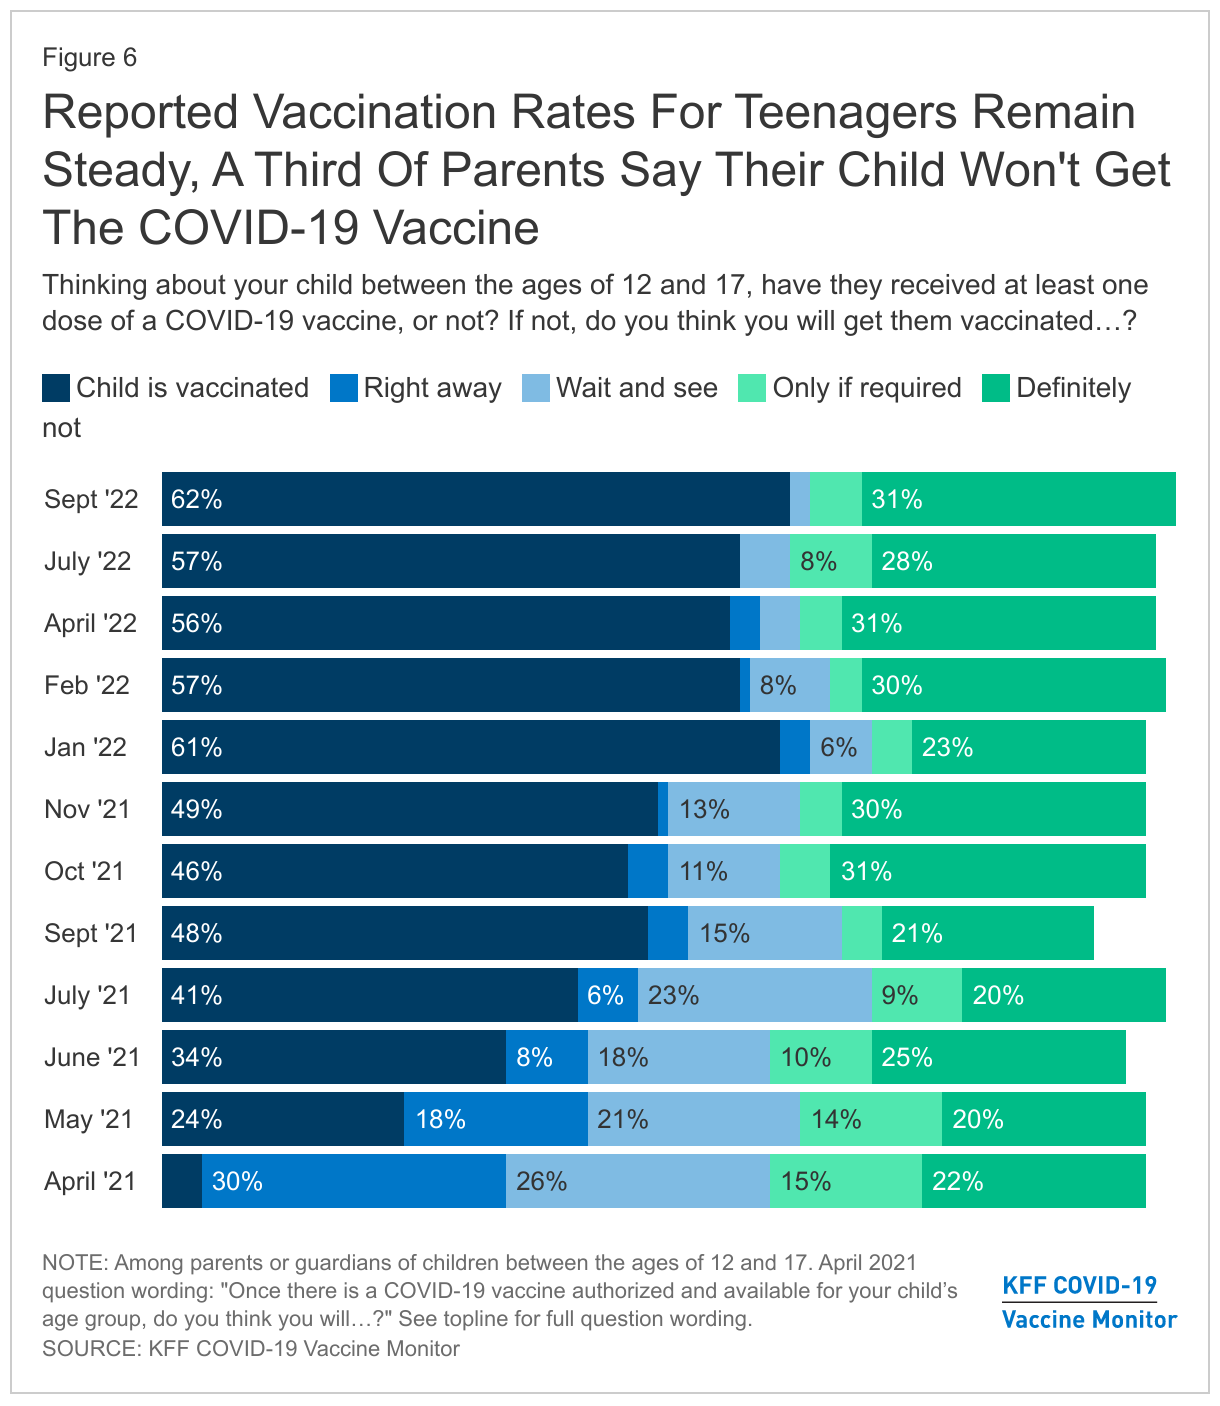
  • About one in five (19%) parents of children ages 6 months through 4 years old say their child has gotten vaccinated for COVID-19, up from 7% in July. The September Monitor survey finds about half (53%) of parents of children in this age range say they will “definitely not” get their child vaccinated for COVID-19. Reported vaccine uptake among children ages 5-11 and teenagers ages 12-17 has slowed in recent months. Almost half of parents of kids ages 5-11 now report their child has gotten vaccinated (46%), as do 62% of parents of teens ages 12-17.

COVID-19 Vaccination Rates And New COVID-19 Boosters

Overall adult vaccination rates have been relatively steady over the past year. The latest COVID-19 Vaccine Monitor finds that nearly eight in ten adults (77%) say they have gotten at least one dose of a COVID-19 vaccine, including about half who say they are fully vaccinated and also received at least one booster dose (47%), about a quarter who have been fully vaccinated but have not gotten a booster (26%), and a small share who are partially vaccinated (3%). Twenty-three percent remain unvaccinated, the vast majority of whom say they will “definitely not” get the COVID-19 vaccine (88% of unvaccinated, or 21% of all adults). For the latest breakdown of self-reported vaccination rates by demographic group, see the Vaccine Monitor Dashboard.

In late August, the Food and Drug Administration authorized the use of new, updated COVID-19 vaccine boosters that target both the new omicron variants and the original strain of the virus. The bivalent boosters (one by Moderna and one by Pfizer) are now authorized for use by those ages 12 and older who have gotten an initial series of a COVID-19 vaccine, including those who have already received one or more boosters.

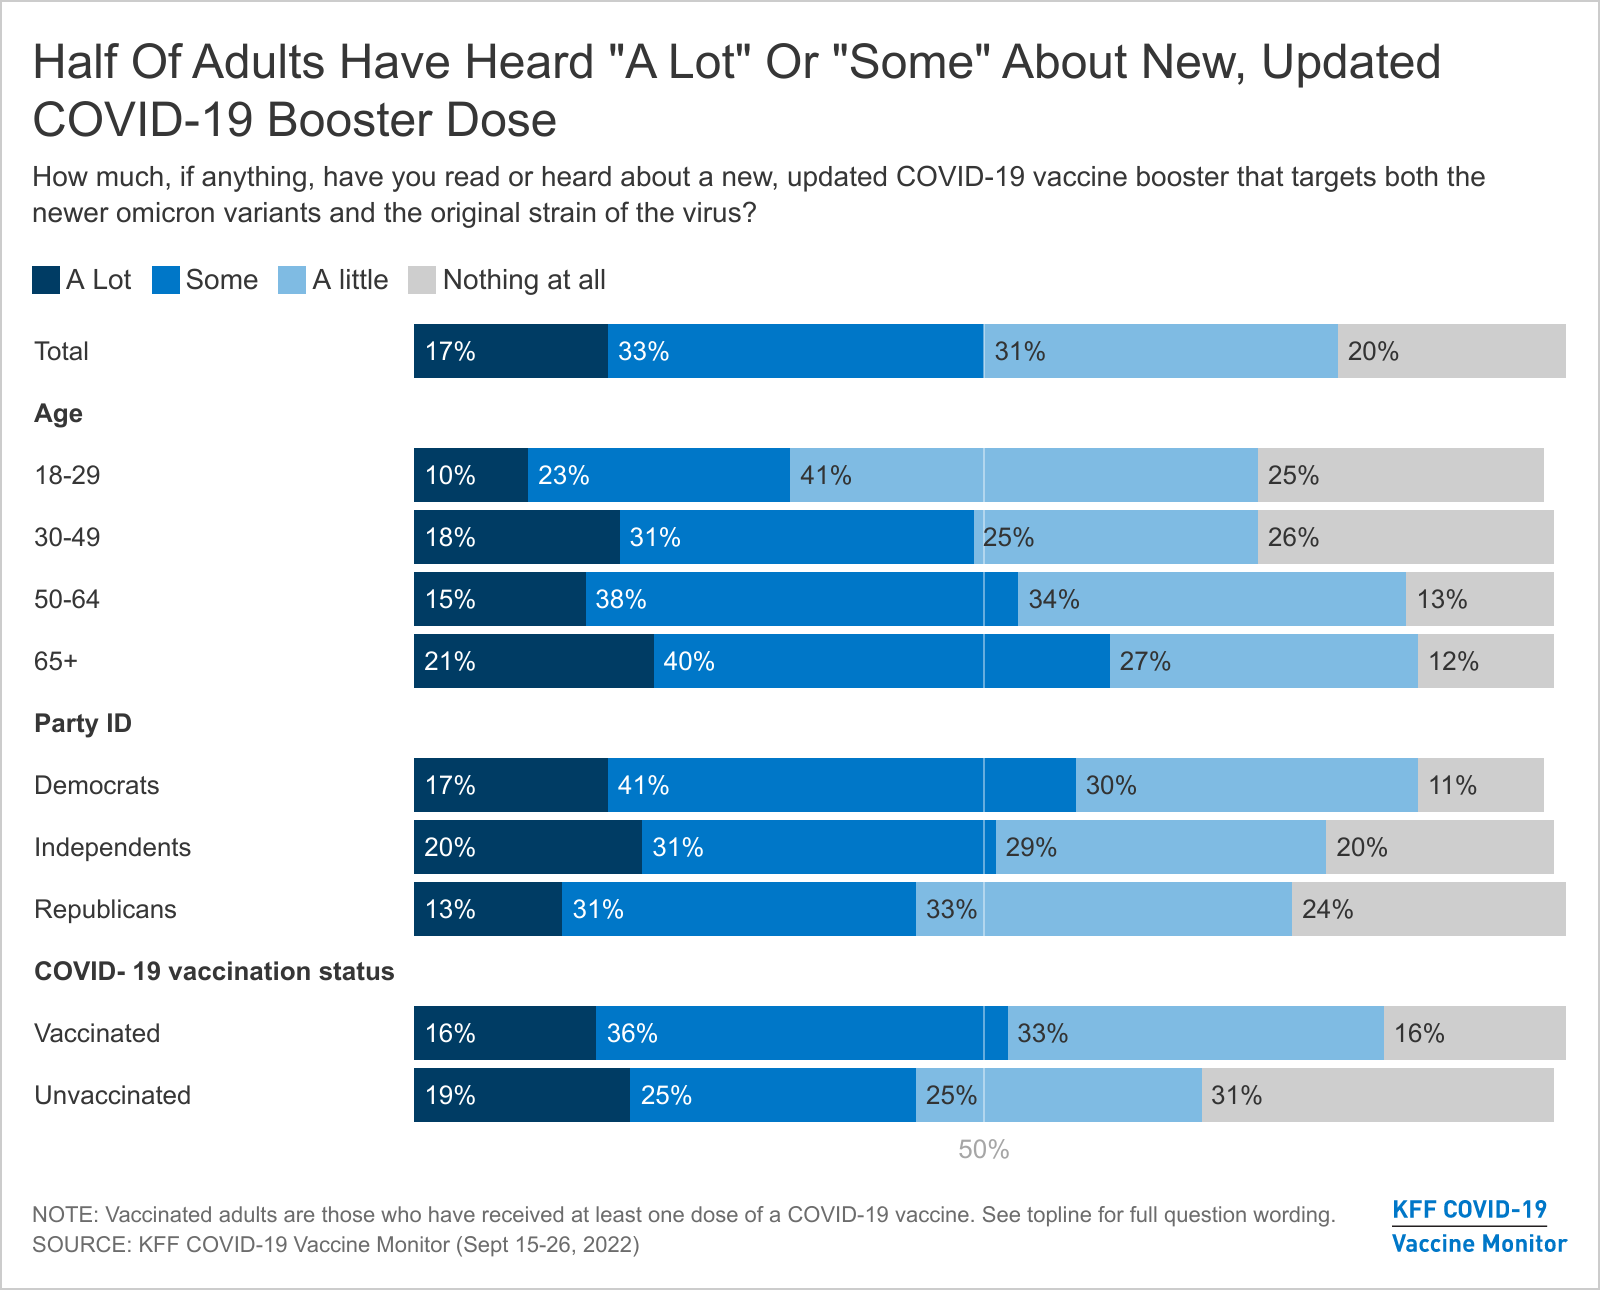
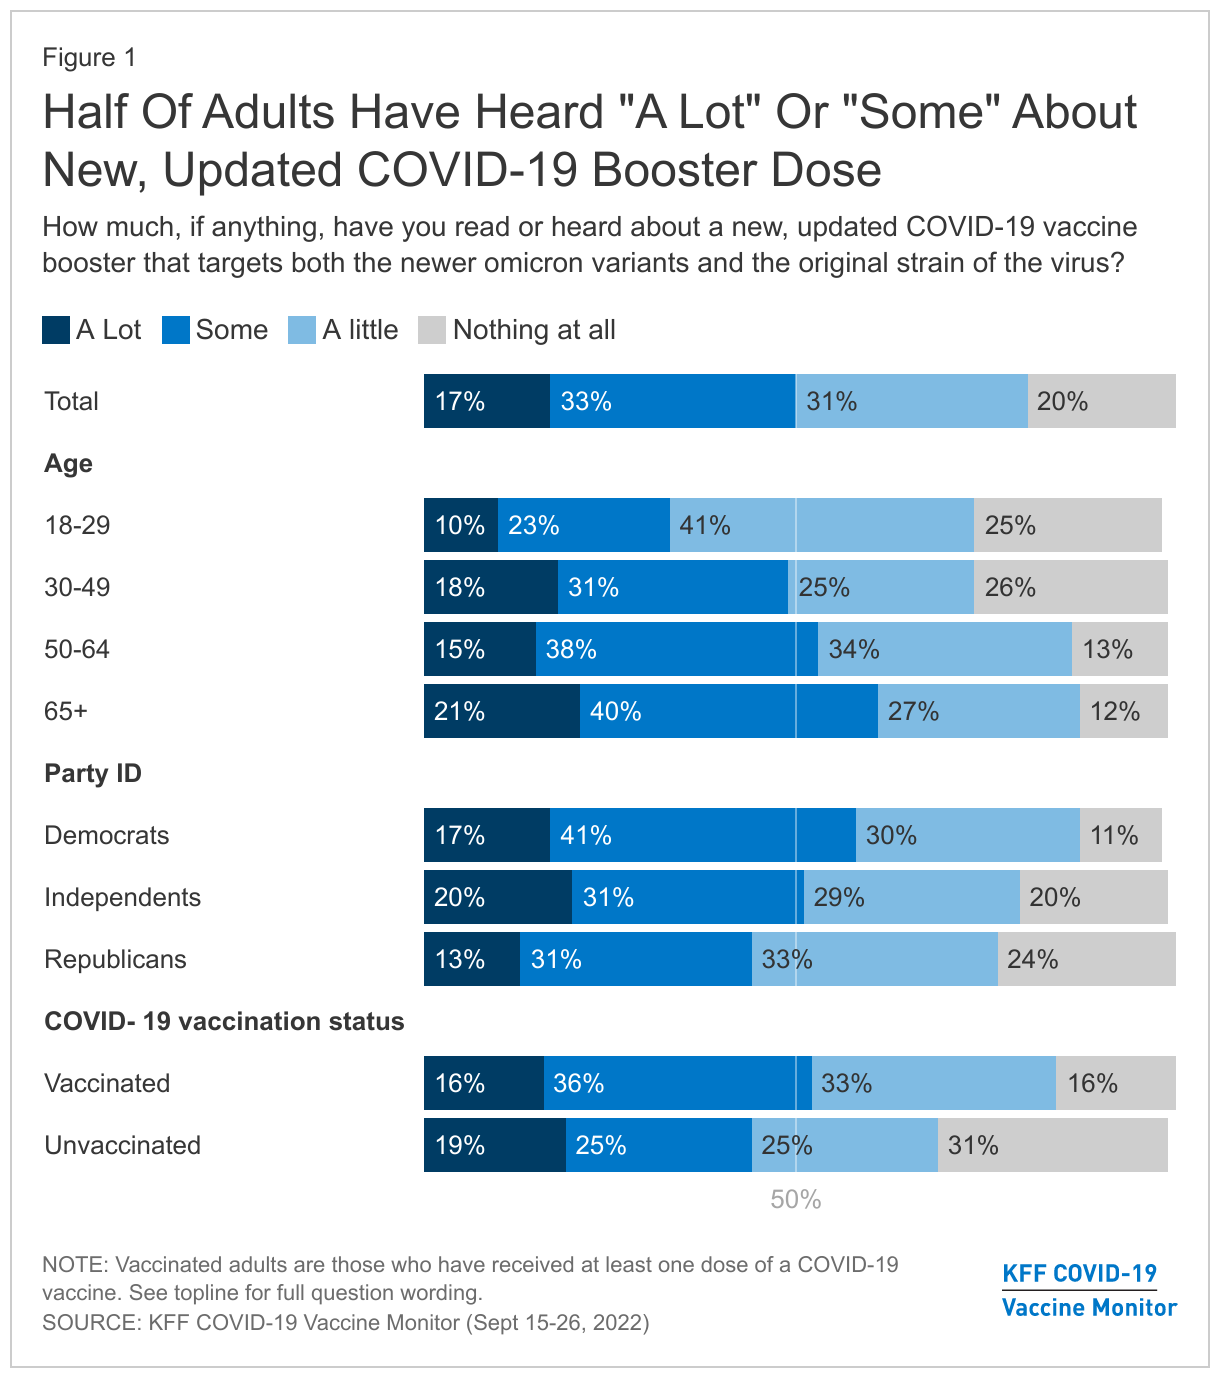
Awareness of the new boosters is modest, with about half of adults saying they have heard “a lot” (17%) or “some” (33%) about updated booster, 31% saying they have heard “a little,” and one in five saying they have heard “nothing at all” about the new booster doses.

Older adults and Democrats are somewhat more likely than their counterparts to say they have heard at least “some” about the new boosters, but fewer than a quarter across these groups report hearing “a lot” about the new shots.

Half Of Adults Have Heard "A Lot" Or "Some" About New, Updated COVID-19 Booster Dose

The CDC has recommended that all adults get a bivalent COVID-19 booster at least two months after they complete their primary vaccine series.

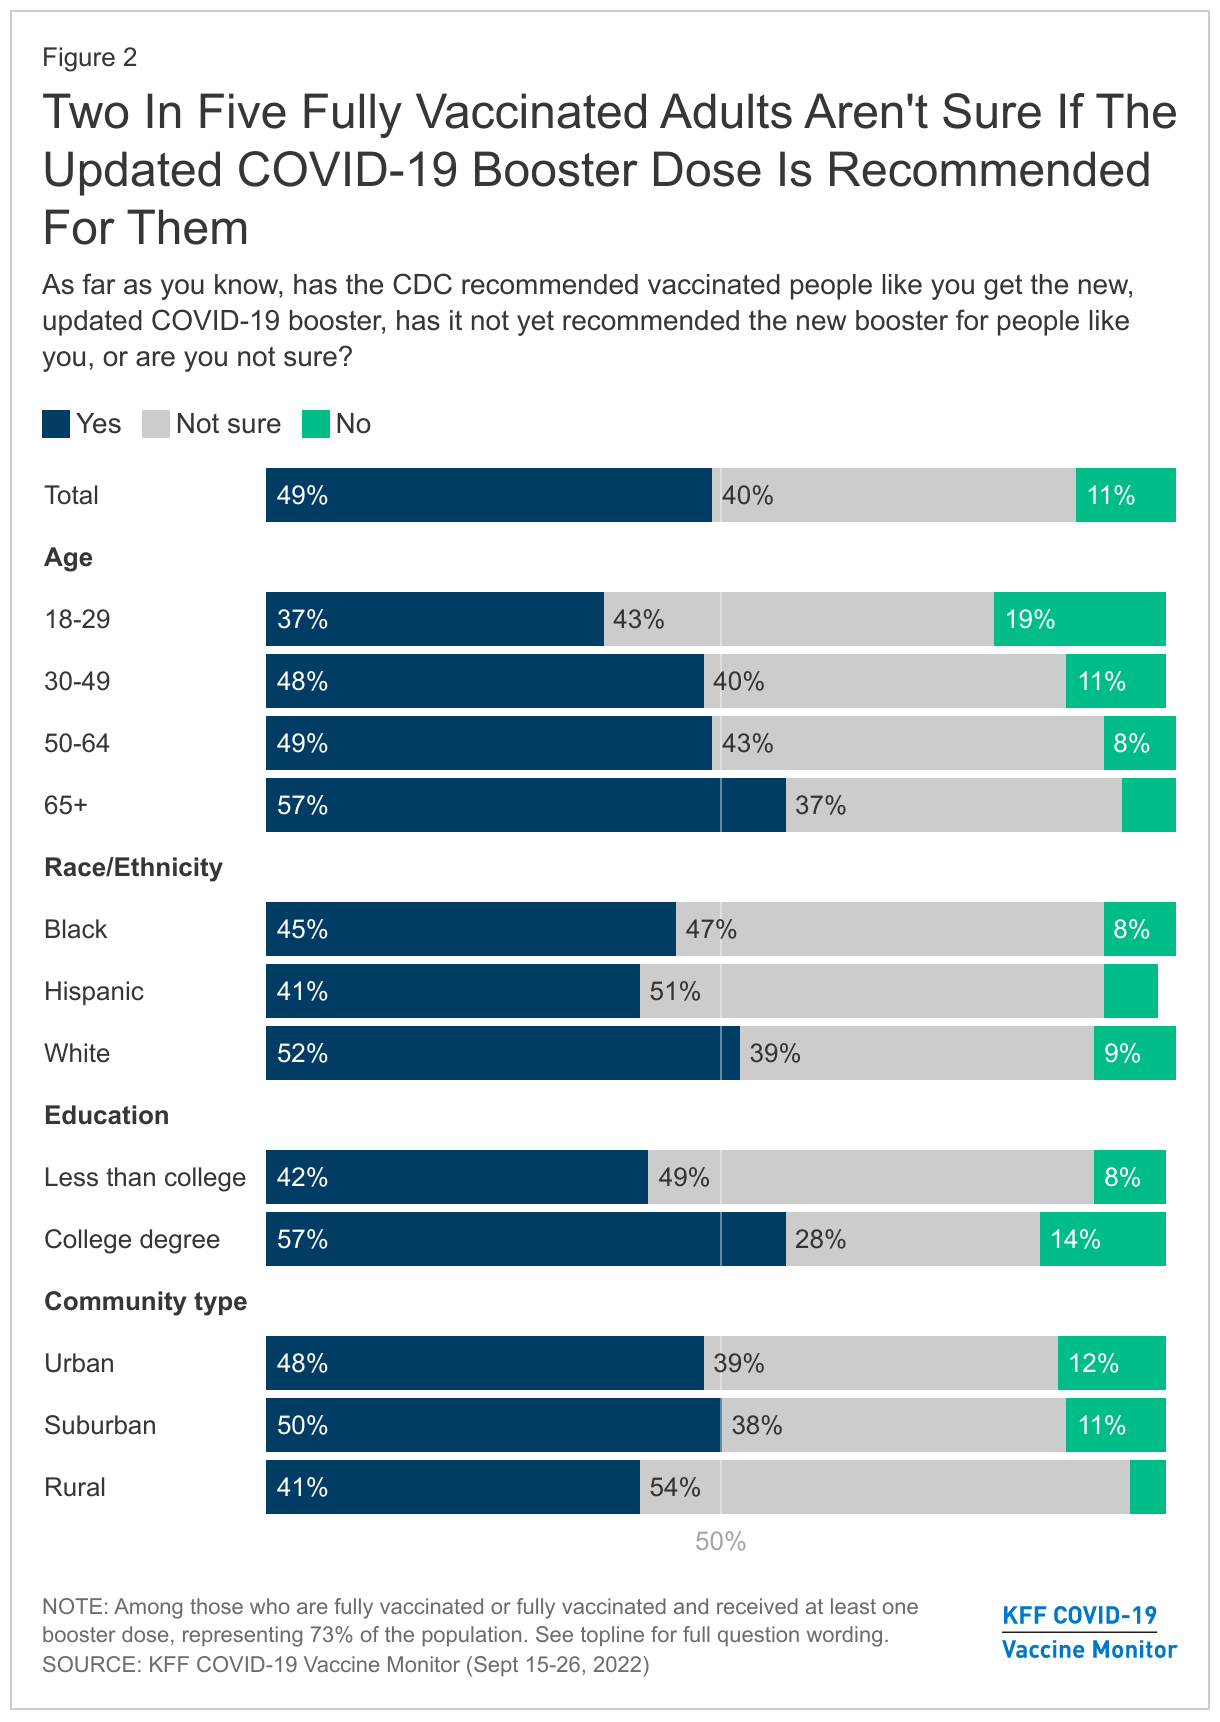
Among the 73% of adults who received at least a full initial COVID-19 vaccine series, about half (49%) recognize that the CDC currently recommends the booster for people like them, while about one in ten (11%) say the new, updated booster is not recommended for people like them.

The CDC recommends the new booster for vaccinated adults of all ages, with a focus on vaccinating those ages 50 and older. Almost six in ten fully vaccinated adults ages 65 and older (57%) know the new booster is recommended for people like them, as do about half (49%) of those ages 50-64. Younger adults are less certain, with 19% of fully vaccinated adults under ages 30 saying they don’t believe the new booster has been recommended for their group and another 43% saying they are unsure.

Four in ten fully vaccinated adults say they are not sure if the CDC has recommended that people like them get the bivalent booster, including about half of fully vaccinated rural residents (54%), Hispanic adults (51%), and those without a college degree (49%) who say they are not sure.

Two In Five Vaccinated Adults Aren't Sure If The Updated COVID-19 Booster Dose Is Recommended For Them

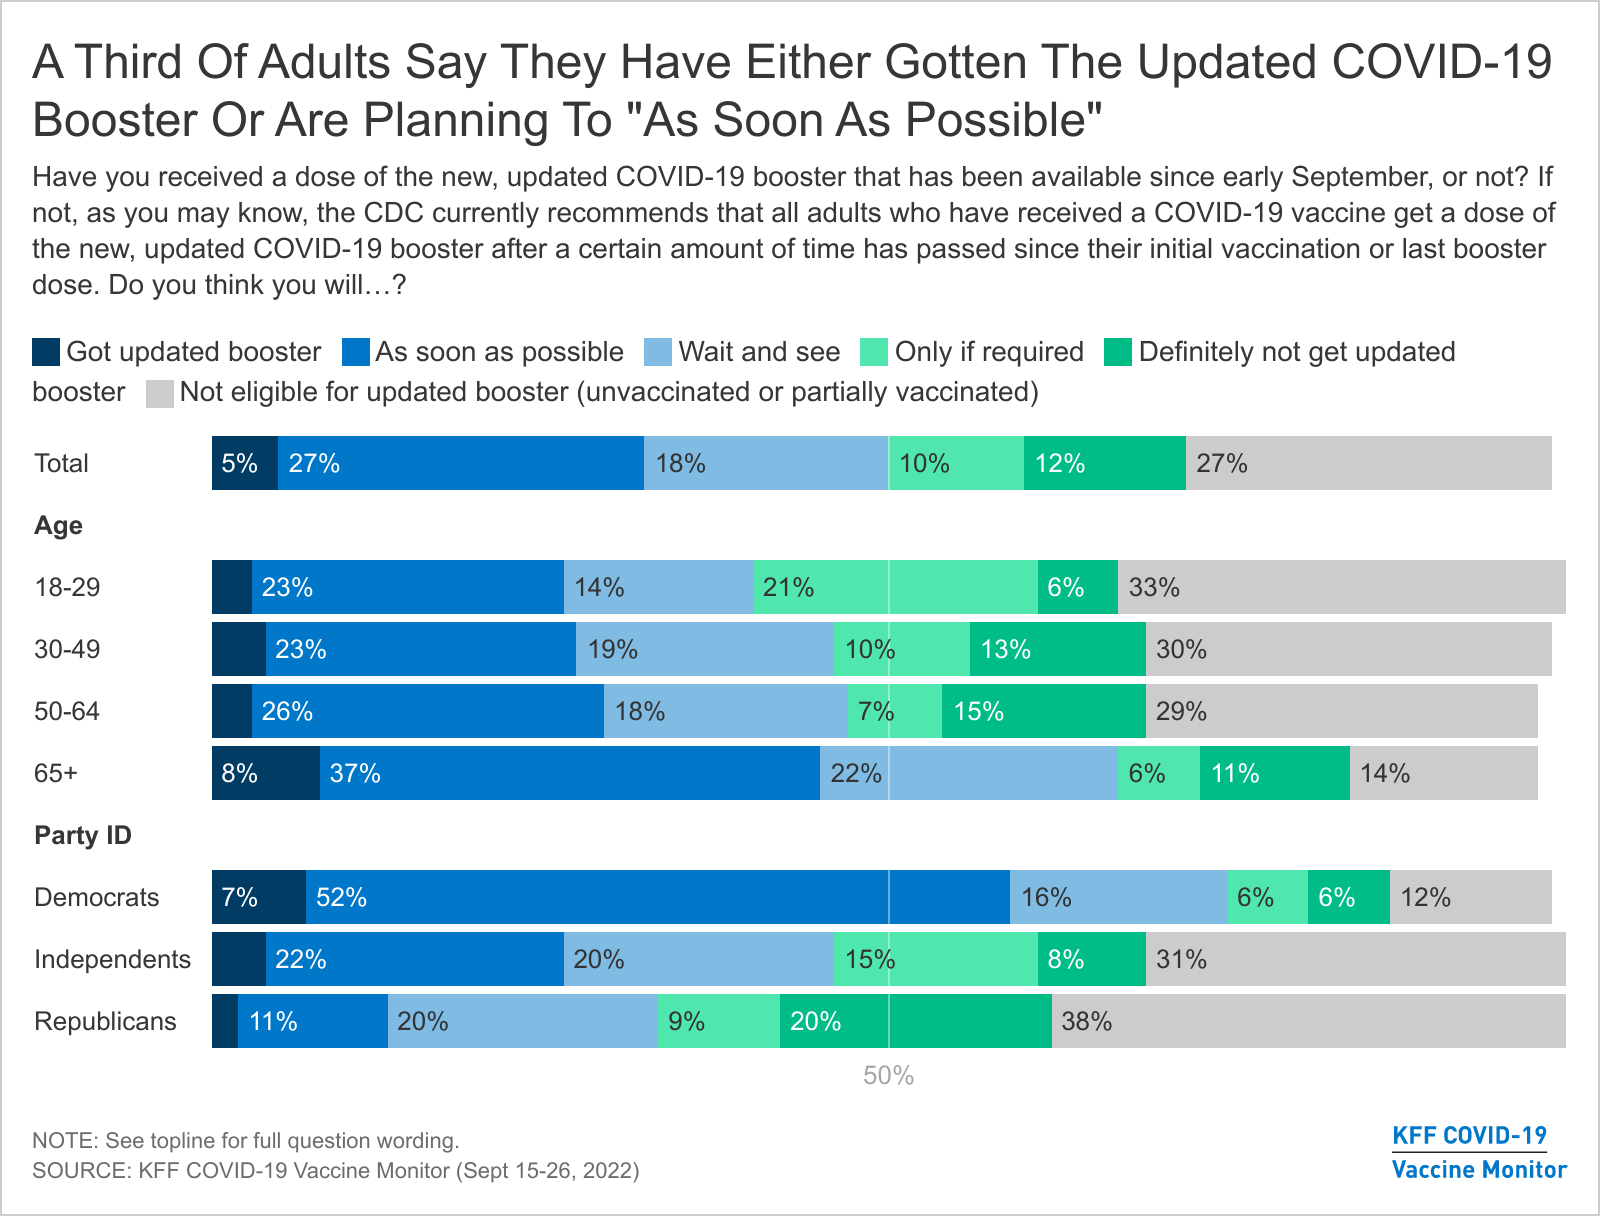
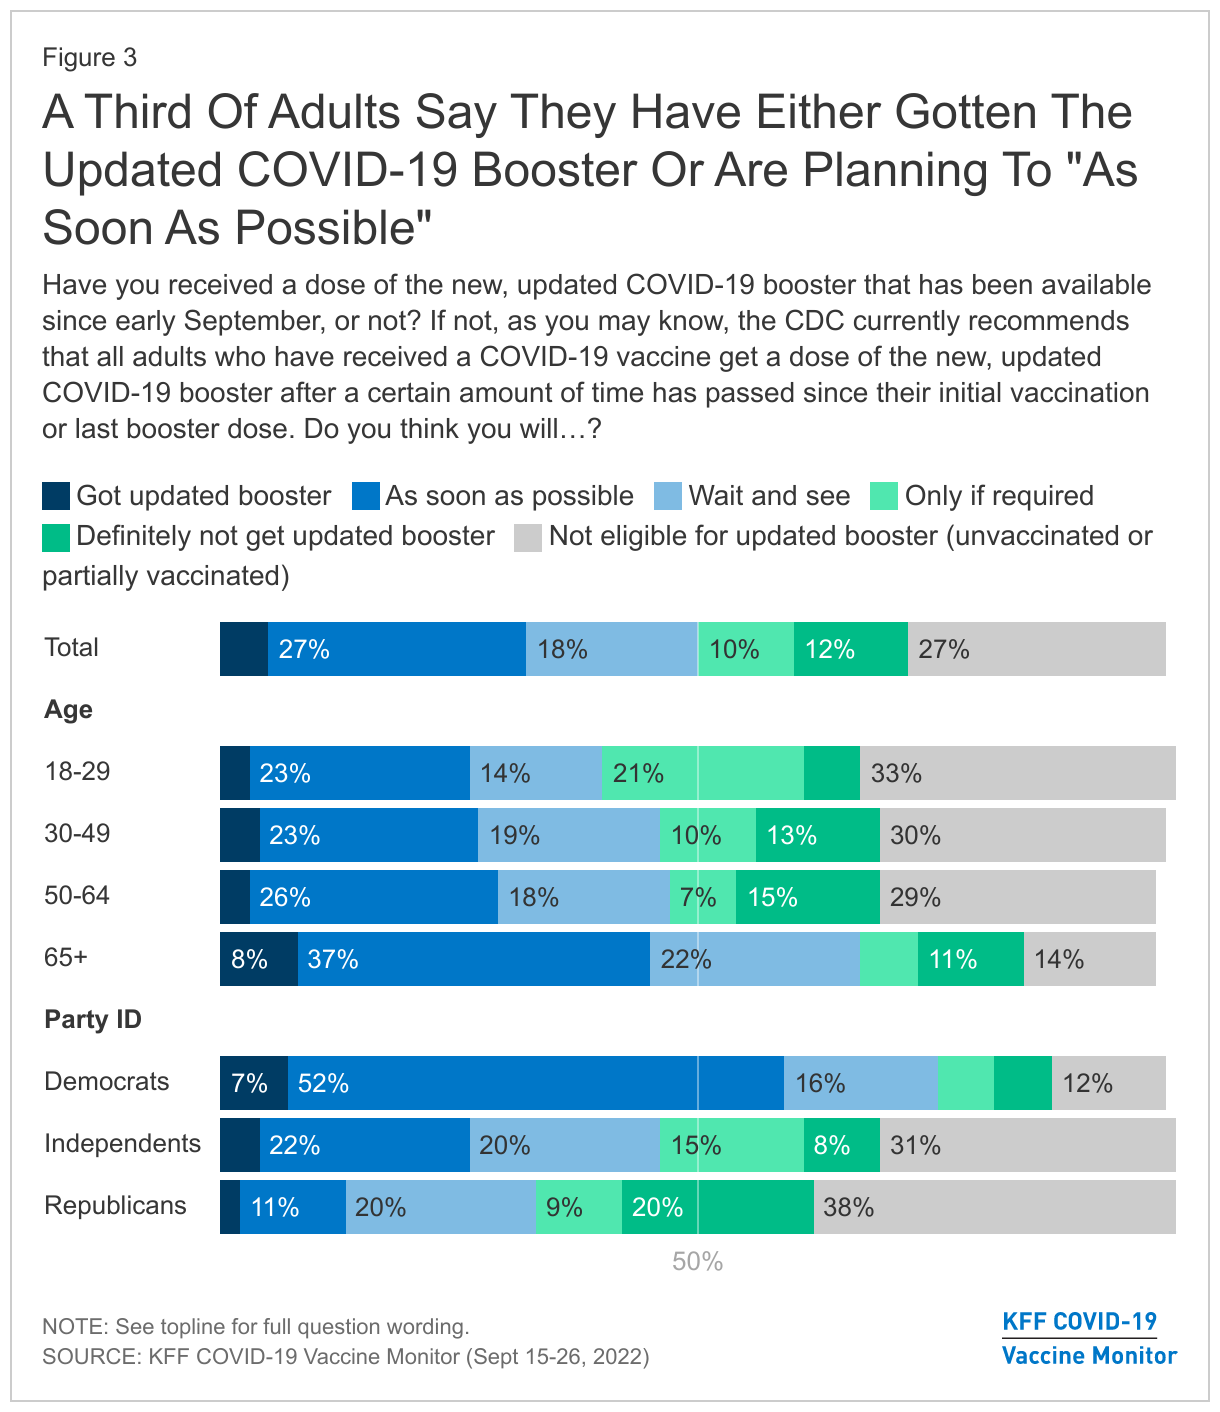
About a third of adults say they have either received the updated bivalent COVID-19 booster dose (5%), which had been available for one to two weeks when the survey was in the field or say they plan to get the new booster as soon as possible (27%). About one in five say they want to “wait and see” before getting the new booster (18%), while 10% will get it “only if required” and 12% say they will “definitely not” get the updated booster dose. Around a quarter of adults are unvaccinated or only partially vaccinated, and therefore not eligible for the new bivalent booster dose.

As with the initial vaccinations, older adults appear to be among the earliest adopters of the new booster. Almost half (45%) of adults ages 65 and older say they’ve gotten the new booster or want to get it as soon as possible. These older adults are among the groups public health officials are focused on getting boosted sooner, as they are more susceptible to serious complications from COVID-19.

The partisan divide also mirrors early COVID-19 vaccine uptake, with six in ten Democrats (60%) saying they’ve already gotten the shot or will get it as soon as possible compared to one in eight Republicans (13%). Notably, 20% of Republicans say they will “definitely not” get the new COVID-19 booster dose, while a further 38% of Republicans are unvaccinated or only partially vaccinated and therefore not eligible for the new updated COVID-19 booster dose.

Around A Third Of Adults Report Having Already Gotten The Updated COVID-19 Booster Or Planning To Get It As Soon As Possible

Vaccination Rates for Children

In July, the FDA granted emergency authorization for both the Pfizer and Moderna COVID-19 vaccines for use in children ages 6 months through 4 years old. The latest KFF COVID-19 Vaccine Monitor survey finds relatively slower initial uptake for this group than for older children for whom the COVID-19 vaccine was authorized last year.

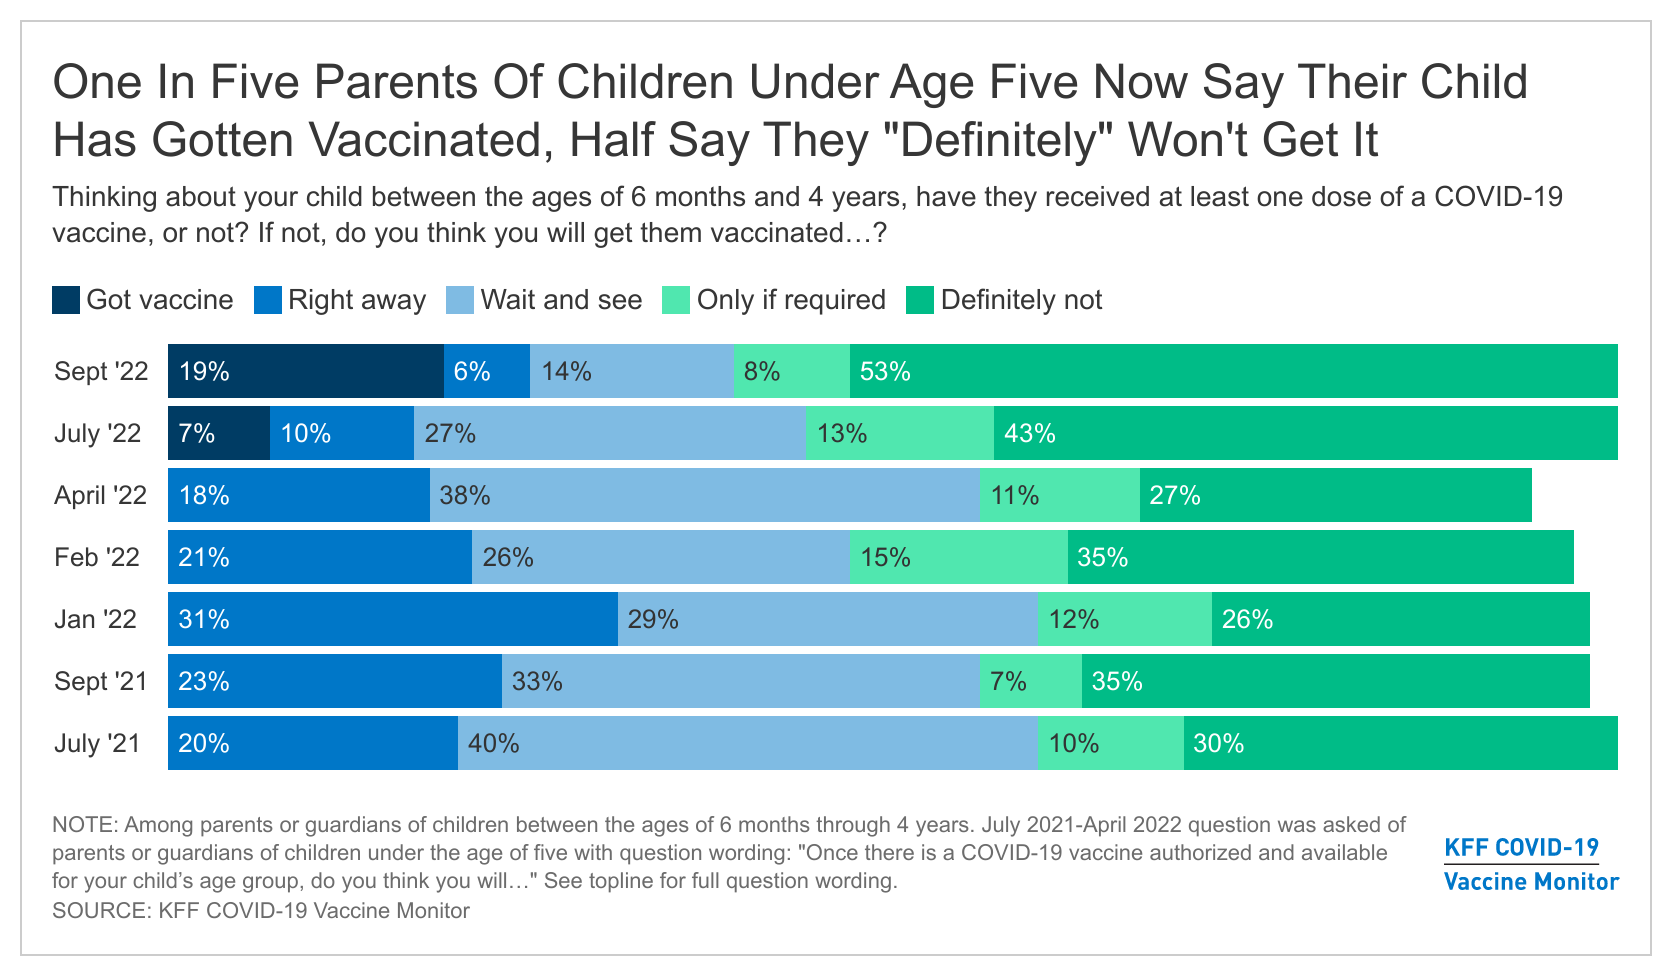
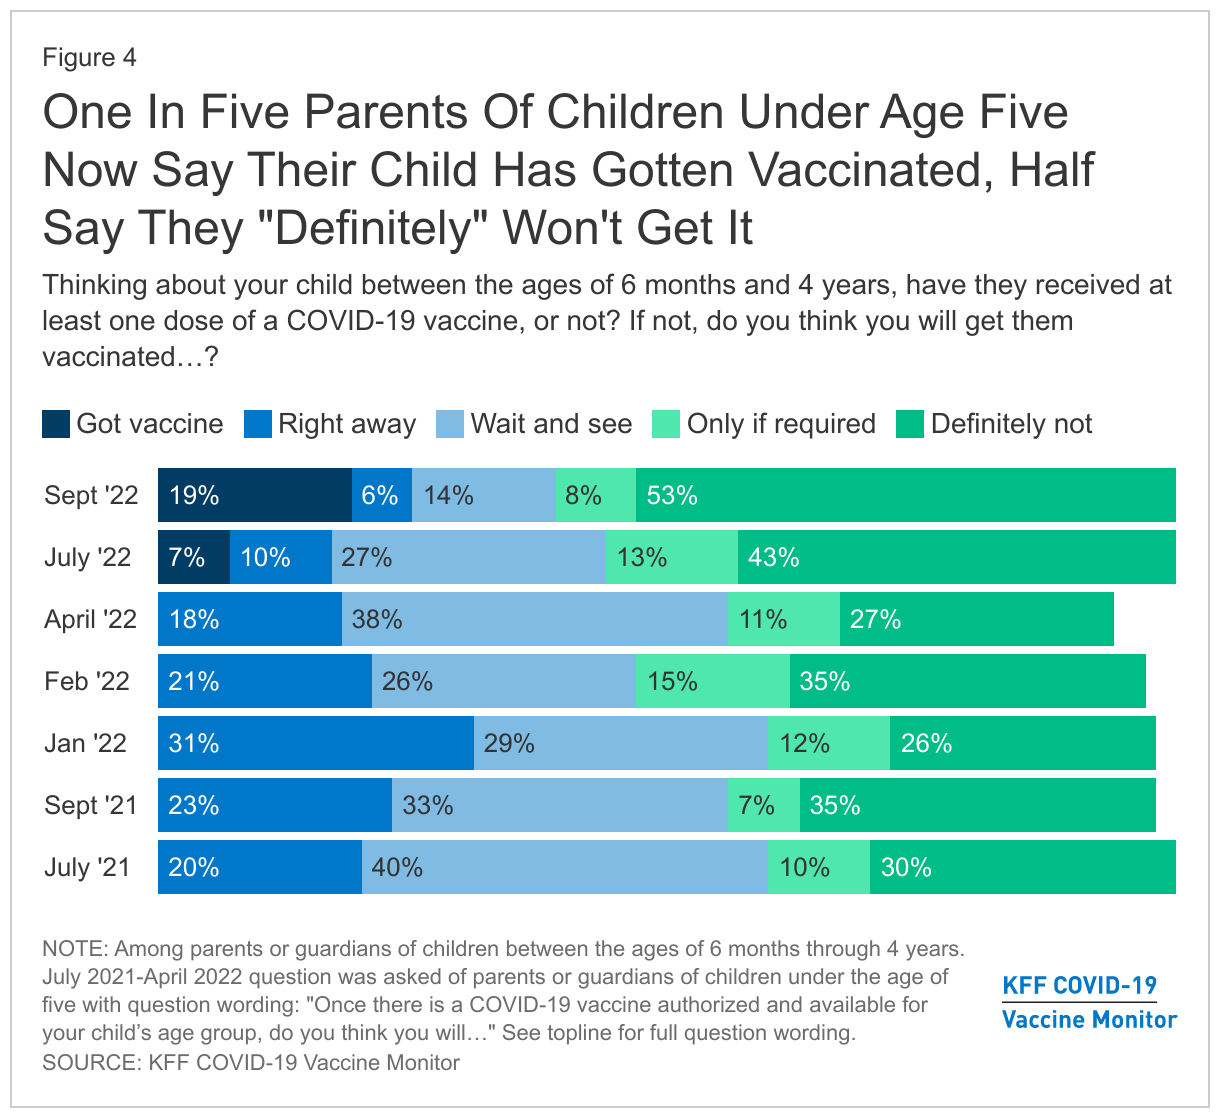
About one in five (19%) parents of children ages 6 months through 4 years old now say their child has gotten vaccinated for COVID-19, up from 7% in July. Few remaining parents of children in this age range (6%) say they plan to vaccinate their children “right away,” while 14% say they want to “wait and see” and another 8% of parents of young children will get them vaccinated “only if required” for school or other activities.

The September Monitor survey finds about half (53%) of parents of children ages 6 months through 4 years old say they will “definitely not” get their child vaccinated for COVID-19. The share who say they will “definitely not” get their young child vaccinated for COVID-19 has increased from surveys taken earlier this year, when the vaccines were not yet available.

COne In Five Parents Of Children Under Age Five Now Say Their Child Has Gotten Vaccinated, Half Say They "Definitely" Won't Get It

Reported vaccine uptake among children ages 5-11 has slowed slightly in recent months. Almost half of parents of kids ages 5-11 now report their child has gotten vaccinated (46%), continuing to tick up from earlier in the year. Just 2% of parents now say they will get their child vaccinated right away, and another 9% of parents of 5-11 year-olds still want to “wait and see.”

The share who say they will get their 5-11 year-old vaccinated “only if required” (8%) or will “definitely not” get them vaccinated (35%) has held steady over the past few months.

Almost Half Of Parents Of Kids Ages 5-11 Say Their Child Has Been Vaccinated

Parents’ intentions to vaccinate their older children have remained relatively steady since the start of the year. Almost six in ten parents of teenagers, ages 12-17, say their child has been vaccinated (62%), with very few parents who say they want to “wait and see” before deciding (2%). Around three in ten parents of 12-17 year-olds say they will definitely not get their child vaccinated (31%) while a further 5% say they will only do so if they are required.

Reported Vaccination Rates For Teenagers Remain Steady, A Third Of Parents Say Their Child Won't Get The COVID-19 Vaccine

Methodology

This KFF COVID-19 Vaccine Monitor Poll was designed and analyzed by public opinion researchers at the Kaiser Family Foundation (KFF). The survey was conducted September 15-26, 2022, online and by telephone among a nationally representative sample of 1,534 U.S. adults including 599 women aged 18 to 49, conducted in English (1,475) and in Spanish (59). The sample includes 1,282 adults reached through the SSRS Opinion Panel[1] either online or over the phone (n=36 in Spanish). The SSRS Opinion Panel is a nationally representative probability-based panel where panel members are recruited randomly in one of two ways: (a) Through invitations mailed to respondents randomly sampled from an Address-Based Sample (ABS) provided by Marketing Systems Groups (MSG) through the U.S. Postal Service’s Computerized Delivery Sequence (CDS); (b) from a dual-frame random digit dial (RDD) sample provided by MSG. For the online panel component, invitations were sent to panel members by email followed by up to three reminder emails. 1,241 panel members completed the survey online and panel members who do not use the internet were reached by phone (41). In appreciation for their participation, web-panelists received a $10 incentive for participation in the form of an electronic gift card.

Another 252 (n=23 in Spanish) interviews were conducted from a random digit dial telephone sample of prepaid cell phone numbers obtained through MSG. Phone numbers used for the prepaid cell phone component were randomly generated from a cell phone sampling frame with disproportionate stratification aimed at reaching Hispanic and non-Hispanic Black respondents. Stratification was based on incidence of the race/ethnicity groups within each frame. Respondents in the phone samples received a $10 incentive.

The combined cell phone and panel samples were weighted to match the sample’s demographics to the national U.S. adult population using data from the Census Bureau’s 2021 Current Population Survey (CPS). Weighting parameters included gender, age, education, race/ethnicity, region, and household tenure. The sample was weighted to match patterns of civic engagement from the September 2017 Volunteering and Civic Life Supplement data from the CPS and to match frequency of internet use from the National Public Opinion Reference Survey (NPORS) for Pew Research Center. Finally, the sample was weighted to match patterns of political party identification based on a parameter derived from recent multi-mode benchmarking polls conducted by SSRS. The weights take into account differences in the probability of selection for each sample type (prepaid cell phone and panel). This includes adjustment for the sample design and geographic stratification of the cell phone sample, within household probability of selection, and the design of the panel-recruitment procedure.

The margin of sampling error including the design effect for the full sample is plus or minus 3 percentage points. Numbers of respondents and margins of sampling error for key subgroups are shown in the table below. For results based on other subgroups, the margin of sampling error may be higher. Sample sizes and margins of sampling error for other subgroups are available by request. Sampling error is only one of many potential sources of error and there may be other unmeasured error in this or any other public opinion poll. Kaiser Family Foundation public opinion and survey research is a charter member of the Transparency Initiative of the American Association for Public Opinion Research.

GroupN (unweighted)M.O.S.E.
Total1,534± 3 percentage points
Race/Ethnicity
White, non-Hispanic864± 4 percentage points
Black, non-Hispanic260± 9 percentage points
Hispanic283± 8 percentage points
Party identification
Democrat622± 6 percentage points
Republican342± 7 percentage points
Independent378± 7 percentage points
Parents
Parent with a child ages 6 months through 4 years old179± 10  percentage points
Parent with a child ages 5-11251± 8  percentage points
Parent with a child ages 12-17235± 9  percentage points


News Release

Half of Public Has Heard Little or Nothing About the New COVID-19 Booster Aimed at Omicron; Many Don’t Know If the CDC Recommends That They Get the New Booster

One Third of Adults, Including Nearly Half of Seniors, Say They’ve Either Gotten the New Booster or Intend to Do So ASAP

Published: Sep 30, 2022

Nearly 1 in 5 Parents of Children Under 5 Say Their Child Has Gotten a Vaccine, up from 7% in July, Though Half Say They Will “Definitely Not” Get Their Child Vaccinated

Less than a month after the Food and Drug Administration authorized new COVID-19 booster shots that target both the omicron and original strains, public awareness is modest, a new KFF COVID-19 Vaccine Monitor survey finds.

Half the public says they’ve heard either “a lot” (17%) or “some” (33%) about the new boosters, while the other half says they’ve heard “a little” or “nothing at all.” Older adults (ages 65 and up), who tend to be at greater risk for serious COVID-19 complications, are most likely to know about the new booster.

The Centers for Disease Control and Prevention has recommended that all vaccinated adults and children ages 12 and up get the new bivalent vaccine, even if they received a previous booster. About half of vaccinated adults (49%) say that they know the new vaccine is recommended for people like them, two in five (40%) are not sure, and 11% say that it is not recommended.

Fielded just weeks after the new booster became available, the new survey shows that about a third (32%) of adults say that they’ve either gotten the new booster (5%) or intend to do so as soon as possible (27%). Among older adults (ages 65 and up), nearly half (45%) say they’ve already gotten the new booster (8%) or plan to get it as soon as possible (37%).

“America is not rushing out to get the new booster. Most are only dimly aware of it, which is not surprising in a country that seems to have mostly moved on,” KFF President and CEO Drew Altman said. “The exception may be older folks, who are at greater risk and early on are more interested in the new booster.”

Adult vaccination rates overall have been relatively steady over the past year. Nearly eight in ten (77%) now say they have gotten at least one dose of any COVID-19 vaccine, including about half who got at least one booster dose (47%), a quarter who have been fully vaccinated but have not gotten a booster (26%), and a few who are partially vaccinated (3%). In addition, 23% are unvaccinated, the vast majority of whom say they will “definitely not” get a shot (88% of the unvaccinated, or 21% of all adults).

Rising Share of Parents with Young Children Report Getting Them Vaccinated

The new survey finds about one in five (19%) parents with children ages 6 months through 4 years report getting their child a COVID-19 vaccine, up significantly since July (7%) soon after children in that age group became eligible.

At the same time, slightly more than half (53%) of parents of these young children say they will “definitely not” get their child a vaccine, also up from earlier this year.

Among other parents with children in this age range, 6% say they plan to vaccinate their children “right away,” 14% say they want to “wait and see” how it works for others, and 8% say they will get them vaccinated “only if required” for school or other activities.

The new survey also provides updated data on what parents of older children say about their vaccine intentions:

  • Almost half (46%) of parents with children ages 5-11 now report their child has gotten vaccinated, up a bit since earlier in this year. More than a third of these parents say they will “definitely not” get their child vaccinated.
  • About six in ten parents of teenagers, ages 12-17, say their child has been vaccinated (62%), while nearly a third (31%) say they will definitely not get their child vaccinated.

Designed and analyzed by public opinion researchers at KFF, the Vaccine Monitor survey was conducted from Sept 15-26, 2022, online and by telephone among a nationally representative sample of 1,534 U.S. adults, in English and in Spanish. The margin of sampling error is plus or minus 3 percentage points for the full sample. For results based on other subgroups, the margin of sampling error may be higher.

The KFF COVID-19 Vaccine Monitor is an ongoing research project tracking the public’s attitudes and experiences with COVID-19 vaccinations. Using a combination of surveys and qualitative research, this project tracks the dynamic nature of public opinion as vaccine development and distribution unfold, including vaccine confidence and acceptance, information needs, trusted messengers and messages, as well as the public’s experiences with vaccination.


Health and Health Care for Hispanic People

Published: Sep 29, 2022

September marks National Hispanic American Heritage Month during which the U.S. recognizes the achievements and contributions of Hispanic people. As the country celebrates these achievements, it is key to recognize that Hispanic people face many disparities in health and health care that limit their overall health and well-being. Hispanic people make up 19% of the total U.S. population and are the second largest racial or ethnic group in the U.S. They are also the second fastest growing group, increasing from 50.5 million to 62.1 million between 2010 and 2020. Hispanic people living in the U.S. have a diverse heritage, with origins from over twenty countries and Puerto Rico. The majority of Hispanic people in the U.S. were born in the country, however 33% are immigrants, including 20% who are noncitizens. Overall, the Hispanic population is relatively young, including 26% who are children ages 18 or younger.


Despite gains in health coverage since the implementation of the Affordable Care Act, nonelderly Hispanic people continue to have some of the highest uninsured rates (20%) across racial/ethnic groups, although risk of being uninsured varies by their family heritage, with particularly high rates among those with roots in Central America. These higher uninsured rates, underlying social and economic inequities, and linguistic barriers contribute to increased challenges in accessing health care. Moreover, Hispanic people faced growing fears about accessing health coverage and other assistance due to shifting immigration policy under the Trump Administration and have experienced disproportionate health, social, and economic impacts from the COVID-19 pandemic. They also face increasing health risks associated with climate change. As a large and growing share of the population, addressing health challenges faced by Hispanic people will be important for improving their health and well-being and supporting overall improved health and prosperity of the country.  

The U.S. Government and Global Maternal and Child Health Efforts

Published: Sep 29, 2022

This fact sheet does not reflect recent changes that have been implemented by the Trump administration, including a foreign aid review and restructuring. For more information, see KFF’s Overview of President Trump’s Executive Actions on Global Health.

Key Facts

  • Millions of pregnant women, new mothers, and children experience severe illness or death each year, largely from preventable or treatable causes. Almost all maternal and child deaths (99%) occur in less developed regions, with Africa being the hardest hit region. There have been some gains: attention to maternal and child health (MCH) has been growing over the past decade, and under-five and maternal mortality have fallen substantially since 1990.
  • The U.S. government (U.S.) has been involved in supporting global MCH efforts for more than 50 years and is the largest donor government to MCH activities in the world, in addition to being the single largest donor to nutrition efforts in the world.
  • In recent years, the U.S. has placed a higher priority on MCH and adopted “ending preventable child and maternal deaths” as one of its three main global health goals.
  • Total U.S. funding for MCH and nutrition was $1.435 billion in FY 2022, up from $728 million in FY 2006. This includes the U.S. contributions to Gavi, the Vaccine Alliance, and the U.N. Children’s Fund (UNICEF) as well as support for polio activities.
  • Despite past gains, there is growing evidence that the COVID-19 pandemic has had a detrimental impact on MCH in many countries, and mitigating and reversing this impact presents new challenges for the U.S. and the global community.

Global Situation

The health of mothers and children is interrelated and affected by multiple factors.1  Millions of pregnant women, new mothers, and children experience severe illness or death each year, largely from preventable or treatable causes.2  Almost all maternal and child deaths (99%) occur in less developed countries, with Africa being the hardest hit region.3  Attention to maternal and child health (MCH) has been growing over the past decade, under-five and maternal mortality have fallen substantially since 1990, and improving MCH is seen as critical to fostering economic development.

Maternal Health: The health of mothers during pregnancy, childbirth, and in the postpartum period.

Child Health: The health of children from birth through adolescence, with a focus on the health of children under the age of five. Newborn health is the health of babies from birth through the first 28 days of life.

Still, as efforts focus on achieving new global MCH goals such as ending preventable deaths among newborns and children under five and reducing global maternal mortality, significant challenges remain. Although effective interventions are available, lack of funding and limited access to services have hampered progress, particularly on maternal health. There is growing evidence that the COVID-19 pandemic has had detrimental effects on maternal and child health and nutrition – slowing or even reversing some progress made over the past decade – by disrupting essential services including routine immunization efforts and fueling malnutrition.

Impact

Each year, an estimated 5 million children under age five – primarily infants – die from largely preventable or treatable causes.4  In addition, approximately 295,000 women die during pregnancy and childbirth each year, and millions more experience severe adverse consequences.5  These challenges are especially prevalent in developing countries. Furthermore, sub-Saharan Africa is the hardest hit region in the world, followed by Southern Asia and South-Eastern Asia; altogether they account for approximately 90% of maternal and under-five deaths.6 

Maternal Mortality

More than a quarter (27%) of all maternal deaths are due to severe bleeding, mostly after childbirth (postpartum hemorrhage). Sepsis (11%), unsafe abortion (8%), and hypertension (14%) are other major causes. Diseases that complicate pregnancy, including malaria, anemia, and HIV, account for about 28% of maternal deaths.7  Inadequate care during pregnancy and high fertility rates, often due to a lack of access to contraception and other family planning/reproductive health (FP/RH) services, increase the lifetime risk of maternal death.8  While the percentage of pregnant women receiving the recommended minimum number of four antenatal care visits has been on the rise, it is only 66% globally and lower still in sub-Saharan Africa and Southern Asia.9 

Newborn and Under-Five Mortality

Complications due to premature births account for more than a third (35%) of newborn deaths, followed by delivery-related complications (24%), sepsis (15%), congenital abnormalities (11%), pneumonia (6%), tetanus (1%), diarrhea (1%), and other causes of death (7%).10  Low birth weight is a major risk factor and indirect cause of newborn death.11 

Newborn deaths account for most child deaths (47%), followed by pneumonia (12%), diarrhea (8%), injuries (6%), malaria (5%), measles (2%), HIV/AIDS (1%), and other causes of death (21%).12  Undernutrition significantly increases children’s vulnerability to these conditions, as does the lack of access to clean water and sanitation.13 

Interventions14 

Key interventions that reduce the risk of maternal mortality include skilled care at birth and emergency obstetric care. Newborn deaths may be substantially reduced through increased use of simple, low-cost interventions, such as breastfeeding, keeping newborns warm and dry, and treating severe newborn infections. When scaled-up, interventions such as immunizations, oral rehydration therapy (ORT), and insecticide-treated mosquito nets (ITNs) have contributed to significant reductions in child morbidity and mortality over the last two decades. Other effective child health interventions include improved access to and use of clean water, sanitation, and hygiene practices like handwashing; improved nutrition; and the treatment of neglected tropical diseases (NTDs). Strengthening health systems and increasing access to services, including through community-based clinics, are also important, and interventions have been found to be more effective when integrated within a comprehensive continuum of care.15 

Global Goals

There are several key global goals for expanding access to and improving MCH services, including:

SDGs 2 & 3: Save Mothers and Children’s Lives and End All Forms of Malnutrition

Global MCH targets were adopted in 2015 as part of Sustainable Development Goals (SDGs) 2 and 3 and are to, by 2030:

  • reduce the global MMR16  and end preventable deaths of newborns and under-five children17  (as targets under SDG 3, which is “ensure healthy lives and promote well-being for all at all ages”); and
  • end all forms of malnutrition (as a target under SDG 2, which is “end hunger, achieve food security and improved nutrition, and promote sustainable agriculture”).18 

Among the global efforts designed to support countries’ progress toward meeting these goals is the Every Woman, Every Child (EWEC) movement and the Scaling Up Nutrition (SUN) movement, which were both launched in 2010. The U.N.-led EWEC movement aims to operationalize the 2015 Global Strategy for Women’s, Children’s, and Adolescents’ Health (2016-2030) by combining the efforts of partners who commit to advancing MCH and related efforts with the goal of ending preventable maternal, newborn, child, and adolescent deaths and stillbirths by 2030, among other goals.18  The SUN movement is an initiative that aims to bring together partner efforts to support households and women, in particular, and which recognizes that nutrition, maternal health, and child survival are closely linked.19 

Global Nutrition for Growth Compact

The Global Nutrition for Growth Compact includes a goal of reducing stunting in children and nutrient deficiencies in women and children. Endorsed in 2013 by more than 40 developing country and donor governments, including the U.S., as well as other stakeholders, it committed them to, by 2020:20 

  • ensuring that at least 500 million pregnant women and children under two are reached with effective nutrition interventions;
  • reducing the number of children under five stunted by at least 20 million; and
  • saving at least 1.7 million under-fives by preventing stunting and increasing breastfeeding and treatment of severe acute malnutrition.

The Tokyo Nutrition for Growth Summit held in December 2021 provided an opportunity for governments to review the status of progress, including the impact of the COVID-19 pandemic on efforts, and to make new commitments in support of reaching SDG 2 by 2030; the next Summit will be hosted by France in 2024.21 

U.S. Government Efforts

The U.S. has been involved in global MCH efforts for more than 50 years. The first U.S. international efforts in the area of MCH began in the 1960s and focused on child survival research, including pioneering research on ORT conducted by the U.S. military, the U.S. Agency for International Development (USAID), and the National Institutes of Health (NIH). Early programs included fortifying international food aid with vitamin A (deficiency of which can cause blindness, compromise immune system function, and retard growth among young children) and efforts to control malaria. The U.S. increased support for its child health efforts in FY 1985 when it provided $85 million for child survival activities, nearly doubling funding for this purpose. USAID then developed its first maternal health project in 1989 and introduced a newborn survival strategy in 2001.22  Funding has increased over time and in FY 2022 reached its highest level to date ($1.435 billion). The U.S. government has adopted a longer-term goal of ending preventable child and maternal deaths by 2035.

Organization

USAID serves as the lead U.S. implementing agency for MCH activities, and its efforts are complemented by those of the Centers for Disease Control and Prevention (CDC), NIH, and the Peace Corps. Collectively, U.S. activities reach over 40 countries.23 

USAID

USAID funds a range of MCH interventions (see Table 124 ), and its MCH efforts focus on 25 “priority countries”, most of which are  in Africa and Southern Asia.25  With a strategic emphasis on reaching the most vulnerable populations and improving access to and quality of care and services for mothers and children across U.S. global health efforts, the agency’s near-term goal had been to save 15 million child lives and 600,000 women’s lives from 2012 through 2020 in priority countries; these countries account for approximately 70% of global maternal and child deaths While short of achieving this goal, USAID reports that its efforts over the past ten years have helped save the lives of more than 9.3 million children and 340,000 women.26  Additionally, in 2014, USAID released, for the first time, a multisectoral nutrition strategy that focuses on improving linkages among its humanitarian, global health, and development efforts to better address both the direct and underlying causes of malnutrition and to build resilience and food security in vulnerable communities.27 

Table 2: U.S. Government-Funded Maternal & Child Health (MCH) Interventions
Newborns and ChildrenWomen
Essential newborn careSkilled care at birth
Postnatal visitsEmergency obstetric care
Prevention and treatment of severe childhood diseasesImproved access to FP/RH and birth spacing
Immunizations, including those for polio, measles, and tetanusAntenatal care, including aseptic techniques to prevent sepsis
Malaria prevention (including ITNs) and, for mothers, intermittent preventive treatment during pregnancy (IPTp)
HIV prevention/treatment/care, including prevention of mother-to-child-transmission (PMTCT) of HIV
Improved nutrition/supplementation
Clean water, sanitation, and hygiene efforts
Health systems strengthening (health workforce, information systems, pharmaceutical management, infrastructure development)
Implementation science and operational research

Other U.S. MCH Efforts

CDC operates immunization programs, provides scientific and technical assistance, and works to build capacity in a broad array of MCH (and related RH) areas. It also serves as a World Health Organization Collaborating Center on reproductive, maternal, perinatal, and child health.28  NIH addresses MCH by carrying out basic science and implementation research, sometimes in cooperation with other countries.29  The Peace Corps carries out MCH-related volunteer projects around the world.30 

Additionally, U.S. global FP/RH efforts are also critical to improving MCH (the internationally agreed upon definition of reproductive health includes both FP and MCH), although Congress directs funding to and USAID operates these programs separately.31  (See the KFF fact sheet on U.S. international FP/RH efforts.)

Other U.S. global health and related efforts addressing conditions that threaten the health of many pregnant women, new mothers, and children include the President’s Emergency Plan for AIDS Relief (PEPFAR), the President’s Malaria Initiative (PMI), USAID’s NTD Program, Feed the Future, and clean water efforts under the Water for the Poor and Water for the World Acts. (See the KFF fact sheets on U.S. PEPFAR efforts, U.S. global malaria efforts, and U.S. global NTD efforts.)

Multilateral Efforts

The U.S. government partners with several international institutions and supports global MCH funding mechanisms. Key among them are:

  • Gavi, the Vaccine Alliance (a multilateral financing mechanism aiming to increase access to immunization in poor countries to which the U.S. is one of the largest donors; see the KFF fact sheet on the U.S. and Gavi);32 
  • the Global Financing Facility (GFF, a partnership to improve the health of women, children, and adolescents through innovative financing in which the U.S. is an investor);33 
  • the Global Polio Eradication Initiative (GPEI, a public-private partnership aiming to advance efforts to eradicate polio to which the U.S. is the second largest donor; see the KFF fact sheet on U.S. global polio efforts);34  and
  • the United Nations Children’s Fund (UNICEF, a U.N. agency aiming to improve the lives of children, particularly the most disadvantaged children and adolescents, to which the U.S. is the largest donor;35  UNICEF is one of the largest purchasers of vaccines worldwide).36 

Funding37 

Total U.S. funding for MCH and nutrition, which includes the U.S. contributions to Gavi and UNICEF as well as support for polio activities, has increased over time. It rose from $728 million in FY 2006 to $1.435 billion in FY 2022, its highest level to date (see figure).38  MCH funding totaled $1.28 billion in FY 2022 and includes $848 million for bilateral efforts (of which $253 million was for polio activities) and $429 million for multilateral efforts ($290 million for Gavi and $139 million for UNICEF). Nutrition funding, all of which was for bilateral efforts, totaled $158 million in FY 2022. The current administration has proposed a similar level of MCH and nutrition funding for FY 2023.

U.S. Funding for Maternal & Child Health (MCH) and Nutrition, FY 2006 - FY 2023 RequestP

Most U.S. funding for MCH and nutrition is provided through the Global Health Programs account at USAID, with additional funding provided through the Economic Support Fund account. MCH funding is also provided through the International Organizations & Programs account at the State Department for the U.S. contribution to UNICEF and through CDC’s global immunization programs.39  (See the KFF fact sheets on the U.S. Global Health Budget: Maternal & Child Health and the U.S. Global Health Budget: Nutrition.)

Although not included as part of core MCH funding, in FY 2021 the U.S. also appropriated $4 billion in emergency COVID-19 funding to Gavi to support COVID-19 vaccine procurement and delivery through COVAX (see the KFF brief on COVAX and the U.S. for more information).

  1. George Schmid, et al., “The Lancet’s neonatal survival series,” The Lancet, Vol. 365, Issue 9474, p. 1845, May 28, 2005. ↩︎
  2. U.N. Interagency Group on Child Mortality Estimates (IGME), Levels and Trends in Child Mortality Report 2019, 2019; IGME, Levels and Trends in Child Mortality Report 2020, 2020; WHO, Trends in maternal mortality: 1990 to 2017, 2019. ↩︎
  3. U.N. IGME, Levels and Trends in Child Mortality Report 2020, 2020; WHO, Trends in maternal mortality: 1990 to 2017, 2019. ↩︎
  4. U.N. IGME, Levels and Trends in Child Mortality Report 2021, 2021; WHO, “Children: improving survival and well-being fact sheet,” Sept. 2020, webpage, https://www.who.int/news-room/fact-sheets/detail/children-reducing-mortality. ↩︎
  5. WHO, Trends in maternal mortality: 2000 to 2017, 2019; WHO/UNICEF, Countdown to 2015 Report, 2012; WHO, “Maternal mortality fact sheet,” Sept. 2019, webpage, https://www.who.int/news-room/fact-sheets/detail/maternal-mortality. ↩︎
  6. U.N. IGME, Levels and Trends in Child Mortality Report 2021, 2021; WHO, Trends in maternal mortality: 2000 to 2017, 2019. ↩︎
  7. L. Say, et al., “Global causes of maternal death: a WHO systematic analysis,” The Lancet Global Health, Vol. 2, no. 6, pp. 323-333, June 2014. ↩︎
  8. WHO and UNICEF, Countdown to 2015 Report, 2012. ↩︎
  9. UNICEF, “Antenatal care,” webpage, July 2022, https://data.unicef.org/topic/maternal-health/antenatal-care/. ↩︎
  10. U.N. IGME, Levels and Trends in Child Mortality Report 2019, 2019. ↩︎
  11. Black, et al., for the Child Health Epidemiology Reference Group of WHO and UNICEF, “Global, Regional, and National Causes of Child Mortality in 2008: A Systematic Analysis,” The Lancet, Vol. 375, Issue 9730, pp. 1969–87, 2010. ↩︎
  12. Does not sum to 100 due to rounding. UN IGME, Levels and Trends in Child Mortality Report 2019, 2019; UN IGME, Levels and Trends in Child Mortality Report 2020, 2020; UN IGME, Levels and Trends in Child Mortality Report 2021, 2021. ↩︎
  13. Robert E. Black, et al., “Maternal and child nutrition: building momentum for impact,” The Lancet, Vol. 382, Issue 9890, pp. 372-375, Aug. 3, 2013; CRS, Child Survival and Maternal Health: U.S. Agency for International Development Programs, FY2001-FY2008, July 2008. Per the UN IGME, Levels and Trends in Child Mortality Report 2017, 2017, “nearly half of all deaths in children under age 5 are attributable to undernutrition.” ↩︎
  14. USAID, Working Toward the Goal of Reducing Maternal and Child Mortality: USAID Programming and Response to FY08 Appropriations (Report to Congress), July 2008; UN, The Millennium Development Goals Report 2009, 2009; The Millennium Development Goals Report 2010, 2010; and The Millennium Development Goals Report 2011, 2011; USAID, Two Decades of Progress: USAID’s Child Survival and Maternal Health Program, June 2009; UN IGME, Levels and Trends in Child Mortality Report 2013, 2013. ↩︎
  15. Partnership for Maternal, Newborn & Child Health, Strategic Framework 2012-2015, November 2011. ↩︎
  16. To less than 70 per 100,000 live births. ↩︎
  17. For neonatal mortality, to at least as low as 12 per 1,000 live births, and for under-five mortality, to at least as low as 25 per 1,000 live births. ↩︎
  18. U.N., Transforming our world: the 2030 Agenda for Sustainable Development, 2015. ↩︎
  19. Its secretariat is located in the United Nations Office for Project Services. SUN, “Frequently Asked Questions,” webpage, https://scalingupnutrition.org/about-sun/frequently-asked-questions/; SUN, “The Vision and Principles of SUN,” webpage, http://scalingupnutrition.org/about-sun/the-vision-and-principles-of-sun/. ↩︎
  20. The Global Nutrition for Growth Compact, June 2013, http://www.who.int/pmnch/media/events/2013/nutritionforgrowth/en/. Progress toward the compact’s goals is tracked by, among others, the Nutrition for Growth partnership, which is led by the governments of the United Kingdom, Brazil, and Japan governments, and involves philanthropic foundations and civil society organizations; see Nutrition for Growth website,  https://nutritionforgrowth.org/updates/. ↩︎
  21. Tokyo Nutrition for Growth Summit, “More than US$27 billion committed to tackle global malnutrition and hunger crisis at the Tokyo Nutrition for Growth Summit,” press release, Dec. 8, 2021, https://nutritionforgrowth.org/tokyo-n4g-summit-2021-press-release/. ↩︎
  22. USAID: MCH website, https://www.usaid.gov/global-health/health-areas/maternal-and-child-health; Working Toward the Goal of Reducing Maternal and Child Mortality: USAID Programming and Response to FY08 Appropriations (Report to Congress), July 2008; Two Decades of Progress: USAID’s Child Survival and Maternal Health Program, June 2009; USAID Reports to Congress, 1985, 1987, 1990. ↩︎
  23. KFF analysis of data from the U.S. Foreign Assistance Dashboard website, ForeignAssistance.gov. Additional countries may be reached through USAID regional programs and other efforts. ↩︎
  24. USAID: Acting on the Call: Ending Preventable Child and Maternal Deaths, June 2014; USAID Maternal Health Vision for Action, June 2014; “USAID’s Investments Save the Lives of Women and Children,” 2019. ↩︎
  25. According to USAID, Acting on the Call: Ending Preventable Child and Maternal Deaths, June 2014, priority countries are chosen based on need (as reflected by maternal and child mortality burden) and having: governments that have demonstrated a commitment to working with others to achieve accelerated reductions in maternal and under-five mortality; and opportunities to integrate/leverage other U.S. global health and development efforts as well as leverage USAID resources against those of the partner-country and other donors/organizations. Additional countries may be reached through other country and regional programs. USAID, “Maternal and Child Health Priority Countries,” webpage, https://www.usaid.gov/global-health/health-areas/maternal-and-child-health/priority-countries; USAID, “Maternal and Child Health,” webpage, https://www.usaid.gov/global-health/health-areas/maternal-and-child-health. ↩︎
  26. USAID: Acting on the Call: Ending Preventable Child and Maternal Deaths, June 2014; USAID Maternal Health Vision for Action, June 2014; “USAID Global Health Programs: FY 2016 President’s Budget Request, Ending Preventable Child and Maternal Deaths,” fact sheet, March 2015; “USAID Global Health Programs Ending Preventable Child and Maternal Deaths – FY 2017,” fact sheet, undated, USAID, Acting on the Call: Preventing Child & Maternal Deaths: A Focus on the Role of Nurses and Midwives, 2020; USAID, Acting on the Call: Preventing Child and Maternal Deaths: A Focus on Sustaining Lifesaving Health Services Amidst the COVID-19 Pandemic, Nov. 2021. ↩︎
  27. USAID, USAID Multi-Sectoral Nutrition Strategy 2014-2025, 2014. USAID reports prioritizing nutrition efforts in 22 focus countries, which are mostly in Africa. 16 of these countries are also MCH priority countries. USAID, “Nutrition Countries,” webpage, https://www.usaid.gov/global-health/health-areas/nutrition/countries. ↩︎
  28. CDC, “About DRH Global Reproductive Health,” website, www.cdc.gov/reproductivehealth/Global/index.htm; WHO Collaborating Centres Global Database, “WHO Collaborating Centre for Reproductive Health,” USA-374, webpage, https://apps.who.int/whocc/Detail.aspx?tBVp7HlRcT5vnFl/XfLrgw==. According to WHO, “WHO collaborating centres are institutions such as research institutes, parts of universities or academies, which are designated by the Director-General to carry out activities in support of the Organization’s programmes.” See WHO, “WHO Collaborating Centres,” webpage, https://www.who.int/about/partnerships/collaborating-centres, for more information. ↩︎
  29. NIH/NICHD Office of Global Health website, https://www.nichd.nih.gov/about/org/od/ogh; NIH Office of Research on Women’s Health, “Global Health Research,” webpage, https://orwh.od.nih.gov/research/funded-research-and-programs/co-funded-research/global-health-research; NIH/FIC, “Maternal and child health news, resources and funding for global health researchers,” webpage, https://www.fic.nih.gov/ResearchTopics/Pages/maternal-child-health.aspx. ↩︎
  30. Peace Corps, “What Volunteers Do: Health,” webpage, https://www.peacecorps.gov/volunteer/what-volunteers-do/#health. ↩︎
  31. International Conference on Population and Development (ICPD), Programme of Action, Cairo, 1994. ↩︎
  32. Gavi has provided over $21 billion for vaccination programs worldwide through June 30, 2021, not including funding for COVAX. Gavi, “Cash Receipts 30 June 2021,” https://www.gavi.org/news-resources/document-library/cash-receipts. ↩︎
  33. The GFF was launched in 2015 as “a multi-stakeholder global partnership housed at the World Bank that is committed to ensuring all women, children and adolescents can survive and thrive” and that “supports 36 low and lower-middle income countries with catalytic financing and technical assistance to develop and implement prioritized national health plans to scale up access to affordable, quality care for women, children and adolescents” (see https://www.globalfinancingfacility.org/introduction). The U.S. is as a member of the Investors Group that oversees the partnership’s overall activities (see https://www.globalfinancingfacility.org/investors-group). See also USAID, “USAID’s Partnership with the Global Financing Facility,” fact sheet, Aug. 2019, https://www.usaid.gov/documents/1864/usaid%E2%80%99s-partnership-global-financing-facility. ↩︎
  34. GPEI has invested about $19 billion in efforts to eradicate polio globally. KFF analysis of funding based on data in GPEI, “Contributions and Pledges to the GPEI, 1985-2022,” as of 31 Dec. 2021, http://polioeradication.org/financing/donors/historical-contributions/ and data from the Office of Management and Budget, Agency Congressional Budget Justifications, Congressional Appropriations Bills, and U.S. Foreign Assistance Dashboard website, ForeignAssistance.gov. ↩︎
  35. In 2021. UNICEF, “Funding to UNICEF,” webpage, https://www.unicef.org/partnerships/funding. ↩︎
  36. UNICEF, “About UNICEF,” webpage, https://www.unicef.org/about-unicef; UNICEF, UNICEF Annual Report 2021, May 2022, https://www.unicef.org/reports/unicef-annual-report-2021; UNICEF, “Funding to UNICEF,” webpage, https://www.unicef.org/partnerships/funding; UNICEF, “Immunization,” webpage, https://www.unicef.org/immunization. ↩︎
  37. KFF analysis of data from the Office of Management and Budget, Agency Congressional Budget Justifications, Congressional Appropriations Bills, and the U.S. Foreign Assistance Dashboard website, ForeignAssistance.gov. ↩︎
  38. Prior to FY 2009, nutrition funding was included as part of maternal and child health. ↩︎
  39. Represents specified funding for international MCH and nutrition programs in the President’s budget request, ForeignAssistance.gov, and Congressional appropriations bills. Additional support for international MCH and nutrition programs is provided through research activities at NIH. ↩︎

Recent Developments and Key Issues to Watch with Medicaid Section 1115 Waivers

Authors: Madeline Guth and Elizabeth Hinton
Published: Sep 28, 2022

Section 1115 demonstration waivers offer states an avenue to test new approaches in Medicaid that differ from what is required by federal statute, as long as the federal Centers for Medicare and Medicaid Services (CMS) determines that such proposals are “likely to assist in promoting the objectives of the [Medicaid] program.” While Section 1115 waivers have been used over time, recent activity from the Trump Administration and into the Biden Administration has tested how these waivers can be used to advance administrative priorities and has also tested the balance between states’ flexibility and discretion by the federal government. The Trump Administration’s Section 1115 waiver policy emphasized work requirements and other eligibility restrictions, payment for institutional behavioral health services, and capped financing. The Biden Administration has signaled a shift in policy to emphasize waivers that expand, rather than restrict, Medicaid coverage and access to care. The Biden Administration has withdrawn work requirements and started to phase out premium requirements, and has instead encouraged states to propose waivers that expand coverage, reduce health disparities, and/or advance “whole-person care” (including addressing health-related social needs). This policy watch describes the current landscape of Section 1115 waivers and highlights key issues to watch: the outcome of litigation related to Georgia’s waiver, as well as the Biden Administration’s decisions on pending requests from Tennessee and other states.

As of September 20, 47 states have a total of 65 approved Section 1115 Medicaid waivers, while 28 states have a total of 32 pending waivers (Figure 1). Pending waivers include new waiver requests and pending extensions or amendments to existing approved waivers. Key themes in current approved and pending waivers include targeted eligibility expansions, benefit expansions (particularly in the area of behavioral health, such as coverage of services provided in institutions for mental disease (IMDs)), and provisions related to social determinants of health (SDOH). More detail on these areas can be found on the updated KFF waiver tracker.

Landscape of Approved and Pending Section 1115 Waivers

Key Issues to Watch

What will happen with Georgia’s Pathways waiver? The Trump Administration aimed to reshape the Medicaid program by newly approving Section 1115 waivers that imposed work and reporting requirements as a condition of Medicaid eligibility; however, courts struck down many of these requirements and the Biden Administration withdrew these provisions in all states that had approvals. One state affected by these administrative activities was Georgia: in December 2021, CMS rescinded work requirement and premium authorities that the Trump Administration had approved as part of a limited coverage expansion (at the state’s regular match rate for federal funding) in Georgia’s waiver—an action that the state subsequently challenged in court. In August 2022, a Federal District Court judge issued a decision in favor of the state, vacating CMS’s rescission of the work requirement and premium provisions and thus reinstating these provisions. Although CMS generally reserves the right to withdraw waiver authorities at any time, the judge found that its rescission of Georgia’s waiver provisions was arbitrary and capricious due to agency errors, including that it failed to weigh that the waiver would have increased Medicaid coverage. CMS has not yet indicated whether it will appeal this decision.

How will the Biden Administration respond to an amendment to Tennessee’s TennCare III waiver?  In January 2021, CMS under the Trump Administration approved a waiver request from Tennessee that set an aggregate cap on federal spending and provided an opportunity for the state to keep a portion of any federal savings. Other controversial aspects of the approval included a closed prescription drug formulary and a 10-year approval period. In June 2022, CMS under the Biden Administration sent a letter to Tennessee asking the state to submit an amendment that would remove the aggregate cap and closed formulary provisions. Tennessee subsequently submitted an amendment that removed these provisions, instead transitioning to a per-capita budget neutrality cap that would allow the state to access the federal share of any savings if expenditures are lower than the cap to invest in Designated State Investment Programs (DSIPs). The amendment leaves the 10-year approval period (through 2030) in place. The waiver is open for federal comment through October 6, but it is unclear how the Biden Administration will respond to the revised financing request.

What provisions will be approved in several key waivers that expire at the end of September? Several states have Section 1115 demonstrations set to expire on September 30. Key provisions to watch in extension proposals from these states would: address enrollees’ SDOH and health equity; expand pre-release services available to incarcerated populations; and provide continuous eligibility for adults and children (Table 1). CMS has indicated an openness to approving some of these provisions, which may align with its strategic priorities under the Biden Administration. For example, in a June 2022 letter to Massachusetts, CMS wrote that it “strongly supports the goals set forth in the state’s extension proposal” and that “CMS and Massachusetts are jointly committed to finalizing the state’s demonstration extension by September 30, 2022, including approval of…authorities necessary to achieve our shared goals.”

Key Pending Provisions To Watch in Section 1115 Waivers

The outcome of waiver proposals and litigation could have implications for other states. The court decision in favor of Georgia calls Section 1115 policy and process into question by limiting CMS’s authority to determine whether already-approved waivers advance Medicaid program objectives. Especially if CMS appeals the decision, the outcome of the case could have implications for other states that may similarly seek limited coverage expansions conditioned on other provisions (like work requirements and/or premiums). Upcoming CMS decisions on Tennessee’s amendment and waivers expiring at the end of September may indicate how the Biden Administration will respond to financing proposals and the extent to which the administration will allow states to use waivers for coverage for incarcerated individuals, to address social determinants of health, and for continuous coverage. In addition to Arizona, Massachusetts, and Oregon, other states are requesting similar provisions in waivers pending or in development at the state level. For example, 10 states in total have pending waivers to provide pre-release coverage to certain incarcerated individuals (Arizona, California, Kentucky, Massachusetts, Montana, New Jersey, Utah, Vermont, Washington, and West Virginia) and five states have pending waivers to provide continuous eligibility for certain populations (Kansas, Massachusetts, New Jersey, Oregon, and Washington). Similar to Oregon, Washington and New Mexico (whose waiver is currently undergoing state-level public comment) are both pursuing continuous enrollment for children through age six. Potential approval of these demonstrations could allow the Biden Administration to promote its strategic Medicaid priorities, which include expanded access to coverage.

Will Long COVID Exacerbate Existing Disparities in Health and Employment?

Author: Alice Burns
Published: Sep 23, 2022

Early data show that as of August 8, 2022, rates of self-reported long COVID are one quarter to one third higher among adults who are female, transgender, Hispanic, and without a high-school degree than they are among all adults (Figure 1). In this policy watch, we explore how those higher rates of long COVID could exacerbate existing disparities in health and employment using new data on long COVID from the Household Pulse Survey, as reported by the Centers for Disease Control and Prevention (CDC). The Pulse survey is an experimental survey providing information about how the COVID pandemic is affecting households from social and economic perspectives. Its primary advantage is the short turn-around time, but the data may not meet all Census Bureau quality standards. In June 2022, the survey began asking questions about long COVID. While these early data provide some important insights into the prevalence of long COVID, to date, the sample only includes about 150,000 respondents, which limits the reliability of the findings and the ability to detect differences between groups. This policy watch focuses on characteristics for which the CDC has determined there are enough observations to report differences between groups.

Percent of Adults Who Ever Had Long COVID, as of August 8, 2022

There is no well-established definition of long COVID, but the Pulse survey asked respondents whether they had any COVID symptoms that lasted for longer than 3 months, including “tiredness or fatigue, difficulty thinking, concentrating, forgetfulness, or memory problems (sometimes referred to as “brain fog”), difficulty breathing or shortness of breath, joint or muscle pain, fast-beating or pounding heart (also known as heart palpitations), chest pain, dizziness on standing, menstrual changes, changes to taste/smell, or inability to exercise.” There are few other studies that evaluate the socioeconomic implications of long COVD, but those that do are consistent with our findings from the Pulse survey.

The Household Pulse data show that rates of long COVID are higher for adults who are female (18%) and transgender (19%) relative to males (11%). The difference in rates between men and women has been documented elsewhere: Another study estimated the prevalence of long COVID pre-Omicron was 1.4%-2.2% of adult females in the U.S. compared with only 0.9%-1.7% of adult males. It is unclear what is driving the differences in outcomes between women and men, but patterns are similar to that of other post-infection syndromes such as chronic fatigue syndrome. These data may be the first published data showing separate rates of long COVID among people who are transgender, and the large confidence interval around the rate suggests considerable uncertainty in the estimate. However, other research shows that transgender people have lower earnings and poorer health outcomes, which could contribute to greater vulnerability to COVID.

One in five (20%) Hispanic adults reported ever having long COVID compared with less than 15% of White, Black, or Asian adults. Data were not separately reported for American Indian and Alaska Native or Native Hawaiian and other Pacific Islander people. There are not studies evaluating the causes of higher long COVID rates among Hispanic adults, but their higher rates of COVID infection undoubtedly contribute to the difference. No differences are observed in rates of long COVID between Black and White adults, despite Black adults experiencing higher age-adjusted rates of COVID infection and death. More research is needed to better understand the racial and ethnic patterns of long COVID rates and their relationship to COVID cases and deaths.

Of adults with less than a high-school diploma, 20% report having long COVID, compared with only 12% of adults with a college degree. The Pulse data as reported by the CDC do not show the distribution of long COVID among people based on income or employment outcomes, but there is a well-established relationship between higher levels of education and lower earnings and income, so it is likely that rates of long COVID are higher among people with lower earnings and incomes. It is unclear to what extent higher rates of long COVID result from reduced access to health care prior to infection, but a study of long COVID rates in the United Kingdom found socioeconomic deprivation was a risk factor. Analyses of future Pulse data, with larger sample sizes, will be useful in determining whether similar patterns exist in the U.S.

Because long COVID disproportionately affects people of working age, it may exacerbate employment outcomes, in addition to health. Consistent with other studies, the Pulse data show that rates of long COVID are highest among adults in their working years. (It is likely that the very low rates of long COVID among people over age 60 reflect higher mortality from COVID among this population.) Current research shows that long COVID significantly affects people’s ability to work. Although it is too early to know how long-term those effects may be, a recent study found that people who experienced week-long, COVID-related absences from work were significantly less likely to be working than similar workers who did not miss a week of work for health-related reasons. And a recent analysis of survey data found that 26% of people with long COVID reported that it had affected their employment.

Looking ahead, long COVID could amplify existing disparities within society. Even before the pandemic, females were more likely to work in low-wage jobs or receive lower pay for similar levels of work as males, and the pandemic had particularly harmful effects on female’s employment relative to male’s. Similarly, higher rates of long COVID among Hispanic adults may further exacerbate health, employment, and income disparities among this group, who were already harder hit by the pandemic. Another study found that Latino and Black adults had higher rates of workplace exposure, which contributed to higher COVID prevalence—and eventually long COVID. The Pulse data suggest that the effects of long COVID—like the effects of the pandemic more broadly—may fall disproportionately among adults who already experience disparities in health and employment outcomes. Currently, the sample size is too small to analyze differences among some populations. Future KFF analysis will leverage additional waves of Pulse survey data to further explore differences among groups that vary by race, ethnicity, income, employment, and other pertinent characteristics.

In releasing two new reports relevant to those with long COVID, HHS Secretary Becerra writes, “Long COVID can hinder an individual’s ability to work, attend school, participate in community life, and engage in everyday activities.” Existing research reinforces the urgency of understanding the effects of long COVID on people: A recent study shows that 4 million people may be out-of-work in the U.S. as a result of long COVID. The implications are magnified when one considers that the employment losses are concentrated among people who already have lower incomes, lower earnings, and additional challenges in accessing health care. Further, long COVID patients are struggling to access disability benefits, which could mitigate some of the financial consequences associated with an inability to work As new research comes out on long COVID, it will be important to improve our understanding of who is most likely to be affected, what types of treatment are most promising, and what social and economic supports may mitigate the longer-term consequences of long COVID on socioeconomic disparities in the U.S.

Five Key Findings on Mental Health and Substance Use Disorders by Race/Ethnicity

Published: Sep 22, 2022

Summary

Over two years into the COVID-19 pandemic, many people continue to grapple with worsened mental health associated with the prolonged impact of the pandemic, including social distancing, income loss, and death and illness. In 2020, 33% of all nonelderly adults reported having a mental illness or substance use disorder. Drug overdose deaths have increased over time – particularly during the pandemic – and these increases have disproportionately affected people of color. Following a period of increases, suicide deaths slowed in 2019 and 2020, although they have increased faster among people of color than White people. Drawing on a series of recent KFF analyses, this brief presents five key findings on mental health and substance use concerns by race/ethnicity. It finds:

  • Rates of death by suicide are rising faster among people of color compared to their White counterparts.
  • The recent rise in deaths associated with drug overdoses has disproportionately affected people of color.
  • Overall rates of mental illness and substance use disorder are lower for people of color compared to White people but may be underdiagnosed among people of color.
  • People of color have experienced worsening mental health during the pandemic.
  • People of color face disproportionate barriers to accessing mental health care.

Rapidly rising rates of deaths by suicide and drug overdose among people of color, along with disproportionate impacts of the COVID-19 pandemic, further underscore inequities in access to mental health care and treatment and highlight the importance of centering equity in diagnostics, care, and treatment.

Key Findings

Rates of death by suicide are rising faster among people of color compared to their White counterparts.

Between 2010 and 2020, Black and American Indian or Alaska Native (AIAN) people experienced the largest increases in rates of death by suicide (Figure 1). AIAN and White people continue to experience the highest rates of deaths by suicide compared to all other racial and ethnic groups (23.9 and 16.8 per 100,000 in 2020, respectively). However, people of color are experiencing the largest increases in rates of death by suicide. AIAN and Black people experienced the largest absolute increases in suicide death rates (7.0 and 2.3 percentage points, respectively) from 2010 to 2020 (Figure 1). Moreover, Black and Hispanic people had larger percentage increases in their suicide death rates compared to White people over the same period (at 43% and 27%, respectively, compared to 12%).

Suicide Death Rates by Race/Ethnicity, 2010-2020

Between 2010 and 2020, suicide-related death rates among adolescents more than doubled for Asian adolescents and nearly doubled for Black and Hispanic adolescents (Figure 1). However, similar to the overall population data, AIAN adolescents accounted for the highest rates of deaths by suicide, over three times higher than White adolescents (22.7 vs. 6.3 per 100,000). In contrast, Black, Hispanic, and Asian adolescents had lower rates of suicide deaths compared to their White peers. Suicide remains the second leading cause of death among adolescents overall.

The recent rise in deaths associated with drug overdoses has disproportionately affected people of color.

Drug overdose death rates increased across all racial and ethnic groups in recent years, but these increases were larger for people of color compared to their White counterparts. Reflecting these increases, drug overdose death rates among Black people surpassed rates of White people by 2020 (35.4 versus 32.8 per 100,000) (Figure 2). However, AIAN people continued to experience the highest rates of drug overdose deaths (41.9 per 100,000 in 2020) compared with all other racial and ethnic groups. Among adolescents, deaths due to drug overdose nearly doubled in 2020 and disproportionately affected adolescents of color. Further, it is possible that deaths by suicide are being undercounted due to misclassifications as drug overdose deaths. Fentanyl-related deaths, which have accounted for many drug overdose deaths during the pandemic, may be disproportionately affecting Black communities.

Age-Adjusted Drug Overdose Deaths Per 100,000, by Race/Ethnicity

White people continue to account for the largest share of deaths due to drug overdose, but people of color are accounting for a growing share of these deaths over time. Between 2015 and 2020, the share of drug overdose deaths among White people fell, while at the same time the shares of these deaths among Black and Hispanic people rose. As a result of this increase, Black people accounted for a disproportionate share of drug overdose deaths relative to their share of the total population in 2020 (17% vs. 13%) (Figure 3). Similarly, reflecting an increase in deaths over the period, Hispanic adolescents accounted for a disproportionate share of drug overdose deaths relative to their share of the population as of 2020 (30% vs. 25%). These recent trends are contributing to emerging disparities in drug overdose deaths among some people of color, which may worsen if they continue.

Distribution of Drug Overdose Deaths, by Race/Ethnicity

Overall rates of mental illness and substance use disorder are lower for people of color compared to White people but may be underdiagnosed among people of color.

In 2020, people of color were generally less likely to report experiencing any mental illness or substance use disorders compared to their White peers. Just over a quarter of Black (28%) and Hispanic (27%) nonelderly adults reported having a mental illness or substance use disorder in 2020, compared to 36% of White nonelderly adults (Figure 4). Though overall mental health and substance use disorders were lower in people of color, other research found that the share of nonelderly adults reporting moderate or severe anxiety and/or depression were similar among White (9%), Black (9%), and Hispanic (8%) adults in 2019. Among adolescents, symptoms of anxiety and/or depression were higher among White (19%) and Hispanic (15%) adolescents and lower among Black adolescents (11%) in 2020.

Prevalence of Mental illness and Substance Use Disorder in Nonelderly Adults by Race/ Ethnicity

A lack of culturally sensitive screening tools that detect mental illness, coupled with structural barriers may contribute to underdiagnosis of mental illness among people of color. Moreover, symptoms of mental illness or substance use disorder among people of color are more likely to be labeled as disruptive or criminal compared to their White counterparts. This practice can occur in childhood where behaviors that may be characterized as a mental health concern among White children are considered disruptive and penalized among children of color and may encourage underreporting of mental health issues. This labeling may, in turn, result in a disproportionate number of Black people being diverted into the justice system instead of treatment centers.

People of color have experienced worsening mental health during the pandemic.

The COVID-19 pandemic has disproportionately impacted people of color in multiple ways that contribute to poor mental health (Figure 5). Compared to their White peers, people of color have experienced higher rates of COVID-19 infection and death and greater financial challenges, including difficulty paying household bills, during the pandemic, which may negatively impact their mental health. KFF COVID-19 Vaccine Monitor Survey data from late 2021 found that at least half of White, Hispanic, and Black adults said the pandemic negatively impacted their mental health. Additional KFF survey data suggests that the mental health of Black and Hispanic parents has been particularly negatively impacted. At least six in ten Black and Hispanic parents say stress related to the pandemic had a negative impact on their mental health compared to less than half of White parents (Figure 5). Further, Black and Asian people have reported negative mental health impacts due to heightened anti-Black and anti-Asian racism and violence during the pandemic.

Impact of the Pandemic on Parents' Mental Health, by Race/Ethnicity

People of color face disproportionate barriers to accessing mental health care.

Leading up to the pandemic, people of color faced disparities in access to and receipt of mental health care, which may have worsened during the pandemic. While similar shares of White, Black, and Hispanic adults reported moderate to severe symptoms of anxiety and/or depression in 2019, a much larger share of Black adults (53%) with these symptoms did not receive care compared to their White (36%) counterparts (Figure 6). Other research shows Black and Hispanic people with mental illness or substance use disorder are less likely to receive treatment compared to the overall population.

Receipt of Mental Health Treatment Among Adults with Moderate or Severe Anxiety and/or Depression by Race/Ethnicity, 2019

People of color face increased barriers to accessing mental health care due to a range of factors both within and beyond the health care system. Research suggests that structural inequities may contribute to disparities in use of mental health care, including lack of health insurance coverage and financial and logistical barriers to accessing care, stemming from broader inequities in social and economic factors. These barriers may have been compounded by the pandemic, which had disproportionate negative financial impacts on people of color.

Lack of a diverse mental health care workforce, the absence of culturally informed treatment options, and stereotypes and discrimination associated with poor mental health may also contribute to limited mental health treatment among people of color. According to the American Psychology Association’s Center for Workforce Studies, although Hispanic and Black people accounted for 30% of the U.S. population, they only made up 9% of the psychology workforce as of 2015. This may be a barrier to treatment access and retention as a recent study found that racial/ethnic concordance among patients and providers plays a significant role in patients’ having positive experiences with their care providers. Moreover, some communities have concerns about the stigma associated with mental illness. For example, Black adults may view mental health conditions as signs of personal weakness and worry about discrimination and experiencing shame in acknowledging their mental health concerns.

Looking Ahead

Drug overdose and suicide deaths among people of color are on the rise, highlighting the inequities in access to and treatment for mental health and substance use disorders. A diverse behavioral health workforce, culturally sensitive screening tools, culturally competent care, and a reduction of structural barriers to care could help improve quality of care and address longstanding barriers to mental health care for people of color. Moreover, recognizing the impacts racism and discrimination and adverse childhood experiences have on both physical and mental health could play a role in developing culturally informed responses to these events. Meanwhile, many people of color continue to experience negative impacts of the COVID-19 pandemic, including worsened mental health, which may persist even as the pandemic subsides.

This work was supported in part by Well Being Trust. KFF maintains full editorial control over all of its policy analysis, polling, and journalism activities.

Medicaid and the Inflation Reduction Act of 2022

Published: Sep 22, 2022

The recent passage of the Inflation Reduction Act of 2022 (IRA) includes a number of climate, tax, and health care provisions and prescription drug reforms. While the prescription drug reforms primarily apply to Medicare; some provisions interact with the Medicaid Drug Rebate Program (MDRP) and could increase overall Medicaid prescription drug spending. In FY 2020, Medicaid gross drug spending was $72 billion and $39 billion was offset by rebates, resulting in $33 billion of net spending that is shared by states and the federal government, accounting for approximately 5% of total Medicaid spending. Despite remaining stable from 2015 to 2019, Medicaid net spending on prescription drugs increased in 2020. Further, the onset of the COVID-19 pandemic has impacted prescription drug trends, with Medicaid prescription drug utilization declining in 2020 while both gross and net spending increased. While other Medicaid provisions, such as closing the coverage gap, were not included in the final reconciliation bill, the Act does include expanded access to vaccines for adults on Medicaid. This policy watch explores the potential impacts of the Inflation Reduction Act on overall Medicaid spending as well as implications for Medicaid beneficiaries.

The Medicare price negotiation provisions included in the Inflation Reduction Act are not expected to have significant implications for Medicaid. Under the new law, the federal government will be able to negotiate prices for some high-cost drugs covered under Medicare starting in 2026. A previous KFF analysis found Medicare negotiation would increase Medicaid drug costs due to lower rebate payments; however, the new law mitigates the impact on Medicaid by including provisions that protect Medicaid rebates and allow Medicaid to benefit from the negotiated prices. Due to federally required rebates under the MDRP, Medicaid pays substantially lower net prices for drugs than Medicare or private insurers, and manufacturer rebates lowered overall Medicaid prescription drug spending by 55% in FY 2020.

The Medicare inflationary rebates established in the new law are expected to increase Medicaid drug spending. The new law requires drug companies to pay a rebate to the government if drug prices rise faster than inflation for Medicare starting in 2023. Medicaid already receives inflationary rebates through the MDRP, and inflation-related rebates provide a large amount of savings for Medicaid programs. The Medicare inflation-related rebates will mean slower growth in drug prices over time, leading to lower Medicaid inflation-related rebates. These rebate losses are expected to outweigh any pharmacy savings from slower drug price growth. Further, drug companies are expected to increase drug launch prices to offset the slower growth in prices, which are projected to increase Medicaid costs despite a larger rebate on the newly launched drug. The CBO estimates the IRA’s Medicare inflation-related rebates will increase Medicaid spending by $15.7 billion over a ten-year period.

Other recent policy changes have implications for the IRA’s impact on Medicaid. Since 2010, there has been a cap on the total rebate amount Medicaid can receive for a drug (100% of average manufacturer price (AMP)). As a result, manufacturers who hit the rebate cap do not face additional Medicaid rebates if they continue to increase prices; a 2015 analysis found about 18.5% of brand drugs reached the rebate cap during the fourth quarter. The American Rescue Plan Act eliminated the cap on Medicaid drug rebates starting in 2024, allowing Medicaid programs to collect rebates (beyond 100% AMP) from manufacturers who continue to increase prices. This change magnifies the effects of the Medicare inflation-related rebates in the IRA relative to previous estimates made before the lifting of the Medicaid cap. At the same time, the IRA includes a provision prohibiting the implementation of a Trump-era prescription drug rebate rule, which could offset some of the increases in Medicaid spending.

The provisions are not expected to impact costs for Medicaid beneficiaries, who continue to be protected against high out-of-pocket drug costs. Medicaid beneficiaries usually pay little or no copays for prescription drugs, including for insulin. The Inflation Reduction Act includes new protections against high out-of-pocket costs for Medicare beneficiaries by adding a $2,000 cap on Medicare Part D out-of-pocket spending starting in 2025 as well as a $35 out-of-pocket cap on insulin costs for Medicare beneficiaries starting in 2023.

The Inflation Reduction Act also covers vaccines and vaccine administration for all Medicaid adults with no cost sharing. Vaccines were previously an optional benefit for certain adult populations, including low-income parent/caretakers, pregnant women, and persons who are eligible based on old age or a disability, but were covered for adults enrolled under the ACA’s Medicaid expansion. One survey from 2018-2019 found half of states did not cover all Advisory Committee on Immunization Practices (ACIP) recommended vaccines and 15 states had cost sharing requirements. Using the survey’s state level data and 2019 adult Medicaid enrollment data, we estimate about 4 million adults could gain coverage of at least one or more vaccines through this provision. Overall, this provision is expected to improve access to vaccines and increase adult vaccination rates and is projected to increase Medicaid spending by $2.5 billion over a ten-year period.


(more…)

2022 State Ballot Initiatives on Abortion Rights

Author: Michelle Long
Published: Sep 20, 2022

Updated November 14, 2022On June 24, 2022, the Supreme Court overturned Roe v. Wade, eliminating the federal Constitutional standard that had protected the right to abortion. Absent any federal standard addressing a right to abortion, states may set their own policies banning or protecting abortion. Explicit protections or restrictions in state Constitutions will limit the authority of state legislators to pass new abortion laws. Presently, five states have Constitutional amendments restricting state courts from interpreting a right to abortion or requiring state funding of abortion. Ten states have state supreme court rulings interpreting a right to abortion in their state Constitutions, but these rulings can be overturned. Most recently, in June 2022, the Iowa Supreme Court overturned its previous decision interpreting the right to abortion in its state Constitution. However, explicit state Constitutional amendments recognizing or restricting abortion remove the role of the state courts in interpreting the state Constitution to evaluate whether a right to abortion is recognized in that state.

(more…)

Medicaid Pandemic Enrollment Policies Helped Drive a Drop in the Uninsured Rate in 2021, but the Coverage Gains Are at Risk

Published: Sep 16, 2022

The Census Bureau released its annual data from the Current Population Survey (CPS) and the American Community Survey(ACS) on health insurance coverage in the US this week. Although the numbers differ slightly, both surveys show that after increasing for several years prior to the pandemic, the uninsured rate declined in 2021, driven by an increase in public coverage, particularly Medicaid coverage. According to data from the American Community Survey (ACS), the uninsured rate dropped from 9.2% in 2019 to 8.6% in 2021 – representing over 1.5 million people gaining coverage — matching the historic low uninsured rate reported in 2016 following implementation of the Affordable Care Act (ACA) (Figure 1).

Changes in Health Insurance Coverage, 2019-2021

Policies adopted during the pandemic to ensure continued coverage in Medicaid were largely responsible for the decline in the uninsured rate. Specifically, provisions in the Families First Coronavirus Response Act (FFCRA), enacted at the start of the pandemic, prohibit states from disenrolling people from Medicaid until the month after the COVID-19 public health emergency (PHE) ends. The ACS data show an increase of 1.3 percentage points in the Medicaid coverage with 69 million covered by Medicaid in 2021. Data from the Centers for Medicare and Medicaid Services (CMS) showed that Medicaid enrollment in May 2022 had increased by nearly 25% since February 2020, much larger than the ACS increase, with 87 million enrolled as of December 2021. There are long-standing discrepancies between survey and administrative data, due in part to different ways of counting people.  Medicaid administrative data are reported by states and reflect enrollment at the end of a given month while the ACS asks individuals about coverage at a point in time. However, many people may not know they have Medicaid coverage, perhaps because their coverage is administered by a private managed care plan, and may misreport their source of coverage on the survey. National survey data also typically undercount lower income people who are more likely to be covered by Medicaid. Because so many people have been kept continuously enrolled in Medicaid during the public health emergency – in many cases without any notification – the disparity between administrative and survey data may be exacerbated.

Enhanced ACA Marketplace subsidies made available by the American Rescue Plan Act (ARPA) and renewed for another three years in the Inflation Reduction Act of 2022 (IRA), also contributed to the coverage gains in 2021. The Biden Administration also increased funding for consumer assistance and established a special ACA enrollment period during the pandemic in 2021. While private coverage dropped overall, direct purchase coverage, which includes Marketplace coverage, increased by 0.6 percentage points to 13.7% in 2021.

Despite these coverage gains, about 28 million people remain without health insurance and concerning disparities in uninsured rates persist. People of color, with the exception of Asian people, have higher uninsured rates than White people. The uninsured rate for people who live in poverty is nearly five times that of people with incomes over 400% of the federal poverty level. And, people who live in states that have not expanded Medicaid are nearly twice as likely to be uninsured as those who live in expansion states (Figure 2).

Uninsured Rates by Selected Characteristics, 2021

The number of people who are uninsured would be reduced further by closing the coverage gap in the dozen states that have not adopted the Medicaid expansion. Previous KFF estimates show there are 2.2 million uninsured people with incomes below poverty ineligible for Medicaid or ACA subsidies in these states. A temporary federal policy to close the coverage gap was included in the House-passed reconciliation bill; however, that provision was not included in the IRA. Without a federal program, attention will turn back to the states, where expansion is likely to be an issue in some upcoming state elections.

While this week’s news points to increased coverage, these coverage gains could be short-lived. Once the public health emergency ends, which is expected sometime next year, states will resume Medicaid redeterminations and will disenroll people who are no longer eligible or who are unable to complete the renewal process even if they remain eligible. As a result, KFF estimates that between 5 and 14 million people could lose Medicaid coverage, including many who newly gained coverage in the past year.

Preventing an erosion of the new gains in coverage will be challenging once the Medicaid continuous enrollment requirement ends, and results will likely vary from state to state depending on how they approach unwinding the requirement. For example, states that streamline the Medicaid renewal process and help people transition to other coverage are likely to see fewer coverage losses. The continued availability of the enhanced Marketplace subsidies will make that coverage more affordable for people who are disenrolled from Medicaid and may increase the share of people who successfully transition from Medicaid to Marketplace coverage.