News Release

A Review of 62 Studies Finds Few Big Differences Between Traditional Medicare and Medicare Advantage on a Variety of Measures

Enrollees in Medicare Advantage Were More Likely to Get Routine Check-ups and Immunizations, While Those in Traditional Medicare Were More Likely to Receive Care in the Highest-Rated Hospitals. Rates of Satisfaction Were Similar Among Both Groups

Published: Sep 16, 2022

With the Medicare open enrollment period set to begin Oct. 15, a perennial decision faced by Medicare beneficiaries is whether to get their coverage through traditional Medicare or the private plans known as Medicare Advantage.

A new KFF review of 62 studies published since 2016 that compares Medicare Advantage and traditional Medicare on measures of beneficiary experience, affordability, utilization, and quality finds few differences that are supported by strong evidence or have been replicated across multiple studies. For example, beneficiaries in both coverage types reported similar rates of satisfaction with their care and overall measures of care coordination.

Notably, relatively few studies specifically examined specific subgroups of interest, such as beneficiaries from communities of color, living in rural areas, or dually eligible for Medicare and Medicaid, making it difficult to assess the strength of the findings or how broadly they apply.

In some areas, however, the research identified noteworthy differences between Medicare Advantage and traditional Medicare, including: 

Medicare Advantage:

  • Medicare Advantage enrollees were more likely than those in traditional Medicare to report having a usual source of care. They were also more likely to receive preventive care services, such as annual wellness visits and routine checkups, screenings, and flu or pneumococcal vaccines.
  • Medicare Advantage enrollees reported better experiences getting needed prescription drugs than traditional Medicare beneficiaries overall. However, among beneficiaries with diabetes, cancer, or a mental health condition, findings were mixed.
  • Most studies found that utilization of home health services and post-acute skilled nursing or inpatient rehabilitation facility care was lower among Medicare Advantage enrollees than traditional Medicare beneficiaries, but were inconclusive as to whether that was associated with better or worse outcomes.

Traditional Medicare:

  • A somewhat smaller share of traditional Medicare beneficiaries than Medicare Advantage enrollees experienced a cost-related problem, mainly due to lower rates of cost-related problems among traditional Medicare beneficiaries with supplemental coverage. (But traditional Medicare beneficiaries without supplemental coverage had the most affordability-related difficulties.)
  • Traditional Medicare outperformed Medicare Advantage on measures such as receiving care in the highest-rated hospitals for cancer care or in the highest-quality skilled nursing facilities and home health agencies.

In other areas, though, findings were mixed or showed little difference between Medicare Advantage and traditional Medicare based on multiple studies.

Among the findings:

  • There were generally no differences in the aggregate number of hospital days or average length of stay for common medical admissions.
  • Neither Medicare Advantage nor traditional Medicare consistently performed better across all quality measures.
  • Additionally, two analyses of several measures of beneficiary experience found no differences between the two groups in experiences with wait times and in the share reporting trouble finding a general doctor, being told that their health insurance was not accepted, and being told they would not be accepted as a new patient.

Findings related to the use of other health care services, including hospital care and prescription drugs, and condition-specific quality of care measures varied – likely due to differences in data and methodology across studies.

Interest in how well Medicare Advantage plans serve their growing and increasingly diverse enrollee population has never been higher, as Medicare Advantage, for the first time, is projected to enroll more than half of all eligible Medicare beneficiaries next year, making it the main way that Medicare beneficiaries get their coverage and care. In comparison, just over a decade ago in 2010, 25 percent of the eligible population was in a Medicare Advantage plan.

The Medicare open enrollment period runs through Dec. 7.The full analysis, Beneficiary Experience, Affordability, Utilization, and Quality in Medicare Advantage and Traditional Medicare: A Review of the Literature, as well as more data and analyses about Medicare Advantage, are available at kff.org.

Beneficiary Experience, Affordability, Utilization, and Quality in Medicare Advantage and Traditional Medicare: A Review of the Literature

Published: Sep 16, 2022

Executive Summary

The growing role of Medicare Advantage in the Medicare program and the changing demographics of Medicare Advantage enrollees have given rise to an interest in how well private plans serve their enrollees relative to traditional Medicare. To answer this question, we build on a previous review of research by examining 62 studies published since 2016 that compare Medicare Advantage and traditional Medicare based on measures of beneficiary experience, affordability, service utilization, and quality.

We found few differences between Medicare Advantage and traditional Medicare that are supported by strong evidence or have been replicated across multiple studies. Both Medicare Advantage and traditional Medicare beneficiaries reported similar rates of satisfaction with their care and overall measures of care coordination. Medicare Advantage outperformed traditional Medicare on some measures, such as use of preventive services, having a usual source of care, and lower hospital readmission rates. However, traditional Medicare outperformed Medicare Advantage on other measures, such as receiving care in the highest-rated hospitals for cancer care or in the highest-quality skilled nursing facilities and home health agencies. Additionally, a somewhat smaller share of traditional Medicare beneficiaries than Medicare Advantage enrollees experienced a cost-related problem, mainly due to lower rates of cost-related problems among traditional Medicare beneficiaries with supplemental coverage. Several studies found lower use of post-acute care among Medicare Advantage enrollees but were inconclusive as to whether that was associated with better or worse outcomes. Findings related to the use of other health care services, including hospital care and prescription drugs, and condition-specific quality of care measures varied – likely due to differences in data and methodology across studies.

When possible, we highlight findings for specific subgroups of interest, such as beneficiaries from communities of color, living in rural areas, or dually eligible for Medicare and Medicaid. Notably, relatively few studies specifically examine these population subgroups, so it is difficult to assess the strength of the findings or how broadly they apply. For example, one study found that Black Medicare beneficiaries had higher rates of potentially avoidable hospitalizations in Medicare Advantage than in traditional Medicare. While important, we could not identify additional analyses that compared the rate of potentially avoidable hospitalizations between Medicare Advantage and traditional Medicare among Hispanic and other beneficiaries of color, beneficiaries living in rural areas, or beneficiaries dually eligible for Medicare and Medicaid. Additionally, despite an increased focus on alternative payment models in Medicare, we only identified two studies that differentiated traditional Medicare beneficiaries attributed to accountable care organizations (ACOs) from traditional Medicare beneficiaries not attributed to ACOs.

Our findings across all measures are summarized below.

Beneficiary Experience

Satisfaction, access to care, care coordination, and experience with prescription drugs: Beneficiaries in Medicare Advantage and traditional Medicare reported similar rates of satisfaction with their care, and similar experiences with wait times, finding a new provider, and overall measures of care coordination. However, Medicare Advantage enrollees were more likely to report having a usual source of care, receiving information during care transitions, and having better experiences getting needed prescription drugs.

Switching: Overall, there were low rates of switching between Medicare Advantage and traditional Medicare, though a slightly larger share of Medicare Advantage enrollees opted to switch from Medicare Advantage to traditional Medicare than beneficiaries who switched from traditional Medicare to Medicare Advantage. Additionally, rates of switching from Medicare Advantage to traditional Medicare were relatively higher among beneficiaries who are dually eligible for Medicare and Medicaid, beneficiaries of color, beneficiaries in rural areas, and following the onset of a functional impairment. Switching rates may be a proxy for dissatisfaction with current coverage arrangements.

Affordability

A somewhat smaller share of beneficiaries in traditional Medicare with supplemental coverage than Medicare Advantage enrollees reported having cost-related problems. Similar findings were observed among Black beneficiaries, beneficiaries under the age of 65, and beneficiaries in fair or poor self-assessed health. Beneficiaries in traditional Medicare with no supplemental coverage had higher rates of cost-related problems than beneficiaries enrolled in Medicare Advantage plans. Three studies examining beneficiaries with high-needs, diabetes, or a mental illness found no differences in affordability-related measures between Medicare Advantage and traditional Medicare.

Utilization

Preventive services: Medicare Advantage enrollees were more likely than beneficiaries in traditional Medicare to receive preventive care services, such as annual wellness visits and routine checkups, screenings, and flu or pneumococcal vaccines, based on several studies, with similar findings for people of color and beneficiaries under age 65.

Hospital Services: Differences in the use of hospital services between people in Medicare Advantage and traditional Medicare varied based on how hospital utilization is measured. Overall, there were generally no differences in the aggregate number of hospital days or average length of stay for common medical admissions, based on evidence from five studies. Four studies found fewer hospital stays among Medicare Advantage enrollees compared to traditional Medicare beneficiaries for at least some groups of beneficiaries. Differences in the share of beneficiaries with at least one hospital stay varied, with two studies finding no differences between Medicare Advantage and traditional Medicare and two studies finding lower rates in Medicare Advantage. No studies examined differences in hospital utilization between Medicare Advantage and traditional Medicare by race and ethnicity or other demographics.

Post-Acute Care: Several studies reported lower rates of skilled nursing facility (SNF), inpatient rehabilitation facility (IRF), and home health use among Medicare Advantage enrollees, and shorter lengths of stay in SNFs and IRFs for Medicare Advantage enrollees than traditional Medicare beneficiaries. Across the seven studies that examined the relationship between post-acute care use, home health use, and patient outcomes, studies generally found lower hospital readmission rates among Medicare advantage users of SNFs and lower hospitalization rates among Medicare Advantage users of home health, but mixed results across other outcomes of care. None of these studies presented results by race and ethnicity or other demographics.

Prescription Drugs: Findings on prescription drug use varied depending on the measure of utilization and condition studied. Three studies found that among specific groups – people with a mental illness, diabetes, Alzheimer’s disease, and high-need beneficiaries (each studied separately) – there were no differences in the use of prescription drugs between Medicare Advantage and traditional Medicare beneficiaries. Two of these studies found that the use of prescription drugs was higher for Medicare Advantage enrollees than traditional Medicare beneficiaries without diabetes and without Alzheimer’s disease. Conversely, another study found that Medicare Advantage enrollees were less likely than traditional Medicare beneficiaries in stand-alone prescription drug plans to fill at least one prescription for an opioid. None of these studies stratified results by race and ethnicity or other demographic groups.

Physician-administered drugs (i.e., Part B drugs): A single study examined the use of physician-administered drugs and found no difference between Medicare Advantage enrollees and traditional Medicare beneficiaries in the number of injectable drug procedures. Another study found that Medicare Advantage enrollees were more likely than traditional Medicare beneficiaries to receive low-cost Part B drugs in four clinical scenarios where similar or equally effective drugs exist, suggesting that Medicare Advantage coverage may be associated with more efficient prescribing of Part B drugs. These two studies did not present results by race, ethnicity, or other demographics.

Other medical provider and emergency department visits: Medicare Advantage enrollees had fewer medical provider visits overall, but more primary care visits per person, based on four of the six studies we reviewed that compared the number of provider visits between beneficiaries enrolled in Medicare Advantage and traditional Medicare. Emergency department (ED) use was generally similar among Medicare Advantage and traditional Medicare beneficiaries overall, based on one study. A second study that focused on beneficiaries in a single hospital-based delivery system (Banner Health) found that Medicare Advantage enrollees had higher ED visit rates than traditional Medicare attributed to an ACO and traditional Medicare beneficiaries not attributed to an ACO. None of these studies presented results by race, ethnicity, or other demographics.

Quality

Hospital Readmissions: Seven of the 12 studies comparing hospital readmission rates found lower overall readmission rates among Medicare Advantage enrollees than among traditional Medicare beneficiaries. However, four studies that were limited to beneficiaries in a single hospital or beneficiaries undergoing specific procedures, such as knee/hip replacements, found no differences. One study that looked at readmission rates for people with three chronic conditions (myocardial infarction, congestive heart failure, and pneumonia) found higher readmission rates among Medicare Advantage enrollees relative to beneficiaries in traditional Medicare. In two separate studies, Black beneficiaries had higher readmission rates than White beneficiaries in both Medicare Advantage and traditional Medicare.

Potentially avoidable hospitalizations: One study found that Black beneficiaries had higher rates of potentially avoidable hospitalizations for ambulatory care sensitive conditions (ACSCs) in Medicare Advantage than in traditional Medicare. Another study examined rates of hospitalization for ambulatory care sensitive conditions overall and by clinical condition, finding that traditional Medicare beneficiaries were hospitalized more often than Medicare Advantage enrollees for ACSCs; however, this study did not account for differences in the characteristics of Medicare Advantage enrollees and traditional Medicare beneficiaries.

Quality of facility or provider: Five of six studies we reviewed that looked at quality ratings of health care facilities and providers used by Medicare Advantage enrollees and traditional Medicare beneficiaries found that Medicare Advantage enrollees were less likely than traditional Medicare beneficiaries to receive care in the highest-or lowest-rated hospitals overall or in the highest-rated hospitals for cancer care, skilled nursing facilities (SNFs), and home health agencies. A sixth study examined 18 facility-level quality measures in long-stay nursing homes (i.e., nursing homes) and short-stay nursing homes (i.e., SNFs), finding no differences between Medicare Advantage and traditional Medicare for ten of the measures. However, the remaining eight measures had mixed findings, with Medicare Advantage enrollees having lower risk of antipsychotic drug use while traditional Medicare beneficiaries having lower risk of moderate to severe pain and urinary incontinence.

Disease management (heart disease and diabetes): Findings on disease management varied by condition and quality measure. Among beneficiaries with heart disease, Medicare Advantage enrollees were more likely than those in traditional Medicare to receive guideline-recommended therapies in ambulatory settings, but there were no differences reported in inpatient settings. Additionally, among people with diabetes, Medicare Advantage enrollees were more likely than beneficiaries in traditional Medicare to be prescribed guideline-recommended therapy, use medication for their condition, and perform better on clinical care measures such as diabetic eye exam screening; however, there were no differences in blood sugar control, insulin use, or receipt of blood diabetes tests between Medicare Advantage enrollees and traditional Medicare beneficiaries.

Report

Introduction

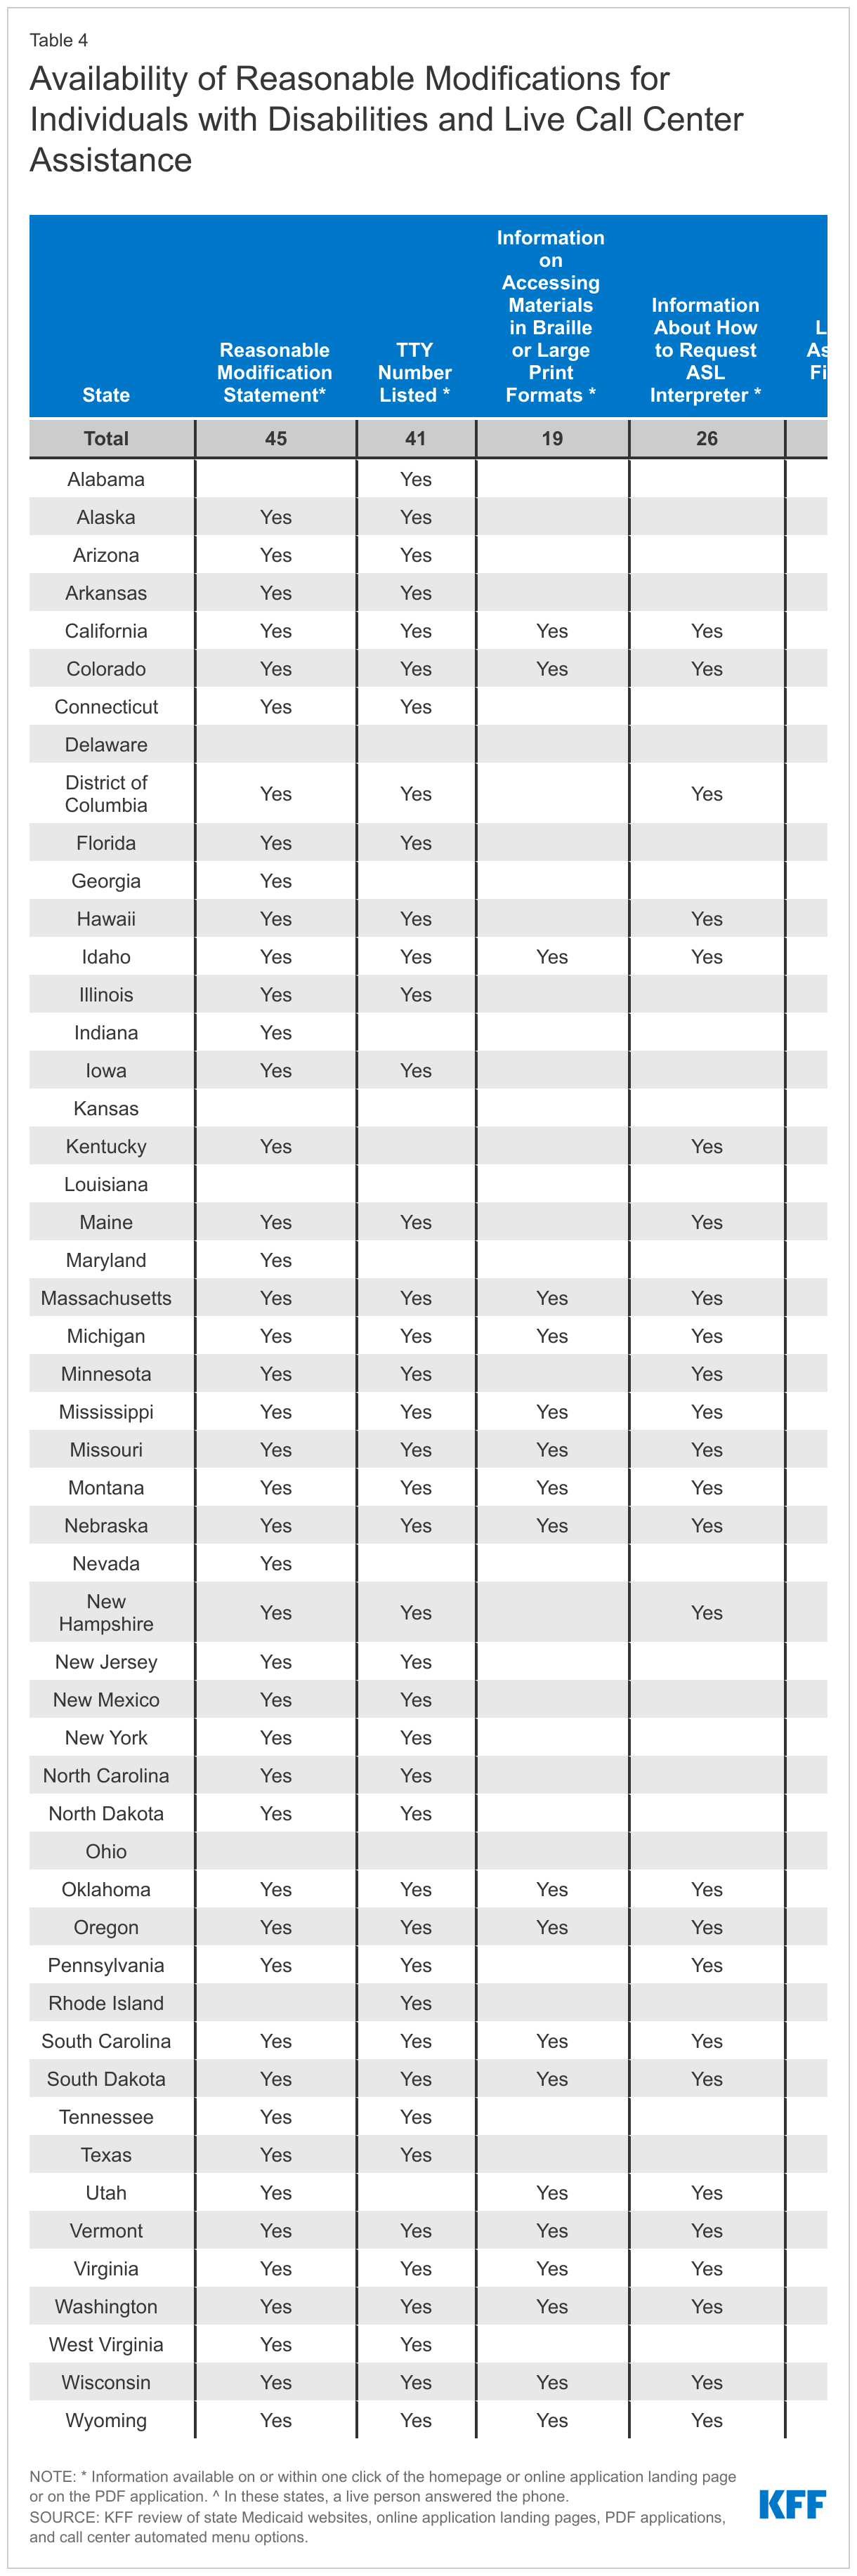
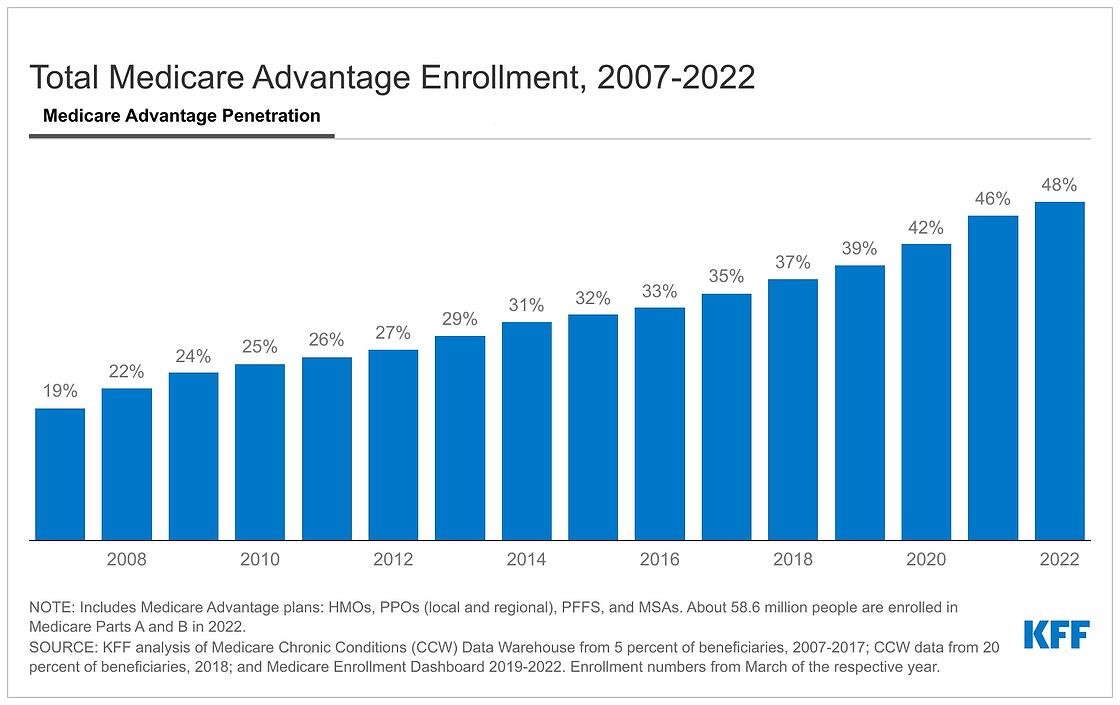
Over the last decade, Medicare Advantage enrollment has grown rapidly, rising from 25% of the eligible Medicare population in 2010 to nearly half of the Medicare population in 2022. The Medicare Advantage population has become increasingly diverse, with half of all Black Medicare beneficiaries and 56% of Hispanic beneficiaries enrolled in a Medicare Advantage plan, as of 2019, compared to just over a third of White beneficiaries (37%). Additionally, beneficiaries who are under age 65 with long-term disabilities and beneficiaries who are dually eligible for Medicare and Medicaid account for a growing share of the Medicare Advantage population.

Medicare Advantage plans have several features that may attract enrollees, including an out-of-pocket limit for Medicare-covered services and additional benefits not available under traditional Medicare, such as dental, hearing, and vision benefits. These benefits are often available at little or no extra premium (other than the Part B premium). However, Medicare Advantage plans typically have more limited provider networks. Additionally, there has been growing concern about higher spending on behalf of Medicare Advantage enrollees relative to traditional Medicare beneficiaries. A KFF analysis estimated that federal spending on behalf of Medicare Advantage enrollees was $321 higher per person in 2019 than it would have been if enrollees had instead been covered by traditional Medicare, contributing an estimated $7 billion in additional spending in that year.

The growing role of Medicare Advantage and the relatively high spending on this program raise the question of how well private plans serve their enrollees compared to traditional Medicare. To answer this question, we reviewed 62 studies published between January 1, 2016 and May 1, 2022 that compare Medicare Advantage and traditional Medicare, building on a previous KFF review of research by examining the most recent evidence available on measures of beneficiary experience, affordability, service utilization, and quality.

The studies we reviewed varied widely in terms of methodology, data, and observation years (Appendix Table 1, Appendix Table 2). Notably, relatively few studies looked specifically at beneficiaries from communities of color, beneficiaries living in rural areas, or beneficiaries dually eligible for Medicare and Medicaid. Additionally, despite an increased focus on alternative payment models in Medicare, only two of the studies looked separately at traditional Medicare beneficiaries attributed to accountable care organizations (ACOs). All differences reported in this report are statistically significant (with p-value less than or equal to 0.05) unless noted otherwise. Additionally, studies attempted to account for differences in beneficiary characteristics such as health status and demographics in some fashion, unless noted otherwise. See Appendix Table 2 for more detailed descriptions of these studies, including data sources, methodology, and whether the analysis attempts to account for differences in beneficiary characteristicsBack to top.

Medicare Advantage vs. Traditional Medicare: Literature Review

We identified 62 studies published between January 1, 2016 and May 1, 2022 that used at least one year of data after 2010 and compared Medicare Advantage and traditional Medicare on measures of beneficiary experience, affordability, utilization, or quality. We included studies published in peer-reviewed publications, studies conducted by research and policy organizations, and government reports. The vast majority of studies in our review (49 studies) used data sources that are nationally representative, while six studies used data for a subset of states, one study used administrative data from a single hospital, and six studies used claims or encounter data collected from a single health plan (e.g., Humana), a single health care delivery system (Banner Health), or from a set of hospitals (Appendix Table 2). Just two studies stratified findings for traditional Medicare by whether beneficiaries were attributed to an accountable care organization (ACO).

Ideally, this review would assess differences between Medicare Advantage and traditional Medicare using relatively recent data. However, just 12 of the 62 studies published since 2016 used data from the past five years, while the remaining 50 studies used data from between 2010 and 2017.

Beneficiary experience

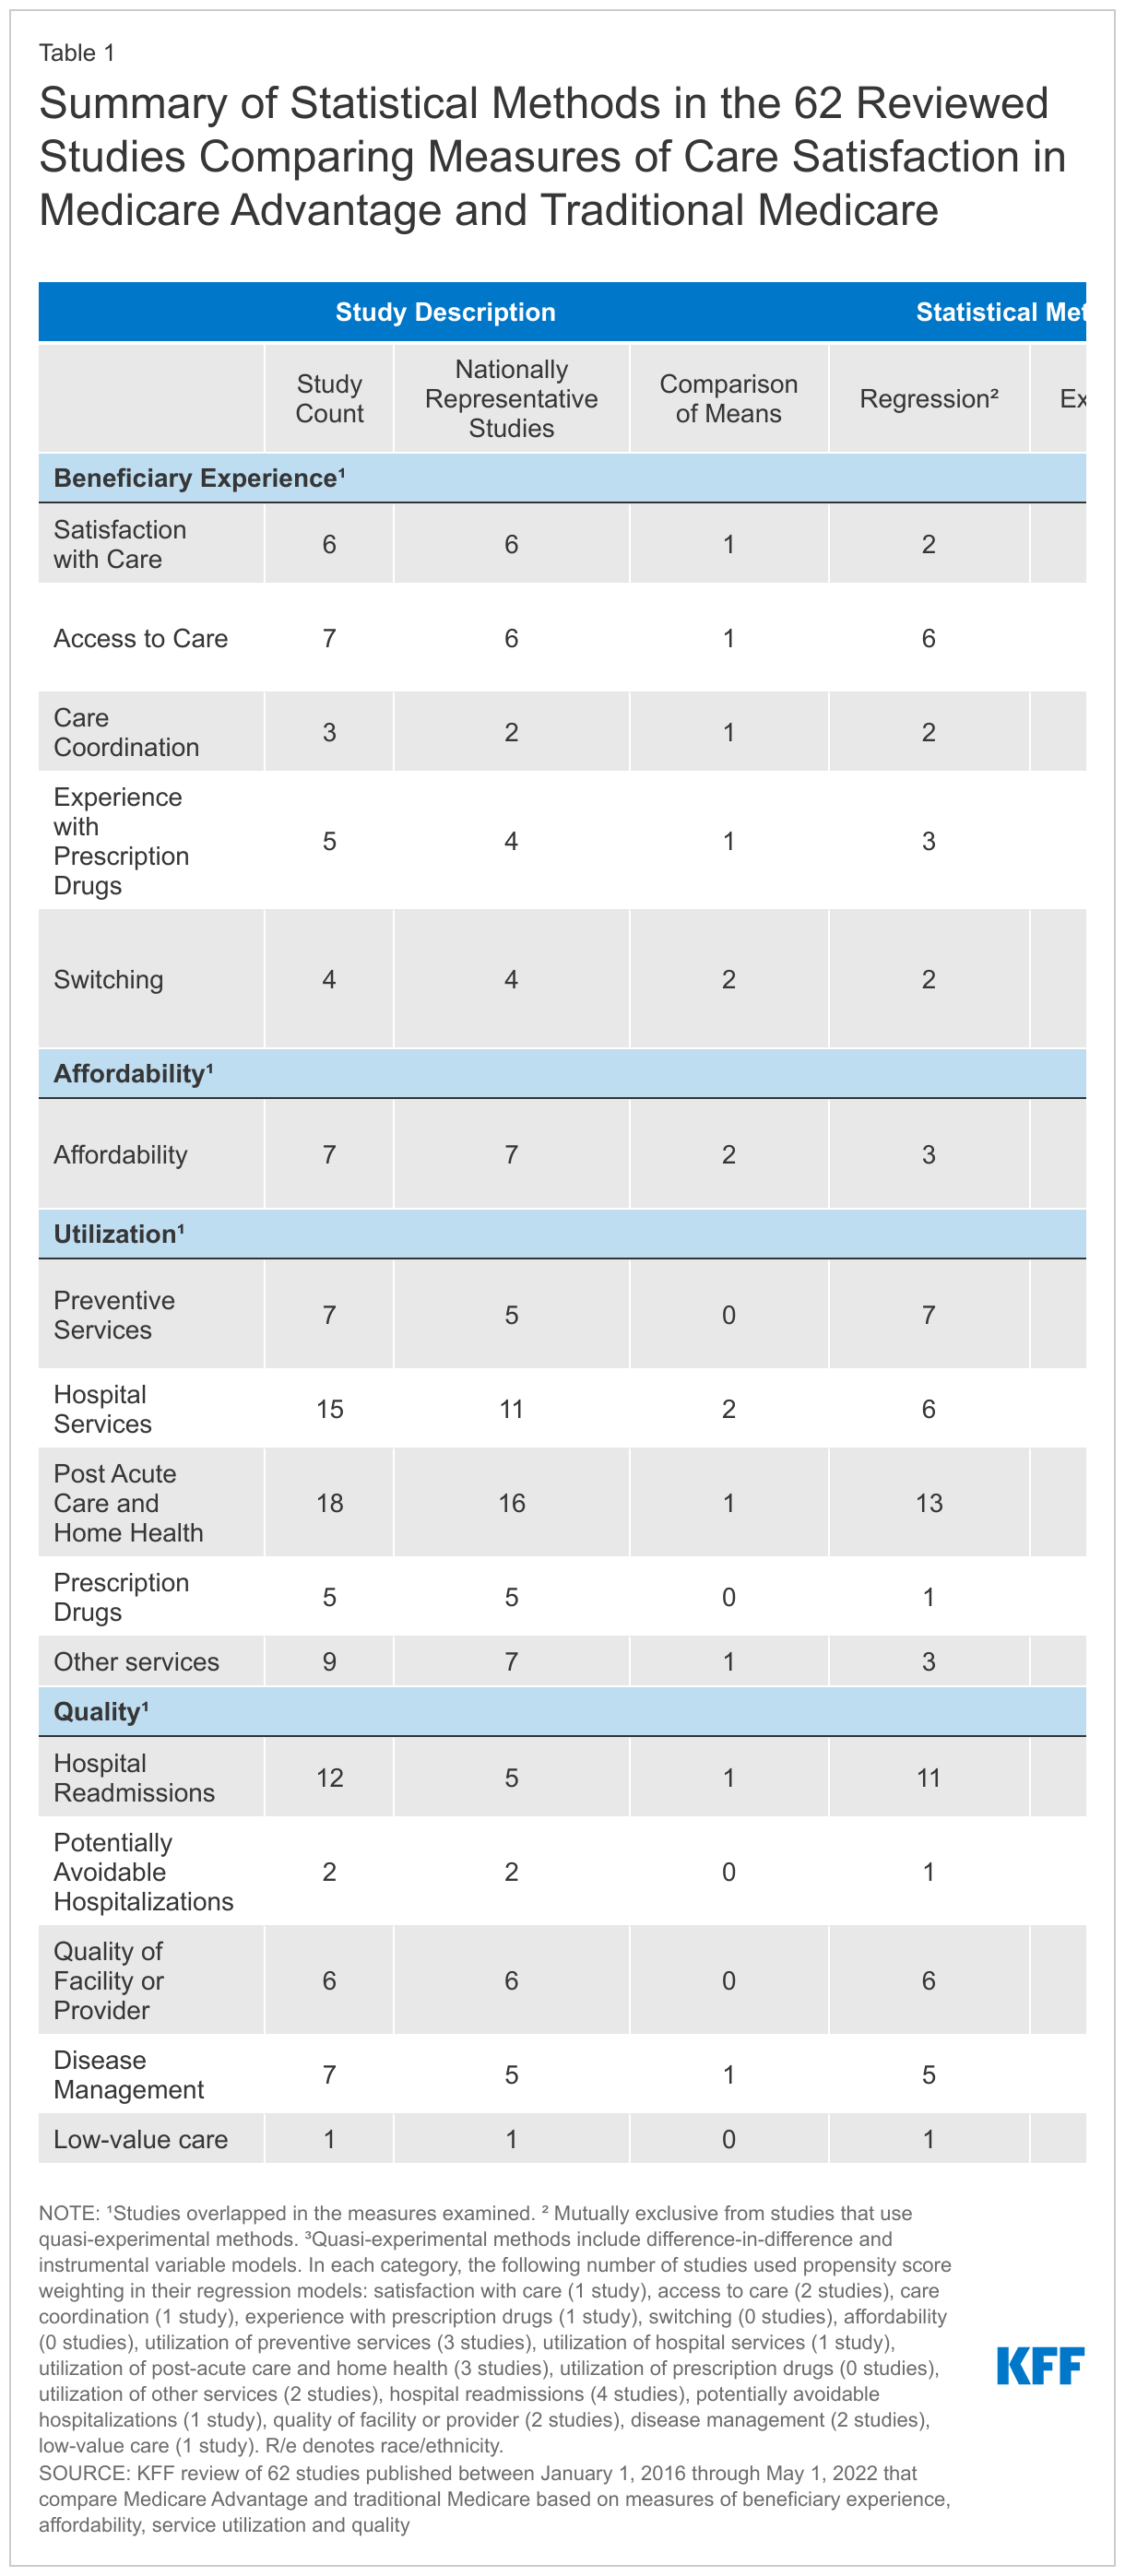
We reviewed 16 studies that examined aspects of beneficiaries’ experiences with Medicare Advantage and traditional Medicare, including satisfaction with care (6 studies), access to care (7 studies), care coordination (3 studies), experience with prescription drugs (5 studies), and switching between Medicare Advantage and traditional Medicare (which may be interpreted as an indicator of satisfaction) (4 studies) (Appendix Table 1, Appendix Table 2). Several of these studies overlapped in the measures examined.

Overall, Medicare Advantage enrollees and traditional Medicare beneficiaries reported similar levels of satisfaction with care. With respect to access measures, Medicare Advantage enrollees were more likely to report having a usual source of care, while both groups reported similar experiences with wait times and finding a new provider. Medicare Advantage enrollees and traditional Medicare beneficiaries were similarly satisfied with care coordination overall, but Medicare Advantage enrollees were more likely to report receiving information during care transitions and were somewhat more likely to report a better experience getting needed prescription drugs. Additionally, while switching between the two coverage types was relatively infrequent in either direction, it occurred more often among Medicare Advantage enrollees who opted to disenroll from Medicare Advantage and switch into traditional Medicare, particularly among higher-need beneficiaries.

Satisfaction with care

Five studies found no differences in measures of care satisfaction between Medicare Advantage and traditional Medicare beneficiaries. Overall, the vast majority of Medicare beneficiaries reported being satisfied with their care in both Medicare Advantage and traditional Medicare.1  One analysis using data from the Medicare Current Beneficiary Survey, found no differences in satisfaction between Medicare Advantage enrollees and traditional Medicare beneficiaries with five aspects of care, including doctor’s concern with overall health, information about medical condition, care by specialist, information obtained by phone, and quality of medical care.2  The analysis did not control for differences in beneficiary demographic, socioeconomic, or health characteristics (Appendix Table 2).

Three additional studies also used data from the Medicare Current Beneficiary Survey to compare satisfaction among beneficiaries with diabetes,3  Alzheimer’s disease,4  or mental illness (defined as a presence of any mental disorder or depression)5  and found no differences between Medicare Advantage and traditional Medicare in several care satisfaction measures, including satisfaction with quality of medical care and availability of care by specialists. However, the authors of the studies on diabetes and Alzheimer’s disease noted that sample sizes for these two groups may have been too small to detect differences.

A separate study that used data from the Health and Retirement Study found no differences between Medicare Advantage and traditional Medicare in the share that reported being very satisfied with the quality of their care.6  This study examined high-need beneficiaries, defined as those with at least three chronic conditions and at least one limitation in activities of daily living (ADLs) or instrumental ADLs, and non-high need beneficiaries.

We were unable to identify studies that compared satisfaction rates for Medicare Advantage and traditional Medicare beneficiaries among other subgroups of the Medicare population, such as by race/ethnicity, age group, Medicare-Medicaid dual eligibility, and rural status.

One study found that experience with care at the end-of-life was rated higher for traditional Medicare than Medicare Advantage. Friends and family reported lower quality end-of-life care for decedents in Medicare Advantage than decedents who had traditional Medicare, even after stratification by hospice enrollment.7  Though Medicare Advantage did not cover health care services for people in hospice at the time of the analysis, Medicare Advantage decedents who died in hospice were included because Medicare Advantage plans may play a major role in end-of-life care planning before hospice, guide enrollees to a specific hospice, or oversee other aspects of care.

Access to care

Medicare Advantage enrollees were more likely than traditional Medicare beneficiaries to report having a usual source care. The vast majority of Medicare beneficiaries in both Medicare Advantage and traditional Medicare reported having a usual source of care.8 , 9  The share of Medicare Advantage enrollees who reported having a usual source of care was higher by between 0.9 and 4.0 percentage points depending on the study, year, and data.10 , 11 , 12  Additionally, one study found that Medicare Advantage enrollees were more likely to report a primary care clinician as their regular source of care.13 

Studies that looked at the subset of Medicare beneficiaries who were age 65 and older14  and studies that looked at the subset of Medicare beneficiaries with long-term disabilities between age 18 and 64 also found that Medicare Advantage enrollees were more likely to report a usual source of care than traditional Medicare beneficiaries in both age groups.15 

However, in a study that looked separately at high-needs beneficiaries (those with three or more chronic conditions and a limitation in ADLs or instrumental ADLs) and non-high-needs beneficiaries, there were no differences between Medicare Advantage and traditional Medicare beneficiaries in the share reporting having a usual source of care.16 

Among people of color (grouped together), a slightly larger share of Medicare Advantage enrollees than traditional Medicare beneficiaries reported having a usual source of care (91% vs 88%) and a primary care clinician as the source of regular care (79% vs 73%).17  Due to data limitations, the authors of that one study combined Black, Hispanic, Native American, and Asian/Pacific Islander people into a single category.

Two studies examined the share of Medicare Advantage enrollees and traditional Medicare beneficiaries that reported difficulty getting needed health care, with inconsistent findings. In a nationally-representative study, there were no statistically significant differences between Medicare Advantage and traditional Medicare in the share of beneficiaries reporting difficulty getting needed health care.18  That study also found no differences between Medicare Advantage and traditional Medicare in the share of beneficiaries reporting that they had a treatment plan for their condition, or that they always or often received an answer about a medical concern the same day they contacted their usual source of care. However, the study did not control for differences in beneficiary case-mix (Appendix Table 2).

Another study examined a subset of beneficiaries in New York, Florida, and California and found that the share of Medicare Advantage enrollees reporting difficulty getting needed care was approximately two percentage points lower than the share of traditional Medicare beneficiaries.19 

There was mixed evidence on other measures of access between Medicare Advantage enrollees and traditional Medicare beneficiaries. Medicare Advantage enrollees were more likely to report having a health care professional they could easily contact in between doctor visits, but reported similar wait times as beneficiaries in traditional Medicare for outpatient and physician office visits.20  Additionally, there were no differences in the share of Medicare Advantage and traditional Medicare beneficiaries reporting trouble finding a general doctor, being told that their health insurance was not accepted, and being told they would not be accepted as a new patient.21  A separate study also found no differences between Medicare Advantage and traditional Medicare in the share of beneficiaries reporting difficulty finding a provider, for both the subset of beneficiaries with high-needs (those with three or more chronic conditions and a limitation in ADLs or instrumental ADLs) and without high-needs. 22 

A fourth study that looked at Medicare beneficiaries with cancer in their last year of life found that those in traditional Medicare were more likely than those in Medicare Advantage to report excellent experience getting care quickly and getting needed care.23 

Care coordination

Medicare Advantage enrollees and traditional Medicare beneficiaries reported similar experiences on measures of care coordination overall. Two studies compared measures of care coordination in Medicare Advantage and traditional Medicare and found no differences between beneficiaries in either group.24 , 25  Additionally, one of these studies found no differences in the share of beneficiaries reporting that their regular doctor always or often helps coordinate care with other providers.26 

A larger share of Medicare Advantage enrollees than traditional Medicare beneficiaries reported specific care management practices in one study. Compared to traditional Medicare beneficiaries, a larger share of Medicare Advantage enrollees reported that their health care professional had discussed with them their main goals or priorities in caring for their condition (76% versus 60%, respectively) or had given them given them clear instructions about symptoms to monitor in caring for their condition after returning home from the hospital (97% versus 90%, respectively).27  The study did not control for differences in beneficiary demographic, socioeconomic, or health characteristics (Appendix Table 2).

That same study also compared measures of care coordination among beneficiaries with three or more chronic conditions or limitations in activities of daily living (defined in the study as “high need”) and beneficiaries with diabetes.28  Among these subgroups, there were no statistically significant differences between beneficiaries in Medicare Advantage and traditional Medicare in the share reporting that their regular doctor always or often helps coordinate care with other providers. However, consistent with the overall findings, among these subgroups a larger share of Medicare Advantage enrollees than traditional Medicare beneficiaries reported that their health care professional had discussed with them their main goals or priorities in caring for their condition.

Another study found that among the subgroups of beneficiaries with high-needs (those with three or more chronic conditions and an ADL or an instrumental ADL) and without high-needs, there were no differences between beneficiaries in Medicare Advantage and traditional Medicare in the share reporting that their preferences were usually or always taken into account.29 

Experience with prescription drugs

Medicare Advantage enrollees reported better experiences getting needed prescription drugs than traditional Medicare beneficiaries overall, but among beneficiaries with specific conditions, findings were mixed. Five studies examined experiences with prescription drugs among beneficiaries in Medicare Advantage and traditional Medicare (Appendix Table 1, Appendix Table 2). In a study of Medicare beneficiaries in California, New York, and Florida, a larger share of Medicare Advantage enrollees than traditional Medicare beneficiaries reported that they were satisfied with their experience getting needed prescription drugs (91.4% in Medicare Advantage vs 87.3% in traditional Medicare).30  Another analysis found that compared to traditional Medicare beneficiaries in stand-alone prescription drug plans (PDPs), enrollees in Medicare Advantage prescription drug plans (MA-PDs) reported greater ease obtaining medications (90.1% vs. 87.9%, respectively), less difficulty getting coverage information (81.2% vs. 78.2%, respectively) and less difficulty getting cost information (80.4% vs. 78.9%, respectively).31 

A third study found that a larger share of Medicare Advantage enrollees (91%) than traditional Medicare beneficiaries (84%) reported having a health care professional review their medications in the past year.32  However, among beneficiaries with diabetes, mental health conditions, or cancer, this same study reported that differences between beneficiaries in Medicare Advantage and traditional Medicare were not statistically significant. While the analysis compared the experiences of beneficiaries with certain health conditions, it did not further control for differences in beneficiary characteristics (Appendix Table 2).

A study that examined beneficiaries with a mental illness found no differences between Medicare Advantage and traditional Medicare on satisfaction with list of prescriptions covered.33 

The fifth analysis found that among Medicare beneficiaries with cancer in their last year of life, those in traditional Medicare were more likely than those in Medicare Advantage to report excellent experience getting needed prescription drugs.34 

Switching between Medicare Advantage and Traditional Medicare

Medicare beneficiaries can make a change in their coverage by switching from traditional Medicare to a Medicare Advantage plan (or vice versa) during the Medicare Open Enrollment period each year. Other beneficiaries, such as those dually eligible for Medicare and Medicaid and beneficiaries in certain institutions, such as nursing homes, may switch coverage more frequently. Researchers use rates of disenrollment or switching as a proxy measure for satisfaction with Medicare coverage.

We identified four studies that examined switching in both directions (Medicare Advantage to traditional Medicare and traditional Medicare to Medicare Advantage) using at least one year of data since 2010. Of these four studies, two did not control for differences in beneficiary case-mix or health risk, including one study that presented descriptive statistics without statistical testing (Appendix Table 1, Appendix Table 2). These four studies found that overall, there were low rates of switching between Medicare Advantage and traditional Medicare; however, there were higher rates of switching from Medicare Advantage to traditional Medicare among beneficiaries who are dually eligible for Medicare and Medicaid, beneficiaries of color, beneficiaries in rural areas, and following the onset of a functional impairment. Authors of these studies discussed several factors that could explain differences in switching among certain beneficiaries, including networks in some plans that beneficiaries with complex care needs may deem restrictive; however, studies did not determine the specific reasons beneficiaries switched their source of Medicare coverage.

Beneficiaries who are dually eligible for Medicare and Medicaid, particularly those with high health needs, and beneficiaries of color had relatively high levels of switching between traditional Medicare and Medicare Advantage. One study examining beneficiaries dually eligible for Medicare and Medicaid found that these beneficiaries switched between Medicare Advantage and traditional Medicare at a higher rate than non-dual-eligible beneficiaries, regardless of the direction of switching.35  These findings may in part be attributable to the fact that dually eligible beneficiaries are able to switch plans once per calendar quarter in the first three quarters of the year, in addition to the open enrollment period. In addition, high-need dual-eligible beneficiaries were more likely to disenroll from Medicare Advantage to traditional Medicare than dual-eligible beneficiaries who were not classified as high need. In comparison, a smaller share of high-need dual-eligible beneficiaries who were enrolled in traditional Medicare switched to Medicare Advantage than non-high need dual eligible beneficiaries.

Another study looked at beneficiaries’ enrollment decisions after the onset of a functional impairment and found that beneficiaries of color were more likely to switch sources of Medicare coverage than White beneficiaries regardless of whether they started with Medicare Advantage or traditional Medicare.36  Specifically, beneficiaries of color accounted for 24% of the Medicare Advantage population in the study’s sample but 47% of Medicare Advantage enrollees who switched from Medicare Advantage to traditional Medicare. In comparison, beneficiaries of color accounted for 15% of the study’s traditional Medicare population and 21% of traditional Medicare beneficiaries who switched from traditional Medicare to Medicare Advantage. Authors of the study were unable to report switching patterns for individual racial and ethnic groups separately due to sample size and data reporting restrictions. Additionally, due to sample size limitations, the analysis was precluded from using multivariable regression models to examine factors that were independently associated with switching (Appendix Table 2). It is possible that higher rates of switching among beneficiaries of color may reflect the fact that a relatively large share of Black and Hispanic beneficiaries are dually eligible for Medicare and Medicaid, and therefore able to switch more frequently during the year.

A study of beneficiaries living in rural areas found that a larger share of rural beneficiaries switched from Medicare Advantage to traditional Medicare than switched from traditional Medicare to Medicare Advantage. One study found that among beneficiaries in rural areas, the rate of switching from Medicare Advantage to traditional Medicare (10.7%) was higher than the rate of switching from traditional Medicare to Medicare Advantage (1.7%).37  Among beneficiaries in non-rural areas, the difference in switching rates between beneficiaries in Medicare Advantage and traditional Medicare was narrower, but the rates were still higher among those switching from Medicare Advantage to traditional Medicare (4.6%) than those switching from traditional Medicare to Medicare Advantage (2.2%).

Few studies have examined patterns of switching among beneficiaries with complex health needs, with one study finding that after the onset of functional impairments, a larger share of beneficiaries in Medicare Advantage switched to traditional Medicare compared to the share of beneficiaries in traditional Medicare that switched to Medicare Advantage. One of the four studies described above found that following the onset of a functional impairment, beneficiaries ages 65 and older were more likely to switch from Medicare Advantage to traditional Medicare than from traditional Medicare to Medicare Advantage.38  Specifically, following the onset of a functional impairment, the rate of switching from Medicare Advantage to traditional Medicare was 65.6 switches per 1,000 person-years, while the rate of switching from traditional Medicare to Medicare Advantage was 44.4 switches per 1,000 person-years. Due to sample size limitations, the analysis was precluded from using multivariable regression models to examine factors that were independently associated with switching (Appendix Table 2).

The fourth study presented descriptive statistics on switching by people with newly-diagnosed diseases or conditions but did not test whether observed differences were statistically significant.39  The authors found that overall, the rate of switching for this group from traditional Medicare to Medicare Advantage (4.1%) was higher than the rate of switching from Medicare Advantage to traditional Medicare (2.2%). This pattern held for most newly-diagnosed diseases and conditions in the analysis, such as Alzheimer’s disease and related dementias, hypertension, and cancer. However, among beneficiaries newly diagnosed with stroke, the rate of switching from traditional Medicare to Medicare Advantage (2.2%) was slightly lower than the rate of switching from Medicare Advantage to traditional Medicare (2.6%).

Affordability

We identified seven studies that compared affordability-related difficulties among beneficiaries in Medicare Advantage and traditional Medicare (Appendix Table 1, Appendix Table 2). These studies generally found that a somewhat larger share of Medicare Advantage enrollees than traditional Medicare beneficiaries experienced a cost-related problem, mainly due to lower rates of cost-related problems among traditional Medicare beneficiaries with supplemental coverage. These studies found that traditional Medicare beneficiaries without supplemental coverage had the most affordability-related difficulties.

Medicare Advantage enrollees who are Black, under age 65 with disabilities, or in fair or poor health were more likely to report cost-related problems than their traditional Medicare counterparts.  Few differences were found among beneficiaries with high-needs, a mental illness, or diabetes.

Traditional Medicare beneficiaries reported fewer cost-related problems than enrollees in Medicare Advantage, mainly driven by traditional Medicare beneficiaries with supplemental insurance. Two studies compared reports of cost-related problems between Medicare Advantage enrollees, traditional Medicare beneficiaries with supplemental insurance, and traditional Medicare beneficiaries without supplemental insurance. The first study examined the share of each group that reported trouble getting care due to cost, a delay in care due to cost, or problems paying medical bills, and found that the share reporting at least one cost-related problem was somewhat lower among beneficiaries in traditional Medicare overall (15%) and traditional Medicare with supplemental coverage (12%) than among Medicare Advantage enrollees (19%).40  The rate of cost-related problems was highest among traditional Medicare beneficiaries without supplemental coverage (30%). These findings held after controlling for income, race and ethnicity, Medicaid dual status, and health status.

Similarly, another analysis found that among adults ages 65 and older, the share reporting problems paying medical bills was higher among Medicare Advantage enrollees (8.3%) than among those in traditional Medicare with private supplemental coverage (5.6%).41  Again, a smaller share of both groups reported problems than among traditional Medicare beneficiaries with no supplemental coverage (12.4%). The analysis did not control for differences in beneficiary characteristics such as income. Two additional studies looked at ability to get needed health care or delays in care due to cost among Medicare Advantage and traditional Medicare beneficiaries, without breaking out traditional Medicare beneficiaries with and without supplemental coverage. One of these analyses found that in 2009, Medicare Advantage enrollees were slightly more likely than beneficiaries in traditional Medicare to report delaying care for cost reasons; however, in 2017, differences between Medicare Advantage and traditional Medicare were not significant.42  The other study did not find statistically significant differences in the share of Medicare Advantage enrollees and traditional Medicare beneficiaries reporting trouble getting health care because of high cost, though the analysis did not control for differences in beneficiary characteristics (Appendix Table 2).43 

One study found that traditional Medicare beneficiaries report fewer cost-related problems than enrollees in Medicare Advantage when focusing on beneficiaries who are Black, under age 65 with disabilities, or in relatively poor health. One of the seven studies described above stratified results by race and ethnicity, age, and self-reported health status.44  The study found that among Black beneficiaries, beneficiaries under the age of 65, and beneficiaries in fair or poor self-assessed health, a smaller share of beneficiaries in traditional Medicare reported cost-related problems compared to enrollees in Medicare Advantage plans after adjusting for various beneficiary characteristics.

Three studies examining beneficiaries with high-needs or specific conditions found some differences in affordability-related measures between Medicare Advantage and traditional Medicare. The first study looked at beneficiaries with high needs (i.e., those with three or more chronic conditions and a limitation in ADLs or instrumental ADLs) and non-high needs beneficiaries, finding no statistically significant differences between Medicare Advantage and traditional Medicare in the share of beneficiaries unable to afford care. 45 

The second study examined measures of affordability among beneficiaries with a mental illness. This study found no differences between Medicare Advantage and traditional Medicare in care dissatisfaction with out-of-pocket costs for prescription drugs, delay in getting prescription drugs due to cost, and inability to get prescription drugs due to cost.46  However, enrollment in Medicare Advantage increased dissatisfaction with out-of-pocket expenses for medical care by 25.5 percentage points. That study further identified beneficiaries with depression specifically, finding that differences in dissatisfaction with out-of-pocket expenses for medical care among beneficiaries with mental illness were largely driven by beneficiaries with depression.

The third study examined beneficiaries with and without diabetes and found no differences between Medicare Advantage and traditional Medicare in the share of beneficiaries with diabetes who were satisfied with out-of-pocket costs for medical care.47  However, Medicare Advantage enrollees without diabetes were slightly less likely to report satisfaction with out-of-pocket costs for medical care than traditional Medicare beneficiaries without diabetes.

Utilization

We reviewed 34 studies that compared the use of health care services between Medicare Advantage enrollees and traditional Medicare beneficiaries, including preventive services (7 studies), hospital care (15 studies), post-acute care and home health (18 studies), prescription drugs (5 studies), and other services (8 studies) (Appendix Table 1, Appendix Table 2).  Several of these studies overlapped in the measures examined. The analyses consistently found that Medicare Advantage enrollees had higher utilization of preventive services and lower utilization of post-acute care and home health services. Findings related to the use of hospital care, prescription drugs, and other services were mixed, with the variation likely due in part to differences in how outcome measures were defined, methodology and data. Just two studies analyzed utilization of health care services among demographic subgroups of the Medicare population, finding that among beneficiaries of color and beneficiaries under the age of 65, utilization of preventive services was greater for Medicare Advantage enrollees, consistent with the overall pattern of preventive services utilization.

Utilization of preventive services

Seven studies compared receipt of preventive care services among beneficiaries in Medicare Advantage and traditional Medicare (Appendix Table 1, Appendix Table 2). These studies examined vaccination rates for flu, pneumonia, and shingles and the receipt of several preventive screenings, finding that Medicare Advantage enrollees were more likely than traditional Medicare beneficiaries to receive these preventive services, overall and among beneficiaries of color and beneficiaries under age 65.

Larger shares of Medicare Advantage enrollees reported having an annual wellness visit or routine checkup than beneficiaries in traditional Medicare. Two studies compared rates of annual wellness visits or routine checkups between Medicare Advantage and traditional Medicare. Both found a larger share of Medicare Advantage enrollees reported a routine checkup48  or annual wellness visit, with Medicare Advantage enrollees also more likely to report that the annual wellness visit included a cognitive assessment.49  The authors of the study that found higher rates of cognitive assessments in annual wellness visits among Medicare Advantage enrollees acknowledged that drawing on data from an online panel may not capture people with severe cognitive impairments.50 

Medicare Advantage enrollees had higher rates of vaccinations than traditional Medicare beneficiaries. Three studies examined overall flu vaccination rates and found a larger share of Medicare Advantage enrollees than traditional Medicare beneficiaries received their annual flu vaccine.51 , 52 , 53  The difference in the shares of Medicare Advantage enrollees and traditional Medicare beneficiaries receiving the flu vaccine ranged from 2.2% to 3.5%.54 , 55  One of these studies also compared receipt of pneumonia vaccines and found higher rates in Medicare Advantage than traditional Medicare, with a difference of 2.0% between the two coverage types.56 

An analysis that focused more narrowly on patients with heart failure found no statistically significant differences in receipt of flu or pneumococcal vaccinations between beneficiaries in Medicare Advantage and traditional Medicare.57 

In a separate analysis looking at shingles vaccinations, a larger share of Medicare Advantage enrollees in prescription drug plans (MA-PDs) did not fill prescribed shingles vaccines (8.9%) compared to traditional Medicare beneficiaries in stand-alone prescription drug plans (PDPs) (6.4%).58  The analysis was limited to beneficiaries ages 65 and older and did not specify how it accounted for any differences in receiving the shingles vaccine before enrolling in Medicare.

Despite the disproportionate impact of COVID-19 pandemic on Medicare beneficiaries, we were unable to identify studies meeting our inclusion criteria that examined COVID-19 vaccination rates by Medicare coverage group as of May 1, 2022.

Medicare Advantage enrollees reported higher rates of several preventive screening services. A larger share of Medicare Advantage enrollees than traditional Medicare beneficiaries reported colorectal and breast cancer screenings and blood pressure screening.59 , 60 , 61  For instance, the difference between Medicare Advantage and traditional Medicare in the share receiving colorectal cancer screening was 4.4 percentage points in one of these studies.62  One study also found higher rates of cholesterol management among Medicare Advantage (95%) enrollees compared to traditional Medicare beneficiaries (87%),63  while another found no differences in this measure.64 

Utilization of preventive service by race and ethnicity mirrored overall differences between Medicare Advantage and traditional Medicare. Patterns of flu and pneumonia vaccination were similar in a study that examined White beneficiaries; Black, Hispanic, Native American, and Asian and Pacific Islander beneficiaries (examined as a single group); and Black beneficiaries (examined separately). In this study, a higher share of beneficiaries of color in Medicare Advantage (67.3%) than in traditional Medicare (63.0%) reported receiving the flu vaccine.65  Similarly, a larger share of beneficiaries of color in Medicare Advantage (70.7%) than in traditional Medicare (64.6%) reported receiving a pneumonia vaccine. The study also presented results for Black beneficiaries separately from other groups, finding a similar pattern. However, the authors acknowledged that due to sample size limitations, they were unable to present disaggregated data for Hispanic, Native American, or Asian/Pacific Islander beneficiaries.

Among beneficiaries under the age of 65, utilization of preventive services was greater for Medicare Advantage enrollees, based on evidence from one study. Only one study examined the use of preventive services for people under 65 with long-term disabilities. Consistent with the overall patterns of preventive services utilization, the study found that among beneficiaries under the age of 65, Medicare Advantage enrollees were more likely to report receiving cholesterol and colon cancer screenings and flu vaccinations.66  We were unable to identify studies that analyzed preventive services utilization among beneficiaries dually eligible for Medicaid or beneficiaries in rural areas.

Hospital utilization

Fifteen studies compared measures of hospital utilization between Medicare Advantage enrollees and beneficiaries in traditional Medicare (Appendix Table 1, Appendix Table 2), including the share of beneficiaries with at least one hospital stay (4 studies), the number of hospitals stays (4 studies), the average length of stay (3 studies), the total number of hospital days (2 studies), and hospitalizations near the end of life (3 studies) (some studies included multiple measures). Findings were mixed and varied based on the particular measure of utilization.

Studies examining the share of beneficiaries with at least one hospital stay had mixed findings, with two studies finding no difference between Medicare Advantage and traditional Medicare and two studies finding lower rates in Medicare Advantage. Two studies found no difference in the share of Medicare Advantage enrollees and traditional Medicare beneficiaries with at least one hospital stay.67 , 68  One of these studies did not control for differences in beneficiary demographic, socioeconomic, or health characteristics (Appendix Table 2).69  A separate study found that among high-needs beneficiaries (those with three or more chronic conditions and a limitation in ADLs or instrumental ADLs) and non-high-needs beneficiaries, a smaller share of Medicare Advantage enrollees reported at least one hospital stay than traditional Medicare beneficiaries.70  Another study examined a single health delivery system, Banner Health, which partnered with Blue Cross Blue Shield of Arizona to provide a Medicare Advantage plan and also operated an Accountable Care Organization (ACO) in one county in Arizona. This study found that the Medicare Advantage enrollees had lower hospitalization rates compared to traditional Medicare beneficiaries, both those who were attributed to the Banner ACO and the non- Banner, non-ACO beneficiaries.71 

The number of hospital stays was lower in Medicare Advantage plans than in traditional Medicare for some groups of beneficiaries. Four studies found fewer hospital stays among Medicare Advantage enrollees compared to traditional Medicare beneficiaries for at least some groups of beneficiaries. One study examined differences in inpatient hospital admissions for Medicare beneficiaries with and without Alzheimer’s disease and related dementias (ADRD), finding slightly fewer hospitalizations among Medicare Advantage enrollees in both groups compared to traditional Medicare beneficiaries.72  Specifically, among beneficiaries with ADRD, those in Medicare Advantage had 0.3 inpatient hospital admissions a year compared to 0.47 for those in traditional Medicare. The study used an instrumental variable design in an effort to address concerns about adverse selection into Medicare Advantage by healthier beneficiaries and controlled for other observable beneficiary characteristics (Appendix Table 2).

A second study examined changes in hospital use following transition from commercial insurance (prior to Medicare enrollment) to Medicare Advantage or traditional Medicare with supplemental insurance (through Aetna) and found that enrollment in Medicare Advantage was associated with a larger reduction in the number of inpatient stays.73  This suggests that the use of hospital services is lower in Medicare Advantage than in traditional Medicare. The study only followed beneficiaries for a single year after enrollment in Medicare and used data from a single insurer, Aetna, so findings may not be generalizable to the broader Medicare population, though the strong quasi-experimental design of the analysis is useful in isolating the effects of payer type for the group studied.

A third study looked at hospital admissions for beneficiaries with and without diabetes. The study found that among people with diabetes, Medicare Advantage enrollees had 0.1 fewer inpatient hospital stays per year on average than traditional Medicare beneficiaries.74  In the same study there were no differences between Medicare Advantage and traditional Medicare beneficiaries in number of inpatient hospital stays for people without diabetes.

The fourth study found that among both high-needs beneficiaries (those with three or more chronic conditions and a limitation in ADLs or instrumental ADLs) and non-high-needs beneficiaries, Medicare Advantage enrollees had fewer hospital stays than traditional Medicare beneficiaries, and the difference between Medicare Advantage and traditional Medicare beneficiaries was larger among high-needs beneficiaries than non-high needs beneficiaries (2.1 fewer inpatient stays versus 0.6 stays, respectively).75 

An additional study examined inpatient hospital admissions among beneficiaries with a mental illness, finding no differences in number of inpatient hospital admissions between Medicare Advantage and traditional Medicare. 76 

Differences in the length of inpatient hospital stays between Medicare Advantage enrollees and traditional Medicare beneficiaries varied by type of admission. One study, based on a subset of beneficiaries in 28 states, found comparable lengths of stay for medical admissions, the most frequent type of admission. Medicare Advantage enrollees had shorter lengths of stay for mental health and longer lengths of stay for injury and surgical admissions.77  At the time of the analysis, the 28 states included in the sample accounted for 75 percent of all Medicare Advantage enrollees.

A second analysis, based on a subset of 18 states, presented descriptive statistics for the 20 most common types of admissions. With the exception of admissions for respiratory failure, where the average length of stay was shorter among Medicare Advantage enrollees (7.2 days) than traditional Medicare beneficiaries (8.2 days), the average lengths of stay for the remaining 19 admissions were similar between Medicare Advantage enrollees and traditional Medicare beneficiaries (a difference of less than 0.3 days on average), though statistical tests were not included in the report.78 

A third study examined patients who underwent total hip and knee arthroplasty using claims data from a single insurer. The analysis found no difference in the length of stay for Medicare Advantage enrollees and traditional Medicare beneficiaries but did not include adjustments for differences in beneficiary characteristics.79 

The number of total hospital days did not differ between Medicare Advantage and traditional Medicare. Two studies included the number of hospital days per 1,000 beneficiaries, a measure that combines the number of admissions and length of stay. Neither study found a difference between Medicare Advantage and traditional Medicare after adjusting for beneficiary characteristics.80 , 81 

Hospitalizations at the end-of-life were somewhat more common in traditional Medicare than in Medicare Advantage. One study calculated descriptive statistics for the site of death for Medicare beneficiaries and found that a smaller share of Medicare Advantage decedents were hospitalized during the last 30 and 90 days of their lives compared to decedents who were in traditional Medicare.82  Another study looked specifically at people with dementia and found that a smaller share of decedents who had Medicare Advantage were hospitalized in the last 30 days of life compared to traditional Medicare beneficiaries, including those attributed to an Accountable Care Organization (ACO).83   A third study found no differences between Medicare Advantage and traditional Medicare in hospital admissions in the last 30 days of life. 84 

We were unable to identify studies that examined any measures of hospital utilization between Medicare Advantage and traditional Medicare that stratified by different demographic subgroups, such as by age group, dual eligibility, and race/ethnicity.

Post-acute And Home Health care utilization

Eighteen studies examined utilization of home health care and post-acute care services in skilled nursing facilities (SNFs), long-stay nursing homes, and inpatient rehabilitation facilities (IRFs) (Appendix Table 1, Appendix Table 2). Ten of these studies evaluated utilization of post-acute care services in SNFs and other nursing homes, or IRFs, with most finding fewer days of care or shorter length of stays among Medicare Advantage enrollees compared to traditional Medicare beneficiaries. Eleven studies included an examination of the use of home health care, with a majority finding somewhat lower use among Medicare Advantage enrollees than traditional Medicare beneficiaries. Several studies overlapped in the type of post-acute care setting examined.

Medicare Advantage enrollees used fewer skilled nursing facility and inpatient rehabilitation services than traditional Medicare beneficiaries. Ten studies examined post-acute care received in institutional settings (e.g., nursing homes, SNFs, and IRFs) and seven of these studies found lower utilization among Medicare Advantage enrollees compared to traditional Medicare beneficiaries. These studies mostly examined discharges following hospitalizations for specific sets of conditions and looked at the likelihood of being admitted to a SNF or IRF, as well the average length of stay.

Four studies compared SNF use overall. The first found that Medicare Advantage enrollees had substantially fewer days of SNF care (2,337 days per 1,000 beneficiary-years) than beneficiaries in traditional Medicare (2,902 days per 1,000 beneficiary-years)—a difference of 565 days per 1,000 beneficiary-years, with greater geographic variation in the number of SNF days among enrollees in Medicare Advantage than in traditional Medicare.85  The analysis controlled for demographic characteristics, as well as the number of limitations in activities of daily living and differences in cognitive function, but according to the authors, data limitations precluded a more robust adjustment for beneficiary health status (Appendix Table 1).

However, two studies that stratified beneficiaries by health needs found no differences in the use of SNFs between Medicare Advantage enrollees and traditional Medicare beneficiaries, for both the subsets of beneficiaries with or without Alzheimer’s disease and related dementias (ADRD)86  or the subsets of beneficiaries with or without high needs (i.e., three or more chronic conditions and limitations in activities of daily living (ADLs) or instrumental ADLs).87 

A fourth study compared SNF use by enrollees in a Medicare Advantage plan operated by Banner Health and Blue Cross Blue Shield, traditional Medicare beneficiaries attributed to an ACO operated by Banner Health since 2012, and traditional Medicare beneficiaries in the same county (Maricopa, Arizona) not attributed to the ACO. The study found that in 2012 and 2013, Medicare Advantage enrollees had fewer days of care in a SNF than traditional Medicare beneficiaries, including both Banner ACO beneficiaries and non-ACO beneficiaries; however, in 2014, differences between Medicare Advantage and traditional Medicare beneficiaries who were not attributed to the Banner ACO were not statistically significant.88  The study also examined SNF use in the two years preceding ACOs (2010-2011) by comparing Medicare Advantage enrollees, the cohort of traditional Medicare beneficiaries who were eventually assigned to an ACO in 2012, and the cohort of traditional Medicare beneficiaries who were not attributed to an ACO in 2012. The authors found fewer days of care among Medicare Advantage enrollees than the traditional Medicare groups.

We identified three studies that examined the use of post-acute care following hospitalizations for high-volume conditions, including joint replacement, stroke, and heart failure, and these studies found that Medicare Advantage enrollees were less likely than traditional Medicare beneficiaries to be discharged to a SNF or IRF.89 , 90 , 91  Once admitted to an IRF, Medicare Advantage enrollees received fewer days of care in these facilities.92  Shorter lengths of stays in SNFs and fewer minutes of rehabilitation care were also found following hospitalization for hip fracture for Medicare Advantage enrollees compared to beneficiaries in traditional Medicare.93 

One analysis of patients undergoing total hip and knee arthroplasty at a single institution found no difference in the likelihood of being discharged to a SNF following the procedure between Medicare Advantage enrollees and traditional Medicare beneficiaries.94 

Studies examining outcome measures for users of skilled nursing facilities found lower hospital readmission rates among Medicare advantage enrollees, but inconsistent findings on other outcome measures. Four studies, including one that followed a subset of beneficiaries hospitalized for joint replacement, stroke, and heart failure, examined outcome measures among users of skilled nursing facilities. These studies found that Medicare Advantage enrollees had lower hospital readmission rates and higher rates of return to the community and did not observe poorer outcomes (e.g., changes in functional status) relative to beneficiaries in traditional Medicare.95 , 96 , 97  However, one of the four studies found that among short-stay (i.e., SNF) residents, Medicare Advantage enrollees had lower rates of new or worsening pressure ulcers but higher rates of moderate to severe pain than traditional Medicare beneficiaries.98  In addition, that same study found that among long-stay residents (i.e., people with nursing home stays that extended beyond 100 days), Medicare Advantage enrollees had higher rates of urinary incontinence than traditional Medicare beneficiaries.

Most studies found utilization of home health was lower among Medicare Advantage enrollees than traditional Medicare beneficiaries. Eleven studies examined utilization of home health care in Medicare Advantage and traditional Medicare. Eight of these studies found that Medicare Advantage enrollees had lower utilization of home health care services and three studies found no differences between beneficiaries in Medicare Advantage and traditional Medicare, either overall,99  or among subsets of beneficiaries with and without diabetes100  or Alzheimer’s disease and related dementias (ADRD).101 

Six of the eight studies that found lower utilization of home health services among Medicare Advantage enrollees included an examination of the share of patients starting home health following discharge from the hospital.102 , 103 , 104 , 105 , 106 , 107  These studies found that Medicare Advantage enrollees were less likely to have a home health visit, and the findings were consistent across studies with various methodological approaches and strategies for addressing differences in beneficiary health status (see Appendix Table 1 and Appendix Table 2 for more detail). The share of enrollees receiving home health services ranged from 2.4% to 6.0% lower in Medicare Advantage compared to traditional Medicare. Additionally, while use of home health was consistently lower in Medicare Advantage, one study that examined trends found that the rates of home health use appeared to be converging over time.108 

The seventh study compared high-needs beneficiaries (those with three or more chronic conditions and a limitation in ADLs or instrumental ADLs) and non-high-needs beneficiaries found that Medicare Advantage enrollees were less likely than traditional Medicare beneficiaries to use home health care among both high-needs and non-high needs beneficiaries; however, the magnitude of the differences between Medicare Advantage and traditional Medicare beneficiaries was larger among high-needs beneficiaries (5.5 percentage point difference) than non-high needs beneficiaries (1.5 percentage point difference).109 

The eighth study looked specifically at home health use among patients with cancer, finding that Medicare Advantage enrollees had lower rates of home health use and shorter lengths of home health care than traditional Medicare beneficiaries.110  While the study presented unadjusted differences that did not account for differences in beneficiary characteristics (Appendix Table 2), the results were consistent with overall findings from other studies that examined utilization of home health services.

Four of these eight studies also examined the duration of home health services and consistently found that Medicare Advantage enrollees had fewer days of home health use than traditional Medicare beneficiaries.111 , 112 , 113 , 114  Traditional Medicare beneficiaries had between 7.1 and 19.3 more days of home health days than Medicare Advantage enrollees, depending on the study.

Studies examining outcome measures for users of home health services found lower hospitalization rates among Medicare Advantage enrollees, but inconsistent findings on other outcome measures. Three studies examined whether home health users had different rates of hospitalization in Medicare Advantage and traditional Medicare, finding lower rates of hospitalization among Medicare Advantage enrollees. Two of these studies, however, have notable limitations that may have confounded the findings. The first study controlled for measures like functional status, but not health status because this information was not available in the data for Medicare Advantage enrollees (Appendix Table 2).115  The second study did not account for the duration of home health and because traditional Medicare beneficiaries had longer home health episodes, they had more opportunities to be admitted to the hospital while receiving home health services.116  Additionally, the third used Medicare Advantage data from a single insurer which covered about 20% of the Medicare Advantage population at the time of the study, potentially limiting generalizability to the broader Medicare Advantage population.117 

In addition, one of the studies looked at additional outcome measures among home health users. This study found that Medicare Advantage enrollees fared better with respect to dyspnea (trouble breathing), while traditional Medicare beneficiaries fared better with respect to improvements in pain.118 

None of the studies that examined use of post-acute care among Medicare Advantage and traditional Medicare beneficiaries included findings by race and ethnicity or other demographic subgroups (Appendix Table 1). Of the 18 studies in our review that examined receipt of post-acute care services in institutionalized (SNF, nursing home, and IRF) settings and home health, we were unable to identify any studies that stratified utilization estimates by both coverage type and demographic subgroups such as race and ethnicity, age group, Medicare-Medicaid dual eligibility, and rural status, though some examined beneficiaries by condition.

Utilization of other services and prescription drugs

Ten studies examined utilization of other services, including outpatient and physician visits (6 studies), emergency department visits (2 studies), and prescription drugs (5 studies) (Appendix Table 1, Appendix Table 2). Three studies overlapped in measures examined. These studies had mixed findings depending on the measure used.

Evidence on differences in outpatient and physician visits between Medicare Advantage enrollees and traditional Medicare beneficiaries was mixed. One study compared the number of primary care visits per person, defined as visits to providers in family medicine, internal medicine, pediatric medicine, and general practice specialties. The study found that Medicare Advantage enrollees had more primary care visits per person than traditional Medicare beneficiaries.119 

A second study examined changes in physician visits following transition from commercial insurance to either a Medicare Advantage plan (Aetna) or traditional Medicare with an Aetna supplemental insurance (i.e., Medigap) plan, finding that enrollment in Medicare Advantage was not associated with a statistically significant change in number of physician visits compared to traditional Medicare.120  This suggests that use of physician services is similar between Medicare Advantage enrollees and traditional Medicare beneficiaries in the year following initial enrollment in Medicare.

Three studies examined utilization of medical practitioner visits, procedures, services, and supplied items among beneficiaries with and without diabetes or Alzheimer’s disease and related dementias (ADRD) and beneficiaries with any mental illness, finding that Medicare Advantage enrollees had lower utilization of these services than traditional Medicare beneficiaries.121 , 122 , 123  Among those with diabetes, Medicare Advantage enrollees had 22.4 fewer of these services than traditional Medicare beneficiaries; among those without diabetes, Medicare Advantage enrollees had 12.5 fewer of these services than traditional Medicare beneficiaries. Similarly, Medicare Advantage enrollees with ADRD had 22.3 fewer of these services than traditional Medicare beneficiaries with ADRD, and Medicare Advantage enrollees without ADRD had 15.0 fewer of these services compared to similar traditional Medicare beneficiaries. Among beneficiaries with any mental illness, Medicare Advantage enrollees had 36.48 fewer of these services than traditional Medicare beneficiaries. The studies on diabetes and ADRD excluded beneficiaries under the age of 65 and all three studies excluded beneficiaries whose original Medicare eligibility was attributable to end-stage renal disease.

A sixth study examined the number of physician visits and the share of beneficiaries with any physician visits among beneficiaries with high-needs (i.e., those with three or more chronic conditions and a limitation in activities of daily living (ADLs) or instrumental ADLs) and those without high-needs. That study found that among high-needs beneficiaries, Medicare Advantage enrollees had a 2.5 percentage point lower probability of having any physician visits; however, differences in the number of physician visits were not statistically significant.124  The study looked separately at those without high-needs, finding no difference in the share of beneficiaries with any physician visits, but a 1.8 percentage point reduction in number of physician visits among Medicare Advantage enrollees than traditional Medicare beneficiaries.

One of the six studies described above also examined outpatient hospital visits among beneficiaries with a mental illness, finding that Medicare Advantage enrollment was associated with 6.73 fewer outpatient hospital visits relative to traditional Medicare.125 

Only two studies examined use of emergency department visits among Medicare Advantage and traditional Medicare beneficiaries, yielding mixed results. We identified just two studies that analyzed differences in emergency department visits. One study found similar shares of Medicare Advantage and traditional Medicare beneficiaries age 65 and older with an emergency department visit (34% for both groups).126  The study did not control for differences in beneficiary characteristics (Appendix Table 2). The second study examined a single hospital-based delivery system (Banner Health) that partnered with Blue Cross Blue Shield to offer a Medicare Advantage plan and beginning in 2012, participated in the Pioneer ACO program. This study found that in 2013 and 2014, the Medicare Advantage enrollees had higher emergency department visit rates than traditional Medicare attributed to the Banner-ACO and traditional Medicare beneficiaries not attributed to an ACO.127 

Utilization of drugs administered by physicians and other health care providers (i.e., drugs that are covered under Medicare Part B that are typically used to treat cancer and other serious conditions) was similar between Medicare Advantage and traditional Medicare, though Medicare Advantage was associated with more efficient use. One study found that upon transitioning from commercial insurance to an Aetna Medicare Advantage or traditional Medicare with an Aetna Medigap policy, there were no differences in the number of injectable drug procedures between the two groups.128  A second study found that Medicare Advantage enrollees were more likely to receive low-cost Part B drugs in four clinical scenarios where similar or equally effective drugs exist, suggesting that Medicare Advantage coverage may be associated with more efficient prescribing of Part B drugs.129 

Studies comparing differences in prescription drug utilization among Medicare Advantage and traditional Medicare beneficiaries found inconsistent evidence. Five studies examined differences in utilization of prescription drugs among beneficiaries in Medicare Advantage and traditional Medicare.

Three studies found no statistically significant differences in use of prescription drugs among beneficiaries with a mental illness, diabetes, or Alzheimer’s disease and related dementias (ADRD) in Medicare Advantage plans or traditional Medicare,130 , 131 , 132  but among beneficiaries without diabetes or ADRD, Medicare Advantage enrollees filled 27.6 and 19.4 more prescriptions than traditional Medicare beneficiaries, respectively. These studies did not specify the type of prescription drug purchases, including whether the drugs were brand or generic drugs.

Another study examined prescribing and utilization patterns related to opioids finding Medicare Advantage Prescription Drug (MA-PD) enrollees were less likely to fill a prescription for an opioid compared to traditional Medicare beneficiaries in stand-alone prescription drug plans (PDPs).133  The analysis accounted for beneficiary age, gender, and race, as well as characteristics of the county and local health care market but did not control for beneficiary-level health risk (Appendix Table 2).

The fifth study found no statistically significant differences in prescription drug use among Medicare Advantage and traditional Medicare beneficiaries with high-needs (i.e., three or more chronic conditions and a limitation in ADLs or instrumental ADLs) and among non-high needs beneficiaries.134 

None of the studies that examined any measures of prescription drug or other service utilization stratified results by different demographic groups. Of the ten studies that examined utilization of outpatient and physician visits, emergency department visits, prescription drugs, and Part B drugs, none presented estimates by both Medicare coverage types and demographic subgroups such as race and ethnicity, age group, Medicare-Medicaid dual eligibility, and rural status.

Quality

We reviewed 27 studies that compared Medicare Advantage and traditional Medicare on aspects of quality, including hospital readmission rates (12 studies), potentially avoidable hospitalizations (2 studies), quality rating of facilities (6 studies), disease management (7 studies), and use of low-value care (1 study), including one study that overlapped in measures examined (Appendix Table 1, Appendix Table 2). Overall, neither Medicare Advantage nor traditional Medicare consistently performed better across all measures

Hospital readmissions

Twelve studies in our review compared hospital readmission rates between Medicare Advantage and traditional Medicare (Appendix Table 1, Appendix Table 2). Seven of these studies generally found lower rates in Medicare Advantage than traditional Medicare. Four studies that were more limited in scope found similar rates of readmission between traditional Medicare and Medicare Advantage and one study examining three conditions (acute myocardial infarction, congestive heart failure, pneumonia) included in the Hospital Readmissions Reduction Program (HRRP) found higher readmission rates among Medicare Advantage enrollees relative to beneficiaries in traditional Medicare. Additionally, while Black beneficiaries had higher readmission rates than White beneficiaries in both Medicare Advantage than traditional Medicare, there was a wider difference between Black and White patients in Medicare Advantage plans.

Readmission rates were generally lower in Medicare Advantage than in traditional Medicare. Of the seven studies that found lower readmission rates among Medicare Advantage enrollees, 135 , 136 , 137 , 138 , 139 , 140 , 141  two studies focused on patients discharged to skilled nursing facilities (SNFs) after their initial hospitalization142 , 143  and two studies followed patients hospitalized for a subset of chronic conditions.144 , 145  One analysis focused on beneficiaries ages 65 and over who were hospitalized in one of 66 hospitals in a single state (WI), finding that readmission rates were lower among Medicare Advantage enrollees than beneficiaries in traditional Medicare within the same hospital for 62 out of 66 hospitals.146  Two studies examined readmission rates among beneficiaries in a subset of states that covered less than a third of the Medicare Advantage population, so findings may not be generalizable to the broader Medicare population.147 , 148 

Four studies found similar rates of hospital readmissions between Medicare Advantage and traditional Medicare,149 , 150 , 151 , 152  though only one of these studies included a sample that was relatively broad. The study found no differences for readmissions for five conditions (acute myocardial infarction, pneumonia, heart failure, stroke and hip or knee replacement), with slightly lower readmissions for one condition, chronic obstructive pulmonary disease, among Medicare Advantage enrollees (17.8%) than traditional Medicare beneficiaries (18.7%).153  The three other studies that found no difference in hospital readmission rates were based on a single hospital,154  claims from one insurer for hip or knee replacements,155  or six surgical procedures in a single state.156 

One study that was national in scope found that Medicare Advantage enrollees had higher risk-adjusted readmission rates compared to beneficiaries in traditional Medicare.157  The analysis looked specifically at patients with acute myocardial infarction, congestive heart failure, and pneumonia. The authors found that the pattern of higher readmission rates among Medicare Advantage enrollees held when comparing beneficiaries admitted to the same hospital.

Black beneficiaries were more likely to be readmitted to the hospital than White beneficiaries in both Medicare Advantage and traditional Medicare. Two studies examined readmission rates between Medicare Advantage and traditional Medicare stratified by race. The first focused on patients who were initially discharged to a skilled nursing facility.158  The second was based on a sample of patients undergoing at least one of six surgical procedures in hospitals in the state of New York.159  In both studies, Black beneficiaries had higher rates of 30-day hospital readmissions than White beneficiaries in both traditional Medicare and Medicare Advantage. However, the studies had inconsistent findings with respect to whether the disparity was greater in traditional Medicare or Medicare Advantage: in the study of patients initially discharged to a skilled nursing facility, the differences between Black and White beneficiaries were similar for both traditional Medicare and Medicare Advantage,160  but in the study of patients undergoing surgical procedures in New York,161  Black traditional Medicare beneficiaries were 33 percent more likely than White traditional Medicare beneficiaries to be readmitted, while Black Medicare Advantage enrollees were 64 percent more likely than White Medicare Advantage enrollees to be readmitted. While these studies examined disparities between White and Black beneficiaries in Medicare Advantage and traditional Medicare, they did not separately compare differences between Medicare Advantage and traditional Medicare within each individual racial group.

We were unable to identify additional studies that stratified readmission estimates by other demographic subgroups such as by Medicare-Medicaid dual eligibility and rural status.

Potentially avoidable hospitalizations

Hospitalizations for ambulatory care sensitive conditions (ACSC) are considered potentially avoidable if appropriate care has been provided in a primary care setting. The rate of hospitalizations for ACSCs are therefore used as an indicator for quality. Two studies examined the rate of these potentially avoidable hospitalizations among Medicare Advantage enrollees and traditional Medicare beneficiaries. However, only one of these studies accounted for differences in the characteristics of Medicare Advantage enrollees and traditional Medicare beneficiaries. After controlling for beneficiary characteristics, Black beneficiaries had higher rates of potentially avoidable hospitalizations in Medicare Advantage than in traditional Medicare.

Traditional Medicare beneficiaries had higher rates of hospitalization for ACSCs in a study that did not control for age or health status differences. One study found that traditional Medicare beneficiaries were hospitalized more often than Medicare Advantage enrollees for ACSCs.162  The study did not evaluate statistical significance or adjust beneficiary characteristics (Appendix Table 2).

Black Medicare Advantage enrollees had higher rates of potentially avoidable hospitalizations for ACSCs than Black traditional Medicare beneficiaries. One study compared hospitalizations for ACSCs between Black and White beneficiaries in Medicare Advantage and traditional Medicare.163  After controlling for differences in demographic characteristics and chronic conditions, this study found that Black Medicare Advantage enrollees were more likely to be hospitalized for ACSCs (221.2 ACSCs per 10,000 beneficiaries) than Black traditional Medicare beneficiaries (209.3 ACSCs per 10,000 beneficiaries), but there were no differences between White Medicare Advantage enrollees and White traditional Medicare beneficiaries.

Disparities between Black and White beneficiaries in rates of potentially avoidable hospitalizations for ACSCs were larger in Medicare Advantage than traditional Medicare. In addition to finding differences between Medicare Advantage and traditional Medicare for Black, but not White beneficiaries, this same study found that the differences between Black and White beneficiaries were larger in Medicare Advantage than traditional Medicare (59.0 ACSCs per 10,000 beneficiaries in Medicare Advantage compared to 45.6 ACSCs per 10,000 beneficiaries in traditional Medicare). Further, differences between Black and White Medicare Advantage enrollees were present in nearly all hospital markets, while differences between Black and White beneficiaries in traditional Medicare were observed in just over half of the geographic areas.164 

Quality of facilities

Six studies compared the quality of facilities used by beneficiaries in Medicare Advantage and traditional Medicare (Appendix Table 1, Appendix Table 2). These studies generally found that Medicare Advantage enrollees were less likely than traditional Medicare beneficiaries to receive care from the highest or lowest rated hospitals overall, or highest-rated hospitals for cancer care, skilled nursing facilities, and home health agencies.   

Two studies found that Medicare Advantage enrollees were less likely than traditional Medicare beneficiaries to receive care from higher-rated hospitals. Two studies examined the quality of admitting hospitals specifically. One study found that Medicare Advantage enrollees were more likely to be admitted to average-quality hospitals rather than either high- or low-quality hospitals for non-emergent conditions; differences for emergency conditions were not significant.165  The study also examined the quality of hospitals for rural beneficiaries in Medicare Advantage and traditional Medicare, finding no difference between the two coverage types. The second study found that Medicare Advantage enrollees were less likely than beneficiaries in traditional Medicare to use a top-ranked cancer hospital for five cancer-related surgical procedures.166 

Two studies found that Medicare Advantage enrollees were less likely to receive care from the highest-quality home health agencies and skilled nursing facilities. Two studies examined the quality ratings of home health agencies and found that Medicare Advantage enrollees were less likely than traditional Medicare beneficiaries to receive care from high-quality home health providers.167 , 168  Another study found that Medicare Advantage enrollees were more likely to enter nursing homes with lower quality ratings and higher rehospitalization rates compared to beneficiaries in traditional Medicare, after controlling for clinical conditions and facility-level characteristics.169 

The sixth study examined 18 facility-level quality measures in long-stay nursing homes (i.e., nursing homes) and short-stay nursing homes (i.e., SNFs), finding no differences between Medicare Advantage and traditional Medicare for ten of the measures. However, the remaining eight measures had inconsistent findings: while Medicare Advantage enrollees in SNFs and long-stay nursing homes had lower risk of antipsychotic drug use, traditional Medicare beneficiaries in SNFs and long-stay nursing homes had lower risk of moderate to severe pain and urinary incontinence, respectively.170 

Disease management

Seven studies examined measures of disease management or quality of care for specific diseases, including heart disease, diabetes, and end-stage renal disease (Appendix Table 1, Appendix Table 2). These three disease areas are of interest because of their prevalence or cost. Nearly a third (32%) of all Medicare beneficiaries have heart disease and about a third (34%) have diabetes. While people with end-stage renal disease accounted for about 1% of the total Medicare population in 2019, they represent a disproportionate share of Medicare spending. These studies had mixed findings depending on the condition and quality measure.

Medicare Advantage enrollees with heart disease were more likely than traditional Medicare beneficiaries to receive guideline-recommended therapies in ambulatory settings, but not during an inpatient admission. One study, using data from patients who were hospitalized for heart failure, found no statistically significant differences between traditional Medicare and Medicare Advantage across most quality measures, such as receipt of guideline-recommended therapies.171  A second analysis of patients with coronary heart disease in the ambulatory setting found that Medicare Advantage enrollees were more likely to receive guideline-recommended secondary prevention treatment (i.e., statins), but there were no significant differences in intermediate outcomes (e.g., systolic and diastolic blood pressure) between beneficiaries in Medicare Advantage and traditional Medicare.172 

The authors of these two studies note that differences in findings for ambulatory versus inpatient settings could be partially attributed to the way Medicare Advantage plans negotiate contracts with providers in these two settings. Specifically, because ambulatory clinicians negotiate contracts directly with Medicare Advantage plans, which may include quality benchmarks, clinicians in this setting are incentivized to provide better quality of care. While similar quality contracts exist in the inpatient hospital setting, inpatient physicians may be unaware of the specifics of the contract, limiting plans’ influence in incentivizing inpatient physicians’ practice.

Four studies comparing quality and experiences with care among beneficiaries with diabetes in Medicare Advantage and traditional Medicare had mixed findings. One analysis of adults ages 65 and older with diabetes found a larger share of Medicare Advantage than traditional Medicare beneficiaries with diabetes “had medication use” (72.7% versus 62.5%) but Medicare Advantage enrollees were less likely to have a blood sugar test (70.3% versus 79.7%) or a test for average blood sugar level over the past three months (HbA1C) (86.6% versus 93.9%).173  The study found no significant differences on five other process measures of diabetes care, including whether blood sugar was well controlled, insulin use, blood pressure check at home, comprehensive foot exam, and checks for sores on feet. That study also found no differences between traditional Medicare and Medicare Advantage in care satisfaction, general health status, or change in health status among diabetic beneficiaries.

A second study found that Medicare Advantage enrollees were more likely than beneficiaries in traditional Medicare to be prescribed guideline-recommended therapy for diabetes.174  The study also found that traditional Medicare beneficiaries were more likely to be treated with medications from newer drug classes, which could represent higher quality of care but also more costly treatment (as these medications do not yet have generic alternatives). The scope of the study did not include process measures of diabetes care, such as whether blood sugar was well controlled.

A third study found that among beneficiaries in three states (CA, FL, NY), Medicare Advantage had higher levels of performance than traditional Medicare on clinical quality measures of diabetes care, including diabetic eye exam screening, diabetic cholesterol screening, and nephropathy care.175 

The fourth study looked at measures of diabetes management by race and ethnicity, finding that while White beneficiaries had higher rates of foot examinations, flu shots, and cholesterol checks than Hispanic beneficiaries in both Medicare Advantage and traditional Medicare, the disparity between White and Hispanic beneficiaries was narrower in Medicare Advantage than in traditional Medicare.176 

Medicare beneficiaries with end-stage renal disease (ESRD) in one Medicare Advantage Special Needs Plan (SNP) had lower mortality and lower utilization than traditional Medicare beneficiaries. Prior to 2021, beneficiaries with ESRD were not able to enroll in most Medicare Advantage plans, with the exception of some SNPs. Therefore, we were only able to identify one study that compared the quality of care received by beneficiaries with ESRD in traditional Medicare versus Medicare Advantage SNPs.177  The study found that enrollees with ESRD in a SNP had lower all-cause mortality and lower utilization across the care continuum compared to beneficiaries with ESRD in traditional Medicare. Because the analysis was limited to beneficiaries in a single health plan, CareMore Health, in three counties in California, findings may not be generalizable to other ESRD SNPs or Medicare Advantage plans more broadly.

Findings from one study on other measures of disease management indicate higher levels of performance for Medicare Advantage than traditional Medicare. The study found that Medicare Advantage had higher levels of performance on three measures of disease management, with variation in the magnitude of differences by type of measure.178  Specifically, Medicare Advantage outperformed traditional Medicare by 8.7 percentage points on a measure of rheumatoid arthritis management and as much as 23.9 percentage points on a measure of osteoporosis management for fractures. Similarly, with respect to medication adherence, Medicare Advantage plans performed better than traditional Medicare.

Low-value care

Low-value care is defined as services that provide little clinical benefits to patients but have potential to cause harm or incur health care costs for certain population groups. One study identified 13 low-value services from prior research and categorized them in four composite measures of low-value cancer screening, antibiotic use, medication, and imaging use (Appendix Table 1, Appendix Table 2). This study compared use of low-value care services between beneficiaries in Medicare Advantage and traditional Medicare, finding no statistically significant differences between the two groups in use of most of these services; however, a larger share of Medicare Advantage enrollees than traditional Medicare beneficiaries had low-value medication use.

One study found no statistically significant differences between Medicare Advantage and traditional Medicare beneficiaries in use of low-value cancer screenings, antibiotic use, or imaging services under certain circumstances. The study categorized screening for cervical, colorectal, and prostate cancer for specific groups under the composite measure of low-value cancer screening, finding no significant differences in use between Medicare Advantage and traditional Medicare beneficiaries.179  Cancer screenings were considered “low-value” if, for example, men age 75 and older without a diagnosis of prostate cancer received a prostate-specific antigen test. The study found similar findings for low-value antibiotic use (e.g., antibiotic for influenza among individuals diagnosed with influenza but without a diagnosis of bacterial infection, chronic obstructive pulmonary disease, or cancer) and low-value imaging services (e.g., MRI or CT for headache for individuals with a diagnosis of headache but no diagnosis of pregnancy, cancer, or epilepsy).

That same study found that a larger share of Medicare Advantage enrollees than traditional Medicare beneficiaries have used at least one medication under circumstances where use of these medications is considered low-value. Specifically,19.7% of Medicare Advantage enrollees in certain circumstances received low-value medications compared to 17.6% of beneficiaries in traditional Medicare.180  Examples of circumstances where medications were considered “low-value” include use of opioids for back pain among individuals with a diagnosis of back pain but no diagnosis of fever or cancer.

Authors of the study were unable to measure all potentially relevant exclusions when identifying use of low-value care, so it is possible that for some of the people who received these services, care was indicated based on risk factors that could not be identified in the data and was therefore not low-value.

This study did not stratify results by race and ethnicity, dual eligibility status, or other demographic groups.Back to top.

Data and Methods for Comparing Medicare Advantage and Traditional Medicare

Analyses use a variety of data sources to compare Medicare Advantage and traditional Medicare. The vast majority of studies we reviewed (49 out of 62 studies) used nationally-representative data sources (Appendix Table 1), including the Medicare Current Beneficiary Survey (MCBS), Medicare Consumer Assessment of Healthcare Providers & Systems (MCAHPS), Medicare Provider Analysis and Review, long-term care Minimum Data Set, and national registries of patients with certain clinical characteristics. Six studies used state-level datasets, such as Healthcare Cost and Utilization Project (HCUP) State Inpatient Databases, and one study used administrative data from a single hospital. The remaining six studies used claims or encounter data collected from a single health plan (Humana, Aetna, or Blue Cross Blue Shield) that covered beneficiaries within the plan nationally or a subset of beneficiaries in a single state, a single health delivery system, or in multiple hospitals. Notably, lags in data availability, and the sometimes-lengthy peer-review process means that only 12 studies used data from the past five years, while the remaining used data from between 2010 and 2017 (Appendix Table 2). The data period is important because the Affordable Care Act made substantial changes to how Medicare Advantage plans are paid, which were not fully phased in for several years after that legislation was enacted into law, and so their effects may not be captured by studies that use older data.

Of the 62 studies in our review, just two studies used Medicare Advantage encounter data. Most studies relied on sources such as the MCBS and Healthcare Effectiveness Data and Information Set (HEDIS) to identify utilization of services among Medicare Advantage enrollees. While many of these data sources have been routinely used to examine outcomes of interest, they lack the type of information on specific service utilization that is contained in claims data. For example, the authors of one study noted they were unable to identify enrollees with all chronic conditions in their analysis of disenrollment among beneficiaries with complex chronic conditions due to incomplete encounter data.181  Ideally, data that is comparable to traditional Medicare’s claims data would be used to compare utilization between Medicare Advantage and traditional Medicare beneficiaries, controlling for demographic, geographic, diagnostic and other variables. However, the Medicare Payment Advisory Commission (MedPAC) has identified several concerns with the quality of Medicare Advantage encounter data, the only multi-payer source of claims across all Medicare Advantage plans currently available to researchers, including data incompleteness and attribution of enrollees to the wrong plan. In addition, differences in coding intensity across Medicare Advantage and traditional Medicare complicate comparisons using claims data. These concerns limit the types of analyses that can be reliably conducted using these data.

Most, but not all, studies attempted to account for differences in beneficiary characteristics, including differences in health status. Of the 62 studies in our review, most (52 studies) attempted to account for differences in the characteristics of beneficiaries in Medicare Advantage and traditional Medicare, including demographic, socioeconomic, and health risks, though they varied in methodology and transparency (Appendix Table 1, Appendix Table 2). Fifty studies were explicit in how they adjusted for health risk, and typically acknowledged that they could not completely address selection bias due to unobservable characteristics between beneficiaries in Medicare Advantage and traditional Medicare.

The use of more sophisticated statistical methods varied. The majority of studies included regression models to estimate the difference between beneficiaries in Medicare Advantage and traditional Medicare, controlling for observable beneficiary characteristics. Several studies created matched samples (using propensity score matching to select traditional Medicare beneficiaries that were most similar to Medicare Advantage enrollees) or included inverse probability of treatment weights (IPTW) in the regression model as a further attempt to adjust for differences in the likelihood of certain groups to enroll in Medicare Advantage (versus traditional Medicare) (Appendix Table 1, Appendix Table 2).

A small number of studies (7 studies) used a quasi-experimental design, such as difference-in-differences and instrumental variable approach, to isolate the effect of enrollment in Medicare Advantage on outcomes of interest (Appendix Table 1, Appendix Table 2). For example, one study examined changes in health care utilization upon transitioning from commercial insurance for people who enrolled in Medicare Advantage compared to those who enrolled in traditional Medicare.182  These study designs help to address concerns about differential selection into Medicare Advantage.Back to top.

Gaps in Research

Despite the growth in enrollment of beneficiaries of color, few studies presented estimates for Medicare Advantage and traditional Medicare beneficiaries by race and ethnicity. Of the 62 studies in our review that compared measures of beneficiary experience, affordability, utilization, and quality between Medicare Advantage and traditional Medicare, seven studies compared estimates by race and ethnicity. These gaps in data for certain subgroups of Medicare beneficiaries is especially concerning given that about half of all Black and Hispanic Medicare beneficiaries are now enrolled in a Medicare Advantage plan. The seven studies that compared estimates by race and ethnicity were unable to present more nuanced and disaggregated data that reflect the heterogeneity within different racial and ethnic groups: three studies were limited to comparisons between Black, White and Hispanic beneficiaries; two studies compared non-Hispanic Black and White beneficiaries; and two studies combined into a single category Black, Hispanic, Native American and Asian/Pacific Islander people, without reporting separately for each of these groups.

Just two studies in our review compared estimates by Medicare-Medicaid dual status. This is despite the fact that 12.3 million people on Medicare also have coverage under Medicare and Medicaid, and a growing share—now 36%—of this group are enrolled in a Medicare Advantage plan. While a portion of this population are enrolled in Medicare-Medicaid plans offered under the financial alignment demonstration, evaluations of which are not included in this review, the majority are in other Medicare Advantage plans. People who are dually eligible for Medicare and Medicaid are low-income and tend to have significant health needs. The two studies that did compare quality of care between Medicare Advantage and traditional Medicare by dual status focused on switching patterns (Medicare Advantage to traditional Medicare and traditional Medicare to Medicare Advantage) rather than other direct indicators of quality of care.

Most studies in our review excluded beneficiaries under age 65 and other groups with significant health needs. Seven million people on Medicare were under age 65 and living with disabilities in 2019, and 39% of this group was enrolled in a Medicare Advantage plan. However, just two studies in our review examined estimates for beneficiaries under age 65. Most studies in our review (33 studies) excluded beneficiaries under age 65 specifically.

In addition, only one study examined the experience of people with end-stage renal disease. This is a very vulnerable population, who is now permitted to enroll in individual Medicare Advantage plans, due to a recent change in law. Monitoring the experiences of those with ESRD will be important, especially with respect to whether they have access to dialysis facilities under MA plans.

Few studies examined measures of beneficiary experiences, affordability, utilization, and quality of care among traditional Medicare and Medicare Advantage beneficiaries in rural areas. More than one in four Medicare beneficiaries living in rural areas are enrolled in a Medicare Advantage plan. However, we were able to identify just two studies that examined differences between Medicare Advantage and traditional Medicare beneficiaries in rural versus urban areas.  While Medicare Advantage enrollment is lower in rural than urban areas, according to MedPAC, Medicare Advantage enrollment has grown faster in rural areas.

While there has been an increased focus on alternative payment models in Medicare, the 62 studies in our review generally did not evaluate Accountable Care Organizations (ACO) or other alternative payment and care delivery models in traditional Medicare separately when comparing traditional Medicare to Medicare Advantage. According to MedPAC, 10.7 million Medicare beneficiaries are attributed to 477 accountable care organizations under the Medicare Shared Savings Program. However, just two studies stratified the traditional Medicare population by ACO attribution.

Only three studies examined Medicare Advantage Special Needs Plan (SNPs) separately from other Medicare Advantage enrollees when comparing estimates to traditional Medicare. Medicare Advantage SNPs provide targeted care to a disproportionately high-need population, including enrollees with severe or disabling chronic conditions, enrollees dually eligible for Medicaid, or enrollees in institutional settings. However, just three studies in our review stratified results for Medicare Advantage enrollees by SNP status.

None of the 62 studies in our review examined measures related to COVID-19, including rates of vaccinations, hospitalizations, and deaths between Medicare Advantage and traditional Medicare beneficiaries. The COVID-19 pandemic has had a disproportionate impact on older adults, virtually all of whom are covered by Medicare. However, we were unable to find analyses that met our inclusion criteria that compared the experiences of traditional Medicare and Medicare Advantage enrollees with respect to COVID-19 hospitalizations, post-acute care, vaccination rates, and deaths as of May 2022. Our inability to find other studies that examined COVID-19 vaccination rates specifically is likely due to the lag in data availability, incompleteness of claims data for measuring COVID-19 vaccine administration, and a sometimes lengthy peer-review process, as only one study in our review included data that overlapped with the pandemic.Back to top.

Conclusion

Together, these 62 studies provide further insight to compare Medicare Advantage and traditional Medicare, though with somewhat mixed and inconclusive evidence. Beneficiaries in Medicare Advantage and traditional Medicare reported similar rates of satisfaction with their care, experiences with wait times, finding a new provider, and overall measures of care coordination. Enrollees in Medicare Advantage plans were more likely to report having a usual source of care and receiving preventive services such as annual wellness visits and the flu vaccine. Medicare Advantage enrollees also had lower utilization of skilled nursing facilities and home health care, as well as lower hospital readmission rates, but they were less likely than traditional Medicare beneficiaries to receive care in hospitals, skilled nursing facilities, and home health agencies with the highest quality ratings. Additionally, Medicare Advantage enrollees who were admitted to skilled nursing facilities following discharge from the hospital had lower hospital readmission rates, though evidence on other outcome measures was inconsistent. Medicare Advantage enrollees from communities of color reported higher rates of preventive care service use, consistent with the overall pattern; however, two studies also found that Black enrollees in particular experienced higher rates of avoidable hospitalizations and hospital readmissions compared to Black beneficiaries in traditional Medicare, and that disparities in rates of avoidable hospitalizations and hospital readmission between Black and White beneficiaries were greater in Medicare Advantage than in traditional Medicare. Beneficiaries in traditional Medicare were less likely to report affordability problems than Medicare Advantage enrollees, mainly due to supplemental coverage.

Our findings are consistent with a 2021 systematic review of the literature that found that Medicare Advantage enrollees had higher utilization of preventive care visits, fewer skilled nursing facility stays, and were more likely to receive care in average-quality hospitals and lower-quality skilled nursing facilities and home health agencies. While our review, limited to data since 2010, generally finds lower hospital readmission rates among Medicare Advantage enrollees, the other literature review, which includes data spanning back to 2003, did not find a consistent pattern in readmission rates relative to traditional Medicare. Our review is broader in scope in that it includes studies that examine affordability measures, patterns of switching between Medicare Advantage and traditional Medicare, experiences with prescription drugs, and utilization of prescription drugs (i.e., Part D) and drugs administered by physicians or other healthcare providers (i.e., Part B).

A 2014 KFF review of studies published between 2000 and 2014 also documented that Medicare Advantage plans scored higher than traditional Medicare on indicators of preventive care services. However, while our 2022 review finds lower hospital readmission rates among Medicare Advantage enrollees, the 2014 review found that the evidence on hospital readmission rates was inconclusive, likely due to few studies that accounted for differences in beneficiary characteristics at that time. Notably, both the 2014 review and this 2022 review continue to document data constraints, including limited insight into the experiences of certain beneficiaries, such as beneficiaries with more complex medical needs.

As Medicare Advantage plans continue to have an expanding role in the Medicare program, the studies in our review provide useful context for understanding how well Medicare Advantage plans are serving their enrollees relative to traditional Medicare. At the same time, data limitations remain a significant concern. The lack of complete and accurate claims (“encounter”) data for Medicare Advantage enrollees makes it difficult to compare service utilization and outcomes among beneficiaries in Medicare Advantage and traditional Medicare, nationally and by geographic region, plan characteristics, and beneficiary demographics. Many of the studies published since 2016 use relatively old data (i.e., data from before 2018) (50 of the 62 studies included in this literature review), which may not present an accurate reflection of current practices given how rapidly Medicare Advantage is growing.

Despite changes in Medicare Advantage enrollment patterns, gaps in research exist, particularly the experience among certain subgroups such as Black and Hispanic beneficiaries who are disproportionately enrolled in Medicare Advantage plans; beneficiaries living in rural areas; and high-need or medically complex segments of the population, such as beneficiaries under the age of 65 with long-term disabilities or beneficiaries with coverage under both Medicare and Medicaid. Additionally, despite being more than two years into the COVID-19 pandemic, we were unable to identify any studies that met our criteria and examined differences in COVID-19-related hospitalizations, deaths, vaccination rates, and treatments between Medicare Advantage and traditional Medicare beneficiaries.

This work was supported in part by Arnold Ventures. KFF maintains full editorial control over all of its policy analysis, polling, and journalism activities.

Back to top.

Methods

This literature review first summarizes findings from 62 studies published between January 1, 2016 and May 1, 2022 that compare measures of beneficiary experience, affordability, service utilization and quality between Medicare Advantage and traditional Medicare.

Studies were selected if they included data pertaining to the period from 2010 to the present. Studies with data prior to 2010 were included if they included at least one year of data post-2010. Studies also met the inclusion criteria if they included a transparent discussion of methods and data sources, including discussion of limitations.

Most studies included in this literature review are journal articles from peer-reviewed journals, but we also included studies published by independent policy and research groups as well as government reports. We excluded reports that were fully funded by advocacy or industry groups. We also do not include evaluations of Medicare-Medicaid plans participating in the Financial Alignment Initiative capitated model demonstrations.

To collect relevant studies, we conducted keyword searches of PubMed, Google Scholar, and other academic search engines, as well as the websites of governmental, research, and policy organizations that publish work related to health care. Additional studies were found using a snowball technique based on bibliographies of previously pulled studies. While we tried to be as comprehensive as possible in our inclusion of studies and findings that meet our criteria, it is possible that we missed some relevant studies or findings.

Back to top.

Appendix

Summary of Statistical Methods in the 62 Reviewed Studies Comparing Measures of Care Satisfaction in Medicare Advantage and Traditional Medicare
Sixty-Two Studies Comparing One or More Measures of Beneficiary Experience, Utilization, and Quality Among Beneficiaries in Medicare Advantage (MA) and Traditional Medicare (TM)

Endnotes

  1. Gretchen Jacobson, Aimee Cicchiello, Janet P. Sutton, and Arnav Shah, Medicare Advantage vs. Traditional Medicare: How Do Beneficiaries’ Characteristics and Experiences Differ? (Washington, DC: The Commonwealth Fund, October 2021), https://www.commonwealthfund.org/publications/issue-briefs/2021/oct/medicare-advantage-vs-traditional-medicare-beneficiaries-differ ↩︎
  2. Gretchen Jacobson, Aimee Cicchiello, Janet P. Sutton, and Arnav Shah, Medicare Advantage vs. Traditional Medicare: How Do Beneficiaries’ Characteristics and Experiences Differ? (Washington, DC: The Commonwealth Fund, October 2021), https://www.commonwealthfund.org/publications/issue-briefs/2021/oct/medicare-advantage-vs-traditional-medicare-beneficiaries-differ ↩︎
  3. Sungchul Park et al., “Differences in Health Care Utilization, Process of Diabetes Care, Care Satisfaction, and Health Status in Patients With Diabetes in Medicare Advantage Versus Traditional Medicare,” Medical Care 58, no. 11 (November 2020): 1004-1012, doi: 10.1097/MLR.0000000000001390 ↩︎
  4. Sungchul Park et al., “Health Care Utilization, Care Satisfaction, and Health Status for Medicare Advantage and Traditional Medicare Beneficiaries With and Without Alzheimer Disease and Related Dementias,” JAMA Network Open 3, no. 3 (March 2020): e201809, doi:10.1001/jamanetworkopen.2020.1809 ↩︎
  5. Sungchul Park, “Effect of Medicare Advantage on health care use and care dissatisfaction in mental illness,” Health Services Research 57, no. 4 (February 2022): 820-829, https://doi.org/10.1111/1475-6773.13945 ↩︎
  6. Zachary Levinson and Julia Adler-Milstein, “A decade of experience for high-needs beneficiaries under Medicare Advantage,” Healthcare 8, no. 4 (December 2020): 100490, https://doi.org/10.1016/j.hjdsi.2020.100490 ↩︎
  7. Claire K. Ankuda et al., “Family and Friend Perceptions of Quality of End-of-Life Care in Medicare Advantage vs Traditional Medicare,” JAMA Network Open 3, no. 10 (October 2020): e2020345, doi:10.1001/jamanetworkopen.2020.20345 ↩︎
  8. Gretchen Jacobson, Aimee Cicchiello, Janet P. Sutton, and Arnav Shah, Medicare Advantage vs. Traditional Medicare: How Do Beneficiaries’ Characteristics and Experiences Differ? (Washington, DC: The Commonwealth Fund, October 2021), https://www.commonwealthfund.org/publications/issue-briefs/2021/oct/medicare-advantage-vs-traditional-medicare-beneficiaries-differ ↩︎
  9. Laura Skopec, Joshua Aarons, and Stephen Zuckerman, “Did Medicare Advantage Payment Cuts Affect Beneficiary Access and Affordability?” American Journal of Managed Care 25, no. 9 (September 2019): e261-e266, https://www.ajmc.com/view/did-medicare-advantage-payment-cuts-affect-beneficiary-access-and-affordability ↩︎
  10. Gretchen Jacobson, Aimee Cicchiello, Janet P. Sutton, and Arnav Shah, Medicare Advantage vs. Traditional Medicare: How Do Beneficiaries’ Characteristics and Experiences Differ? (Washington, DC: The Commonwealth Fund, October 2021), https://www.commonwealthfund.org/publications/issue-briefs/2021/oct/medicare-advantage-vs-traditional-medicare-beneficiaries-differ ↩︎
  11. Laura Skopec, Joshua Aarons, and Stephen Zuckerman, “Did Medicare Advantage Payment Cuts Affect Beneficiary Access and Affordability?” American Journal of Managed Care 25, no. 9 (September 2019): e261-e266, https://www.ajmc.com/view/did-medicare-advantage-payment-cuts-affect-beneficiary-access-and-affordability ↩︎
  12. Kenton J. Johnston, et al., “Association of Race and Ethnicity and Medicare Program Type With Ambulatory Care Access and Quality Measures,” JAMA 326, no. 7 (August 2021): 628-636, doi:10.1001/jama.2021.10413 ↩︎
  13. Kenton J. Johnston, et al., “Association of Race and Ethnicity and Medicare Program Type With Ambulatory Care Access and Quality Measures,” JAMA 326, no. 7 (August 2021): 628-636, doi:10.1001/jama.2021.10413 ↩︎
  14. Gretchen Jacobson, Aimee Cicchiello, Janet P. Sutton, and Arnav Shah, Medicare Advantage vs. Traditional Medicare: How Do Beneficiaries’ Characteristics and Experiences Differ? (Washington, DC: The Commonwealth Fund, October 2021), https://www.commonwealthfund.org/publications/issue-briefs/2021/oct/medicare-advantage-vs-traditional-medicare-beneficiaries-differ ↩︎
  15. Kenton J Johnston, et al., “Comparison of Ambulatory Care Access and Quality for Beneficiaries with Disabilities Covered by Medicare Advantage vs Traditional Medicare Insurance,” JAMA Health Forum 3, no. 1 (January 2022): e214562, doi:10.1001/jamahealthforum.2021.4562 ↩︎
  16. Zachary Levinson and Julia Adler-Milstein, “A decade of experience for high-needs beneficiaries under Medicare Advantage,” Healthcare 8, no. 4 (December 2020): 100490, https://doi.org/10.1016/j.hjdsi.2020.100490 ↩︎
  17. Kenton J. Johnston, et al., “Association of Race and Ethnicity and Medicare Program Type With Ambulatory Care Access and Quality Measures,” JAMA 326, no. 7 (August 2021): 628-636, doi:10.1001/jama.2021.10413 ↩︎
  18. Gretchen Jacobson, Aimee Cicchiello, Janet P. Sutton, and Arnav Shah, Medicare Advantage vs. Traditional Medicare: How Do Beneficiaries’ Characteristics and Experiences Differ? (Washington, DC: The Commonwealth Fund, October 2021), https://www.commonwealthfund.org/publications/issue-briefs/2021/oct/medicare-advantage-vs-traditional-medicare-beneficiaries-differ ↩︎
  19. Justin W. Timbie et al., “Medicare Advantage and Fee‐for‐Service Performance on Clinical Quality and Patient Experience Measures: Comparisons from Three Large States,” Health Services Research 52, no. 6 (December 2017): 2038-2060, doi: 10.1111/1475-6773.12787 ↩︎
  20. Gretchen Jacobson, Aimee Cicchiello, Janet P. Sutton, and Arnav Shah, Medicare Advantage vs. Traditional Medicare: How Do Beneficiaries’ Characteristics and Experiences Differ? (Washington, DC: The Commonwealth Fund, October 2021), https://www.commonwealthfund.org/publications/issue-briefs/2021/oct/medicare-advantage-vs-traditional-medicare-beneficiaries-differ ↩︎
  21. Laura Skopec, Joshua Aarons, and Stephen Zuckerman, “Did Medicare Advantage Payment Cuts Affect Beneficiary Access and Affordability?” American Journal of Managed Care 25, no. 9 (September 2019): e261-e266, https://www.ajmc.com/view/did-medicare-advantage-payment-cuts-affect-beneficiary-access-and-affordability ↩︎
  22. Zachary Levinson and Julia Adler-Milstein, “A decade of experience for high-needs beneficiaries under Medicare Advantage,” Healthcare 8, no. 4 (December 2020): 100490, https://doi.org/10.1016/j.hjdsi.2020.100490 ↩︎
  23. Michael T. Halpern ,Matthew P. Urato, and Erin E. Kent, “The health care experience of patients with cancer during the last year of life: Analysis of the SEER-CAHPS data set,” Cancer 123, no. 2 (January 2017): 336-344,  https://doi.org/10.1002/cncr.30319 ↩︎
  24. Justin W. Timbie et al., “Medicare Advantage and Fee‐for‐Service Performance on Clinical Quality and Patient Experience Measures: Comparisons from Three Large States,” Health Services Research 52, no. 6 (December 2017): 2038-2060, doi: 10.1111/1475-6773.12787 ↩︎
  25. Gretchen Jacobson, Aimee Cicchiello, Janet P. Sutton, and Arnav Shah, Medicare Advantage vs. Traditional Medicare: How Do Beneficiaries’ Characteristics and Experiences Differ? (Washington, DC: The Commonwealth Fund, October 2021), https://www.commonwealthfund.org/publications/issue-briefs/2021/oct/medicare-advantage-vs-traditional-medicare-beneficiaries-differ ↩︎
  26. Gretchen Jacobson et al., 2021 ↩︎
  27. Gretchen Jacobson et al., 2021 ↩︎
  28. Gretchen Jacobson et al., 2021 ↩︎
  29. Zachary Levinson and Julia Adler-Milstein, “A decade of experience for high-needs beneficiaries under Medicare Advantage,” Healthcare 8, no. 4 (December 2020): 100490, https://doi.org/10.1016/j.hjdsi.2020.100490 ↩︎
  30. Justin W. Timbie et al., “Medicare Advantage and Fee‐for‐Service Performance on Clinical Quality and Patient Experience Measures: Comparisons from Three Large States,” Health Services Research 52, no. 6 (December 2017): 2038-2060, doi: 10.1111/1475-6773.12787 ↩︎
  31. Marc N. Elliot et al., “Medicare Prescription Drug Plan Enrollees Report Less Positive Experiences Than Their Medicare Advantage Counterparts,” Health Affairs 35, no. 3 (March 2016): 456-463 https://doi.org/10.1377/hlthaff.2015.0816 ↩︎
  32. Gretchen Jacobson, Aimee Cicchiello, Janet P. Sutton, and Arnav Shah, Medicare Advantage vs. Traditional Medicare: How Do Beneficiaries’ Characteristics and Experiences Differ? (Washington, DC: The Commonwealth Fund, October 2021), https://www.commonwealthfund.org/publications/issue-briefs/2021/oct/medicare-advantage-vs-traditional-medicare-beneficiaries-differ ↩︎
  33. Sungchul Park, “Effect of Medicare Advantage on health care use and care dissatisfaction in mental illness,” Health Services Research 57, no. 4 (February 2022): 820-829, https://doi.org/10.1111/1475-6773.13945 ↩︎
  34. Michael T. Halpern, Matthew P. Urato, Erin E. Kent, “The health care experience of patients with cancer during the last year of life: Analysis of the SEER-CAHPS data set,” Cancer 123, no. 2 (January 2017): 336-344,  https://doi.org/10.1002/cncr.30319 ↩︎
  35. David Meyers et al., “Analysis of Drivers of Disenrollment and Plan Switching Among Medicare Advantage Beneficiaries,” JAMA Internal Medicine 179, no. 4 (February 2019): 524-532, doi:10.1001/jamainternmed.2018.7639 ↩︎
  36. Claire Ankuda et al., “Switching Between Medicare Advantage And Traditional Medicare Before And After The Onset Of Functional Disability,” Health Affairs 39, no. 5 (May 2020), https://doi.org/10.1377/hlthaff.2019.01070 ↩︎
  37. Sungchul Park, David Meyers, and Brent Langellier, “Rural Enrollees In Medicare Advantage Have Substantial Rates Of Switching To Traditional Medicare,” Health Affairs 40, no. 3 (March 2021), https://doi.org/10.1377/hlthaff.2020.01435 ↩︎
  38. Claire Ankuda et al., “Switching Between Medicare Advantage And Traditional Medicare Before And After The Onset Of Functional Disability,” Health Affairs 39, no. 5 (May 2020), https://doi.org/10.1377/hlthaff.2019.01070 ↩︎
  39. Sungchul Park et al., “Disease-Specific Plan Switching Between Traditional Medicare and Medicare Advantage,” The Permanente Journal 24 (November 2019), doi: 10.7812/TPP/19.059 ↩︎
  40. Jeannie Fuglesten Biniek, Nancy Ochieng, Juliette Cubanski, and Tricia Neuman, Cost-Related Problems Are Less Common Among Beneficiaries in Traditional Medicare Than in Medicare Advantage, Mainly Due to Supplemental Coverage  (Washington, DC: KFF, June 2021), https://modern.kff.org/medicare/issue-brief/cost-related-problems-are-less-common-among-beneficiaries-in-traditional-medicare-than-in-medicare-advantage-mainly-due-to-supplemental-coverage/ ↩︎
  41. Amy E. Cha & Robin A. Cohen, “Problems Paying Medical Bills, 2018,” National Center for Health Statistics Data Brief no. 357 (February 2020), https://www.ehidc.org/sites/default/files/resources/files/Problems%20Paying%20Medical%20Bills%202018.pdf ↩︎
  42. Laura Skopec, Joshua Aarons, and Stephen Zuckerman, “Did Medicare Advantage Payment Cuts Affect Beneficiary Access and Affordability?” American Journal of Managed Care 25, no. 9 (September 2019): e261-e266, https://www.ajmc.com/view/did-medicare-advantage-payment-cuts-affect-beneficiary-access-and-affordability ↩︎
  43. Gretchen Jacobson, Aimee Cicchiello, Janet P. Sutton, and Arnav Shah, Medicare Advantage vs. Traditional Medicare: How Do Beneficiaries’ Characteristics and Experiences Differ? (Washington, DC: The Commonwealth Fund, October 2021), https://www.commonwealthfund.org/publications/issue-briefs/2021/oct/medicare-advantage-vs-traditional-medicare-beneficiaries-differ ↩︎
  44. Jeannie Fuglesten Biniek, Nancy Ochieng, Juliette Cubanski, and Tricia Neuman, Cost-Related Problems Are Less Common Among Beneficiaries in Traditional Medicare Than in Medicare Advantage, Mainly Due to Supplemental Coverage  (Washington, DC: KFF, June 2021), https://modern.kff.org/medicare/issue-brief/cost-related-problems-are-less-common-among-beneficiaries-in-traditional-medicare-than-in-medicare-advantage-mainly-due-to-supplemental-coverage/ ↩︎
  45. Zachary Levinson and Julia Adler-Milstein, “A decade of experience for high-needs beneficiaries under Medicare Advantage,” Healthcare 8, no. 4 (December 2020): 100490, https://doi.org/10.1016/j.hjdsi.2020.100490 ↩︎
  46. Sungchul Park, “Effect of Medicare Advantage on health care use and care dissatisfaction in mental illness,” Health Services Research 57, no. 4 (February 2022): 820-829, https://doi.org/10.1111/1475-6773.13945 ↩︎
  47. Sungchul Park et al., “Differences in Health Care Utilization, Process of Diabetes Care, Care Satisfaction, and Health Status in Patients With Diabetes in Medicare Advantage Versus Traditional Medicare,” Medical Care 58, no. 11 (November 2020): 1004-1012, doi: 10.1097/MLR.0000000000001390 ↩︎
  48. Sungchul Park, Jose F. Figueroa, Paul Fishman, and Norma B. Coe, “Primary Care Utilization and Expenditures in Traditional Medicare and Medicare Advantage, 2007–2016,” Journal of General Internal Medicine 35 (May 2020): 2480-2481, https://doi.org/10.1007/s11606-020-05826-x ↩︎
  49. Mireille Jacobson, Johanna Thunell, and Julie Zissimopoulos, “Cognitive Assessment At Medicare’s Annual Wellness Visit In Fee-For-Service And Medicare Advantage Plans,” Health Affairs 39, no. 11 (November 2020): 1935-1942, https://doi.org/10.1377/hlthaff.2019.01795 ↩︎
  50. Mireille Jacobson, Johanna Thunell, and Julie Zissimopoulos, “Cognitive Assessment At Medicare’s Annual Wellness Visit In Fee-For-Service And Medicare Advantage Plans,” Health Affairs 39, no. 11 (November 2020): 1935-1942, https://doi.org/10.1377/hlthaff.2019.01795 ↩︎
  51. Kenton J. Johnston, et al., “Association of Race and Ethnicity and Medicare Program Type With Ambulatory Care Access and Quality Measures,” JAMA 326, no. 7 (August 2021): 628-636, doi:10.1001/jama.2021.10413 ↩︎
  52. Justin W. Timbie et al., “Medicare Advantage and Fee‐for‐Service Performance on Clinical Quality and Patient Experience Measures: Comparisons from Three Large States,” Health Services Research 52, no. 6 (December 2017): 2038-2060, doi: 10.1111/1475-6773.12787 ↩︎
  53. Sungchul Park, Jose F. Figueroa, Paul Fishman, and Norma B. Coe, “Primary Care Utilization and Expenditures in Traditional Medicare and Medicare Advantage, 2007–2016,” Journal of General Internal Medicine 35 (May 2020): 2480-2481, https://doi.org/10.1007/s11606-020-05826-x ↩︎
  54. Kenton J. Johnston, et al., “Association of Race and Ethnicity and Medicare Program Type With Ambulatory Care Access and Quality Measures,” JAMA 326, no. 7 (August 2021): 628-636, doi:10.1001/jama.2021.10413 ↩︎
  55. Justin W. Timbie et al., “Medicare Advantage and Fee‐for‐Service Performance on Clinical Quality and Patient Experience Measures: Comparisons from Three Large States,” Health Services Research 52, no. 6 (December 2017): 2038-2060, doi: 10.1111/1475-6773.12787 ↩︎
  56. Kenton J. Johnston, et al., “Association of Race and Ethnicity and Medicare Program Type With Ambulatory Care Access and Quality Measures,” JAMA 326, no. 7 (August 2021): 628-636, doi:10.1001/jama.2021.10413 ↩︎
  57. Jose F. Figueroa et al., “Quality of Care and Outcomes Among Medicare Advantage vs Fee-for-Service Medicare Patients Hospitalized With Heart Failure,” JAMA Cardiology 5, no. 12 (September 2020): 1349-1357, doi:10.1001/jamacardio.2020.3638 ↩︎
  58. Zhuliang Tao et al., “Impact of Out-of-Pocket Cost on Herpes Zoster Vaccine Uptake: An Observational Study in a Medicare Managed Care Population,” Vaccines 6, no. 4 (December 2018): 78, doi: 10.3390/vaccines6040078 ↩︎
  59. Justin W. Timbie et al., “Medicare Advantage and Fee‐for‐Service Performance on Clinical Quality and Patient Experience Measures: Comparisons from Three Large States,” Health Services Research 52, no. 6 (December 2017): 2038-2060, doi: 10.1111/1475-6773.12787 ↩︎
  60. Kenton J. Johnston, et al., “Association of Race and Ethnicity and Medicare Program Type With Ambulatory Care Access and Quality Measures,” JAMA 326, no. 7 (August 2021): 628-636, doi:10.1001/jama.2021.10413 ↩︎
  61. Sungchul Park, Jose F. Figueroa, Paul Fishman, and Norma B. Coe, “Primary Care Utilization and Expenditures in Traditional Medicare and Medicare Advantage, 2007–2016,” Journal of General Internal Medicine 35 (May 2020): 2480-2481, https://doi.org/10.1007/s11606-020-05826-x ↩︎
  62. Kenton J. Johnston, et al., “Association of Race and Ethnicity and Medicare Program Type With Ambulatory Care Access and Quality Measures,” JAMA 326, no. 7 (August 2021): 628-636, doi:10.1001/jama.2021.10413 ↩︎
  63. Justin W. Timbie et al., “Medicare Advantage and Fee‐for‐Service Performance on Clinical Quality and Patient Experience Measures: Comparisons from Three Large States,” Health Services Research 52, no. 6 (December 2017): 2038-2060, doi: 10.1111/1475-6773.12787 ↩︎
  64. Sungchul Park, Jose F. Figueroa, Paul Fishman, and Norma B. Coe, “Primary Care Utilization and Expenditures in Traditional Medicare and Medicare Advantage, 2007–2016,” Journal of General Internal Medicine 35 (May 2020): 2480-2481, https://doi.org/10.1007/s11606-020-05826-x ↩︎
  65. Kenton J. Johnston, et al., “Association of Race and Ethnicity and Medicare Program Type With Ambulatory Care Access and Quality Measures,” JAMA 326, no. 7 (August 2021): 628-636, doi:10.1001/jama.2021.10413 ↩︎
  66. Kenton J Johnston, et al., “Comparison of Ambulatory Care Access and Quality for Beneficiaries with Disabilities Covered by Medicare Advantage vs Traditional Medicare Insurance,” JAMA Health Forum 3, no. 1 (January 2022): e214562, doi:10.1001/jamahealthforum.2021.4562 ↩︎
  67. Chima Ndumele et al., “Differences in Hospitalizations Between Fee-for-Service and Medicare Advantage Beneficiaries,” Medical Care 57, no. 1 (January 2019): 8-12, DOI: 10.1097/MLR.0000000000001000 ↩︎
  68. Gretchen Jacobson, Aimee Cicchiello, Janet P. Sutton, and Arnav Shah, Medicare Advantage vs. Traditional Medicare: How Do Beneficiaries’ Characteristics and Experiences Differ? (Washington, DC: The Commonwealth Fund, October 2021), https://www.commonwealthfund.org/publications/issue-briefs/2021/oct/medicare-advantage-vs-traditional-medicare-beneficiaries-differ ↩︎
  69. Gretchen Jacobson, Aimee Cicchiello, Janet P. Sutton, and Arnav Shah, Medicare Advantage vs. Traditional Medicare: How Do Beneficiaries’ Characteristics and Experiences Differ? (Washington, DC: The Commonwealth Fund, October 2021), https://www.commonwealthfund.org/publications/issue-briefs/2021/oct/medicare-advantage-vs-traditional-medicare-beneficiaries-differ ↩︎
  70. Zachary Levinson and Julia Adler-Milstein, “A decade of experience for high-needs beneficiaries under Medicare Advantage,” Healthcare 8, no. 4 (December 2020): 100490, https://doi.org/10.1016/j.hjdsi.2020.100490 ↩︎
  71. Joseph P. Newhouse et al., “Delivery System Performance as Its Financial Risk Varies,” American Journal of Managed Care 25,  no. 12 (December 2019): e388-e394,  https://www.ncbi.nlm.nih.gov/pmc/articles/PMC7412600/ ↩︎
  72. Sungchul Park et al., “Health Care Utilization, Care Satisfaction, and Health Status for Medicare Advantage and Traditional Medicare Beneficiaries With and Without Alzheimer Disease and Related Dementias,” JAMA Network Open 3, no. 3 (March 2020): e201809, doi:10.1001/jamanetworkopen.2020.1809 ↩︎
  73. Aaron L. Schwartz et al., “Health Care Utilization and Spending in Medicare Advantage vs Traditional Medicare: A Difference-in-Differences Analysis,” JAMA Health Forum 2, no. 12 (December 2021):e214001, doi:10.1001/jamahealthforum.2021.4001 ↩︎
  74. Sungchul Park et al., “Differences in Health Care Utilization, Process of Diabetes Care, Care Satisfaction, and Health Status in Patients With Diabetes in Medicare Advantage Versus Traditional Medicare,” Medical Care 58, no. 11 (November 2020): 1004-1012, doi: 10.1097/MLR.0000000000001390 ↩︎
  75. Zachary Levinson and Julia Adler-Milstein, “A decade of experience for high-needs beneficiaries under Medicare Advantage,” Healthcare 8, no. 4 (December 2020): 100490, https://doi.org/10.1016/j.hjdsi.2020.100490 ↩︎
  76. Sungchul Park, “Effect of Medicare Advantage on health care use and care dissatisfaction in mental illness,” Health Services Research 57, no. 4 (February 2022): 820-829, https://doi.org/10.1111/1475-6773.13945 ↩︎
  77. Rachel Mosher Henke et al., “Medicare Advantage and Traditional Medicare Hospitalization Intensity and Readmissions,” Medical Care Research and Review 75 no. 4 (August 2018): 434-453, https://doi.org/10.1177%2F1077558717692103 ↩︎
  78. Brian J. Moore and Lan Liang, Medicare Advantage Versus the Traditional Medicare Program: Costs of Inpatient Stays, 2009–2017 (Rockville, MD:  Agency for Healthcare Research and Quality, August 2020), https://www.ncbi.nlm.nih.gov/books/NBK562007/ ↩︎
  79. Michael F Yayac, Samantha L Harrer, David A Janiec, and P Maxwell Courtney, “Costs and Outcomes of Medicare Advantage and Traditional Medicare Beneficiaries After Total Hip and Knee Arthroplasty,” Journal of the American Academy of Orthopaedic Surgeons 28, no. 20 (October 2020): e910-e916, DOI: 10.5435/JAAOS-D-19-00609 ↩︎
  80. Qijuan Li et al., “Regional Variations: The Use Of Hospitals, Home Health, And Skilled Nursing In Traditional Medicare And Medicare Advantage,” Health Affairs 37, no. 8 (August 2018): 1274-1281, https://doi.org/10.1377/hlthaff.2018.0147 ↩︎
  81. Aaron L. Schwartz et al., “Health Care Utilization and Spending in Medicare Advantage vs Traditional Medicare: A Difference-in-Differences Analysis,” JAMA Health Forum 2, no. 12 (December 2021):e214001, doi:10.1001/jamahealthforum.2021.4001 ↩︎
  82. Joan M. Teno et al. “Site of Death, Place of Care, and Health Care Transitions Among US Medicare Beneficiaries, 2000-2015,” JAMA 320 no. 3 (June 2018): 264-271, https://www.ncbi.nlm.nih.gov/pmc/articles/PMC6076888/ ↩︎
  83. Joan M. Teno et al., “Dying with dementia in Medicare Advantage, Accountable Care Organizations, or traditional Medicare,” Journal of the American Geriatrics Society 69, no. 10 (October 2021): 2802-2810, https://agsjournals.onlinelibrary.wiley.com/doi/10.1111/jgs.17225 ↩︎
  84. Sungchul Park, Joan M. Teno, Lindsay White, and Norma B. Coe, “Effect of Medicare Advantage on patterns of end-of-life care among Medicare decedents,” Health Services Research 57, no. 4 (February 2022): 863-871, https://doi.org/10.1111/1475-6773.13953 ↩︎
  85. Qijuan Li et al., “Regional Variations: The Use Of Hospitals, Home Health, And Skilled Nursing In Traditional Medicare And Medicare Advantage,” Health Affairs 37, no. 8 (August 2018): 1274-1281, https://doi.org/10.1377/hlthaff.2018.0147 ↩︎
  86. Sungchul Park et al., “Health Care Utilization, Care Satisfaction, and Health Status for Medicare Advantage and Traditional Medicare Beneficiaries With and Without Alzheimer Disease and Related Dementias,” JAMA Network Open 3, no. 3 (March 2020): e201809, doi:10.1001/jamanetworkopen.2020.1809 ↩︎
  87. Zachary Levinson and Julia Adler-Milstein, “A decade of experience for high-needs beneficiaries under Medicare Advantage,” Healthcare 8, no. 4 (December 2020): 100490, https://doi.org/10.1016/j.hjdsi.2020.100490 ↩︎
  88. Joseph P. Newhouse et al., “Delivery System Performance as Its Financial Risk Varies,” American Journal of Managed Care 25,  no. 12 (December 2019): e388-e394,  https://www.ncbi.nlm.nih.gov/pmc/articles/PMC7412600/ ↩︎
  89. Laura Skopec et al., “Home Health And Postacute Care Use In Medicare Advantage And Traditional Medicare,” Health Affairs 39 no. 5 (May 2020): 837-842, https://doi.org/10.1377/hlthaff.2019.00844 ↩︎
  90. Peter Huckfeldt et al., “Less Intense Postacute Care, Better Outcomes For Enrollees In Medicare Advantage Than Those In Fee-For-Service,” Health Affairs 36, no. 1 (January 2017): 91-100, https://doi.org/10.1377/hlthaff.2016.1027 ↩︎
  91. Jose F. Figueroa et al., “Quality of Care and Outcomes Among Medicare Advantage vs Fee-for-Service Medicare Patients Hospitalized With Heart Failure,” JAMA Cardiology 5, no. 12 (September 2020): 1349-1357, doi:10.1001/jamacardio.2020.3638 ↩︎
  92. Ying Cao et al., “Assessment of Differences in Inpatient Rehabilitation Services for Length of Stay and Health Outcomes Between US Medicare Advantage and Traditional Medicare Beneficiaries,” JAMA Network Open 3, no. 3 (March 2020): e201204, doi:10.1001/jamanetworkopen.2020.1204 ↩︎
  93. Amit Kumar et al., “Comparing post-acute rehabilitation use, length of stay, and outcomes experienced by Medicare fee-for-service and Medicare Advantage beneficiaries with hip fracture in the United States: A secondary analysis of administrative data,” Plos Medicine 15 no. 6 (June 2018): e1002592, https://doi.org/10.1371/journal.pmed.1002592 ↩︎
  94. Michael F Yayac, Samantha L Harrer, David A Janiec, and P Maxwell Courtney, “Costs and Outcomes of Medicare Advantage and Traditional Medicare Beneficiaries After Total Hip and Knee Arthroplasty,” Journal of the American Academy of Orthopaedic Surgeons 28, no. 20 (October 2020): e910-e916, DOI: 10.5435/JAAOS-D-19-00609 ↩︎
  95. Amit Kumar et al., “Comparing post-acute rehabilitation use, length of stay, and outcomes experienced by Medicare fee-for-service and Medicare Advantage beneficiaries with hip fracture in the United States: A secondary analysis of administrative data,” Plos Medicine 15 no. 6 (June 2018): e1002592, https://doi.org/10.1371/journal.pmed.1002592 ↩︎
  96. Ying Cao et al., “Assessment of Differences in Inpatient Rehabilitation Services for Length of Stay and Health Outcomes Between US Medicare Advantage and Traditional Medicare Beneficiaries,” JAMA Network Open 3, no. 3 (March 2020): e201204, doi:10.1001/jamanetworkopen.2020.1204 ↩︎
  97. Peter Huckfeldt et al., “Less Intense Postacute Care, Better Outcomes For Enrollees In Medicare Advantage Than Those In Fee-For-Service,” Health Affairs 36, no. 1 (January 2017): 91-100, https://doi.org/10.1377/hlthaff.2016.1027 ↩︎
  98. Emiley Chang et al., “Differences in Nursing Home Quality Between Medicare Advantage and Traditional Medicare Patients,” Journal of the American Medical Directors Association 17, no. 10 (October 2016): 960.e9-960e14, https://doi.org/10.1016/j.jamda.2016.07.017 ↩︎
  99. Adrianne W. Casebeer et al., “A Comparison of Home Health Utilization, Outcomes, and Cost Between Medicare Advantage and Traditional Medicare,” Medical Care 60, no. 1 (January 2022): 66-74, https://doi.org/10.1097/MLR.0000000000001661 ↩︎
  100. Sungchul Park et al., “Differences in Health Care Utilization, Process of Diabetes Care, Care Satisfaction, and Health Status in Patients With Diabetes in Medicare Advantage Versus Traditional Medicare,” Medical Care 58, no. 11 (November 2020): 1004-1012, doi: 10.1097/MLR.0000000000001390 ↩︎
  101. Sungchul Park et al., “Health Care Utilization, Care Satisfaction, and Health Status for Medicare Advantage and Traditional Medicare Beneficiaries With and Without Alzheimer Disease and Related Dementias,” JAMA Network Open 3, no. 3 (March 2020): e201809, doi:10.1001/jamanetworkopen.2020.1809 ↩︎
  102. Laura Skopec et al., “Home Health And Postacute Care Use In Medicare Advantage And Traditional Medicare,” Health Affairs 39 no. 5 (May 2020): 837-842, https://doi.org/10.1377/hlthaff.2019.00844 ↩︎
  103. Lacey Loomer, Cyrus M. Kosar, David J. Meyers, and Kali S. Thomas, “Comparing Receipt of Prescribed Post-acute Home Health Care Between Medicare Advantage and Traditional Medicare Beneficiaries: an Observational Study,” Journal of General Internal Medicine 36 (October 2020): 2323–2331, https://doi.org/10.1007/s11606-020-06282-3 ↩︎
  104. Laura Skopec et al., “Home Health Use In Medicare Advantage Compared To Use In Traditional Medicare,” Health Affairs 39, no. 6 (June 2020): 1072–1079, https://doi.org/10.1377/hlthaff.2019.01091 ↩︎
  105. Daniel Waxman et al., “Does Medicare Advantage Enrollment Affect Home Healthcare Use?” American Journal of Managed Care 22, no. 11 (November 2016): 714-720, https://www.ajmc.com/view/does-medicare-advantage-enrollment-affect-home-healthcare-use ↩︎
  106. Kali S Thomas et al., “Home Health Use Following a Cancer Diagnosis Among Patients Enrolled in Medicare Advantage and Traditional Medicare: Findings From the Newly Linked SEER-Medicare and Home Health OASIS Data,” JNCI Monographs 2020, no. 55 (May 2020): 53-59, https://doi.org/10.1093/jncimonographs/lgaa003 ↩︎
  107. Stephen Zuckerman et al, Changes in Home Health Care Use in Medicare Advantage Compared to Traditional Medicare, 2011-2016 (Office of the Assistant Secretary for Planning and Evaluation, October 2020), https://aspe.hhs.gov/reports/changes-home-health-care-use-medicare-advantage-compared-traditional-medicare-2011-2016 ↩︎
  108. Stephen Zuckerman et al., Changes in Home Health Care Use in Medicare Advantage Compared to Traditional Medicare, 2011-2016 (Office of the Assistant Secretary for Planning and Evaluation, October 2020), https://aspe.hhs.gov/reports/changes-home-health-care-use-medicare-advantage-compared-traditional-medicare-2011-2016 ↩︎
  109. Zachary Levinson and Julia Adler-Milstein, “A decade of experience for high-needs beneficiaries under Medicare Advantage,” Healthcare 8, no. 4 (December 2020): 100490, https://doi.org/10.1016/j.hjdsi.2020.100490 ↩︎
  110. Kali S Thomas et al., “Home Health Use Following a Cancer Diagnosis Among Patients Enrolled in Medicare Advantage and Traditional Medicare: Findings From the Newly Linked SEER-Medicare and Home Health OASIS Data,” JNCI Monographs 2020, no. 55 (May 2020): 53-59, https://doi.org/10.1093/jncimonographs/lgaa003 ↩︎
  111. Daniel Waxman et al., “Does Medicare Advantage Enrollment Affect Home Healthcare Use?” American Journal of Managed Care 22, no. 11 (November 2016): 714-720, https://www.ajmc.com/view/does-medicare-advantage-enrollment-affect-home-healthcare-use ↩︎
  112. Laura Skopec et al., “Home Health Use In Medicare Advantage Compared To Use In Traditional Medicare,” Health Affairs 39, no. 6 (June 2020): 1072–1079, https://doi.org/10.1377/hlthaff.2019.01091 ↩︎
  113. Qijuan Li et al., “Regional Variations: The Use Of Hospitals, Home Health, And Skilled Nursing In Traditional Medicare And Medicare Advantage,” Health Affairs 37, no. 8 (August 2018): 1274-1281, https://doi.org/10.1377/hlthaff.2018.0147 ↩︎
  114. Stephen Zuckerman et al., Changes in Home Health Care Use in Medicare Advantage Compared to Traditional Medicare, 2011-2016 (Office of the Assistant Secretary for Planning and Evaluation, October 2020), https://aspe.hhs.gov/reports/changes-home-health-care-use-medicare-advantage-compared-traditional-medicare-2011-2016 ↩︎
  115. Stephen Zuckerman et al., Changes in Home Health Care Use in Medicare Advantage Compared to Traditional Medicare, 2011-2016 (Office of the Assistant Secretary for Planning and Evaluation, October 2020), https://aspe.hhs.gov/reports/changes-home-health-care-use-medicare-advantage-compared-traditional-medicare-2011-2016 ↩︎
  116. Daniel Waxman et al., “Does Medicare Advantage Enrollment Affect Home Healthcare Use?” American Journal of Managed Care 22, no. 11 (November 2016): 714-720, https://www.ajmc.com/view/does-medicare-advantage-enrollment-affect-home-healthcare-use ↩︎
  117. Adrianne W. Casebeer et al., “A Comparison of Home Health Utilization, Outcomes, and Cost Between Medicare Advantage and Traditional Medicare,” Medical Care 60, no. 1 (January 2022): 66-74, https://doi.org/10.1097/MLR.0000000000001661 ↩︎
  118. Daniel Waxman et al., “Does Medicare Advantage Enrollment Affect Home Healthcare Use?” American Journal of Managed Care 22, no. 11 (November 2016): 714-720, https://www.ajmc.com/view/does-medicare-advantage-enrollment-affect-home-healthcare-use ↩︎
  119. Sungchul Park, Jose F. Figueroa, Paul Fishman, and Norma B. Coe, “Primary Care Utilization and Expenditures in Traditional Medicare and Medicare Advantage, 2007–2016,” Journal of General Internal Medicine 35 (May 2020): 2480-2481, https://doi.org/10.1007/s11606-020-05826-x ↩︎
  120. Aaron L. Schwartz et al., “Health Care Utilization and Spending in Medicare Advantage vs Traditional Medicare: A Difference-in-Differences Analysis,” JAMA Health Forum 2, no. 12 (December 2021):e214001, doi:10.1001/jamahealthforum.2021.4001 ↩︎
  121. Sungchul Park et al., “Differences in Health Care Utilization, Process of Diabetes Care, Care Satisfaction, and Health Status in Patients With Diabetes in Medicare Advantage Versus Traditional Medicare,” Medical Care 58, no. 11 (November 2020): 1004-1012, doi: 10.1097/MLR.0000000000001390 ↩︎
  122. Sungchul Park et al., “Health Care Utilization, Care Satisfaction, and Health Status for Medicare Advantage and Traditional Medicare Beneficiaries With and Without Alzheimer Disease and Related Dementias,” JAMA Network Open 3, no. 3 (March 2020): e201809, doi:10.1001/jamanetworkopen.2020.1809 ↩︎
  123. Sungchul Park, “Effect of Medicare Advantage on health care use and care dissatisfaction in mental illness,” Health Services Research 57, no. 4 (February 2022): 820-829, https://doi.org/10.1111/1475-6773.13945 ↩︎
  124. Zachary Levinson and Julia Adler-Milstein, “A decade of experience for high-needs beneficiaries under Medicare Advantage,” Healthcare 8, no. 4 (December 2020): 100490, https://doi.org/10.1016/j.hjdsi.2020.100490 ↩︎
  125. Sungchul Park, “Effect of Medicare Advantage on health care use and care dissatisfaction in mental illness,” Health Services Research 57, no. 4 (February 2022): 820-829, https://doi.org/10.1111/1475-6773.13945 ↩︎
  126. Gretchen Jacobson, Aimee Cicchiello, Janet P. Sutton, and Arnav Shah, Medicare Advantage vs. Traditional Medicare: How Do Beneficiaries’ Characteristics and Experiences Differ? (Washington, DC: The Commonwealth Fund, October 2021), https://www.commonwealthfund.org/publications/issue-briefs/2021/oct/medicare-advantage-vs-traditional-medicare-beneficiaries-differ ↩︎
  127. Joseph P. Newhouse et al., “Delivery System Performance as Its Financial Risk Varies,” American Journal of Managed Care 25, no. 12 (December 2019): e388-e394,  https://www.ncbi.nlm.nih.gov/pmc/articles/PMC7412600/ ↩︎
  128. Aaron L. Schwartz et al., “Health Care Utilization and Spending in Medicare Advantage vs Traditional Medicare: A Difference-in-Differences Analysis,” JAMA Health Forum 2, no. 12 (December 2021):e214001, doi:10.1001/jamahealthforum.2021.4001 ↩︎
  129. Kelly E. Anderson, Daniel Polsky, Sydney Dy, and Aditi P. Sen, “Prescribing of low- versus high-cost Part B drugs in Medicare Advantage and traditional Medicare,” Health Services Research 57, no. 3 (November 2021): 1-11, https://doi.org/10.1111/1475-6773.13912 ↩︎
  130. Sungchul Park et al., “Differences in Health Care Utilization, Process of Diabetes Care, Care Satisfaction, and Health Status in Patients With Diabetes in Medicare Advantage Versus Traditional Medicare,” Medical Care 58, no. 11 (November 2020): 1004-1012, doi: 10.1097/MLR.0000000000001390 ↩︎
  131. Sungchul Park et al., “Health Care Utilization, Care Satisfaction, and Health Status for Medicare Advantage and Traditional Medicare Beneficiaries With and Without Alzheimer Disease and Related Dementias,” JAMA Network Open 3, no. 3 (March 2020): e201809, doi:10.1001/jamanetworkopen.2020.1809 ↩︎
  132. Sungchul Park, “Effect of Medicare Advantage on health care use and care dissatisfaction in mental illness,” Health Services Research 57, no. 4 (February 2022): 820-829, https://doi.org/10.1111/1475-6773.13945 ↩︎
  133. LC Baker, MK Bundorf, and DP Kessler, “The Effects of Medicare Advantage on Opioid Use,” Journal of Health Economics 70 (March 2020), doi: 10.1016/j.jhealeco.2019.102278 ↩︎
  134. Zachary Levinson and Julia Adler-Milstein, “A decade of experience for high-needs beneficiaries under Medicare Advantage,” Healthcare 8, no. 4 (December 2020): 100490, https://doi.org/10.1016/j.hjdsi.2020.100490 ↩︎
  135. Paul Jacobs and Jayasree Basu, “Medicare Advantage and Postdischarge Quality: Evidence From Hospital Readmissions,” American Journal of Managed Care 26, no. 12 (December 2020), https://www.ajmc.com/view/medicare-advantage-and-postdischarge-quality-evidence-from-hospital-readmissions ↩︎
  136. Peter Huckfeldt et al., “Less Intense Postacute Care, Better Outcomes For Enrollees In Medicare Advantage Than Those In Fee-For-Service,” Health Affairs 36, no. 1 (January 2017): 91-100, https://doi.org/10.1377/hlthaff.2016.1027 ↩︎
  137. Amit Kumar et al., “Comparing post-acute rehabilitation use, length of stay, and outcomes experienced by Medicare fee-for-service and Medicare Advantage beneficiaries with hip fracture in the United States: A secondary analysis of administrative data,” Plos Medicine 15 no. 6 (June 2018): e1002592, https://doi.org/10.1371/journal.pmed.1002592 ↩︎
  138. Daniel Jung et al., “Likelihood of hospital readmission in Medicare Advantage and Fee‐For‐Service within same hospital,” Health Services Research 55, no. 4 (August 2020): 587-595, https://doi.org/10.1111/1475-6773.13315 ↩︎
  139. Maricruz Rivera-Hernandez, Momotazur Rahman, Vincent Mor, and Amal N. Trivedi, “Racial disparities in readmission rates among patients discharged to skilled nursing facilities,” Journal of the American Geriatrics Society 67 no. 8 (August 2019): 1672-1679, doi: 10.1111/jgs.15960 ↩︎
  140. Laura Skopec et al., “Home Health And Postacute Care Use In Medicare Advantage And Traditional Medicare,” Health Affairs 39 no. 5 (May 2020): 837-842, https://doi.org/10.1377/hlthaff.2019.00844 ↩︎
  141. Justin W. Timbie et al., “Medicare Advantage and Fee‐for‐Service Performance on Clinical Quality and Patient Experience Measures: Comparisons from Three Large States,” Health Services Research 52, no. 6 (December 2017): 2038-2060, doi: 10.1111/1475-6773.12787 ↩︎
  142. Amit Kumar et al., “Comparing post-acute rehabilitation use, length of stay, and outcomes experienced by Medicare fee-for-service and Medicare Advantage beneficiaries with hip fracture in the United States: A secondary analysis of administrative data,” Plos Medicine 15 no. 6 (June 2018): e1002592, https://doi.org/10.1371/journal.pmed.1002592 [cxlii] Daniel Jung et al., “Likelihood of hospital readmission in Medicare Advantage and Fee‐For‐Service within same hospital,” Health Services Research 55, no. 4 (August 2020): 587-595, https://doi.org/10.1111/1475-6773.13315 ↩︎
  143. Maricruz Rivera-Hernandez, Momotazur Rahman, Vincent Mor, and Amal N. Trivedi, “Racial disparities in readmission rates among patients discharged to skilled nursing facilities,” Journal of the American Geriatrics Society 67 no. 8 (August 2019): 1672-1679, doi: 10.1111/jgs.15960 ↩︎
  144. Peter Huckfeldt et al., “Less Intense Postacute Care, Better Outcomes For Enrollees In Medicare Advantage Than Those In Fee-For-Service,” Health Affairs 36, no. 1 (January 2017): 91-100, https://doi.org/10.1377/hlthaff.2016.1027 ↩︎
  145. Laura Skopec et al., “Home Health And Postacute Care Use In Medicare Advantage And Traditional Medicare,” Health Affairs 39 no. 5 (May 2020): 837-842, https://doi.org/10.1377/hlthaff.2019.00844 ↩︎
  146. Daniel Jung et al., “Likelihood of hospital readmission in Medicare Advantage and Fee‐For‐Service within same hospital,” Health Services Research 55, no. 4 (August 2020): 587-595, https://doi.org/10.1111/1475-6773.13315 ↩︎
  147. Justin W. Timbie et al., “Medicare Advantage and Fee‐for‐Service Performance on Clinical Quality and Patient Experience Measures: Comparisons from Three Large States,” Health Services Research 52, no. 6 (December 2017): 2038-2060, doi: 10.1111/1475-6773.12787 ↩︎
  148. Paul Jacobs and Jayasree Basu, “Medicare Advantage and Postdischarge Quality: Evidence From Hospital Readmissions,” American Journal of Managed Care 26, no. 12 (December 2020), https://www.ajmc.com/view/medicare-advantage-and-postdischarge-quality-evidence-from-hospital-readmissions ↩︎
  149. Yue Li et al., “Medicare Advantage Associated With More Racial Disparity Than Traditional Medicare For Hospital Readmissions,” Health Affairs 36, no. 7 (July 2017): 1328-1335, https://doi.org/10.1377/hlthaff.2016.1344 ↩︎
  150. Michael F Yayac, Samantha L Harrer, David A Janiec, and P Maxwell Courtney, “Costs and Outcomes of Medicare Advantage and Traditional Medicare Beneficiaries After Total Hip and Knee Arthroplasty,” Journal of the American Academy of Orthopaedic Surgeons 28, no. 20 (October 2020): e910-e916, DOI: 10.5435/JAAOS-D-19-00609 ↩︎
  151. Joobong June Park Oh, “Analysis of Hospital Readmission Patterns in Medicare Fee-for-Service and Medicare Advantage Beneficiaries,” Professional Case Management 22, no. 1 (January/February 2017): 10-20, doi: 10.1097/NCM.0000000000000172 ↩︎
  152. Rachel Mosher Henke et al., “Medicare Advantage and Traditional Medicare Hospitalization Intensity and Readmissions,” Medical Care Research and Review 75 no. 4 (August 2018): 434-453, https://doi.org/10.1177%2F1077558717692103 ↩︎
  153. Rachel Mosher Henke et al., “Medicare Advantage and Traditional Medicare Hospitalization Intensity and Readmissions,” Medical Care Research and Review 75 no. 4 (August 2018): 434-453, https://doi.org/10.1177%2F1077558717692103 ↩︎
  154. Joobong June Park Oh, “Analysis of Hospital Readmission Patterns in Medicare Fee-for-Service and Medicare Advantage Beneficiaries,” Professional Case Management 22, no. 1 (January/February 2017): 10-20, doi: 10.1097/NCM.0000000000000172 ↩︎
  155. Michael F Yayac, Samantha L Harrer, David A Janiec, and P Maxwell Courtney, “Costs and Outcomes of Medicare Advantage and Traditional Medicare Beneficiaries After Total Hip and Knee Arthroplasty,” Journal of the American Academy of Orthopaedic Surgeons 28, no. 20 (October 2020): e910-e916, DOI: 10.5435/JAAOS-D-19-00609 ↩︎
  156. Yue Li et al., “Medicare Advantage Associated With More Racial Disparity Than Traditional Medicare For Hospital Readmissions,” Health Affairs 36, no. 7 (July 2017): 1328-1335, https://doi.org/10.1377/hlthaff.2016.1344 ↩︎
  157. Orestis A. Panagiotou et al., “Hospital Readmission Rates in Medicare Advantage and Traditional Medicare: A Retrospective Population-Based Analysis,” Annals of Internal Medicine 171, no. 2 (July 2019): 99-106, doi: 10.7326/M18-1795 ↩︎
  158. Maricruz Rivera-Hernandez, Momotazur Rahman, Vincent Mor, and Amal N. Trivedi, “Racial disparities in readmission rates among patients discharged to skilled nursing facilities,” Journal of the American Geriatrics Society 67 no. 8 (August 2019): 1672-1679, doi: 10.1111/jgs.15960 ↩︎
  159. Yue Li et al., “Medicare Advantage Associated With More Racial Disparity Than Traditional Medicare For Hospital Readmissions,” Health Affairs 36, no. 7 (July 2017): 1328-1335, https://doi.org/10.1377/hlthaff.2016.1344 ↩︎
  160. Maricruz Rivera-Hernandez, Momotazur Rahman, Vincent Mor, and Amal N. Trivedi, “Racial disparities in readmission rates among patients discharged to skilled nursing facilities,” Journal of the American Geriatrics Society 67 no. 8 (August 2019): 1672-1679, doi: 10.1111/jgs.15960 ↩︎
  161. Yue Li et al., “Medicare Advantage Associated With More Racial Disparity Than Traditional Medicare For Hospital Readmissions,” Health Affairs 36, no. 7 (July 2017): 1328-1335, https://doi.org/10.1377/hlthaff.2016.1344 ↩︎
  162. William B. Weeks et al., “Ambulatory Care Sensitive Condition Admission Rates in Younger and Older Traditional Medicare and Medicare Advantage Populations, 2011–2019,” Journal of General Internal Medicine 18 (June 2021), https://doi.org/10.1007/s11606-021-06955-7 ↩︎
  163. Sungchul Park et al., “Racial Disparities in Avoidable Hospitalizations in Traditional Medicare and Medicare Advantage,” Medical Care 59 no. 11 (November 2021):989-996, doi:10.1097/MLR.0000000000001632 ↩︎
  164. Sungchul Park et al., “Racial Disparities in Avoidable Hospitalizations in Traditional Medicare and Medicare Advantage,” Medical Care 59 no. 11 (November 2021):989-996, doi:10.1097/MLR.0000000000001632 ↩︎
  165. David Meyers et al., “Comparison of the Quality of Hospitals That Admit Medicare Advantage Patients vs Traditional Medicare Patients,” JAMA 3 no. 1 (January 2020): e1919310, doi:10.1001/jamanetworkopen.2019.19310 ↩︎
  166. Daeho Kim et al. “Comparison of the Use of Top-Ranked Cancer Hospitals Between Medicare Advantage and Traditional Medicare,” The American Journal of Managed Care 27, no. 10 (October 2021): https://www.ajmc.com/view/comparison-of-the-use-of-top-ranked-cancer-hospitals-between-medicare-advantage-and-traditional-medicare ↩︎
  167. Margot Schwartz et al., “Quality of Home Health Agencies Serving Traditional Medicare vs Medicare Advantage Beneficiaries,” JAMA 2 no. 9 (September 2019): e1910622, doi:10.1001/jamanetworkopen.2019.10622 ↩︎
  168. Laura Skopec et al., “Home Health Use In Medicare Advantage Compared To Use In Traditional Medicare,” Health Affairs 39, no. 6 (June 2020): 1072–1079, https://doi.org/10.1377/hlthaff.2019.01091 ↩︎
  169. David J. Meyers, Vincent Mor, and Momotazur Rahman, “Medicare Advantage Enrollees More Likely To Enter Lower-Quality Nursing Homes Compared To Fee-For-Service Enrollees,” Health Affairs 37, no. 1 (January 2018): 78-85, https://doi.org/10.1377/hlthaff.2017.0714 ↩︎
  170. Emiley Chang et al., “Differences in Nursing Home Quality Between Medicare Advantage and Traditional Medicare Patients,” Journal of the American Medical Directors Association 17, no. 10 (October 2016): 960.e9-960e14, https://doi.org/10.1016/j.jamda.2016.07.017 ↩︎
  171. Jose F. Figueroa et al., “Quality of Care and Outcomes Among Medicare Advantage vs Fee-for-Service Medicare Patients Hospitalized With Heart Failure,” JAMA Cardiology 5, no. 12 (September 2020): 1349-1357, doi:10.1001/jamacardio.2020.3638 ↩︎
  172. Jose F. Figueroa et al., “Differences in Management of Coronary Artery Disease in Patients With Medicare Advantage vs Traditional Fee-for-Service Medicare Among Cardiology Practices,” JAMA Cardiology 4, no. 3 (February 2019): 265-271, doi:10.1001/jamacardio.2019.0007 ↩︎
  173. Sungchul Park et al., “Differences in Health Care Utilization, Process of Diabetes Care, Care Satisfaction, and Health Status in Patients With Diabetes in Medicare Advantage Versus Traditional Medicare,” Medical Care 58, no. 11 (November 2020): 1004-1012, doi: 10.1097/MLR.0000000000001390 ↩︎
  174. Bruce E. Landon, Alan M. Zaslavsky, Jeffrey Souza, and John Z. Ayanian, “Use of Diabetes Medications in Traditional Medicare and Medicare Advantage,” The American Journal of Managed Care 27, no. 3 (March 2021), https://www.ajmc.com/view/use-of-diabetes-medications-in-traditional-medicare-and-medicare-advantage ↩︎
  175. Justin W. Timbie et al., “Medicare Advantage and Fee‐for‐Service Performance on Clinical Quality and Patient Experience Measures: Comparisons from Three Large States,” Health Services Research 52, no. 6 (December 2017): 2038-2060, doi: 10.1111/1475-6773.12787 ↩︎
  176. Elham Mahmoudi, Wassim Tarraf, Brianna L. Maroukis, and Helen G. Levy, “Does Medicare Managed Care Reduce Racial/Ethnic Disparities in Diabetes Preventive Care and Healthcare Expenditures?” American Journal of Managed Care 22, no. 10 (October 2016): e360-e367, https://www.ajmc.com/view/does-medicare-managed-care-reduce-racial-ethnic-disparities-in-diabetes ↩︎
  177. Brian W. Powers et al., “The Beneficial Effects Of Medicare Advantage Special Needs Plans For Patients With End-Stage Renal Disease,” Health Affairs 39, no. 9 (September 2020): 1486-1494, https://doi.org/10.1377/hlthaff.2019.01793 ↩︎
  178. Justin W. Timbie et al., “Medicare Advantage and Fee‐for‐Service Performance on Clinical Quality and Patient Experience Measures: Comparisons from Three Large States,” Health Services Research 52, no. 6 (December 2017): 2038-2060, doi: 10.1111/1475-6773.12787 ↩︎
  179. Sungchul Park et al., “Trends in Use of Low-Value Care in Traditional Fee-for-Service Medicare and Medicare Advantage,” JAMA Network Open, 4 no. 3 (March 2021): e211762, doi:10.1001/jamanetworkopen.2021.1762 ↩︎
  180. Sungchul Park et al., “Trends in Use of Low-Value Care in Traditional Fee-for-Service Medicare and Medicare Advantage,” JAMA Network Open, 4 no. 3 (March 2021): e211762, doi:10.1001/jamanetworkopen.2021.1762 ↩︎
  181. David Meyers et al., “Analysis of Drivers of Disenrollment and Plan Switching Among Medicare Advantage Beneficiaries,” JAMA Internal Medicine 179, no. 4 (February 2019): 524-532, doi:10.1001/jamainternmed.2018.7639 ↩︎
  182. Aaron L. Schwartz et al., “Health Care Utilization and Spending in Medicare Advantage vs Traditional Medicare: A Difference-in-Differences Analysis,” JAMA Health Forum 2, no. 12 (December 2021):e214001, doi:10.1001/jamahealthforum.2021.4001 ↩︎
News Release

Analysis: There is Significant Variation in State and Local Eligibility Criteria for Monkeypox Vaccines, and Vaccine Information is not Always Accessible

Published: Sep 16, 2022

According to a new KFF analysis assessing monkeypox (MPX) vaccine eligibility across the United States, people who are exposed or presumed exposed to MPX are generally eligible to get a vaccine across the country. However, eligibility varies across the United States for certain workers, including laboratory staff and others who might be at increased risk.

The analysis examines MPX vaccine eligibility policies, compared to criteria recommended by the Centers for Disease Control and Prevention (CDC), in the 50 states, Washington, DC, and five cities that receive vaccines from the federal government (Chicago, Houston, Los Angeles, New York City, and Philadelphia) as of Sept. 12.

KFF finds that vaccine eligibility varies significantly across states, with several, including Illinois, Indiana, Maryland, and New Mexico, appearing to lack clear criteria or information about who is eligible or where to get vaccinated.

Key findings include:

  • People in 52 of the 56 states and cities are eligible for vaccination after being exposed to the virus. However, Illinois and New Mexico do not detail eligibility criteria online. In addition, South Carolina and the District of Columbia do not explicitly say they are offering vaccination to people with known exposure, but both offer vaccination to those with suspected or likely exposure and go beyond what CDC recommends.
  • People in 51 of the states and cities are eligible for vaccination not just after exposure, but also after presumed exposure because of their risk factors or recent experiences. This includes 37 that specifically identify gay, bisexual, and other men who have sex with men. As recommended by the CDC, some states and cities also include transgender and non-binary people who have sex with men.
  • Certain laboratory workers and health care workers who may be exposed because of occupational risk are eligible for vaccination in 18 of the states and cities.
  • Twenty-four of the states and cities provide broader eligibility for vaccination, going beyond CDC’s current approach, including 19 that offer vaccinations to anyone at increased sexual risk (not limited to men who have sex with men, transgender or gender non-conforming individuals), and 16 that offer vaccination to anyone engaged in sex work.

The significant variation in MPX eligibility across the country means that people who are at high risk of contracting the virus may have access to vaccination in one state or city, while someone with a similar risk profile in a different region would not. Further, information about who can get vaccinated and where to find vaccines is sometimes sparse. This kind of variation could have an impact on infection rates as well as how equitable the vaccine roll-out is, particularly as new MPX cases are more concentrated among men of color who have sex with men.

Assessing Monkeypox (MPX) Vaccine Eligibility Across the United States

Authors: Lindsey Dawson, Jennifer Kates, Tatyana Roberts, and Anna Rouw
Published: Sep 16, 2022

Background

The current monkeypox (MPX) outbreak continues in the U.S., with more than 22,000 cases having been confirmed in less than five months, and likely many more yet to be diagnosed. While cases seem to be declining somewhat, they continue at a high level. The World Health Organization (WHO) declared the current outbreak to be a Public Health Emergency of International Concern on July 23, 2022 and the U.S. Department of Health and Human Services (HHS) declared MPX to be a national public health emergency on August 4, 2022. Vaccines are a key component of the public health response to the outbreak. The federal government announced plans to begin providing MPX vaccines to state and local jurisdictions from the Strategic National Stockpile (SNS) in June and has been ramping up supply and distribution since, primarily focusing on JYNNEOS, the preferred vaccine due to its safer profile compared with the other available vaccine (ACAM2000). JYNNEOS is being allocated to jurisdictions “to meet the needs of at-risk individuals and [HHS has] prioritize[d] the hardest-hit jurisdictions, which have high case burden and transmission rates for monkeypox” and the largest at-risk communities. Most of those affected and at risk to date are gay and bisexual men and other men who have sex with men (MSM).

While supply has increased over time, supply challenges hampered the initial roll out and continue in some areas of the country. Given who is at most risk and supply limitations, Centers for Disease Control and Prevention (CDC) guidance to jurisdictions for determining MPX vaccine eligibility currently focuses on the following priorities (also see Table 1): post-exposure prophylaxis, or PEP (vaccination after a known exposure) as well as expanded post-exposure prophylaxis and PEP++ (vaccination for those with actual or presumed exposure due to their risk factors or recent experiences). A third strategy, pre-exposure prophylaxis, or PrEP, for specific groups who might be at risk due to occupational exposure (e.g., laboratory workers) is also identified, though not prioritized at this time.  Still, each jurisdiction determines its own distribution approach, including its eligibility criteria, and which groups are prioritized for vaccination.

We sought to assess vaccine eligibility criteria across the country, focusing on state and local jurisdictions that receive direct vaccine allocations from the federal government, including all 50 states, Washington, D.C. and five cities (Chicago, Houston, Los Angeles, New York City, and Philadelphia). We compared local eligibility criteria to the approach recommended by CDC, and identified which groups and/or situations are being prioritized for vaccination. We also assessed the extent to which information on vaccine eligibility was clearly available. Our analysis is a point in time assessment, with data as of September 12, 2022, and as such it is possible that criteria may have changed. Links to source documents are included.

Overall, we find that almost all jurisdictions have adopted PEP and PEP++ vaccination strategies, with a much smaller number employing PrEP as currently defined by CDC.  However, there is substantial variation in how eligibility is defined within, and in some cases beyond, these categories. Additionally, several jurisdictions lack clear criteria or information about who is eligible or where to get vaccinated. Such variation has implications for access and may affect how equitable roll-out of vaccination is across the country, particularly as new MPX cases are increasingly concentrated among MSM of color.

Table 1: Centers for Disease Control and Prevention (CDC) Monkeypox Vaccination Strategies

Findings

As of September 12, across the 56 jurisdictions assessed, we find that:

  •  Almost all jurisdictions assessed (52 of 56) indicate that they are offering PEP (vaccination for those with known contacts). Among the four remaining jurisdictions, two (Illinois and New Mexico) do not provide detail regarding eligibility criteria in any category. The other two (D.C. and South Carolina) do not clearly state whether they are offering vaccination to those with known contacts but both offer vaccination to those with suspected or likely contacts (and actually go beyond the CDC approach in some ways); while this implies that known contacts are eligible for vaccination, the criteria are not clear on this point.
  • Similarly, almost all jurisdictions (51 of 56) offer PEP++ (vaccination not just after exposure, but also after presumed exposure due to risk factors or recent experiences).
    • This includes 37 that specifically identify gay, bisexual, and other MSM, and in some cases also include transgender and non-binary individuals, as recommended by CDC.
    • In some cases, individuals in these groups are also required to meet additional criteria following the approach laid out by the CDC, such as limiting eligibility for MSM to those who use dating apps, have had more than one sex partner in the last 14 days and/or have visited sexual venues (saunas, sex parties, bathhouses, etc.), or are HIV PrEP users.
  • A smaller number of jurisdictions (18) indicate that they are offering MPX PrEP for health care workers who may be exposed due to occupational risk. These individuals were typically laboratory workers performing MPX testing or clinicians collecting MPX specimens, but sometimes a broader approach was taken.
  • There are also many jurisdictions (24 of 56) that go beyond the CDC-defined categories to provide broader eligibility for vaccination in stand-alone categories as follows:
    • Seven offer vaccination to anyone considered to be at increased or general risk (not defined further).
    • Nineteen offer vaccinations to anyone at increased sexual risk specifically (e.g., not limited to men who have sex with men, transgender or gender non-conforming individuals).
    • Sixteen offer vaccination to anyone engaged in sex work (and in some cases, to those working in commercial sex venues).
    • Nine offer vaccination to anyone who has HIV, most of which also include someone who has had a recent STI. An additional 15 prioritize vaccination or emphasize the importance of vaccination among people with HIV but do not include people living with HIV as a clear eligibility group.
    • Eleven offer vaccination to anyone using HIV PrEP.
    • Others offer vaccination to additional groups of individuals considered to be at increased risk such as intravenous drug users (1); those in local jails or people who have been recently incarcerated (2); and those experiencing homelessness (3 as an eligible population and 1 as a prioritized population).
  • Additionally, several jurisdictions allow for more local or provider-specific eligibility determinations. Eight specify that eligibility may be determined on a case-by-case basis, even when, in some cases, other eligibility groups are defined, and eight devolve all or some eligibility decision-making to local health departments or authorities.
  • In terms of signing up for a vaccination appointment or identifying where vaccination is being offered, we found mixed results. Many jurisdictions provide links for sign-ups, though some are for “pre-registration” only. Several instruct individuals to reach out to their local health departments or provider. In some of these cases, local health department contact information is provided, or a list of community-based vaccine sites and contact information. Other jurisdictions provide a health department phone number to call for additional information, eligibility screening, or for making an appointment. Jurisdictions often provide more than one of these options. However, in other cases, information on how to sign-up is less clear. For example, it is somewhat common for individuals to be instructed to reach out to their local health departments for vaccination but no further contact information is provided.
  • There is also variable information provided about residency requirements. While most (43 of 56) provide no clear information about residency requirements at all, 10 specify that vaccination is limited to those who live, work, go to school, or receive health care in the jurisdiction. A few state that exceptions to this limitation are possible and three explicitly state there is no residency requirement.
  • Finally, in many jurisdictions, eligibility information, even if ultimately available, was hard to find or unclear. This included jurisdictions where different aspects of eligibility criteria were presented in multiple places, including, sometimes, in health care provider instructions (vs. consumer-facing materials); stand-alone press releases; and/or in online registration forms that required multiple click-throughs. In other cases, certain eligibility information was only available in health care provider materials. Several instances of contradictory information were found– information in PDFs might have different eligibility criteria than what was posted to the website, for example. Eligibility information was especially challenging to ascertain in four jurisdictions (Illinois, Indiana, Maryland and New Mexico). Finally, some jurisdictions indicated they were following CDC’s eligibility guidance but then provided much more limited or more expansive eligibility criteria.

Discussion

Jurisdictions have approached defining populations eligible for MPX vaccine with substantial variation and these decisions could have an impact on curbing local transmission. In some cases, the information on vaccine eligibility or access process is hard to locate or not very clear, potentially creating barriers, limiting individuals’ ability to understand whether they are eligible and/or how to find vaccination. Variation also means that a higher risk individual in one jurisdiction will have access to vaccination whereas someone with similar risk in different region would not. Many jurisdictions note that the eligibility requirements are in place due to limited vaccine supply, and several suggest that they will broaden eligibility in the future when more vaccine is available. Until that point, an understanding of how local vaccine eligibility is defined and how clear the vaccination process is for those at risk may offer insights into take-up and equity moving forward.

Table 2: Jurisdictional Approaches to Monkeypox (JYNNEOS) Vaccine Eligibility - Eligible Categories, Groups, and Sign-Up Information, as of September 12, 2022

The Safer Communities Act: Changes to Medicaid EPSDT and School Based Services

Authors: Madeline Guth and Elizabeth Williams
Published: Sep 6, 2022

To help reduce gun violence and expand access to mental health services for children, the Bipartisan Safer Communities Act includes a number of Medicaid/CHIP provisions to ensure access to comprehensive health services and to strengthen school-based mental health care. In 2019, Medicaid covered nearly four in ten children nationwide, providing coverage for a comprehensive set of physical and behavioral health services. Mental health concerns among children have increased in recent years, and access and utilization of mental health care may have worsened during the pandemic. As directed by the Safer Communities Act, on August 18 the Centers for Medicare and Medicaid Services (CMS) released informational bulletins to guide state implementation of the Early and Periodic Screening, Diagnostic and Treatment (EPSDT) benefit (particularly mental health services) and expand access to school-based Medicaid services. This policy watch examines Medicaid’s current role in providing coverage for EPSDT and school-based health services, current challenges, and changes to these services included in the new legislation.

What is EPSDT and what does Safer Communities Act do?

A wide range of services for children are required to be covered under Medicaid’s EPSDT benefit. Under EPSDT, states are required to cover all screening services for children as well as any services “necessary… to correct or ameliorate” a child’s physical or mental health condition. Under EPSDT, states must provide screenings for developmental and behavioral health conditions, as well as for vision, hearing, and dental conditions, on a periodic basis that meets reasonable standards of medical practice. This benefit facilitates greater access to care for children with behavioral health needs, as children diagnosed with mental or other behavioral health conditions must receive any service available under federal Medicaid law necessary to address the condition, even if the state does not cover the behavioral health service for adults.

A 2019 GAO report found that many Medicaid-covered children do not receive recommended screenings and services and recommended increased CMS oversight of EPSDT. More recent data from the Child Core Set for FY 2020 show similar findings with a range in the median share of children who received a well-child visit across states (from 66% of children in their first 15 months of life to 53% of those 12-21). The median share of children under age 4 who received screenings for risk of developmental, behavioral, or social delays across states was 36% and the median share of all children who received preventive dental services was 42%. The GAO report recommended several steps necessary for CMS to increase oversight and ensure that children receive appropriate EPSDT services, including regular assessment and evaluation of EPSDT performance measures and state performance as well as planning assistance to help states improve their provision of the EPSDT benefit.

The Safer Communities Act required federal agencies to review EPSDT implementation and provide updated guidance for state Medicaid programs by June 2024 and requires review and updated guidance every five years thereafter. On August 18, CMS released updated guidance that emphasizes the coverage of mental health and substance use disorder (SUD) services under EPSDT and provides various strategies to expand and strengthen behavioral health services for children with Medicaid. Prior to this, CMS had not released comprehensive guidance on EPSDT requirements and implementation since a series of strategy guides in 2014. The Act also requires the federal Department of Health and Human Services (HHS) to conduct regular reviews of state implementation of EPSDT services, identify gaps and deficiencies, and provide technical assistance to states. These requirements include a review of EPSDT services provided by managed care organizations (MCOs), which are an especially important source of care for children: as of July 2021, 37 states using managed care reported covering 75% or more of all children through MCOs. Finally, the Act directs the GAO to conduct a study on state implementation of EPSDT (including state oversight of managed care organizations) and submit a report to Congress by June 2025.

How does Medicaid support school-based health services and what does Safer Communities Act do?

Schools can be a key setting for providing services to Medicaid-covered children, including those with and without disabilities. Medicaid programs may reimburse medically necessary services that are part of a student’s Individualized Education Plan (IEP) under the Individuals with Disabilities Education Act. Medicaid can also reimburse school-based health centers (SBHCs) for services provided to Medicaid-covered children, including routine screenings, preventive care, behavioral health care, and/or acute care services. Since 2014, CMS has permitted payment for any Medicaid services delivered to covered children, regardless of whether the school provides these services to all students without charge. SBHCs have been found to improve educational and health-related outcomes and be effective tools to advance health equity, and nearly 9 in 10 SBHCs reported billing Medicaid by 2014. Finally, schools can receive Medicaid funding for some administrative activities, such as outreach to and enrollment of Medicaid-eligible children, care coordination, and transportation to and from Medicaid-eligible services.

However, federal agencies have in the past raised concerns about poor oversight and improper Medicaid billing for school-based services. In response to such concerns, CMS issued state guidance as well as an updated guide for claiming payment and now offers training to states. However, the claiming guide has not been updated since 2003, and many contend the guidance has become outdated.

The Safer Communities Act requires federal agencies to issue guidance and provide technical assistance for school-based Medicaid services and awards grants for the expansion of such services. On August 18, CMS released updated guidance that outlines state flexibilities and strategies for expanding Medicaid-covered mental health services in schools. In the guidance, CMS indicated it intends to release further guidance on Medicaid school-based services, including an updated claiming guide and technical assistance guide, in the coming months. This guidance is expected to provide best practices for paying for school-based services, provide strategies for reducing administrative burdens, and supply examples of providers who can provide school-based Medicaid services. The Act also establishes a technical assistance center to assist with the provision of Medicaid payment for school-based services, with a focus on supporting small and rural schools, and allocates $50 million for planning grants to states to expand school-based services under Medicaid.

Additional Medicaid/CHIP provisions in the Safer Communities Act include expanding the Medicaid Certified Community Behavioral Health Center (CCBHC) Medicaid demonstration program and requiring CMS to issue guidance on increasing access behavioral health care services through telehealth. The Act also more broadly addresses children’s mental health challenges by expanding the number of school-based mental health providers, providing trauma care to students, and funding additional school programming.

Given the large share of children covered by Medicaid and the reach of EPSDT and school-based services for access to physical and behavioral health services, the changes to Medicaid in the Safer Communities Act could have significant and long-lasting implications for children’s access to care.

A 50-State Review of Access to State Medicaid Program Information for People with Limited English Proficiency and/or Disabilities Ahead of the PHE Unwinding

Authors: MaryBeth Musumeci, Sweta Haldar, Emma Childress, Samantha Artiga, and Jennifer Tolbert
Published: Aug 26, 2022

Issue Brief

Executive Summary

State Medicaid websites are a key source of information and an avenue for enrollment in or renewal of coverage for many applicants and existing enrollees. Medicaid households include a disproportionate share of nonelderly adults with limited English proficiency (LEP), and three in ten nonelderly Medicaid adults report having a disability. Moreover, some individuals have LEP as well as a disability. When the continuous enrollment requirement related to the COVID-19 public health emergency (PHE) ends and states resume regularly scheduled redeterminations and renewals, individuals with LEP and/or disabilities may be at increased risk of losing coverage, despite remaining eligible, due to barriers in accessing eligibility and renewal information. Several federal laws require state Medicaid agencies to provide information in a way that is accessible to people with LEP and people with disabilities (Appendix).

This issue brief reviews accessibility of information for people with LEP and people with disabilities provided through state Medicaid websites, online application landing pages, and PDF applications and call center automated phone trees as of June 16, 2022. The analysis shows that while states have taken some steps to support access to information and applications for people with LEP and people with disabilities, gaps in accessibility remain. Given the potential challenges people with LEP and people with disabilities may face maintaining coverage once Medicaid renewal and redeterminations resume following the end of the public health emergency, specific steps to minimize barriers and ensure easy access to information, applications, and assistance could help prevent coverage losses among those who remain eligible.

Most states have taken steps to support access to information and applications for people with LEP and people with disabilities.  Such steps include the following:

  • Nearly every state (49) translates information on their homepage, their online application landing page, and/or their PDF Medicaid application into languages other than English. However, there is variation across and within states in terms of which resources are translated and how many translated languages are available. Just under two-thirds of states (32) translate information on their Medicaid homepage into a language other than English, 36 states translate their online application landing page into at least one other language, and 39 states make a PDF application available in at least one other language than English. The number of languages other than English ranges from 1 to over 100 in states using automated translation systems such as Google Translate, although as noted below, there may be quality issues associated with automatically translated information. The languages most commonly available include Spanish, Chinese, Vietnamese, and Tagalog. Online application landing pages and PDF applications are typically available in fewer languages than homepages, with translations of these resources often limited to only Spanish.
  • A total of 46 states include multilingual tagline notices about how to obtain language assistance services on or within one click of their homepages online application landing pages and/or on their PDF applications. In these states, taglines are provided in between 1 and 55 languages other than English, with most of these states including taglines in at least 15 languages in addition to English. All states with taglines include taglines in Spanish. In addition to Spanish, the most common other languages in which taglines are offered are Chinese and Vietnamese.
  • Forty-five states provide general information about the availability of reasonable modifications (also known as reasonable accommodations) for people with disabilities on or within one click of their homepage or online application landing page and/or on their PDF application. Examples of alternative formats and services to increase access for people with disabilities include teletypewriter (TTY) call center numbers to assist people who are deaf, hard-of-hearing, or have a severe speech impairment, which 41 states provide on their website, online application landing page, and/or PDF application. Fewer states specify how to access large print or Braille materials and/or applications (19 states) or how to request an American Sign Language or other appropriate interpreter (26 states).
  • State Medicaid homepages and online application landing pages on average have fewer accessibility errors for people who are blind or have low vision compared to webpages in general. State homepages and online application landing pages were evaluated using WAVE, a suite of automated web accessibility measurement tools that includes 110 elements that assess potential accessibility errors for people who are blind or have low vision. WAVE detected an average of 11.4 errors per page across the 101 webpages assessed, compared to the average of 50.8 errors per page found on the top one million web homepages generally. About half of the assessed webpages showed five or fewer detectible errors, and 11 pages showed no detectible errors. These findings suggest that states have given notable attention to ensuring accessibility on these pages overall.

While states have taken steps to support access to information and applications for people with LEP and people with disabilities, continuing gaps in accessibility remain. Some of these gaps include:

  • Multilingual information is often available in a limited number of other languages. In several states, Spanish is the only language other than English in which translated information is available on Medicaid homepages. Moreover, as noted above, translated online application landing pages and PDF applications are typically available in fewer languages and often limited to Spanish. For example, 26 of the 39 states with a translated PDF application only translate it into Spanish. Of the 40 states that offer language options through call center automated menus, 31 states offer options only in English and Spanish. While Spanish is the most common language spoken among nonelderly adults in Medicaid households who have LEP, Chinese and Vietnamese are each spoken by 3% of these adults, and there are a diverse set of languages spoken overall by this group.
  • Translated information on Medicaid homepages may be less reliable than the information available on English versions of homepages and, in some cases, translations are incomplete. Over half of states providing translated homepages use automated translations through Google Translate, which may lead to quality issues associated with the translations. Google has indicated that it is not intended to replace human translators or to be used in public health contexts without having translations verified. A few states include disclaimers that the English version of the homepage is the most reliable. Additionally, in some states, some content in the headers, footers, and/or menus of the translated versions of the homepage remains in English and/or clicking links in translated versions of the homepage leads to English content.
  • Most states do not make information and applications available in multiple formats to improve accessibility for people with disabilities. A total of 19 states include information on their homepage, online application landing page, or PDF application about how to obtain materials in large print or Braille, but only two states post a large print PDF application form online. The remaining states do not mention how to access alternative formats. Making information and applications available in multiple formats is an important means of increasing access for people with disabilities. People with disabilities may access information in different ways, depending on their type of disability and type of assistive technology they use.
  • Most of the webpages (in 47 states) assessed through WAVE showed at least one incidence of low contrast text, which is difficult for people with color blindness or low vision to read. Connecticut is the only state that allows users to change the homepage to a “high contrast” mode to improve readability for users. Other commonly detected accessibility issues included missing labels to describe the various fields of content in a form (24 states) and images missing alternative text (23 states).
  • Nearly all state call centers (49 states) answer with an automated phone tree, which can increase accessibility challenges for people with LEP and/or intellectual, developmental, or mental health disabilities. In 12 states with automated phone trees, the first set of menu options include the option to speak to a live person. As of the time of our data collection, the call center wait time to speak with a live person was less than 15 minutes in 34 states, while in 8 states the wait time was more than 15 minutes, and in the remaining 7 states, we could not reach a live person.1  Access to a live person can improve accessibility for people with LEP and/or intellectual or developmental disabilities and people with mental health disabilities. 

Introduction

State Medicaid websites are a key source of information and an avenue for enrollment in or renewal of coverage for many applicants and existing enrollees. Medicaid households include a disproportionate share of nonelderly adults with limited English proficiency (LEP), and three in ten nonelderly Medicaid adults report having a disability. While Spanish is the most common language spoken among nonelderly adults in Medicaid households who have LEP, Chinese and Vietnamese are each spoken by 3% of these adults, and there are a diverse set of languages spoken overall by this group. Medicaid enrollees have a variety of disabilities, including blindness or low vision; deafness or hard of hearing; intellectual and developmental disabilities such as autism or Down’s syndrome; traumatic brain or spinal cord injuries; and mental illness. Some people may have both LEP and a disability.

When the continuous enrollment requirement related to the COVID-19 public health emergency (PHE) ends, and states resume regularly scheduled redeterminations and renewals, individuals with LEP and/or disabilities may be at increased risk of losing coverage, despite remaining eligible, due to barriers in accessing eligibility and enrollment information. The Centers for Medicare & Medicaid Services (CMS) guidance about the PHE unwinding reminds states about these obligations and prompts states to review their communications with people with LEP and people with disabilities as a strategy to mitigate inappropriate coverage loss. Several federal laws require state Medicaid agencies to provide information in a way that is accessible to people with LEP and people with disabilities. The Appendix provides background information on these laws.

This issue brief reviews accessibility of information for people with LEP and people with disabilities provided through state Medicaid websites and call center automated phone trees, as of June 16, 2022. We assessed homepages and call center automated menu options in all 50 states and DC and online application landing pages and PDF applications in the states that provide these resources2  (Appendix Table 1). See the Methods box for more detail.

Accessibility of Information for People with LEP

Translation of Website Information and Applications

Overall, 32 states translate information on their Medicaid program homepage into languages other than English, and 36 states provide translations of their online application landing page into other languages (Appendix Table 2 and Figure 1). The number of languages other than English range from 1 to over 100 in 18 states using automated translation systems such as Google Translate. Additional states also use Google Translate to offer translations in a more limited number of languages, while other states do not specify if the translation is based on automated software. All states that offer translation on their homepages or online application landing pages offer information in Spanish. The other languages most commonly available include Chinese, Vietnamese, and Tagalog. In general, states offer fewer translated languages on their online application landing pages than on the homepages. For example, 23 of the 36 states with translated online application landing pages only translate into Spanish.

Most states with online PDF applications (39 of 48 states) offer the application in languages other than English (Appendix Table 2 and Figure 1). In 26 of these states, Spanish is the only other language in which the PDF application is available. In the remaining 13 states, PDF applications are offered in additional languages, including in 10 or more languages in California, New York, North Carolina, Oregon and Washington. The most common other languages available are Vietnamese, Chinese and Korean. Most PDF applications ask about the applicant’s preferred spoken language, which may facilitate access to linguistically accessible communications in the future.

There may be potential quality issues with translations in states using automated translations, such as Google Translate. Google has indicated that it is not intended to replace human translators or to be used in public health contexts without having translations verified and other research has found Google Translate to be unreliable in medical contexts.3 ,4  A few states include disclaimers that the English version of the homepage is the most reliable. In some states, some content in the headers, footers, and/or menus of the translated versions of the homepage remains in English and/or clicking links in translated versions of the leads to English content.

Homepage Available in Languages Other than English
Figure 2: Google Translate Translation Menu from California’s Medicaid Homepage

Access to Language Assistance and Interpretation Services

Thirty-five states include multilingual taglines on or within one click of their homepages or online application landing pages with information on how to access language assistance services (Appendix Table 2). Most of these states provide taglines in at least 15 languages other than English. All 35 states include taglines in Spanish, and the other most common languages are Chinese and Vietnamese.

Most states with PDF applications (35 of 48 states) include multilingual tagline notices regarding the availability of language assistance services on the PDF application (Appendix Table 2). These taglines are generally present on the first or second page of the application or as a footer running across every page. In 26 of these states, taglines are only provided in Spanish and English, while in others, they are provided in between 2 and 15 other languages. In addition to Spanish, the most common other languages in which taglines are offered are Chinese and Vietnamese.

Figure 3: Spanish Tagline from Iowa’s Medicaid Website

In 49 states, call centers answered with automated phone trees, and 40 of these states offered menu options in languages other than English. However, in 31 of these states the only other language offered through the menu is Spanish (Appendix Table 2 and Figure 1).5  In the remaining states, phone tree menus offer between two and six languages other than English. In some states, other language options are only offered after the applicant listens to a long set of options in English.

Accessibility of Information for People with Disabilities

Availability of Reasonable Modifications

Most states (43) provide general information about the availability of reasonable modifications (also known as reasonable accommodations) for people with disabilities on or within one click of their homepage or online application landing page, while 32 states provide this information on their online PDF application (Appendix Table 4 and Figure 4).6  States often provide information about reasonable modifications for people with disabilities on a separate webpage titled “Nondiscrimination policy” or “Accessibility” rather than directly on their homepage. Users can usually find these separate webpages by clicking on a “Nondiscrimination policy” link at the bottom of the homepage. States often use these separate webpages to outline their general commitment “to serving the needs of people with disabilities” (CT). Most of these separate webpages include information about free “auxiliary aids and services necessary to afford an individual with a disability an equal opportunity to participate in all services, programs and activities” (KY). Additionally, states often include information about reasonable accommodations such as alternative formats including Braille or large print materials, teletypewriter (TTY) numbers, and how to request qualified American Sign Language (ASL) interpreters on these separate webpages. The comprehensiveness of the reasonable modification statement varies across states—some states only include a general statement while other states describe the types of aids and alternative formats that are available and provide instructions on how to access them. The availability of information in plain language also is an important means of providing access for people with cognitive disabilities, though our website review did not assess content for plain language.

Statement on Reasonable Modifications for Individuals with Disabilities Available Online

Alternative Written Formats for People with Disabilities

A total of 19 states provide information about how to obtain materials in large print or Braille (Appendix Table 4 and Figure 4). Most of these states list a phone number (and/or a TTY number) for individuals to call to request materials in alternative formats, such as large print, or advise users to contact their local office. Two states (CA, CO) post a large print PDF application form online,, and several states, including DE, KS, MS, NH, NY, TN, and VA, allow users to increase or decrease the font size of text on the webpage. Connecticut allows users to change the homepage to a “high contrast” mode to improve readability for users. Making information and applications available in multiple formats is an important means of increasing access for people with disabilities. People with disabilities may access information in different ways, depending on their type of disability and type of assistive technology they use.

Website Accessibility for People Who are Blind or Have Low Vision

State homepages and online application landing pages were evaluated using WAVE, a suite of automated web accessibility measurement tools that includes 110 elements that assess potential accessibility errors for people who are blind or have low vision. WAVE is developed and made available as a free community service by WebAIM (Web Accessibility in Mind) at Utah State University. WAVE assesses web accessibility, including compatibility with screen reader software, which can be used by people who are blind to convert web content to synthesized speech, and screen magnifiers or zoom, which can be used by people with low vision. Because WAVE is automated, it does not assess all aspects of accessibility that may be encountered by website users. However, WAVE does identify the accessibility errors that are most frequently encountered and that tend to have the greatest impact on users who are blind or have low vision.7  Additionally, errors identified by WAVE have been found to correlate with the existence of other accessibility issues that WAVE does not detect but which can be encountered by a website user.8  The WAVE analysis was applied to a total of 101 webpages, including the homepages for all 50 states and DC and the online application landing pages for 49 states and DC.9 

The most common accessibility issue detected by WAVE is very low contrast text, with 67% of the assessed webpages (in 47 states) showing at least one incidence of this error (Appendix Table 3 and Figure 5). Overall, WAVE detected an average of seven instances of very low contrast text errors per page across the 101 webpages assessed. Low contrast text refers to the difference in brightness between text or a graphic and its background colors and is difficult for people with color blindness or low vision to read.  Other commonly detected accessibility issues include missing labels to describe the various fields of content in a form (27% of pages, 24 states) and images missing alternative text (25% of pages, 23 states) (Appendix Table 3). Alternative text is used to describe the content of an image. Images that lack alternative text and forms without text labels cannot be properly identified by screen readers, making this content very difficult to access for people who rely on that technology.

The average number of accessibility errors detected by WAVE across the 101 assessed state homepages and online application landing pages is substantially lower than the average number of errors found on webpages in general. Specifically, WAVE detected an average of 11.4 errors per page across the 101 webpages assessed, compared to the average of 50.8 errors per page found on the top one million web homepages generally. The number of web accessibility errors detected on the assessed webpages varies widely across states (Appendix Table 3). Over half of the states have 15 or fewer errors across their homepages and online application pages and in seven states, there are less than five errors (Figure 5). These findings suggest that states have given notable attention to ensuring accessibility on these pages overall, although some pages may have errors that could pose difficulty for users with disabilities.

Number of Web Accessibility Errors Detected by WAVE, 2022

Effective Communication for People with Disabilities

Forty-one states list a TTY call center number on their homepage or online application landing page, within one click from these pages, or on their PDF application (Appendix Table 4 and Figure 6).10  These numbers are often found in different places on states websites. Some states require users to click on a “contact us” tab to find a TTY number, while others require users to click on a different link to a “nondiscrimination” or “access for users with special needs” webpage to find a TTY number. In some states, the TTY number is only available on the language assistance page. TTY numbers allow individuals who are deaf or hard of hearing to communicate by sending typed messages over the phone line. If states communicate with applicants or the public by phone, they also must handle calls via TTY or similar technology.11  While a number of states include the TTY number in their tagline notices for language assistance, a smaller number of states, such as North Carolina, provide a Spanish language TTY (Relay Service).

Twenty-six states provide information about how to request an ASL interpreter on their website and/or PDF application (Appendix Table 4 and Figure 6). One of these states (WA) directly lists this information on their homepage, while the other states require users to click on another link such as a “nondiscrimination” webpage to find information about how to request an ASL interpreter. Both TTY numbers and ASL interpreters can help promote effective communication for people who are deaf or hard of hearing that could be essential for someone to understand how to enroll in or retain Medicaid coverage.

The large majority (49 of 51) of call centers answer with an automated phone tree and only 12 of the automated phone trees include an option to speak to a live person in the first set of menu options (Appendix Table 4 and Figure 6). Two call centers (DC, SD) answer with a live person instead of an automated phone tree. Access to a live person can improve accessibility for people with LEP and/or intellectual or developmental disabilities and people with mental health disabilities. As of the time of our data collection, the call center wait time to speak with a live person was less than 15 minutes in 34 states, while in six states, the wait time was more than 15 minutes. In the remaining seven states, we were unable to reach a live person.12  The end of the COVID-19 PHE may increase these wait times, as states resume processing redeterminations and renewals.

TTY Number Available on Medicaid Homepage

Looking Ahead

As the COVID-19 PHE ends and states resume regularly scheduled Medicaid redeterminations and renewals, people with LEP and/or disabilities may face increased challenges to maintaining coverage despite remaining eligible due to barriers in accessing eligibility and enrollment information. Under Title VI of the Civil Rights Act, Section 1557 of the Affordable Care Act, and the Rehabilitation Act, state Medicaid agency program information must be accessible to people with LEP and people with disabilities. The Biden Administration has issued a proposed rule revising implementing regulation for Section 1557, taking steps to reverse Trump Administration policy and regulations that significantly narrowed the implementation and administrative enforcement of the regulations. The proposed rule reinstates the requirement that Medicaid agencies provide notice of the availability of language assistance services and auxiliary aids and services in both physical locations and on their websites. Additionally, the rule, for the first time, requires state Medicaid agencies to give staff clear guidance and training on the provision of language assistance services and effective communication and reasonable modifications to policies and procedures for people with disabilities in order to improve compliance. Regardless of the status of the regulations, the underlying statutory protections of Section 1557, which require meaningful access to federal programs for people with LEP and/or disabilities, remain as well as protections under other federal laws and federal Medicaid regulations that require public programs be accessible to people with LEP and/or disabilities.

As states prepare to resume Medicaid redeterminations and renewals, they can take steps to prevent and minimize potential administrative barriers to maintaining coverage, particularly for people who have LEP and/or disabilities. CMS guidance outlines specific steps states can take, including ensuring accessibility of forms and notices for people with LEP and people with disabilities and reviewing communications strategies to ensure accessibility of information. Increasing access to a live person through call centers and/or providing a dedicated call center line for people with LEP may also help improve accessibility for people with LEP and people with disabilities. Ensuring accessibility of information, forms, and assistance will be key for preventing coverage losses and gaps among these individuals.

Methods

State Medicaid websites were identified by using the first result from a Google search for the state name and Medicaid (e.g., Alabama Medicaid), with the exception of DC, Illinois, and Nevada, for which the first results were not specific to Medicaid or did not include applicant or member-facing information. For DC and these states, the second result, which was more relevant, was used. Online Medicaid application landing pages and PDF applications were identified through State Medicaid websites. In some cases, online application landing pages are housed in separate websites from the Medicaid website, for example, if the online application allows individuals to apply for multiple benefits (such as health care, food, and cash assistance) or if the application is integrated with Marketplace coverage. The analysis included examination of information available on and within one click of the Medicaid homepage and online application page as well as PDF applications, where available.  An abbreviated list of indicators used to determine the accessibility and accommodation information is reproduced in Appendix Tables 1 through 4.Call center data was obtained by searching the Medicaid state homepage for the customer support call center number. Calls were made to these numbers (listed in Appendix table 1) from June 2 through June 16, 2022, between 9 AM and 5 PM EST.

KFF appreciates the assistance of Jared Smith, program manager at Utah State University Institute for Disability Research, Policy and Practice, with analyzing and interpreting the WAVE results.

Appendix

Appendix

Summary of Relevant Federal Nondiscrimination Laws

State Medicaid agency program information must be accessible to people with LEP and people with disabilities. States must provide information about Medicaid eligibility requirements, covered services, and applicant/enrollee rights and responsibilities via a website as well as orally and in writing.13  States also must allow individuals the opportunity to apply for Medicaid without delay.14  Individuals must be able to apply online, by telephone, by mail, in person, and through other commonly available electronic means.15  State Medicaid agencies must provide assistance to individuals seeking help with the application or renewal process in person, over the telephone, and online.16 

Federal law requires state Medicaid agencies to provide meaningful access for people with LEP. As recipients of federal funds, state Medicaid agencies are prohibited from discriminating on the basis of national origin, pursuant to Title VI of the Civil Rights Act of 1964 and Section 1557 of the Affordable Care Act (ACA). Current regulations require state Medicaid agencies to “ensure meaningful access to… programs or activities by limited English proficient individuals.”17  People who are LEP may include those who do not speak English as their primary language and who have a limited ability to read, write, speak, or understand English. The current Section 1557 regulations, issued by the Trump Administration, reduced the regulatory standards originally adopted by the Obama Administration. The Biden Administration has issued a proposed rule taking steps to reverse Trump Administration policy and strengthen and reinstate Section 1557 regulatory standards.

The two main types of language assistance services are oral interpreting and written translation. In addition to the requirements of Title VI and Section 1557, federal Medicaid regulations specifically require state Medicaid agencies to provide information about eligibility requirements, covered services, and applicant/enrollee rights and responsibilities as well as application assistance in a timely manner and in a way that is accessible to people with LEP, though the provision of language assistance services at no cost to the individual.18  Individuals must be informed about the availability of these language assistance services and how to access them.19  At minimum, state Medicaid agencies must provide taglines in non-English languages that indicate the availability of language assistance services.20 

Federal law requires state Medicaid agencies to make programs and services accessible to people with disabilities. Title II of the Americans with Disabilities Act (ADA) applies to state and local governmental entities, while Section 504 of the Rehabilitation Act and Section 1557 of the ACA apply to recipients of federal funds. All of these laws prohibit state Medicaid agencies from discriminating against people with disabilities. This means that people with disabilities cannot be excluded from participation in or be denied the benefits of the services, programs, or activities offered by a state Medicaid agency.21  People with disabilities also must have an equal opportunity and ability to participate in or benefit from the services, programs, and activities of state Medicaid agencies.22  Additionally, state Medicaid agencies must afford people with disabilities the opportunity to request, and must make, reasonable modifications in policies, practices, or procedures when necessary to avoid disability-based discrimination, unless doing so would result in a fundamental program alteration  or result in an undue burden.23  The definition of disability is to be construed broadly in favor of expansive coverage to the maximum extent permitted.24 

State Medicaid agencies must take appropriate steps to ensure that communication with applicants, participants, and members of the public with disabilities is as effective as communication with those without disabilities.25  State Medicaid agencies also must timely furnish appropriate auxiliary aids & services where necessary to afford people with disabilities an equal opportunity to participate in and enjoy the benefits of a program or activity.26  The type of auxiliary aid or service to be provided varies based on the individual’s communication method; the nature, length and complexity of the communication; and the context. Governmental entities like state Medicaid agencies must give primary consideration to the individual’s requested type of auxiliary aid or service. Auxiliary aids and services may include qualified onsite or video remote interpreters. A teletypewriter (TTY) or equally effective telecommunication system must be used when an agency communicates with applicants or enrollees by phone, and agencies must respond to relay calls in the same manner as other phone calls.27  Any automated attendant system (voicemail or interactive voice response system) to receive or direct incoming calls must provide effective real time communication.28 

In addition to the requirements of the ADA, Section 504, and Section 1557, federal Medicaid regulations specifically require state Medicaid agencies to provide information about eligibility requirements, covered services, and applicant/enrollee rights and responsibilities as well as application assistance in plain language, in a timely manner, and in a way that is accessible to people with disabilities, though the provision of auxiliary aids and services at no cost to the individual.29  Individuals must be informed about the availability of accessible information and how to obtain it.30 

State Medicaid Websites, Call Center Numbers, and Availability of PDF and Online Applications
Availability of Online Program Information, PDF Applications, and Call Center Menu Options in Languages Other than English
Most Common Web Accessibility Errors Detected by WAVE, by Error Type
Availability of Reasonable Modifications for Individuals with Disabilities and Live Call Center Assistance


Endnotes

  1. Two states (AZ, FL) require callers to enter identifying information in order to access live assistance and were excluded from this assessment. ↩︎
  2. If the PDF application could not be found on the homepage or online application landing page, this indicator was coded as “no” even if a PDF application was available elsewhere online. PDF applications vary widely in length, ranging from 9 to 62 pages. ↩︎
  3. Salame, R. (2021, April 30). Limited English Skills Can Mean Limited Access to the COVID-19 Vaccine. Slate. https://slate.com/news-and-politics/2021/04/covid-19-vaccine-for-non-english-speakers.html. ↩︎
  4. Taira, et al. (2021). A Pragmatic Assessment of Google Translate for Emergency Department Instructions. Journal of General Internal Medicine, 36(11), 3361-3365. doi: 10.1007/s11606-021-06666-z. ↩︎
  5. We did not assess the availability of live multilingual call center assistance. ↩︎
  6. We were unable to assess this indicator for online application forms because most states require users to create an account before accessing the contents of the online application. ↩︎
  7. Conversation with Jared Smith, Program Manager, Institute for Disability Research, Policy and Practice, Utah State University (June 7, 2022). ↩︎
  8. Id. ↩︎
  9. AK lacks an online application page. ↩︎
  10. State websites often include a brief description of TTY services explaining how the service is “designed for people who are Deaf or Hard or Hearing” (NC). For example, North Carolina’s website describes how the “relay operator reads aloud the message [the caller] typed to the other party and types the other party’s voiced message and background sounds, if any, to [the caller].” To see more about how TTY numbers can be used, see North Carolina’s infographic. ↩︎
  11. If the TTY number could not be found on the homepage or within one click from the homepage, this indicator was coded as “no” even if the number was available elsewhere on the website. ↩︎
  12. Two states (AZ, FL) require callers to enter identifying information in order to access live assistance. ↩︎
  13. 42 C.F.R. u00a7 435.905 (a). ↩︎
  14. 42 C.F.R. u00a7 435.906. ↩︎
  15. 42 C.F.R. u00a7 435.907 (a). ↩︎
  16. 42 C.F.R. u00a7 435.908 (a). ↩︎
  17. Nondiscrimination in Health and Health Education Programs or Activities, Delegation of Authority, 85u00a0Fed. Reg. 37,160u00a0(June 19, 2020) (to be codified at 42 CFR Parts 438, 440, and 460). ↩︎
  18. 42 C.F.R. u00a7 u00a7 435.905 (b)(1); 435.908 (a). ↩︎
  19. 42 C.F.R. u00a7 435.905 (3). ↩︎
  20. Id. ↩︎
  21. 42 U.S.C. u00a7 12131; 28 C.F.R. u00a7 35.130 (accord Rehab. Act u00a7u00a0 504 and ACA u00a7 1557). ↩︎
  22. Id. ↩︎
  23. 28 C.F.R. u00a7 u00a7 35.130; 35.164. ↩︎
  24. 28 C.F.R. u00a7 35.101. ↩︎
  25. 28 C.F.R. u00a7 35.160. ↩︎
  26. 28 CFR u00a7 u00a7 35.104; 35.160. ↩︎
  27. 28 C.F.R. u00a7 35.161. ↩︎
  28. Id. ↩︎
  29. 42 C.F.R. u00a7 u00a7 435.905 (b)(2); 435.908 (a). ↩︎
  30. 42 C.F.R. u00a7 435.905 (3). ↩︎

The Inflation Reduction Act is a Foot in the Door for Containing Health Care Costs

Author: Larry Levitt
Published: Aug 25, 2022

In this JAMA Forum column, KFF’s Larry Levitt examines the Medicare drug-price negotiation provisions and other drug-price reforms in the Inflation Reduction Act and their potential to spur others efforts to address health care costs.

News Release

Medicare Advantage Is Close to Becoming the Predominant Way That Medicare Beneficiaries Get Their Health Coverage and Care

Published: Aug 25, 2022

As Medicare Advantage continues to grow, a gradual but significant reshaping of the Medicare program is taking place.

A new KFF analysis finds that nearly half of eligible Medicare beneficiaries – 28.4 million out of 58.6 million Medicare beneficiaries overall – are now enrolled in Medicare Advantage plans. That represents a more than doubling of the share of the eligible Medicare population enrolled in such plans from 2007 to 2022 (19% to 48%). Enrollment is projected to cross the 50 percent threshold as soon as next year, making Medicare Advantage the predominant way that Medicare beneficiaries with Parts A and B get their coverage and care.

The rise of Medicare Advantage signals the transformation of Medicare to a program in which a majority of people receive benefits by enrolling in plans offered by private health insurance companies.

The new analysis is one of three released today by KFF in which researchers examine various aspects of Medicare Advantage. It provides the latest data on Medicare Advantage enrollment, including the types of plans in which Medicare beneficiaries are enrolled, and how enrollment varies across geographic areas. A companion analysis describes Medicare Advantage premiums, out-of-pocket limits, cost sharing, extra benefits offered, and prior authorization requirements. A third examines trends in bonus payments to Medicare Advantage plans, enrollment in plans in bonus status, and how these measures vary across plan types and firms.

Among other key findings:

  • Enrollment in private plans is highly concentrated among a small number of firms, with UnitedHealthcare and Humana together accounting for 46 percent of all Medicare Advantage enrollees nationwide. In nearly a third of counties across the U.S., these two firms account for at least 75 percent of Medicare Advantage enrollment.
  • In 2022, nearly 7 in 10 Medicare Advantage enrollees (69%) are in plans with prescription drug coverage (MA-PDs) that require no premium other than the Medicare Part B premium ($170.10 in 2022).
  • Nearly all enrollees in individual Medicare Advantage plans open for general enrollment have access to some benefits not covered by traditional Medicare, including eye exams and/or glasses (99%), hearing exams and/or aids (98%), and a fitness benefit (98%).
  • Virtually all Medicare Advantage enrollees (99%) are in plans that require prior authorization for some services. Prior authorization is most often required for relatively expensive services, such as prescription drugs administered by a physician (Part B drugs; 99%), skilled nursing facility stays (98%), and inpatient hospital stays (acute: 98%; psychiatric: 94%), but it is rarely required for preventive services (6%).
  • Federal spending on Medicare Advantage bonus payments has increased every year since 2015 and will reach at least $10 billion in 2022. Payments vary across firms, with UnitedHealthcare receiving the largest total payments ($2.8 billion) and Kaiser Permanente receiving the highest payment per enrollee ($521). (KFF is an independent, nonprofit organization that analyzes national health issues and is not affiliated with Kaiser Permanente.) Recently, the Medicare Payment Advisory Commission (MedPAC) and others have raised questions about whether the bonus program includes too many measures, does not adequately account for social risk factors, and may not be a useful indicator of quality for beneficiaries.

The full analyses are available online and include:

(KFF has adjusted its methodology from previous years to calculate the share of eligible Medicare beneficiaries enrolled in Medicare Advantage, meaning they must have both Part A and B coverage. This aligns with how the Medicare Payment Advisory Commission (MedPAC) and others describe this population. The share enrolled in Medicare Advantage would be somewhat smaller using the old method. See the methods section of the analysis.)

For more data and analyses about Medicare Advantage, visit kff.org

Monkeypox (MPX) Cases and Vaccinations by Race/Ethnicity

Authors: Nambi Ndugga, Sweta Haldar, Drishti Pillai, Latoya Hill, and Samantha Artiga
Published: Aug 24, 2022

On August 4, 2022, the U.S. Department of Health and Human Services declared the U.S. monkeypox (MPX) outbreak to be a public health emergency. The Centers for Disease Control and Prevention (CDC)  released data on national-level MPX cases reported in the U.S through July 22, including demographic information where available. These data show that, in addition to nearly all MPX cases reported being among men (99%) reporting recent male-to-male sexual or close intimate contact (94%), there are also racial and ethnic disparities, with Black and Hispanic people bearing a disproportionate burden of cases to date. While the national data by race/ethnicity have not been updated since the CDC release, a small number of states, as well as some local jurisdictions, are reporting race/ethnicity data on MPX cases and vaccinations and these data show a similar disproportionate impact. Moreover, the very limited data available to date on vaccinations also suggest that Black and Hispanic people are receiving smaller shares of vaccinations despite accounting for larger shares of cases.

National Data on MPX Cases by Race/Ethnicity

Data from 43 states, DC, and Puerto Rico show that Black people made up 26% of MPX cases compared to 12% of the population, and Hispanic people accounted for 28% of cases versus 19% of the population. Data were not separately reported for American Indian and Alaska Native (AIAN) or Native Hawaiian or Other Pacific Islander (NHOPI) people. CDC notes that areas with high numbers of cases that did not submit case reports are more racially and ethnically diverse. As such, the reported data may understate disparities. Moreover, the share of cases among Black people has risen in recent weeks, suggesting widening disparities for this group.

Racial/Ethnic Distribution of Monkeypox Cases in the U.S., May 17- July 22, 2022

To date, race and ethnicity data are missing for the majority of MPX cases at the federal level. CDC reports a total of 2,891 cases through July 22 in the 43 reporting states and DC and Puerto Rico. Case reports with at least some demographic data were available for 1,195 or 41% of these cases, but only 1,095 or 38% of cases had race/ethnicity reported. Cases have continued to climb since the report, with CDC reporting over 14,000 cases as of August 18, 2022.

State and Local Data on MPX Cases and Vaccinations by Race/ Ethnicity

Similar to national data, the limited state data available to date suggest Black and Hispanic people are accounting for disproportionate shares of MPX cases. As of August 22nd, 2022, nine states (California, Colorado, Georgia, Louisiana, New Jersey, New York, North Carolina, Oregon, and Tennessee), and Washington D.C are reporting MPX cases by race/ethnicity. While these states report race/ethnicity of MPX cases and vaccines, they vary in their racial/ethnic categorizations, making it challenging to compare data across jurisdictions. Still, these data raise early concerns about disparities for Black and Hispanic people. The proportion of MPX cases among Black and Hispanic people is higher than their share of the total population in most reporting states (Table1). For example, in Georgia, Black people account for over 80% of cases but less than a third of the population, and in Oregon, Hispanic people account for 28% of cases versus 13% of the population. White people account for a smaller share of cases than their share of the population in most of the states reporting data. Asian people make up a smaller share of cases than their share of the total population in all reporting states.

Four states (Colorado, Georgia, New Jersey, and North Carolina) and Washington D.C. are reporting MPX vaccination data by race and/or ethnicity, which show that Black people are receiving smaller shares of vaccinations compared to their share of cases. For example, in DC, Black people have received 22% vaccines, while they account for 36% of cases. In contrast, White people have received 63% of vaccinations but account for 42% of cases. In Georgia, Black people have received less than half of vaccinations, while they make up 80% of cases. Conversely, White people have received 44% of vaccinations and make up 14% of cases. And, in North Carolina, a quarter (25%) of vaccinations have gone to Black people although they account for nearly three-quarters of cases (73%), while over two-thirds (69%) of vaccinations have been received by White people who account for 20% of cases. Data are mixed for Hispanic people with them receiving a smaller share of vaccinations compared to their share of cases in Colorado (11% of vaccinations vs. 37% of cases) and New Jersey (25% of vaccinations vs. 40% of cases), but a similar or higher share in Georgia (8% of both vaccinations and cases) and North Carolina (8% of vaccinations vs. 4% of cases).

Racial/Ethnic Distribution of MPX Cases and Vaccinations by State, as of August 22, 2022

While this analysis did not include a comprehensive assessment of data being reported at the local level, we did assess data from five cities (Chicago, Houston, Los Angeles, New York City, and Philadelphia) for which the federal government is providing direct MPX vaccine allotments. All five of these cities, except Houston, were reporting MPX cases data by race and/or ethnicity, with Philadelphia and New York City also reporting MPX vaccination data by race/ethnicity as of August 19, 2022 (Table 2). Similar to the state data, for cities reporting both MPX vaccination and cases data, Black people are receiving a smaller share of vaccinations compared to their shares of cases while White people are receiving similar to, or higher shares of vaccinations compared to their share of cases. The city data also show Hispanic people receiving a lower share of vaccinations compared to their share of cases. For example, New York City reports that Black and Hispanic people account for 29% and 34% of MPX cases, respectively, while they have received 12%, and 23% of vaccines. Conversely, White people in New York City account for 32% of MPX cases yet make up nearly half (46%) of MPX vaccine recipients. Similarly, in Philadelphia, Black people make up more than half of MPX cases (57%), yet only account for 23% of MPX vaccine recipients and Hispanic people make up 15% of cases but represent 12% of vaccine recipients. In contrast, White people account for 28% of MPX cases and make up 57% of vaccine recipients.

Racial/Ethnic Distribution of MPX Cases by City and/or County, as of August 19, 2022

Discussion

Overall, it remains challenging to draw strong conclusions about racial equity in MPX cases and vaccinations due to the dearth of comprehensive data, inconsistency in reporting, and the lack of disaggregated data for smaller racial/ethnic groups, particularly NHOPI people. As the COVID-19 pandemic highlighted, having comprehensive data disaggregated by race/ethnicity is fundamental for identifying and addressing disparities.

Although limited, these early data indicate significant and potential growing racial and ethnic disparities in MPX cases and vaccination uptake, highlighting the importance of centering intersectional equity in MPX response efforts, including prevention, testing, and treatment, from the outset. Moreover, addressing challenges that include homophobia, stigma, and discrimination will be key given the disproportionate impacts among men who have sex with other men. Underlying structural inequities place people of color at increased risk for public health threats, as was seen in COVID-19 and as is beginning to be observed amid the MPX outbreak. Early and intentional efforts will be key to minimizing and preventing disparities going forward amid the MPX outbreak and for future public health threats.


COVID-19 Cases and Deaths by Race/Ethnicity: Current Data and Changes Over Time

Published: Aug 22, 2022

Over the course of the COVID-19 pandemic, analyses of federal, state, and local data have shown that people of color have experienced a disproportionate burden of cases and deaths. This brief examines racial disparities in COVID-19 cases and deaths and how they have changed over time based on KFF analysis of data on COVID-19 infections and deaths from CDC. It updates a February 2022 analysis to reflect data through mid-2022, amid the ongoing surge associated with the Omicron variant. It finds:

  • Total cumulative data show Black, Hispanic, American Indian or Alaska Native (AIAN), and Native Hawaiian or Other Pacific Islander (NHOPI) people have experienced higher rates of COVID-19 cases and deaths compared to White people when data are adjusted to account for differences in age by race and ethnicity.
  • Disparities in infections and deaths have both widened and narrowed at various times over the course of the pandemic, with disparities generally widening during periods in which the virus has surged and narrowing when overall infection rates fall. In data that has not been adjusted for age, there were some periods when death rates for White people were higher than or similar to some groups of color. However, in the age-adjusted data, White people have lower death rates than AIAN, Black, and Hispanic people over most of the course of the pandemic and disparities are larger for AIAN, Black, and Hispanic people, reflecting an older White population and higher rates of death across all age groups among people of color compared to White people.

Continuing to assess COVID-19 health impacts by race/ethnicity is important for both identifying and addressing disparities and preventing against further widening of disparities in health going forward. While disparities in cases and deaths have narrowed and widened over time, the underlying structural inequities in health and health care and social and economic factors that placed people of color at increased risk at the outset of the pandemic remain. As such, they may remain at increased risk as the pandemic continues to evolve and for future health threats, such as the Monkeypox virus, for which early data show similar disparities emerging.

Disparities in Total COVID-19 Cases and Deaths

As of August 5, 2022, the Centers for Disease Control and Prevention (CDC) reported a total of over 84 million cases, for which race/ethnicity was known for 65% or over 55 million, and a total of over 880,000 deaths, for which race/ethnicity was known for 85% or over 750,000. These estimates are based on a subset of data for which case-level demographic information has been reported to CDC by state health departments, so they differ from those reported elsewhere. For example, CDC reports a total of over 1 million deaths from COVID as of August 5, 2022. Data on cases also are likely significantly underreported as they do not reflect individuals who test positive on home tests and do not report findings to their public health agency.

Total cumulative data show that Black, Hispanic, AIAN, and NHOPI people have experienced higher rates of COVID-19 cases and deaths than White people when data are adjusted to account for differences in age by race and ethnicity. Age-standardized data show that that NHOPI, Hispanic, and AIAN people are at about one and a half times greater risk of COVID-19 infection than White people, and AIAN, Hispanic, NHOPI, and Black people are about twice as likely to die from COVID-19 as their White counterparts (Figure 1). The CDC also reports large disparities in COVID-19 hospitalizations for AIAN, Black, and Hispanic people. (CDC data does not include separate reporting for NHOPI people.) Adjusting for age when comparing groups on health measures is important because risk of infection, illness, and death can vary by age, and age distribution differs by racial and ethnic group. Age adjustment allows for direct comparison between groups on health measures independent of the age distribution differences. For example, unadjusted rates underestimate racial disparities for COVID-19 deaths, since the White population is older compared to populations of color and COVID-19 death rates have been higher among older individuals. Age adjustment has limited impact on case rates by race and ethnicity, suggesting that age plays a more limited role in risk of infection.

Cumulative COVID-19 Age-Adjusted Infection Rates by Race/Ethnicity, 2020-2022

Disparities in Cases and Deaths Over Time

Analysis of monthly data on COVID-19 infections from CDC and deaths from NCHS shows disparities in infections and deaths have both widened and narrowed over the course of the pandemic. During periods in which the virus has surged, disparities have generally widened, while they have narrowed when overall infection rates fall. However, over the course of the pandemic, specific patterns of disparities have varied by race and ethnicity and between cases and deaths.

Figure 2 shows age-adjusted monthly data on cases by race and ethnicity between April 2020 and July 2022.  There were no notable differences in patterns of disparities between unadjusted and age-adjusted data for reported cases. The data show that during periods of resurgence, disparities have generally widened for people of color compared to White people, while they have narrowed when overall infection rates fall.

  • Early in the pandemic Hispanic, AIAN, and Black people had higher rates of COVID-19 cases compared to their White counterparts, with a particularly high rate among Hispanic people. Asian people had the lowest monthly infection rate.
  • Case rates increased through Winter 2021, spiking in December 2021, and disparities further widened for Hispanic and AIAN people. Following the spike in December 2021, monthly infection rates fell across all groups. By June 2021, gaps between groups narrowed.
  • By August 2021, infection rates rose again across groups, reflecting the spread of the Delta variant, with higher rates for Black and AIAN people compared to White people during this resurgence.
  • During January 2022, infections sharply rose again across all groups amidst the spread of the Omicron variant, resulting in the highest case rates recorded since the start of the pandemic. Rates were higher for all groups of color compared to White people, with AIAN people having the highest infection rate during this surge, followed closely by Hispanic people. This surge was also the first time since early in the pandemic that the infection rate for Asian people was comparable to other groups of color. By February 2022, infection rates had fallen sharply, and disparities once again narrowed.
  • Between Winter 2022 and June 2022 case rates have fallen across groups. In April, Asian people had the highest infection rate and Black, AIAN and Hispanic people had the lowest infection rate, marking the first time these patterns were observed since the start of the pandemic. More research is needed to understand the factors that contributed to this recent shift in trends. However, by June 2022, this pattern began to reverse with White people having the lowest infection rate, and Hispanic people at highest risk of infection in June and July.
COVID-19 Monthly Age-Adjusted Cases in the United States per 100,000 by Race/Ethnicity, April 2020 to July 2022

Figure 3 presents age-adjusted monthly data on COVID-19 deaths by race and ethnicity between April 2020 and May 2022. Both the unadjusted and age-adjusted data show large disparities in death rates for people of color during surges in the pandemic, with the highest rates among AIAN people for most of the pandemic. In unadjusted data, there were some periods when death rates for White people were higher than or similar to some groups of color. However, in the age-adjusted data, White people have lower death rates than AIAN, Black, and Hispanic people over most of the course of the pandemic and disparities are larger for AIAN, Black, and Hispanic people, reflecting an older White population and higher rates of death across all age groups among people of color compared to White people.

  • During the initial surge in summer 2020, AIAN, Hispanic, and Black people experienced higher rates of death than White people. As of July 2020, Hispanic people were five times more likely to die than White people, while AIAN and Black people were roughly four and three times as likely to die than White people, respectively. Asian people were at a similar risk of death as White people.
  • Deaths peaked in December 2020 and January 2021 across groups. AIAN and Hispanic people had the highest rates of death, and all groups of color had a higher death rate than White people as of January 2021. Following that surge, death rates fell across all racial and ethnic groups and disparities narrowed by early summer 2021.
  • Moving into late summer 2021, amid the rise of the Delta variant, death rates rose and were highest among AIAN people. Black and Hispanic people had higher death rates than White people, while Asian people had the lowest rate of death Following the Delta surge, monthly deaths declined slightly across groups with higher rates of death for AIAN people persisting before climbing again across groups in late 2021 with the arrival of the Omicron variant.
  • As of January 2022, during the Omicron surge, Black, AIAN, and Hispanic people experienced the highest rates of death (36.5, 33.1, and 29.4 per 100,000 population, respectively). Following the spike in early 2022, monthly death rates fell across all groups and gaps between groups narrowed with similar rates of death across all groups (2.4 per 100,000 for AIAN and White people, 2.0 per 100,000 for Black people, 1.5 per 100,000 for Hispanic people, and 1.4 per 100,000 for Asian people.)
COVID-19 Monthly Age-Adjusted Deaths in the United States per 100,000 by Race/Ethnicity, April 2020 to May 2022

Discussion

In sum, these data show that, overall, Black, Hispanic, and AIAN people have experienced higher rates of COVID-19 infection and death compared to White people when accounting for age differences across racial and ethnic groups. The age-adjusted data also suggest that while these disparities have narrowed at times over the course of the pandemic, people of color are disproportionately impacted by surges caused by new variants, with disparities widening during these periods.

The higher rates of infection among people of color likely reflect increased exposure risk due to working, living, and transportation situations, including being more likely to work in jobs that cannot be done remotely, to live in larger households, and to rely on public transportation. Black, Hispanic, and AIAN people have experienced the highest age-adjusted death rates amid each resurgence period, reflecting higher rates of death across all age groups among people of color compared to White people and an older White population. Overall, death rates have decreased across groups over the course of the pandemic as vaccination rates have increased and vaccination – particularly with boosters – continues to be highly effective at reducing the risk of hospitalization and death. Early disparities in vaccination rates by race and ethnicity have also narrowed over time. However, data suggest potential disparities in access to COVID-19 treatments, which will be important to monitor going forward.

Looking ahead, continuing to assess COVID-19 health impacts by race/ethnicity is important for both identifying and addressing disparities and preventing against further widening of disparities in health going forward. While disparities in cases and deaths have narrowed and widened during different periods over time, the underlying structural inequities in health and health care and social and economic factors that placed people of color at increased risk at the outset of the pandemic remain. As such, they may remain at increased risk as the pandemic continues to evolve and for future health threats, such as the Monkeypox virus, for which early data show similar disparities emerging.

Methods

This analysis uses data from multiple sources including the Centers for Disease Control and Prevention (CDC) COVID Data Tracker, the Centers for Disease Control and Prevention COVID-19 Response. COVID-19 Case Surveillance Data, the National Center for Health Statistics (NCHS) Provisional COVID-19 Deaths, and the Census Bureau Annual Estimates of the Resident Population. Unless otherwise noted, race/ethnicity was categorized by non-Hispanic White (White), non-Hispanic Black (Black), Hispanic, non-Hispanic American Indian and Alaska Native (AIAN), non-Hispanic Asian (Asian), and non-Hispanic Native Hawaiian or Other Pacific Islander (NHOPI).

Data on COVID-19 infections includes reported cases as of August 1, 2022 and data on COVID-19 deaths includes provisional deaths as of July 30, 2022 where race/ethnicity was available. Age-adjusted infection and death rates were standardized to the 2019 U.S. Census Bureau Annual Estimates of the Resident Population using the direct method of standardization. The direct method of age standardization is calculated by multiplying the age specific crude rates for each population by the appropriate weight in standard population and summing them to produce an age-standardized rate. Data for monthly age adjusted NHOPI cases and deaths not shown due to small number of observations. Age standardization allows for direct comparison of groups on health measures independent of differences in age distribution that may influence the measure being examined.