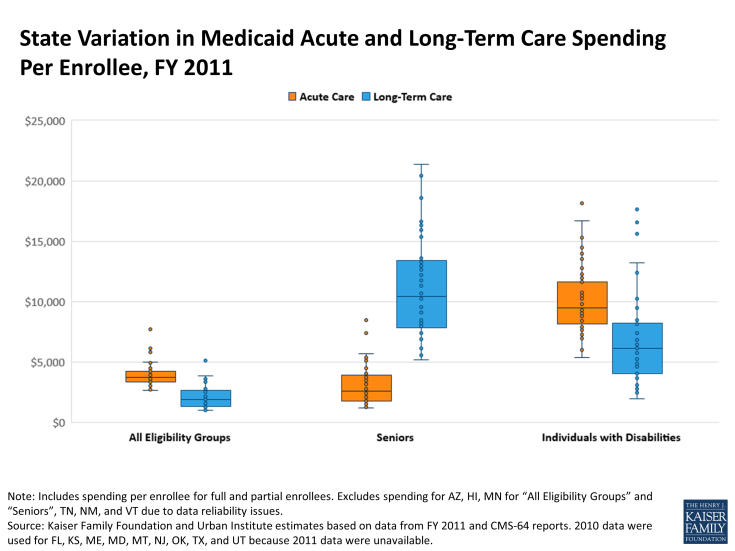
State Variation in Medicaid Acute and Long-Term Care Spending Per Enrollee, FY 2011
Source
| State Variation in Medicaid Acute and Long-Term Care Spending Per Enrollee, FY 2011 | ||||||
| All Eligibility Groups | Seniors | Individuals with Disabilities | ||||
| Acute Spending Per Enrollee | LTC Spending Per Enrollee | Acute Spending Per Enrollee | LTC Spending Per Enrollee | Acute Spending Per Enrollee | LTC Spending Per Enrollee | |
| United States | $3,885 | $1,878 | $3,773 | $9,630 | $10,377 | $6,345 |
| Difference between maximum state spending per enrollee and minimum state spending per enrollee | $5,003 | $4,115 | $7,265 | $16,219 | $12,730 | $15,653 |
| Alabama | $2,732 | $1,379 | $1,232 | $7,126 | $5,388 | $2,601 |
| Alaska | $6,136 | $3,338 | $4,724 | $18,597 | $15,310 | $13,245 |
| Arizona | N/A | N/A | N/A | N/A | N/A | N/A |
| Arkansas | $3,347 | $1,917 | $3,466 | $9,528 | $7,667 | $3,897 |
| California | $3,352 | $1,116 | $5,574 | $6,175 | $13,982 | $6,123 |
| Colorado | $3,776 | $1,903 | $5,117 | $11,826 | $10,762 | $8,246 |
| Connecticut | $3,834 | $3,631 | $1,714 | $12,938 | $8,005 | $16,562 |
| Delaware | $4,578 | $1,371 | $2,501 | $10,938 | $10,796 | $6,171 |
| District of Columbia | $5,838 | $3,038 | $3,853 | $16,577 | $16,706 | $10,253 |
| Florida | $3,138 | $1,296 | $2,948 | $5,584 | $8,428 | $3,702 |
| Georgia | $2,941 | $1,051 | $1,285 | $6,319 | $6,002 | $2,774 |
| Hawaii | N/A | N/A | N/A | N/A | N/A | N/A |
| Idaho | $3,979 | $1,721 | $1,816 | $8,508 | $11,636 | $6,874 |
| Illinois | $3,170 | $1,308 | $2,920 | $7,006 | $9,464 | $6,232 |
| Indiana | $3,358 | $1,898 | $2,797 | $12,194 | $9,030 | $6,225 |
| Iowa | $3,067 | $2,424 | $2,561 | $13,304 | $9,228 | $9,665 |
| Kansas | $3,357 | $2,639 | $2,304 | $11,339 | $7,427 | $7,402 |
| Kentucky | $4,221 | $1,716 | $1,560 | $8,047 | $7,508 | $3,261 |
| Louisiana | $3,249 | $1,620 | $1,723 | $6,893 | $7,941 | $5,108 |
| Maine | $4,053 | $1,915 | $3,760 | $5,172 | $9,547 | $4,838 |
| Maryland | $4,934 | $2,112 | $3,182 | $13,409 | $14,482 | $6,480 |
| Massachusetts | $6,297 | $2,420 | $8,497 | $12,632 | $11,946 | $4,853 |
| Michigan | $3,931 | $1,136 | $2,648 | $12,756 | $12,257 | $1,977 |
| Minnesota | N/A | N/A | N/A | N/A | $9,967 | $15,606 |
| Mississippi | $3,664 | $1,670 | $2,248 | $8,099 | $7,348 | $3,103 |
| Missouri | $4,524 | $1,965 | $4,478 | $10,228 | $10,663 | $5,738 |
| Montana | $4,339 | $2,801 | $2,131 | $20,413 | $10,925 | $5,301 |
| Nebraska | $3,343 | $2,420 | $3,019 | $11,775 | $8,954 | $8,458 |
| Nevada | $2,703 | $1,025 | $1,564 | $5,605 | $8,173 | $3,818 |
| New Hampshire | $3,776 | $3,478 | $1,725 | $16,616 | $7,302 | $9,470 |
| New Jersey | $4,579 | $3,730 | $4,147 | $13,499 | $11,883 | $10,242 |
| New Mexico | N/A | N/A | N/A | N/A | N/A | N/A |
| New York | $5,030 | $3,871 | $5,708 | $15,912 | $13,555 | $16,666 |
| North Carolina | $3,673 | $1,553 | $1,634 | $7,523 | $9,206 | $4,604 |
| North Dakota | $3,198 | $5,140 | $2,418 | $21,391 | $7,506 | $17,630 |
| Ohio | $4,150 | $2,705 | $3,528 | $16,330 | $10,403 | $8,162 |
| Oklahoma | $3,349 | $1,433 | $1,859 | $8,226 | $8,775 | $5,045 |
| Oregon | $4,021 | $1,887 | $2,048 | $13,579 | $10,007 | $4,871 |
| Pennsylvania | $4,932 | $2,879 | $2,120 | $15,343 | $10,239 | $5,288 |
| Rhode Island | $7,706 | $1,541 | $5,615 | $8,205 | $18,118 | $2,483 |
| South Carolina | $3,568 | $1,237 | $2,066 | $8,280 | $9,364 | $2,704 |
| South Dakota | $3,534 | $1,951 | $1,811 | $9,105 | $9,168 | $6,591 |
| Tennessee | N/A | N/A | N/A | N/A | N/A | N/A |
| Texas | $3,970 | $1,308 | $3,577 | $6,174 | $9,831 | $5,427 |
| Utah | $3,651 | $1,240 | $3,656 | $7,968 | $12,778 | $6,820 |
| Vermont | N/A | N/A | N/A | N/A | N/A | N/A |
| Virginia | $4,045 | $2,179 | $2,330 | $9,118 | $9,411 | $6,632 |
| Washington | $3,360 | $1,633 | $1,445 | $10,695 | $8,613 | $5,534 |
| West Virginia | $3,783 | $2,532 | $1,343 | $12,812 | $6,949 | $4,082 |
| Wisconsin | $4,114 | $1,300 | $7,432 | $7,434 | $12,417 | $3,276 |
| Wyoming | $3,310 | $2,801 | $5,376 | $15,350 | $9,304 | $12,396 |
| NOTE: Includes full and partial benefit enrollees. Spending for AZ, HI, MN for “All Eligibility Groups” and “Seniors”, TN, NM, and VT is withheld due to data reliability issues. Spending and enrollment for these states are not included in U.S. spending per enrollee amounts. Prescription drug spending is included in acute care spending. SOURCE: Kaiser Family Foundation and Urban Institute estimates based on data from FY 2011 and CMS-64 reports. 2010 data were used for FL, KS, ME, MD, MT, NJ, OK, TX, and UT because 2011 data were unavailable. |
||||||

