
Medicaid Enrollment: June 2013 Data Snapshot
Overview
This Data Snapshot provides 50-state data on Medicaid monthly enrollment trends, adding new data for June 2013. Overall, Medicaid enrollment growth continued to slow to the lowest rate since the start of the Great Recession as the economic conditions continued to slowly improve. Looking ahead, Medicaid enrollment growth is expected to increase significantly as states implement the ACA. This report provides baseline data for understanding the impact of the ACA eligibility and enrollment policies on enrollment growth across states. Future reports will examine the changes in trends across states and eligibility groups, especially differences between states that are implementing the Medicaid expansion in 2014 and states not moving forward with the expansion at this time.
Issue Brief
Total Enrollment
In June 2013, six months ahead of the implementation of major coverage expansions and new enrollment standards as part of the Affordable Care Act (ACA), 55 million individuals were enrolled in Medicaid. Nearly three-quarters were non-disabled, non-elderly individuals. Compared to one year earlier, enrollment grew by 814,200 or 1.5 percent – the slowest rate since the start of the Great Recession. At the height of the recessionary period1, enrollment growth rates peaked at 7.8 and 7.2 percent in 2008-2009 and 2009-2010, adding 3.4 million in each period. (Figure 1)
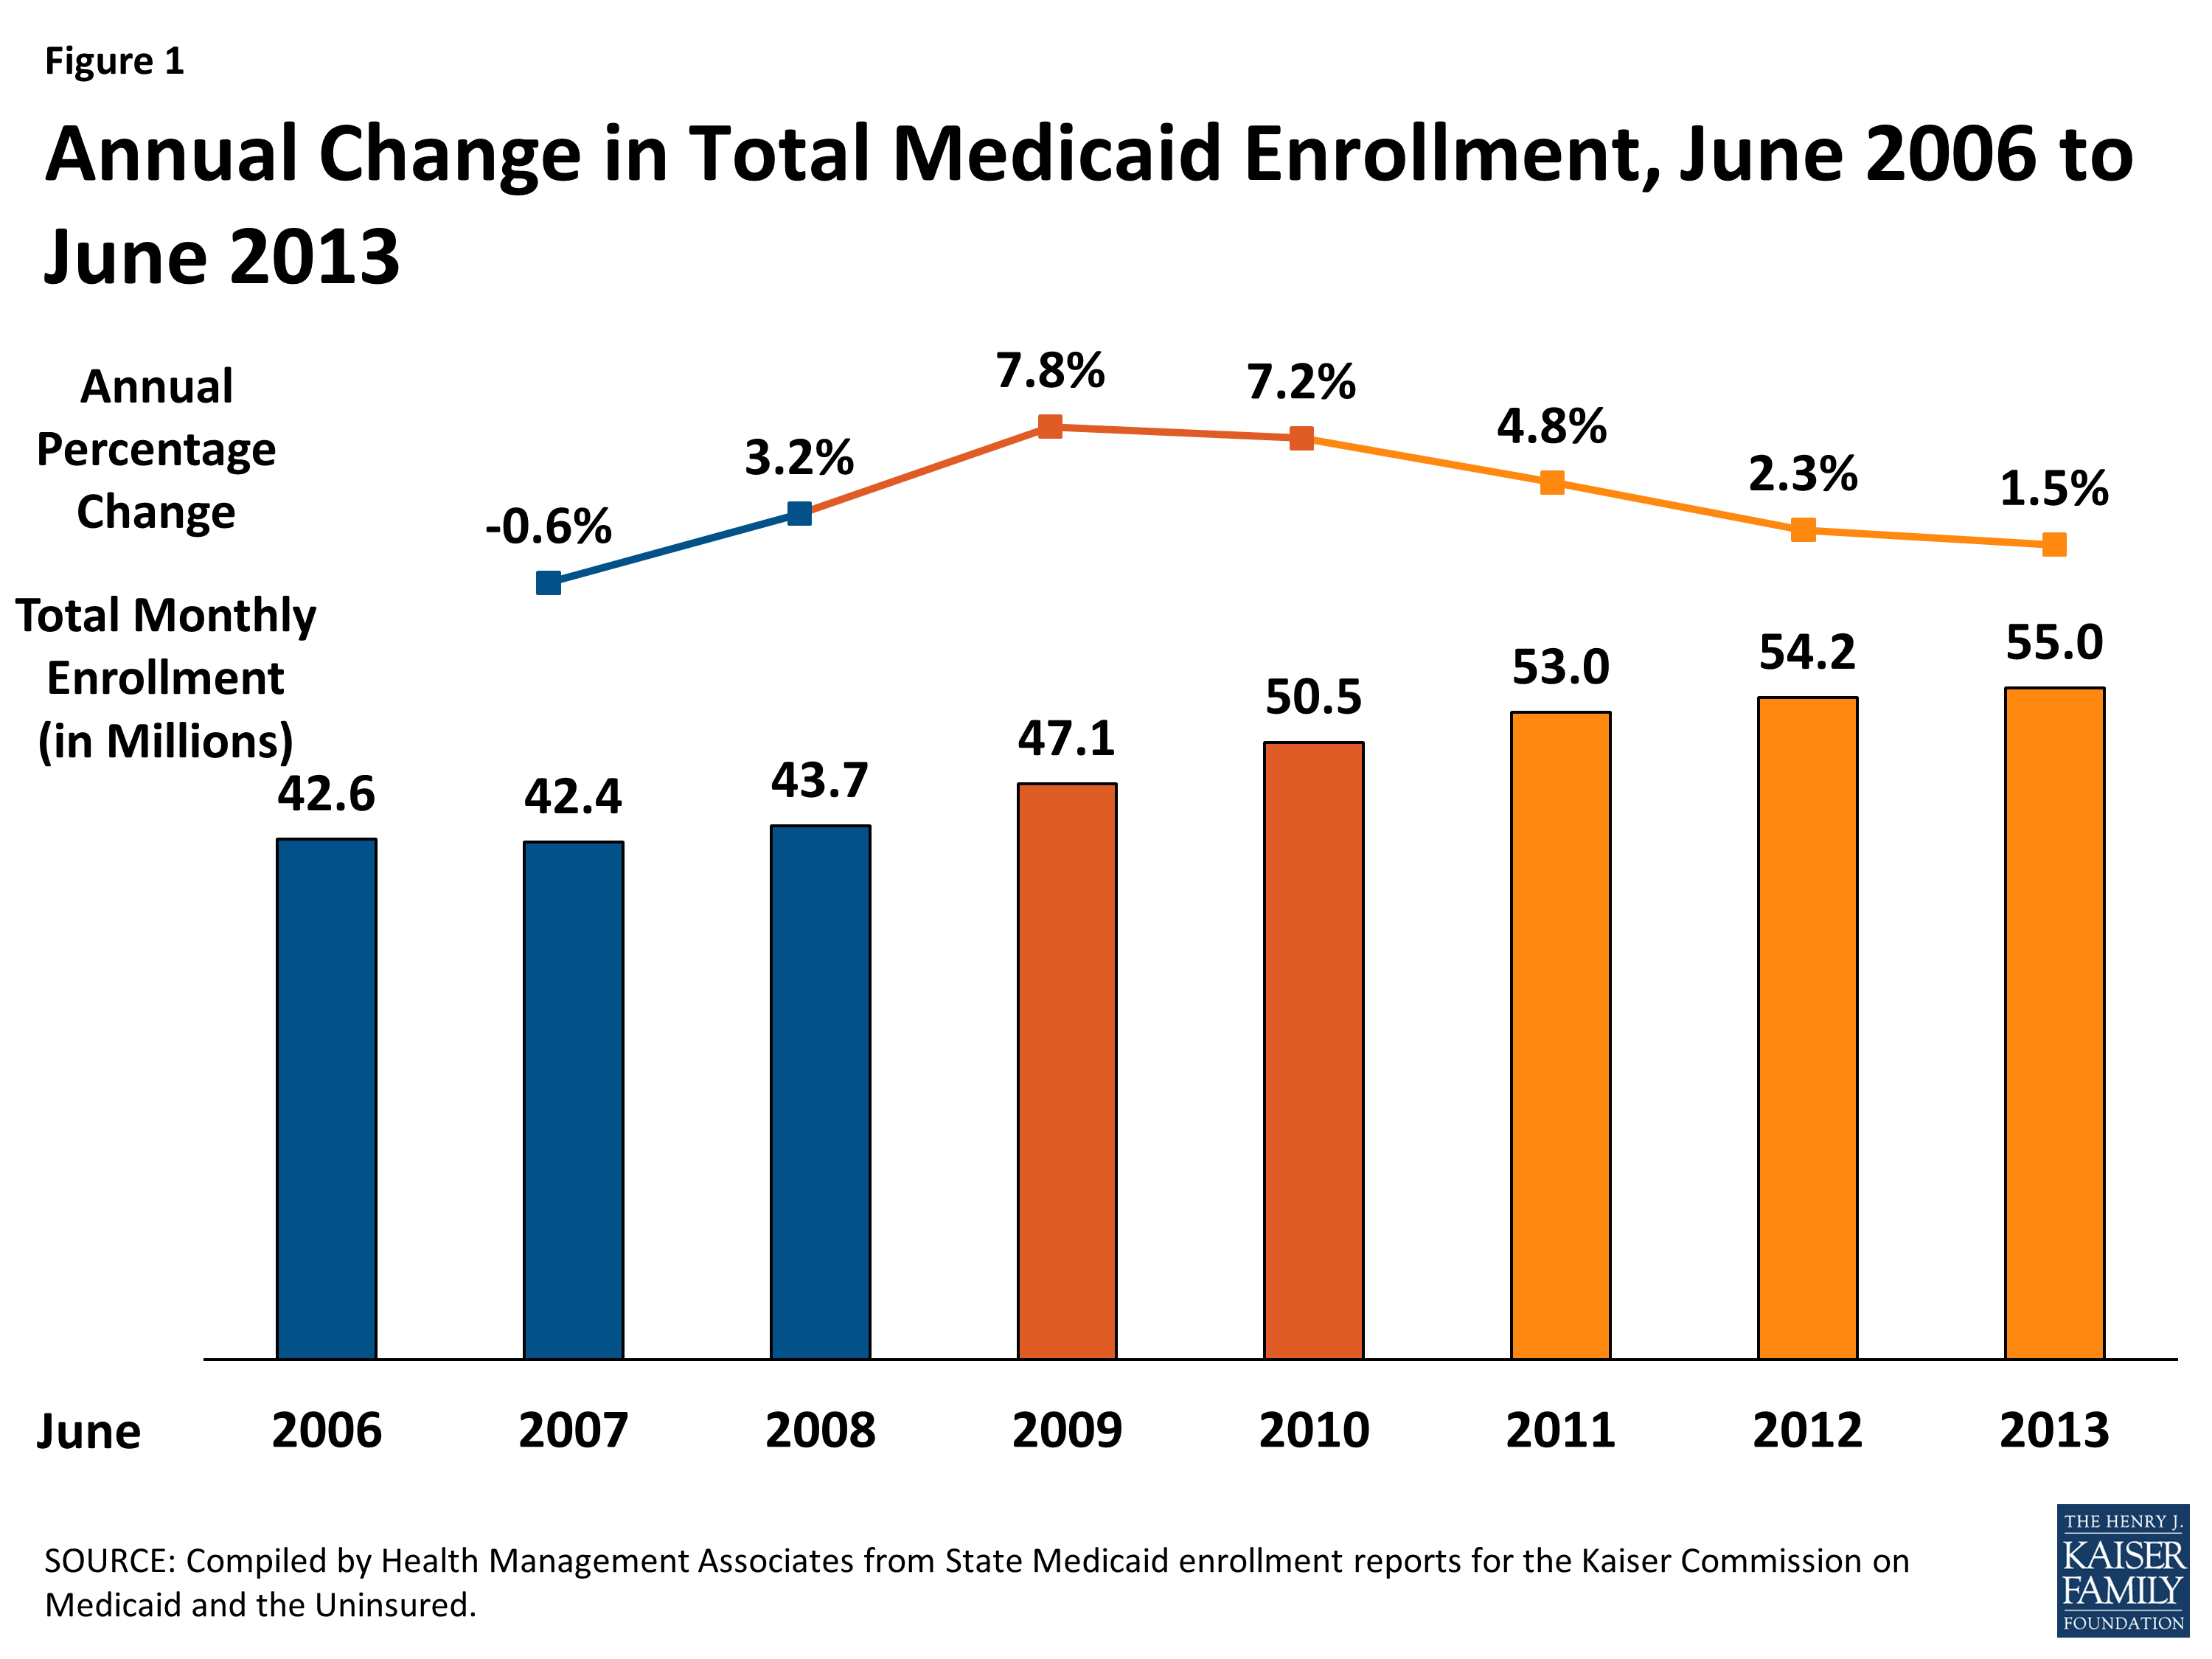
Figure 1: Annual Change in Total Medicaid Enrollment, June 2006 to June 2013
Changes in enrollment are driven by both economic conditions as well as policy. During the economic downturn, as unemployment rates climbed and incomes fell, more people became eligible for and enrolled in Medicaid. This increased demand, combined with the maintenance of eligibility (MOE) provisions that helped preserve coverage (which were first enacted as part of the American Recovery and Reinvestment Act and then maintained under the ACA) led to substantial annual growth, particularly among non-disabled, non-elderly groups which include children. Increased Medicaid coverage played a critical role in staving off increases in the number of nonelderly uninsured, particularly children.2
As the economy started to improve, Medicaid enrollment growth started to slow, particularly for non-disabled, non-elderly enrollees. (Figure 2)
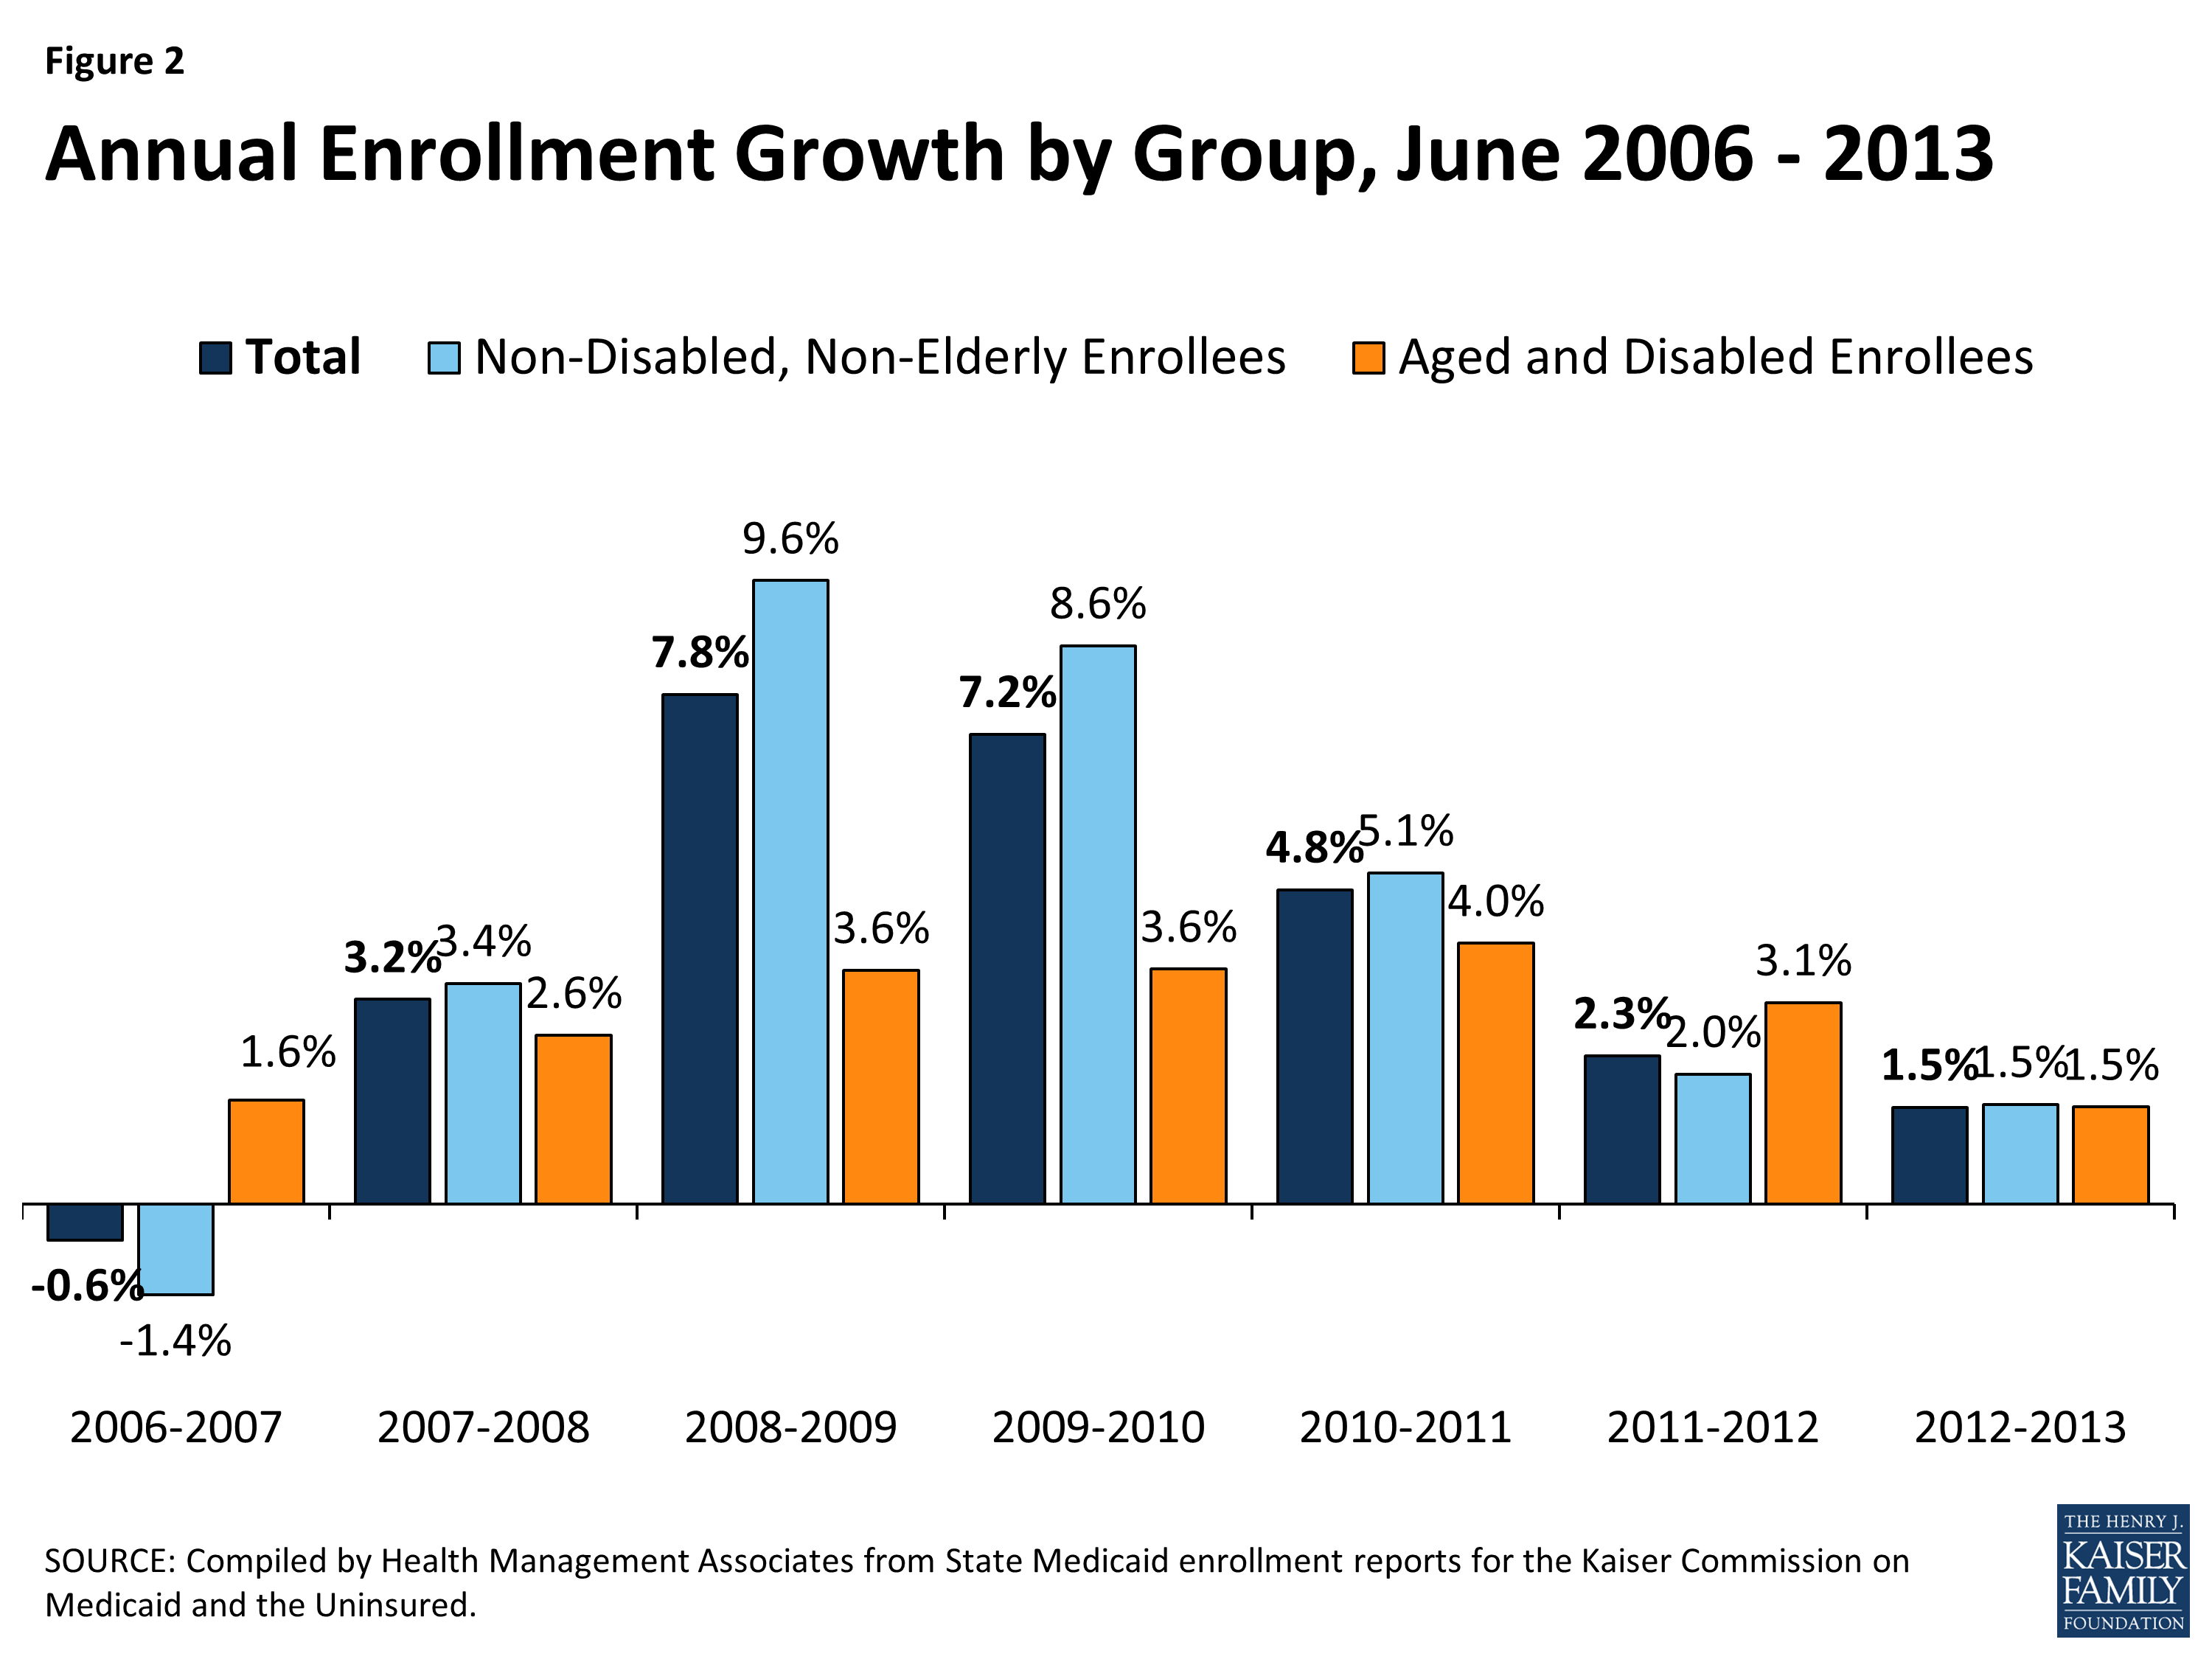
Figure 2: Annual Enrollment Growth by Group, June 2006 – 2013
While enrollment growth rates have been generally trending downward as economic conditions continue to slowly improve, some recent enrollment growth is attributable to policy actions including ACA provisions implemented in advance of January 2014, such as expansions of adult coverage in California. However, beginning in January 2014, the ACA is anticipated to lead to significant increases in Medicaid enrollment as a result of new streamlined Medicaid eligibility and enrollment policies and a single application for Medicaid, CHIP, and subsidized Marketplace coverage that are required across all states as well as an expansion in Medicaid eligibility to nearly all adults with incomes below 139% of the federal poverty level for states that are implementing the ACA Medicaid expansion. 3 While this expansion was intended to occur nationwide, the Supreme Court ruling on the ACA effectively made it a state option, and 26 states are implementing the expansion in 2014. (Figure 3)
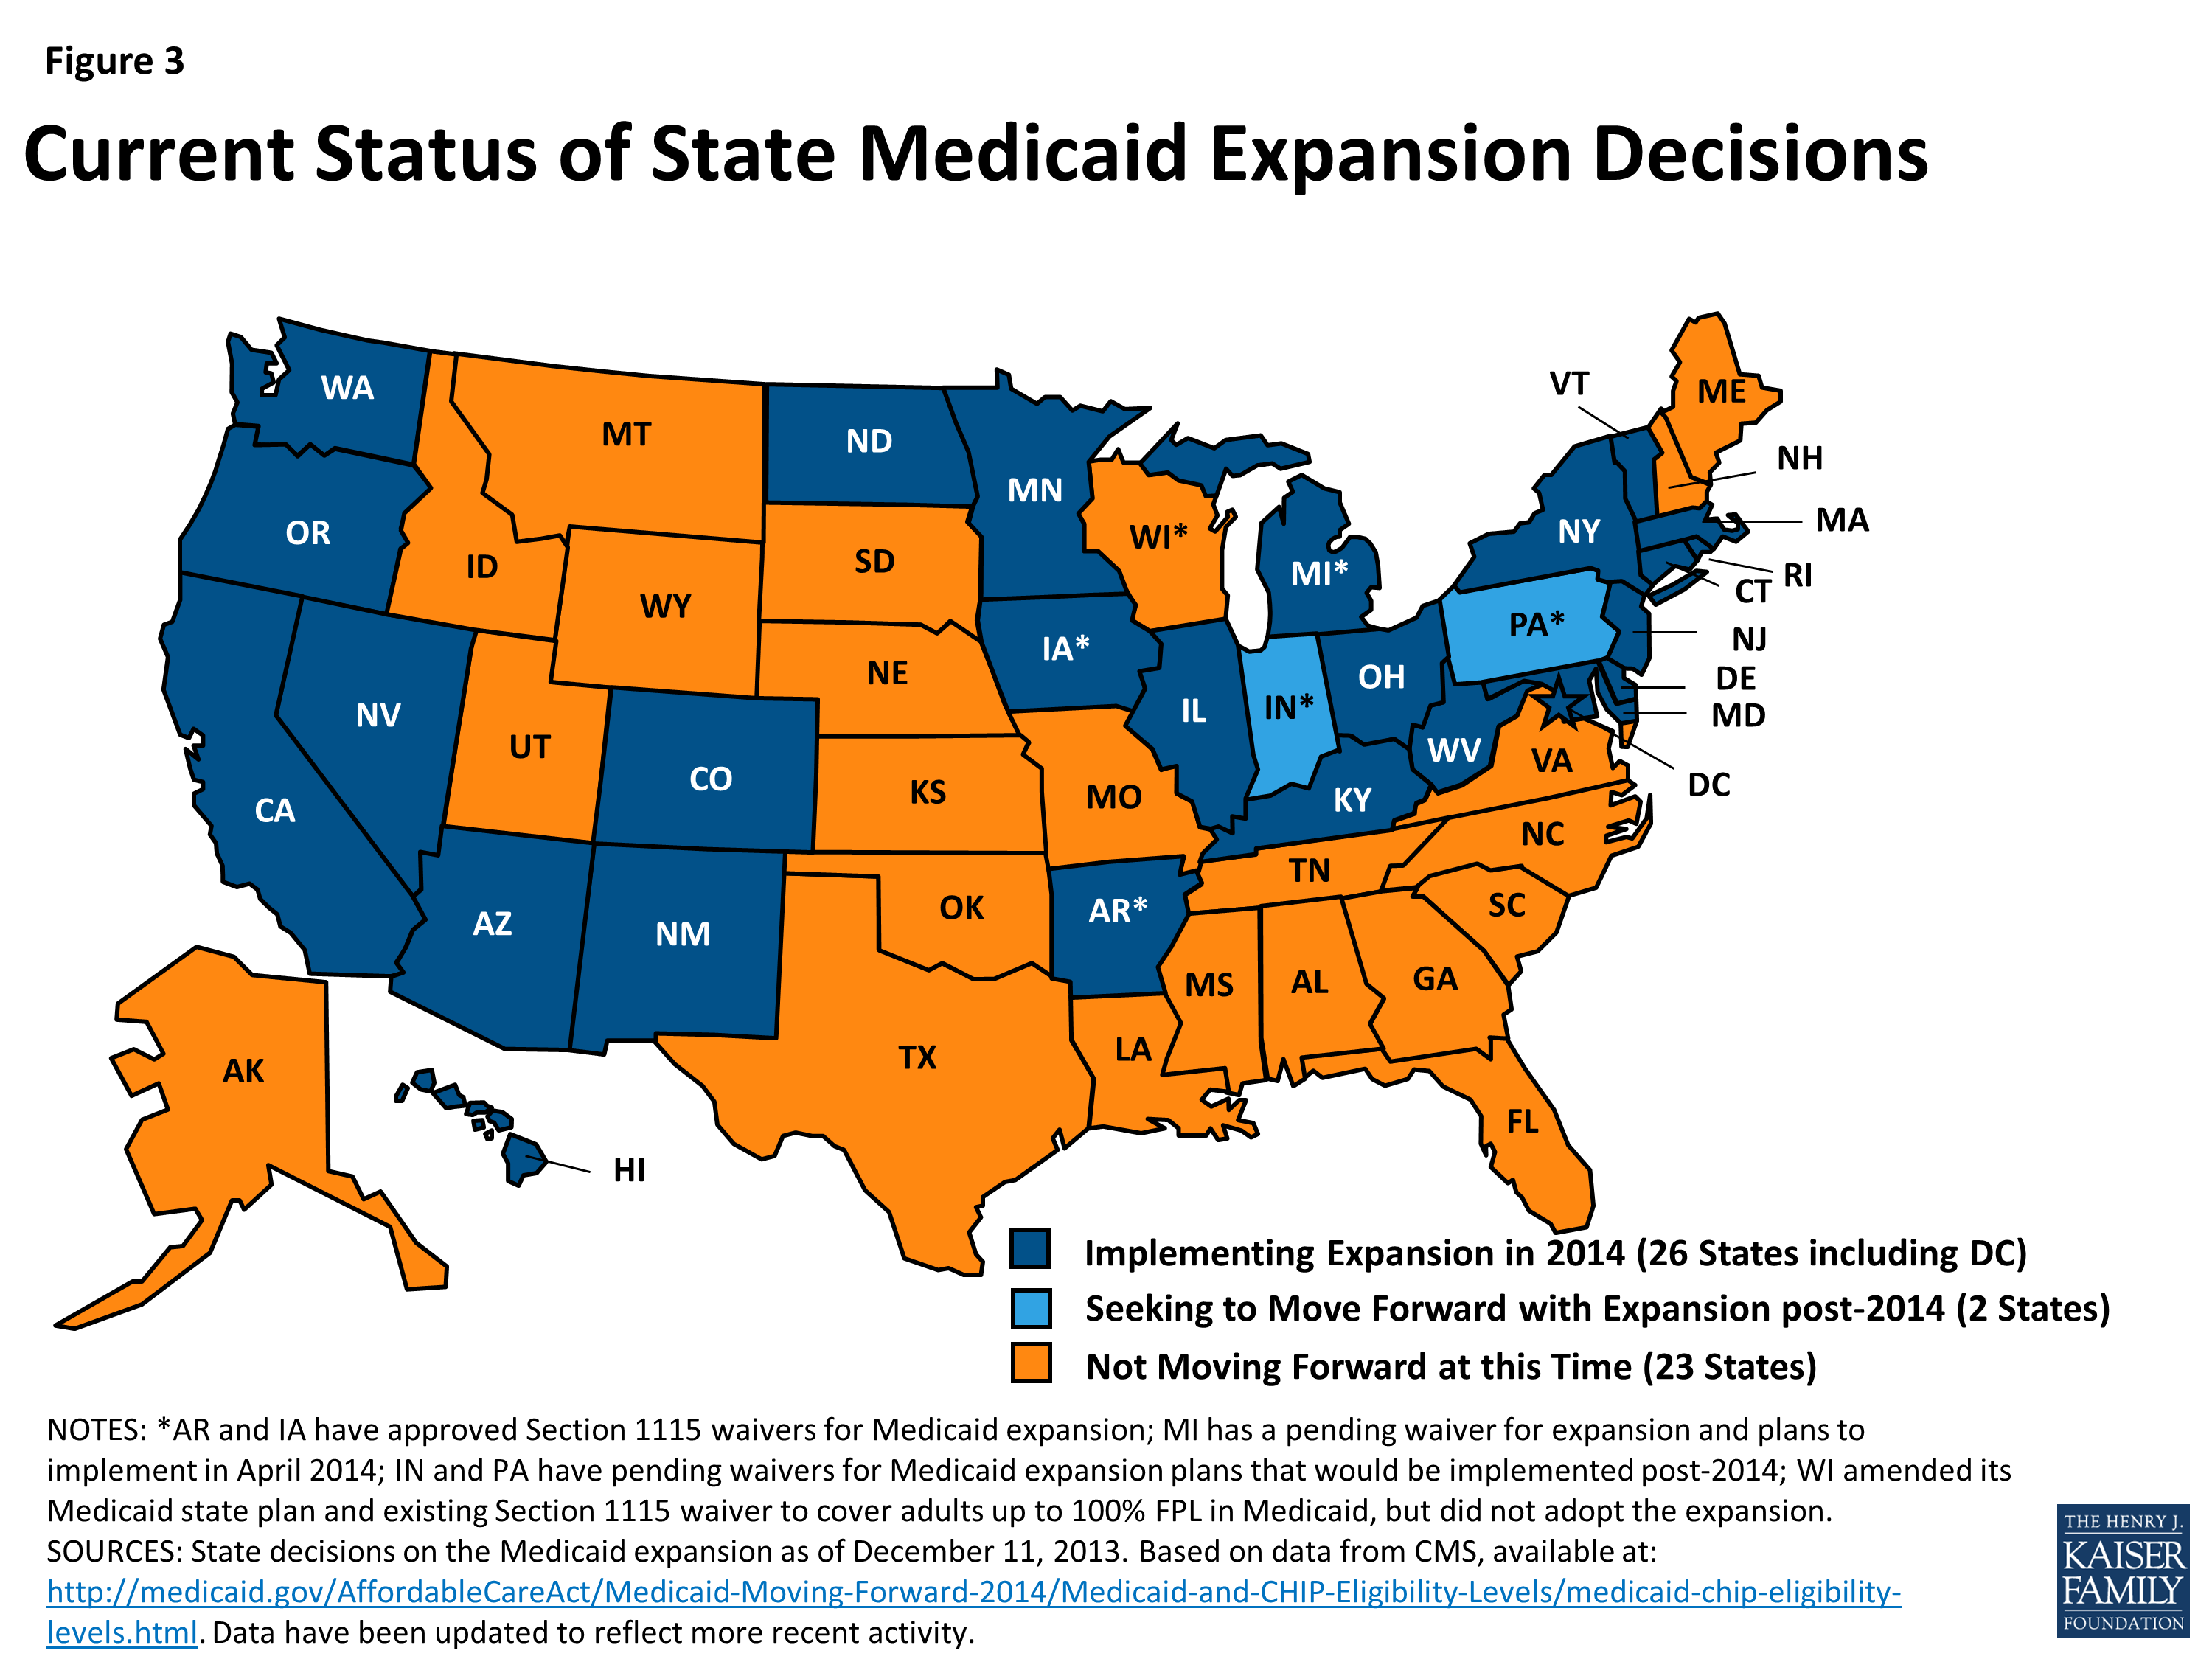
Figure 3: Current Status of State Medicaid Expansion Decisions
Going forward, states that implement the expansion are expected to experience higher Medicaid enrollment growth compared to states that have not expanded at this time. However, from June 2012 to June 2013 enrollment growth rates across the program are similar in expanding states (1.7 percent) and not-expanding states (1.2 percent.) Looking back over several years, those states expanding in 2014 have generally had slightly higher growth rates than states not planning to expand, though the growth rates were quite similar. (Figure 4)
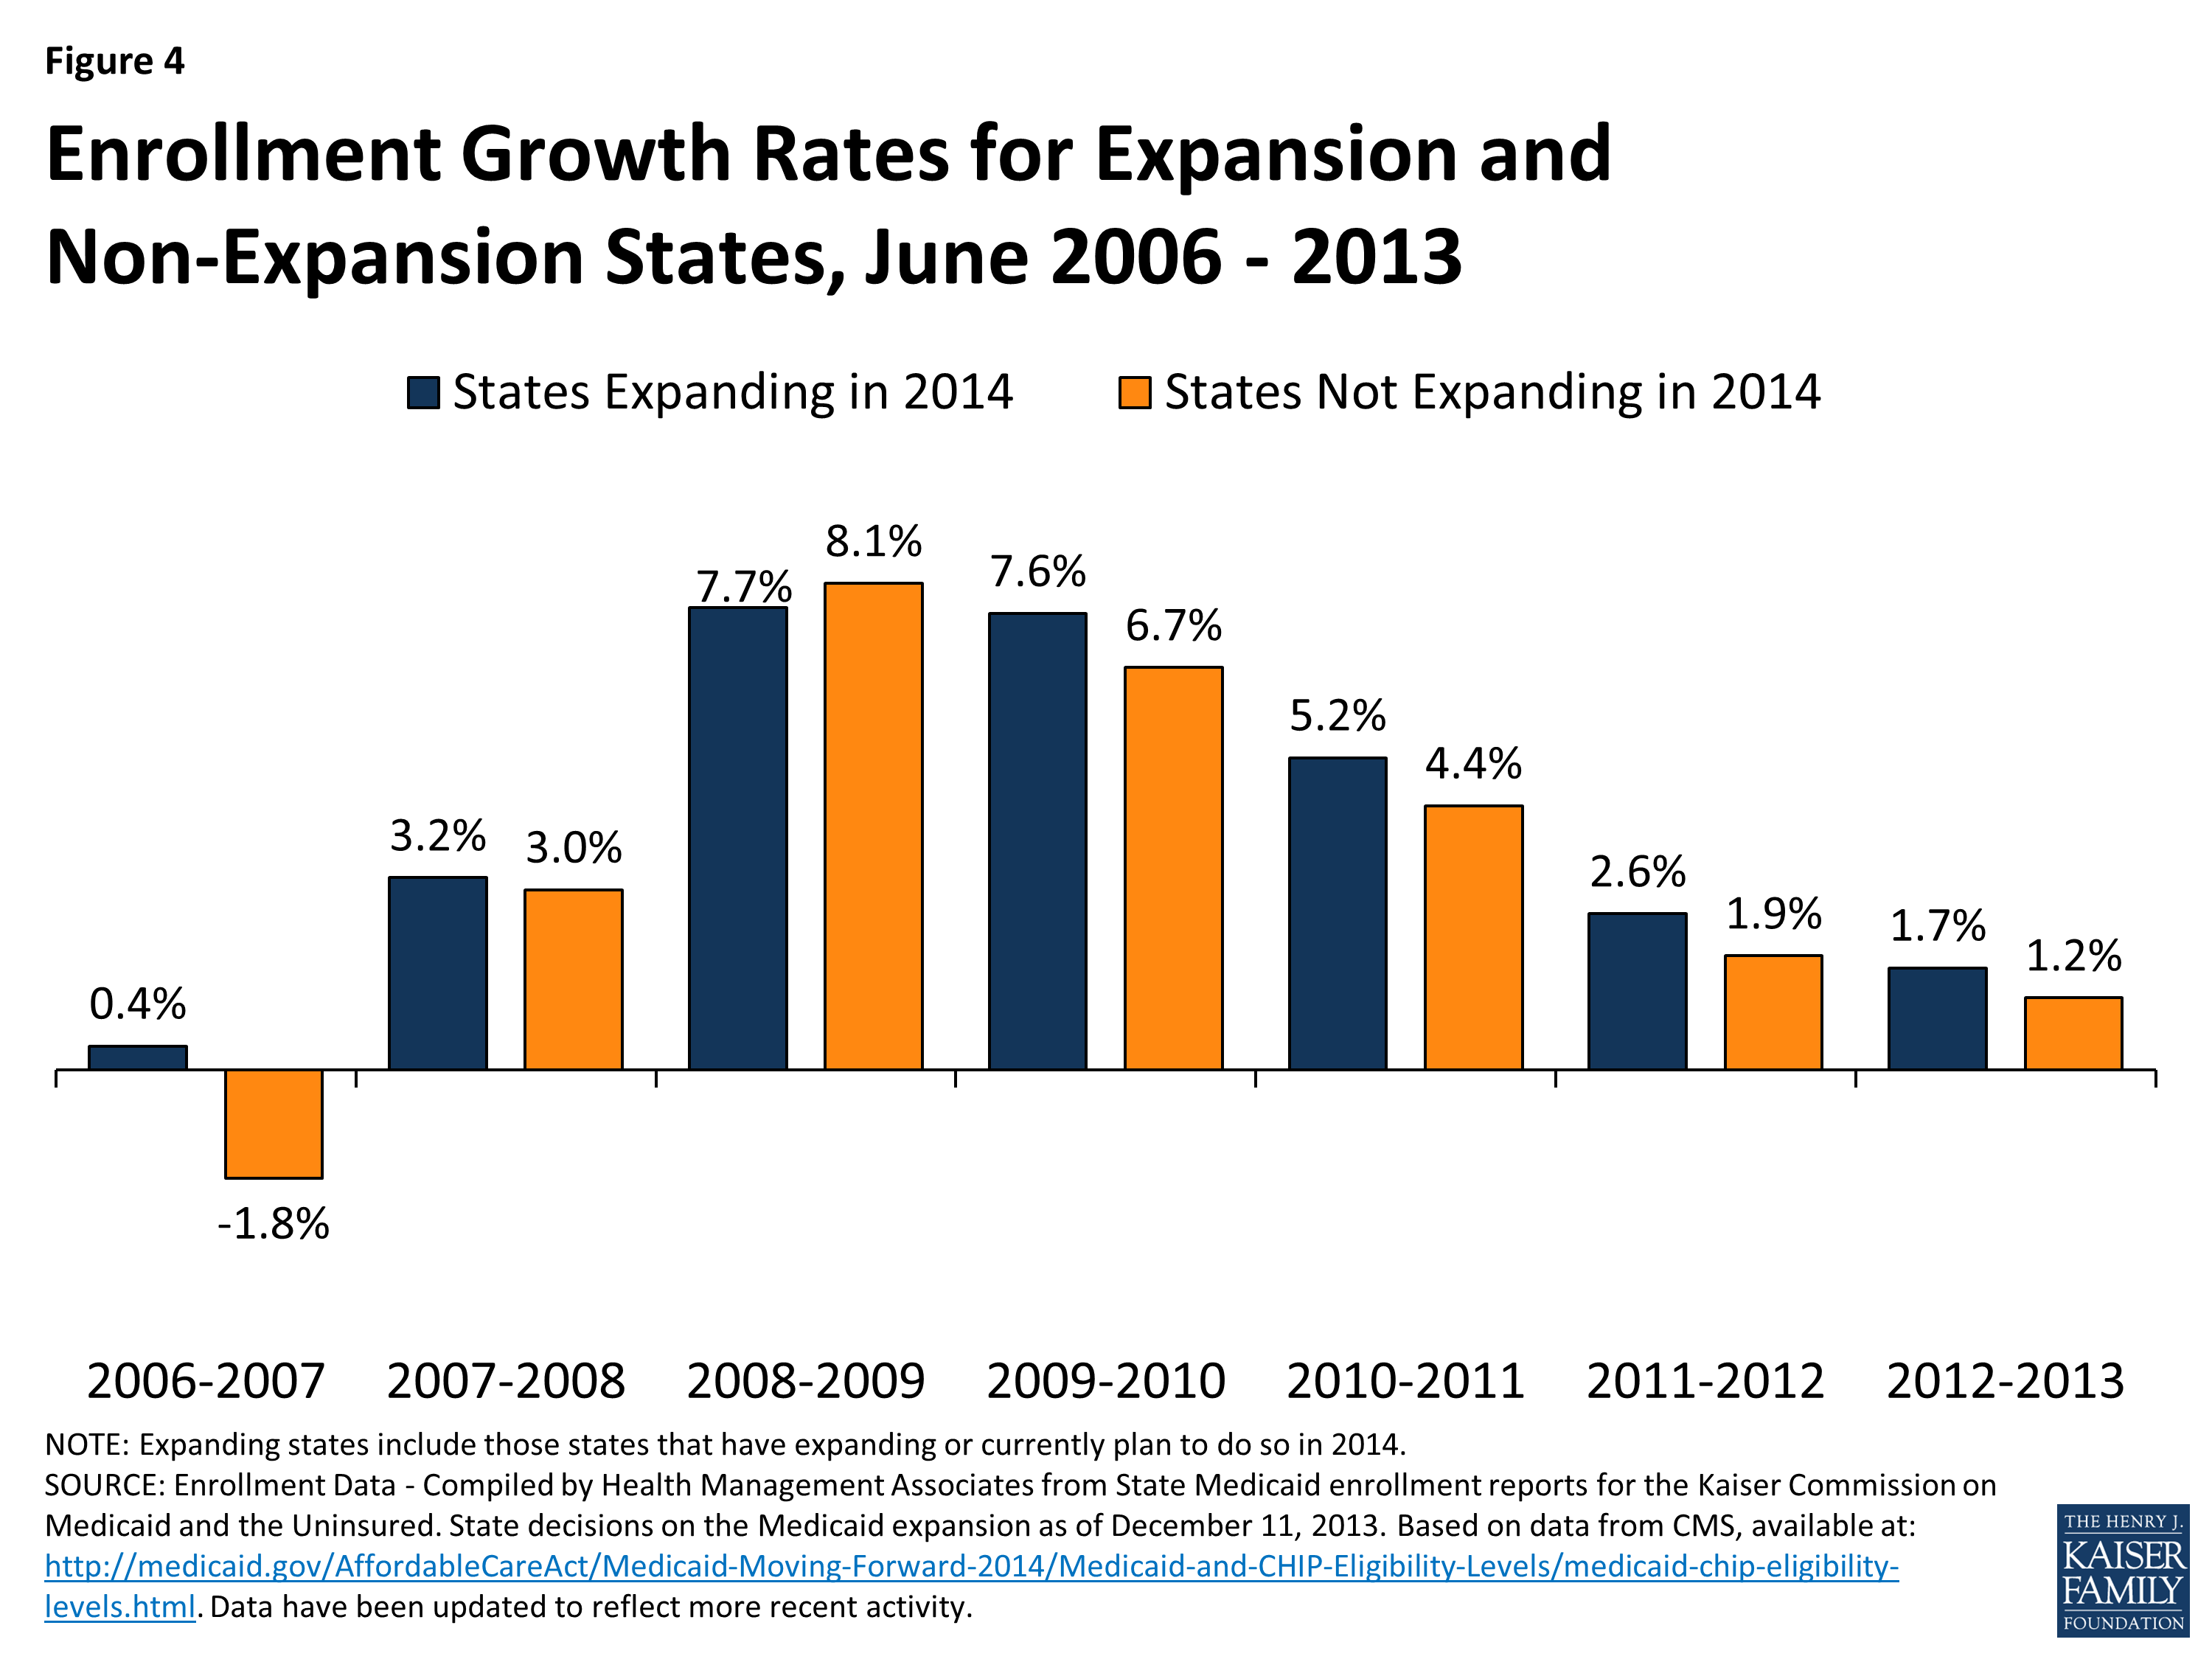
Figure 4: Enrollment Growth Rates for Expansion and Non-Expansion States, June 2006 – 2013
Cross State Trends. Across the country, enrollment in Medicaid reached 55 million as an additional 814,200 individuals enrolled in coverage between June 2012 and June 2013. Almost half of this enrollment growth was accounted for in three states (New York, Florida, and California). (Figure 5) Florida and New York saw enrollment growth across many parts of their programs. On the other hand, enrollment growth in California was driven by growth in its Low Income Health Program (LIHP), a county-based adult Medicaid expansion, discussed in more detail in a later section.
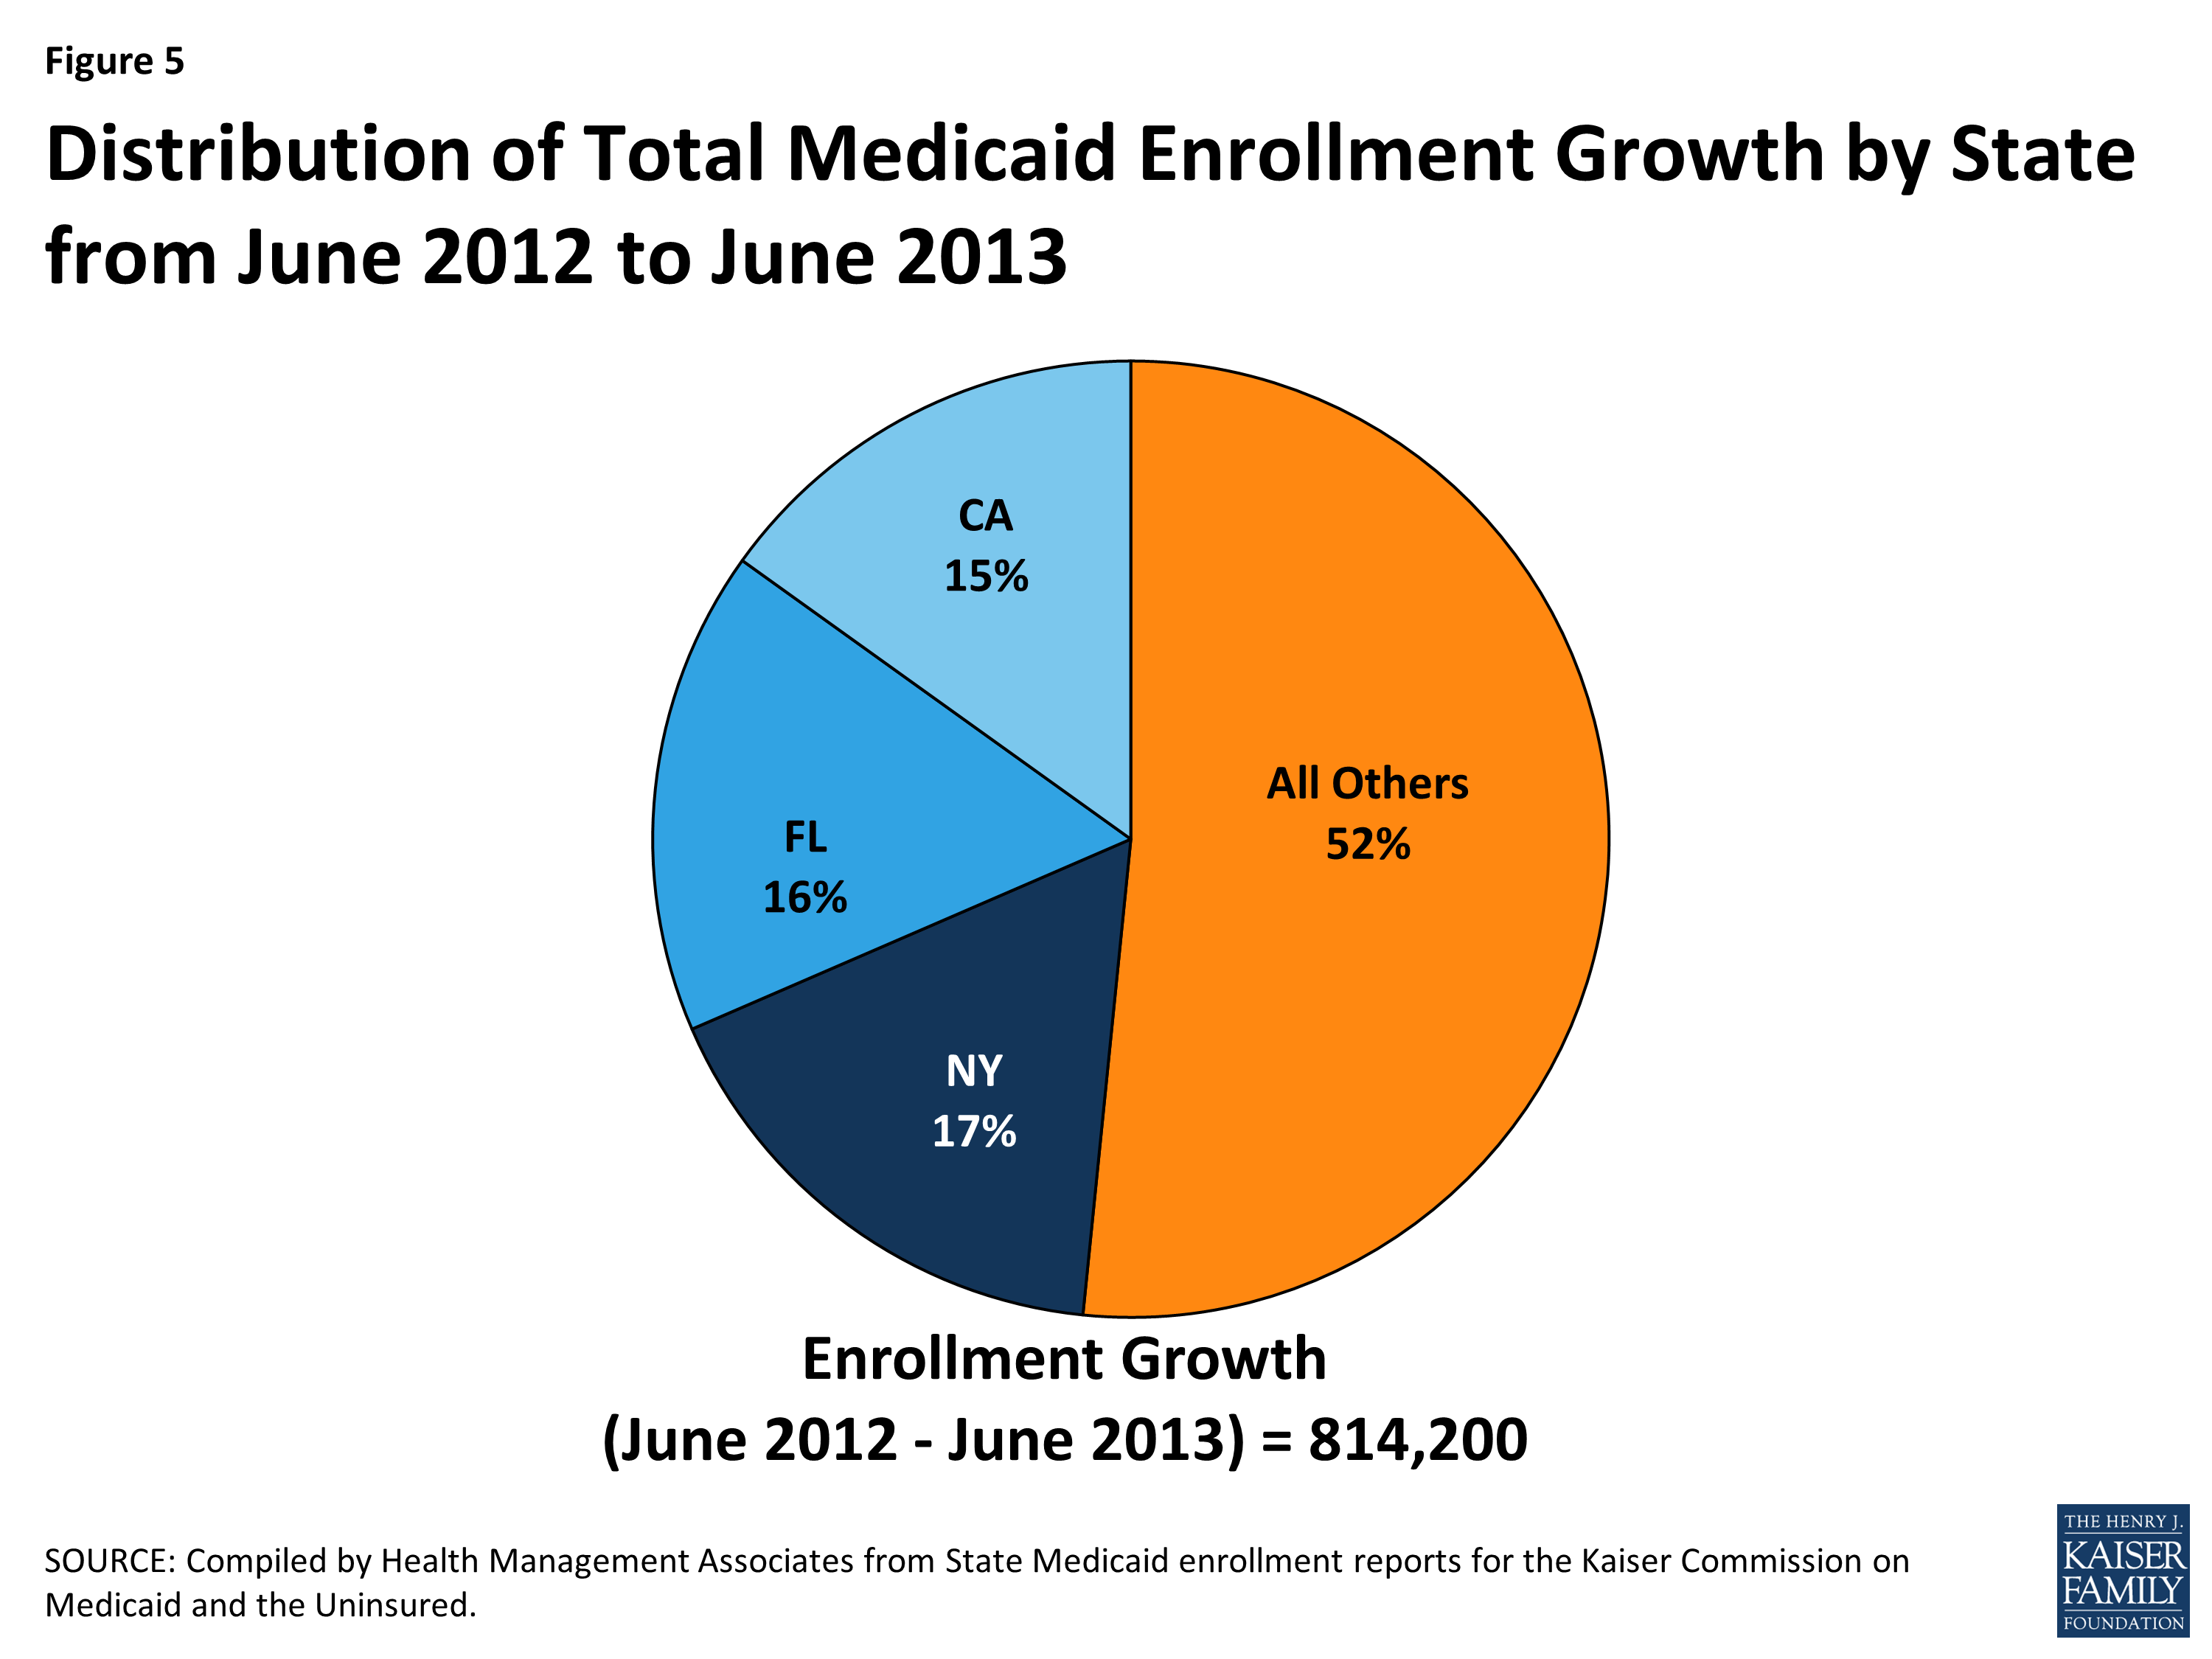
Figure 5: Distribution of Total Medicaid Enrollment Growth by State from June 2012 to June 2013
In contrast, declines in enrollment between June 2012 and June 2013 occurred in 13 states. (Figure 6) Three of these states with some of the larger declines during this period (Arizona, Maine and Wisconsin) have recently implemented eligibility restrictions for non-disabled, non-elderly adults that were exempted from the MOE provisions; these restrictions are also discussed in further detail in a later section.
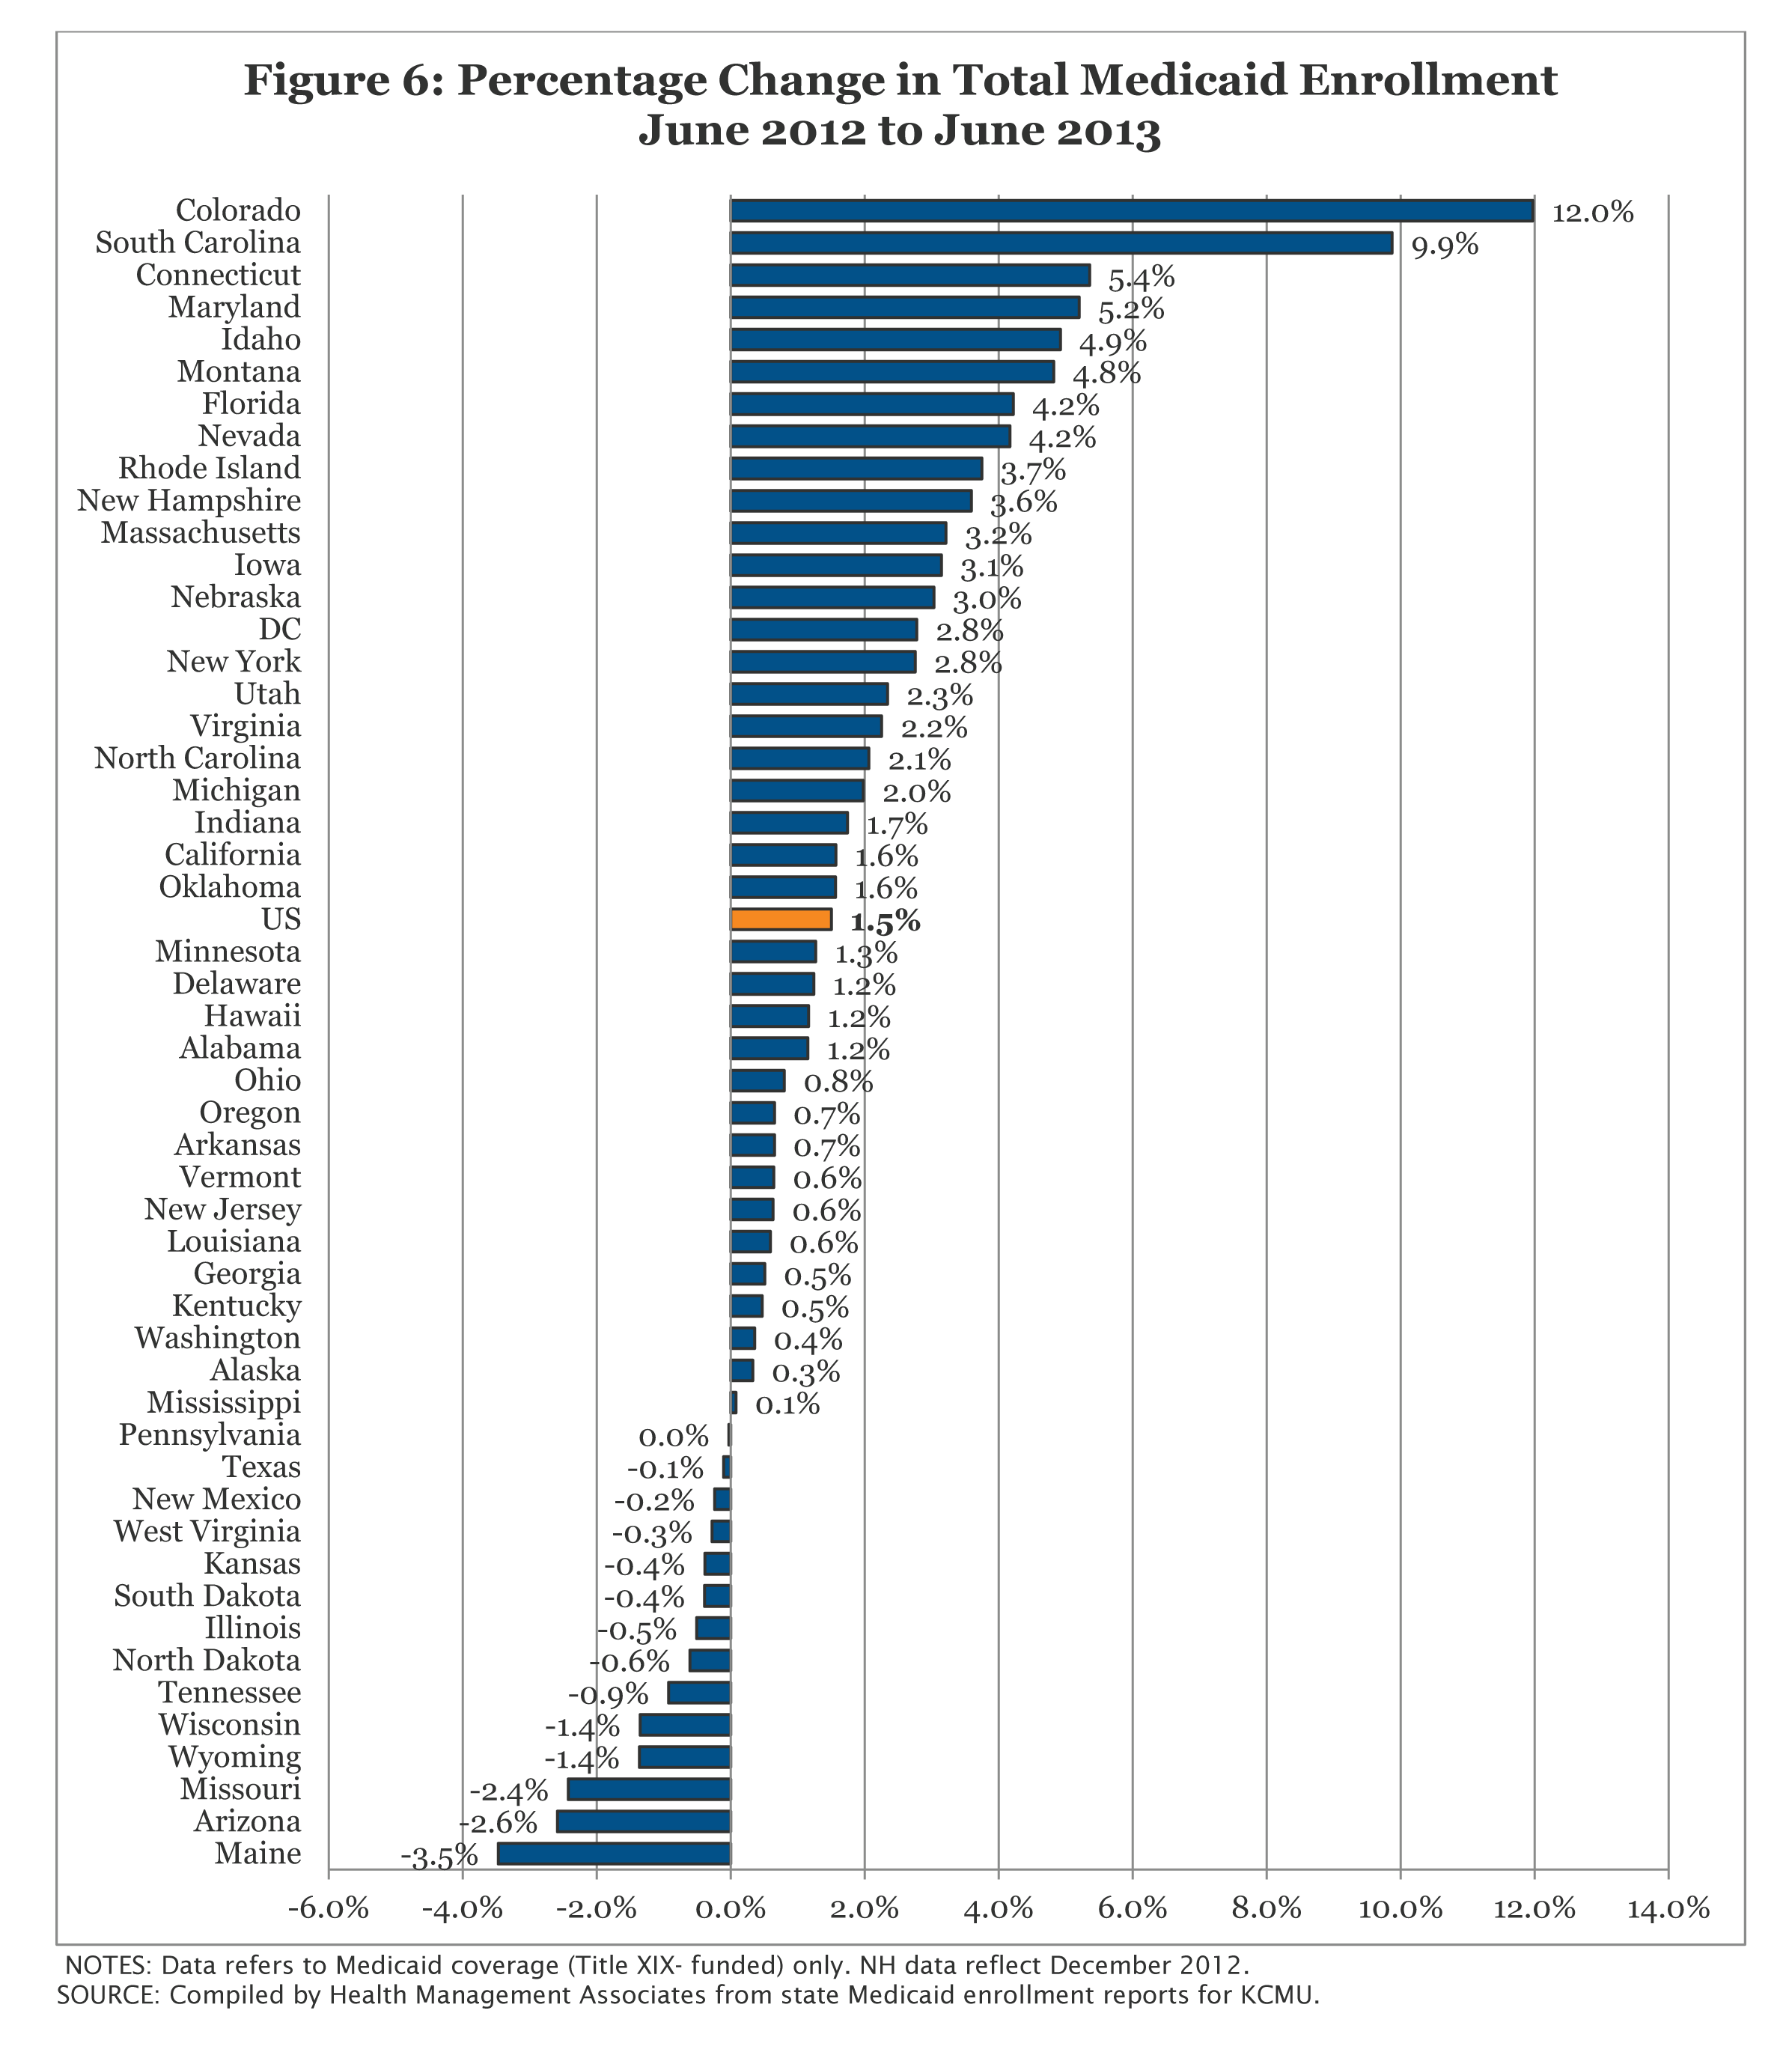
Figure 6: Percentage Change in Total Medicaid Enrollment June 2012 to June 2013
In terms of percentage change from one year to the next, enrollment grew at a slower pace than in the prior annual period in 34 states. Colorado and South Carolina were the only states that experienced double digit growth; both of these states have implemented a number of policy changes and eligibility expansions recently that are discussed in later sections.
Non-Disabled, Non-Elderly Enrollees
In June 2013, nearly 40.2 million non-disabled, non-elderly individuals were enrolled in Medicaid programs across the country. This 40.2 million, which includes over 28 million children as well as nearly 12.2 million non-elderly, non-disabled adults (i.e. parents, pregnant women and childless adults), represents over 70 percent of all Medicaid enrollment.
Enrollment growth for this group is sensitive to changes in economic conditions. As shown in Figure 7, enrollment growth slowed and even declined as the economy improved in the years leading up to the Great Recession, and then peaked again between June 2008 and June 2009 at the height of the Great Recession. Since June 2007, just before the start of the Great Recession, an additional 12.6 million people enrolled in Medicaid programs across the country, nearly 10.2 million of whom were non-disabled, non-elderly individuals. As mentioned earlier, Medicaid programs, as well as CHIP programs, aided by maintenance of eligibility (MOE) provisions maintained under the ACA have played a critical role in staving off increases in the number of non-elderly uninsured, particularly children. Between 2007 and 2012, the uninsured rate for children dropped from 10.9 percent to 9.2 percent, despite a decrease in the share of children with employer-sponsored coverage. Additionally, the uninsured rate for non-elderly individuals declined in 2011 and 2012 for the first time since the start of the Great Recession; this decline was primarily driven by increases in Medicaid coverage among adults.1

Figure 7: Annual Change in Medicaid Enrollment for Non-Disabled, Non-Elderly Enrollees , June 2006 to June 2013
In June 2013, an additional 593,500 non-disabled, non-elderly individuals were enrolled in Medicaid compared to the same month one year earlier. Enrollment growth has slowed for this group, falling to the lowest growth rate since the start of the Great Recession (1.5 percent), reflecting improvements in the economy. Enrollment growth for this population was driven by increased enrollment among adults as well as children. Nearly 60 percent of the most recent annual enrollment growth for this group was due to increased adult enrollment. (Figure 8)

Figure 8: Distribution of Annual Enrollment Growth among Non-Disabled, Non-Elderly Enrollees by Group, June 2013
Cross state trends in enrollment for non-disabled, non-elderly adults and non-disabled children are discussed separately below. Enrollment trends for adult expansions are discussed in a separate appendix (Appendix B) at the end of this report.
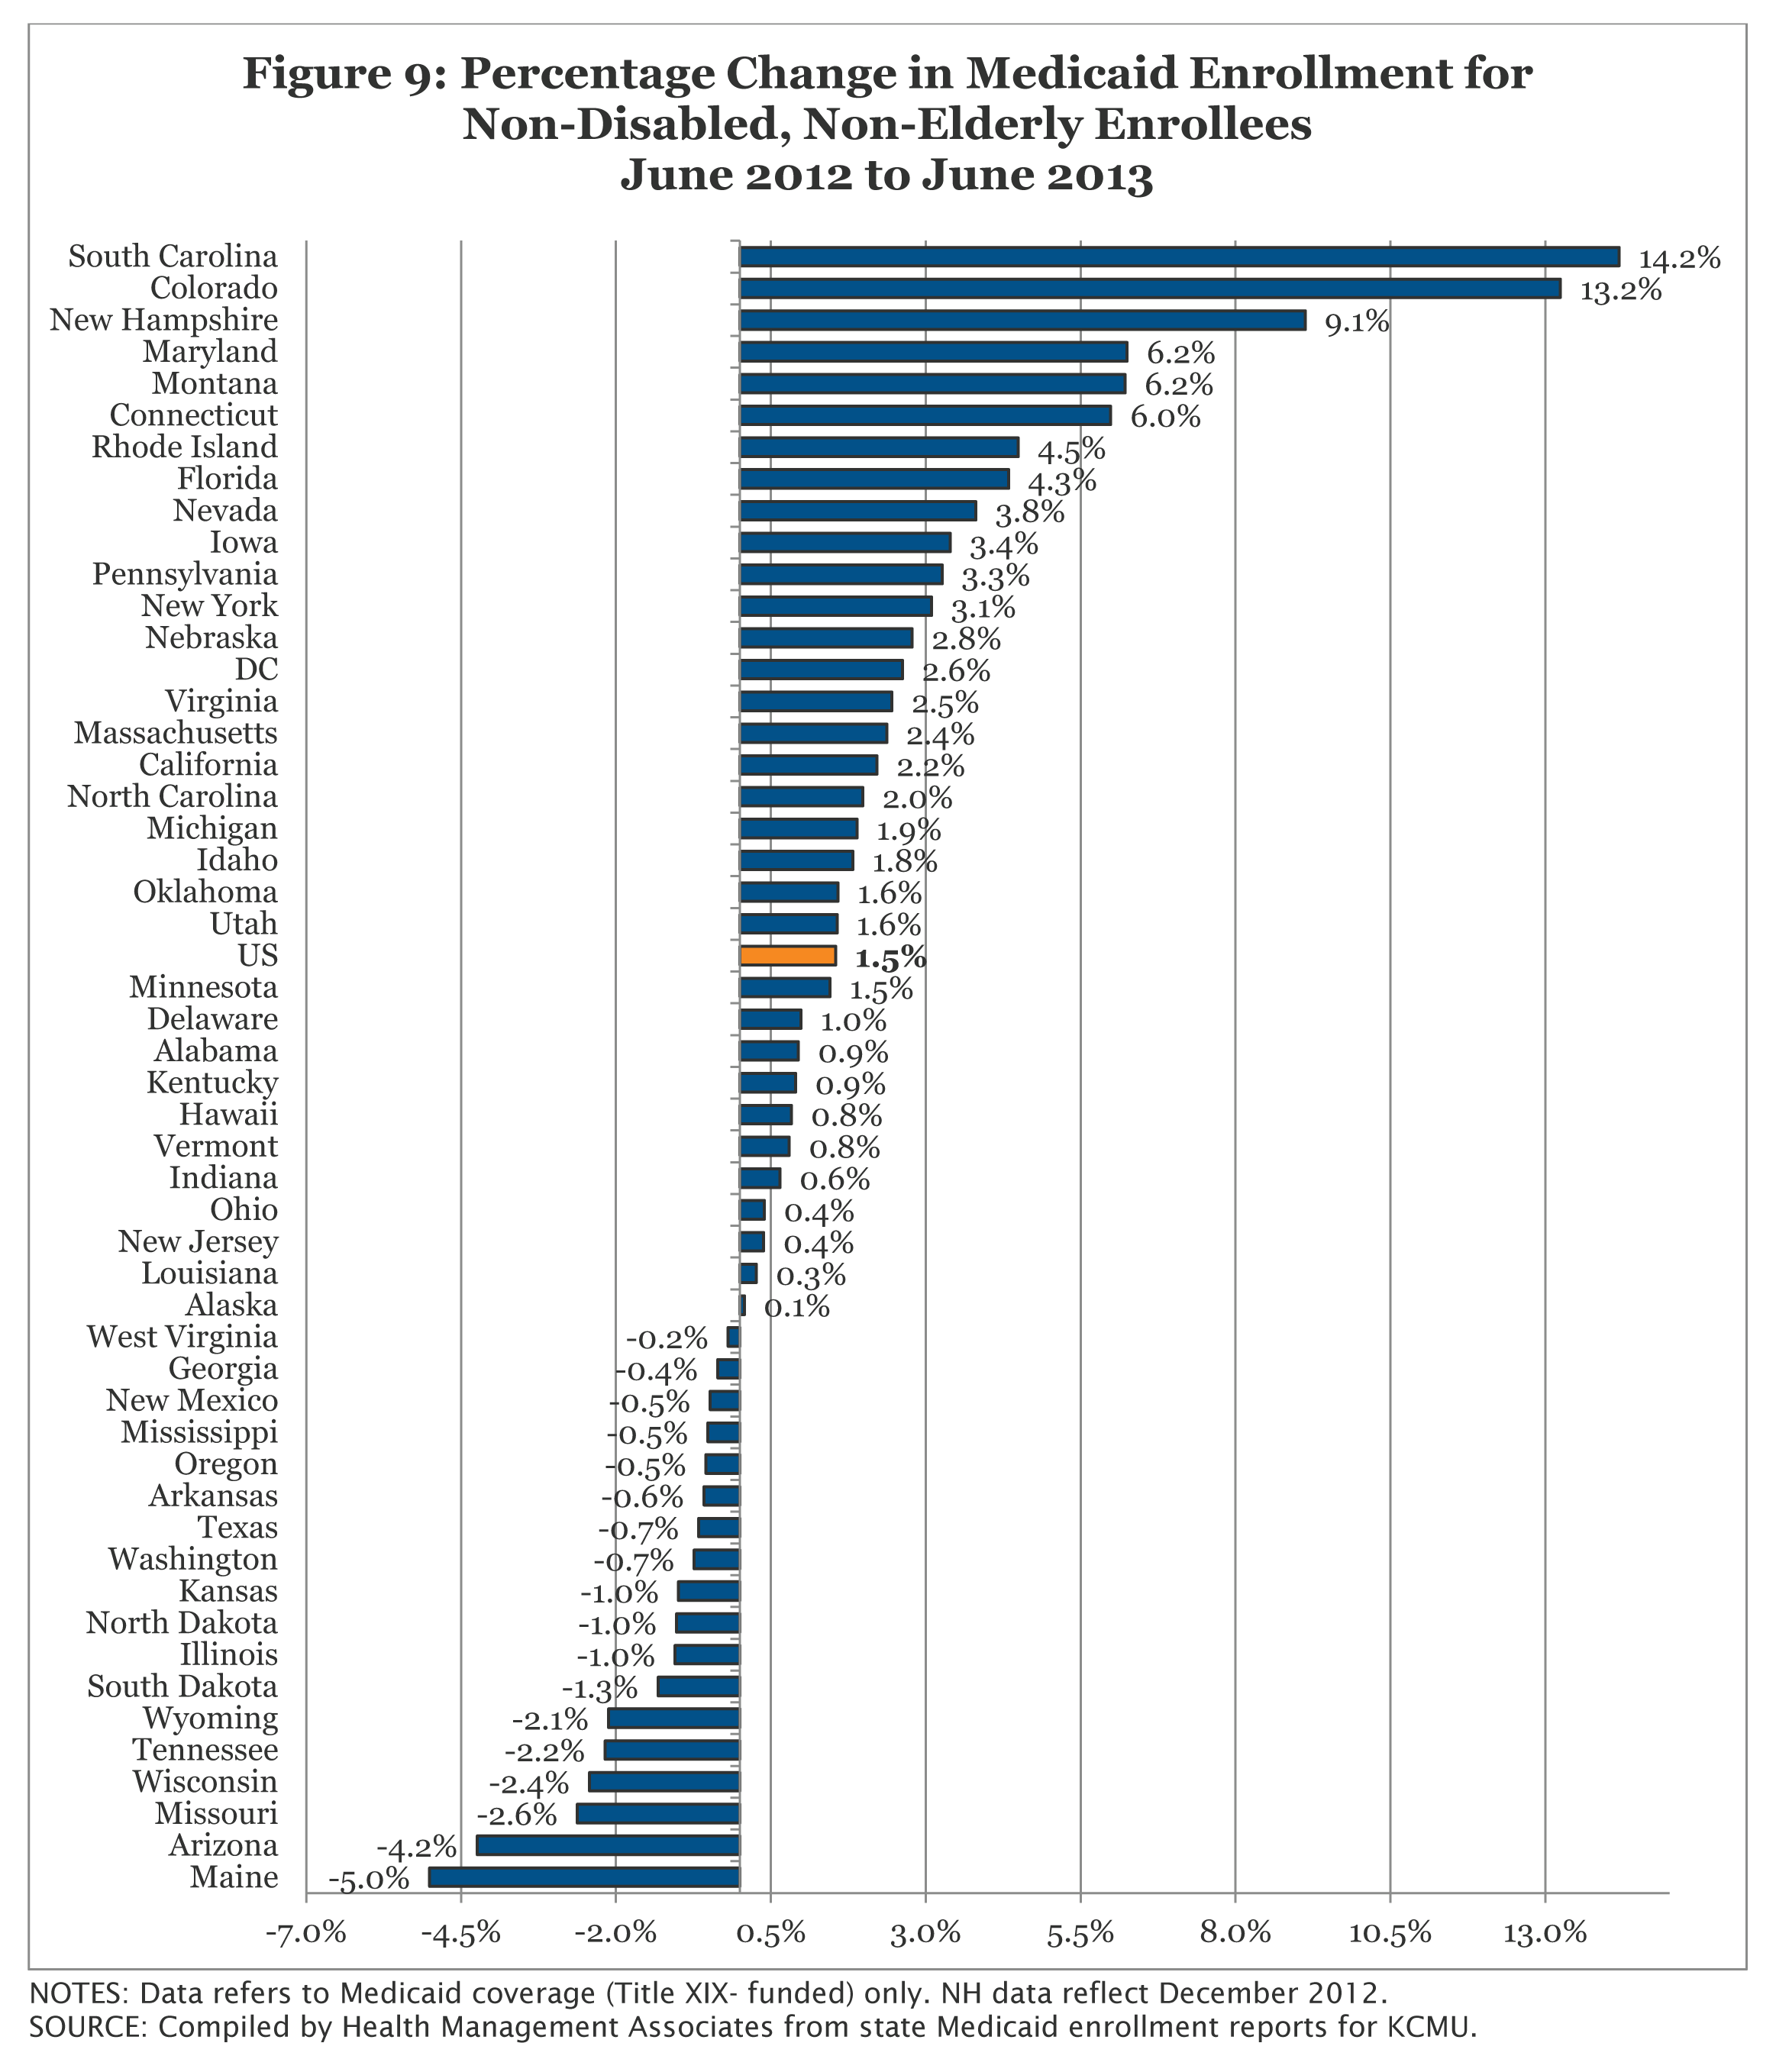
Figure 9: Percentage Change in Medicaid Enrollment for Non-Disabled, Non-Elderly Enrollees June 2012 to June 2013
Non-Disabled, Non-Elderly Adults
In June 2013, nearly 12.2 million non-disabled, non-elderly adults were enrolled in Medicaid programs across the country. In spite of some states expanding eligibility, enrollment growth among this group has fallen to a post-recessionary low at 2.9 percent. An additional 342,000 adults were enrolled in Medicaid programs between June 2012 and June 2013; over two-thirds of this growth occurred in two states (California and New York.) (Figure 10)
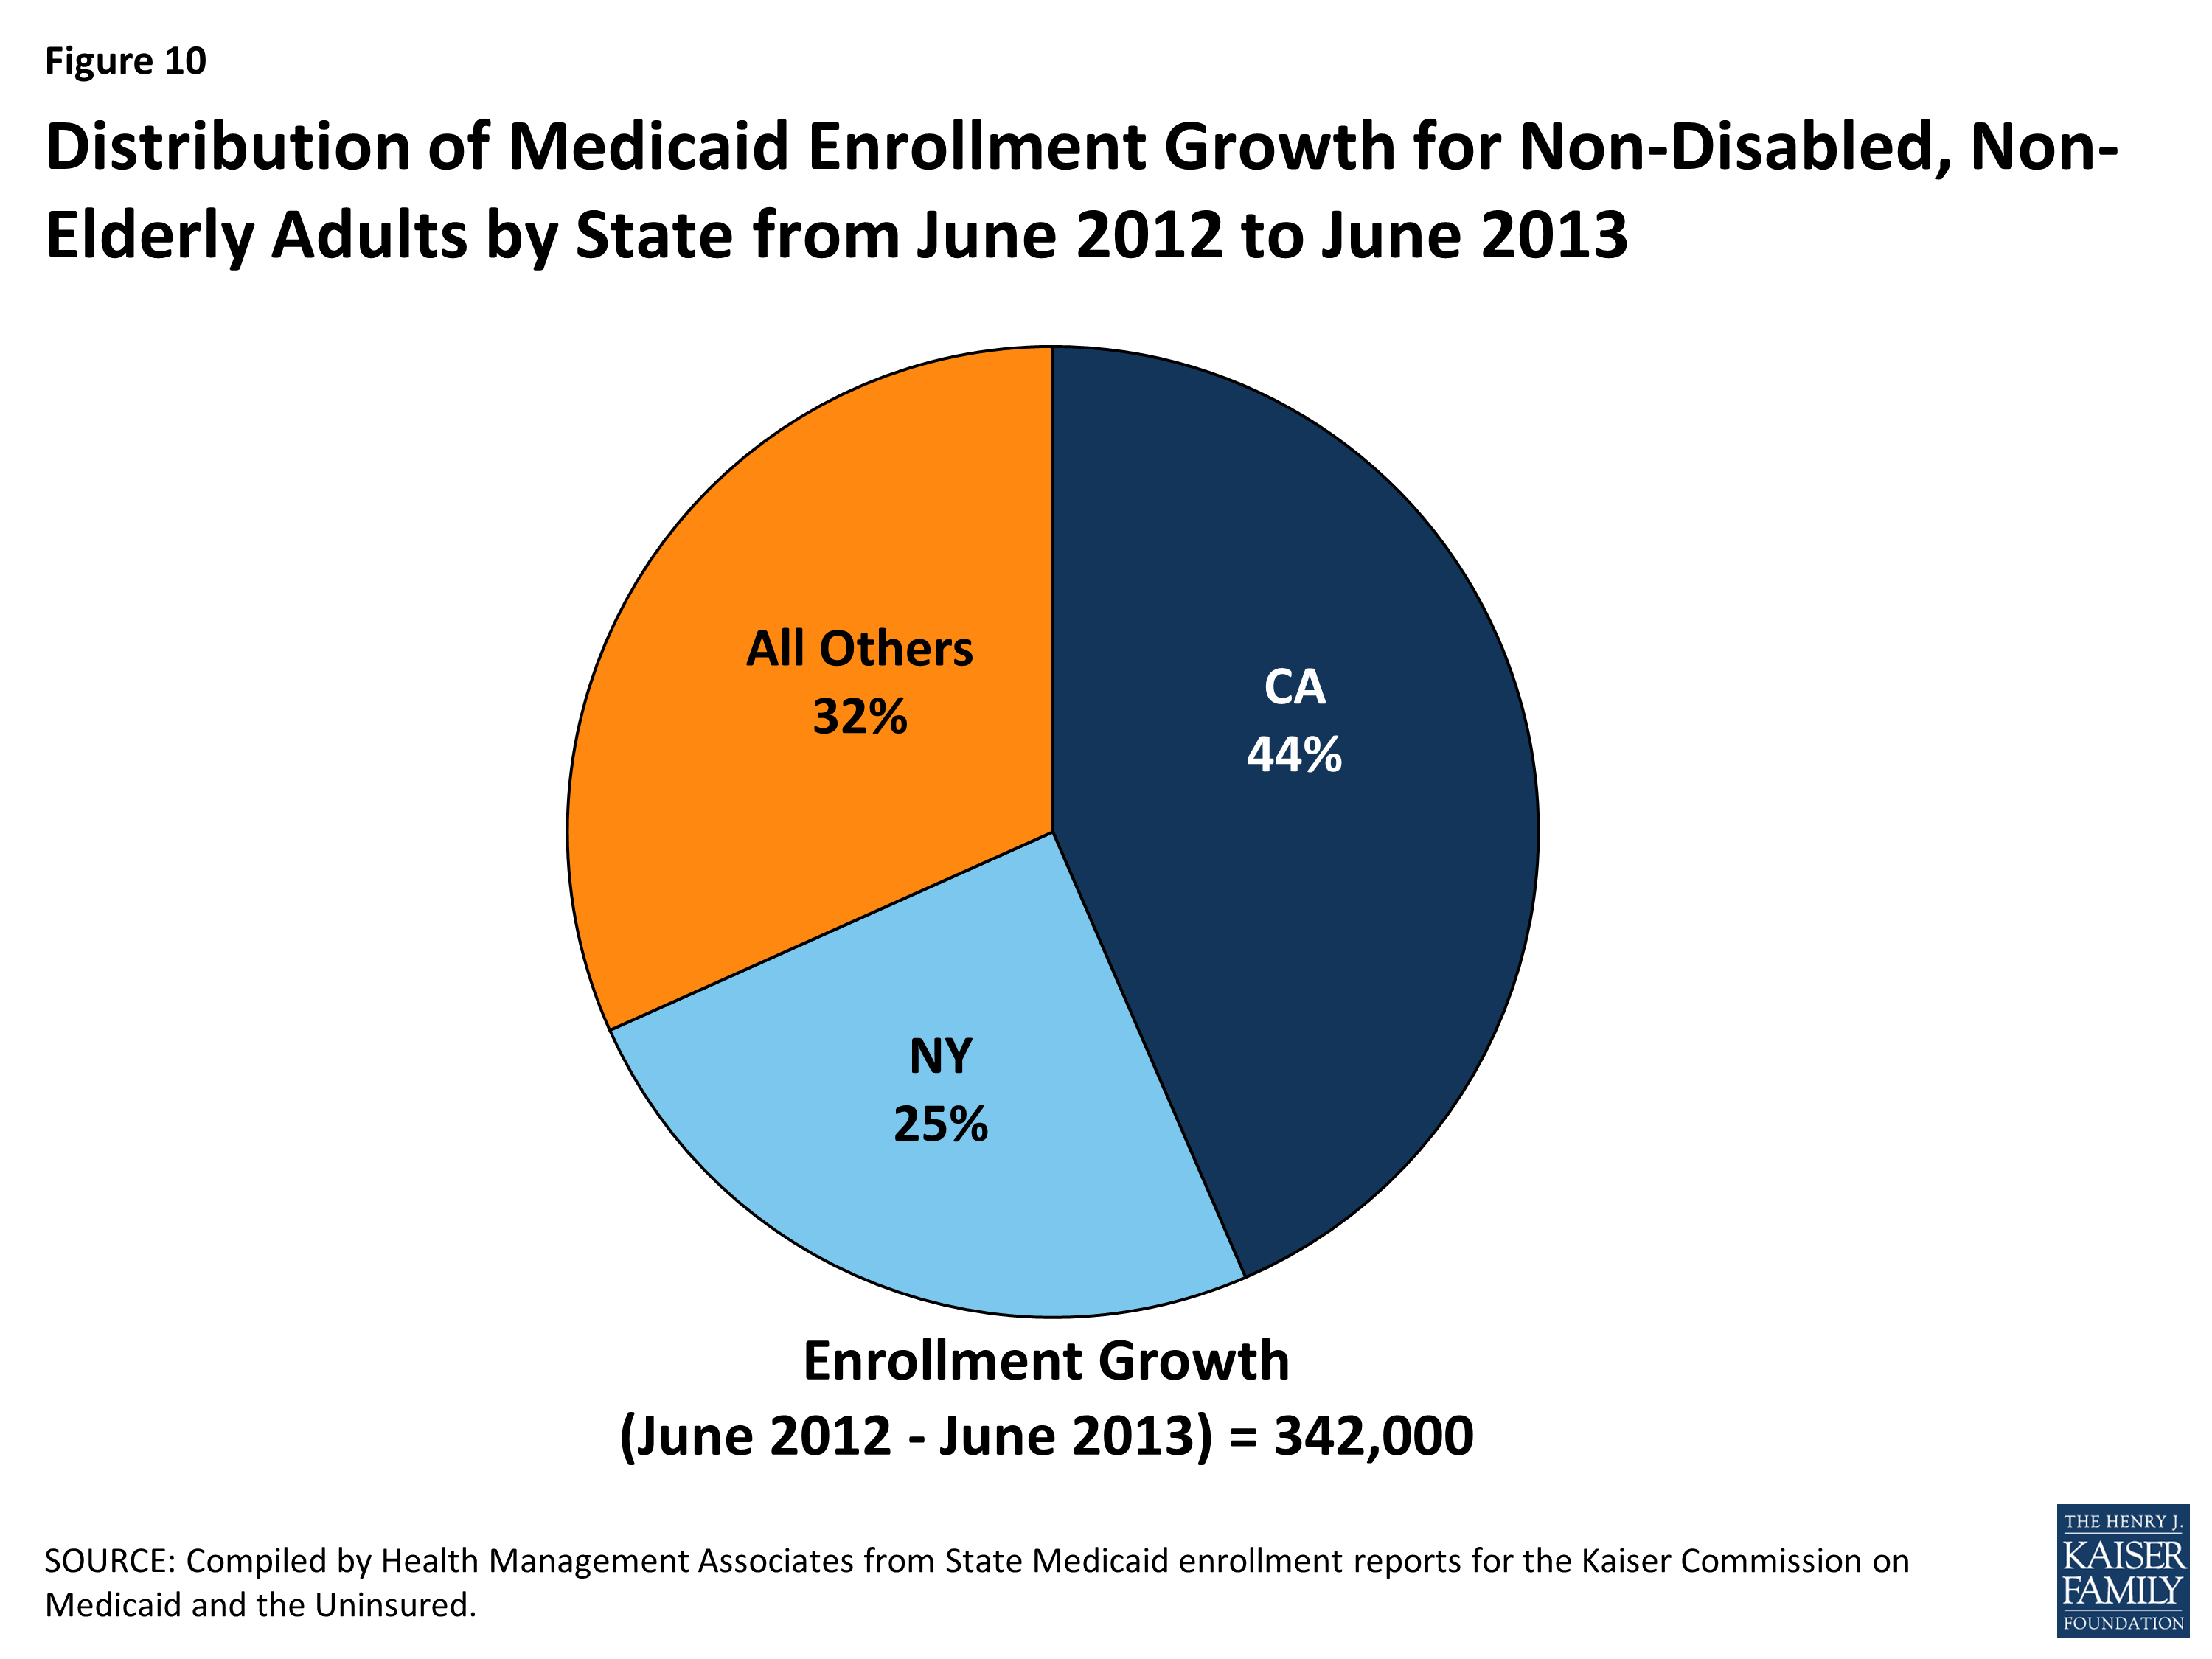
Figure 10: Distribution of Medicaid Enrollment Growth for Non-Disabled, Non-Elderly Adults by State from June 2012 to June 2013
- California’s increase among adults enrolled in Medicaid was driven by continued growth in its Low Income Health Program (LIHP.) Enacted as part of the state’s Bridge to Reform waiver, LIHP allows counties to expand eligibility to adults with incomes up to 133 percent FPL.1 Counties began LIHP enrollment in July 2011; California’ LIHP enrollment continued to rise as an additional 161,414 adults enrolled between June 2012 and June 2013.
- New York saw an additional 83,800 adults enrolled in Medicaid during this same period. Growth may have been driven by implementation of 12 month continuous eligibility for several groups, including children and adults, in April 2013.2
Five states (Colorado, Pennsylvania, Idaho, Connecticut, and Maryland) saw double digit growth among this group during the period from June 2012 to June 2013 (Figure 11); three of these states (Colorado, Connecticut and Maryland) have expanded coverage to childless adults recently. During this same period, 20 states saw declines in enrollment among non-elderly adults. The largest declines occurred in Arizona, Maine, and Wisconsin. Each of these states recently implemented eligibility restrictions permissible under exemptions from the MOE.
- Arizona saw 42,400 fewer adults enrolled in their Medicaid program driven by the continued decline among their childless adult population. As part of its waiver renewal, the state implemented an enrollment freeze for this population in July 2011. Between June 2012 and June 2013, 40,000 fewer childless adults were enrolled.
- Maine reported 12,900 fewer adults enrolled in Medicaid in June 2013 compared to one year earlier. This decline was driven by declines among their childless adult waiver program as well as among parents and step-parents. After certifying a budget shortfall to qualify for an exemption from the MOE provisions, the state reduced eligibility levels for parents from 200% FPL to 133% FPL in March 2013. Enrollment in the state’s childless adult waiver program has also been capped for several years.
- Wisconsin reported 34,800 fewer adults enrolled in Medicaid in June 2013 compared to one year earlier. Enrollment for childless adults under their waiver has been closed for several years. In July 2012, the state added premium requirements to this group. Wisconsin also changed its crowd-out policy for parents and adults with incomes over 133 percent FPL; if they have access to health insurance that cost 9.5 percent or less of income, they are excluded from coverage. A 12 month restrictive reenrollment period for non-pregnant, non-disabled adults over 133 percent FPL was also instituted for those that do not pay their premiums.3
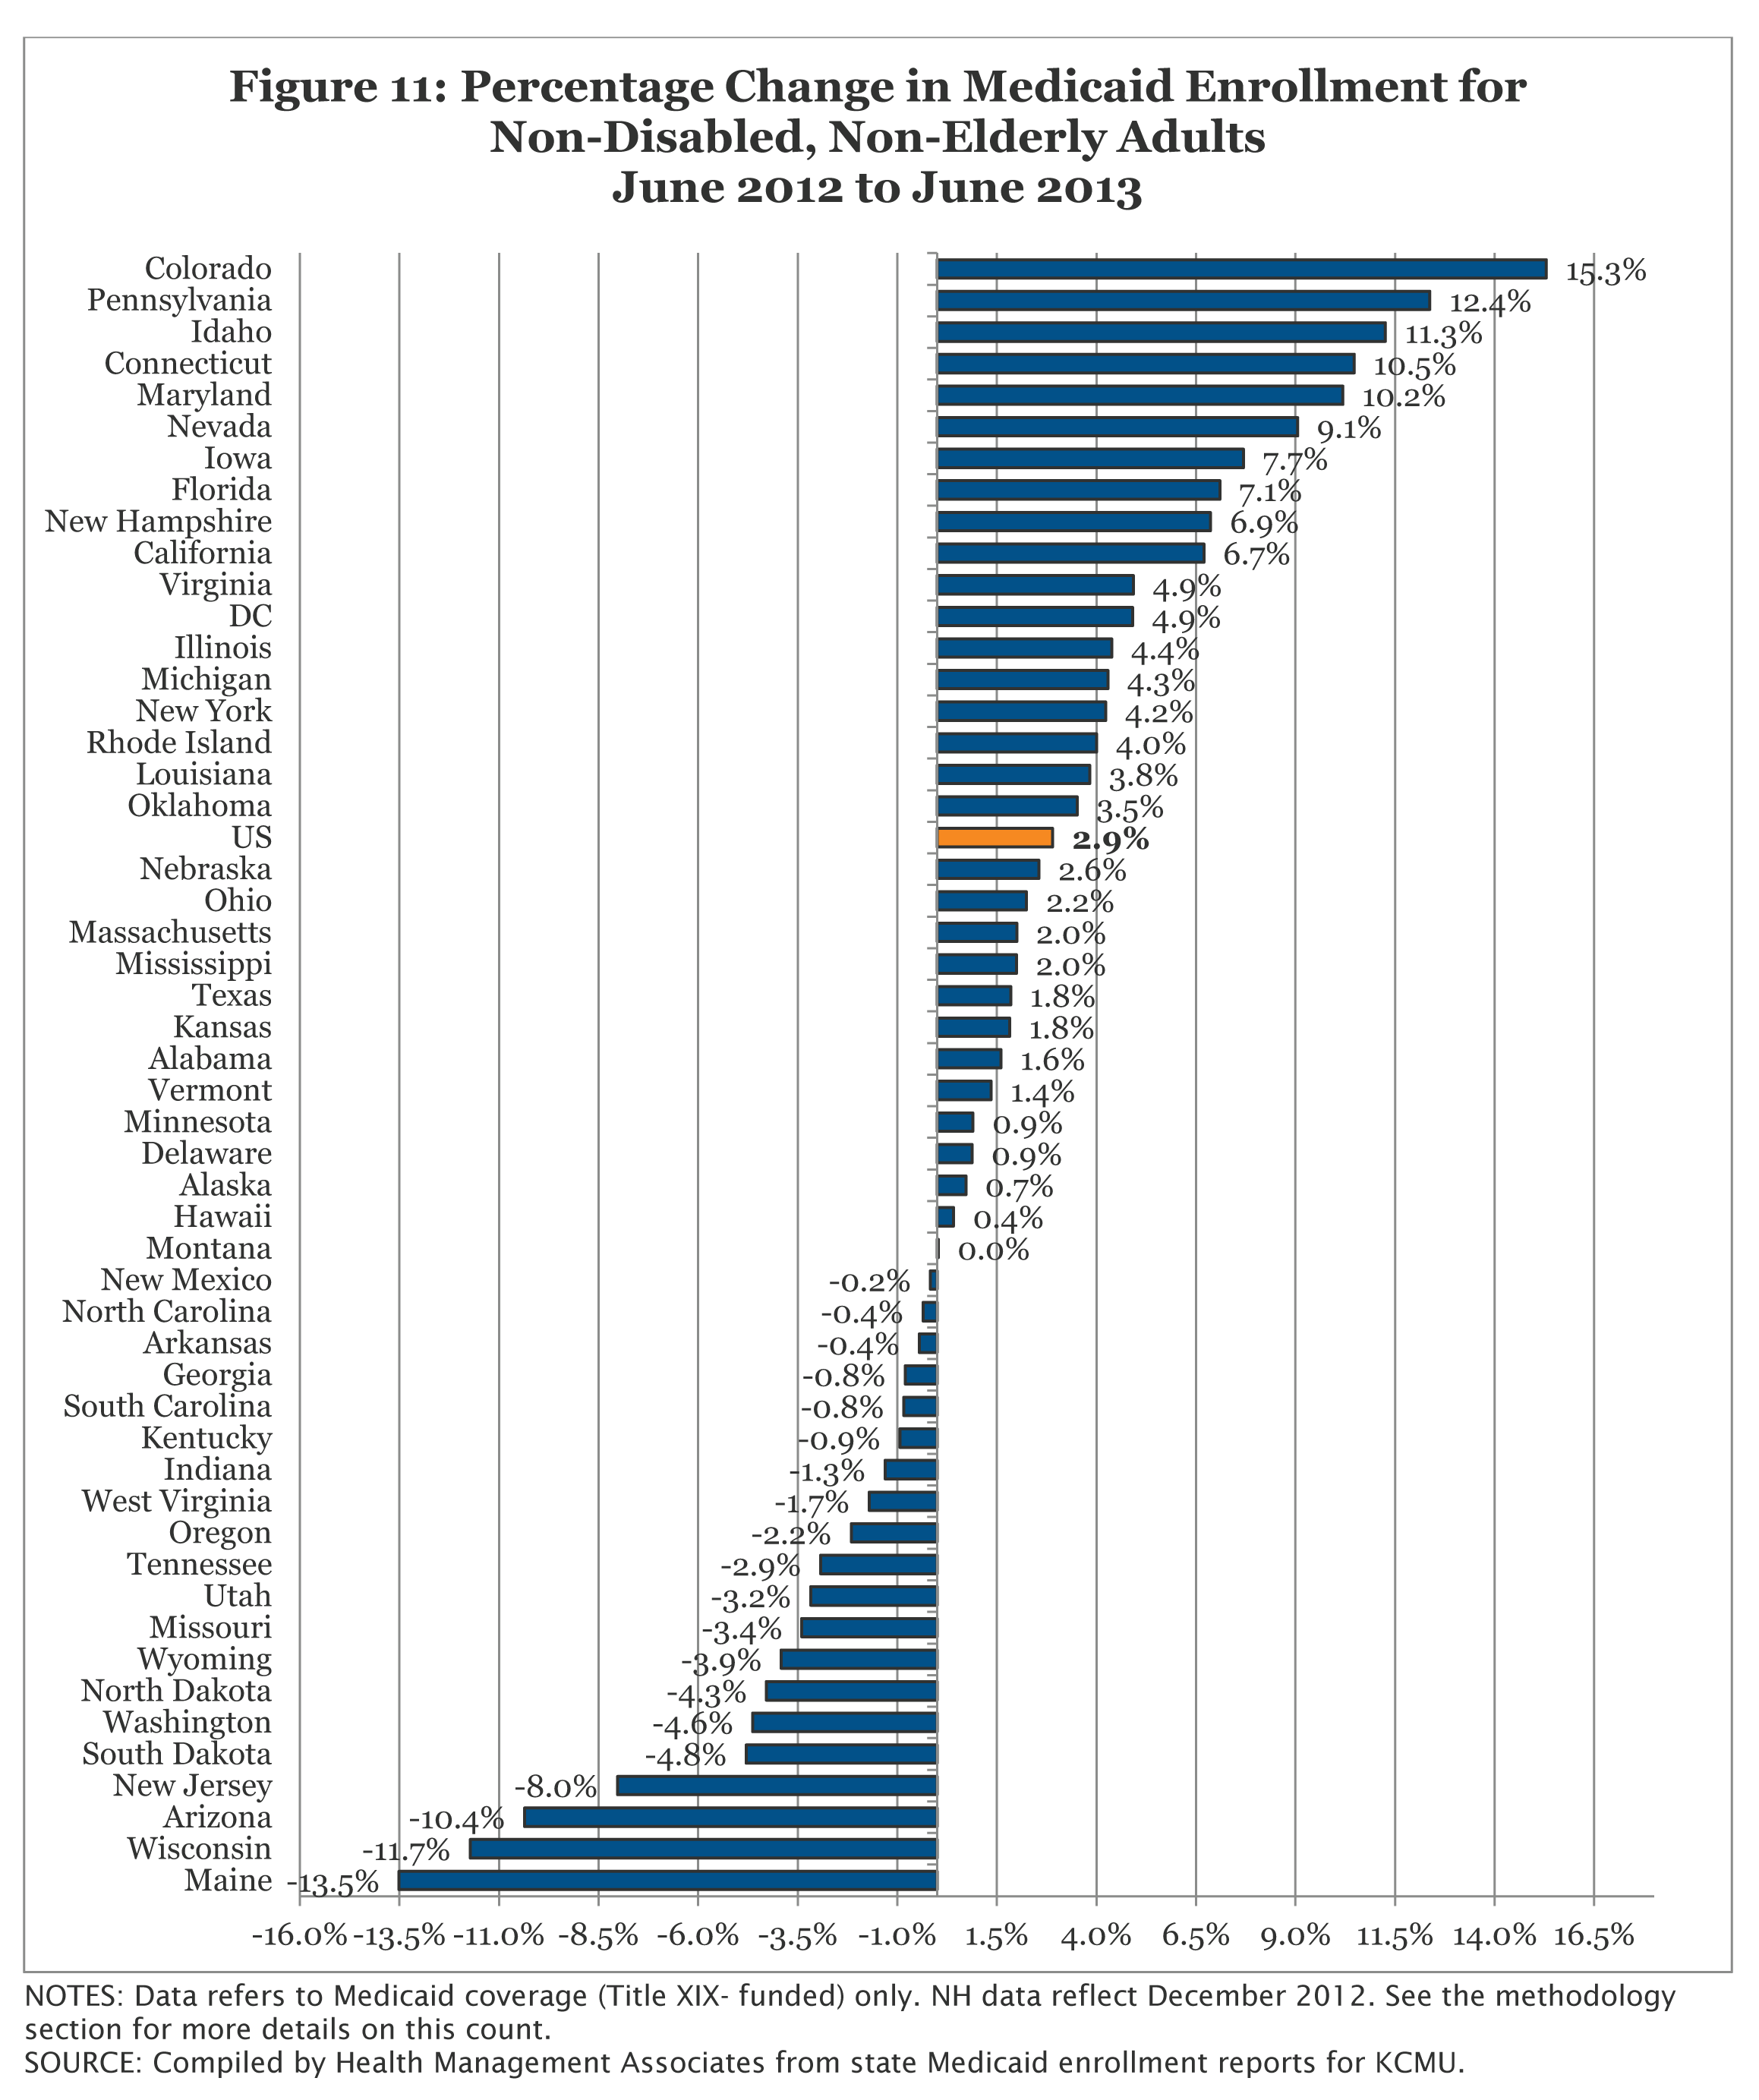
Figure 11: Percentage Change in Medicaid Enrollment for Non-Disabled, Non-Elderly Adults June 2012 to June 2013
Non-Disabled Children
In June 2013, over 28 million children were enrolled in Medicaid. As reported for other groups, enrollment growth fell to a post-recessionary low at less than one percent (0.9%.) During this period, an additional 252,000 children were enrolled in the program compared to one year earlier. Nearly 80 percent of this growth occurred in four states (Colorado, Florida, New York, and South Carolina.) (Figure 12) Three of these states implemented policy changes that likely contributed to their enrollment growth among children.1
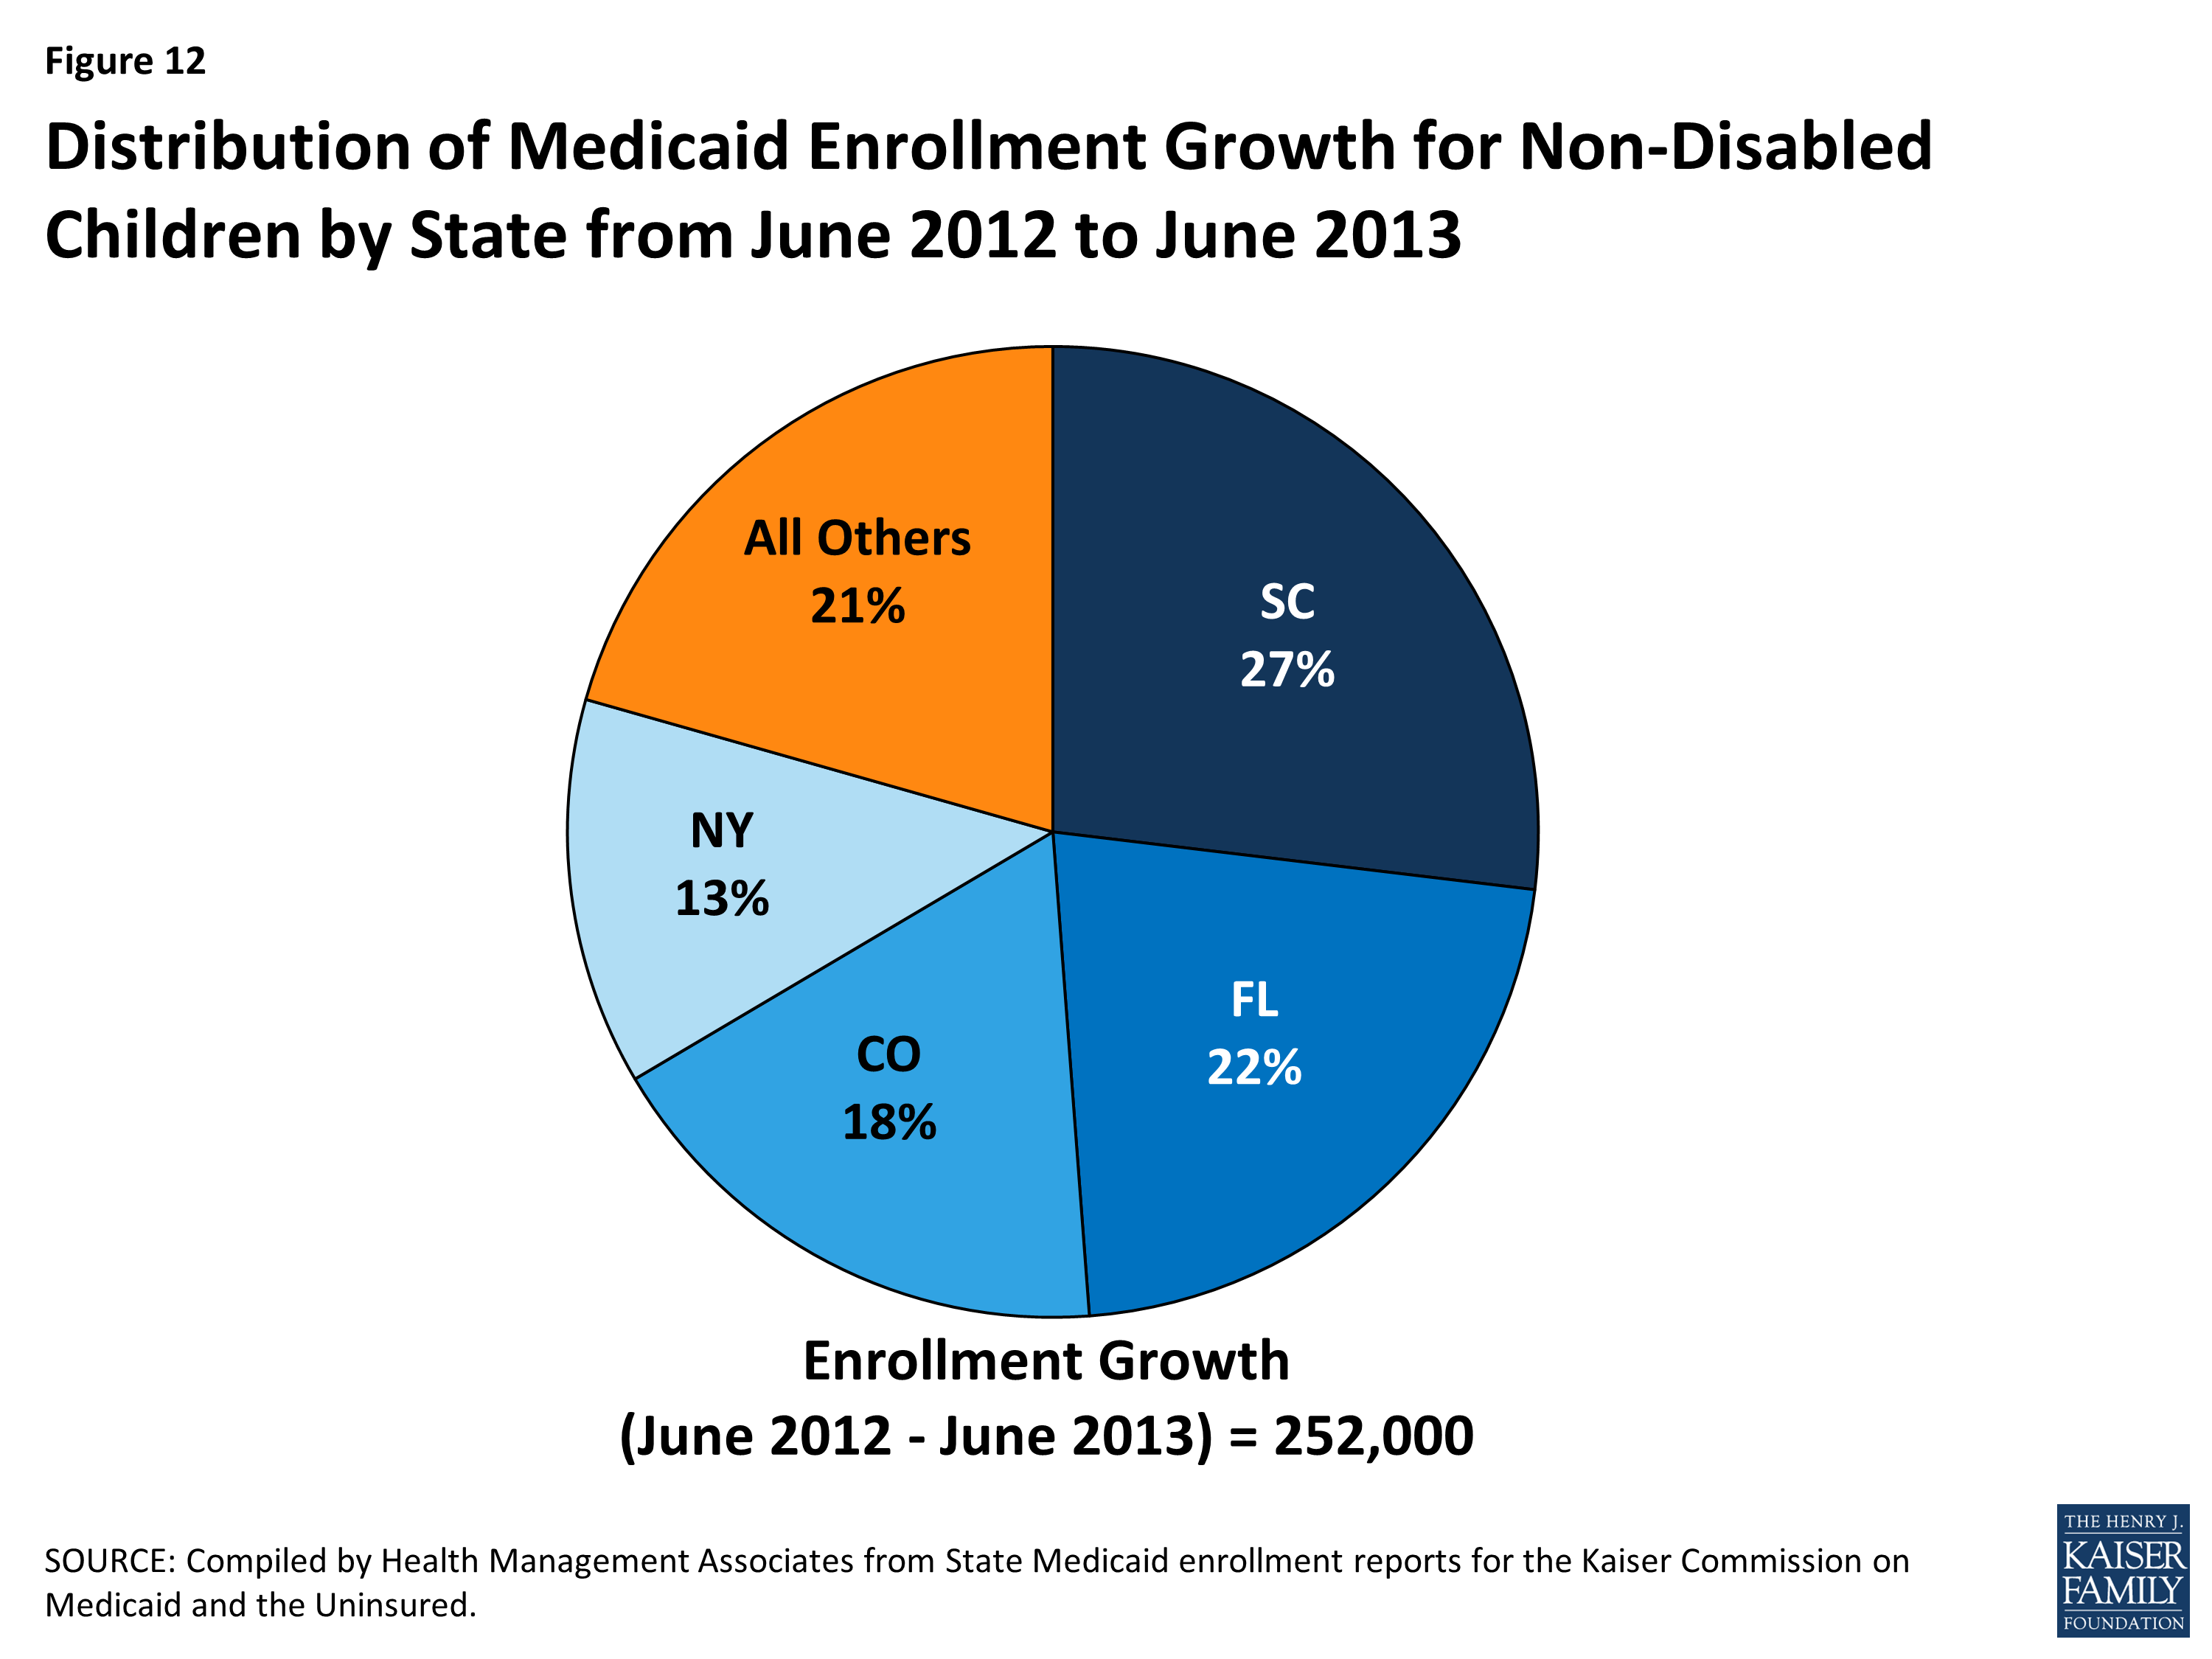
Figure 12: Distribution of Medicaid Enrollment Growth for Non-Disabled Children by State from June 2012 to June 2013
- Colorado reported an additional 45,200 children were enrolled in Medicaid in June 2013 compared to one year earlier. This was likely driven in part by the implementation of Express Lane Eligibility for children in early 2013 along with additional enrollment simplifications implemented in FY 2012.
- New York saw an additional 33,000 children enrolled in Medicaid during this same period. Growth among children may have been driven by the implementation of express lane eligibility at renewal for children in 2012.2 The state also received approval to implement 12 month continuous eligibility for several groups, including children and adults, in April 2013.3
- South Carolina saw an additional 68,700 individuals enrolled in this group during this period. The state expanded their use of express lane eligibility for children at application in FY 2013.
During the period from June 2012 to June 2013, 17 states saw declines in enrollment among children. (Figure 13) However, the declines were relatively small, most under one percentage point. This is due in part to the fact that eligibility levels and enrollment procedures for children in Medicaid and CHIP have been preserved due to the maintenance of eligibility (MOE) requirements; these requirements will remain in effect for children until 2019.
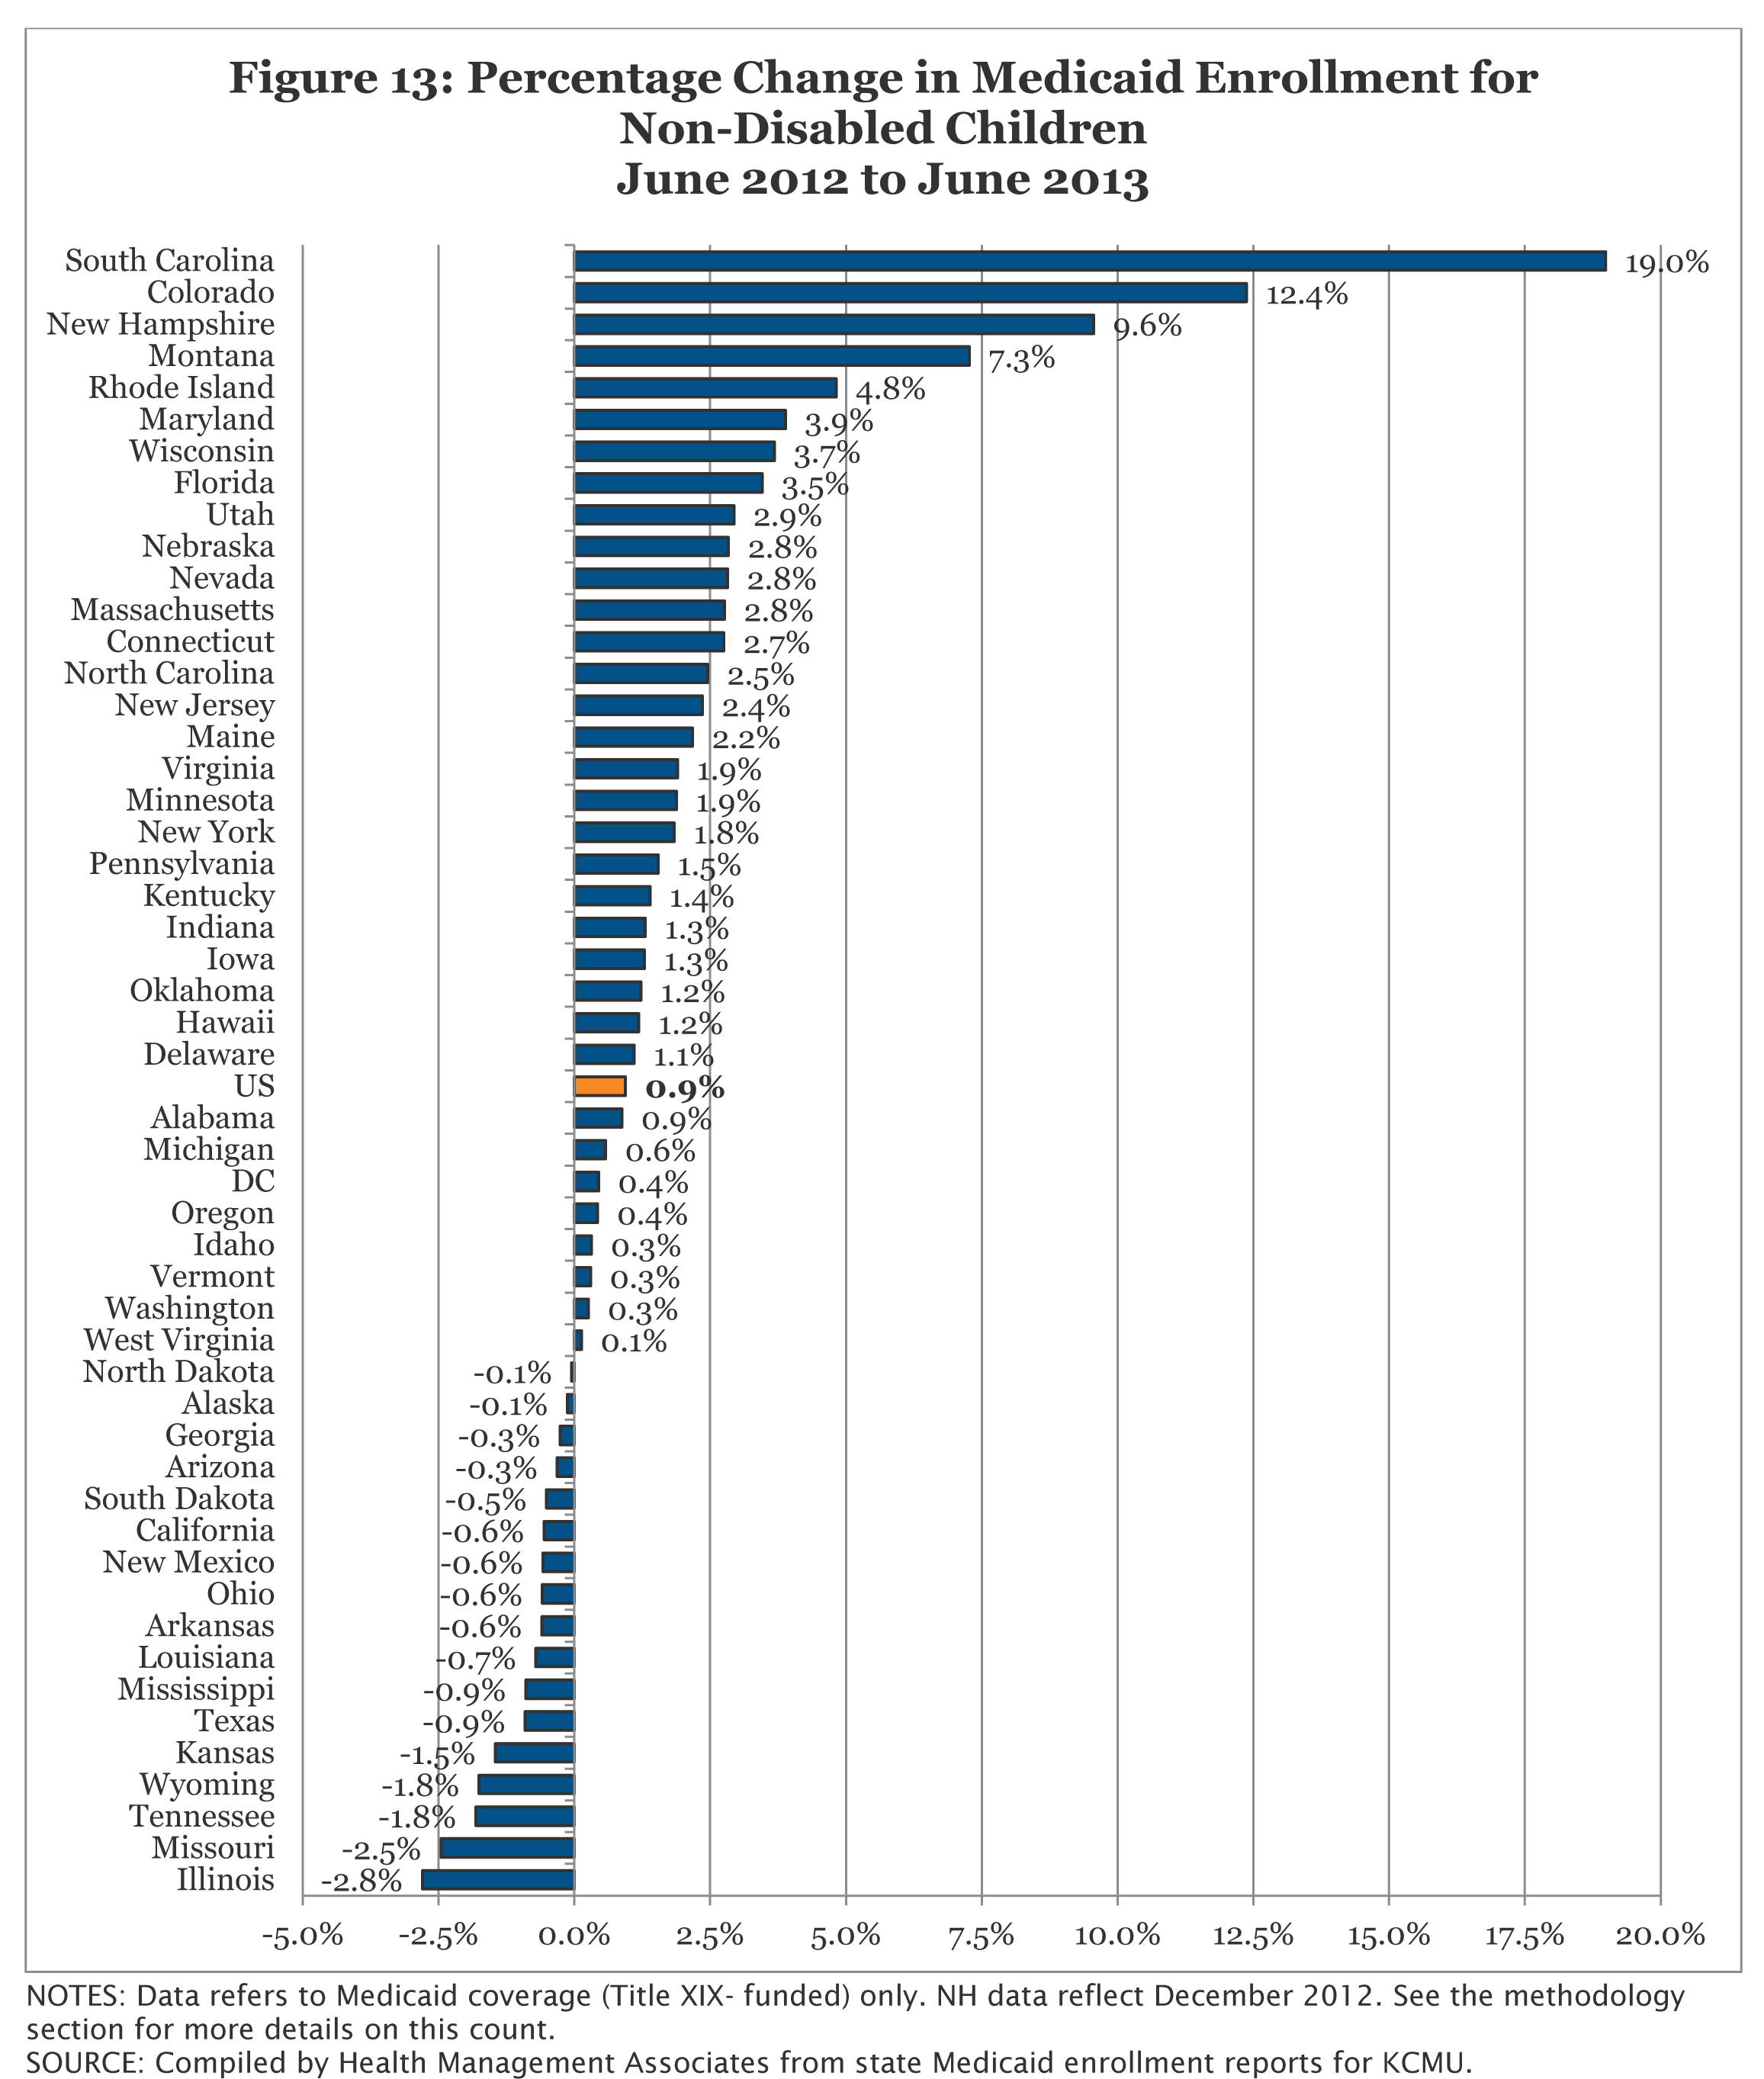
Figure 13: Percentage Change in Medicaid Enrollment for Non-Disabled Children June 2012 to June 2013
Aged and Disabled
Enrollment among Medicaid enrollees who are aged or living with disabilities, including disabled children and those dually-eligible for Medicare and Medicaid, has risen to nearly 14.8 million in June 2013. Less sensitive to changes in economic conditions, enrollment among the aged and disabled has risen fairly consistently over the past ten years. Nationally, enrollment for this group rose at a slower rate (1.5 percent) over the period from June 2012 to June 2013 than the prior annual period (3.1 percent.) (Figure 14)
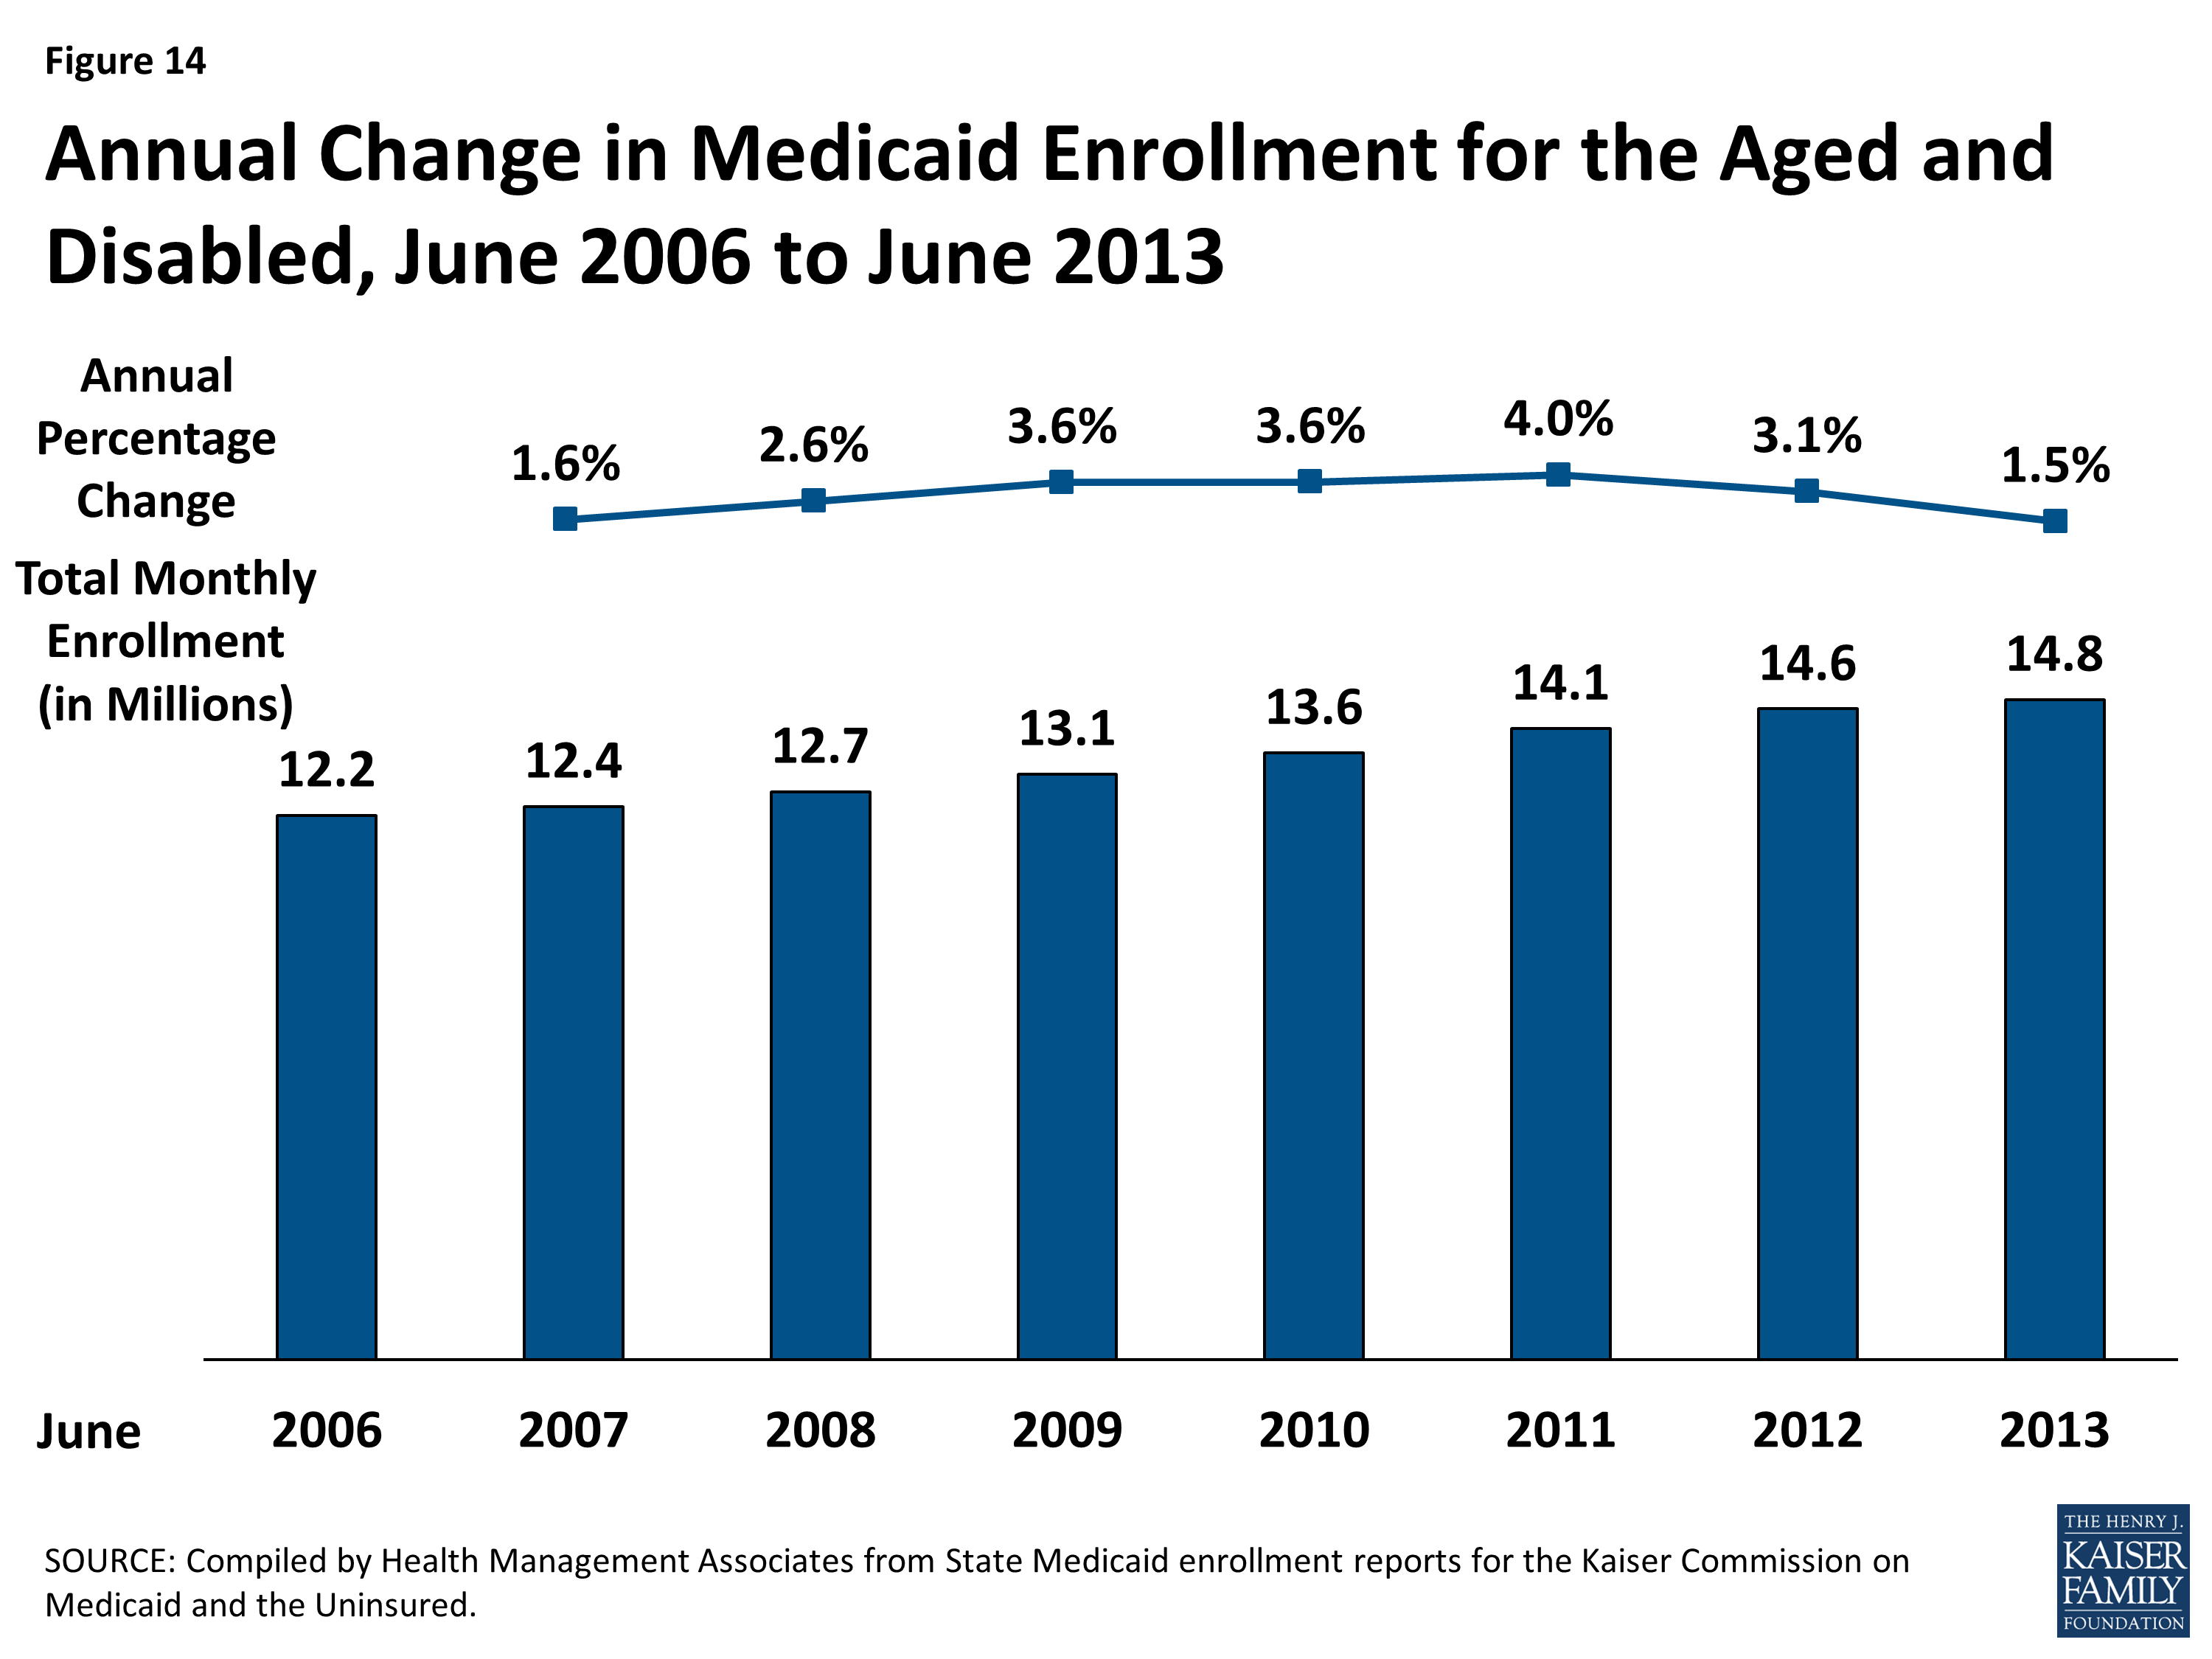
Figure 14: Annual Change in Medicaid Enrollment for the Aged and Disabled, June 2006 to June 2013
Cross State Trends. Four states (Florida, New York, Massachusetts and Texas) accounted for nearly 40 percent of the annual enrollment growth for this group. (Figure 15) Each of these states has implemented some limited changes to eligibility and enrollment policy in recent years that may partly explain these increases.
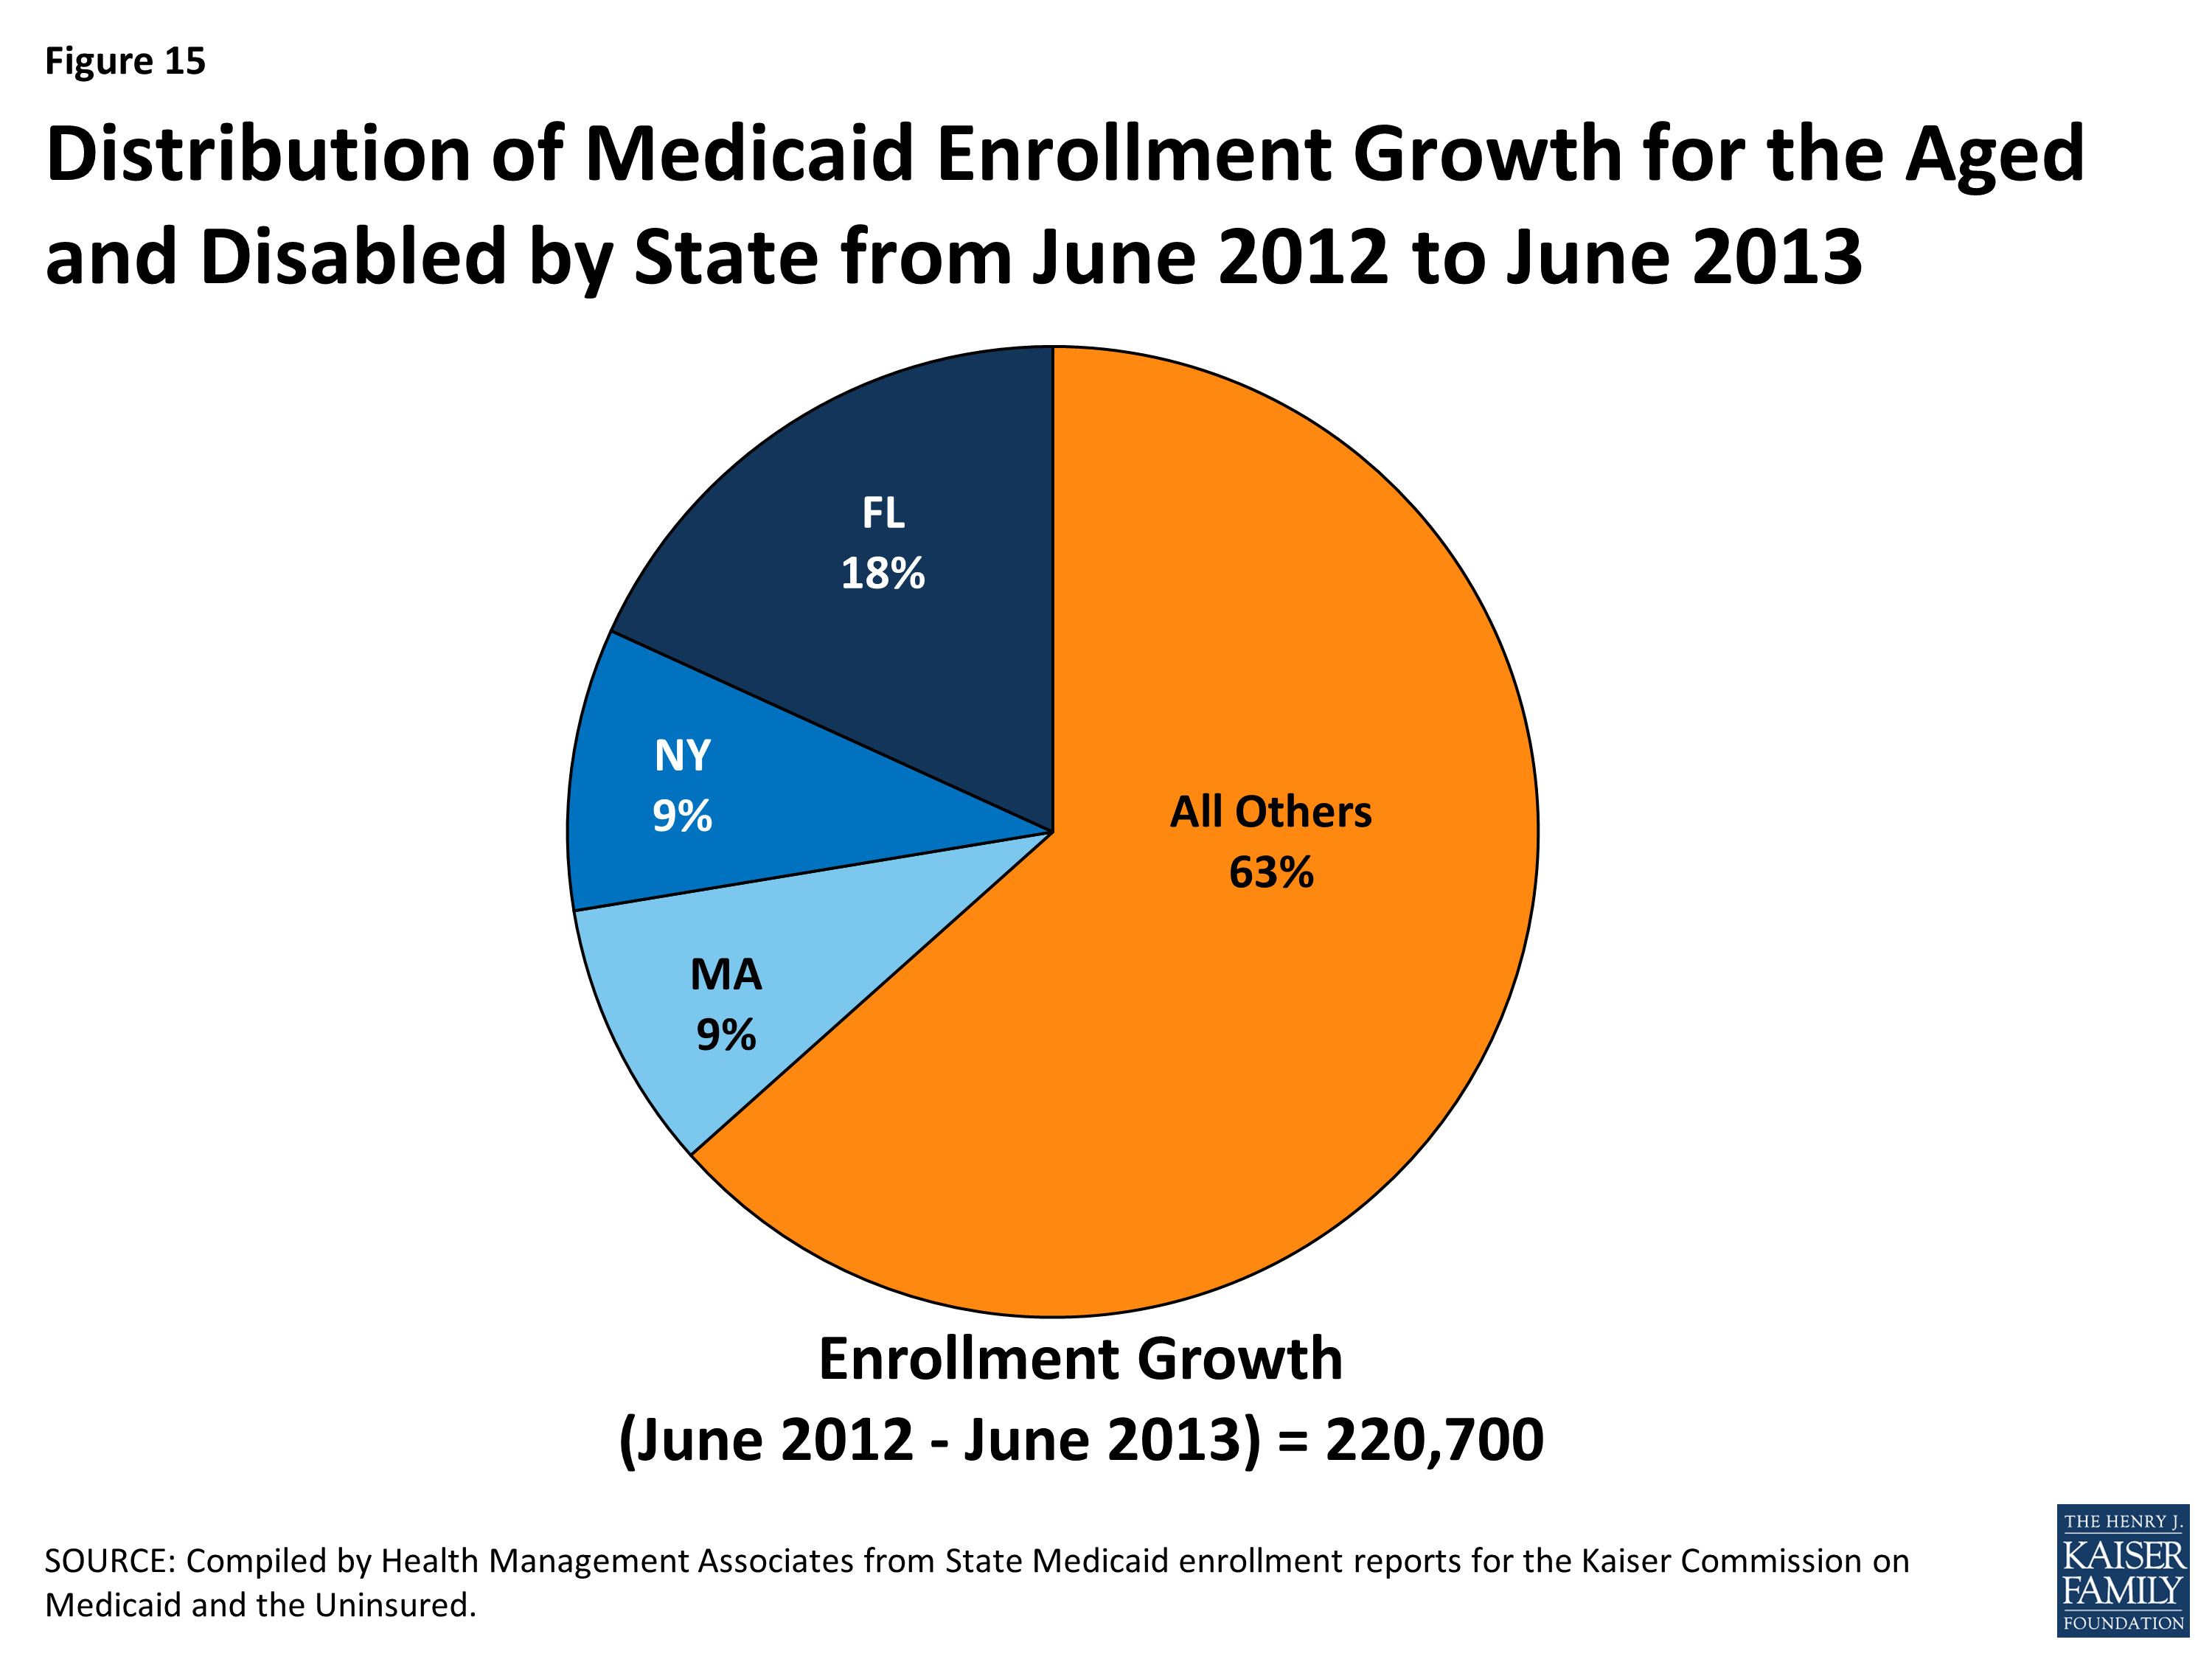
Figure 15: Distribution of Medicaid Enrollment Growth for the Aged and Disabled by State from June 2012 to June 2013
- In FY 2012, Florida instituted a policy that would waive disability interviews when sufficient information is provided on paper disability forms.1 The state also lowered the age requirement for the Assisted Living HCBS waiver in October 2012.2
- Massachusetts expanded their use of administrative renewal to include additional populations in December 2011; this included community residents whose sole source of income is Social Security.3
- New York reported automating administrative renewals for Medicare Savings Program participants with fixed incomes in FY 2012 and expanding this to other aged, blind and disabled beneficiaries receiving pensions in FY 2013.4 The state also expanded their use of self-attestation of income, resources, and residency at renewal for those receiving community-based long term care services in FY 2011.5
Enrollment for this group grew in all but six states; 41 states saw a slower rate of growth between June 2012 and June 2013 than the previous annual period. The largest decline occurred in Pennsylvania, which saw a decline of over 38,600 among this group during this period (-4.1%.) The decline appears to be concentrated among those individuals enrolled through the General Assistance group.6 In terms of percentage change, Idaho was the only state to experience double-digit enrollment growth for this group during this period (12.7%). (Figure 16) This increase was concentrated among disabled children and adults served by the state’s Total Enhanced Plan.
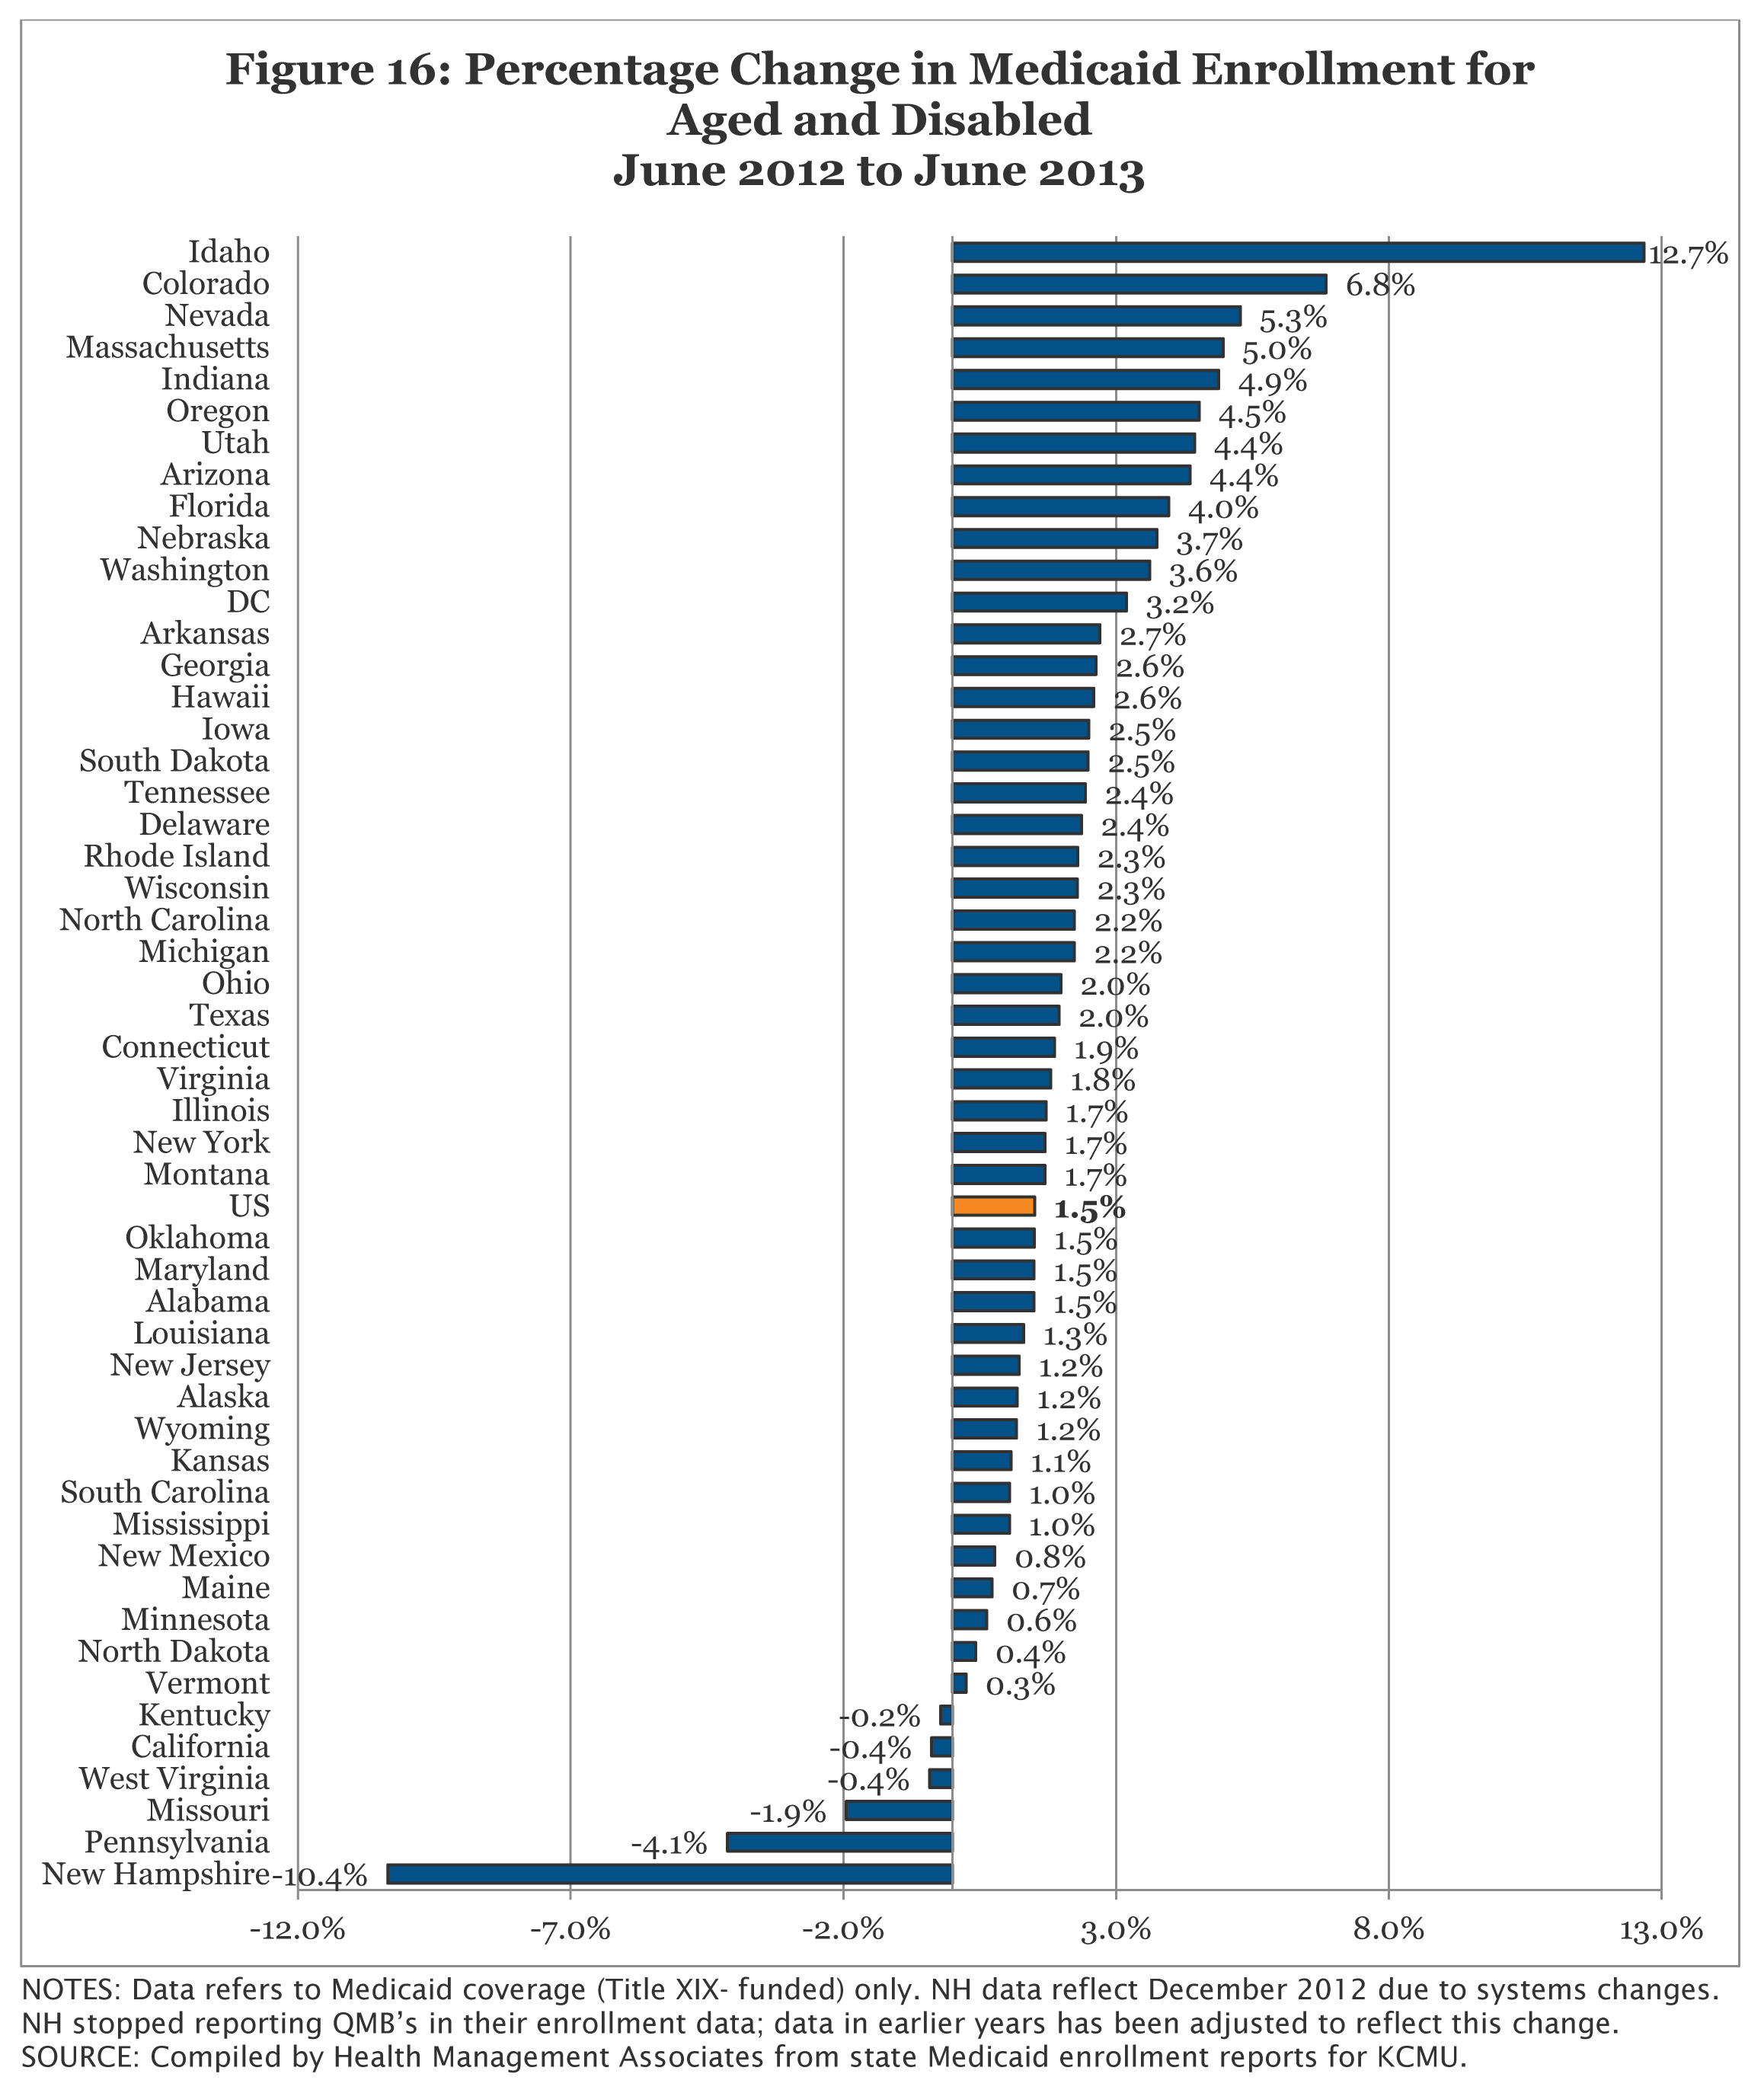
Figure 16: Percentage Change in Medicaid Enrollment for Aged and Disabled June 2012 to June 2013
Conclusion
Overall, Medicaid enrollment growth continued to slow to the lowest rate since the start of the Great Recession as the economic conditions continued to slowly improve. While enrollment growth rates have been trending downward as economic conditions continue to slowly improve, enrollment growth is expected to increase significantly as states implement the ACA. Regardless of whether states decide to implement the Medicaid expansion or not, enrollment is anticipated to grow on average across all states due to new streamlined eligibility and enrollment processes as well as outreach for new coverage.1
This report provides baseline data for understanding the impact of the ACA eligibility and enrollment policies on enrollment growth across states. Future reports will examine the changes in trends across states and eligibility groups, especially differences between states that are implementing the Medicaid expansion in 2014 and states not moving forward with the expansion at this time.
This Data Snapshot was prepared by Laura Snyder and Robin Rudowitz of the Kaiser Family Foundation along with Eileen Ellis and Dennis Roberts at Health Management Associates.
Methodology
Methodology. This study is based on data provided by each of the 50 states and the District of Columbia. Health Management Associates asked each state to provide the internal reports they use to track enrollment in the program. Each state’s report included total enrollment and enrollment in certain eligibility categories. Report categories are not standardized across states. Where it was possible to do so, the state enrollment data were grouped to further examine trends in specific Medicaid eligibility categories. The data tables and graphs in this document present “point-in-time” monthly Medicaid enrollment counts for the months of June and December of each year from 2000 through 2013 rather than “ever-enrolled” counts published by CMS. The data were provided to HMA by each state Medicaid program in November and early December 2013. Historical data may change over time as states change how they report their enrollment data as well as if a state provides revised data for previous time periods.
Net Change. The data collected for this report are net changes in enrollment across the program and within select eligibility groups, taking into account the net impact of individuals enrolling and disenrolling from the Medicaid program. Because these data are not individual level data and states do not make a distinction between enrollment among current beneficiaries and new beneficiaries, it is not possible to determine from this data the number of individuals that left the program and the number that newly enrolled in a given time period, i.e. the churn within the program. For example, this data set cannot be used to determine how many of the 55.0 million beneficiaries enrolled in June 2013 had also been enrolled in June 2012.
Definitions of Medicaid Enrollment. The counts provided by the states reflect all persons with Medicaid eligibility for each month. Every person with Medicaid coverage was counted as an enrollee with the exception of family planning waiver enrollees and pharmacy plus waiver enrollees. No adjustment was made for other persons who are enrolled in Medicaid categories with less than full coverage. Therefore the enrollment figures reported here include a small number of individuals that are covered by Medicaid only for emergency services as well as persons with Medicare and Medicaid dual eligibility enrolled as either Specified Low-Income Medicare Beneficiaries (SLMBs) or Qualified Individuals (QIs) for whom Medicaid pays only a portion of Medicare premiums, copays and deductibles or as Qualified Medicare Beneficiaries (QMBs) for whom Medicaid covers some additional services Medicare does not as well as the premium and cost-sharing assistance provided to SLMBs or QIs. To the extent possible, state-only health coverage programs and Medicaid expansion CHIP enrollees not funded by Medicaid are excluded.
Non-Disabled Children and Non-Disabled, Non-Elderly Adults. To remain consistent with other enrollment reports, such as the Medicaid Statistical Information System (MSIS), this report groups disabled children in the elderly and disabled category. However, the detail provided in enrollment reports from states varies in the level of detail available. Most states are able to provide data that breaks out the number of non-disabled children either within the same report or through a separate report. In 2 states (IL and WI) some estimation is required due to differences in report totals to determine the number of non-disabled children. Raw data used for California only breaks out children compared to adults and does not break out non-disabled children from disabled children in more recent periods. To make this measure comparable to other states, the ratio of all non-disabled children to all non-disabled, non-elderly adults from an earlier time period was applied to the non-disabled, non-elderly group.
Additionally, there are a relatively small number of enrollees for whom their eligibility pathway was not identified by the state. These individuals were included in the non-disabled, non-elderly adult counts unless they were clearly identified as children.
State Variation in Enrollment Reports. Common variations across the states include how states count “spend-down” enrollees and whether states adjust for “retroactive” eligibiles. Some states include in their enrollment counts persons with excess income that qualify to “spend-down” to Medicaid eligibility whether or not they have incurred sufficient medical costs to become eligible for Medicaid in that month. Other states only include those individuals that have met their “spend-down” requirement. Since a primary goal of this report is to identify trends, these variations have been deemed acceptable given that the state does not change its methodology over time. Data for some states include “retroactive” eligibles, i.e., individuals whose Medicaid eligibility is established at a later date, but whose coverage is retroactive to a prior point in time. Effort was made to use reports that reflect retroactive eligibility where they exist. Yet, it is possible that additional changes occurred after the counts provided for use here.
Appendices
Appendix A: Table A-1: Total Medicaid Enrollment by State
|
Table A-1: Total Medicaid Enrollment by State (Monthly Enrollment in Thousands), June 2006 – 2013
|
||||||||
|
State
|
2006
|
2007
|
2008
|
2009
|
2010
|
2011
|
2012
|
2013
|
|
Alabama
|
690.5
|
665.2
|
698.0
|
736.1
|
783.1
|
832.3
|
836.8
|
846.4
|
|
Alaska
|
88.3
|
85.7
|
83.3
|
86.9
|
100.6
|
107.2
|
109.2
|
109.6
|
|
Arizona
|
984.7
|
988.4
|
1,056.2
|
1,216.5
|
1,356.6
|
1,370.1
|
1,297.4
|
1,263.9
|
|
Arkansas
|
480.7
|
492.6
|
487.6
|
514.0
|
526.5
|
538.9
|
544.7
|
548.3
|
|
California
|
6,425.9
|
6,416.2
|
6,557.0
|
6,899.6
|
7,178.6
|
7,551.9
|
7,844.5
|
7,967.7
|
|
Colorado
|
401.7
|
381.1
|
407.2
|
467.6
|
526.2
|
588.9
|
651.1
|
729.1
|
|
Connecticut
|
379.3
|
388.3
|
416.2
|
443.8
|
525.2
|
565.6
|
582.4
|
613.6
|
|
DC
|
125.7
|
126.5
|
126.2
|
134.1
|
145.4
|
189.9
|
198.2
|
203.7
|
|
Delaware
|
144.5
|
144.3
|
153.1
|
166.7
|
181.6
|
198.7
|
208.4
|
211.0
|
|
Florida
|
2,185.3
|
2,055.3
|
2,151.7
|
2,502.8
|
2,801.7
|
2,993.8
|
3,156.8
|
3,290.0
|
|
Georgia
|
1,325.7
|
1,224.5
|
1,266.9
|
1,387.1
|
1,457.4
|
1,501.7
|
1,528.5
|
1,536.3
|
|
Hawaii
|
187.6
|
184.9
|
192.3
|
214.4
|
234.9
|
247.0
|
260.5
|
263.5
|
|
Idaho
|
167.1
|
171.9
|
171.4
|
183.6
|
207.0
|
215.0
|
220.2
|
231.1
|
|
Illinois
|
1,805.1
|
1,930.3
|
2,043.4
|
2,194.4
|
2,451.8
|
2,566.2
|
2,624.1
|
2,610.7
|
|
Indiana
|
779.4
|
787.7
|
827.4
|
920.3
|
964.8
|
978.4
|
1,015.3
|
1,033.0
|
|
Iowa
|
316.3
|
314.1
|
334.9
|
374.3
|
407.4
|
430.9
|
451.9
|
466.2
|
|
Kansas
|
265.9
|
245.1
|
253.7
|
264.4
|
285.0
|
325.3
|
342.7
|
359.1
|
|
Kentucky
|
683.5
|
695.0
|
698.5
|
748.5
|
775.0
|
794.5
|
798.4
|
802.1
|
|
Louisiana
|
892.5
|
827.2
|
858.9
|
898.3
|
962.7
|
997.3
|
1,043.1
|
1,049.2
|
|
Maine
|
248.4
|
262.0
|
254.5
|
262.1
|
279.7
|
297.6
|
285.6
|
275.7
|
|
Maryland
|
507.2
|
525.0
|
549.8
|
659.6
|
770.7
|
847.9
|
889.7
|
936.0
|
|
Massachusetts
|
963.5
|
997.9
|
1,053.6
|
1,095.5
|
1,150.2
|
1,190.9
|
1,233.2
|
1,272.8
|
|
Michigan
|
1,460.4
|
1,502.1
|
1,526.3
|
1,684.8
|
1,870.0
|
1,940.2
|
1,891.7
|
1,929.2
|
|
Minnesota
|
585.6
|
585.3
|
603.8
|
663.9
|
714.9
|
831.9
|
868.1
|
879.1
|
|
Mississippi
|
539.7
|
509.9
|
530.6
|
577.3
|
600.5
|
617.8
|
622.2
|
622.7
|
|
Missouri
|
724.8
|
717.8
|
750.7
|
778.3
|
817.5
|
824.4
|
816.9
|
797.1
|
|
Montana
|
84.2
|
90.1
|
89.2
|
95.1
|
105.9
|
112.5
|
115.3
|
120.8
|
|
Nebraska
|
178.7
|
177.2
|
177.3
|
190.0
|
201.1
|
207.2
|
206.1
|
212.3
|
|
Nevada
|
171.8
|
170.2
|
188.9
|
213.5
|
263.6
|
290.9
|
301.0
|
313.5
|
|
New Hampshire
|
108.8
|
110.1
|
114.3
|
124.1
|
130.5
|
133.9
|
134.0
|
138.8
|
|
New Jersey
|
751.3
|
761.4
|
781.3
|
812.4
|
855.9
|
898.1
|
980.8
|
987.0
|
|
New Mexico
|
369.0
|
380.4
|
432.3
|
472.7
|
508.7
|
509.4
|
508.9
|
507.6
|
|
New York
|
4,177.2
|
4,101.0
|
4,139.6
|
4,417.9
|
4,722.2
|
4,902.9
|
5,004.0
|
5,141.7
|
|
North Carolina
|
1,179.0
|
1,179.6
|
1,238.2
|
1,331.1
|
1,358.4
|
1,391.5
|
1,470.9
|
1,501.3
|
|
North Dakota
|
53.0
|
51.7
|
51.9
|
58.7
|
63.7
|
65.7
|
65.6
|
65.2
|
|
Ohio
|
1,601.2
|
1,580.5
|
1,653.3
|
1,796.7
|
1,946.0
|
1,993.3
|
2,055.7
|
2,072.1
|
|
Oklahoma
|
497.3
|
525.9
|
522.4
|
563.0
|
602.6
|
627.3
|
653.6
|
663.8
|
|
Oregon
|
361.2
|
338.7
|
356.5
|
393.4
|
455.5
|
541.5
|
568.6
|
572.3
|
|
Pennsylvania
|
1,877.4
|
1,887.6
|
1,925.7
|
2,017.8
|
2,115.9
|
2,215.7
|
2,098.5
|
2,097.8
|
|
Rhode Island
|
167.6
|
163.7
|
158.7
|
159.3
|
165.6
|
170.8
|
172.2
|
178.6
|
|
South Carolina
|
650.2
|
618.6
|
643.4
|
681.7
|
690.8
|
691.5
|
711.0
|
781.1
|
|
South Dakota
|
88.9
|
89.7
|
90.9
|
95.3
|
101.3
|
102.2
|
102.8
|
102.4
|
|
Tennessee
|
1,255.7
|
1,215.3
|
1,237.0
|
1,266.3
|
1,266.4
|
1,289.1
|
1,317.8
|
1,305.6
|
|
Texas
|
2,800.7
|
2,864.9
|
2,882.6
|
3,099.7
|
3,358.5
|
3,592.0
|
3,648.2
|
3,644.2
|
|
Utah
|
199.5
|
186.3
|
193.0
|
230.8
|
246.0
|
273.0
|
283.3
|
289.9
|
|
Vermont
|
118.3
|
116.2
|
124.5
|
133.9
|
136.2
|
139.9
|
141.8
|
142.7
|
|
Virginia
|
646.3
|
638.0
|
665.8
|
720.6
|
785.7
|
808.4
|
832.7
|
851.4
|
|
Washington
|
865.4
|
860.3
|
888.3
|
969.2
|
1,038.7
|
1,114.5
|
1,128.3
|
1,132.3
|
|
West Virginia
|
308.8
|
300.2
|
307.4
|
320.1
|
331.4
|
335.4
|
333.5
|
332.6
|
|
Wisconsin
|
667.3
|
673.6
|
725.3
|
826.7
|
942.3
|
963.4
|
969.7
|
956.5
|
|
Wyoming
|
58.3
|
56.0
|
55.6
|
61.2
|
67.1
|
67.8
|
67.3
|
66.4
|
|
Total
|
42,597
|
42,361
|
43,696
|
47,126
|
50,535
|
52,982
|
54,193
|
55,025
|
|
NOTES: Data refers to Medicaid coverage (Title XIX- funded) only. NH data reflect December 2012. |
||||||||
Appendix A: Table A-2: Total Medicaid Enrollment by State (Percentage Change)
|
Table A-2: Total Medicaid Enrollment by State (Percentage Change), June 2005 – 2013
|
||||||||
|
State
|
05-06
|
06-07
|
07-08
|
08-09
|
09-10
|
10-11
|
11-12
|
12-13
|
|
Alabama
|
0.5%
|
-3.7%
|
4.9%
|
5.5%
|
6.4%
|
6.3%
|
0.5%
|
1.2%
|
|
Alaska
|
1.6%
|
-2.9%
|
-2.9%
|
4.3%
|
15.8%
|
6.6%
|
1.9%
|
0.3%
|
|
Arizona
|
-2.0%
|
0.4%
|
6.9%
|
15.2%
|
11.5%
|
1.0%
|
-5.3%
|
-2.6%
|
|
Arkansas
|
4.9%
|
2.5%
|
-1.0%
|
5.4%
|
2.4%
|
2.4%
|
1.1%
|
0.7%
|
|
California
|
-0.7%
|
-0.2%
|
2.2%
|
5.2%
|
4.0%
|
5.2%
|
3.9%
|
1.6%
|
|
Colorado
|
-2.2%
|
-5.1%
|
6.8%
|
14.8%
|
12.5%
|
11.9%
|
10.6%
|
12.0%
|
|
Connecticut
|
-3.2%
|
2.4%
|
7.2%
|
6.6%
|
18.3%
|
7.7%
|
3.0%
|
5.4%
|
|
DC
|
-0.7%
|
0.6%
|
-0.3%
|
6.3%
|
8.4%
|
30.6%
|
4.3%
|
2.8%
|
|
Delaware
|
5.7%
|
-0.1%
|
6.1%
|
8.9%
|
8.9%
|
9.4%
|
4.9%
|
1.2%
|
|
Florida
|
-0.7%
|
-5.9%
|
4.7%
|
16.3%
|
11.9%
|
6.9%
|
5.4%
|
4.2%
|
|
Georgia
|
-3.9%
|
-7.6%
|
3.5%
|
9.5%
|
5.1%
|
3.0%
|
1.8%
|
0.5%
|
|
Hawaii
|
0.7%
|
-1.4%
|
4.0%
|
11.5%
|
9.6%
|
5.1%
|
5.5%
|
1.2%
|
|
Idaho
|
-0.2%
|
2.9%
|
-0.3%
|
7.1%
|
12.7%
|
3.9%
|
2.4%
|
4.9%
|
|
Illinois
|
4.5%
|
6.9%
|
5.9%
|
7.4%
|
11.7%
|
4.7%
|
2.3%
|
-0.5%
|
|
Indiana
|
2.8%
|
1.1%
|
5.0%
|
11.2%
|
4.8%
|
1.4%
|
3.8%
|
1.7%
|
|
Iowa
|
9.1%
|
-0.7%
|
6.6%
|
11.8%
|
8.8%
|
5.8%
|
4.9%
|
3.1%
|
|
Kansas
|
1.5%
|
-7.8%
|
3.5%
|
4.2%
|
7.8%
|
14.1%
|
5.3%
|
4.8%
|
|
Kentucky
|
1.7%
|
1.7%
|
0.5%
|
7.2%
|
3.5%
|
2.5%
|
0.5%
|
0.5%
|
|
Louisiana
|
0.5%
|
-7.3%
|
3.8%
|
4.6%
|
7.2%
|
3.6%
|
4.6%
|
0.6%
|
|
Maine
|
-0.9%
|
5.4%
|
-2.9%
|
3.0%
|
6.7%
|
6.4%
|
-4.0%
|
-3.5%
|
|
Maryland
|
0.1%
|
3.5%
|
4.7%
|
20.0%
|
16.9%
|
10.0%
|
4.9%
|
5.2%
|
|
Massachusetts
|
4.1%
|
3.6%
|
5.6%
|
4.0%
|
5.0%
|
3.5%
|
3.6%
|
3.2%
|
|
Michigan
|
2.7%
|
2.9%
|
1.6%
|
10.4%
|
11.0%
|
3.8%
|
-2.5%
|
2.0%
|
|
Minnesota
|
0.1%
|
-0.1%
|
3.2%
|
9.9%
|
7.7%
|
16.4%
|
4.4%
|
1.3%
|
|
Mississippi
|
-9.0%
|
-5.5%
|
4.1%
|
8.8%
|
4.0%
|
2.9%
|
0.7%
|
0.1%
|
|
Missouri
|
-17.4%
|
-1.0%
|
4.6%
|
3.7%
|
5.0%
|
0.9%
|
-0.9%
|
-2.4%
|
|
Montana
|
-1.7%
|
7.0%
|
-1.1%
|
6.6%
|
11.3%
|
6.2%
|
2.5%
|
4.8%
|
|
Nebraska
|
1.3%
|
-0.9%
|
0.1%
|
7.2%
|
5.8%
|
3.0%
|
-0.5%
|
3.0%
|
|
Nevada
|
0.1%
|
-1.0%
|
11.0%
|
13.0%
|
23.4%
|
10.4%
|
3.4%
|
4.2%
|
|
New Hampshire
|
2.1%
|
1.2%
|
3.8%
|
8.5%
|
5.2%
|
2.6%
|
0.0%
|
3.6%
|
|
New Jersey
|
5.0%
|
1.3%
|
2.6%
|
4.0%
|
5.4%
|
4.9%
|
9.2%
|
0.6%
|
|
New Mexico
|
0.6%
|
3.1%
|
13.7%
|
9.3%
|
7.6%
|
0.1%
|
-0.1%
|
-0.2%
|
|
New York
|
1.1%
|
-1.8%
|
0.9%
|
6.7%
|
6.9%
|
3.8%
|
2.1%
|
2.8%
|
|
North Carolina
|
3.6%
|
0.1%
|
5.0%
|
7.5%
|
2.1%
|
2.4%
|
5.7%
|
2.1%
|
|
North Dakota
|
1.2%
|
-2.5%
|
0.4%
|
13.1%
|
8.5%
|
3.2%
|
-0.1%
|
-0.6%
|
|
Ohio
|
2.1%
|
-1.3%
|
4.6%
|
8.7%
|
8.3%
|
2.4%
|
3.1%
|
0.8%
|
|
Oklahoma
|
2.2%
|
5.7%
|
-0.7%
|
7.8%
|
7.0%
|
4.1%
|
4.2%
|
1.6%
|
|
Oregon
|
-1.6%
|
-6.2%
|
5.2%
|
10.4%
|
15.8%
|
18.9%
|
5.0%
|
0.7%
|
|
Pennsylvania
|
5.1%
|
0.5%
|
2.0%
|
4.8%
|
4.9%
|
4.7%
|
-5.3%
|
0.0%
|
|
Rhode Island
|
0.1%
|
-2.4%
|
-3.0%
|
0.4%
|
3.9%
|
3.1%
|
0.8%
|
3.7%
|
|
South Carolina
|
-0.6%
|
-4.8%
|
4.0%
|
6.0%
|
1.3%
|
0.1%
|
2.8%
|
9.9%
|
|
South Dakota
|
0.7%
|
1.0%
|
1.3%
|
4.8%
|
6.3%
|
0.9%
|
0.6%
|
-0.4%
|
|
Tennessee
|
-9.3%
|
-3.2%
|
1.8%
|
2.4%
|
0.0%
|
1.8%
|
2.2%
|
-0.9%
|
|
Texas
|
0.6%
|
2.3%
|
0.6%
|
7.5%
|
8.3%
|
7.0%
|
1.6%
|
-0.1%
|
|
Utah
|
-2.7%
|
-6.6%
|
3.6%
|
19.6%
|
6.6%
|
11.0%
|
3.8%
|
2.3%
|
|
Vermont
|
1.9%
|
-1.8%
|
7.2%
|
7.5%
|
1.8%
|
2.7%
|
1.3%
|
0.6%
|
|
Virginia
|
2.9%
|
-1.3%
|
4.4%
|
8.2%
|
9.0%
|
2.9%
|
3.0%
|
2.2%
|
|
Washington
|
2.4%
|
-0.6%
|
3.3%
|
9.1%
|
7.2%
|
7.3%
|
1.2%
|
0.4%
|
|
West Virginia
|
3.0%
|
-2.8%
|
2.4%
|
4.1%
|
3.5%
|
1.2%
|
-0.6%
|
-0.3%
|
|
Wisconsin
|
2.7%
|
0.9%
|
7.7%
|
14.0%
|
14.0%
|
2.2%
|
0.6%
|
-1.4%
|
|
Wyoming
|
1.1%
|
-3.9%
|
-0.7%
|
10.1%
|
9.6%
|
1.1%
|
-0.8%
|
-1.4%
|
|
Total
|
0.2%
|
-0.6%
|
3.2%
|
7.8%
|
7.2%
|
4.8%
|
2.3%
|
1.5%
|
|
NOTES: Data refers to Medicaid coverage (Title XIX- funded) only. NH data reflect December 2012.
SOURCE: Compiled by Health Management Associates from state Medicaid enrollment reports for KCMU. |
||||||||
Appendix A: Table A-3: Non-Disabled, Non-Elderly Enrollees
Appendix A: Table A-4: Non-Disabled Children
Appendix A: Table A-5: Non-Disabled, Non-Elderly Adults
Appendix A: Table A-6: Aged and Disabled Enrollees
Appendix B: Adult Expansions
Prior to the ACA, states could not receive federal Medicaid matching funds to cover non-disabled childless adults. As such, states could only cover these adults if they obtained a waiver or through a fully state-funded program. Effective April 2010, the ACA gave states flexibility to expand Medicaid to adults to get an early start on the 2014 expansion. Since April 2010, seven states (CA, CT, CO, DC, MN, NJ, and WA) have expanded coverage to adults through the new ACA option or a waiver to prepare for 2014. However, overall, Medicaid coverage for low-income adults remains very limited. As of January 2013, only nine states, including DC, provided full Medicaid coverage to low-income adults, and enrollment is closed in two of these states. Sixteen states only provide limited coverage to adults, and enrollment is closed in eight of these states. (Figure 17)
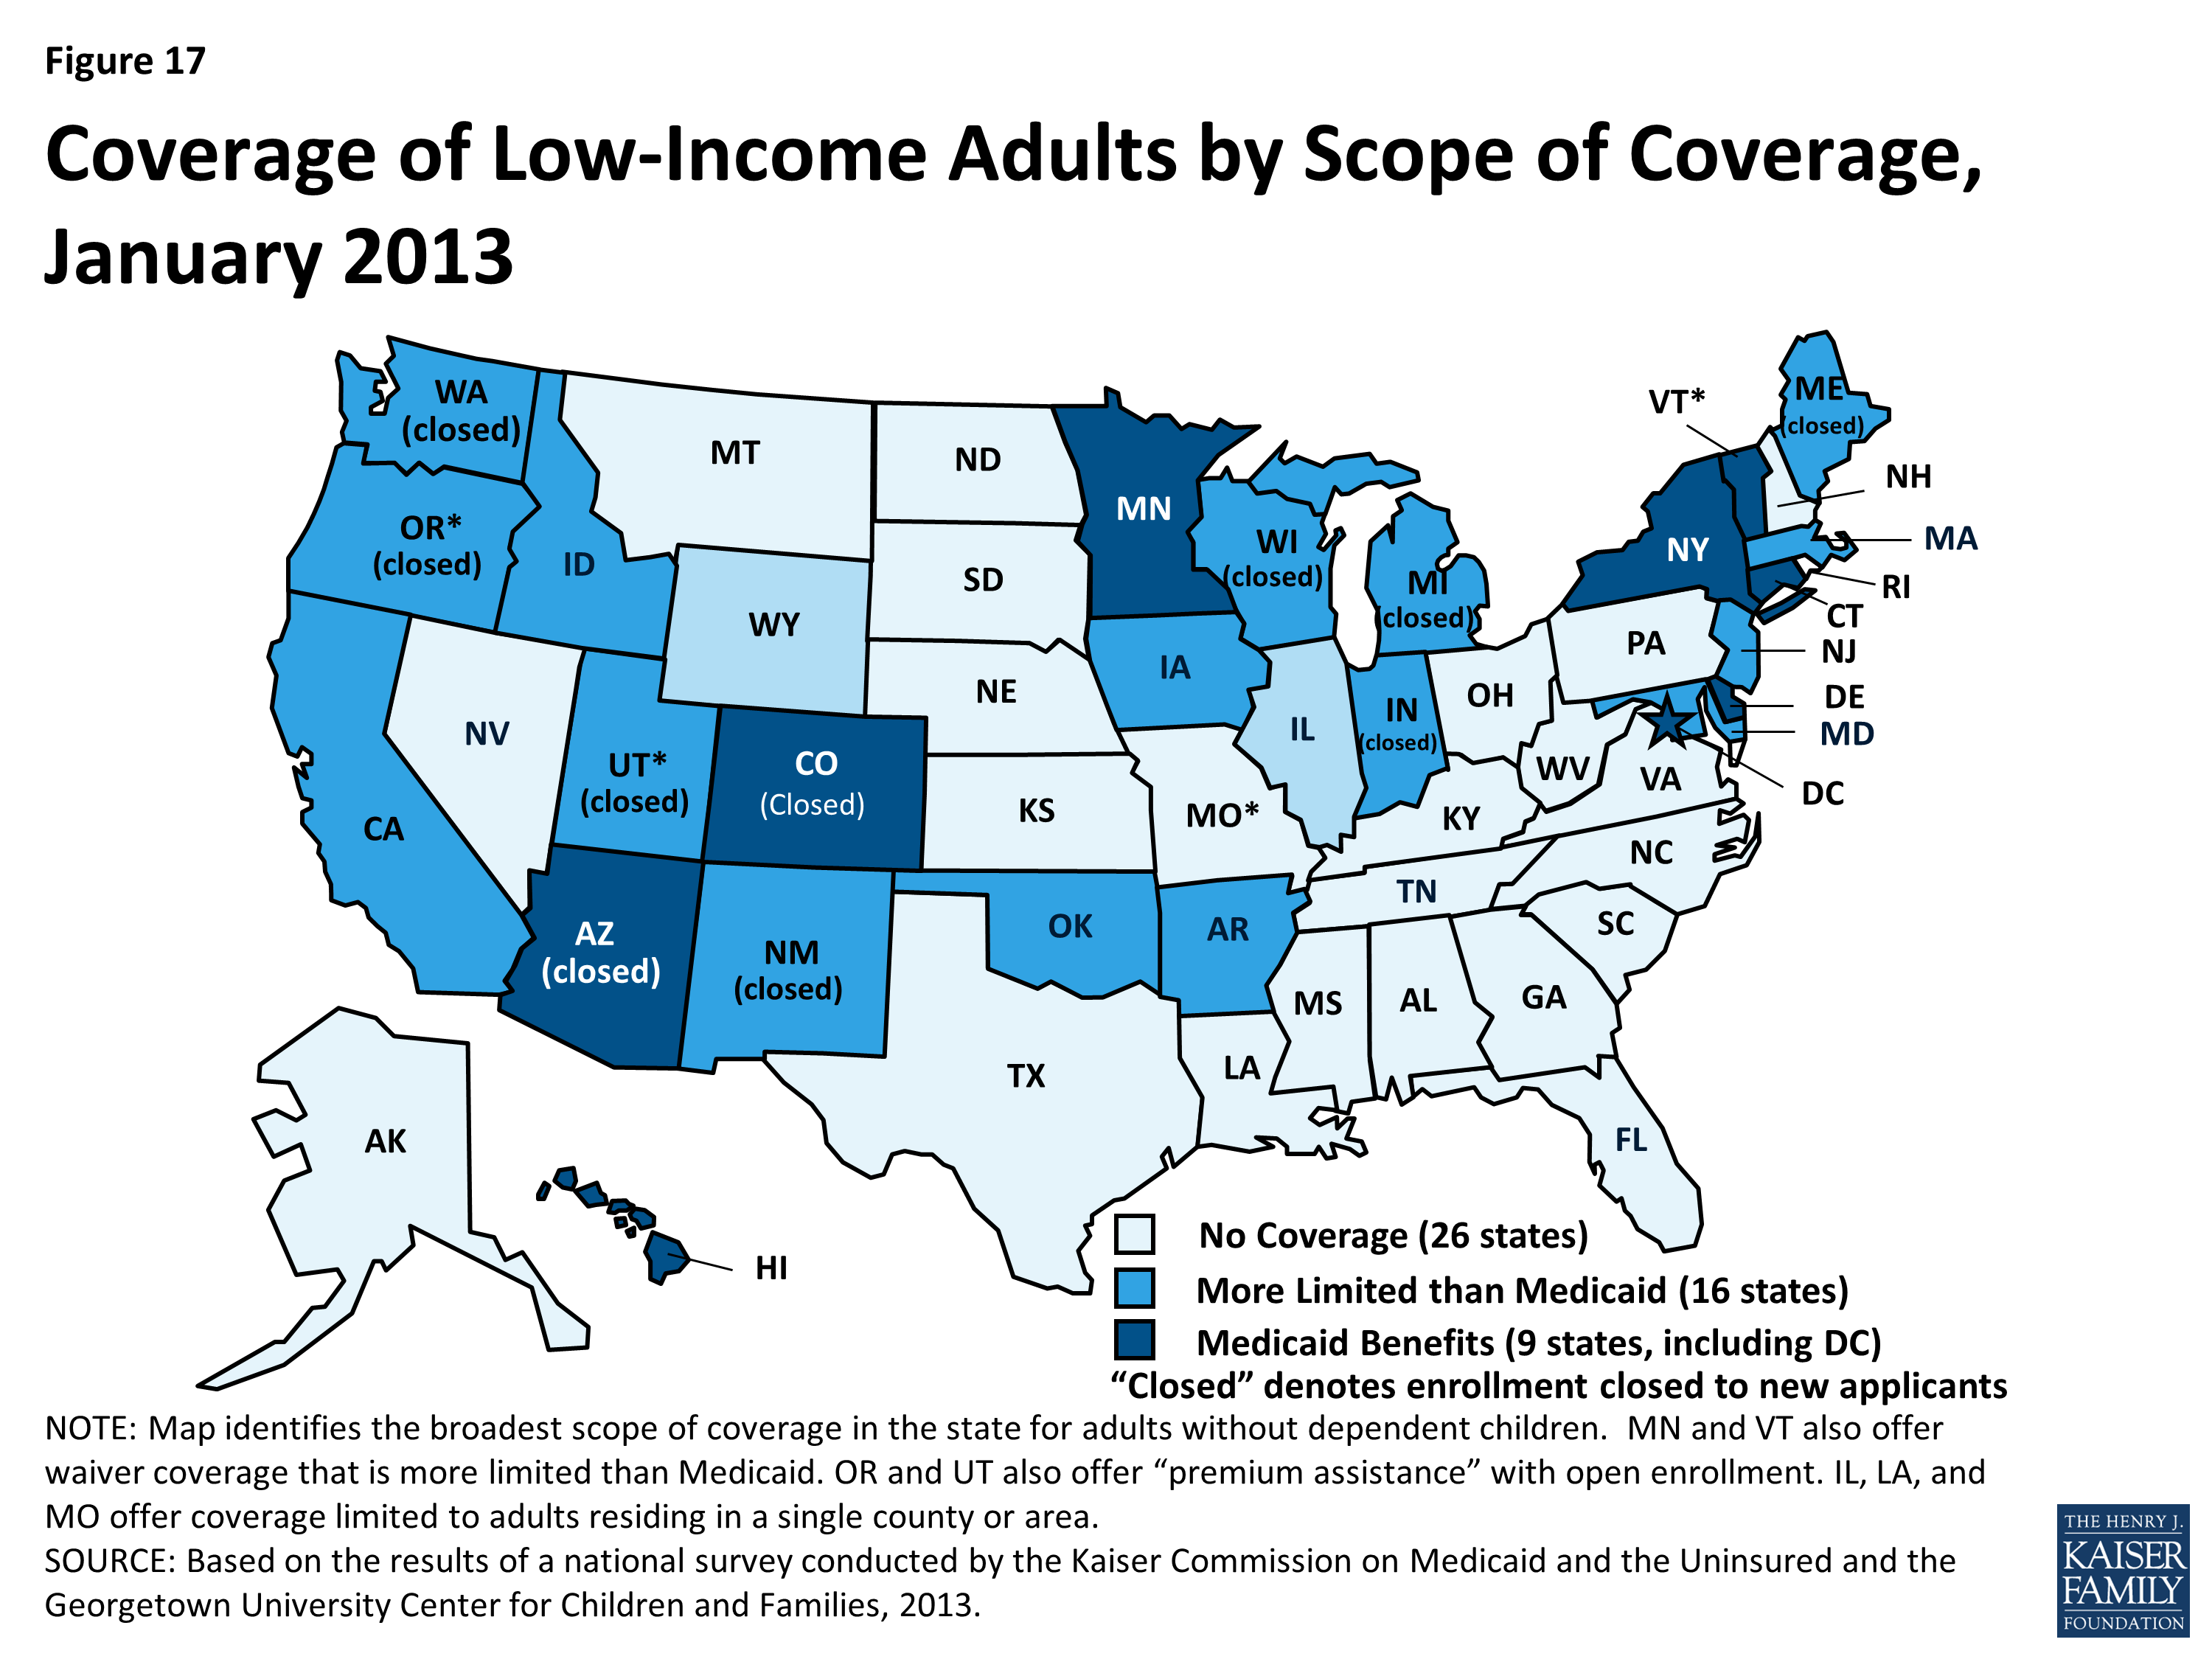
Figure 17: Coverage of Low-Income Adults by Scope of Coverage, January 2013
In the table on the following page (Table B-1), 17 states were able to report separately enrollment data for childless adults for June 2013; an additional five states reported data that included both parents and childless adults. Of the 2.6 million low-income non-disabled adults covered under expansion programs in these states in June 2013, at least 1.86 million were childless adults. Enrollment in June 2013 was positively affected by continued rollouts of adult expansions in California, Colorado, and Louisiana. In terms of percentage change, four other states (Connecticut, Maryland, Iowa, and Michigan1) saw double digit enrollment growth.
In contrast, eleven states reported enrollment declines between June 2012 and June 2013. Enrollment in most of these states for this group was negatively affected by enrollment freezes or enrollment caps either newly instituted or in place in a number of states, most notably in Arizona, where 40,800 fewer childless adults remained enrolled in June 2013 compared to one year earlier.2 Maine and Wisconsin also saw enrollment declines of 25 percent or more, both of which had long-standing enrollment caps for their childless adult waiver programs. Additionally, Wisconsin added premiums to its waiver programs in July 2012.
Coverage for childless adults will markedly change in January 2014. Twenty-six states, including 21 states that currently cover childless adults, plan move forward with the Medicaid expansion in 2014. 3 Eight states (ID, IN, LA, ME, MO, OK, UT, and WI) with current Section 1115 waivers to cover childless adults have indicated that they are not moving forward with the ACA Medicaid expansion in 2014. However, CMS recently approved one-year waiver extensions in 5 of these states (ID, IN, LA, MO, and OK.)4 In these states, the waiver coverage will continue, but coverage will be limited to individuals with incomes below 100% FPL and will not be eligible for the enhanced Medicaid financing available under the ACA. Current Medicaid beneficiaries with incomes above 100% FPL will be eligible for help purchasing coverage in the new Marketplaces. Wisconsin has a waiver proposal would reduce eligibility for childless adults in its existing waiver program to 100% FPL. Maine plans to let their current Section 1115 waiver for childless adults expire, resulting in childless adults covered under the waivers losing eligibility and likely becoming uninsured.
|
Table B-1: Adult Expansions June 2011 to June 2013 (Monthly Enrollment in Thousands)
|
|||||
|
State
|
June 2011
|
June 2012
|
June 2013
|
June 2011 to June 2012
|
June 2012 to June 2013
|
|
Childless adults
|
|||||
|
Arizona *
|
224.5
|
116.4
|
75.7
|
-48.1%
|
-35.0%
|
|
Colorado
|
N/A
|
7.8
|
14.8
|
N/A
|
90.5%
|
|
Connecticut
|
72.0
|
79.3
|
91.2
|
10.1%
|
15.0%
|
|
DC **
|
39.2
|
42.9
|
45.3
|
9.3%
|
5.8%
|
|
Delaware
|
37.1
|
40.6
|
41.2
|
9.6%
|
1.4%
|
|
Indiana
|
16.1
|
15.2
|
12.6
|
-5.8%
|
-17.2%
|
|
Maine
|
16.5
|
13.2
|
9.0
|
-20.2%
|
-31.5%
|
|
Maryland
|
56.8
|
66.7
|
79.6
|
17.4%
|
19.2%
|
|
Massachusetts
|
114.7
|
123.4
|
121.0
|
7.5%
|
-1.9%
|
|
Michigan
|
77.9
|
38.1
|
79.5
|
-51.1%
|
108.7%
|
|
Minnesota **
|
83.9
|
83.0
|
87.7
|
-1.1%
|
5.6%
|
|
New Jersey****
|
N/A
|
47.9
|
41.7
|
N/A
|
-13.0%
|
|
New Mexico ******
|
26.5
|
24.5
|
24.3
|
-7.6%
|
-0.6%
|
|
New York *****
|
949.3
|
991.7
|
1,046.7
|
4.5%
|
5.5%
|
|
Oregon
|
49.5
|
48.5
|
42.5
|
-2.0%
|
-12.5%
|
|
Vermont
|
NR
|
34.4
|
33.7
|
NR
|
-1.9%
|
|
Wisconsin
|
34.2
|
24.3
|
17.8
|
-28.9%
|
-26.8%
|
|
Subtotal (Childless adults only)
|
1798.3
|
1797.8
|
1864.1
|
-0.02%
|
3.69%
|
|
Parents and Childless Adults
|
|||||
|
California
|
184.2
|
449.7
|
611.1
|
144.1%
|
35.9%
|
|
Iowa
|
46.0
|
56.3
|
65.2
|
22.3%
|
15.8%
|
|
Louisiana *****
|
20.5
|
50.7
|
60.8
|
148.0%
|
19.9%
|
| Utah **** | 16.8 | 16.7 | 15.5 | -0.3% | -7.3% |
|
Washington
|
37.9 |
32.9 |
27.6 |
-13.2% |
-16.1% |
|
Subtotal (Parents and Childless adults
|
305.4 | 606.3 | 780.2 |
98.5%
|
28.7%
|
|
Total (Both Groups)
|
2103.6
|
2404.1
|
2644.3
|
14.3%
|
10.0%
|
|
NOTES: There are four additional states that cover childless adults with Title XIX funds that are not included in the table above: Arkansas (premium assistance only), Hawaii, Idaho (premium assistance only), and Oklahoma (premium assistance only.) Enrollment data for childless adults were not included in reports for AR, ID, and OK. Hawaii’s total enrollment data includes this group, but did not break this group out from other enrollees. Additionally, there are county-based expansions in Missouri (St. Louis area), Illinois (Cook County) and Ohio (Cuyahoga County) that were not included in the data reported. |
|||||
Endnotes
Issue Brief
Total Enrollment
The Great Recession officially began in December 2007 and officially ended in July 2009 according to the National Bureau of Economic Research; however, the effects of the Great Recession continued well past this point.
Kaiser Commission on Medicaid and the Uninsured, The Uninsured: A Primer – Key Facts about Health Insurance on the Eve of Coverage Expansions. Kaiser Commission on Medicaid and the Uninsured, October 2013. http://www.kff.org/report-section/the-uninsured-a-primer-2013-3-how-and-why-has-the-number-of-uninsured-people-changed/.
Kaiser Commission on Medicaid and the Uninsured, Medicaid in a Historic Time of Transformation: Results from a 50-State Medicaid Budget Survey for State Fiscal Years 2013 and 2014. Kaiser Commission on Medicaid and the Uninsured, October 2013. http://www.kff.org/medicaid/report/medicaid-in-a-historic-time-of-transformation-results-from-a-50-state-medicaid-budget-survey-for-state-fiscal-years-2013-and-2014/.
Non-Disabled, Non-Elderly Enrollees
Kaiser Commission on Medicaid and the Uninsured, The Uninsured: A Primer – Key Facts about Health Insurance on the Eve of Coverage Expansions. Kaiser Commission on Medicaid and the Uninsured, October 2013. http://www.kff.org/report-section/the-uninsured-a-primer-2013-3-how-and-why-has-the-number-of-uninsured-people-changed/.
Non-Disabled, Non-Elderly Adults
LIHP is comprised of two programs, the Medicaid Coverage Expansion (MCE) group with covers adults up to 133% FPL and the Health Care Coverage Initiative, which covers adults from 133 to 200% FPL. Fifty of the 58 counties were participating in the MCE as of January 2013 while only 5 counties were participating in the HCCI program at that point in time.
Centers for Medicare and Medicaid Services, Partnership Plan Medicaid Section 1115 Demonstration: Special Terms and Conditions. Department of Health and Human Services, April 2013. http://www.health.ny.gov/health_care/managed_care/appextension/docs/special_terms_and_conditions_04_2013.pdf
Retroactive eligibility was also eliminated for non-pregnant, non-disabled parents with incomes between 133 and 150 percent FPL. Kaiser Commission on Medicaid and the Uninsured, Medicaid Today; Preparing for Tomorrow: A Look at State Medicaid Program Spending, Enrollment and Policy Trends. Kaiser Commission on Medicaid and the Uninsured, October 2012. http://www.kff.org/medicaid/report/medicaid-today-preparing-for-tomorrow-a-look-at-state-medicaid-program-spending-enrollment-and-policy-trends-results-from-a-50-state-medicaid-budget-survey-for-state-fiscal-years-2012-and-2013/.
Non-Disabled Children
For the purposes of this report, only children who are funded by Title XIX funds are included. Children funded under Title XXI are included in a separate report that looks at trends in CHIP enrollment: Kaiser Commission on Medicaid and the Uninsured, CHIP Enrollment: June 2013 Data Snapshot. Kaiser Commission on Medicaid and the Uninsured, January 2014. www.kff.org/medicaid/issue-brief/chip-enrollment-june-2013-data-snapshot.
Kaiser Commission on Medicaid and the Uninsured, Getting into Gear for 2014: Findings from a 50-State Survey of Eligibility, Enrollment, Renewal, and Cost-Sharing Policies in Medicaid and CHIP, 2012-2013. Kaiser Commission on Medicaid and the Uninsured, January 2013. http://www.kff.org/medicaid/report/getting-into-gear-for-2014-findings-from-a-50-state-survey-of-eligibility-enrollment-renewal-and-cost-sharing-policies-in-medicaid-and-chip-2012-2013/.
Centers for Medicare and Medicaid Services, Partnership Plan Medicaid Section 1115 Demonstration: Special Terms and Conditions. Department of Health and Human Services, April 2013. http://www.health.ny.gov/health_care/managed_care/appextension/docs/special_terms_and_conditions_04_2013.pdf
Aged and Disabled
Kaiser Commission on Medicaid and the Uninsured, Medicaid Today; Preparing for Tomorrow: A Look at State Medicaid Program Spending, Enrollment and Policy Trends. Kaiser Commission on Medicaid and the Uninsured, October 2012. http://www.kff.org/medicaid/report/medicaid-today-preparing-for-tomorrow-a-look-at-state-medicaid-program-spending-enrollment-and-policy-trends-results-from-a-50-state-medicaid-budget-survey-for-state-fiscal-years-2012-and-2013/.
In both FY 2012 and 2013, Florida also increased the average private pay nursing home rate divisor, in effect reducing the number of penalty months for individuals to receive institutional and HCBS waiver services. Kaiser Commission on Medicaid and the Uninsured, Medicaid in a Historic Time of Transformation: Results from a 50-State Medicaid Budget Survey for State Fiscal Years 2013 and 2014. Kaiser Commission on Medicaid and the Uninsured, October 2013. http://www.kff.org/medicaid/report/medicaid-in-a-historic-time-of-transformation-results-from-a-50-state-medicaid-budget-survey-for-state-fiscal-years-2013-and-2014/.
Kaiser Commission on Medicaid and the Uninsured, Medicaid Today; Preparing for Tomorrow: A Look at State Medicaid Program Spending, Enrollment and Policy Trends. Kaiser Commission on Medicaid and the Uninsured, October 2012. http://www.kff.org/medicaid/report/medicaid-today-preparing-for-tomorrow-a-look-at-state-medicaid-program-spending-enrollment-and-policy-trends-results-from-a-50-state-medicaid-budget-survey-for-state-fiscal-years-2012-and-2013/.
Kaiser Commission on Medicaid and the Uninsured, Medicaid in a Historic Time of Transformation: Results from a 50-State Medicaid Budget Survey for State Fiscal Years 2013 and 2014. Kaiser Commission on Medicaid and the Uninsured, October 2013. http://www.kff.org/medicaid/report/medicaid-in-a-historic-time-of-transformation-results-from-a-50-state-medicaid-budget-survey-for-state-fiscal-years-2013-and-2014/.
Kaiser Commission on Medicaid and the Uninsured, Medicaid Today; Preparing for Tomorrow: A Look at State Medicaid Program Spending, Enrollment and Policy Trends. Kaiser Commission on Medicaid and the Uninsured, October 2012. http://www.kff.org/medicaid/report/medicaid-today-preparing-for-tomorrow-a-look-at-state-medicaid-program-spending-enrollment-and-policy-trends-results-from-a-50-state-medicaid-budget-survey-for-state-fiscal-years-2012-and-2013/.
Previous reports had erroneously included the General Assistance groups in the Families, Children, and Pregnant Women counts; this enrollment group was moved to the Aged and Disabled count in this report for June 2013 and all previous data points.
Conclusion
Kaiser Commission on Medicaid and the Uninsured, Medicaid in a Historic Time of Transformation: Results from a 50-State Medicaid Budget Survey for State Fiscal Years 2013 and 2014. Kaiser Commission on Medicaid and the Uninsured, October 2013. http://www.kff.org/medicaid/report/medicaid-in-a-historic-time-of-transformation-results-from-a-50-state-medicaid-budget-survey-for-state-fiscal-years-2013-and-2014/.
Appendices
Appendix B: Adult Expansions
Enrollment into Michigan’s Adult Benefit Waiver program was opened from April 1, 2013 to April 30, 2013. http://www.michigan.gov/documents/mdch/MSA_13-03_411563_7.pdf
Arizona’s enrollment freeze did not violate the MOE provisions enacted under the ACA as the enrollment freeze was enacted as part of a waiver renewal, one of the exceptions to the MOE provisions.
“Status of State Action on the Medicaid Expansion Decision as of December 11, 2013,” Kaiser Family Foundation State Health Facts, accessed December 17, 2013, https://www.kff.org/medicaid/state-indicator/state-activity-around-expanding-medicaid-under-the-affordable-care-act/.
Center for Medicare and Medicaid Services, Missouri 1115 waiver extension letter, September 27, 2013. http://www.medicaid.gov/Medicaid-CHIP-Program-Information/By-Topics/Waivers/1115/downloads/mo/mo-gateway-to-better-health-ca.pdf.
Center for Medicare and Medicaid Services, Louisiana 1115 waiver extension letter, September 30, 2013. http://www.medicaid.gov/Medicaid-CHIP-Program-Information/By-Topics/Waivers/1115/downloads/la/la-gnoch-ca.pdf.
Center for Medicare and Medicaid Services, Idaho 1115 waiver extension letter, September 24, 2013. http://www.medicaid.gov/Medicaid-CHIP-Program-Information/By-Topics/Waivers/1115/downloads/id/id-childless-adults-ca.pdf.
Center for Medicare and Medicaid Services, Louisiana 1115 waiver extension letter, September 6, 2013. http://www.medicaid.gov/Medicaid-CHIP-Program-Information/By-Topics/Waivers/1115/downloads/ok/ok-soonercare-ca.pdf
Center for Medicare and Medicaid Services, Louisiana 1115 waiver extension letter, September 3, 2013. http://www.medicaid.gov/Medicaid-CHIP-Program-Information/By-Topics/Waivers/1115/downloads/in/in-healthy-indiana-plan-ca.pdf