Snapshots: Wages & Benefits: A Long-Term View
Recent polls show that a substantial portion of families worry about whether their incomes will keep pace with rising prices generally and whether they will have to pay more for health care or health insurance.1 This concern about the cost of health insurance may result in part from the rapid increases in the costs of work-based health insurance in recent years: between 1999 and 2009, health insurance premiums rose 131%, a much faster rate of increase than general inflation (28%) or workers earnings (38%).2 Health benefit costs have risen substantially over many years, measured absolutely and as a percentage of total economic activity, or gross domestic product (GDP). Using the same data used by the government to track changes in the U.S. economy over time, the analysis below shows the growth in employer costs for private group health benefits over a relatively long time span and shows the size of these expenses compared with wages and other benefits.3
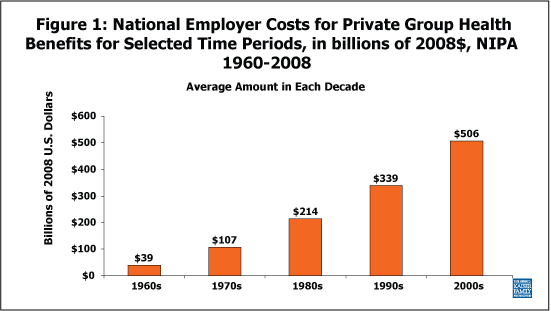
Figure 1 shows, in billions of 2008 dollars4, the total amount spent by employers on group health insurance policies from 1960 to 2008. The amount grew over twenty-fold from $25 billion in 1960 to $545 billion in 2008. This growth has been constant except for a short period between 1995 and 1998, and in 2006 and 2008.

Source: U.S. Department of Commerce, Bureau of Economic Analysis, National Income and Product Accounts, 1960-2008, Tables 6.11B, 6.11C, & 6.11D.
Note: Amounts shown are averages of annual figures for each time period.
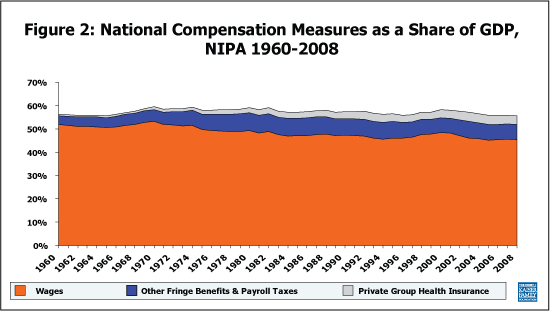
Figure 2 shows total employer costs for three forms of employee compensation as a share of GDP. The three compensation types we consider are: private group health benefits (the upper-most shaded region), wages/salaries (the bottom-most region), and other (non-private group health) benefits and payroll tax contributions (the middle region).5 Total compensation as a share of GDP is denoted by the topmost line and is a fairly stable over the period, ranging from about 56 percent to 59 percent. Although wages are consistently the largest component of worker compensation, the shares paid to employees for health benefits and other fringe benefits/payroll taxes have increased as a share of GDP, while the amount paid as wages has fallen. Health benefit costs have increased from 0.6 percent of GDP in 1960 to 3.8 percent in 2008. Fringe benefits other than health care and payroll taxes have also increased over this period, ranging from 3.8 percent of GDP in 1960 to 6.6 percent in 2008. Wages, meanwhile, have fallen from 51.8 percent of GDP in 1960 to 45.3 percent in 2008.

Source: U.S. Department of Commerce, Bureau of Economic Analysis, National Income and Product Accounts, 1960-2008, Tables 1.1.5, 2.1, 6.11B, 6.11C, & 6.11D.
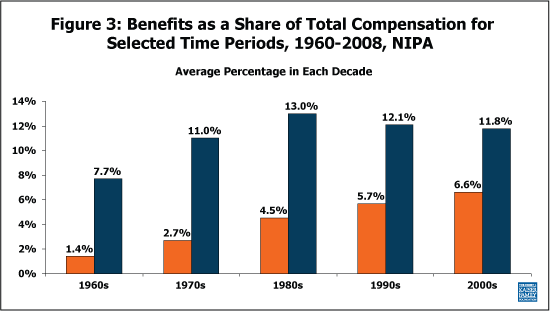
Figure 3 focuses on employer costs for private group health benefits and for non-health benefits as percentages of total compensation (i.e., benefits plus wages) to show more clearly the changes over time. Non-health benefits increased as a share of total compensation from the 1960s to the 1980s, but have fallen modestly since. On the other hand, employer payments for health benefits have increased as a share of total compensation in every decade, reaching 6.8 percent of compensation in 2008.

Source: U.S. Department of Commerce, Bureau of Economic Analysis, National Income and Product Accounts, 1960-2008, Tables 1.1.5, 2.1, 6.11B, 6.11C, & 6.11D.
Note: Percentages shown are averages of annual shares for each time period.
Conclusion
Many people feel the burden of health care costs directly when they use medical goods and services. However, another way these expenses may affect families’ well-being is by slowing the increase in their paychecks each year. These figures show that the share of employee compensation going to health benefits has risen substantially over time, while the share going to wages has fallen. Absent fundamental change in cost growth, these trends seem likely to continue.
The snapshot was prepared by Paul Jacobs, Kaiser Family Foundation, 2007 and updated in November 2009 by Bianca DiJulio. Figure 2 largely reproduces an exhibit presented at several briefings and meetings by Len Nichols, Ph.D., of the New America Foundation. We thank Dr. Nichols for permitting us to reuse and expound upon his work.
Notes:
1. Kaiser Family Foundation, Kaiser Health Tracking Poll—July 2009. Available online at: http://www.kff.org/kaiserpolls/posr072309pkg.cfm.
2. Kaiser Family Foundation/Health Research & Educational Trust, Employer Health Benefits 2009 Annual Survey, September 2009. Available online at: http://www.kff.org/insurance/7936/index.cfm.
3. The data were obtained in November of 2009 from the U.S. Department of Commerce, Bureau of Economic Analysis, National Income and Product Accounts (NIPA) for the years 1960 to 2008. The data are available online at: http://www.bea.gov/national/nipaweb/SelectTable.asp. Note that the Bureau of Economic Analysis periodically updates published values, which may explain differences for data obtained after November of 2009, or differences between this version and the previous version published in February 2008 with data for 1960 through 2006.
4. In Figure 1, employer contributions towards private group health insurance are converted to 2008 dollars using the consumer price index for urban consumers. U.S. Department of Labor, Bureau of Labor Statistics, Consumer Price Index, All Urban Consumers (Current Series). Available online at: http://www.bls.gov/cpi/. For Figures 2 and 3, the data are shown as a percentage of nominal GDP, so they have not been adjusted.
5. Other benefits include employer contributions for: private pension and profit-sharing plans, publicly administered government employee retirement plans, private group life insurance plans, privately administered workers’ compensation plans, and supplemental unemployment benefit plans (denoted as “Employer contributions for employee pension and insurance funds” in the NIPA), as well as old age, survivors, and disability insurance (social security), hospital insurance (Medicare), unemployment insurance, railroad retirement, pension benefit guaranty, veterans life insurance, publicly administered workers’ compensation, military medical insurance, and temporary disability insurance (denoted as “Employer contributions for government social insurance” in the NIPA). For more information, see, U.S. Department of Commerce, Bureau of Economic Analysis, “A Guide to the National Income and Product Accounts of the United States,” September 2006. Available online at: http://www.bea.gov/methodologies/index.htm.
