Factors Affecting States’ Ability to Respond to Federal Medicaid Cuts and Caps: Which States Are Most At Risk?
Introduction
Medicaid, the nation’s primary health insurance program for low-income and high-need Americans, is jointly financed by states and the federal government, but states administer Medicaid programs within broad federal rules. Under federal law, Medicaid provides an entitlement to coverage to individuals who are eligible for the program and a guarantee to federal matching dollars. Given the current financing structure of the program, Medicaid is both a budget item and a revenue item in state budgets. State Medicaid policy choices (including the ACA coverage expansion, other eligibility levels, scope of benefits, reimbursement rates and delivery system models) as well as other factors such as demographics, health needs, health care markets, and state fiscal capacity affect Medicaid spending. Due to all of these factors, Medicaid coverage and financing vary significantly across states (Figures 1 and 2).
Figure 1. State Characteristics
| For notes and sources, see the appendix. |
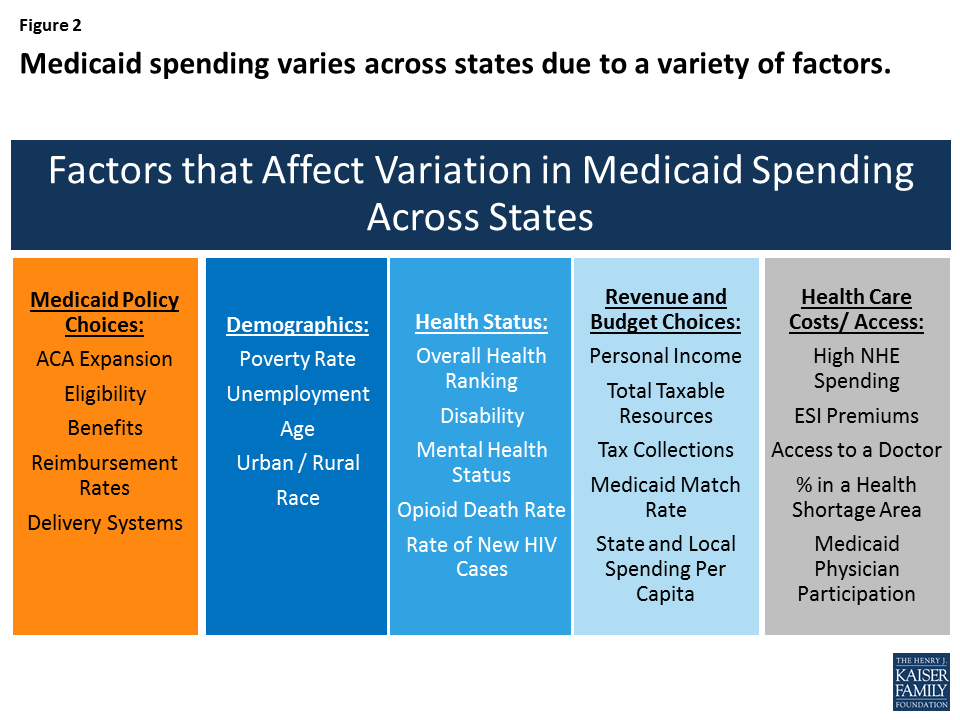
Figure 2: Medicaid spending varies across states due to a variety of factors.
This brief, builds on earlier work that examined the factors contributing to variation in Medicaid spending from 2012. This update reflects changes including the implementation of the ACA and a slowly improving economy. In 2017, Congress has been debating the AHCA, legislation that could eliminate enhanced federal matching funds for the ACA Medicaid expansion and fundamentally change the structure and financing of the overall program by capping and significantly reducing the amount of federal funds provided to states. This brief examines 30 key factors that contribute to variation in Medicaid per enrollee spending and highlights states that may be at particularly high risk under federal cuts or caps in Medicaid funding. We identify “high risk” states as ranking in the top five for each factor. While we use this ranking construct, there may not be significant differences between states that follow in rank order. The brief has findings in five key areas:
- Medicaid policy choices (including implementation of the ACA Medicaid expansion);
- Demographics;
- Health status;
- Available tax revenues and state budget choices; and
- Health care markets (costs and access).
Table 1 includes state level data to show expansion status, Medicaid per enrollee spending for FFY 2014 and number of state residents. The appendix provides sources for data included in the tables and described in the report.
Key Findings
1. Medicaid Policy Choices
Medicaid ACA Expansion
The ACA expanded Medicaid coverage to nearly all adults up to 138% of the federal poverty level (FPL) and provided states with enhanced federal financing for this new coverage; however, the Supreme Court ruling that effectively gave states the option to adopt the expansion resulted in even greater variation in Medicaid programs across states. Following the implementation of the ACA in 2014, millions of people have enrolled in new coverage options (Medicaid and Marketplace), and the uninsured rate for the non-elderly had dropped to a historic low of 10% by early 2016. The proposed elimination of federal enhanced matching funds for the ACA Medicaid expansion included in the AHCA would have different implications for states based on the decision to implement the expansion and the effects of that decision in a given state. States that expanded have experienced benefits tied to coverage gains and financing that could be at risk, while non-expansion states risk the future loss of Medicaid enhanced matching funds for expansion (Figure 3 – states in multiple categories are shown in orange).
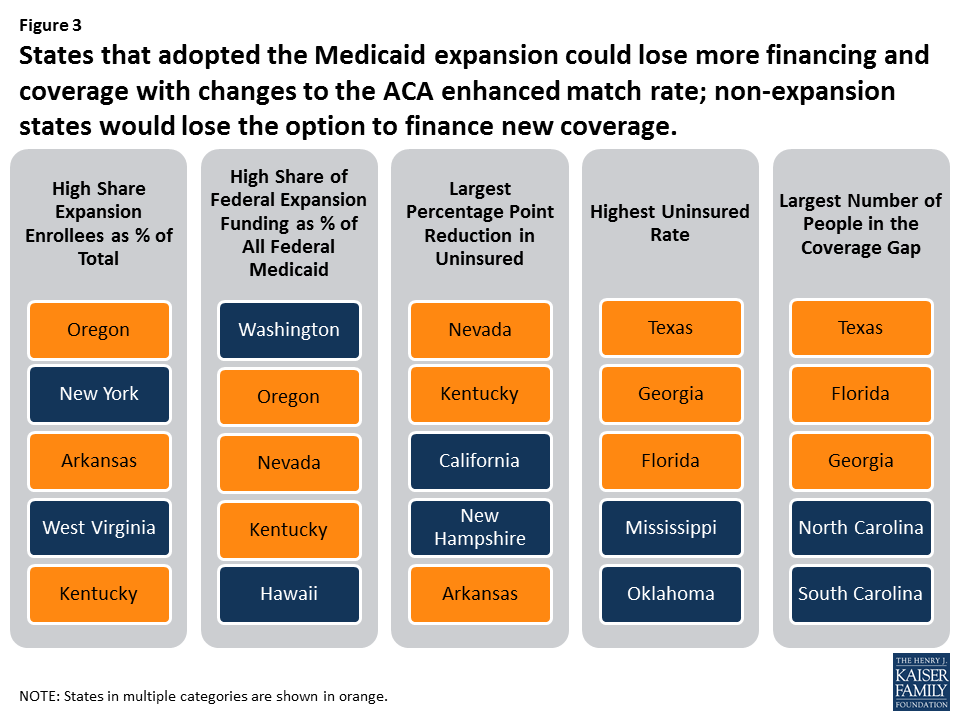
Figure 3: States that adopted the Medicaid expansion could lose more financing and coverage with changes to the ACA enhanced match rate; non-expansion states would lose the option to finance new coverage.
Expansion States. Policy proposals that would end the enhanced federal matching funds for the ACA Medicaid expansion could have significant implications for coverage and financing in expansion states. To date, 32 states (including DC) adopted the Medicaid expansion. Coverage gains were particularly large among low-income people living in states that expanded Medicaid. At the start of 2016, there were 14.4 million adults in the Medicaid expansion group, including 11 million who were “newly” eligible due to the ACA expansion. Overall, expansion enrollment accounted for about 20% of all Medicaid enrollment. From 2014-2016, the federal government financed 100% of the costs of those newly eligible under the expansion. Under the law, this rate phased down to 95% in 2017 and gradually phases down to 90% by 2020. Federal funding for the expansion group totaled $68.2 billion in FY 2015 (about 21% of all federal Medicaid funding). In total numbers, California, New York, Pennsylvania, Ohio and Illinois account for the largest number of enrollees in the expansion group (54%) and California, New York, Ohio, Michigan and Illinois account for the highest levels of federal expansion funding (52%).
- In Oregon, New York, Arkansas, West Virginia, and Kentucky, Medicaid expansion enrollees accounted for 35% or more of total enrollment (Figure 4).
- In Washington, Oregon, Nevada and Kentucky, expansion funding accounts for at least 40% of all federal Medicaid funds.
- Nevada, Kentucky, California, New Hampshire and Arkansas experienced the largest percentage point reduction in the uninsured from 2013 to 2015.
Figure 4. Affordable Care Act (ACA) Expansion
| For notes and sources, see the appendix. |
Eight of the expansion states (Arkansas, Arizona, Illinois, Indiana, Michigan, New Hampshire, New Mexico and Washington) have legislation requiring them to reduce or eliminate the expansion if the federal match rate is reduced. Other states are likely to eliminate or scale back their expansion coverage due to the increased cost if federal funding is reduced. As a result, many expansion adults in these states would likely become uninsured since they would not be able to afford other coverage options. Adults covered by Medicaid typically work in low-wage jobs that do not provide health coverage or are family caregivers, and many have chronic conditions or disabilities. Increases in uninsured rates among these adults would increase strains on other parts of state health care systems, including community health centers and hospitals.
Non-Expansion States. The 19 states that have not expanded would lose the option to expand in the future and access to enhanced federal funds to support their capacity to cover low-income uninsured adults. Most of the non-expansion states (12 of 19) limit Medicaid eligibility for parents to less than half the poverty level and other low-income adults are not eligible regardless of income, except in Wisconsin. Many poor parents and other adults in these states fall into a coverage gap since they do not qualify for Medicaid, but have incomes below 100% of poverty so cannot access tax credits to purchase Marketplace coverage. The ongoing coverage gap for low-income adults in these states limits state capacity to achieve overall improvements in population health. Texas, Florida, Georgia, North Carolina, and South Carolina are the states with the highest number of adults who fall into the coverage gap.
Table 2 includes state level data related to the ACA Medicaid expansion and source information can be found in the appendix.
Other Medicaid Policy Choices
States administer Medicaid within broad federal rules. The federal government sets core requirements, but states have flexibility to determine eligibility levels, benefits, provider payments, and delivery systems. There is a great deal of variation across states in how their Medicaid programs are structured, and therefore differences in spending on the program due to policy choices made by states. Under a per capita cap or block grant policy, states could be locked into historic decisions about their Medicaid programs.
States with more limited Medicaid programs in terms of eligibility, benefits and payment rates could be at higher risk with reductions or caps in federal financing because it could be more difficult for these states to find savings if some core federal requirements remain in place. Moreover, nearly all community based long-term care services are an optional service in Medicaid, so states that have lower levels of home and community-based services (HCBS) may find it difficult to expand these services to shift utilization and achieve savings from reductions in more costly institutional care in the face of federal Medicaid cuts. The AHCA repeals the 6% enhanced federal funding for the Community First Choice Option to provide attendant care services as of 2020, which would result in a $12 billion decrease in federal funding over 10 years and further hinder efforts to increase community integration. In addition, states that have already moved enrollees to managed care would not be able to recoup some of the one-time savings that some states experience in that transition.
Figure 5 identifies states with restrictive Medicaid programs that would face particular challenges to achieving increased savings within their programs in response to reductions in federal funding. States in multiple categories are shown in orange.
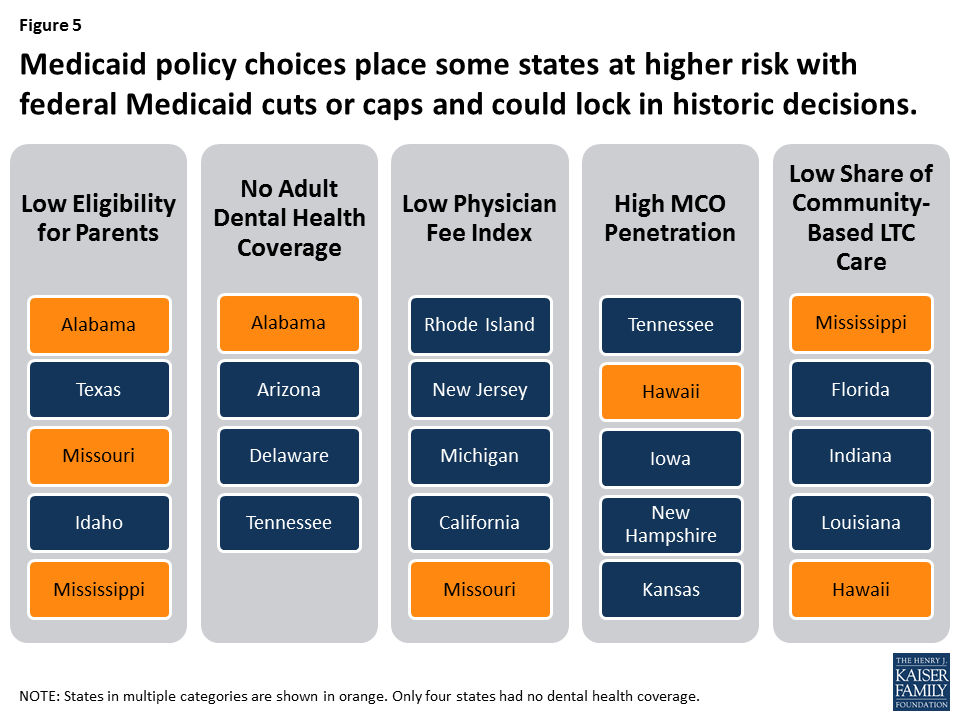
Figure 5: Medicaid policy choices place some states at higher risk with federal Medicaid cuts or caps and could lock in historic decisions.
Eligibility. Federal law requires states to cover certain population groups up to minimum income eligibility levels in order to receive federal matching funds. States can expand coverage beyond federal minimum levels and receive federal matching funds. As of January 2017, the median eligibility levels were 255% of the federal poverty level (FPL) for children and 138% FPL for parents and adults without dependent children. Eligibility levels for adults in non-expansion states are much lower for parents and Wisconsin is the only non-expansion state to provide Medicaid coverage to childless adults. Alabama, Texas, Missouri, Idaho and Mississippi have the lowest eligibility levels for parents. The median eligibility thresholds for parents in non-expansion states is 44% FPL (Figure 6).
Figure 6. Medicaid Policy
| For notes and sources, see the appendix. |
Benefits. States participating in Medicaid must cover a core set of benefits, but states can also receive federal matching funds for coverage of “optional benefits.” All states cover some optional benefits, but the scope of state benefit packages varies widely across states. States also have flexibility in determining the amount, duration and scope of the benefits they offer. Adult dental benefits can be used as a proxy to understand the variation across state benefit packages. While almost all states (46) and DC currently provide some dental benefits for adults in Medicaid, the scope of Medicaid adult dental benefits varies widely by state. As of February 2016, 15 states provided extensive adult dental benefits, 19 states provided limited dental benefits, and 13 states covered only dental care for pain relief or emergency care for injuries, trauma, or extractions. Four states provided no dental benefits at all. Like other optional Medicaid services, adult dental benefits are often cut when states face budget pressures.
Payment Rates/Physician Fees. States largely determine provider payments within limited federal requirements. Federal law requires that payments be consistent with efficiency, economy, quality and access, and safeguard against unnecessary utilization. For physicians and other providers, states are required to pay rates that are sufficient to ensure access equal to the rest of the area population. In 2014, Medicaid paid physicians on average 66% of Medicare rates and 59% of what Medicare pays for primary care. Relative to what other states reimburse for physicians, Rhode Island, New Jersey, Michigan, California and Missouri have the lowest physician fee index.
Managed Care. Today, 39 states contract with managed care organizations (MCOs) and risk-based managed care is the dominant delivery system in Medicaid. Hawaii, Tennessee, Iowa, New Hampshire, Kansas and New Jersey all report that at least 95% of enrollees are in MCOs. Sometimes, when states first transition to managed care arrangements, they can see some savings relative to fee-for-service arrangements, but savings are not sustained not over time. States that have already transitioned to managed care have less ability to use this as a mechanism to reduce future per enrollee costs.
Long-Term Care Setting. Medicaid covers a continuum of long-term care service settings. Driven by requirements under the Americans with Disabilities Act (ADA), consumer preferences and efforts to control long-term care costs, states continue to work on reorienting their Medicaid long-term care delivery systems away from institutional settings and toward more community-based services. Overall, more than half of spending (55%) for long-term care is for HCBS, but this varies by state from a high of 82% in Oregon to 31% in Mississippi.
Table 3 includes state level data related to Medicaid policies and source information can be found in the appendix.
2. Demographics
Demographic characteristics vary across states. These characteristics affect demand for Medicaid as well as public health services more broadly. States with high rates of poverty, unemployment, and uninsured could have higher demands for Medicaid. Similarly, because Medicaid is the largest provider of long-term services and supports, states with higher shares of elderly as well as states facing the fastest growth projections in their population over 85 years old could face increased demand for Medicaid. In addition, Medicaid plays an important role in providing coverage to people of color as well as people in rural areas. States with demographic factors that contribute to high demand for Medicaid could be disproportionately impacted by cuts or caps in federal Medicaid funding compared to other states. High demand and limited funding could make it challenging for these states to meet the needs of the residents in their state. Individuals in poverty or who are unemployed are unlikely to have another source of health coverage and those who are uninsured are at risk for not getting needed health services.
Figure 7 highlights states with demographic characteristics that lead to increased need for Medicaid. States in multiple categories are shown in orange.
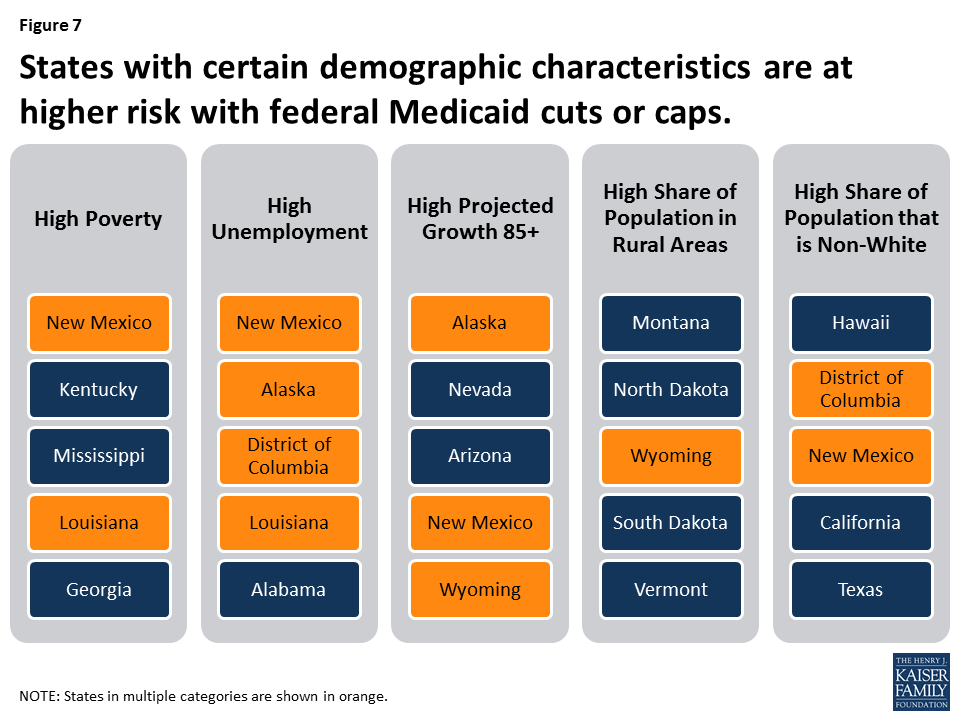
Figure 7: States with certain demographic characteristics are at higher risk with federal Medicaid cuts or caps.
Poverty. Many government assistance programs are targeted to help low-income families. Programs administered or supported by the United States Department of Health and Human Services (HHS) use the department’s federal poverty guidelines. The annual federal poverty level in 2017 is $12,060 for an individual and $20,420 for a family of three. In 2015, 14% of people living in the U.S. had incomes below the poverty level. The percent of the population living below poverty varies by state, ranging from less than 10% of residents in Alaska, Connecticut, Minnesota, New Hampshire and Utah up to 20% in Kentucky and New Mexico.
Unemployment. During an economic downturn, individuals lose jobs, incomes drop, and state revenues decline at the same time that demand for public programs such as Medicaid, cash assistance, and food stamps increase. During the most recent recession, unemployment peaked at 10% in October 2009. The economy has been improving since then and unemployment rates have been stable at less than 5% since May 2016, but rates vary across states. As of April 2017, the national unemployment rate was 4.4%. Colorado, Hawaii, Maine, Nebraska, New Hampshire, North Dakota, and South Dakota had unemployment rates at 3% or less, while Alaska and New Mexico had rates greater than 6%.
Age. Demand for health care services varies by age. For example, those over the age of 65 are more likely to need long-term care services than children, who generally require fewer medical services and mostly preventive care and acute care. In 2015, the elderly accounted for 15% of the population and the population 85 years of age and older accounted for 2%.1 From 2015 to 2030, the percent of the population 85 years and older is expected to grow by 41% with 21 states projecting growth in the 85 and older population of more than 50% (Figure 8).
Figure 8. Demographics
| For notes and sources, see the appendix. |
Rural. States with large rural populations tend to have poorer residents with complex and costly health needs, which are often exacerbated by workforce shortages and large geographic distances between patients and providers. Medicaid plays a central role in helping to fill gaps in private coverage in rural areas. States including Montana, North Dakota, and Wyoming have all of their populations living in rural areas.
Race. Communities of color are more likely to face disparities in health and access to health care and Medicaid plays an important role in improving coverage for persons of color. In seven states (California, District of Columbia, Hawaii, Maryland, Nevada, New Mexico, and Texas), the share of the population that is non-white is 50% or more.
Table 4 includes state level data related to demographic characteristics and source information can be found in the appendix.
3. Health Status
Health status characteristics vary across states and these characteristics affect demand for Medicaid as well as public health services more broadly. Medicaid plays an important role in serving individuals with disabilities, addressing public health crises, and providing mental health care. Medicaid also plays a central role in helping states address the opioid crisis and the HIV epidemic. Cuts or caps in federal Medicaid financing could increase the challenges in addressing the opioid and HIV epidemics and providing care for individuals with disabilities. Figure 9 shows states that have particularly high health needs across certain measures; states in multiple categories are shown in orange.
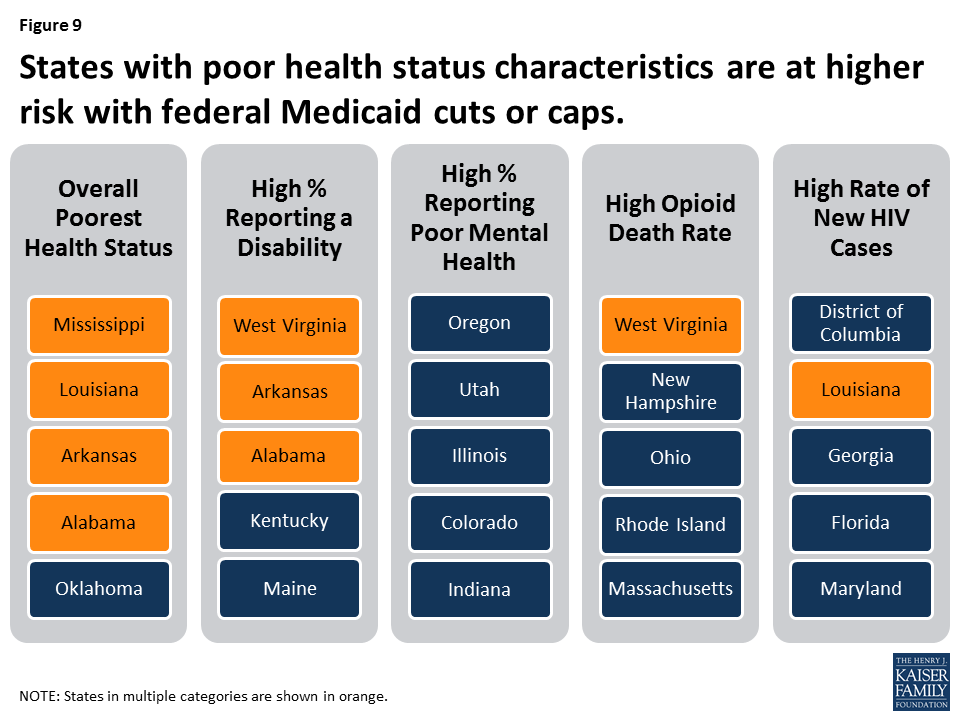
Figure 9: States with poor health status characteristics are at higher risk with federal Medicaid cuts or caps.
Overall Health Ranking. America’s Health Rankings® Annual Report provides annual state-by-state rankings based on behaviors, community and environment, policy, clinical care, and outcomes data. Based on these data, Hawaii, Massachusetts, Connecticut, Minnesota and Vermont are the healthiest states and Mississippi, Louisiana, Arkansas, Alabama and Oklahoma have the greatest challenges.
Disability. Medicaid covers more than 3 in 10 nonelderly adults with disabilities, providing a broad range of medical and long-term care services that enable people with disabilities to live and work in the community. There are a number of factors that determine the need for health and long-term care services in states, including the prevalence of disability and chronic conditions as well as other indicators of health. In 2015, 13% of the non-institutionalized population reported having a disability. Sixteen states had 15% or more of noninstitutionalized people reporting a disability (Figure 10). In FY 2014, Medicaid enrollees with a disability accounted for 40% of Medicaid spending, but only 14% of Medicaid enrollment; the spending per enrollee for these individuals was three times as much as the average spending per all enrollees.2
Figure 10. Health Status
| For notes and sources, see the appendix. |
Mental Health. The Medicaid program covers a disproportionate share of individuals with behavioral health conditions. More than one in four adults with Medicaid (27%) have a mental illness. The Medicaid program serves as a safety net for many low-income individuals with behavioral health conditions by facilitating access to and financing numerous services, including clinical services, case management, prescription medication and rehabilitative services. Over one-third of adults nationally (35%) report poor mental health.
Opioid Deaths. The opioid epidemic is increasing among Americans with addiction to heroin and prescription painkillers. Medicaid plays a central role in the nation’s effort to address the opioid epidemic through coverage of people struggling with opioid addiction and financing for states. In 2015, more than 10 people in every 100,000 died from an opioid related drug overdose nationally and opioid overdoses accounted for 63% of all drug overdoses. West Virginia, New Hampshire and Ohio reported the highest opioid related drug overdoses at over 24 people in every 100,000.
HIV. Medicaid is the largest source of coverage for individuals with HIV. By covering more people with HIV and increasing state capacity to provide treatment to individuals with HIV, Medicaid plays a key role in curbing the epidemic. In 2015, the new HIV diagnoses rate among adults and adolescents was 14.7 people for every 100,000.
Table 5 includes state level data related to health status and source information can be found in the appendix.
4. Available Revenues And State Budget Choices
States vary in the amount of revenue resources available and in how they tap into those resources to pay for public services and programs. States also make different decisions about how revenue is allocated across different areas of spending. Medicaid is an important revenue source for states, but also a major source of spending. Figure 11 highlights states with lower tax bases, lower tax collections and higher federal Medicaid match rates, which would be at higher risk with reductions or caps in federal financing because it would be more difficult for these states to offset the loss of federal funds with state funds. States in multiple categories are shown in orange.

Figure 11: States with less tax capacity and high Medicaid match rates are at higher risk with federal Medicaid cuts or caps.
Tax Base. A states’ tax base provides a measure of resources that may be available to a state. Two measures of tax base include personal income and total taxable resources. Per capita personal income3 is currently used to determine the Federal Medical Assistance Percentage (FMAP) for Medicaid. States with low personal income per capita have a higher FMAP. Personal income per capita does not include all potential taxable income sources in a state.4 In 2014, personal income per capita was $46,049 nationally (Figure 12). Total taxable resources (TTR) is an alternative and more comprehensive measure of tax base designed to better account for a state’s available resources to provide public services.5,6 Mississippi, West Virginia, South Carolina, Idaho and New Mexico had the lowest personal income per capita in 2014. Mississippi, Arizona, Idaho, South Carolina and Alabama had the lowest TTR in 2014.
Figure 12. Available Revenues and State Budgets
| For notes and sources, see the appendix. |
Tax Collections. Tax collections are one measure of how a state taps into its available resources. In 2014, tax collections per capita averaged $4,675 across the U.S.7 This brief examines tax collections as a percent of personal income as a proxy for a more representative measure of tax effort, that is, how much a state collects in taxes relative to its tax capacity. Tax collections as a share of personal income averaged 10%. Tennessee, Florida, Alabama, South Dakota and Oklahoma had the lowest tax collections as a share of personal income.
State and Local Spending Per Capita. Because states must balance their budgets annually, state spending is a function of how much revenue is collected. Average state and local spending per capita in 2014 was $8,489. Idaho, Arizona, Georgia, Nevada and Tennessee had the lowest state and local spending per capita from all sources.
Federal Medical Assistance Percentage (FMAP). As noted above, the FMAP is based on a state’s relative personal income per capita. States with lower relative personal income have a higher FMAP. In FY 2018, the FMAP ranged from a floor of 50% to a high of 76% in Mississippi.
Table 6 includes state level data related to income, tax, spending data and FMAP variables and source information can be found in the appendix.
5. Health Care Markets (Costs and Access)
Medicaid programs purchase services from the private market as other insurers do. Therefore, some of the variation in Medicaid spending is due to differences in health care markets and the ability to access care as well as the number of providers and health care facilities in a given state. The share of the population living in health professional shortage areas and the share of providers accepting Medicaid also varies by state and can contribute to overall variation in per enrollee costs. Figure 13 highlights states with high health care costs and limited access, which could be at higher risk under reductions or caps in federal financing because it would become increasingly difficult to purchase services in a high cost market or make improvements in access to care. It also highlights states with low Medicaid physician participation, which would be at risk under Medicaid cuts or caps because it would be difficult to increase provider rates beyond the caps to promote additional provider participation. States in multiple categories are shown in orange.
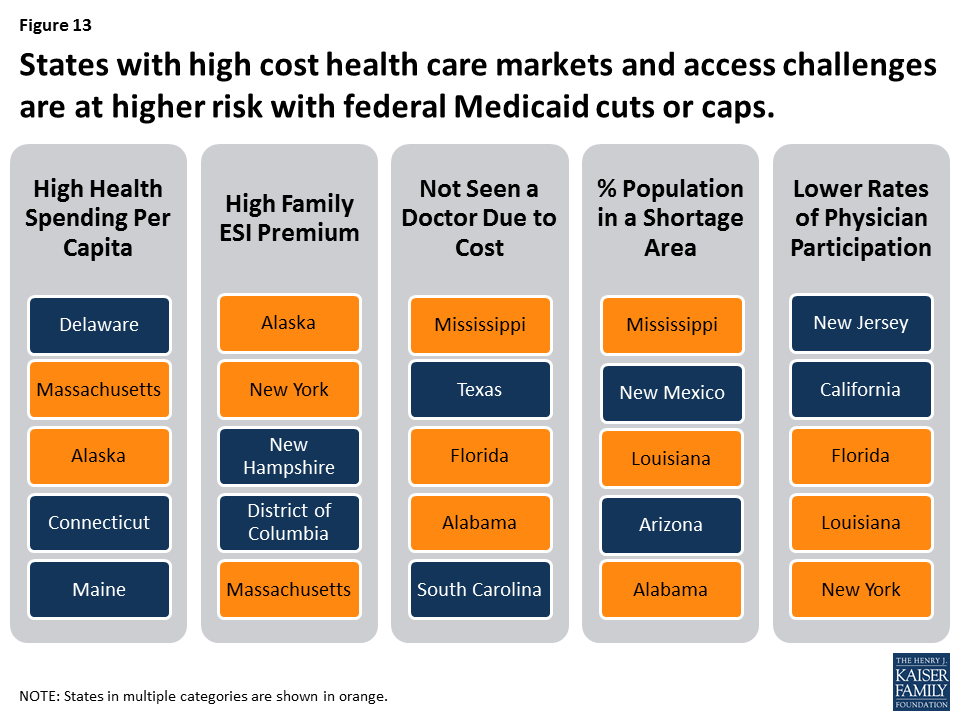
Figure 13: States with high cost health care markets and access challenges are at higher risk with federal Medicaid cuts or caps.
Health Care Costs. Medicaid spending is, in part, affected by the cost of procuring health care in the state market. Differences in the cost of obtaining health care in a particular state affects the amount state Medicaid programs have to spend in order to purchase services. Health care costs typically outpace inflation. In 2009, national health expenditures (NHE) per capita were $6,815. Half of all U.S. residents and 56% of non-elderly residents are covered by employer-sponsored insurance (ESI) plans. In 2015, the average premium cost for a family (including the employee and employer shares) for employer-based coverage was $17,322 (with 73% paid by the employer).
Access to Care. Access varies across states due to factors such as provider availability, geography and population density, payment, and other local factors. The presence of access barriers may influence Medicaid beneficiaries’ ability to access services and, in turn, state Medicaid spending. Nationally, 13% of the population reported that they had not seen a doctor because of cost. This was most likely to occur in Mississippi, Texas, Florida, Alabama, and South Carolina. Areas with a documented shortage of providers are designated as Health Professional Shortage Areas (HPSAs) by the Health Resources and Services Administration (HRSA). As of December 2016, HRSA had designated 6,626 primary care HPSAs across the country, affecting over 66 million people. Nationally, 20% of the population lives in a primary care HPSA. Mississippi, New Mexico, Louisiana, Arizona and Alabama have the highest share of their populations in primary care HPSAs (Figure 14).
Figure 14. Health Care Markets (Cost and Access)
| For notes and sources, see the appendix. |
Physician Participation. Nationally, 69% of all office-based physicians accept new Medicaid patients. The percentage of physicians accepting new Medicaid patients varies by state, ranging from 39% in New Jersey to 97% in Nebraska. In one-quarter of states (14), more than 85% of physicians accept new Medicaid patients.
Table 7 includes state level data related to health care market costs and access, and source information can be found in the appendix.
Looking Ahead
Today, Medicaid is a state and federal partnership. The program is largely administered by states within broad federal rules. States have flexibility to make policy choices related to eligibility, benefits and how to deliver and pay for care. States and the federal government share financing for Medicaid and states have a guarantee to federal matching dollars with no set limit. Under current law, Medicaid spending per enrollee varies across states due to a complex array of factors that involve state policy choices, residents’ needs for public health services as well as health and long-term care, states’ abilities to raise revenue and collect revenue, Medicaid policy choices, and the underlying health care market in a state.
Congress continues to debate and consider legislation to eliminate the enhanced match for the Medicaid ACA expansion and cut and cap federal Medicaid financing through a block grant or per capita cap. The cap on federal funding would lock-in current state spending patterns that reflect historic Medicaid policy choices. All states could face challenges responding to federal Medicaid cuts and caps, but states with certain characteristics are more at risk.
Challenging demographics, poor health status, low tax capacity and state spending, high health care costs and poor access are key factors that would place states at higher risk from a per capita cap or block grant. If states are locked in to prior policy choices, states with limited eligibility and benefits, lower provider rates and those that have already moved to capitated care arrangements could be at higher risk with federal Medicaid spending caps because these states would have few options to reduce the scope of the program or generate new efficiencies. States that have seen the largest gains in coverage and those that have high shares of federal Medicaid dollars from the expansion could see the biggest losses if the ACA Medicaid expansion funds are eliminated, while other states that have not expanded, could lose the future opportunity to expand and see similar gains in coverage and financing.
This analysis of 30 factors in 5 groups shows that all states have risk factors to varying degrees; more than 6 in 10 states rank in the top five for multiple risk factors. Eleven states rank in the top five for five or more risk factors (Alabama, Arizona, Florida, Georgia, Kentucky, Louisiana, Mississippi, New Mexico, South Carolina, Texas, and West Virginia). Looking ahead, limiting the growth in federal Medicaid spending could force states to make difficult choices in their current programs and could also limit states’ ability to afford new drug therapies or other medical advances, adapt to changing demographics or make future investments to improve delivery systems or address broader health status issues.