People with Medicare Will Face Higher Costs for Some Orphan Drugs Due to Changes in the New Tax and Budget Law

Published: Oct 20, 2025

Editorial Note: This brief was originally published on September 24, 2025 and was updated on October 20, 2025 to include the revised, higher cost estimate from the Congressional Budget Office of the changes to the orphan drug exclusion in the 2025 tax and budget reconciliation law.

Changes are coming to Medicare’s drug price negotiation program that could result in close to $10 billion in additional Medicare spending over time and higher out-of-pocket costs for people with Medicare. Under the Medicare Drug Price Negotiation Program, the federal government is required to negotiate with drug companies for the price of some high-spending drugs that have been on the market for several years without competition, with the goal of lowering Medicare drug spending and helping to reduce out-of-pocket costs for people with Medicare. The law that established the negotiation program, the Inflation Reduction Act of 2022, excluded certain types of drugs from negotiation, including orphan drugs approved to treat a single rare disease or condition. The new tax and budget reconciliation law passed by Congressional Republicans and signed by President Trump in July 2025 modifies the orphan drug exclusion in ways that will lead to higher Medicare spending – an additional $8.8 billion, according to a recently-updated Congressional Budget Office (CBO) estimate, up from its original estimate of $4.9 billion, which did not fully account for all the drugs that will likely be affected – and higher costs for beneficiaries who take these medications.

Takeaways

  • The new tax and budget law will result in delayed eligibility or exclusion from Medicare drug price negotiation for several high-spending drugs, including a number of cancer drugs and other medications with $17.5 billion in total spending by Medicare and beneficiaries in 2023. For example, the changes in law are expected to delay selection of Keytruda and Opdivo, both on the market since 2014, by at least one year. In 2023, Medicare and beneficiaries spent $5.6 billion on Keytruda and $2.0 billion on Opdivo. Several other drugs are also likely to be delayed in their eligibility to be selected for negotiation or are now ineligible for negotiation unless they receive non-orphan approvals in the future.
  • Expanding the orphan drug exclusion to allow more drugs to be delayed or excluded from Medicare drug price negotiation, as under the new tax and budget law, will mean higher out-of-pocket costs for Medicare beneficiaries who use these medications. Medicare’s negotiated drug prices can help to lower the amount beneficiaries pay, particularly in situations where they face a coinsurance requirement that is calculated based on the underlying price of the drug, such as in the case of Part B drugs and higher-cost Part D drugs. By delaying or excluding additional orphan drugs from selection for price negotiation, the tax and budget law will maintain higher prices for these drugs relative to the price Medicare would have paid if the drugs had been eligible and selected for drug price negotiation, which will translate to higher out-of-pocket liability. For example, if the government were to negotiate a 22% discount off the price of Keytruda, on par with the average 22% net price discount from the first round of Medicare drug price negotiation, that would generate annual savings on cost-sharing liability of around $3,300 for Medicare beneficiaries who use Keytruda.
  • Delaying or excluding orphan drugs from Medicare drug price negotiation will cost the federal government several billion dollars over the coming decade – $8.8 billion according to CBO, or close to 10% of the overall 10-year $98.5 billion savings to Medicare that CBO projected from the Inflation Reduction Act’s Medicare drug price negotiation program when that law passed in 2022. CBO’s new estimate is 80% higher than its original estimate of $4.9 billion, which did not fully account for all the drugs that will likely be affected, including Keytruda, Opdivo, and Darzalex. The cost to Medicare of changes to the orphan drug exclusion included in the 2025 reconciliation law could also grow over time based on how the pharmaceutical industry responds, if it leads to more orphan drugs coming to market and additional orphan indications (as well as non-orphan indications) for orphan drugs already on the market to avoid or delay being subject to price negotiation.

What is the orphan drug exclusion and how does the new tax and budget law modify it?

Under the IRA, drugs that are designated for only one rare disease or condition with approvals under that one designation were excluded from Medicare drug price negotiation. This exclusion helped to address pharmaceutical industry concerns about the potential dampening effect on orphan drug research and development if drugs approved to treat a single rare disease were subject to Medicare price negotiation. After enactment of the IRA, efforts to expand the orphan drug exclusion were launched, based on pharmaceutical industry and rare disease advocacy group concerns about the potential impact on research and development for multi-orphan drugs. This echoes broader claims made by the industry about the impact on drug development associated with other policies to reduce drug prices, even as high drug prices create affordability and access challenges for patients. Nevertheless, lobbying efforts culminated with the inclusion of changes to the IRA’s orphan drug exclusion supported by the pharmaceutical industry in the recently enacted tax and budget law.

Changes in the tax and budget law include broadening the orphan drug exclusion to make orphan drugs that are designated for multiple rare diseases or conditions, not just a single rare disease, ineligible for Medicare drug price negotiation, and delaying the start of the 7- or 11-year waiting period for selection for drug price negotiation for orphan drugs that subsequently receive FDA approval for a non-orphan indication. Under the IRA, small-molecule drugs must be 7 years past FDA approval and biologics 11 years past FDA licensure when drugs are selected for negotiation. Under the new tax and budget law, for orphan drugs, this 7- or 11-year waiting period begins only when the drug has received approval for a non-orphan indication.

While these changes to Medicare’s drug price negotiation program might appear to be relatively minor, they will result in some very high-spending drugs becoming eligible for negotiation later than they otherwise would have been and other drugs will be excluded entirely unless they are approved for non-orphan uses in the future. Taken together, these changes have the potential to reduce savings to Medicare from the negotiation program and lead to higher beneficiary out-of-pocket costs.

The new tax and budget law could impact which high-spending drugs are selected for negotiation in the coming year

A number of drugs that were expected to be selected for Medicare drug price negotiation in the near future based on meeting the criteria for selection – including total Medicare spending of more than $200 million, lack of generic or biosimilar equivalents, and a sufficient number of years since FDA approval – are now likely to be off the table, either delayed in their eligibility to be selected for negotiation or no longer eligible. Among them are several high-spending cancer drugs, including Keytruda, Darzalex, Opdivo, and Jakafi, along with several other medications used to treat various types of cancer and other medical conditions (Table 1).

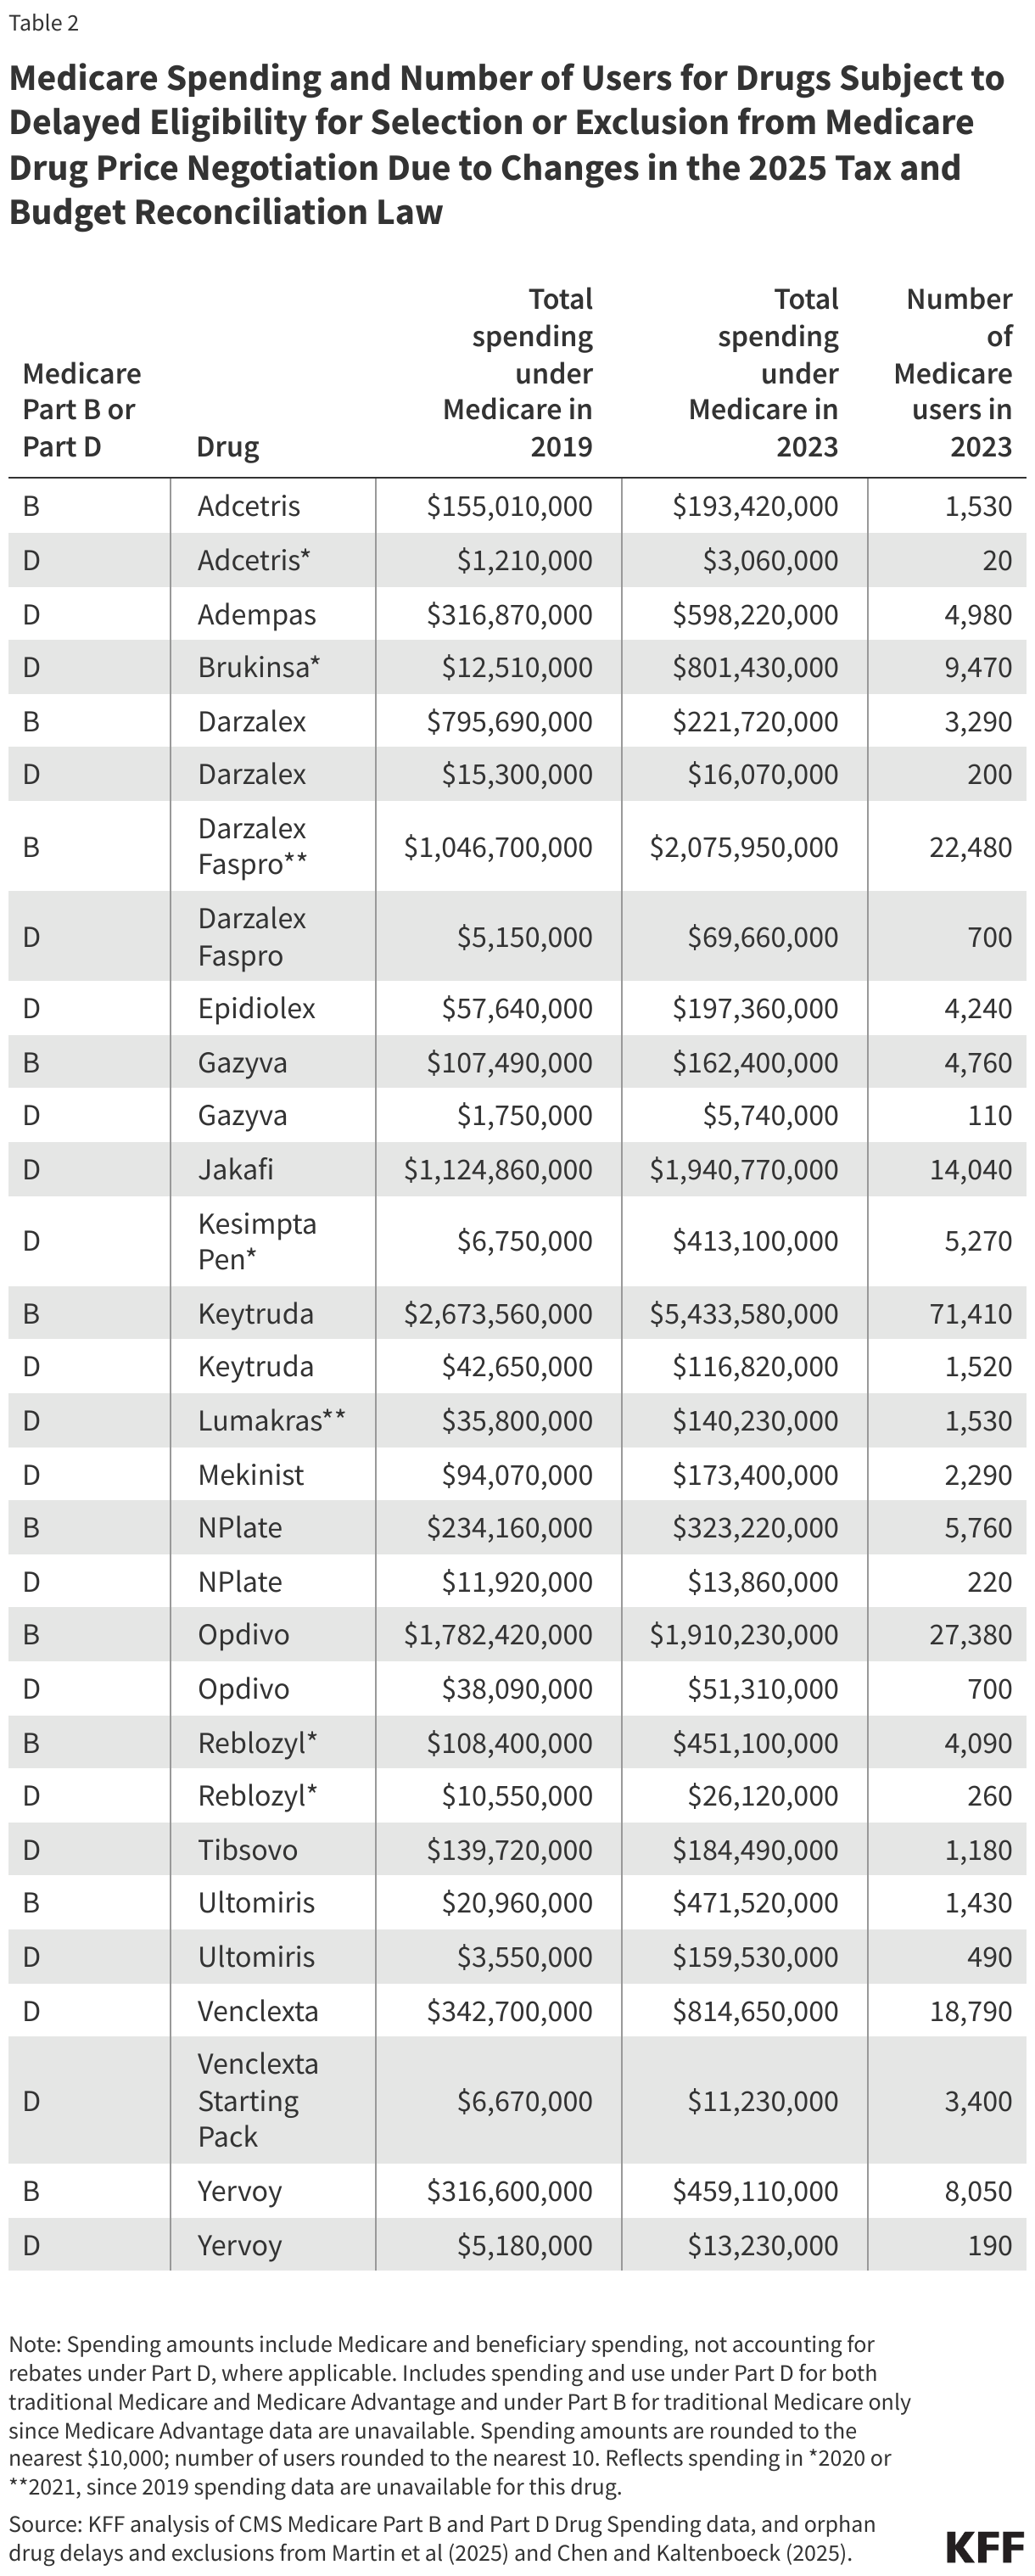
In 2023, spending by Medicare and beneficiaries on these drugs totaled $17.5 billion, an 83% increase since 2019 ($9.5 billion), based on Medicare Part B and Part D drug spending data from the Centers for Medicare & Medicaid Services (Figure 1, Table 2). These estimates include Part D spending under both traditional Medicare and Medicare Advantage but Part B drug spending in traditional Medicare only, since Medicare Advantage spending data are unavailable. Of these medications, Keytruda alone accounts for 32% of the total, with $5.6 billion in spending in 2023, up from $2.7 billion in 2019. Of the 734 drug and biologic products included in CMS’s Medicare Part B drug spending data for 2023, Keytruda ranked number one in terms of total spending by Medicare and beneficiaries, excluding any spending by enrollees in Medicare Advantage.
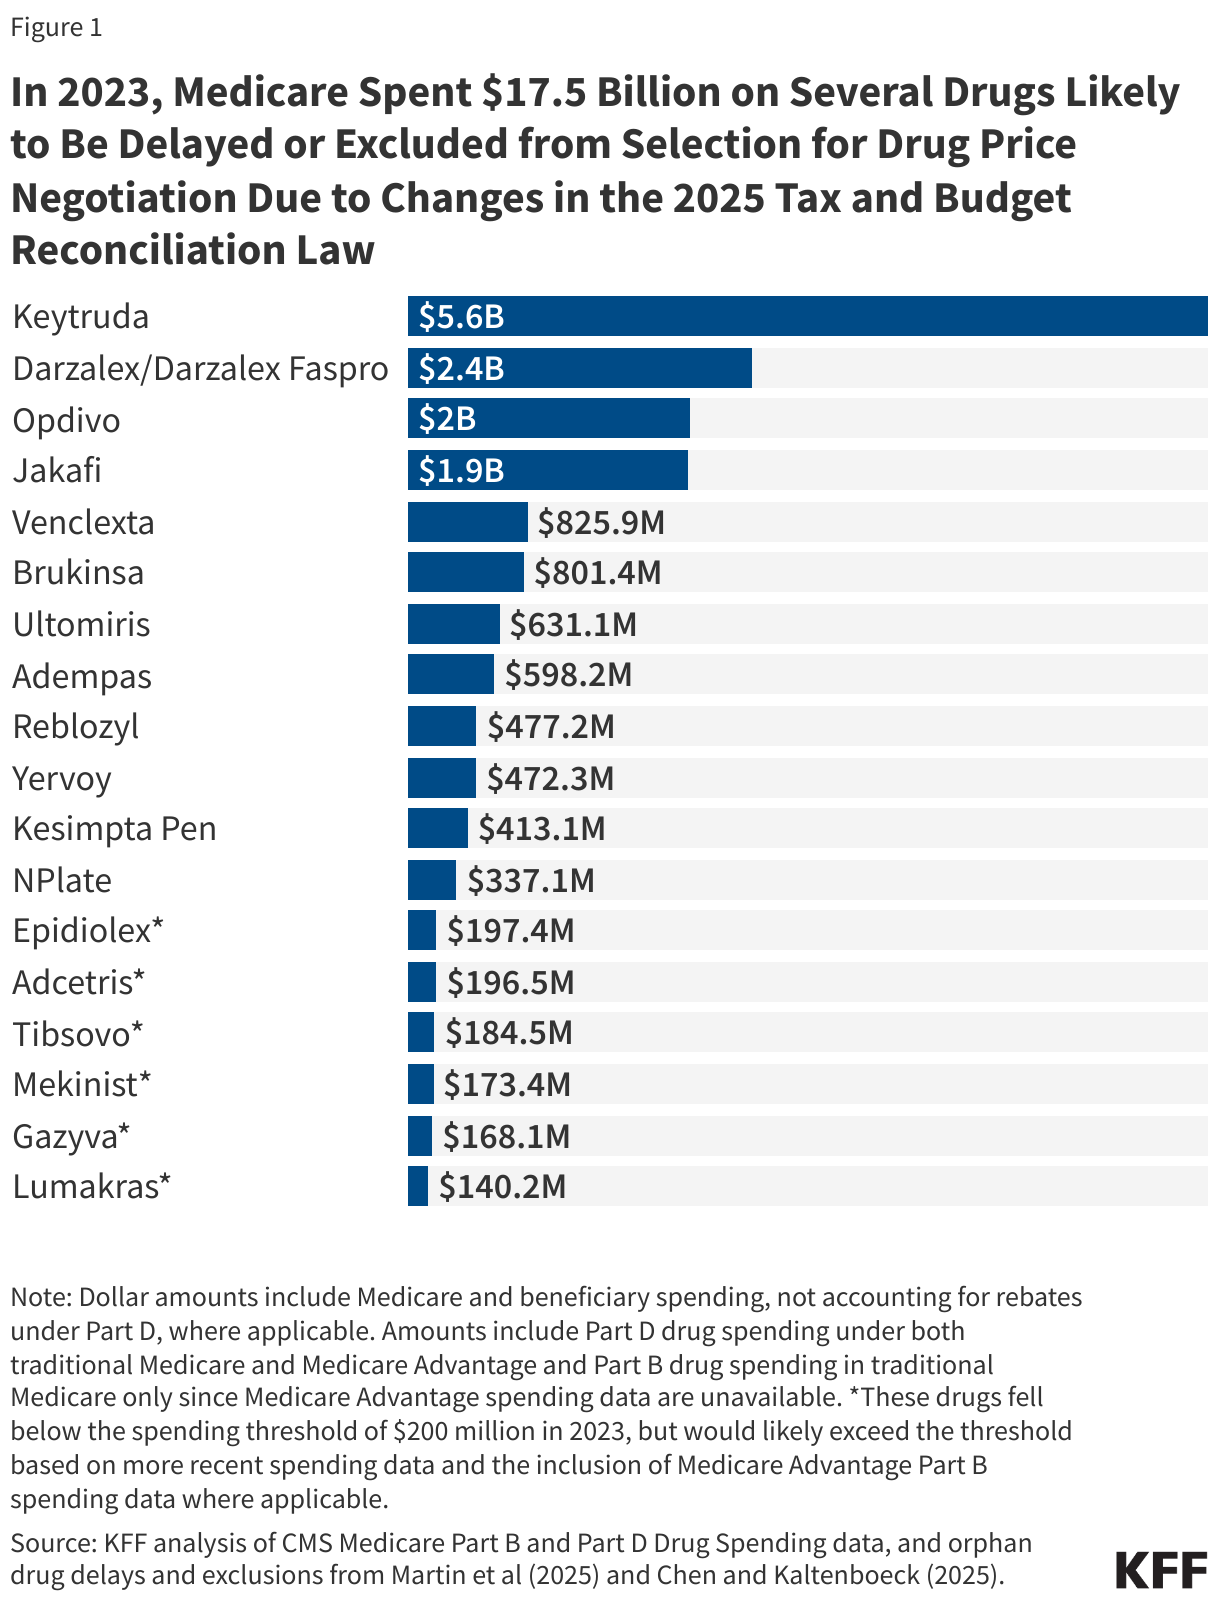
In 2023, Medicare Spent .5 Billion on Several Drugs Likely to Be Delayed or Excluded from Selection for Drug Price Negotiation Due to Changes in the 2025 Tax and Budget Reconciliation Law (Bar Chart)

The change in law is expected to delay selection of Keytruda and Opdivo for price negotiation by at least one year, with a longer delay or exclusion from negotiation applying to other medications

Changes to the orphan drug exclusion will take effect beginning with the third round of drug price negotiation in 2026, with the selection of drugs required to be announced no later than February 1, 2026, and Medicare’s negotiated prices for these drugs taking effect on January 1, 2028. The changes are likely to have an immediate impact on which drugs are selected for Medicare price negotiation in 2026 by delaying the selection of Keytruda and Opdivo, which were likely to be selected for negotiation next year based on their total spending levels and meeting other statutory criteria.

  • Keytruda, manufactured by Merck, was first approved as an orphan drug to treat melanoma in September 2014 and was subsequently approved for a non-orphan indication for non-small cell lung cancer in October 2015, followed by several other approvals for additional indications, broadening its use beyond the original rare disease approval. Under the IRA, Keytruda would have been eligible to be selected for price negotiation in February 2026, since that will be more than 11 years after its initial FDA approval, and Medicare’s negotiated price would have been available in 2028 if it had been selected next year. But under the new tax and budget law, Keytruda’s eligibility to be selected for negotiation will be delayed a year to 2027, with Medicare’s negotiated price available in 2029 if it is selected for negotiation. This is because the 13-month period that Keytruda was on the market as an orphan-only drug will not count towards the 11-year waiting period following initial FDA approval that determines when biologic drugs potentially become eligible for selection.
  • A similar delay likely applies to Opdivo, manufactured by Bristol Myers Squibb, which was first approved as an orphan drug to treat melanoma in December 2014 but was subsequently approved for a non-orphan indication for non-small cell lung cancer in March 2015. Opdivo’s eligibility to be selected for negotiation will be delayed a year from 2026 to 2027, assuming the drug continues to meet other criteria for selection.

A longer delay likely applies to other orphan drugs, including Yervoy, manufactured by Bristol Myers Squibb, which was first approved as an orphan drug to treat melanoma in March 2011 but was subsequently approved for non-orphan indications for kidney cancer in April 2018 and colorectal cancer in July 2018. Eligibility for Yervoy to be selected for negotiation will likely be delayed by four years, from 2026 to 2030.

Exclusion from negotiation will now apply to several other orphan drugs based on the new tax and budget law’s changes to the IRA’s orphan drug exclusion provision. For example, Jakafi (manufactured by Incyte), Venclexta (manufactured by AbbVie), and Darzalex (manufactured by Janssen Biotech) are orphan drugs with multiple orphan designations and approvals but no non-orphan approvals, which previously made them eligible to be selected for negotiation under the IRA, but they are no longer eligible under the new tax and budget law, unless they receive approval for wider uses in the future.

The high price of these drugs has contributed to their relatively high annual Medicare spending per user

Total spending by Medicare and beneficiaries on a single claim for each of these drugs in 2023 exceeded several thousand dollars – in many cases, $10,000 or more – which translated to annual total spending per user of tens of thousands of dollars. For example, spending on the blood cancer drug Jakafi under Medicare Part D was $16,700 per claim and $138,200 per user in 2023; spending on Keytruda under Medicare Part B was $12,600 per claim and $76,100 per user in 2023, and for Opdivo, Part B spending was $10,500 per claim and $69,800 per user (Figure 2). While the total number of Medicare beneficiaries using any one of these medications is relatively low compared to more commonly used drugs – around 70,000 for Keytruda in 2023 and fewer than 30,000 for the other medications (Table 2) – their high prices translate to relatively high annual spending under Medicare.
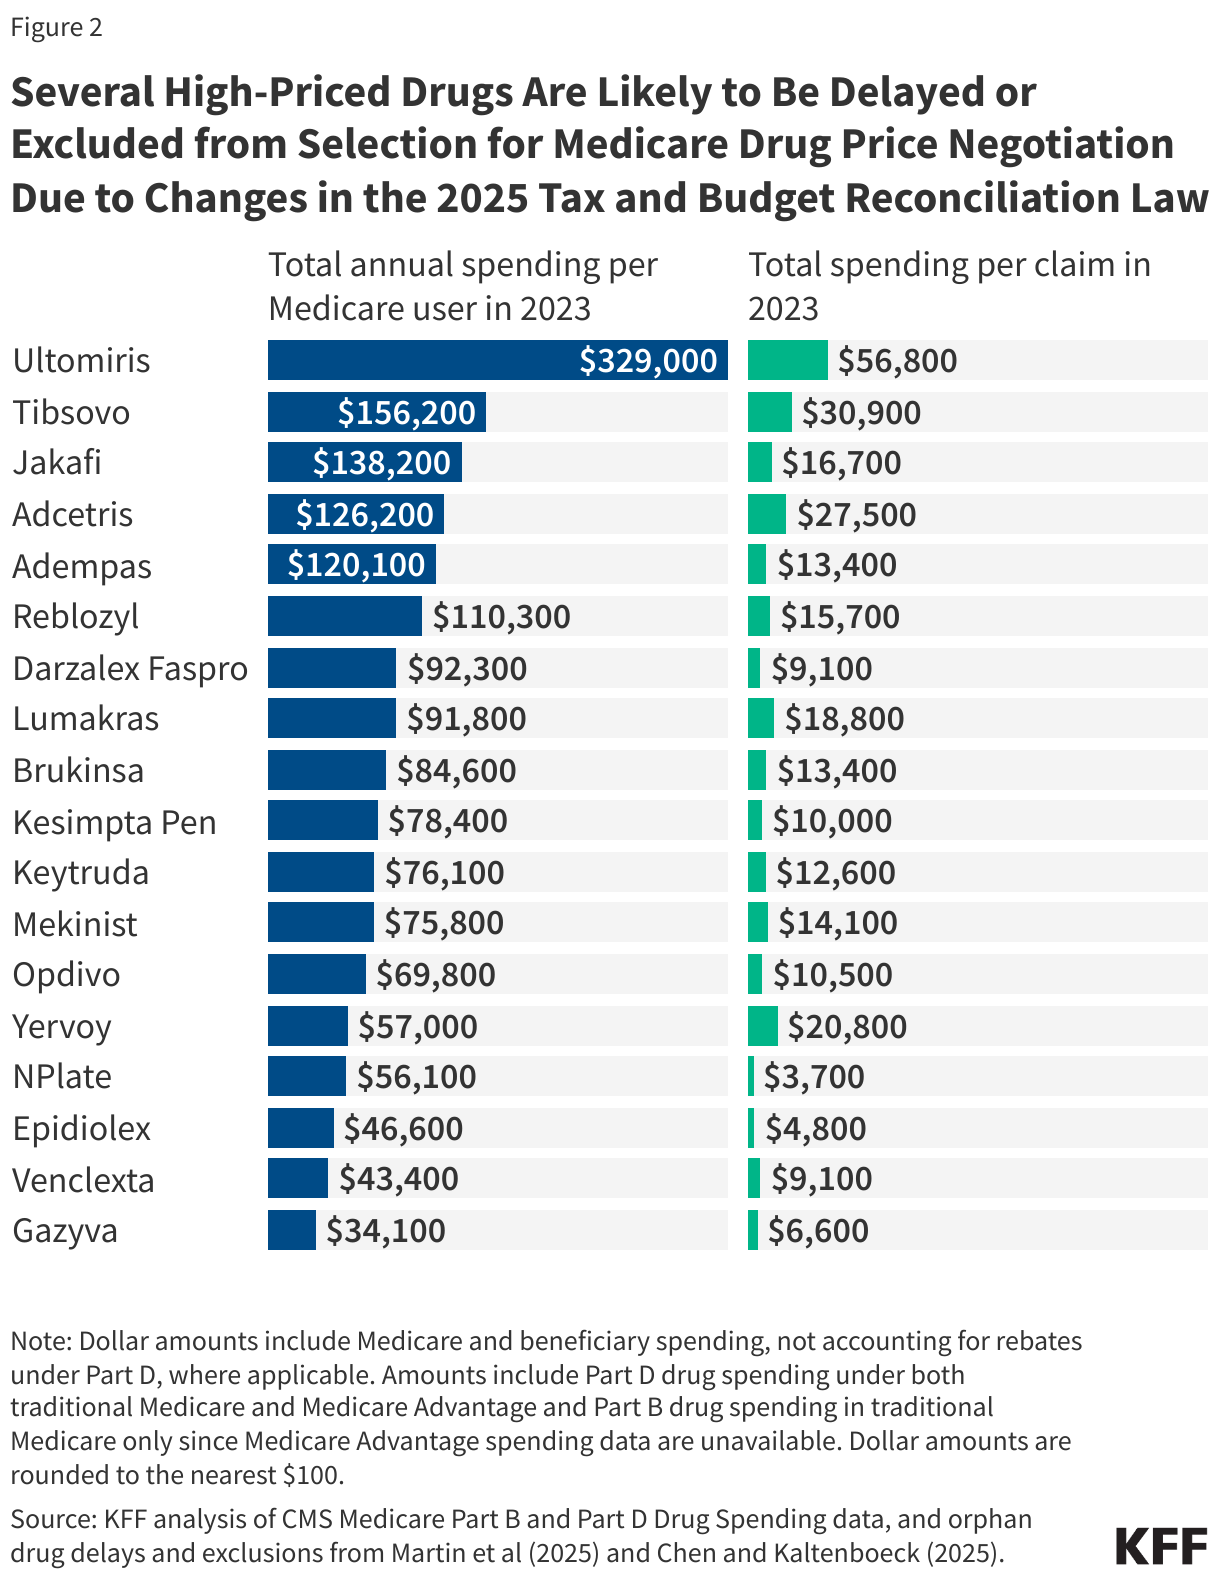
Several High-Priced Drugs Are Likely to Be Delayed or Excluded from Selection for Medicare Drug Price Negotiation Due to Changes in the 2025 Tax and Budget Reconciliation Law (Split Bars)

Coinsurance requirements for high-cost Part B and Part D drugs translate to high out-of-pocket costs for Medicare beneficiaries

For high-priced drugs covered under Part B or Part D, beneficiary cost-sharing requirements in the form of coinsurance (a percentage of the drug’s total price) can translate to several hundred dollars, if not $1,000 or more, each time they fill a prescription or are administered the drug.

  • Under Medicare Part B, which primarily covers physician-administered medications like Keytruda, Darzalex, and Opdivo, beneficiaries in traditional Medicare face a 20% coinsurance requirement. Most but not all traditional Medicare beneficiaries have some type of additional coverage to help with their Medicare cost-sharing requirements, such as employer-sponsored coverage, Medigap, or Medicaid. By law, beneficiary cost-sharing liability for a Part B drug or other service provided in a hospital outpatient setting on a single day cannot exceed the amount of the Part A hospital inpatient deductible, which is $1,676 in 2025. But this cap does not apply to Part B drugs administered in a physician’s office, and there is no limit on total annual out-of-pocket liability for services covered under Part A or Part B in traditional Medicare.
  • Under Medicare Advantage, plans can charge no more than 20% for Part B drugs administered by an in-network provider and are required to have a maximum out-of-pocket limit, unlike traditional Medicare. In 2025, the limit averages $5,320 for in-network services and $9,547 for in-network and out-of-network services combined.
  • Under Medicare Part D, coinsurance for high-priced drugs placed on the specialty tier, like Jakafi and Venclexta, ranges from 25% to 33%. Under the Part D benefit, an annual out-of-pocket spending cap of $2,000 in 2025 (increasing to $2,100 in 2026) limits an enrollee’s cost exposure, and another feature allows enrollees to spread out their out-of-pocket costs over the course of the calendar year, helping to limit the financial burden of high monthly cost-sharing requirements.

Based on these cost-sharing requirements, Medicare beneficiaries will face relatively high coinsurance for these orphan drugs each time the drug is administered or when they fill a prescription. For Part B drugs, out-of-pocket liability per claim can amount to $1,000 or more for drugs administered in a physician’s office or maxes out at the amount of the Part A inpatient deductible for drugs administered in hospital outpatient departments. For Part D drugs, beneficiaries in 2026 would likely hit the $2,100 out-of-pocket cap with a single prescription fill.

For example, based on the $12,600 total cost per claim for Keytruda in 2023, 20% coinsurance under Part B amounts to around $2,500, or roughly $15,000 for the year (based on six claims for each Keytruda user in 2023, on average). For Opdivo, coinsurance of 20% based on a $10,500 cost per claim amounts to $2,100 beneficiary liability per claim, or roughly $14,000 annually (based on 6.6 claims for each Opdivo user in 2023) (Figure 3). For Jakafi, the $16,700 total cost per claim would mean a Part D enrollee would hit the $2,100 annual out-of-pocket cap in 2026 with one fill, based on a specialty tier coinsurance requirement of 25% to 33%.
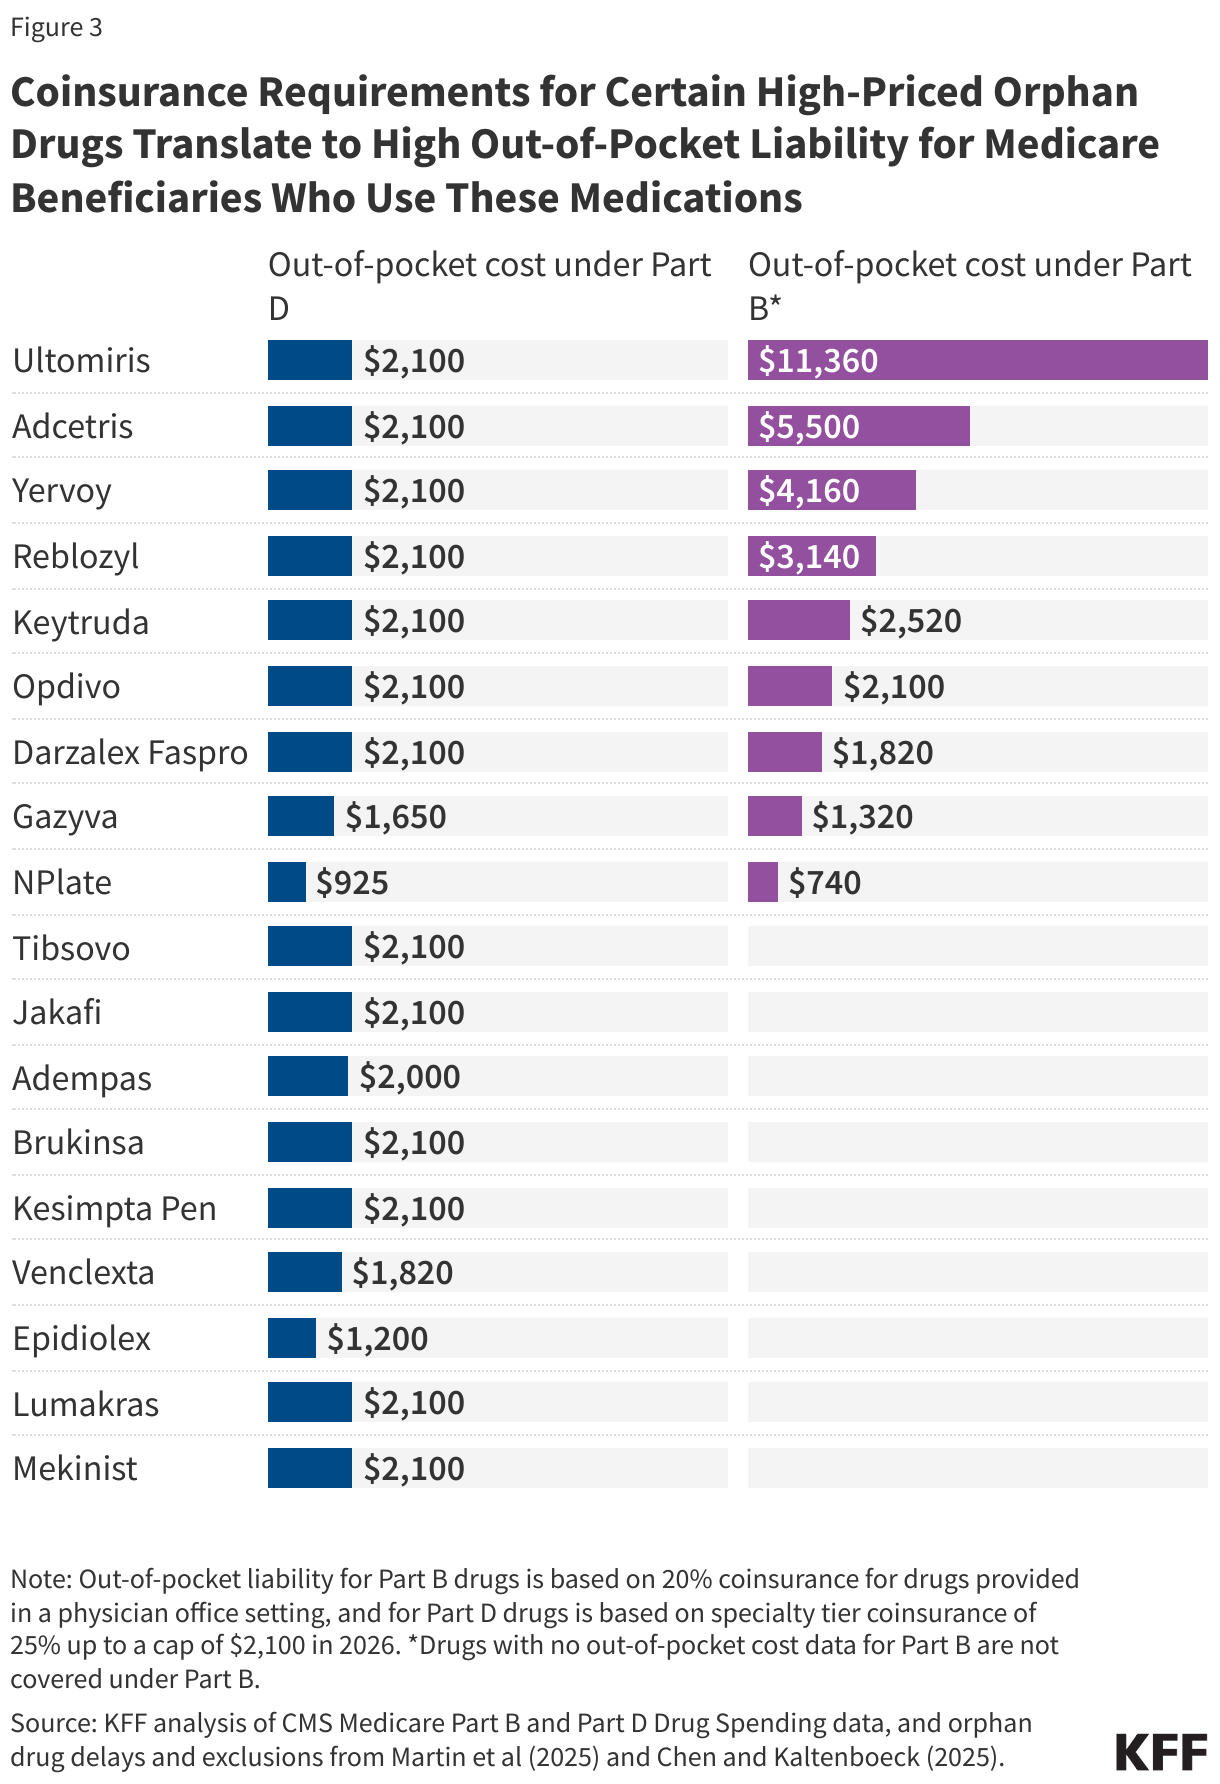
Coinsurance Requirements for Certain High-Priced Orphan Drugs Translate to High Out-of-Pocket Liability for Medicare Beneficiaries Who Use These Medications (Split Bars)

Additional delays and exclusions from Medicare drug price negotiation provided under the new tax and budget law will likely mean higher out-of-pocket costs for Medicare beneficiaries who use these medications

Medicare’s negotiated drug prices can help to lower the amount beneficiaries pay, particularly in situations where they face a coinsurance requirement that is calculated based on the underlying price of the drug, such as in the case of Part B drugs and higher-cost Part D drugs. By delaying price negotiation for certain orphan drugs or excluding them from eligibility for negotiation, the tax and budget law maintains higher prices relative to the price Medicare would have paid if the drugs had been eligible for drug price negotiation. The result will be higher out-of-pocket liability for Medicare beneficiaries, which could give rise to cost-related access problems and lower utilization.

Estimating the exact magnitude of higher cost-sharing liability would depend in part on how much lower Medicare’s negotiated prices would fall below status quo prices for drugs that would have been selected for negotiation but for the changes in law, and how much longer the higher prices apply. In the absence of these more exact estimates, the following examples of potential savings from Medicare drug price negotiation help to illustrate the potential foregone savings for beneficiaries of delaying or fully exempting orphan drugs from price negotiation.

  • If the government were to negotiate a 22% discount off the price of Keytruda, on par with the average 22% net price discount from the first round of Medicare drug price negotiation, that would generate savings of around $550 per claim for Medicare beneficiaries, reducing out-of-pocket liability to just under $2,000. Annual savings would amount to around $3,300, based on an average of six claims per user in 2023.
  • Similarly, for Opdivo, a 22% negotiated price discount would generate savings of around $460 per claim, reducing out-of-pocket liability to around $1,600. Annual savings would amount to around $3,000, based on an average of 6.6 claims per Opdivo user in 2023.

These illustrative examples suggest that the continuation of higher prices for certain drugs brought about by the new tax and budget law could place additional financial strain on beneficiaries in the form of higher out-of-pocket liability, with potential out-of-pocket savings from price negotiation for these high-cost drugs of several hundred dollars. At the same time, even reduced cost-sharing liability for these expensive medications might continue to represent a substantial financial burden for some Medicare beneficiaries, especially for those in traditional Medicare without additional coverage and those in Medicare Advantage prior to reaching their maximum out-of-pocket limit.

Delaying or excluding additional orphan drugs from selection for Medicare drug price negotiation will cost the federal government several billion dollars over the coming decade

According to a new estimate from the Congressional Budget Office (CBO), changes to the orphan drug exclusion in the 2025 reconciliation law will increase Medicare spending by $8.8 billion between 2025 and 2034. This is an 80% increase from CBO’s original estimate of $4.9 billion, which did not fully account for certain drugs that are likely to be affected by the changes, including Keytruda, Opdivo, and Darzalex. This higher spending erodes close to 10% of the overall 10-year $98.5 billion savings to Medicare that CBO projected from the Inflation Reduction Act’s Medicare drug price negotiation program when that law was enacted in 2022. The cost to Medicare of changes to the orphan drug exclusion included in the 2025 reconciliation law could also grow over time based on how the pharmaceutical industry responds, if it leads to more orphan drugs coming to market and additional orphan indications (as well as non-orphan indications) for orphan drugs already on the market to avoid or delay being subject to price negotiation.

With several blockbuster drugs expected to be delayed or excluded from selection for negotiation due to the changes in the new tax and budget law, CMS will be required to skip over these higher-spending drugs when it selects the list of drugs for negotiation in the future. While the changes to the IRA’s orphan drug exclusion were made in response to claims about the potential for less innovation related to drugs for rare diseases under the original provision, the changes are expected to reduce the potential savings from Medicare’s drug price negotiation program and prolong higher out-of-pocket liability for Medicare patients who use these drugs.

This work was supported in part by Arnold Ventures. KFF maintains full editorial control over all of its policy analysis, polling, and journalism activities.
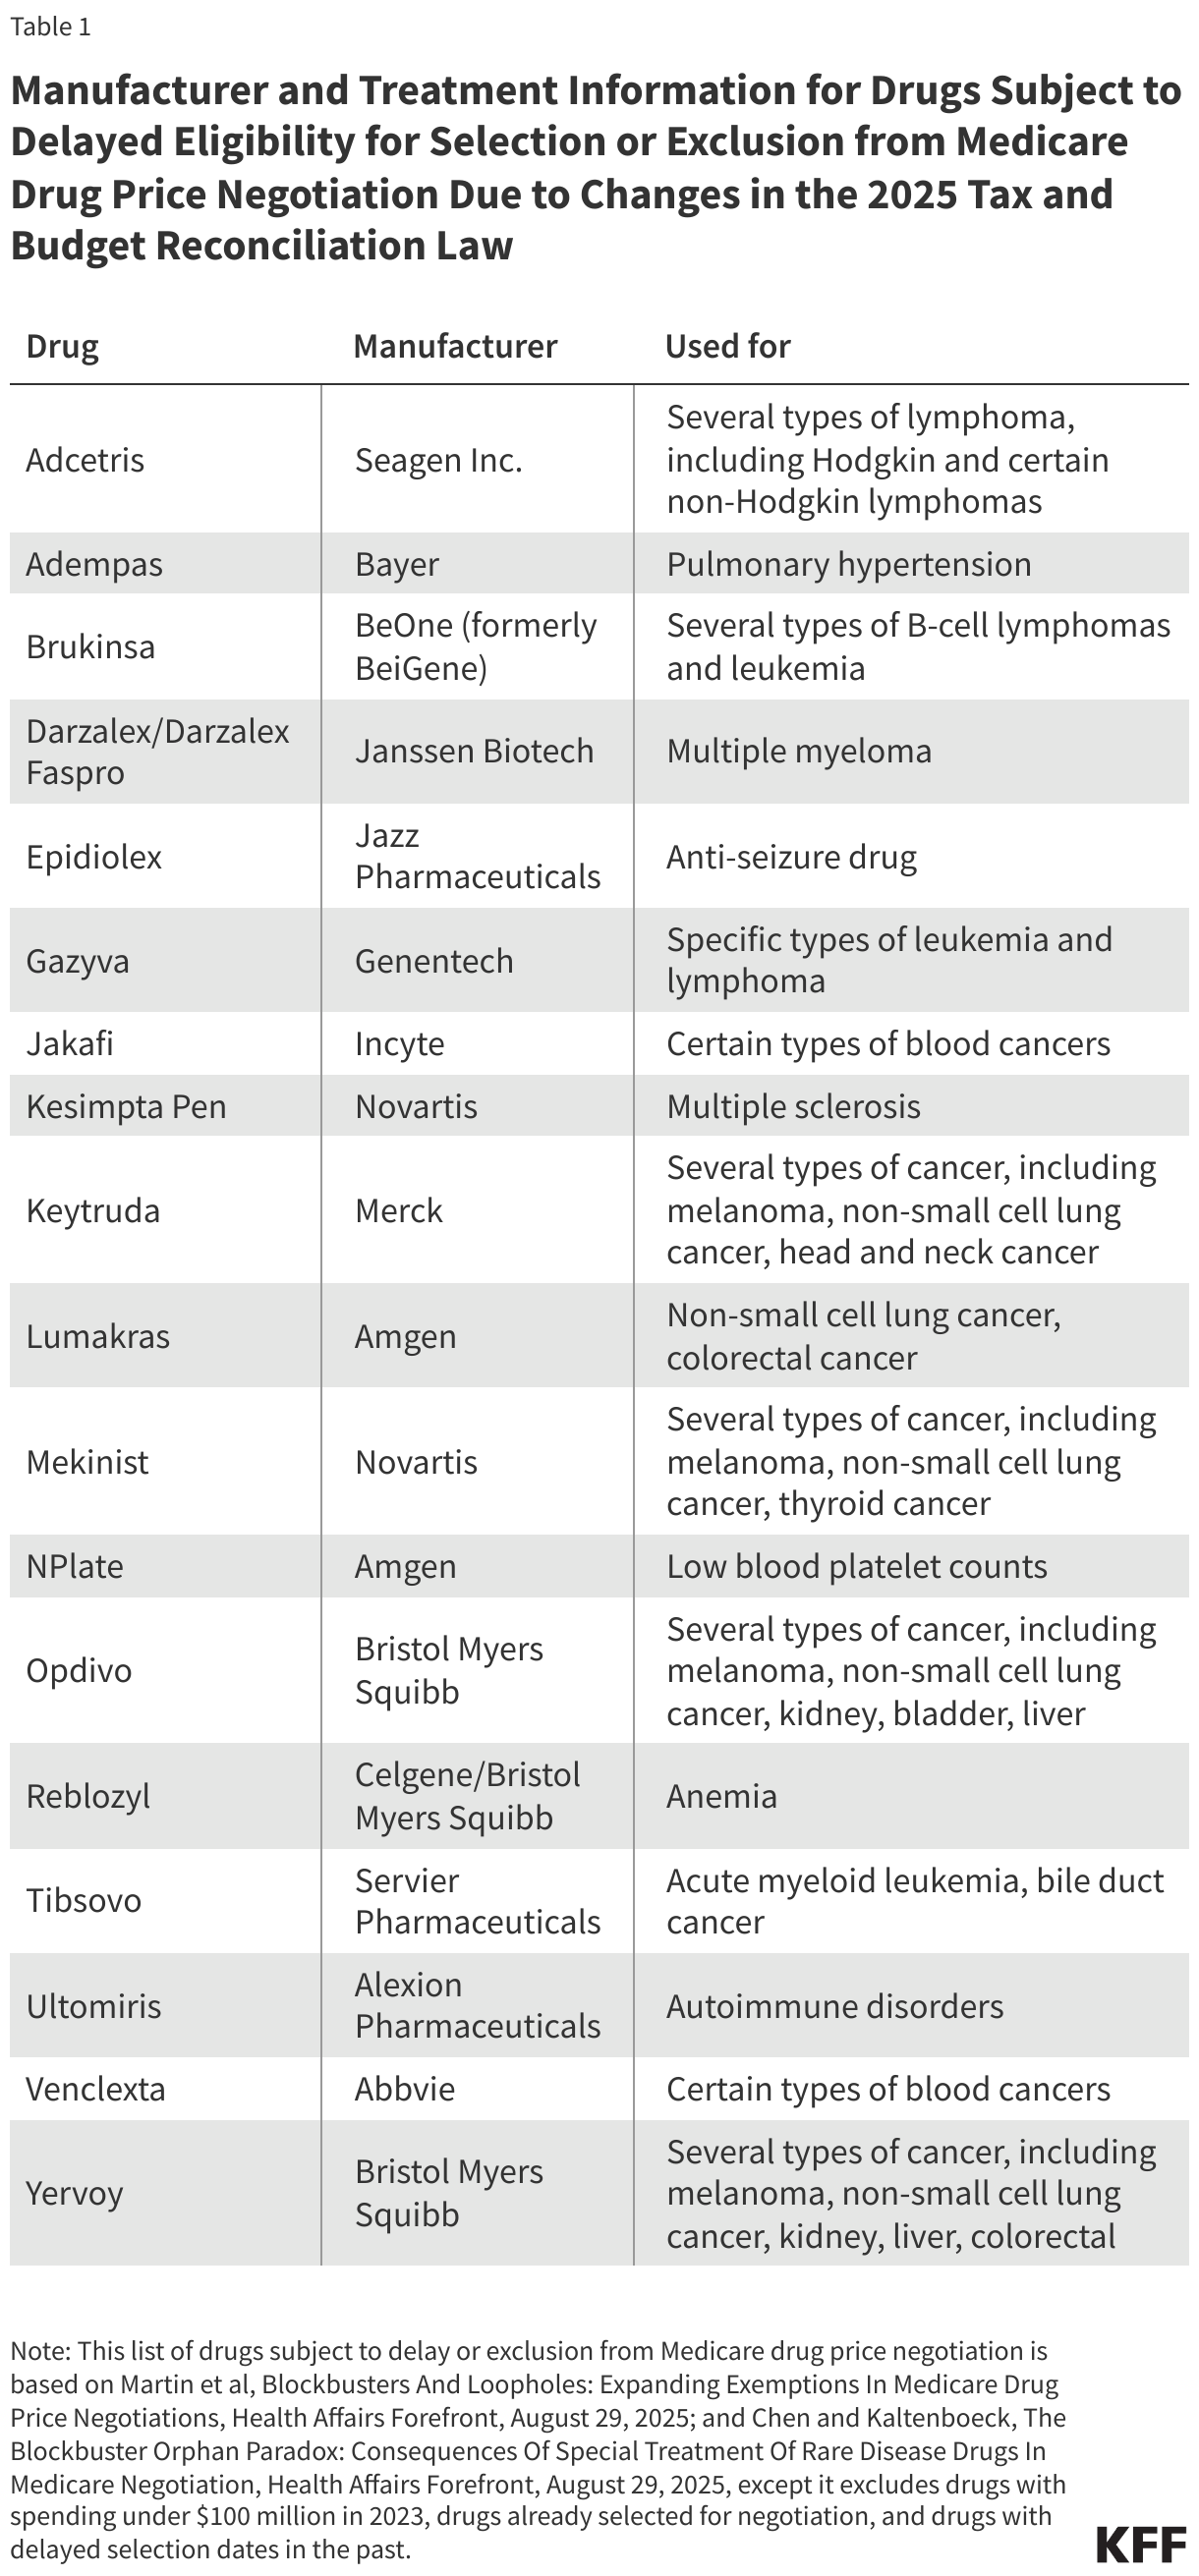
Manufacturer and Treatment Information for Drugs Subject to Delayed Eligibility for Selection or Exclusion from Medicare Drug Price Negotiation Due to Changes in the 2025 Tax and Budget Reconciliation Law (Table)
Medicare Spending and Number of Users for Drugs Subject to Delayed Eligibility for Selection or Exclusion from Medicare Drug Price Negotiation Due to Changes in the 2025 Tax and Budget Reconciliation Law (Table)

States Are Forming “Health Alliances.” Can They Make a Difference for Public Health Policy?

Published: Oct 16, 2025

The recent emergence of several state health alliances marks a new phase for public health in the U.S. These alliances include two that formed last month: the “West Coast Health Alliance” announced September 3 and the “Northeast Public Health Collaborative” announced September 18, and another just this week announced by fifteen governors called the “Governors Public Health Alliance”, which has some overlapping membership with the regional alliances. To date, these alliances have included Democratic-led states only, and a common thread across all three is a broad rejection of the Trump administration’s approach to public health and the policies of the Department of Health and Human Services (HHS) under its current Secretary, Robert F. Kennedy, Jr.

Thus far this year the administration has cut staff at HHS by over 20,000 (with the Centers for Disease Control and Prevention, CDC, losing about 3,000 workers – a quarter of its staff), sought to pull back funding for state and local health departments, implemented new, more restrictive recommendations for some vaccines, and questioned long-standing scientific data and public health guidance. Many state health leaders, especially Democratic-led ones, have criticized these changes, with the new alliances being one manifestation of that push back. While the federal government is charged with issuing guidance and making recommendations that can influence public health across the country, it is states that have the ultimate authority to decide whether and where to follow that guidance.

Given this, the effects of forming these alliances generally fall into two main areas. One is practical: even if each state will continue to determine its own public health policies, alliances can foster communication and cooperation and allow for sharing of resources when needed, without necessarily relying directly on the federal government. For example, the West Coast Health Alliance aims to help align immunization recommendations across member states while the Governors Public Health Alliance seeks to be a “coordinating hub” for state leaders to share data and develop complementary public health guidance, among other activities. That could prove valuable for states that no longer have faith in the public health recommendations coming from CDC or other federal agencies. It could aid in communication with the public by providing a more unified message across states rather than each state seemingly going its own way. The other effect these alliances may have is more symbolic and political in nature: states banding together as a highly visible rebuke to the Trump administration’s public health approach and policies.
Even before these alliances were announced, many states had already started to make moves to de-link their policies from the federal government (particularly relating to vaccines). So far this year, for example, 26 states have implemented policies to ensure that pharmacists can administer COVID-19 vaccines broadly and without a prescription, despite changes – actual and anticipated – in federal recommendations coming from the Trump administration. A smaller number have moved to require state-regulated health insurers to cover, at no-cost, vaccines recommended by the state, even if they are no longer recommended by the federal government.

While it may be unusual for groups of states to join together to develop their own public health recommendations, independent of federal guidance, it’s not completely unprecedented. In the early months of the COVID-19 pandemic (during the first Trump administration) groups of Western states and northeastern states set up coalitions to coordinate responses and share supplies and know-how across state lines in the face of what they perceived as federal government inaction. Later, Republican-led states joined together in opposing some of the COVID-19 policies imposed by President Biden. 

Whether more alliances will form or these new ones will grow, remains to be seen. Ultimately, however, perhaps the most significant consequence of their formation is further cementing what is a growing partisan divide in public health, reflected in both public opinion and state policy, and which is likely to lead to increasingly divergent public health policies and access across the country and uncertainty about the future of the relationship between the federal government and the states on key public health issues.

What to Know About the Medicare Open Enrollment Period and Medicare Coverage Options

Published: Oct 16, 2025

Medicare is the federal health insurance program for 69 million people ages 65 and over and younger adults with long-term disabilities. The program helps to pay for many medical care services, including hospitalizations, physician visits, and prescription drugs, along with post-acute care, skilled nursing facility care, home health care, hospice care, and preventive services.

People with Medicare may choose to receive their Medicare benefits through traditional Medicare or through a Medicare Advantage plan, such as a health maintenance organization (HMO) or preferred provider organization (PPO), administered by a private health insurer. People who choose traditional Medicare can sign up for a separate Medicare Part D prescription drug plan for coverage of outpatient prescription drugs and may also consider purchasing a supplemental insurance policy (Medigap) to help with out-of-pockets costs if they do not have additional coverage from a former employer, union, or Medicaid. People who opt for Medicare Advantage can choose among dozens of Medicare Advantage plans, which include all services covered under Medicare Parts A and B, and typically include Part D prescription drug coverage as well.

Each year, Medicare beneficiaries have an opportunity to make changes to how they receive their Medicare coverage during the nearly 8-week annual open enrollment period. This brief answers key questions about the Medicare open enrollment period and Medicare coverage options.

1. When is the Annual Medicare Open Enrollment Period?

The annual Medicare open enrollment period runs from October 15 to December 7 each year (Figure 1). During this time, people with Medicare can review features of Medicare plans offered in their area and make changes to their Medicare coverage, which go into effect on January 1 of the following year. These changes include switching from traditional Medicare to a Medicare Advantage plan (or vice versa), switching between Medicare Advantage plans, and electing or switching between Medicare Part D prescription drug plans.

Figure 1: Medicare’s Open Enrollment Period Runs From October 15 to December 7 Each Year

2. What Changes Can Medicare Beneficiaries Make During the Annual Open Enrollment Period?

People in traditional Medicare can use the Medicare open enrollment period to enroll in a Medicare Part D prescription drug plan or switch between Part D plans. Traditional Medicare beneficiaries who did not sign up for a Part D plan during their initial enrollment period for Medicare can enroll in a Part D plan during the annual open enrollment period, though they may be subject to a late enrollment penalty if they did not have comparable prescription drug coverage from another plan before signing up for Part D. Traditional Medicare beneficiaries with Medicare Parts A and B can also use this time to switch from traditional Medicare into a Medicare Advantage plan, with or without Part D coverage.

People who are enrolled in a Medicare Advantage plan can use the Medicare open enrollment period to choose a different Medicare Advantage plan or switch to traditional Medicare. Medicare Advantage enrollees who switch to traditional Medicare can enroll in a Part D plan if they want outpatient prescription drug coverage, which is not covered under Medicare Parts A and B. (Beneficiaries may be subject to late enrollment penalties if they go without Part D drug coverage and don’t have other creditable coverage.) They may also consider purchasing a Medicare supplemental insurance policy (Medigap) if the option is available to them (see question 4 for details about Medigap and potential limits on enrollment).

Medicare beneficiaries are encouraged to review their current source of Medicare coverage during the annual open enrollment period and compare other options that are available where they live. Because an individual’s medical needs can change over the course of the year, and from one year to the next, this may influence their priorities when choosing how they want to get their Medicare benefits. Medicare Advantage and Medicare prescription drug plans typically change from one year to the next and may vary in many ways that could have implications for a person’s access to providers and costs. Despite this, nearly 7 in 10 (69%) Medicare beneficiaries did not compare their Medicare coverage options during a recent open enrollment period.

3. Are There Other Opportunities for Medicare Beneficiaries to Make Coverage Changes Outside of the Open Enrollment Period?

Medicare provides several different Special Enrollment Periods (SEPs) where Medicare beneficiaries can make certain changes to their coverage outside of the annual open enrollment period under certain circumstances. For example, beneficiaries who experience disruptions to existing coverage (such as a cross-county move or a loss of employer- or union-sponsored coverage) or loss of Medicaid eligibility may qualify for a SEP at any time of year.

As of 2025, people who are enrolled in both Medicare and Medicaid (i.e., dual-eligible individuals) or who qualify for the Medicare Part D Low-Income Subsidy program (also known as “Extra Help”), can make certain changes to their coverage once per month. Beneficiaries in these groups may use this monthly SEP to disenroll from a Medicare Advantage plan into traditional Medicare, enroll in a stand-alone Part D drug plan, or switch between Part D plans. However, they may not use the monthly SEP to enroll in Medicare Advantage or switch between Medicare Advantage plans, with the exception of individuals with full Medicaid benefits who are switching to a Fully Integrated Dually Eligible Special Needs Plan (FIDE SNP), a Highly Integrated Dually Eligible Special Needs Plan (HIDE SNP), or a coordination-only D-SNP that is an Applicable Integrated Plan (AIP) that is aligned with their Medicaid managed care enrollment.  People living in nursing homes and certain other facilities may change their Medicare Advantage or Medicare Part D coverage once per month.

Medicare Advantage enrollees who wish to change plans or switch to traditional Medicare may do so between January 1 through March 31 each year, during the Medicare Advantage Open Enrollment Period. (This is in addition to the open enrollment period that runs from October 15 to December 7.) Additionally, those who have a Medicare Advantage or Medicare Part D plan with a 5-star quality rating available in their area may switch into a 5-star plan between December 8 and November 30 of the following year.

For 2026, people who select a Medicare Advantage plan based on inaccurate provider directory information in Medicare Plan Finder may qualify for a new, temporary SEP that allows them to switch to a different Medicare Advantage plan or return to traditional Medicare if they later discover that their preferred provider is not included in their plan’s network. This temporary SEP is currently limited to coverage decisions made for the 2026 plan year and runs for three months after the effective date of plan election. This is distinct from an existing SEP that allows Medicare Advantage enrollees to make changes to their coverage if their plan makes certain changes to its provider network that are deemed “significant,” such as terminating a large number of in-network providers. (See Q6 for more information about Medicare Advantage provider networks.)

The annual open enrollment period and other opportunities to switch coverage are distinct from the initial enrollment period for people who are newly enrolling in Medicare, which begins three months before a person’s 65th birthday and ends three months after it. For more information on initial enrollment, see KFF’s Medicare Open Enrollment FAQ.

4. How Does Supplemental Coverage, like Medigap and Employer-Sponsored Retiree Health Benefits, Factor into Medicare Coverage Decisions?

Many Medicare beneficiaries have some form of additional coverage, such as a Medicare Supplemental Insurance policy (Medigap) or coverage offered by an employer or a union, that helps with Medicare’s cost-sharing requirements. Enrollment in these plans and programs is not tied to the open enrollment period, though beneficiaries may wish to take them into account when considering their options for Medicare coverage.

Medigap. People in traditional Medicare with both Part A and Part B can apply for a Medigap policy at any time of the year. Medigap policies are designed to help beneficiaries in traditional Medicare with Medicare’s deductibles and cost-sharing requirements and have standard benefits to allow for apples-to-apples comparisons across insurers. Traditional Medicare beneficiaries with a Medigap plan that covers most deductible and cost-sharing requirements may have lower out-of-pocket spending for Medicare-covered services than people with other coverage, including a Medicare Advantage plan. Medigap policies are designed to wrap around traditional Medicare, and do not work with Medicare Advantage. People enrolled in Medicare Advantage do not need (and can’t buy) a Medigap policy.

While Medigap insurers are required to issue policies to people age 65 or over, without regard to health status or diagnosed medical conditions when they first enroll in Medicare, those with pre-existing conditions may be denied a Medigap policy or face higher premiums in most states if they apply for Medigap coverage after their first six months of enrollment in Part B. People who disenroll from Medicare Advantage within 12 months of first enrolling in Medicare Advantage have a right to purchase a Medigap policy without regard to medical history, but after 12 months, they are not guaranteed Medigap coverage and may be denied a policy due to a pre-existing condition or face higher Medigap premiums if they are offered a policy.

Medigap guaranteed issue rights are different for people under age 65 who qualify for Medicare due to long-term disability. Federal law does not require Medigap insurers to sell a policy to people with Medicare under age 65, although several states do require insurers to offer at least one kind of Medigap policy to people under 65. Premiums for Medigap policies sold to people under age 65 are typically higher than policies sold to those age 65 or older. People under age 65 with disabilities who are already enrolled in Medicare will qualify for the 6-month Medigap open enrollment period when they turn 65 and become age eligible for Medicare. At this point, they can buy any Medigap policy they want without facing higher premiums or denials of coverage based on their existing medical conditions.

Employer-sponsored coverage. While employer-sponsored retiree health benefits are on the decline, more than 14.5 million people with Medicare have retiree health coverage (distinct from people with Medicare Part A only who continue to work and have health insurance through their current employer or a spouse’s current employer). Retiree health benefits may be designed to supplement either traditional Medicare or Medicare Advantage. Some employers that offer health benefits to retirees on Medicare offer these benefits exclusively through a Medicare Advantage plan. Beneficiaries with retiree health coverage offered exclusively through a Medicare Advantage plan may lose these benefits if they choose to switch to traditional Medicare during the annual open enrollment period. Similarly, employers may only offer a retiree health benefit that supplements traditional Medicare. If a person with such coverage switches from traditional Medicare to Medicare Advantage during an open enrollment period, they may lose their retiree health benefits. In fact, if a Medicare beneficiary drops their employer or union-sponsored retiree health benefits for any reason, they may not be able to get them back.

5. How Does Additional Support for Low-Income People Factor into Medicare Coverage Decisions?

Low-income Medicare beneficiaries who meet their states’ Medicaid eligibility criteria qualify for additional coverage of services through Medicaid that are not covered under Medicare, such as long-term services and supports. Additionally, Medicare beneficiaries with modest incomes may qualify for assistance with Medicare premiums and out-of-pocket costs from the Medicare Savings Programs (MSP) and Part D Low-Income Subsidy (LIS) if their income and assets are below certain amounts. Medicare beneficiaries who are eligible for Medicaid, the Medicare Savings Programs (MSPs), or Medicare Part D Low-Income Subsidies (LIS), but not yet enrolled in these programs, can enroll at any time of the year. This additional coverage and assistance may factor into how people choose to receive their Medicare benefits. 

Medicaid. For people with Medicare who qualify for full Medicaid benefits, their choice of Medicare coverage can impact how they receive Medicaid benefits and the degree to which those benefits are coordinated with Medicare. In general, Medicaid wraps around Medicare coverage, with Medicare as the primary payer and Medicaid paying for costs and services not covered by Medicare. People who are eligible for both Medicare and Medicaid (dual-eligible individuals) can enroll in a Medicare Advantage plan designed for this population, such as a dual-eligible Special Needs Plan (SNP), and depending on the state and the plan, may experience a higher level of coordination of their benefits. Beginning in 2025, people who qualify for full Medicaid benefits can make certain changes to their Medicare coverage outside of the open enrollment period, up to once per month (see Q3 for further details).

Medicare Savings Programs. Through the Medicare Savings Programs (MSP), state Medicaid programs pay Medicare premiums and, in many cases, cost sharing for Medicare beneficiaries who have income and assets below certain amounts (though some states have lifted their income and/or asset thresholds above the federal limits). Specifically, states cover the Medicare Part B premium for people who qualify and may also provide assistance with Medicare deductibles and other cost-sharing requirements. People who receive MSP assistance and are enrolled in a Medicare Advantage plan may still have cost sharing associated with non-Medicare covered services offered by the plan. People who qualify for MSP but not full Medicaid benefits (sometimes referred to as “partial Medicaid benefits”) can also make certain changes to their coverage outside of the open enrollment period, up to once per month. 

Part D Low-Income Subsidy. People who qualify for the Part D Low-Income Subsidy (LIS) receive varying levels of assistance toward their Part D prescription drug coverage premiums and cost sharing, depending on their income and asset levels. Dual-eligible individuals, people enrolled in the Medicare Savings Programs, and those who receive Supplemental Security Income payments from Social Security automatically qualify for LIS benefits, and Medicare automatically enrolls them into a stand-alone Part D drug plan in their area with a premium at or below a certain amount (the Low-Income Subsidy benchmark) if they do not choose a plan on their own. Other beneficiaries are subject to both an income and asset test and need to apply for the LIS through either the Social Security Administration or Medicaid. People who receive LIS assistance can select any Part D plan offered in their area, but if they enroll in a plan that is not a so-called “benchmark plan” (that is, plans available without a premium to enrollees receiving full LIS), or their current plan loses benchmark status, they may be required to pay some portion of their plan’s monthly premium, which would diminish the value of the premium subsidy. People who receive LIS can also make certain changes to their coverage outside of the open enrollment period, up to once per month.

6. How Do the Features of Traditional Medicare Compare to Those of Medicare Advantage?

Traditional Medicare and Medicare Advantage both provide coverage of all services included in Medicare Part A and Part B, but certain features, such as out-of-pocket costs, provider networks, and access to extra benefits vary between these two types of Medicare coverage. When deciding between traditional Medicare and Medicare Advantage, Medicare beneficiaries may want to consider a variety of factors, such as their own health and financial circumstances, preferences for how they get their medical care, which providers they see, and their prescription drug needs. These decisions may involve careful consideration of premiums, deductibles, cost sharing and out-of-pocket spending; extra benefits offered by Medicare Advantage plans; how the choice of coverage option may affect access to certain physicians, specialists, hospitals and pharmacies; rules related to prior authorization and referral requirements; and variations in coverage and costs for prescription drugs.

People may prefer traditional Medicare if they want the broadest possible access to doctors, hospitals and other health care providers. Traditional Medicare beneficiaries may see any provider that accepts Medicare and, if they are new to the provider, accepts new patients. People with traditional Medicare are not required to obtain a referral for specialists or mental health providers. Additionally, prior authorization is rarely required in traditional Medicare and only applies to a limited set of services. With traditional Medicare, people have the ability to choose among stand-alone prescription drug plans offered in their area, which tend to vary widely in terms of which drugs are covered and at what cost. (Beginning in 2026, a pilot initiative known as the Wasteful and Inappropriate Services Reduction (WISeR) model will test the use of prior authorization in traditional Medicare for a small set of outpatient services in six states. The WISeR model is limited to traditional Medicare, though most Medicare Advantage plans already require prior authorization for some services.)

People may prefer Medicare Advantage if they want extra benefits, such as coverage of some dental and vision services, and reduced cost sharing offered by these plans, often for no additional premium (other than the Part B premium). Additionally, Medicare Advantage plans are required to include a cap on out-of-pocket spending, providing some protection from catastrophic medical expenses. Medicare Advantage plans also offer the benefit of one-stop shopping (i.e., people who enroll have coverage under one plan and do not need to sign up for a separate Part D prescription drug plan or a Medigap policy to supplement traditional Medicare).

7. How do Medicare Advantage Plans Vary?

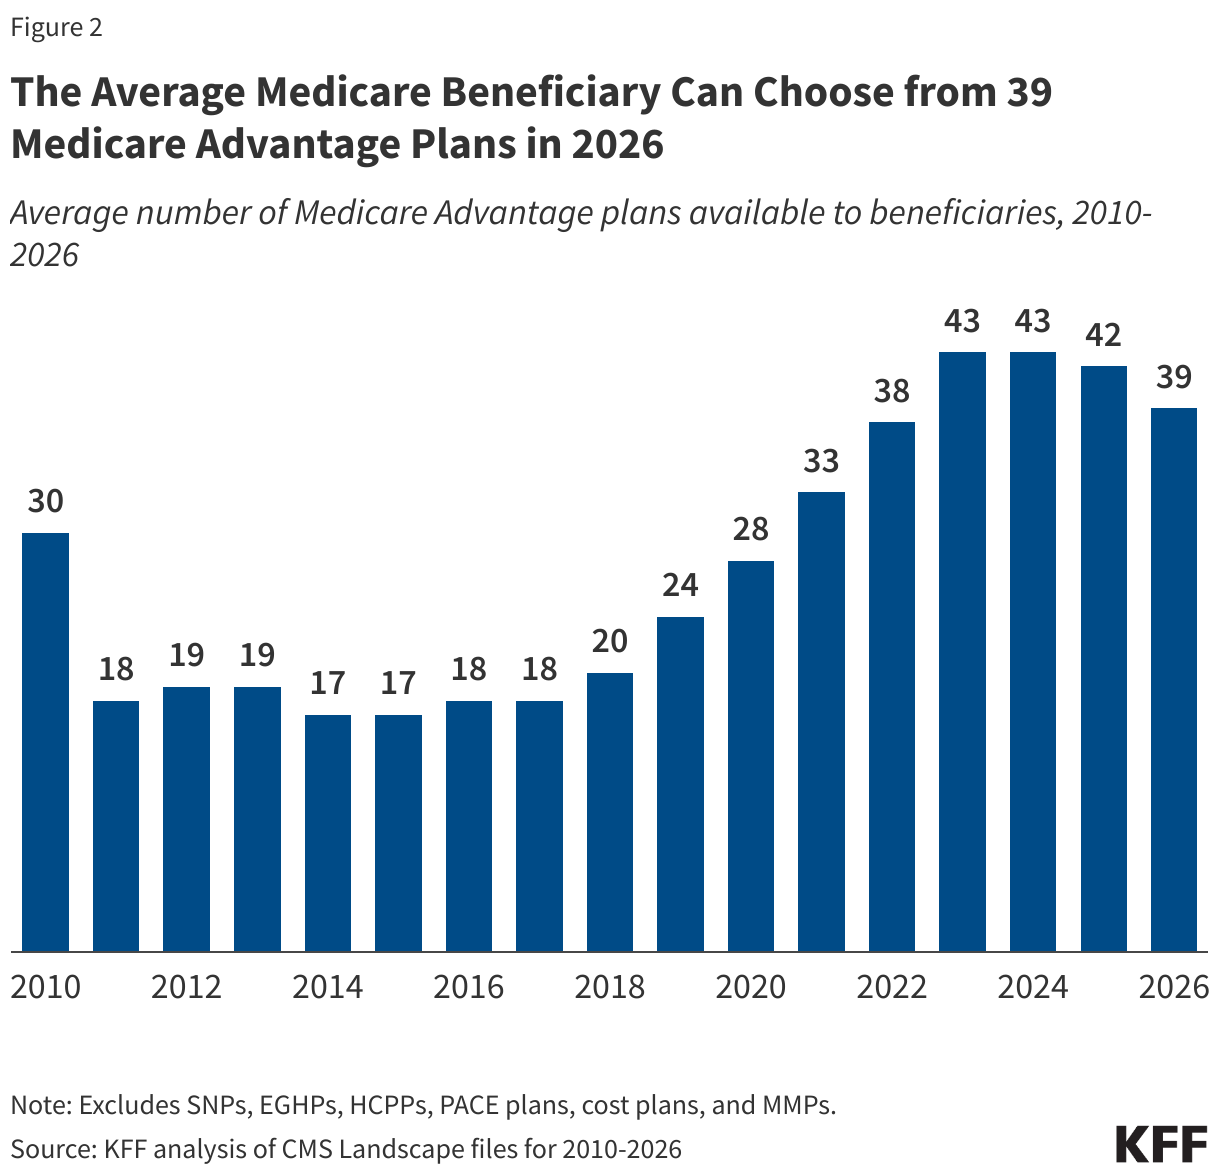
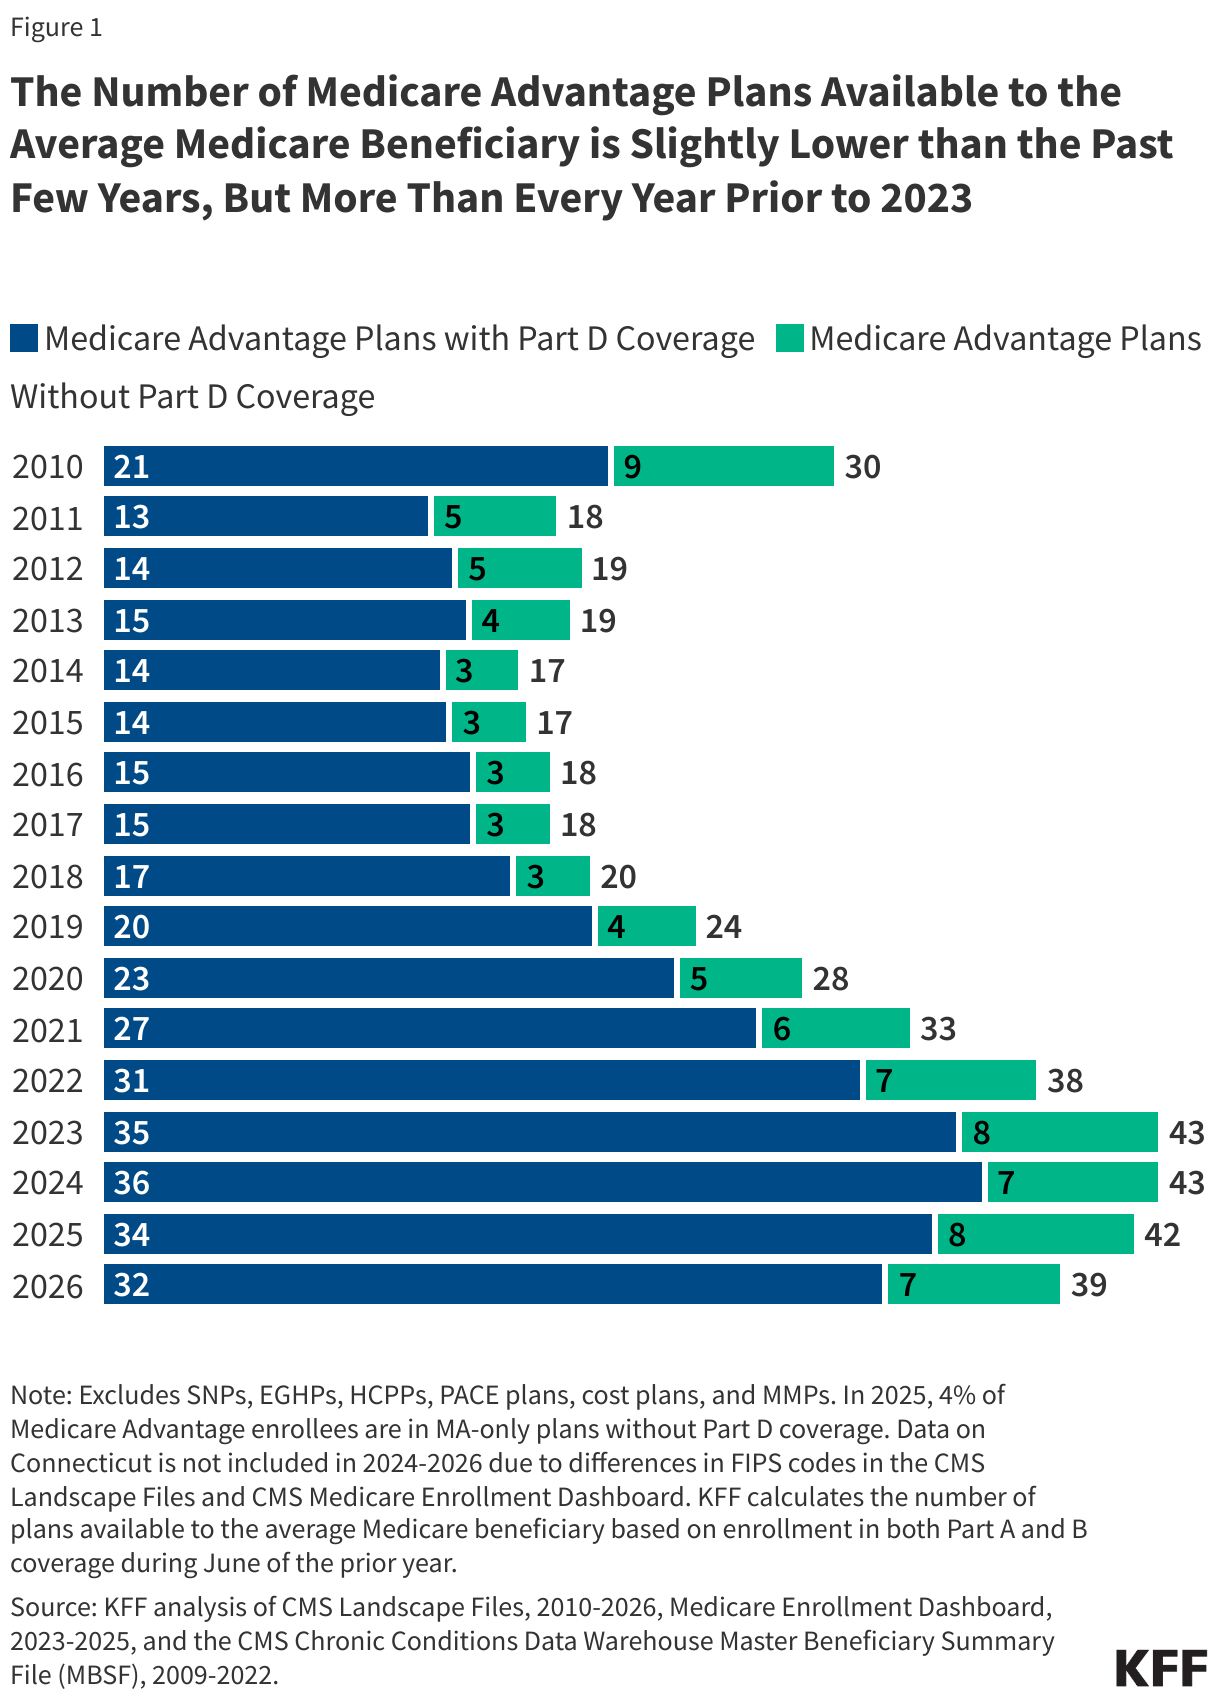
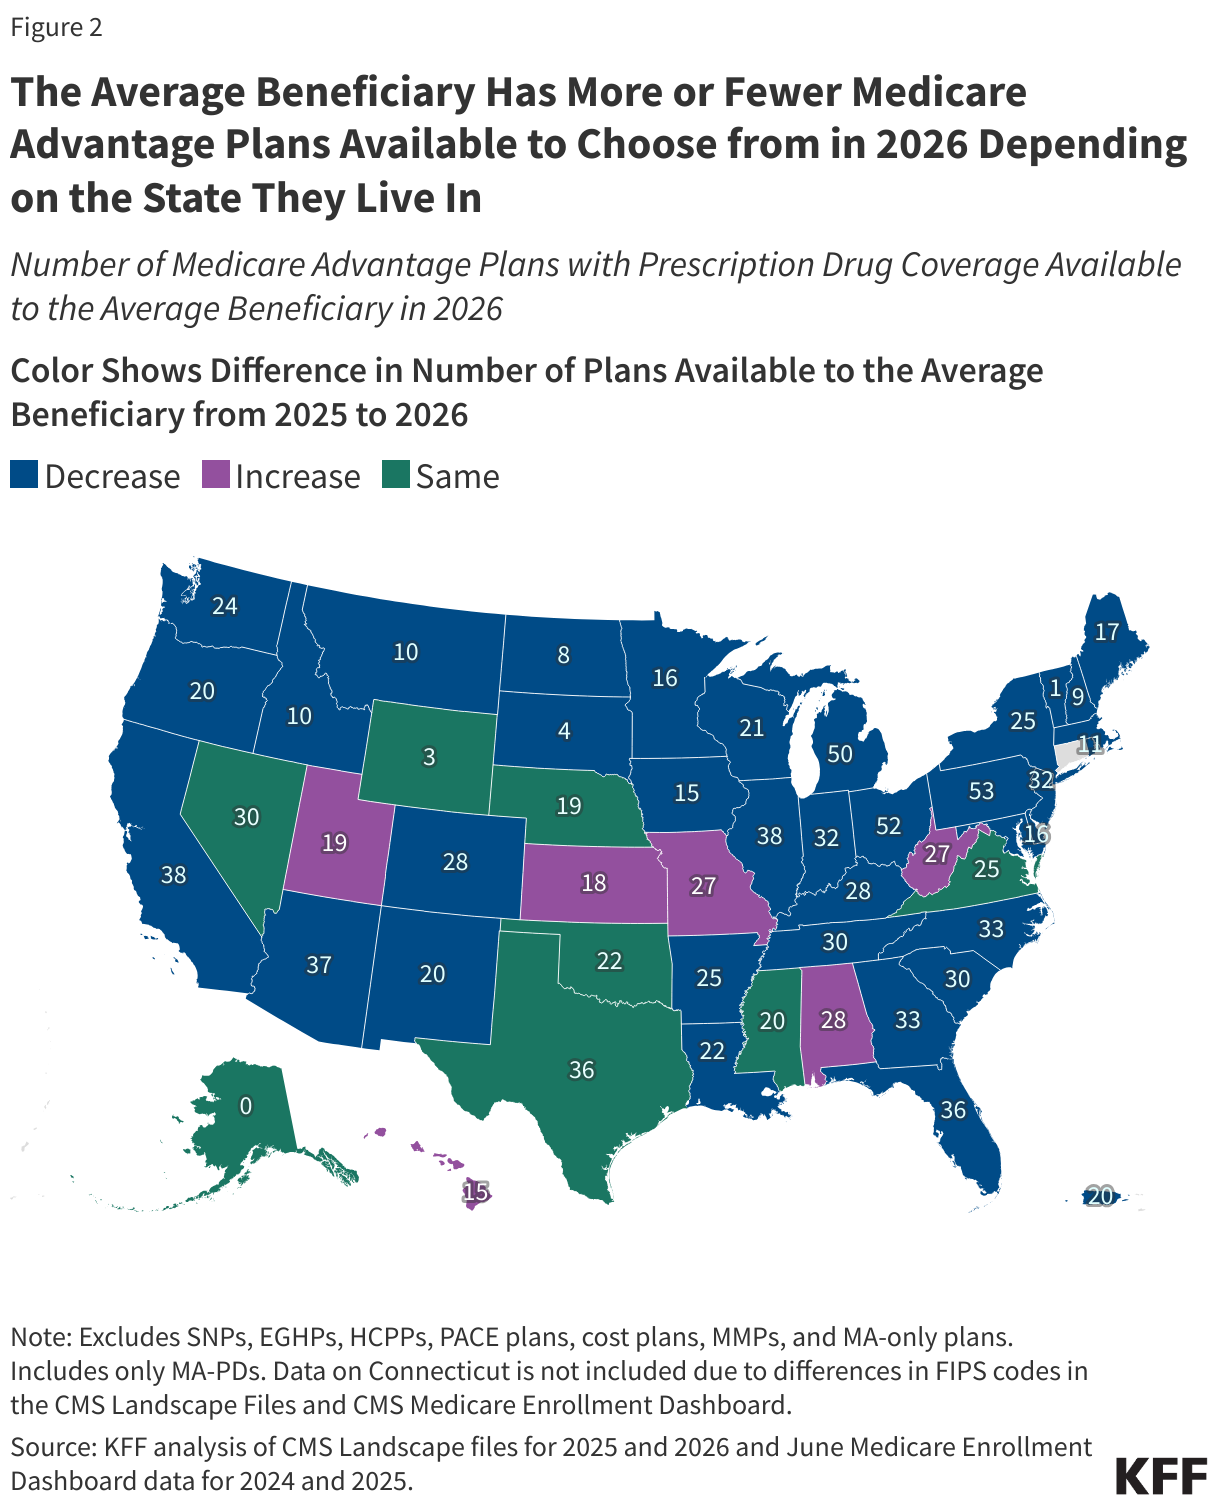
The average Medicare beneficiary can choose from 39 Medicare Advantage plans in 2026, including 32 Medicare Advantage plans with Part D coverage, though the average number of plan options varies widely across states (Figure 2). These plans vary across many dimensions, including premiums and out-of-pocket spending, provider networks, extra benefits, prior authorization and referral requirements, and prescription drug coverage. As a result, enrollees face different out-of-pocket costs, access to providers and pharmacies, and coverage of non-Medicare benefits (such as dental, vision and hearing) based on the Medicare Advantage plan they choose.

The Average Medicare Beneficiary Can Choose from 39 Medicare Advantage Plans in 2026 (Column Chart)

Premiums and out-of-pocket spending. Medicare Advantage enrollees may be charged a separate monthly premium (in addition to the Part B premium). In 2025, the average enrollment-weighted premium for Medicare Advantage plans was $13 per month, though three quarters (76%) of enrollees were in plans that charged no additional premium (apart from the Part B premium).

Medicare Advantage plans are generally prohibited from charging more than traditional Medicare, but vary in the deductibles, co-pays and co-insurance they require. For example, plans typically charge a daily co-pay for hospital stays, which vary both in the amount and the number of days for which they apply.

Medicare Advantage plans are required to include a cap on out-of-pocket expenses. In 2025, this cap may not exceed $9,350 for in-network services or $14,000 for all covered services. Most plans have an out-of-pocket limit below this cap, averaging $5,320 for in-network services and $9,547 for in-network and out-of-network services combined. Out-of-pocket limits only apply to services covered under Medicare Parts A and B.

Provider networks. Medicare Advantage plans are permitted to limit their provider networks, the size of which can vary considerably for both physicians and hospitals, depending on the plan and the county where it is offered. Medicare Advantage plans that include prescription drug coverage may also establish pharmacy networks or designate preferred pharmacies, where enrollees will have lower out-of-pocket costs. If a Medicare Advantage plan provides coverage of out-of-network providers, it may require higher cost sharing from enrollees for these services. For the 2026 plan year, the Medicare Plan Finder tool will incorporate searchable provider directories for Medicare Advantage plans. While these directories will initially include plan network information sourced from a third-party vendor, insurers will be required to provide regular updates to this information from January 2026 onward, including notifications within 30 days of any changes to a plan’s network and annual attestations that the listed directories are up to date.

Extra benefits. Medicare Advantage plans may choose to offer extra benefits not covered by traditional Medicare, such as some coverage of dental, vision, and hearing services. Virtually all Medicare Advantage enrollees are in a plan that offers extra benefits, including some coverage of eye exams and/or eyeglasses (more than 99%), dental care (98%), hearing exams and/or aids (95%), and a fitness benefit (94%). Additionally, a majority of Medicare Advantage enrollees are in plans that provide an allowance for over-the-counter items (79%) and meals following a hospital stay (70%). While extra benefits are common, the scope of coverage varies widely from plan to plan. For example, in 2021, more than half (59%) of Medicare Advantage enrollees were in a plan with a maximum dental benefit of $1,000 or less, while nearly one-third (30%) were in a plan with a limit between $2,000 and $5,000.

Prior authorization and referral requirements. Medicare Advantage plans may require enrollees to receive prior authorization before a service will be covered. In 2023, nearly 50 million prior authorization requests were submitted to insurers on behalf of Medicare Advantage enrollees, and in 2025, virtually all Medicare Advantage enrollees are in plans that require prior authorization for some services, such as inpatient hospital stays, diagnostic tests and procedures, or stays in a skilled nursing facility. Prior authorization may also be required for some services included in a plan’s extra benefits, such as hearing and eye exams or comprehensive dental services. In addition, Medicare Advantage plans may require enrollees to obtain a referral from a primary care provider in order to see a specialist or mental health provider.

Beginning in 2026, Medicare Advantage plans will be required to follow additional requirements when making prior authorization decisions. These include issuing decisions within a set timeframe (7 calendar days for standard requests or 72 hours for expedited requests), informing beneficiaries and providers of the specific reason a request is denied, and reporting certain information about their prior authorization processes on their public websites by March 31 each year, such as the share of requests that were approved, denied, or approved after appeal in the prior calendar year.

Prescription drug coverage. Medicare Advantage enrollees who want prescription drug coverage must choose a plan that offers this coverage, as they are not permitted to enroll in a stand-alone prescription drug plan while enrolled in Medicare Advantage. Medicare Advantage plans that include prescription drug coverage may also charge a drug deductible. Drug coverage in Medicare Advantage plans varies along the same dimensions as drug coverage in stand-alone Part D plans (described below).

8. How Do Part D Plans Vary?

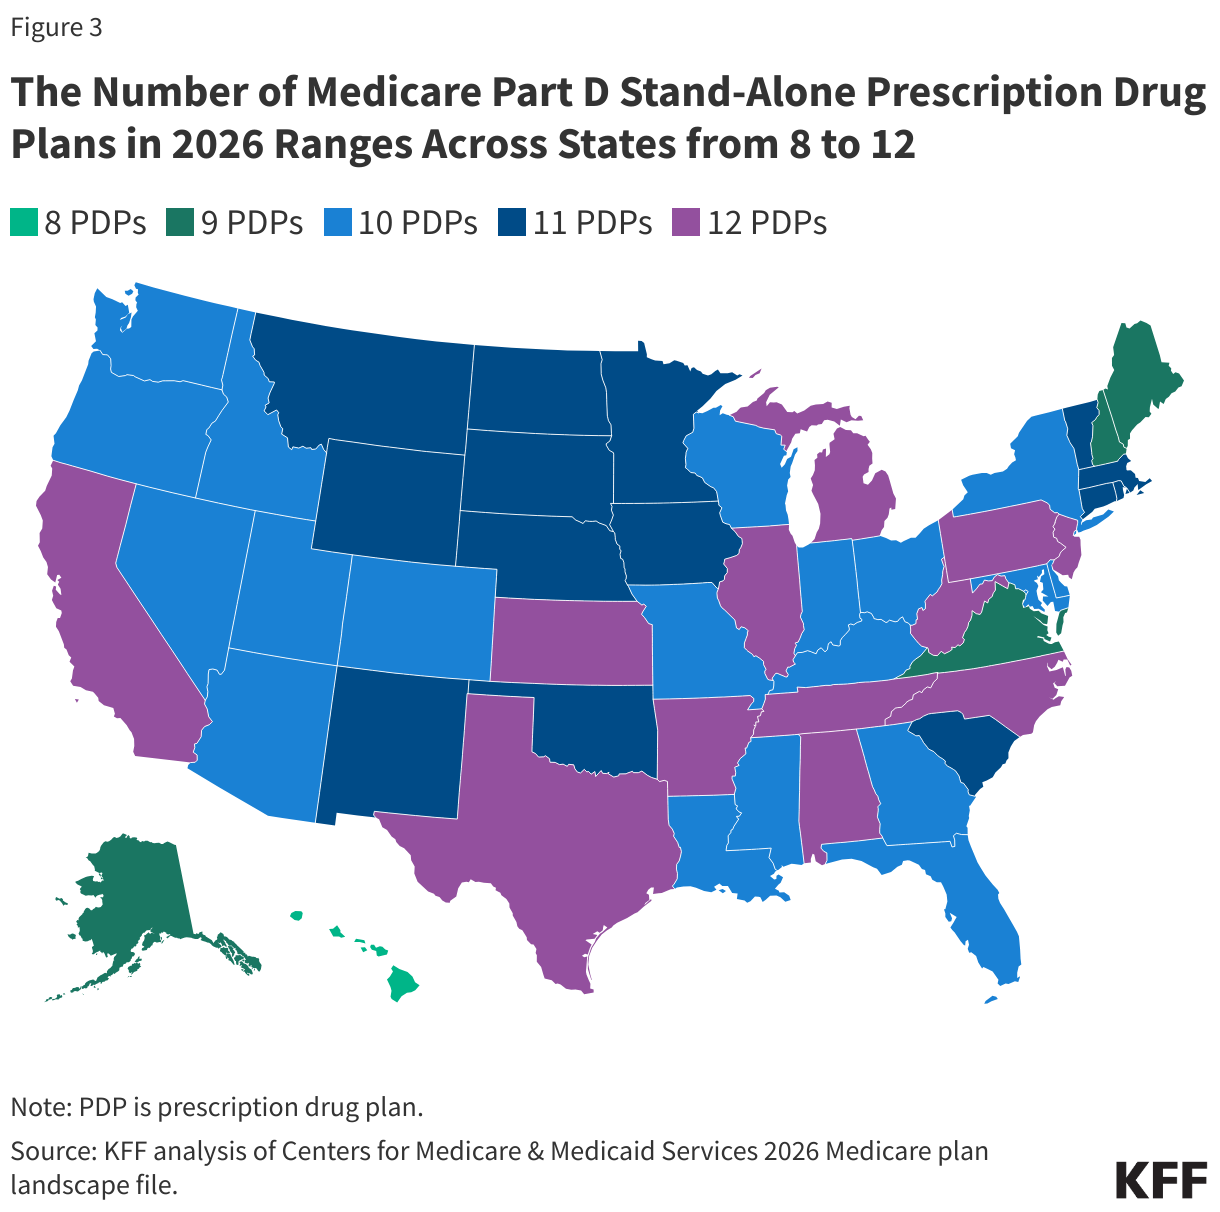
Medicare beneficiaries have between 8 and 12 stand-alone Part D plans to choose from for 2026 (Figure 3) (in addition to a large number of Medicare Advantage drug plans, if they want to consider Medicare Advantage for all of their Medicare-covered benefits). For traditional Medicare beneficiaries who want to add Part D coverage, stand-alone Part D plans vary in terms of premiums, deductibles and cost sharing, the drugs that are covered and any utilization management restrictions that apply, and pharmacy networks. These differences can affect enrollees’ access to prescription drugs and out-of-pocket costs.

The Number of Medicare Part D Stand-Alone Prescription Drug Plans in 2026 Ranges Across States from 8 to 12 (Choropleth map)

Premiums. People in traditional Medicare who are enrolled in a separate stand-alone Part D plan generally pay a monthly Part D premium unless they qualify for benefits through the Part D Low-Income Subsidy (LIS) program and are enrolled in a premium-free (benchmark) plan. In 2025, the average enrollment-weighted premium for stand-alone Part D plans was $39 per month. Changes to the Part D benefit in the Inflation Reduction Act, such as the cap on out-of-pocket drug spending for Part D enrollees ($2,100 in 2026), mean lower out-of-pocket costs for many Medicare beneficiaries but higher costs for Part D plan sponsors (see Q9 for further discussion of the Inflation Reduction Act).

Deductibles and cost sharing. Deductibles and cost-sharing requirements for prescription drug coverage vary across plans. In 2026, the standard deductible for Part D coverage is $615, but some plans charge a lower or no deductible. Plans generally impose a tier structure to define the cost-sharing amounts charged for different types of drugs. Plans typically charge lower cost-sharing amounts for generic drugs and preferred brands and higher amounts for non-preferred and specialty drugs, and charge a mix of flat dollar copayments and coinsurance (based on a percentage of a drug’s list price) for covered drugs. Separate cost-sharing rules now apply to insulin, where copays are capped at $35 per month, and adult vaccines covered under Part D, where no cost sharing can be charged, based on provisions in the Inflation Reduction Act of 2022.

Drugs covered and utilization management restrictions. Part D plans include a list of drugs they cover (also referred to as a plan’s formulary). In addition, plans impose utilization management restrictions on some covered prescription drugs, including prior authorization, quantity limits, and step therapy, which can affect beneficiaries’ access to medications. In 2025, Part D plans applied utilization management requirements to around half of all drugs covered on a plan’s formulary.

Pharmacy networks. Part D prescription drug plans may establish pharmacy networks or designate preferred pharmacies, where enrollees will have lower out-of-pocket costs.

9. What Changes Have Been Made to Medicare Eligibility Based on Immigration Status?

Prior to the tax and budget reconciliation law enacted in 2025, residents of the U.S. ages 65 or older, including citizens, permanent residents, and lawfully-present immigrants, were eligible for premium-free Medicare Part A if they had worked at least 40 quarters (10 years) in jobs where they or their spouses paid Medicare payroll taxes. Lawfully-present immigrants ages 65 or older without this work history could purchase Medicare Part A after residing legally in the U.S. for five continuous years. Lawfully-present immigrants under age 65 with long-term disabilities could also qualify for Medicare, provided they met the same eligibility requirements for Social Security Disability Insurance (SSDI) that apply to citizens. These requirements are based on work history, payment of Social Security taxes on income, and having enough years of Social Security taxes accumulated to equal between 20 and 40 work credits (5-10 years).

Starting in July 2025, Medicare eligibility is limited to U.S. citizens, permanent residents (i.e., green card holders), Cuban-Haitian entrants, and people residing under the Compacts of Free Association. Lawfully-present immigrants who don’t meet these criteria, such as refugees, asylees, and people with Temporary Protected Status, will no longer eligible for Medicare regardless of age or work history. Individuals with current Medicare coverage who do not fall in any of these categories will have their coverage terminated no later than January 2027.

10. What Resources are Available to Assist Medicare Beneficiaries in Understanding Their Coverage Options?

People with Medicare can learn more about Medicare coverage options and the features of different plan options by reviewing the Medicare & You handbook. In addition, people can review and compare the Medicare options available in their area by using the Medicare Plan Compare website, a searchable tool on the Medicare.gov website, by calling 1-800-MEDICARE (1-800-633-4227), or by contacting their local State Health Insurance Assistance Program (SHIP). SHIPs offer local, personalized counseling and assistance to people with Medicare and their families. Contact information for state SHIPs can be found by calling 877-839-2675 or by checking the listing provided on the Medicare.gov website.

Additionally, many people use insurance agents and brokers to navigate their coverage options. While independent agents and brokers can be helpful, they are typically financially compensated by private insurers for enrolling people in their plans, and often receive higher commissions if people choose a Medicare Advantage plan rather than remaining in traditional Medicare and purchasing a supplemental Medigap policy and stand-alone Part D plan.

Fertility Awareness-Based Methods to Prevent Pregnancy

Published: Oct 16, 2025

Introduction

When used as contraception, fertility awareness-based methods (FABMs) rely on the ability to track ovulation to prevent pregnancy. FABM is an umbrella term for a variety of methods used to predict fertile and unfertile days during the menstrual cycle. Some contraceptive users may choose to use these methods because of a religious objection towards contraception involving drugs, devices, or surgical procedures, while others may prefer hormone-free methods of contraception. Oftentimes, users combine FABMs or use them in conjunction with other forms of contraception such as condoms. These methods are less effective at preventing pregnancy than other forms of reversible contraception such as the oral contraceptive pill, IUD, and implant.

In recent years, FABMs have gained attention following the increased spread of misinformation about hormonal contraception on social media, as well as Project 2025’s call for an increased focus on FABMs in the Title X program. Additionally, the Trump administration has announced that $1.5 million of Title X funding will be spent on fertility training centers aimed at addressing infertility through approaches such as FABMs. This fact sheet provides an overview of FABMs and their efficacy rates and discusses associated costs and insurance coverage of these methods.

Fertility Awareness-Based Methods

On average, each menstrual cycle has a fertile window of about six days—five days before ovulation, the day of ovulation, and up to 24 hours after ovulation—though this can vary from person to person. There are a range of tools available to help users identify their fertile days by either counting days on a calendar, observing and recording signs and symptoms associated with ovulation, or using a combination of these approaches (Table 1). FABM users who want to prevent pregnancy can remain abstinent or use a barrier method on their fertile days.

The term “FABM” is often used interchangeably with the term “natural family planning” (NFP). While this is technically correct, NFP is a subset of FABM that specifically excludes the use of drugs, surgical procedures, and barrier methods like condoms. Instead, users choose to remain abstinent on fertile days. Some religious institutions such as the Catholic Church encourage NFP for followers looking to delay or prevent pregnancy.

Calendar-based methods for tracking ovulation and fertility are some of the oldest forms of FABMs and include the Rhythm Method and the Standard Days (or Bead) Method. Users record the length of their menstrual cycles to predict their most fertile days in future cycles.

The majority of FABMs monitor and record signs and symptoms of ovulation to predict fertile days. These methods may require users to receive training from health care professionals to track daily changes to their basal body temperature (BBT), cervical mucus, or urine hormone levels. BBT measurements require a basal thermometer as it is more sensitive than a regular thermometer, and urine hormone measurements require a fertility monitor. Users often choose to track multiple indicators to prevent pregnancy more effectively.

The lactational amenorrhea method (LAM), or postpartum breastfeeding, may be used to temporarily prevent pregnancy. This method requires the postpartum parent to exclusively breastfeed their baby at least every 4 hours during the day and every 6 hours at night for up to six months (or until their menstrual cycle resumes) to delay ovulation. LAM requires strict adherence to be effective as contraception and is not suitable for postpartum parents who cannot exclusively breastfeed. It is unclear whether using breast pumps at the same frequency produces the same level of pregnancy prevention.

Fertility Awareness-Based Methods of Contraception (Table)

In addition to their use as contraception, FABMs play a crucial role in a growing movement among conservative policymakers called “Restorative Reproductive Medicine,” a practice meant to determine the root causes of infertility as well as promote fertility without the use of in vitro fertilization or artificial insemination. Similarly, “Natural Procreative Technology,” or NaPro, is another example of the role FABMs play outside of contraception. NaPro is a “fertility-care based” health care approach combining FABMs with “gynecologic health monitoring and maintenance. Though the terminology is relatively new, these practices are already included in standard gynecological and fertility care.

Use and Efficacy

In the United States, people who use FABMs to prevent pregnancy often pair them with another contraceptive method. Data from the 2024 KFF Women’s Health Survey show that 13% of women ages 18 to 49 used FABMs as contraception at some point in the last year. Individuals seeking to prevent pregnancy may choose these methods because they are hormone-free, low cost, or for religious or health reasons.

The effectiveness of FABMs in preventing pregnancy depends on the accuracy of the specific method used, the ability of the user to correctly interpret their biological signs of fertility, and the user and their partner’s ability to avoid unprotected sex during the fertile window or use a condom during that phase (Table 2). Failure rates vary across methods and range from 2 to 34 pregnancies for every 100 women per year with typical use. With perfect use, some clinical trials suggest FABMs have low failure rates. LAM, for example, is highly effective if the breastfeeding parent: 1) has amenorrhea, 2) exclusively breastfeeds at least every four hours during the day or every six hours at night, and 3) is less than six months postpartum. In comparison, less than one in 100 women using an IUD or implant, and approximately seven in 100 women using oral contraceptive pills, may become pregnant in one year of typical use.

Perfect Use and Typical Use Rates of Fertility Awareness-Based Methods (Table)

Limitations

FABMs may prevent pregnancy for some, but there is significant room for human error that may result in unintended pregnancy, making them less effective than most other hormonal and non-hormonal contraceptive options. FABMs require significant commitment from both the user and their partner. Users are often advised to track at least six menstrual cycles to learn about their cycle length and fertility indicators before relying on an FABM to prevent pregnancy, which may leave them vulnerable to unintended pregnancy if no other contraceptive method is used during this initial period. Users must also monitor signs of fertility either daily or multiple times a day, as well as correctly interpret their observations. Finally, both the user and their partner must be able to remain abstinent or use a barrier method during the fertile window.

FABMs may not be suitable for everyone, especially for those who have irregular menstrual cycles. Calendar-based methods, for example, rely on the length of menstrual cycles regularly being between 26 and 32 days each month. Health conditions, stress, alcohol, medications, or life events affect the predictability of menstrual cycles, making FABMs less reliable. Some preliminary research suggests that clinician knowledge and perceptions of FABMs may play a role in patients’ success in using FABMs as contraception. In a survey of clinicians working in Title X clinics, providers identified several barriers to offering FABMs, including a lack of training on these methods, lack of time for counseling, low demand from patients, lower success rates, and preference for more reliable methods of contraception. Though some respondents reported providing education materials to patients upon request, they may not have had information on all FABMs. In addition, respondents perceived FABMs to be inappropriate for their patients’ needs.

Technology and Access

The correct use of FABMs requires consistency and users to have varying levels of training and technology. For calendar-based methods, users may use a physical calendar, CycleBeads, or mobile apps to track the days of their menstrual cycle. Some fertility tracking apps, such as Daysy, have tools specifically designed to sync user information to their associated app. Daysy syncs with its own BBT thermometer to digitally record the user’s temperature throughout their cycle. Other apps use algorithms to interpret user data to predict an individual’s daily risk of pregnancy. FABMs that track multiple signs of fertility sometimes require training with a licensed instructor to ensure proper use, particularly if the method has a unique system for recording these indicators such as symbols or colors.

In 2018, the Natural Cycles app became the first FDA cleared mobile medical app that can be used as contraception. The app operates by tracking the user’s daily BBT and uses an algorithm to identify fertile days and “not fertile” days. Unlike other fertility-tracking apps, Natural Cycles states that the app uses an algorithm that is personalized to the user based on their unique temperature and cycle data. In general, mobile health apps that meet the FDA’s definition of a mobile medical app or device must be approved and regulated by the FDA. While apps that do not meet this definition are exempt from FDA review, they must register with the FDA and comply with general regulations.

Over the years, health apps have come under scrutiny due to privacy concerns. In a post-Roe reproductive health landscape, users of period-tracking and fertility apps have taken to social media to caution other users about data privacy and protection, particularly for personal and identifiable information. In response, apps such as Flo have updated their privacy policies to include options such as “Anonymous Mode,” though research suggests that health apps can do more to improve user privacy.

Coverage and Cost

Federal guidelines such as the CDC’s and the Office of Population Affairs’ Providing Quality Family Planning Services (QFP) and HRSA’s recommendations for preventive services for women state that offering women the full range of FDA-approved contraceptive methods, including FABMs, is a critical element of quality family planning care. From 2022-2023, 60% of all family planning clinics and 81% of Planned Parenthood clinics offered FABM instructions or supplies.

The cost of supplies varies by method. Tools such as basal body thermometers generally cost between $10 and $20, and many fertility awareness apps in the U.S. are free to use, though some apps require subscriptions. For example, the Kindara app offers a $5 monthly subscription and a $50 annual subscription, as well as the optional Kindara Wink oral thermometer for $129. Without insurance, Natural Cycles has a $150 annual subscription that includes the Natural Cycles Thermometer, as well as a $22 monthly subscription with the option to purchase the thermometer for an additional $40. The app also syncs with the Oura Ring and certain Apple Watch models, but these devices are sold separately and not covered by insurance. 

As an FDA cleared birth control method, Natural Cycles is included in the ACA’s contraceptive coverage policy, which requires most private plans and Medicaid expansion programs to cover contraceptives for women that are prescribed by a clinician. Natural Cycles is covered by most major health insurance plans, though coverage is limited to the annual subscription with a prescription from a healthcare provider. As an over-the-counter product, coverage is not necessarily required under Medicaid. In a 2021 KFF state survey of Medicaid family planning services, few states reported covering Natural Cycles in their programs.

Some methods, such as the Creighton Model Fertilitycare System (CrMS), require classes from trained instructors. CrMS costs for the first year of use vary by instructor or program, but typically include an introductory session, an instructional kit, and at least eight follow-up sessions with an instructor, all of which can easily exceed $200. Health insurance coverage of these instructional classes varies by insurance provider and state policies.

The Role of Social Media

Contraceptive information is pervasive on social media, with nearly four in ten (39%) women of reproductive age saying they have seen or heard something on social media about birth control in the past 12 months. Some prominent social media influencers have utilized their social networks to share their negative experiences with and rationale for discontinuation of hormonal birth control methods such as oral contraceptive pills or intrauterine devices (IUDs), sometimes making false claims about the harms and efficacy of hormonal contraception. A content analysis of Pinterest in 2021 and TikTok in 2023 found that FABM-related pins conveyed more benefits than barriers, while pins about oral contraceptive pills conveyed more barriers than benefits.

Medicaid and Children’s Health: 5 Issues to Watch Amid Recent Federal Changes

Published: Oct 15, 2025

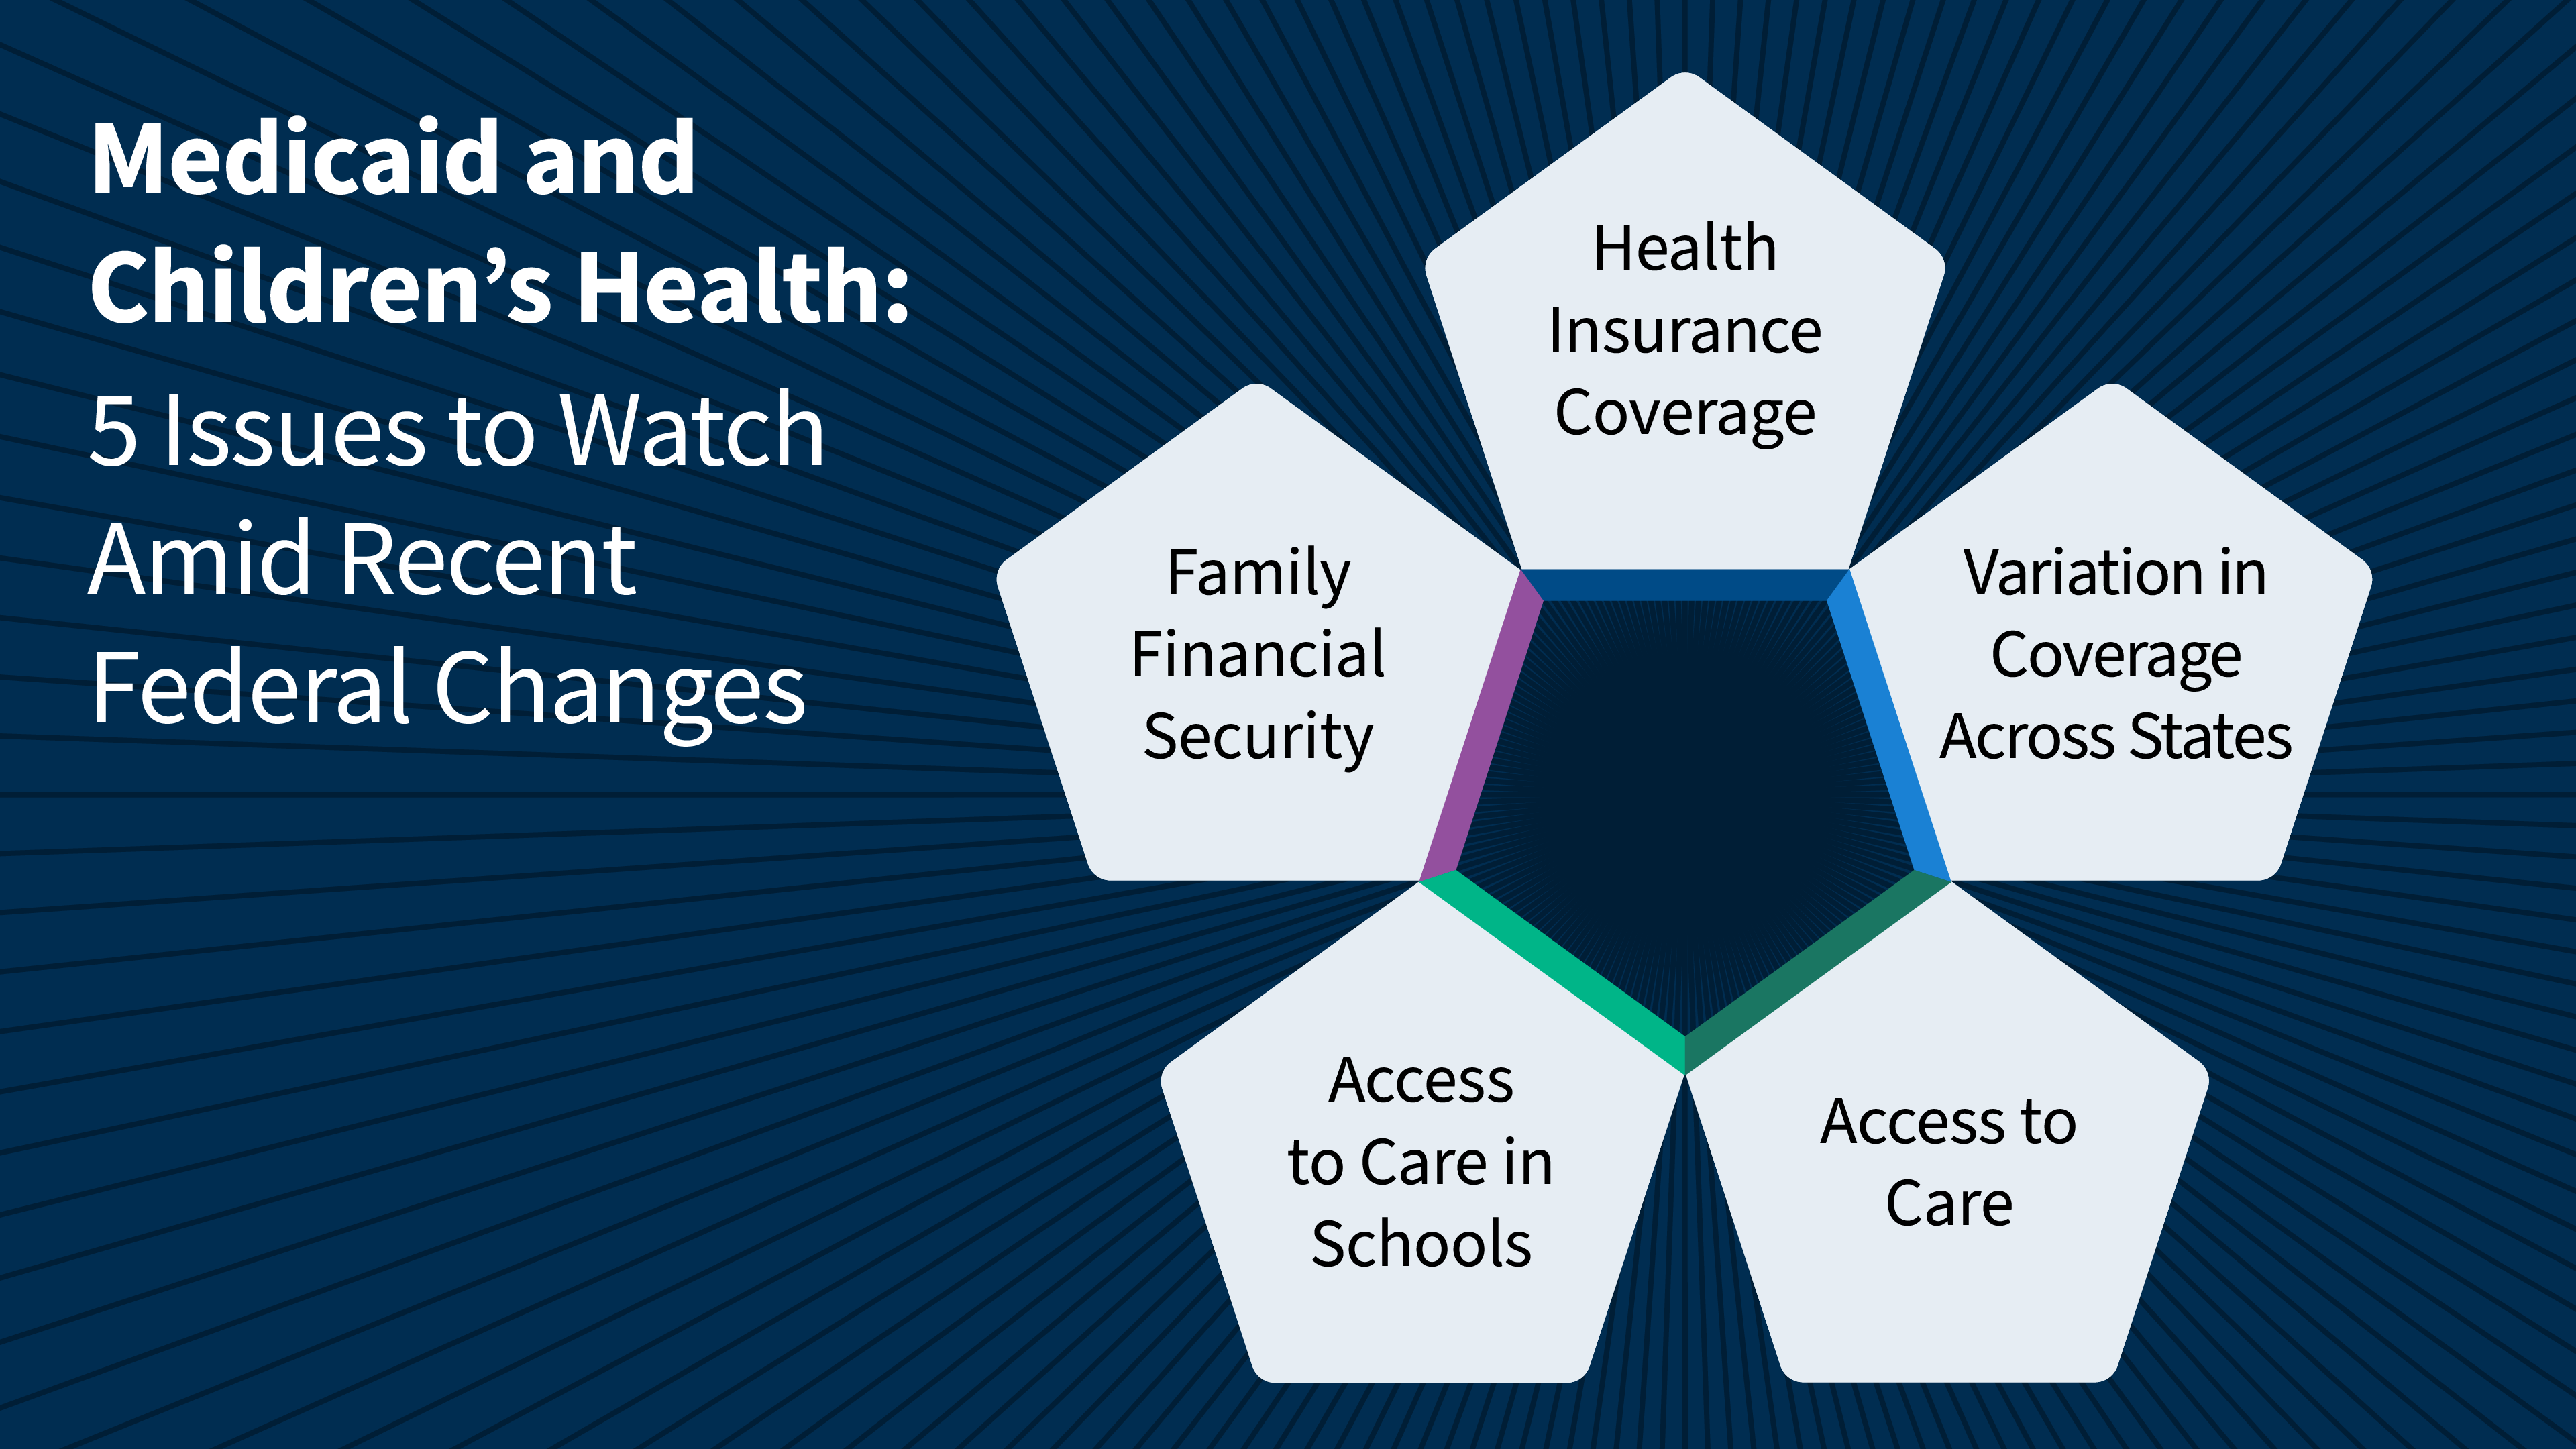
The uninsured rate, supplemental poverty rate, and food insecurity for children have all increased since the expiration of pandemic-era fiscal relief, and high household costs, including health care costs, are putting pressure on family budgets. After increasing during the pandemic, overall federal spending on children as a share of the economy (or GDP) has declined and is projected to continue to decline further over the next 10 years. At the same time, over the last decade, rates of chronic conditions among children, including obesity and mental health concerns, have increased. At the same time, children’s routine vaccination rates are declining, and many states are contending with measles outbreaks. Recent federal changes (Box 1), including the recently passed reconciliation law, administrative actions by the Centers for Medicare & Medicaid Services (CMS), and other broader Trump administration changes, could have further implications for children and their health and well-being. Nearly four in 10 children in the U.S. are covered by Medicaid, making the program (and changes to the program) particularly relevant to broader children’s health trends. This issue brief explores the latest data on Medicaid and children’s health and highlights five key issues to watch as federal changes are implemented (Figure 1).

Figure 1

Medicaid and Children's Health:
5 Issues to Watch Amid Recent Federal Changes

Box 1: Major Federal Changes that Could Impact Children’s Health

2025 Federal Budget Reconciliation Law (H.R. 1): The reconciliation law, passed on July 4, 2025, includes significant health care policy changes. While many of the provisions in the new law do not directly target children, changes could have implications for children’s coverage and access to health services:

  • Coverage losses: The Congressional Budget Office (CBO) projected that H.R. 1 will increase the number of uninsured people by 10 million over the next decade (or by more than 14 million if combined with the expiration of the Affordable Care Act’s (ACA) enhanced premium tax credits).  It is unclear how many of the newly uninsured are projected to be children. However, loss of Medicaid coverage among parents (from increased renewals or work requirements) could impact children’s coverage as research has shown that increasing coverage for parents increases children’s coverage.
  • Federal spending cuts: H.R. 1 is expected to reduce federal Medicaid spending by $911 billion over the next decade, though the impact of the reductions will vary across states. In response to some financing changes, states may reduce provider rates which could have implications for access to care for enrollees including children. The new law also reduces federal Supplemental Nutrition Assistance Program (SNAP) spending by $187 billion, which could result in an estimated 1 million children with reduced or eliminated food assistance. While the reconciliation law did make modest increases to some child care tax benefits, including the Child Tax Credit, the CBO expects the reconciliation provisions, taken together, will redistribute wealth from the lowest income families to the highest incomes, largely due to Medicaid and SNAP cuts.

CMS Administrative Actions:  Among other waiver changes, CMS has restricted Medicaid waivers for multi-year continuous eligibility for Medicaid and Children’s Health Insurance Program (CHIP) children, a policy currently adopted by 12 states to eliminate gaps in coverage for children during early childhood. In addition, through both the reconciliation law and executive action, the Trump administration has limited immigrant eligibility for federal public benefits, which could reduce access to health care for immigrant children and their families.

Broader Trump Administration Changes: The Make America Healthy Again (MAHA) commission, led by HHS Secretary Robert F. Kennedy (RFK) Jr., has sought to shed light on recent trends and identify recommendations to improve children’s health. The latest MAHA strategy report includes proposals to address children’s “poor diet”, “chemical exposure”, “lack of physical activity and chronic stress”, and “overmedicalization”, though implementation details remain unclear. Secretary Kennedy has also led recent efforts to re-examine the federal childhood vaccine schedule, replace the committee that creates childhood vaccine recommendations, and restrict access to COVID-19 vaccines and mRNA vaccine research. 

The Trump Administration has also laid off staff across governmental agencies, including at the Department of Human Services (HHS) and the Department of Education (DOE), and reduced support for state and local health departments. At DOE in particular, over half of the staff has been cut, including the office responsible for special education. Grant funding for schools has also been delayed, including funds to support and expand school-based mental health services.

Lastly, tariffs implemented by the Trump Administration are expected to drive up costs for families (including health care costs).

1. Health Insurance Coverage

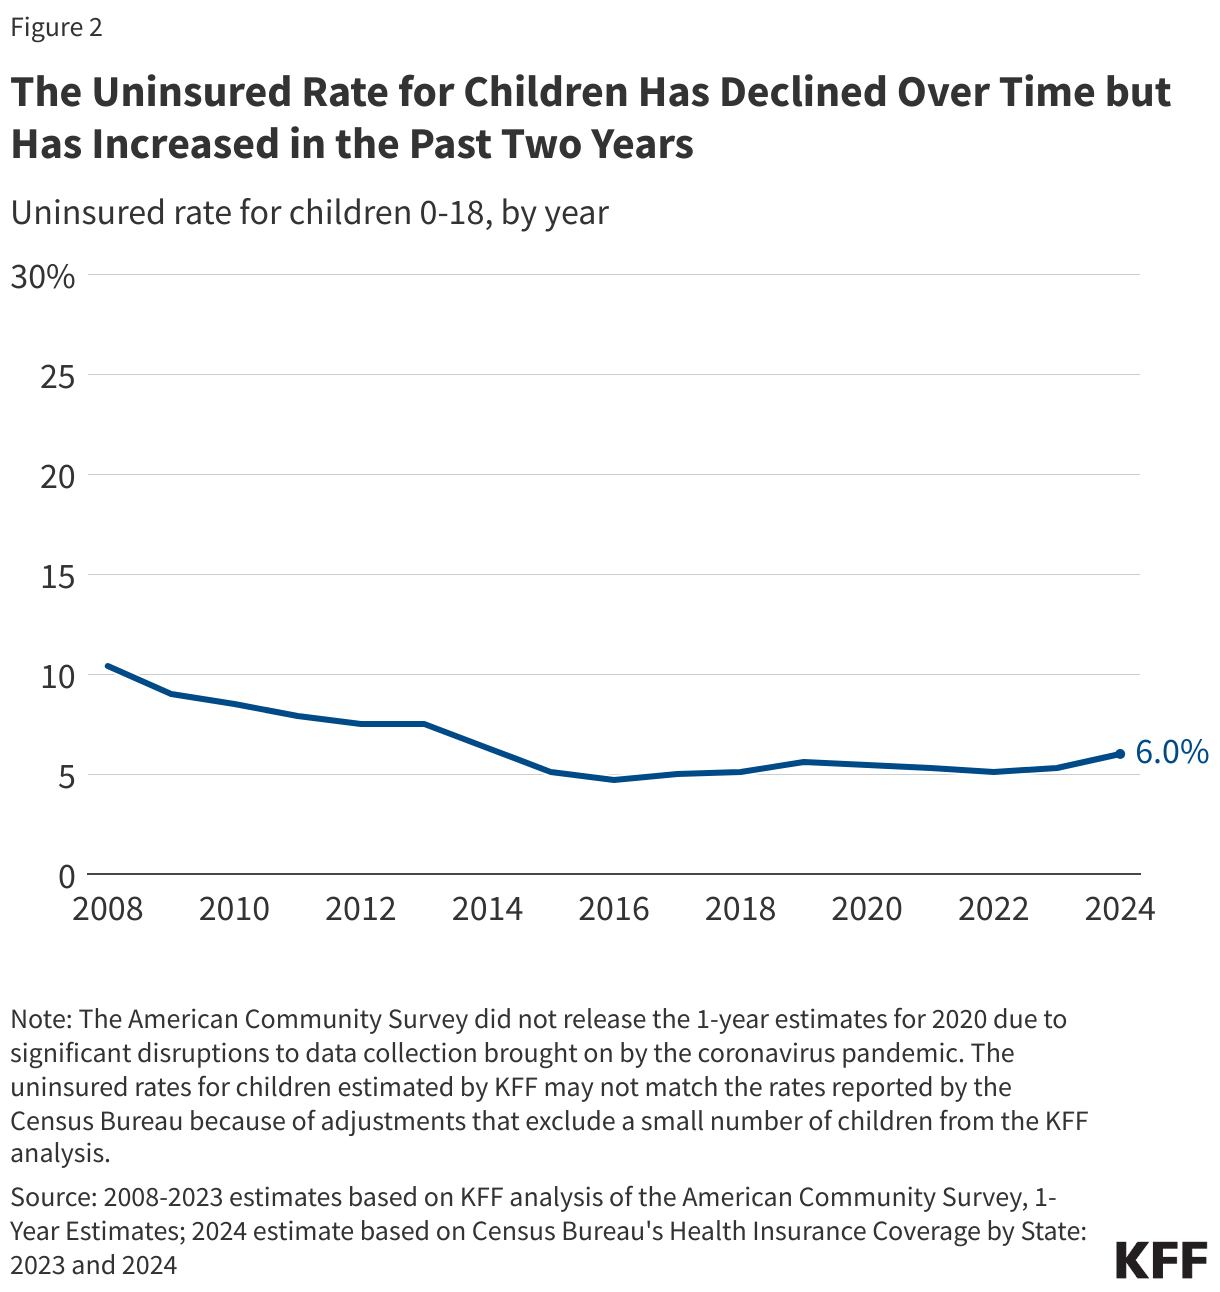
The uninsured rate for children has declined over time but has increased in the past two years. The uninsured rate for children has declined from 10.4% in 2008 to 6.0% in 2024 (Figure 2), largely due to policies at the state and federal level that expanded and streamlined Medicaid coverage, including the ACA Medicaid expansion. The children’s uninsured rate fell to an all-time low in 2016 (4.7%) before ticking up during the first Trump administration, when generally favorable economic conditions as well as Trump administration policy changes led to declines in Medicaid enrollment. The children’s uninsured rate declined again following the onset of the COVID-19 pandemic, but did increase slightly from 5.1% in 2022 to 5.3% in 2023 (a statistically significant increase of 0.2%), driven by a decline in Medicaid coverage as children lost coverage due to the unwinding of the Medicaid continuous enrollment provision, a pandemic-era policy. These trends continued in 2024, and recent federal changes could further reduce children’s Medicaid coverage and increase the number of children who are uninsured in the coming years.

The Uninsured Rate for Children Has Declined Over Time but Has Increased in the Past Two Years (Line chart)

2. Variation in Coverage Across States

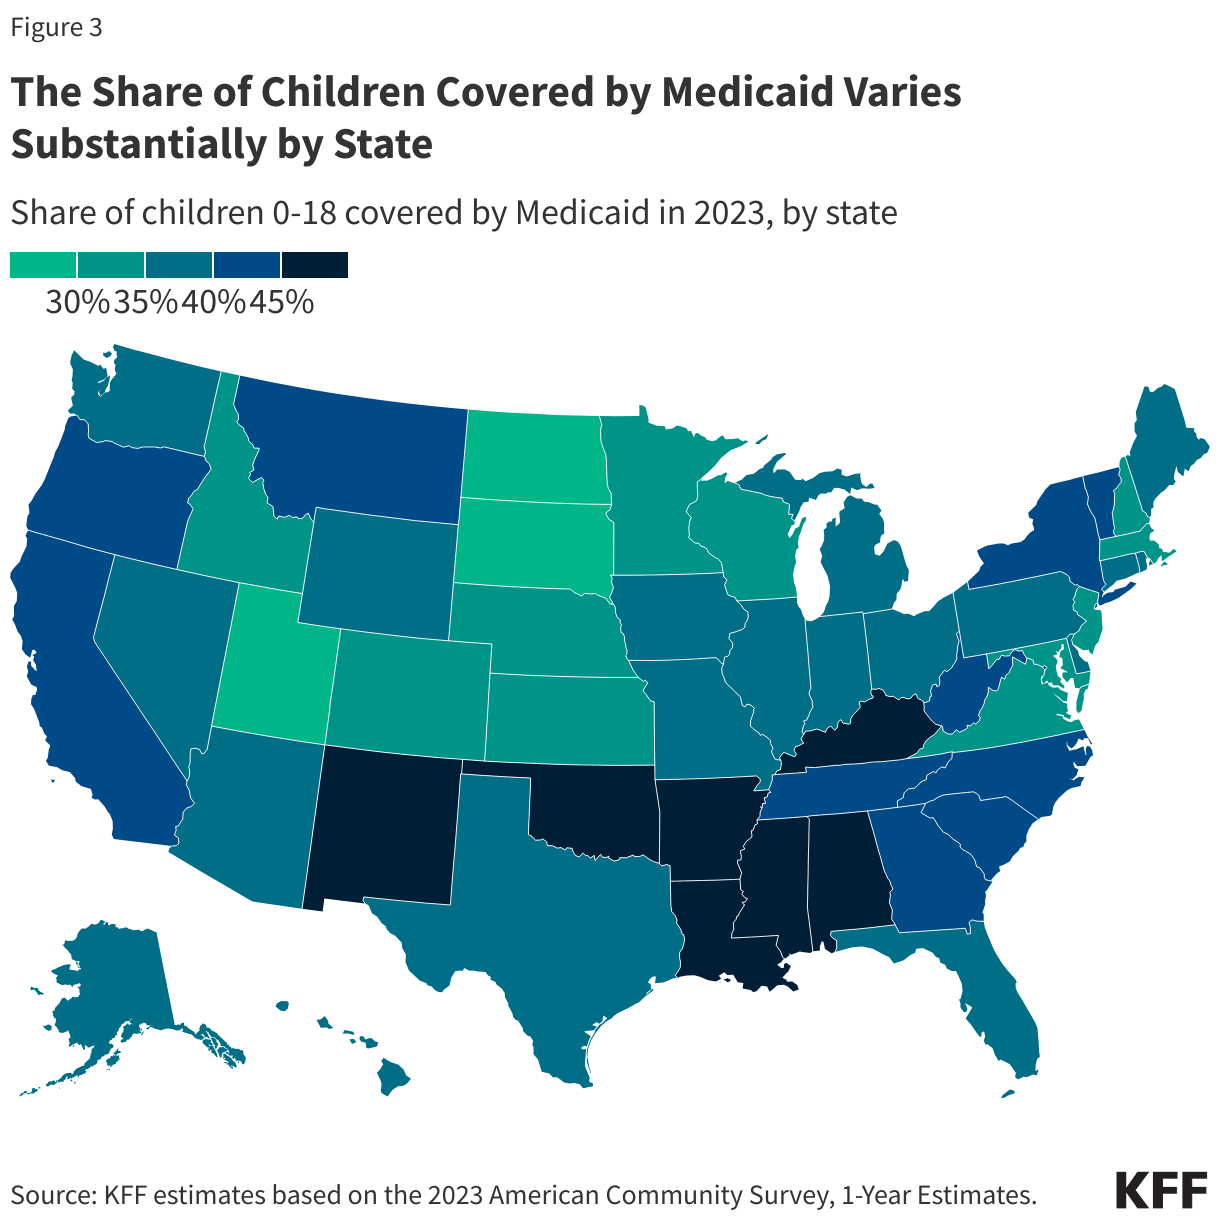
The share of children covered by Medicaid varies substantially by state. Overall, Medicaid covers nearly 4 in 10 children in the U.S., but the share of children covered by Medicaid in each state varies, ranging from under 20% in Utah to over 60% in New Mexico (Figure 3). Seven states (Alabama, Kentucky, Oklahoma, Arkansas, Mississippi, Louisiana, and New Mexico) have over 45% of children enrolled in Medicaid. Medicaid also finances about 4 in 10 births nationally and over half of births in four states (Louisiana, Mississippi, New Mexico, Oklahoma). The program plays a particularly large role in rural areas, paying for nearly half of all births in rural communities and helping to shore up financing for hospitals in rural areas suffering from provider shortages. Research also shows that Medicaid enrollment in childhood can lead to better health outcomes throughout life, increase earnings in adulthood, and potentially reduce future federal spending. A number of states have expanded access to Medicaid and CHIP coverage for children since the pandemic began, but recent federal efforts could reverse this trend. The magnitude of Medicaid budget cuts stemming from the reconciliation law and the extent to which children may be impacted will vary across states, depending on state characteristics as well as how states implement and respond to various provisions.

The Share of Children Covered by Medicaid Varies Substantially by State (Choropleth map)

3. Access to Care

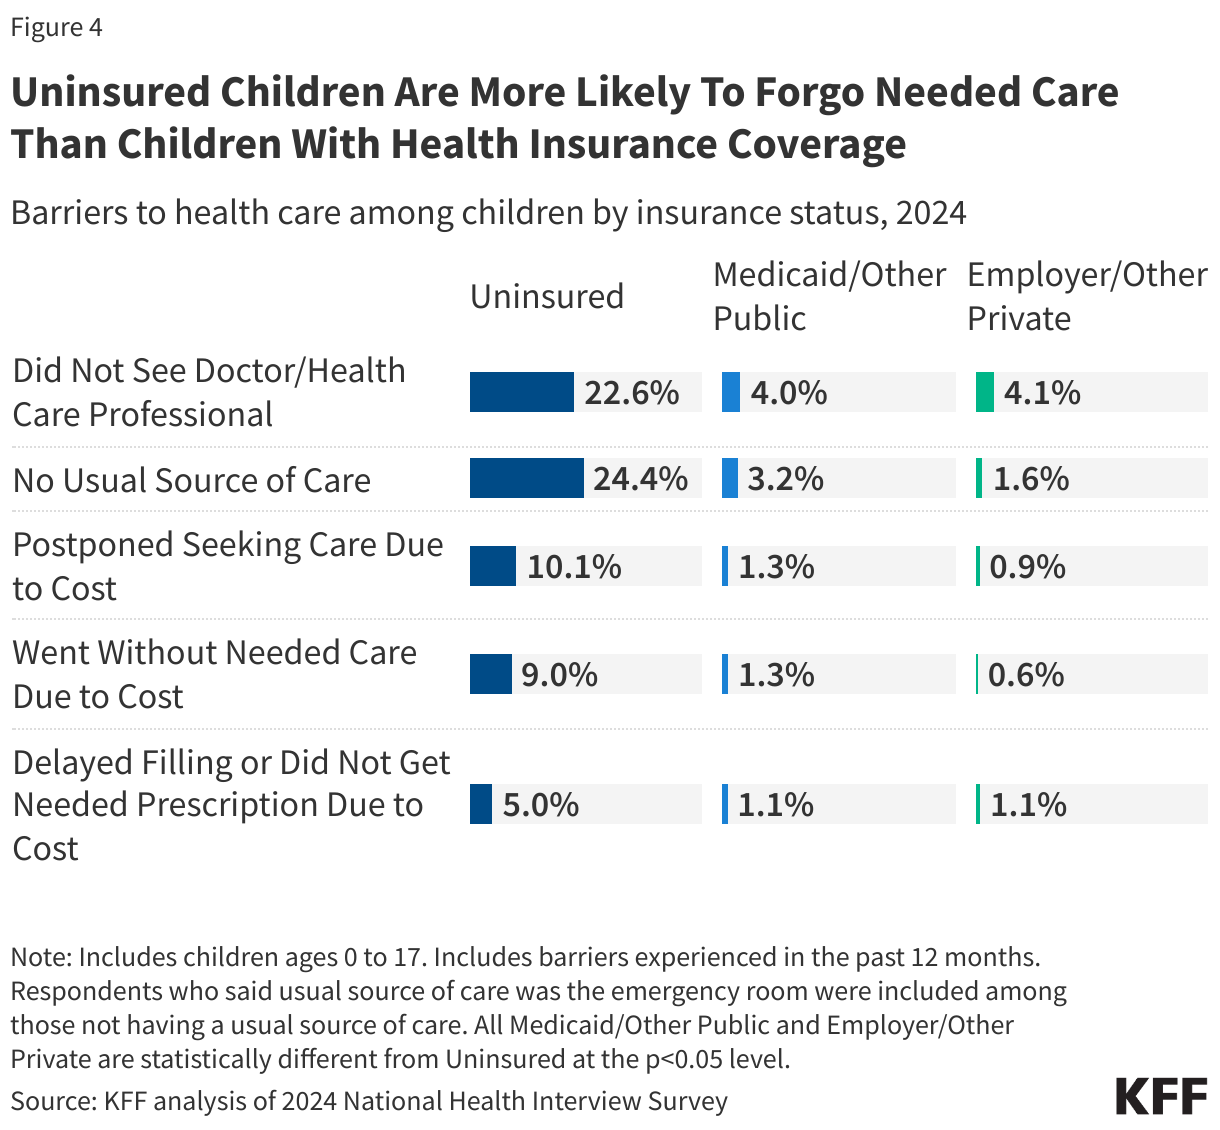
Uninsured children are more likely to forgo needed care than children with health insurance coverage. Research has shown that health coverage provides children with access to needed care, and survey data show uninsured children are more likely than those with private insurance or Medicaid to report going without needed care due to cost and that they had not seen a doctor in the past year (Figure 4). Medicaid’s benefit package for children, Early and Periodic Screening, Diagnostic and Treatment (EPSDT), helps meet children’s health care needs and protects them from high out-of-pocket costs. Under EPSDT, states are required to cover primary care and screening services for children well as any services “necessary… to correct or ameliorate” a child’s physical or mental health condition. This is especially important for children with special health care needs as Medicaid provides more comprehensive coverage for children than the typical private insurance plan and increases access to needed services that improve the quality of daily life, including long-term care and home care.

Some children with Medicaid still face barriers to accessing care. Administrative data have shown that only half of Medicaid enrolled children receive a well-child visit or any kind of dental service within the year. These low rates indicate Medicaid children face barriers to accessing care, including a lack of available providers in their community. Children can also experience challenges accessing behavioral health care, with 57% of children reporting difficulties obtaining mental health care in 2023. Provider rate cuts in response to recent federal changes could reduce access to care, likely contributing to even lower rates of utilization among children and exacerbating access issues for services such as behavioral health care. Other broader Trump administration changes could also have implications for access, including recent changes to vaccine recommendations as well as MAHA commission proposals to enhance prior authorization requirements to prevent “the overuse of medications in school-age children—particularly for conditions such as ADHD”.

Uninsured Children Are More Likely To Forgo Needed Care Than Children With Health Insurance Coverage (Split Bars)

4. Access to Care in Schools

Medicaid coverage can facilitate access to care for children, including children with special education plans, in school. There are an estimated 7 million children, or 10% of all children in the U.S., who currently have special education plans. This includes children receiving special education services under a special education or early intervention plan (often an Individualized Education Plan (IEP) or Individualized Family Service Plan). Medicaid covers half of all children with special education plans, though the share varies by state ranging from 26% in New Jersey to 73% in Kentucky (Figure 5). Medicaid provides significant financing for the delivery of services in schools including reimbursement for medically necessary services that are part of a student’s special education plan, for eligible health services for students with Medicaid coverage more broadly, and for some administrative activities. Recent federal cuts are expected to squeeze school district budgets, potentially affecting school services and reducing access, including for students with special education plans.
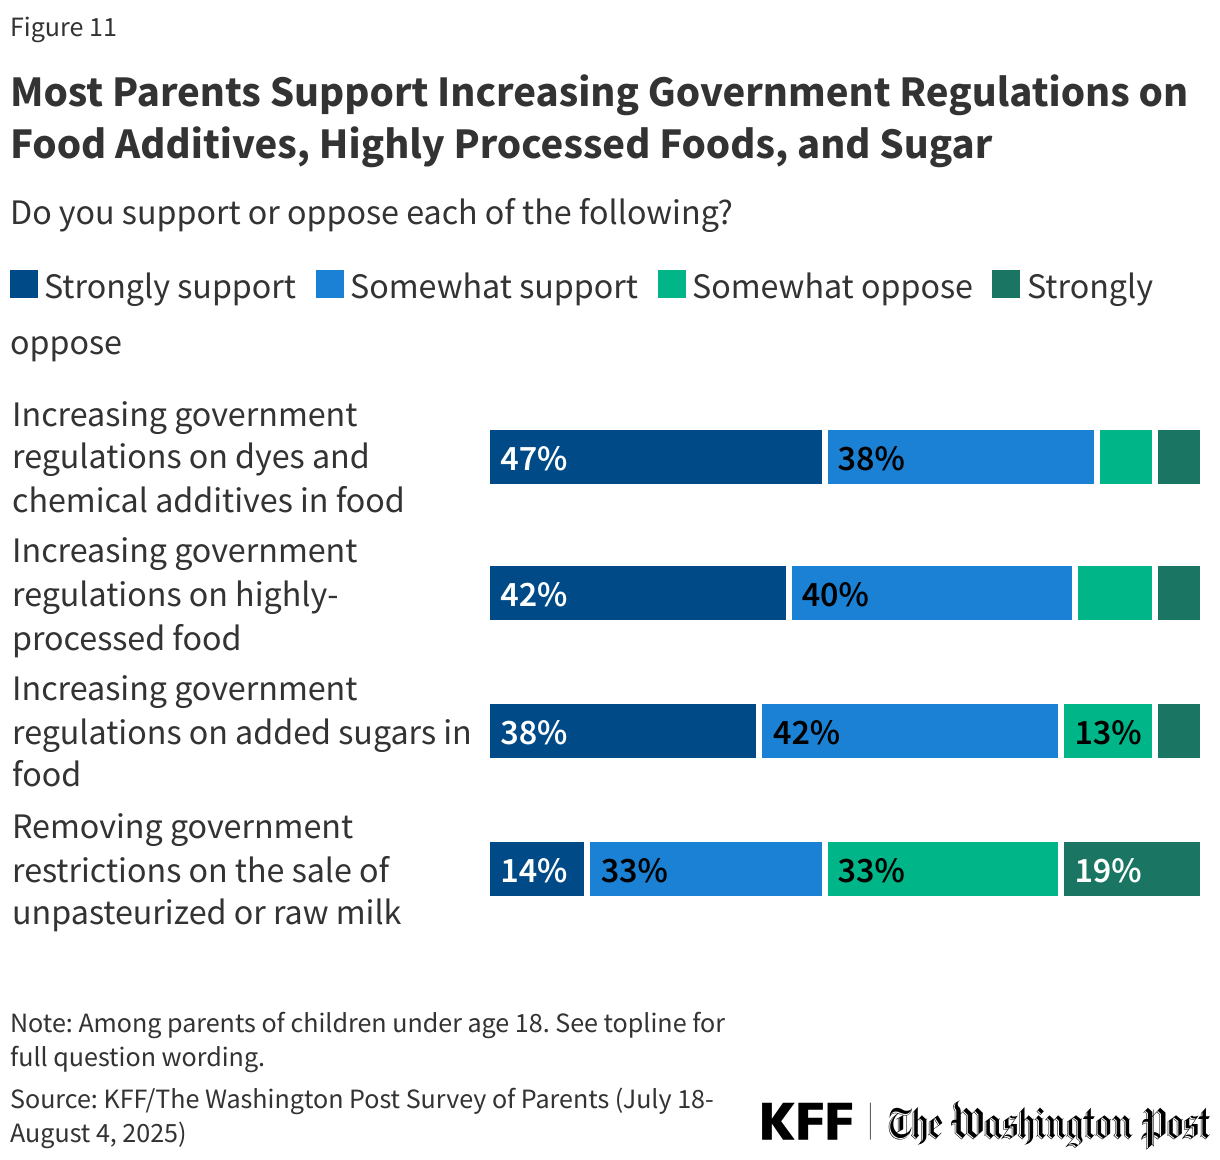
As youth mental health concerns have grown, both the federal government and states have taken action to expand access to school-based mental health care. Schools receive support for providing mental health services in several ways, including support at the federal level through DOE and HHS, as well as through Medicaid, and nearly one in five students attending public schools in the U.S. utilize school-based mental health services. School-based mental health services can improve access to care and reduce access barriers for underserved populations, including children from low-income households and children of color. Recent cuts, including reductions in coverages as well as cuts to DOE and HHS staff, could dampen recent efforts to increase access to mental health care in schools.

Medicaid Coverage Can Facilitate Access to Care for Children, Including Children With Special Education Plans, in School (Choropleth map)

5. Family Financial Security

Children with Medicaid experience higher rates of food insecurity than children overall. Survey data show that 19% of all children in the U.S. and 30% of children covered by Medicaid live in households that experience food insecurity, meaning they are unable to access adequate food due to lack of money or other resources (Figure 6). U.S. Department of Agriculture (USDA) data also show that food insecurity among children has increased in recent years. Food insecurity is associated with multiple chronic conditions, poorer self-reported health status, higher health care utilization, and lower rates of medication adherence. Overall, 19% of children, and 41% of children with Medicaid, receive SNAP benefits. Several studies indicate that individuals who receive SNAP benefits have better health and lower rates of food insecurity than similar people who are eligible but not receiving these benefits. While the MAHA commission highlights the importance of nutrition in recent recommendations, federal SNAP cuts in the reconciliation law could worsen access to food for children.

Medicaid covers 8 in 10 children living in poverty or over 9 million of the almost 12 million children who lived in poverty in 2023 (measured using the official poverty measure; the poverty threshold for a family with two adults and one child was $24,526 in 2023). New data show that from 2023 to 2024 the official poverty rate for children declined slightly and the supplemental poverty rate, which accounts for a wider set of resources, held steady; however, the supplemental poverty rate for children remains more than double what it was in 2021 due to the expiration of pandemic-era federal support. Inflation has cooled since 2022, but household costs remain high, contributing to additional financial hardship and increased food insecurity for families. Federal cuts in the reconciliation law and other recent federal changes could worsen affordability challenges and could lead to further increases in poverty and, ultimately, poorer health outcomes.

Children With Medicaid Experience Higher Rates of Food Insecurity Than Children Overall (Grouped column chart)

Examining Short-Term Limited-Duration Health Plans on the Eve of ACA Marketplace Open Enrollment

Authors: Michelle Long, Emma Lee, and Sammy Cervantes
Published: Oct 15, 2025

Editorial Note: This issue brief provides an update and additions to KFF’s similar 2018 analysis on short-term limited-duration health insurance, using a revised methodology.

Short-term, limited-duration (STLD) health plans have long been sold to individuals through the “non-group” (individually-purchased) private insurance market and through industry associations. STLDs were designed for individuals who experience a temporary gap in health coverage, such as someone who is between jobs. Short-term plans are often marketed as less expensive alternatives to health insurance sold on the Affordable Care Act (ACA) Marketplace. However, STLDs provide less comprehensive coverage and have fewer consumer protections than Marketplace plans. As Open Enrollment for Marketplace plans nears, recent actions taken by Congress and the Trump administration, and the potential expiration of enhanced premium tax credits, are likely to result in millions of people losing coverage or having to pay substantially higher premiums for Marketplace coverage. At the same time, the Trump administration recently announced that it would not prioritize enforcement actions for violations of Biden-era consumer protections for short-term plans, and that it intends to undertake rulemaking, which could roll back those regulations. Taken together, these changes could lead more consumers to purchase less expensive and less comprehensive coverage, such as short-term plans, instead of a more comprehensive ACA plan this Open Enrollment season.

KFF has analyzed short-term health policies sold on the websites of nine large insurers in a major city in each of the 36 states where short-term plans are available. These insurers offer 30 distinct products, with a total of approximately 200 distinct plans. For more details, see the Methods section. This brief provides an update to and expansion of a similar 2018 KFF quantitative analysis, examining premiums, cost sharing, covered benefits, and coverage limitations of these short-term policies, and comparing their features to plans sold on the ACA Marketplace.

Key Takeaways

  • Short-term plans are sold in 36 states. Five states prohibit the sale of short-term health plans, and in nine states plus the District of Columbia, short-term plans are not outright prohibited, but none are available due to more extensive state regulations.
  • Premiums for the lowest-cost short-term plans can cost two-thirds or less than the lowest-cost unsubsidized Bronze plans sold on the ACA Marketplace in the same area. However, the vast majority of Marketplace enrollees receive premium tax credits, which can effectively result in similarly priced or even cheaper Marketplace plans, all of which provide more comprehensive coverage than the highest cost short-term plan.
  • Short-term plans tend to have lower premiums because they are medically underwritten and have pre-existing condition exclusions. For example, an individual with cancer, obesity, or who is pregnant is likely to be declined. Additionally, the lowest-cost short-term plan premium for a 40-year-old woman ranges from 6% to 19% higher than the lowest-cost premium for a man. These practices are not permitted in ACA-compliant plans.
  • Short-term plan deductibles for an individual in select U.S. cities range from $500 to $25,000 compared to $0 to $9,200 for Bronze Marketplace plans. Silver and Gold plans have lower deductibles, but also higher premiums. Unlike all ACA-compliant plans, most short-term plans do not have out-of-pocket (OOP) maximums or only apply these maximums to certain OOP expenses. The maximum benefit limits for short-term plans sold in these ten cities are as low as $100,000 per policy term. ACA-compliant plans are not allowed to have annual or lifetime dollar limits.
  • Among all the short-term products we reviewed, 40% do not cover mental health services, 40% do not cover substance abuse treatment, 48% do not cover outpatient prescription drugs, and almost all exclude coverage for adult immunizations (94%) and maternity care (98%). All ACA-compliant plans must cover these services.
  • Even when short-term plans do cover these and other benefits, limitations and exclusions almost always apply that would not be permitted under ACA-compliant plans, such as separate benefit limits, limits on the number of primary care visits the plan will cover, and limits on the number of days the plan will cover inpatient hospital care.

Background

Consumer Protections

As the name suggests, short-term health plans are not required to be renewable. Whereas federal law, since 1996, has required all other individual health insurance to be guaranteed renewable at the policyholder’s option, coverage under a short-term policy terminates at the end of the contract term. Continuing coverage beyond that term requires applying for a new policy. An individual who buys a short-term policy and then becomes seriously ill will not be able to renew coverage when the policy ends.

The ACA prohibits health insurance plans sold on the non-group market from practices such as medical underwriting, pre-existing condition exclusions, and lifetime and annual limits. ACA-compliant plans are required to provide minimum coverage standards and limit out-of-pocket cost sharing ($9,200 for an individual in 2025). Since short-term plans are not regulated as individual market insurance under federal law, these market rules do not apply to short-term plans, which, by contrast, can:

  • base premiums, without limit, on health status, gender, and age;
  • require application fees or enrollment in a special association to be eligible for coverage;
  • deny coverage for people with pre-existing conditions, or exclude coverage for those conditions;
  • exclude coverage for essential health benefits, including maternity care, prescription drugs, mental health care, and preventive care, and limit coverage in other ways;
  • impose lifetime and annual dollar limits on covered services;
  • not have an out-of-pocket maximum on patient cost sharing; and
  • exclude other ACA consumer protections, such as rate review or minimum medical loss ratios.

Short-term policies are not considered “minimum essential coverage,” the term used to describe health coverage that meets the ACA requirement that individuals have health coverage, and which determines eligibility for Special Enrollment Periods. Therefore, loss of short-term coverage does not qualify an individual for a Special Enrollment Period in the ACA Marketplace, so they would have to wait until the next Open Enrollment period to enroll in an ACA Marketplace plan.

There is no current or comprehensive data on the number of consumers enrolled in an STLD. Most available estimates are a substantial undercount because they do not account for STLDs sold through associations, which is likely the majority. The most comprehensive estimate may come from a 2020 Congressional investigation, which estimated that approximately 3 million people were enrolled in a short-term plan at some point during 2019.

Federal Laws and Regulations

Today, short-term plans are typically available for one to six months, with some issuers offering coverage for up to 12 months and one offering “three-packs” of short-term policies, enabling consumers to buy up to three years of short-term coverage at a time. The duration and renewability of STLD plans have been the subject of changing federal regulations, as shown in Table 1.

Permissible Durations of Short-term Plans Under Changing Regulations, 2016-2024 (Table)

To address reports of misleading marketing and deceptive sales tactics, current federal regulations also require short-term plans to conspicuously notify consumers that short-term plans are “NOT comprehensive coverage” and to include standardized language describing STLD plans’ coverage limitations in comparison to insurance sold on HealthCare.gov.

The Trump administration’s 2018 regulation expanding the permitted duration of short-term plans was challenged in district court, with a 2019 ruling in favor of the government. The Biden administration once again imposed limits on the use of short-term plans. In August 2025, the Trump administration announced that it would no longer prioritize enforcement of Biden-era regulations on short-term plans and that it intends to undertake corresponding rulemaking. Amendments to these provisions could, again, prompt lawsuits. Meanwhile, a lawsuit challenging the 2024 regulations is working its way through the courts.

State Laws and Regulations

Short-term health plans are available in 36 states (Figure 1). Five states (CA, IL, MA, NJ, and NY) have laws prohibiting the sale of short-term health plans. In nine states plus the District of Columbia, short-term plans are not prohibited, but none are available due to more extensive state regulations that require these plans to provide more consumer protections than they do in other states (e.g., no pre-existing condition exclusions, coverage of certain benefits, shorter durations).

Availability of Short-Term Plans by State, 2025 (Choropleth map)

How Short-Term Plans Compare to Bronze-Level ACA Marketplace Plans

Premiums

Due to coverage limitations and fewer consumer protections, short-term policies, unsurprisingly, typically have lower premiums than unsubsidized Bronze plans, a trend that is similar to our 2018 analysis. (Note, however, that the methodology used for this analysis differs from that used in 2018, and some of the states we reported data for in 2018 no longer have short-term plans for sale.) Our cost analysis of approximately 200 short-term plans sold by nine major insurers in the 36 states where short-term plans are available found that many of the cheapest short-term plans for a 40-year-old non-smoker were priced at two-thirds or less of the premium for the lowest-cost ACA-compliant, unsubsidized Bronze plan in the same area (Table 2). However, premiums for the highest-price short-term plans, which typically have lower cost sharing, are higher than the highest-cost Bronze plan in four of the ten cities shown in the table for males and five of the cities for females. All Bronze plans provide more comprehensive coverage than even the highest-cost short-term plans.

The vast majority (93%) of ACA Marketplace enrollees receive a premium tax credit tied to their income, reducing both the price they pay for a Marketplace plan and the price difference between the lowest cost short-term plan and the lowest cost Bronze plan. In some cases, the lowest-cost subsidized Bronze plan is cheaper than the lowest-cost short-term plan sold in the area. For example, the cheapest Bronze plan for a 40-year-old individual living in Houston, TX, who earns $45,140 per year (the median individual income in the U.S. in 2024) and receives a premium tax credit, would be 5% less for a male and 23% less for a female than the cost for the lowest-cost short-term plan. Additionally, in nine of the ten cities in Table 2, the highest-cost subsidized Bronze plan for an individual earning $45,140 per year is lower than the highest-cost short-term plan, sometimes by hundreds of dollars. Premiums for Silver plans, with the tax credit, would be higher, but also come with lower deductibles.

ACA-compliant plans are not permitted to charge women higher premiums than men. There are no equivalent federal requirements for short-term plans, and as such, short-term plans can and do charge women more than men. Among the ten major cities shown, the lowest-cost short-term plan premium for a 40-year-old woman ranges 6% to 19% higher than the lowest-cost premium for a man. ACA-compliant plans may charge higher premiums for older consumers than younger consumers, but only within specified limits. These limits do not apply to short-term plans. For example, in Phoenix, AZ, the lowest-cost Bronze plan for a 60-year-old individual is 112% higher than for a 40-year-old, whereas the lowest-cost short-term plan costs 311% more for a 60-year-old male and 228% more for a 60-year-old female.

Premium Ranges for ACA Marketplace Bronze Plan Premiums Compared to Short-term Health Plans in Select Cities, 2025 (Table)

In addition to monthly premiums, most short-term products require one-time application fees, which typically range in price from $20 to $35. Additionally, all the national insurers require enrollment in a special association to be eligible for coverage in most states (e.g., one association serves as a source of information on consumer issues and offers its members products and services in a variety of areas); three of these insurers require enrollees to pay an extra monthly fee for the association membership, ranging from $15 to $25 per month. Taken together, these fees can turn a three-month short-term policy with a $70 monthly premium into a policy that actually costs over $100/month. Plans sold on the ACA Marketplace do not charge application fees or require association memberships.

Cost Sharing

In addition to premiums, cost sharing is another consideration when comparing the affordability of short-term plans to ACA-compliant plans. An insurer may offer several plans with variable cost-sharing structures within each product type. Cost sharing does not typically vary by the enrollee’s age or sex. A deductible is the amount an enrollee has to pay out-of-pocket in the plan year (or policy term) before insurance will begin paying for most covered services. In general, health insurance plans that have lower premiums tend to have higher deductibles and vice versa.

Among the ten major cities analyzed for this part of the analysis, deductibles for Bronze Marketplace plans range from $0 (an HMO in Milwaukee, WI) to $9,200 (most cities); in 2025, no ACA-compliant plans can have a deductible exceeding this amount (Table 3). In comparison, deductibles for short-term plans in these cities range from $500 (Houston, TX) to $25,000 (all cities), nearly three times higher than the highest deductible for a Bronze plan. Some consumers enrolled in a short-term plan with a shorter duration (such as three or four months) and a higher deductible may never meet the deductible during the policy term and may end up paying for care entirely out-of-pocket.

In the individual market, plans must have an out-of-pocket (OOP) maximum on enrollee cost sharing (including deductibles, coinsurance, and copayments) for covered services provided by an in-network provider. For the 2025 plan year, the OOP max cannot be higher than $9,200 for single coverage. If an enrollee meets the OOP maximum, the plan must pay for covered services in full (meaning no enrollee cost sharing) for the remainder of the plan year. Short-term plans, on the other hand, are not required to have an OOP maximum under federal law, and many do not, meaning there is no limit to the amount an enrollee must pay out of pocket for covered services during the policy term. When a short-term plan does have an OOP maximum, sometimes the deductible and coinsurance count toward the OOP max (not copayments, cost sharing for services with a benefit limit that has been exceeded, or facility fees). In the major cities shown, OOP maximums for a Bronze Marketplace plan range from $7,100 (Portland, OR) to $9,200 (all cities). While the lowest OOP max for a short-term plan in these cities is $2,000 (most cities), short-term plans that have no OOP maximum are available in all but one city (Portland, OR). Among short-term plans that do have an OOP maximum, OOP maximums are as high as $32,500 in most cities, approximately three and a half times higher than the highest OOP maximum for a Bronze plan.

All short-term plans have a total dollar limit that they will pay for covered care during the term of the plan, or sometimes over the enrollee’s lifetime. The maximum benefit limits among the ten are as low as $100,000 per policy term. This means that if the plan spends $100,000 on covered services for an enrollee, the plan will not pay for any more covered services the enrollee receives during the policy term. This amount is lower than in 2018, when the lowest coverage limit was $250,000. ACA-compliant plans are prohibited from imposing dollar limits on how much they will pay for covered services during the plan year (unless those services are not part of the ACA’s essential health benefits).

Cost-Sharing Ranges for ACA Marketplace Bronze Plans Compared to Short-term Health Plans in Select Cities, 2025 (Table)

Covered Benefits

All plans sold on the ACA-Marketplace must cover these 10 essential health benefits: hospitalization, ambulatory services, emergency services, maternity and newborn care, mental health and substance abuse treatment, prescription drugs, laboratory services, pediatric services, rehabilitative and habilitative services and devices, and preventive care (many of these preventive services must also be covered without cost sharing). In contrast, there are no federal requirements for short-term plans to cover the essential health benefits, though many short-term plans provide at least some level of coverage for some of these benefits, and some states have their own coverage requirements for certain services.

This part of the analysis examines specific benefits covered by 30 distinct short-term products from nine major insurers in the 36 states where short-term plans are available. This information is based on shopping tools and plan documents available on the insurers’ websites, including state variations when provided. Table 4 shows the percentage of short-term products by major city that cover at least some services in five benefit categories: mental health services, substance use services, prescription drugs, adult immunizations, and maternity services. Note that short-term plans that cover these benefit categories often apply limits and exclusions on these services, which are not reflected in this table, but are discussed in more detail below.

Of the short-term products reviewed, just 60% cover mental health services, 60% cover services for substance abuse treatment, 52% cover prescription drugs, 6% cover adult immunizations, and just 2% cover maternity care. In two states (AK and MD), mental health services are not covered by any short-term product, and in six other states, fewer than half cover them. There are no short-term products in Maryland that cover substance use treatment, and in six other states, fewer than half cover treatment. Two states (MD and SD) do not have any short-term products that cover prescription drugs, and in three other states, fewer than half cover them. Ten states have no short-term products that cover adult immunizations. Only two states (MT and NH) have products that cover maternity services. See the Methods section for how we defined a product as covering these benefits.

Percentage of Short-Term Health Insurance Products Covering Select Benefits, by Major City, 2025 (Table)

Benefit Limitations

Even when short-term plans do cover these benefits, limitations and exclusions almost always apply that would not be permitted under ACA plans. For example, thirteen of the fourteen products that cover prescription drugs apply a maximum dollar limit on the benefit, all ranging from $1,000 to $5,000 per policy term, except for one product with a $10,000 pharmacy benefit limit. Some short-term plans that cover prescription drugs also limit the types of drugs they will cover. For example, they may not cover contraceptives or may only cover them if the primary purpose they are being prescribed for is not to prevent pregnancy. Additionally, many products that cover prescription drugs do not cover specialty drugs, and some only cover “maintenance” medications for certain chronic conditions. Short-term products that cover mental health and substance abuse treatment impose significant limits on the benefits. Examples of coverage limitations for these benefit categories include a $50 maximum benefit for outpatient visits, a 31-day maximum for inpatient care, and a benefit limit of $3,000 per policy term. Additionally, short-term products that cover treatment for substance use disorders usually do not cover illnesses or injuries resulting from being under the influence of alcohol, illegal substances, or controlled substances unless they were prescribed to that individual.

Short-term products have several other limitations on covered benefits. For example, while nearly all advertise coverage for preventive care, most services require cost sharing or dollar limits that would not be permitted in ACA-compliant plans. Other common examples of per policy term limitations and additional costs include coverage of only one office, coverage of no more than three emergency room visits, an additional $750 deductible for inpatient care, and a $15,000 benefit limit for all covered outpatient care.

All of the short-term products reviewed exclude coverage for pre-existing health conditions, and most have waiting periods for at least some services, rendering coverage of certain covered benefits less meaningful than they may seem at first glance. For example, nearly eight in ten products advertise coverage for cancer treatment, but anyone who has been diagnosed with cancer before enrolling would be denied coverage when they apply. Even if there had been no cancer diagnosis before enrolling in the plan, if the enrollee is first diagnosed with cancer while enrolled in the short-term plan, the plan could deny coverage for treatment if the symptoms should have caused an “ordinarily prudent person” to seek medical care, or the plan could terminate coverage altogether. Additionally, for many cancers, a course of treatment would take much longer than short-term coverage would last. By contrast, ACA-compliant health plans are prohibited from having pre-existing condition exclusions or dropping coverage if the enrollee gets sick. Other common health conditions that are typically considered “declinable” by short-term plans include having a history of ulcers or Crohn’s disease, diabetes, depression, heart disease, and obesity; recent pregnancy is also considered a pre-existing health condition by short-term plans.

Looking Forward

With the ACA enhanced premium tax credits slated to expire at the end of this year and new federal policies on the horizon that are expected to result in millions of people losing coverage, more individuals may consider purchasing less expensive and less comprehensive coverage, such as short-term health plans. Without federal enforcement of Biden-era consumer protections, short-term health plans already are available for longer durations, and while all short-term products we reviewed do include the consumer warning currently required, insurers could opt to exclude or modify it in future plan years. Consumers, who, as mentioned above, have been the target of aggressive and, at times, misleading marketing of short-term plans, could end up enrolled in plans that cover less than they thought and leave them on the hook for higher out-of-pocket costs than are permitted under Marketplace plans. Relatedly, the Trump administration has already taken action to expand access to catastrophic plans sold on the Marketplace, beginning with the coming Open Enrollment period. Although these plans must meet all the requirements of metal-level Marketplace plans (described above), they have much higher cost sharing.

Additionally, to the extent that healthy individuals opt for short-term plans instead of ACA-compliant plans, this adverse selection could contribute to instability in the non-group market and raise the cost of comprehensive coverage, particularly for those who are not eligible for premium tax credits. Furthermore, short-term plans are just one loosely regulated alternative to ACA plans. Other types of coverage that consumers could be steered to by marketers and insurers include fixed indemnity plans, cancer-only plans, hospital-only plans, and other types of supplemental coverage.

If the Trump administration issues regulations rolling back the 2024 regulations limiting the duration of short-term plans and requiring a standardized consumer warning on these products, which it aims to do by the end of 2026, additional lawsuits are likely. Unlike previous litigation, however, legal challenges to new regulations would not face the same standard of judicial review that upheld the 2018 Trump regulations.

Considering the significant attention focused on issues like high drug prices, the opioid epidemic, and mental health, it is notable that short-term plans often exclude or severely limit coverage for mental health, substance use, and prescription drugs. Because short-term plans provide less comprehensive coverage and fewer consumer protections than ACA-compliant plans, people who buy short-term policies in order to reduce their monthly premiums risk that if they do need medical care, they could be left with significant medical bills.

KFF acknowledges Karen Pollitz for her contributions to this analysis, including insights into the data and feedback on the draft.

In the summer and fall of 2025, we analyzed publicly-available information published on the websites of nine insurers: Allstate, United, Pivot, Everest, Select Health, Moda Health, BCBS of ID, BCBS of SC, and Medical Mutual. We believe these insurers are the primary sellers of short-term plans in the U.S, representing a wide breadth of short-term plans and products in the 36 states where short-term plans are sold. The number of insurers in each state ranges from one in Alaska, Maryland, New Hampshire, and North Dakota, to five in Ohio, South Carolina, and Texas. We used the online shopping tool for each insurer to identify the plans available in one major city of each of the 36 states and reviewed both the information in the search results and accompanying plan documents. One issuer sells a short-term product in some states that is guaranteed issue. For an equivalent comparison across all other insurers and products, this analysis does not include that product.

Each short-term product has a unique name and set of benefits and often offers multiple plans with different cost-sharing structures. The insurers in this analysis offer 30 distinct products (representing a total of approximately 200 unique plans), ranging from one product in Maryland to 23 in Ohio. The same product is often sold in multiple states, occasionally with variations in benefits by state. While we made every effort to account for state-level variations in this analysis, we only present information made available in insurers’ published plan documents and online shopping tools, which may be incomplete or may not reflect every specific state requirement, as some insurers may not make full coverage details available until after the plan has been purchased.

Premiums presented are for a 40-year-old non-smoker. Since premiums vary by gender for short-term plans, they are presented for males and females. Since ACA-compliant plans cannot base premiums on gender, only one set of premiums is presented.

For the analysis of covered benefits, products that only cover treatment for “organic” mental health conditions are not considered to cover mental health for this analysis. Products that only cover treatment for alcohol disorders are not considered to cover substance use. Products that only cover prescription drugs when administered in an inpatient setting, or that only provide a prescription drug discount card, are not considered to cover prescription drugs. A few products do not specify whether adult immunizations are covered. In these instances, we do not consider them to be covered. All products cover complications of pregnancy. Only products that also cover pregnancy care and childbirth are considered to cover maternity care.

Poll Finding

KFF/The Washington Post Survey of Parents: Polling Insights on the MAHA Movement

Published: Oct 15, 2025

At the start of his second term, President Donald Trump established the Make America Healthy Again (MAHA) Commission, chaired by Health and Human Services Secretary Robert F. Kennedy Jr., to examine the rise in chronic childhood conditions and develop federal strategies to address them. Recent MAHA Commission reports have covered issues including diet and exercise, the dangers of social media and excessive screen time, the impact of highly-processed foods, and use of prescription medications and vaccines. Findings from the KFF/Washington Post Survey of Parents shed light on the issues that parents see as top concerns for their children’s wellbeing and the attitudes and behaviors of parents who identify with the MAHA movement.

Key Takeaways

  • About four in ten (38%) parents identify as supporters of the MAHA movement, a coalition that includes between three in ten and four in ten parents across gender, age, race, and ethnicity. Alignment with the movement among parents is highly correlated with political identification, as about six in ten Republican parents (62%), rising to eight in ten MAGA Republican parents (81%), identify with the President’s health movement, compared to about one in six (17%) Democratic parents. One third of independent parents (34%) identify with the movement.
  • Many MAHA-supporting parents echo vaccine skepticism that has been amplified by HHS Secretary Kennedy. Nearly six in ten (56%) MAHA parents say they trust Kennedy to provide reliable information about vaccines, more than twice the share of non-MAHA-supporting parents who say the same (23%). While few MAHA parents say they are “anti-vaccine” (9%), a majority say they are “in the middle” when it comes to vaccines (55%), and their attitudes reflect this mix of views and behaviors. Most MAHA parents say they have kept their children up to date with recommended vaccines (75%), but at least four in ten say the CDC recommends too many vaccines for children (42%) and they are not confident in U.S. health agencies to ensure vaccine safety and effectiveness (58%).
  • There is broad agreement across parents on some of the biggest issues facing children’s health in the U.S. today, with large shares of both MAHA-supporting parents and non-MAHA parents saying the use of social media (78% and 74% respectively) and mental health challenges (68% and 69%) are either the biggest or a major threat to children’s health. Majorities of both groups also cite highly processed foods (78% and 62%) and obesity (69% and 61%) as major threats to children’s health, though the shares are somewhat larger for MAHA parents compared to non-MAHA parents. Attitudes diverge on some other issues, with larger shares of MAHA parents than non-MAHA parents citing over-prescribing of medications (61% vs. 43%), neurodevelopmental disorders (48% vs. 38%), and fluoride in water supplies (33% vs. 25%) as at least major threats to children’s health. Parents who do not support the MAHA movement are more likely than MAHA parents to cite gun violence (68% among non-MAHA parents vs. 50% among MAHA parents), pollution (56% vs. 48%), difficulty affording enough food (50% vs. 41%), and infectious diseases (45% vs. 36%) as the biggest or major threats to children’s health in the U.S. today.
  • The MAHA Commission’s policy goals related to regulating food in the U.S. have broad support, though parents are split on the question of whether to deregulate the sale of raw milk. At least eight in ten parents support increasing government regulations on dyes and chemical additives in food (85%), on highly processed food (82%), and on added sugars in food (80%). While MAHA-supporting parents are more likely than non-MAHA parents to support each of these regulation proposals, at least three in four, regardless of MAHA support, support these policy goals. About half (47%) of parents support deregulating the sale of unpasteurized milk, including much larger shares of MAHA (63%) than non-MAHA (36%) supporting parents.

Who Are MAHA Parents?

About four in ten (38%) parents say they are supporters of the MAHA movement, with support strongly tied to political identification. About six in ten (62%) Republican parents identify with the movement, rising to eight in ten (81%) among Republicans who support the Make America Great Again (MAGA) movement. About one-third (34%) of independent parents and one in six (17%) Democratic parents support the MAHA movement.

Larger shares of parents without a college degree (41%) than with a college degree (33%) support the MAHA movement, a difference that persists even when controlling for partisanship, MAGA identity, and other demographics.

About four in ten White parents (43%) say they support the MAHA movement compared to about three in ten Hispanic parents (32%) and Black parents (30%). While much media attention has been paid to so-called MAHA moms, a group of social media influencers who amplify the MAHA movement’s stance on food additives, this poll finds similar shares of mothers and fathers say they support MAHA, as do similar shares of parents across age groups.

About Four in Ten Parents Support the MAHA Movement, Including Eight in Ten MAGA Republican Parents (Bar Chart)

Trusted Information Sources for MAHA Parents

There are wide divisions when it comes to trust in some sources of vaccine information for MAHA and non-MAHA parents. Pediatricians continue to be the most trusted source of information about vaccines for parents, with about eight in ten (81%) MAHA-supporting parents and about nine in ten (88%) non-MAHA parents saying they trust their child’s pediatrician “a great deal” or “a fair amount.”

Aside from pediatricians, majorities of MAHA parents say they trust their friends and family (58%), HHS Secretary Kennedy (56%), and their local public health departments (56%) for vaccine information, making these the top sources of vaccine information for these parents after pediatricians. About half of MAHA parents report trusting the CDC (51%) or FDA (47%) for information on vaccines. One-third or fewer MAHA parents say they trust their child’s school or daycare (37%), pharmaceutical companies (22%), or health and wellness influencers (14%) “a great deal” or “a fair amount” when it comes to reliable information about vaccines.

MAHA Supporting Parents Are More Than Twice as Likely as Non-MAHA Parents to Trust Kennedy on Vaccines (Split Bars)

Vaccine Views Among MAHA-Supporting Parents

In a section titled “The Overmedicalization of Our Kids,” the White House’s MAHA report released earlier this year states that while vaccines protect children from infectious diseases, there has not been enough research into the risks of vaccines. Vaccine skepticism is a core component of the MAHA platform.

As with parents overall, MAHA and non-MAHA parents overwhelmingly value long-standing childhood vaccines but are more divided when it comes to the COVID-19 and flu vaccines for children. About nine in ten MAHA and non-MAHA parents see the measles, mumps, and rubella (MMR) (86% and 93% respectively) and polio (85% and 91%) vaccines as important for children in their communities, including majorities who say each of these are “very important.”

MAHA parents, however, are much less likely to say the COVID-19 or flu vaccines are important for children in their communities. Parents who do not support the MAHA movement are nearly twice as likely as MAHA parents to say it is “very” or “somewhat” important for children in their community to be vaccinated for COVID-19 (52% vs. 28%) and 20 percentage points more likely to say it is important for children to be vaccinated for the flu (64% vs. 44%).
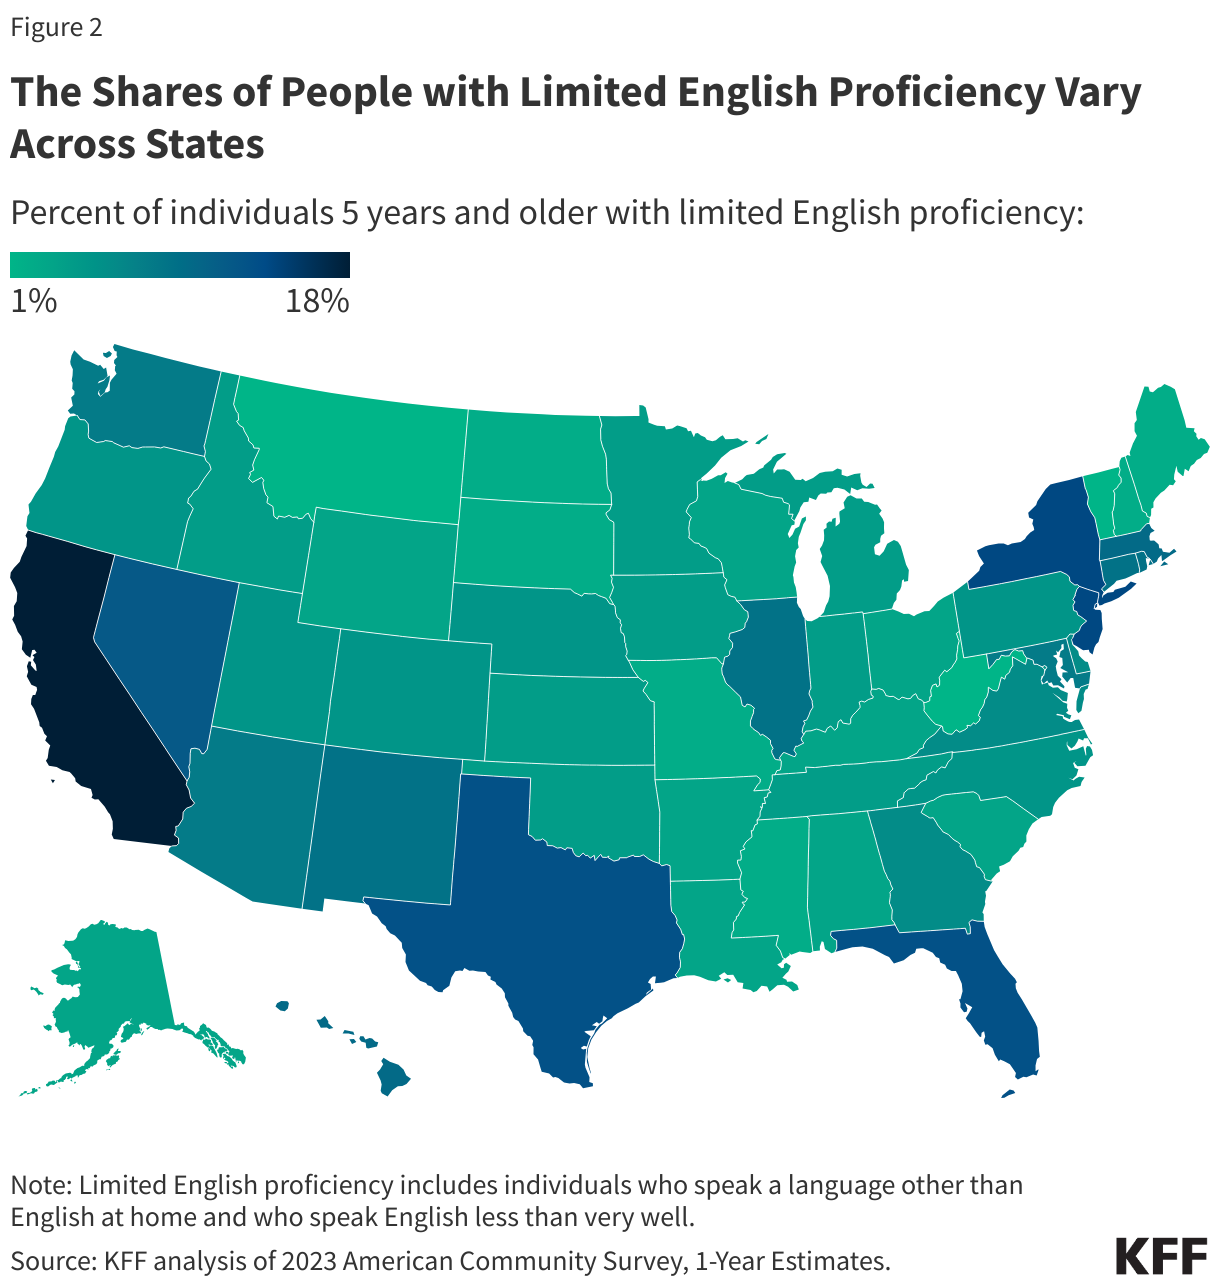
Split bar chart showing percent who say it is very or somewhat important for children in their community to be vaccinated against specific diseases. Results shown by total parents and MAHA support.

While most MAHA and non-MAHA parents report confidence in the safety of MMR and polio vaccines, MAHA parents are less likely to be “very” confident. These parents are even less confident in the safety of flu and COVID-19 vaccines for children. About three in four MAHA parents (78%) and nearly nine in ten non-MAHA-supporting parents (88%) are confident in the safety of MMR vaccines, though MAHA parents are less likely than non-MAHA parents to be “very confident” (44% vs. 60%). Similarly, about eight in ten (79%) MAHA parents and nine in ten (88%) non-MAHA parents are confident in the safety of polio vaccines, with fewer MAHA parents being “very confident” (43% vs. 60%).

When it comes to the safety of COVID-19 vaccines for children, just one in four MAHA-supporting parents are “very” (9%) or “somewhat” (16%) confident, compared to about half (54%) of non-MAHA parents. In fact, about half (53%) of MAHA parents say they are “not at all” confident in the safety of COVID-19 vaccines for children. MAHA parents are divided in their confidence in the flu vaccines for children, with about half (54%) saying they are confident. About seven in ten (72%) parents who do not support the MAHA movement are confident in the safety of the flu vaccines.

Most MAHA Parents Express Confidence in Childhood Vaccine Safety, but Fewer Than Half Are Very Confident (Stacked Bars)

Parents who support the MAHA movement are more likely than parents who do not support MAHA to hold vaccine skeptical views explored in this survey, though few (9%) would call themselves anti-vaccine. About six in ten (58%) MAHA parents say they are not confident in the CDC and FDA to ensure the safety and effectiveness of vaccines approved for use in the U.S., compared to about half (47%) of non-MAHA parents.

About half (51%) of MAHA-supporting parents say children are healthier when their vaccines are spaced out and they do not get multiple shots in one visit, while about half (47%) correctly say there is no strong evidence for this. Parents who are not supporters of the MAHA movement are more likely to correctly indicate that there is no evidence for spacing vaccines (63%), while one-third (35%) say children are healthier when vaccines are spaced out.

About four in ten MAHA-supporting parents (42%) say the CDC recommends “too many” childhood vaccines, more than twice the share of non-MAHA parents who say the same (17%).

As with parents overall, a majority of MAHA-supporting parents report keeping their children up to date on childhood vaccinations aside from COVID-19 and flu (75%). However, one in four MAHA-supporting parents (24%) report skipping or delaying at least one childhood vaccine for their kids, more than twice the share of non-MAHA-supporting parents who report the same (11%).

Vaccine Attitudes Differ Between MAHA and Non-MAHA Supporting Parents (Split Bars)

Make America Healthy Again and Vaccine Myths

HHS Secretary Kennedy has amplified claims about vaccines that have been rejected by scientists and public health officials, adding to the confusion surrounding their safety. While small shares of parents believe these claims are true, most MAHA parents do not reject them as false, and many express uncertainty.

Though the overall shares are small, MAHA parents are more likely than non-MAHA parents to say it is true that chronic diseases are likely rising because of an increase in the number of vaccines children get (21% vs. 8%), that MMR vaccines can cause autism in children (15% vs. 6%), that the measles vaccine causes the same illness it is supposed to prevent (11% vs. 6%), and that vitamin A is an effective treatment for measles (9% vs. 4%).

About half of MAHA parents say they “do not know enough to say” whether it is true that the measles vaccine causes the illness it is meant to prevent, or that chronic diseases are likely rising because of an increase in the number of vaccines children get, two claims alluded to in the MAHA Commission report. Fewer than four in ten MAHA parents correctly say either of these claims are false (38% and 31% respectively), while a majority of non-MAHA parents identify these as false (57% and 55%).

When it comes to the false claim that MMR vaccines can cause autism in children, nearly six in ten (59%) MAHA parents say they “do not know enough to say” whether it is true, and about one in four (26%) say it is false. Non-MAHA-supporting parents are about twice as likely to correctly indicate that this claim is false (53%). There has been extensive scientific research disproving the link between autism and vaccines.

Stacked bar chart showing percent who say specific false claims about vaccines and diseases are true, they don't know enough to say, or are false.

Views of Autism Research

While there has been extensive scientific research disproving the link between autism and vaccines, there is a lack of consensus on the exact causes for the rise in autism rates in the U.S. The White House MAHA Commission is tasked with studying the root causes of autism.

Many (44%) parents overall say there has been “too little” research into the causes of autism spectrum disorder generally. One in four parents say there has been “about the right amount” of research, and a similar share (28%) say they are not sure. Few (3%) parents say there has been too much research into the topic.

When asked more specifically about the amount of research done into whether there is a link between vaccines and autism spectrum disorder, one-third say there has been “too little” research into this, and similar shares say there has been “about the right amount” (29%) or they are not sure (30%). Few (7%) parents say there has been “too much” research into whether there is a link.

Stacked bar chart showing percent who say they has been too much, too little, or about the right amount, or are unsure, of scientific research into specific topics regarding autism spectrum disorder.

Parents who support the MAHA movement, and Republican parents (including MAGA Republican parents) are more likely than their counterparts to say there has been “too little” research into the causes of autism or whether there is a link between autism and vaccines. In fact, MAHA-supporting parents are twice as likely as non-MAHA parents to say there has been too little research into the connection between autism and vaccines (48% vs. 24%).

While about six in ten parents of children diagnosed with autism spectrum disorder say there has been “too little” research into the causes of autism spectrum disorder generally (61%), fewer – about one-third (35%) – say there has been too little research into whether there is a link between vaccines and autism spectrum disorder. About six in ten parents who have skipped or delayed vaccines for their children say there has been too little research into the causes of ASD (60%) or whether there is a link between vaccines and ASD (57%).

Split bar chart showing percent who say there has been too little scientific research into specific topics related to autism spectrum disorder. Results shown by total parents, parents by vaccine choice, parents with and without a child with autism spectrum disorder, party identification, and MAGA support.

What Do Parents See As the Biggest Threats to Children’s Health in the U.S.?

Social media use, mental health challenges, and issues related to diet and exercise are top issues parents view as serious threats to children’s health in the U.S. At least six in ten parents overall say social media use (75%), highly processed foods (68%), mental health challenges such as chronic anxiety or depression (68%), obesity (64%), gun violence (61%), and lack of physical activity (60%) are either the “biggest” or a “major” threat to children’s health in the U.S. today. About half of parents say pollution, poor air quality, and environmental toxins (53%), over-prescribing medications (50%), and difficulty affording food (46%) are at least major threats to children’s health, while about four in ten cite neurodevelopmental disorders (42%) and infectious diseases (41%) as threats. Fewer (28%) see fluoride in local water supplies as the biggest or a major threat to children’s health.

Social Media Use, Mental Health Challenges, and Highly Processed Food Rank Among the Biggest Threats Parents See for Children (Stacked Bars)

Despite partisan and demographic differences in who identifies with the MAHA movement, there are some similarities in what parents see as the biggest threats to children’s health. Social media and mental health challenges rank high for both MAHA and non-MAHA-supporting parents when it comes to assessing threats to children’s health, with about three-fourths of MAHA-supporting parents (78%) and non-MAHA-supporting parents (74%) citing social media, and about seven in ten of each group citing mental health challenges.

For issues related to nutrition and exercise, majorities of parents in both groups identify these as threats to children’s health, but MAHA parents are more likely to emphasize their level of threat. MAHA parents are more likely than parents who do not support the movement to say highly processed foods (78% among MAHA parents vs. 62% among non-MAHA parents), obesity (69% vs. 61%), and lack of physical activity (66% vs. 57%) are threats to children’s health. MAHA parents are also more likely to cite over-prescribing medications (61% vs. 43%), neurodevelopmental disorders (48% vs. 38%), and fluoride in water supplies (33% vs. 25%) as the biggest or major threats to children’s health today.

Parents who do not support the MAHA movement, largely comprised of Democratic and independent parents, are more likely to cite gun violence (68% among non-MAHA parents vs. 50% among MAHA parents), pollution (56% vs. 48%), difficulty affording enough food (50% vs. 41%), and infectious diseases (45% vs. 36%) as the biggest or major threats to children’s health in the U.S. today.

Highly Processed Foods, Use of Social Media, are Among The Biggest Threats MAHA Parents See for Children Today; Non-MAHA Parents Also Cite Gun Violence (Range Plot)

Support for Regulating Food Additives

In the past year, Robert F. Kennedy Jr. has called for stricter regulations on the U.S. food supply, requesting the removal of synthetic dyes and ultra-processed foods, citing their negative impact on children’s health. These policy proposals are popular, with at least eight in ten parents saying they “strongly” or “somewhat” support increasing government regulations on dyes and chemical additives in food (85%), on highly processed food (82%), and on added sugars in food (80%). About one in five or fewer parents oppose each of these proposals.

Parents are more divided when it comes to removing government restrictions on the sale of unpasteurized or raw milk, with half (47%) in support and another half (52%) opposed.

Most Parents Support Increasing Government Regulations on Food Additives, Highly Processed Foods, and Sugar (Stacked Bars)

About three quarters or more of Democratic parents, independent parents, Republican parents, MAHA-supporting, and non-MAHA-supporting parents support increasing government regulation on food additives, highly processed foods, and sugar. Partisans are divided on the question of raw milk de-regulation, as six in ten Republican (60%) and MAHA-supporting (63%) parents support removal of restrictions on raw milk, while majorities of non-MAHA supporters and Democrats are in opposition. For decades, the FDA has prohibited the interstate sale of raw milk, citing serious health risks posed by the consumption of unpasteurized milk. While Secretary Kennedy has previously accused the FDA of unfairly suppressing the consumption of raw milk, the MAHA Commission report released this year did not include references to raw milk or proposed changes to existing regulations.

Bipartisan Majorities of Parents Support Increasing Regulations on Food, Parents Are Split on De-Regulating Raw Milk Sales (Split Bars)

This KFF/The Washington Post Survey of Parents was designed and analyzed by public opinion researchers at KFF and The Washington Post. The survey was designed to reach a representative sample of parents or legal guardians of children under the age of 18 in the U.S. The survey was conducted July 18 – August 4, 2025, online among a nationally representative sample of 2,716 parents using the Ipsos KnowledgePanel in English (n=2519) and in Spanish (n=197). KnowledgePanel is a nationally representative probability-based panel where panel members are recruited randomly through invitations mailed to respondents randomly sampled from an Address-Based Sample (ABS) provided by Marketing Systems Groups (MSG) through the U.S. Postal Service’s Computerized Delivery Sequence (CDS). Invitations were sent to panel members by email followed by up to two reminder emails.

All completes were reviewed to ensure respondents were giving the survey adequate attention. Three cases were removed from the data that failed internal quality checks. Most KnowledgePanel respondents received a financial incentive equaling about $1 for their participation in this survey with some harder-to-reach groups receiving about $5 for their participation.

The survey also includes an oversample of parents of children 5 years old and younger (n=1,092) in order to reach a higher rate of responses from parents who are currently making decisions around their child’s vaccines. The full sample was weighted to match the sample’s demographics to the national U.S. parent population using data from the Census Bureau’s 2023 American Community Survey. Weighting parameters included gender, age, education, race/ethnicity, region, metro status, and language proficiency within the Hispanic sample. The sample was also weighted to the total parent population on political party identification using the 2025 KFF Benchmarking Survey.  An additional adjustment was conducted in order to provide estimates from parents living in Texas (n=276) using the 2023 ACS as well as the 2023-2024 Pew Religious Landscape Survey. Both weights take into account differences in the probability of selection, including adjustment for the sample design, within household probability of selection, and the design of the panel-recruitment procedure.

The margin of sampling error including the design effect for the total sample is plus or minus 2 percentage points and plus or minus 3 percentage points for the parents of children under the age of 6. The full Texas sample has a margin of sampling error of plus or minus 7 percentage points. Numbers of respondents and margins of sampling error for key subgroups are shown in the table below. For results based on other subgroups, the margin of sampling error may be higher. Sample sizes and margins of sampling error for other subgroups are available on request. Sampling error is only one of many potential sources of error and there may be other unmeasured error in this or any other public opinion poll. KFF and The Washington Post are charter members of the Transparency Initiative of the American Association for Public Opinion Research.

GroupN (unweighted)M.O.S.E.
Total parents2,716± 2 percentage points
   
Support for Make America Healthy Again (MAHA) movement  
MAHA-supporting parents977± 3 percentage points
Not MAHA-supporting parents1,679± 3 percentage points
   
Party ID  
Democratic parents801± 4 percentage points
Independent/Other party parents1,077± 3 percentage points
Republican parents780± 4 percentage points
MAGA Republican parents498± 5 percentage points
   
Parents by vaccine choice  
Skipped or delayed any childhood vaccines436± 5 percentage points
Kept kids up to date on all childhood vaccines2,264± 2 percentage points

Medicare Beneficiaries Have 32 Medicare Advantage Prescription Drug Plans Available, on Average, for 2026

The average number of private plans has declined slightly but remains above the number available in 2022 and prior years

Authors: Jeannie Fuglesten Biniek, Meredith Freed, Anthony Damico, and Tricia Neuman
Published: Oct 14, 2025

In anticipation of the Medicare annual open enrollment period, which runs from October 15 to December 7, the Centers for Medicare and Medicaid Services (CMS) recently released information about Medicare Advantage plans for the coming year. News articles following the release of plan information report that Medicare Advantage insurers are scaling back their offerings in response to changes in federal payments and because unexpected increases in the use of health services have led to rising costs and falling profits.

KFF’s analysis of plan offerings shows that Medicare beneficiaries will have the option of 32 Medicare Advantage prescription drug (MA-PD) plans in 2026, two fewer than the 34 options available in 2025 (excluding employer plans and special needs plans). The number of MA-PD options has grown steadily since 2010, peaking in 2024 when the average Medicare beneficiary had 36 options. Despite the decline in offerings over the last two years, the number of options available for 2026 will be higher than the number available in 2022 (31) and every year before (Figure 1).

The Number of Medicare Advantage Plans Available to the Average Medicare Beneficiary is Slightly Lower than the Past Few Years, But More Than Every Year Prior to 2023 (Stacked Bars)

Across all Medicare Advantage plans for individual enrollment, including those with and without prescription drug coverage, the average Medicare beneficiary has the option to choose among 39 plans in 2026, compared to 42 options in 2025. Similar to the trend for MA-PDs, the total number of Medicare Advantage plans available to the average beneficiary is higher than the average number of plans available in 2022 (38), and each year since 2010. While Medicare Advantage plans are required to cover all Medicare Part A and Part B benefits, plans decide whether to include Part D prescription drug coverage as part of the benefit package. Enrollees may pay a separate premium for Part D coverage, or plans can use the rebate portion of their payment from the federal government to cover these costs. Most Medicare Advantage enrollees are in plans that include prescription drug coverage.

The number of Medicare Advantage plans with prescription drug coverage available to the average beneficiary varies across states, as does the change in the number of plans compared to 2025 (Figure 2). In 35 states, DC and Puerto Rico, the average beneficiary has a choice of fewer plans on average in 2026 than in 2025. The states with the largest drop in the number of plans available were New Hampshire (13 fewer plans) and Minnesota (11 fewer plans). In Minnesota, UCare, the second largest Medicare Advantage insurer in the state, exited the market altogether, while UnitedHealthcare and Humana decreased their offerings, especially in more rural counties with lower enrollment. However, in 6 states (AL, HI, KS, MO, UT, and WV), the average beneficiary has access to more plans in 2026 than in 2025, on average. In the remaining 8 states, the number of plans available to the average beneficiary stayed the same. This includes Alaska, which had no plans available in 2026, as in 2025 (Alaska has historically had few or no Medicare Advantage plans available for general enrollment). Connecticut is not included in this calculation because of differences in how counties are reported across CMS enrollment and plan files.

The Average Beneficiary Has More or Fewer Medicare Advantage Plans Available to Choose from in 2026 Depending on the State They Live In (Choropleth map)

While the average Medicare beneficiary will have more than 30 Medicare Advantage plans with prescription drug coverage to choose from, in certain states the number of options is substantially lower. Medicare beneficiaries will have fewer than 5 options, on average, in four states: Alaska (0), South Dakota (4), Wyoming (3), and Vermont (1). Within states, the number of plans also varies across counties (data not included). Historically, fewer Medicare Advantage plans have been offered in the most rural areas, and a larger share of Medicare beneficiaries in the most rural areas get Medicare coverage from traditional Medicare.   

The modest decrease in the average of Medicare Advantage plans means that some Medicare beneficiaries will find that their current coverage is no longer an option for next year. In most cases, these beneficiaries live in counties where they will continue to have dozens of other Medicare Advantage plan options available for 2026, as well as traditional Medicare. Some beneficiaries in plans that have exited the market will have the option to enroll in a plan offered by the same insurer, and in many cases, enrollees will be moved into a new plan offered by the same insurer automatically if the contract includes another plan of the same type (i.e., HMO or PPO) in the same county. Others will have to make an active choice about their Medicare coverage if they wish to enroll in another Medicare Advantage plan, or will be automatically covered by traditional Medicare.

Every year, Medicare Advantage plans change in ways that could be important to enrollees, including the scope and generosity of extra benefits, cost sharing for Medicare-covered benefits, rules for using covered services (such as referral requirements and prior authorization), drug formularies, and provider networks. Despite these changes, most Medicare beneficiaries report that they do not compare coverage options on an annual basis. Further, prior Medicare focus groups indicate that Medicare enrollees are often overwhelmed by the number of Medicare Advantage choices and have difficulty sorting through all plan options. With more than 30 Medicare Advantage plans with prescription drug coverage available in 2026, on average, understanding how plans differ, and why it may matter, may remain a challenge.


The Trump Administration Executive Order on Gender Continues to Reverberate

Author: Lindsey Dawson
Published: Oct 14, 2025

Much has been written about the Trump Administration’s early effort to suppress data collection, presentation, and research related to LGBTQ – and particularly transgender – people’s health. A day one executive order (and subsequent HHS guidance and an OPM memorandum) on “gender ideology” laid out the administration’s approach to sex and gender, defining sex as an immutable binary biological classification and removing recognition of gender identity. While they have each been challenged in court, together, these and other policies have underpinned the removal of a range of websites, cancellation of federal grants, and led to changes to federal survey instruments, including those related to health and well-being, actions that continue to be expanded upon.

Earlier this year, court orders required the restoration of certain webpages, datasets, and resources needed to provide medical care (and in a separate case, the government agreed to restoration of pages), yet data collection related to LGBTQ people remains limited and removal of information reportedly continues. 1 In at least some cases where it was required to restore websites, the administration plainly states it is doing so only because of its legal obligation. By way of example, a Centers for Disease Control and Prevention (CDC) page on transgender people and HIV now includes a banner stating that it has been restored per court order and that “any information on this page promoting gender ideology,” including reference to transgender people “does not reflect biological reality and therefore the Administration and this Department rejects it.” Additionally, new reporting found that more pages relating to sexual health, LGBTQ people, and other topics have been removed from the CDC site, as recently as September. These actions stand to limit understanding of LGBTQ people’s experiences and challenge the ability of stakeholders to shape responsive policy.

Also in September, the CDC updated its “about” page to include a new set of agency priorities, with a section on “gender ideology and protecting children.”  This section references the HHS guidance and states that it is an agency “priority to recognize that a person’s sex as either male or female is unchangeable and determined by objective biology, and to ensure CDC programs accurately reflect science, including the biological reality of sex.” Removing acknowledgment of transgender people from agency materials has implications for public health messaging and services related to the population’s health needs, posing challenges for a community that has elevated health risks, including for some communicable diseases, like HIV. This could lead to gaps in individual, community, and scientific knowledge and, depending on what is removed, the ability to monitor, and ultimately, respond to outbreaks or health disparities. This priority shift could also negatively influence the LGBTQ community’s trust in the agency – which has historically been important when CDC has responded to certain events, like the mpox outbreak of 2022, necessitating community collaboration. Further, if CDC, aligns funding opportunities with this priority area, it could jeopardize CDC grants going to those working to engage gender diverse communities, thereby limiting service provision. Tailoring public health approaches to communities experiencing high unmet needs or not otherwise being reached is a basic public health approach and requires acknowledging their existence and approaching needs in culturally competent ways.
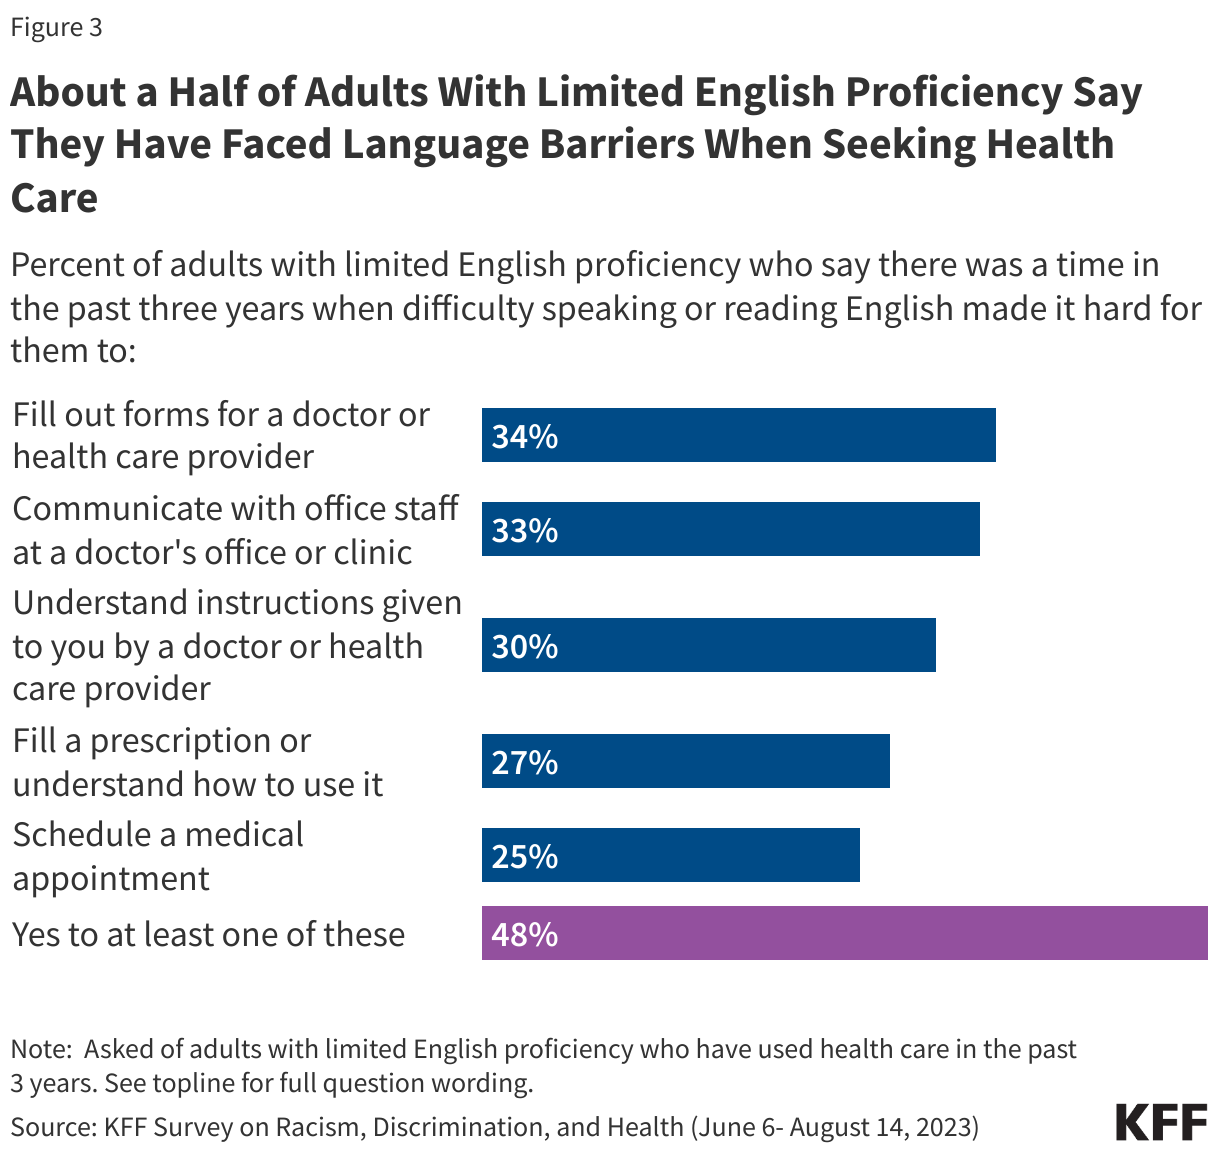
Additionally, recent CDC clinical guidelines, used to inform providers about the evidence and clinical recommendations related to public health interventions, omit mention of transgender people, seemingly reflecting administrative priorities. A new twice-yearly injectable pre-exposure-prophylaxis or PrEP (HIV prevention) drug, lenacapavir, was approved in June and holds significant promise in helping to bend the curve on the HIV epidemic by addressing adherence and clinical capacity issues. However, the clinical recommendations from the CDC do not reference transgender or non-binary people, who, because they experience HIV at disproportionate rates, were specifically included in “PURPOSE 2”, one of the clinical trials that led to the drug’s FDA approval. The PURPOSE 2 trial assessed lenacapavir’s efficacy in cisgender men, transgender men and women, and non-binary people. The trials found that lenacapavir was 96%-100% effective at preventing HIV transmission and the final drug label issued by the FDA specifies that “there were no clinically significant differences in the pharmacokinetics of lenacapavir based on…gender identity”, among other variables. This marks a departure from CDC’s 2021 PrEP guideline, released prior to approval of the new drug, which included a section on PrEP and transgender people. It also represents a departure from the approach taken by the World Health Organization (WHO) in their lenacapavir guidelines, which identified gender diverse people as a key population and discusses prescribing lenacapavir to those also taking gender affirming hormone therapy. While providers may look elsewhere for detailed information (such as to the WHO or the trial data), the exclusion could impact willingness to prescribe among those less experienced with PrEP or in working with transgender patients. In addition, given that an earlier PrEP drug (emtricitabine/tenofovir alafenamide), was not approved for people engaged in “receptive vaginal sex because the effectiveness in this population has not been evaluated,” providers may be especially cautious about reviewing sex and gender based indications for new PrEP drugs. Indeed, this earlier exclusion is a key reason that led to the more inclusive – of both cisgender women and gender diverse people – trial design and ultimate broad approval of lenacapavir. This follows the removal of detailed information on proving antiretrovirals to transgender people for HIV treatment from the HHS treatment guidelines, an action that took place sometime between March and April 2025.   

As with other changes, the exclusion of transgender people from treatment and prevention recommendations likely reflects and is consistent with the administration’s stance on sex and gender with the Executive Order directing agencies to “remove all statements, policies, regulations, forms, communications, or other internal and external messages that promote or otherwise inculcate gender ideology.”   

Looking across these actions, barriers to providing complete treatment and prevention information could impact individual health (HIV is a life-long chronic condition when treated, and a deadly one when untreated), as well as public health if ongoing HIV transmission continues. It also has implications for private and public budgets with the estimated lifetime cost of HIV treatment per person in the United States now over $1 million.

  1. The Court in this case vacated the OPM Memo and the HHS Guidance, remanding them to the agencies. However, the remedy was limited to website and data restoration and “vacatur does not require the HHS defendants to undo every action taken pursuant to the OPM Memo or HHS Guidance” and the court “will not prevent the defendants from heading back to the drawing board and attempting to craft a lawful policy with similar objectives.” Other cases challenge the gender Executive Order itself. ↩︎

Designating English as the Official Language of the United States Could Impact Millions with Limited English Proficiency

Published: Oct 10, 2025

Introduction

On March 1, 2025, President Trump signed Executive Order (EO) 14224 designating English as the official language of the United States. This marks the first time in the country’s history that the U.S. has declared an official language at the federal level. Although the Order does not by itself trigger changes in services provided by agencies or organizations receiving federal funding, the policy represents a departure from previous administrations’ policies around language access for individuals with limited English proficiency (LEP). The federal government defines people with LEP as those who do not speak English as their primary language and who have a limited ability to read, write, speak, or understand English (also described as speaking English “less than very well”).

An accompanying official fact sheet released by the Trump administration outlines how EO 14224 will affect agencies and their services, including review of all services currently offered in languages other than English and phasing out of non-essential services. Prior guidance for agencies serving people with LEP has been suspended.

The Order will likely result in more limited availability of language access services for people with LEP.  Language and interpretation services are important for ensuring access to health coverage, care, and for improving health outcomes. Loss of services may further exacerbate disparities in health and health care, as people with LEP are disproportionately more likely to be Hispanic, Asian, immigrants, and to have lower incomes. Further, the new EO could also create challenges and confusion for health care and other service providers, who remain subject to other laws and regulations that still require provision of language access services.

This issue brief provides an overview of EO 14224 and its potential implications for multilingual resources, including data on the shares of individuals with LEP across different socioeconomic characteristics based on KFF analysis of 2023 American Community Survey (ACS) data.

Prior Language Access Policies

Prior laws and guidance have established requirements for language access and protection for people with LEP. Title VI of the Civil Rights Act of 1964 and Section 1557 of the Affordable Care Act (ACA) prohibit discrimination based on national origin, including discrimination based on the ability to speak English. Previously, the Department of Justice (DOJ) took the stance that Title VI of the Civil Rights Act prohibited discrimination against people with LEP, recognizing that a lack of language access represented discrimination based on national origin. In 2000, President Clinton issued EO 13166, which required all federal agencies to ensure meaningful access to services for people with LEP and established that failing to provide adequate services would be considered discrimination based on national origin. EO 14224, signed by President Trump, revokes EO 13166 and any policy guidance documents issued under it, and requires the Attorney General to provide updated guidance.

Section 1557 of the Affordable Care Act strengthened language access protections by prohibiting discrimination in health programs and other services that receive federal financial assistance. Section 1557 requires covered entities, including hospitals, clinics, insurers, and state Medicaid programs, to provide meaningful access for individuals with LEP. While Section 1557’s protections took effect when the ACA was enacted in 2010, much of its reach has been determined by implementation guidance issued across different presidential administrations. Under the Biden administration regulations issued in 2024, entities that operate health programs or activities and receive federal financial assistance must take reasonable steps to provide meaningful access to individuals with LEP who are eligible to be served or likely to be directly affected by the program or activity. The regulation specifies requirements regarding how the services must be provided, including that they be free of charge, accurate, and timely; outlines standards for interpretation and translation services; and identifies requirements for entities to provide notice of the availability of services. Section 1557 remains in effect despite the Executive Order, meaning that health care entities will continue to be required to provide language access services, even as federal agencies may scale back their language access resources.

Changes in Language Access Under the Trump Administration

EO 14224, issued by President Trump in March 2025, declares English as the official language of the U.S. and revokes prior orders requiring federal agencies to provide meaningful access to services for individuals with LEP. The Order also instructs the Attorney General to rescind all policy guidance stemming from EO 13166. As a result, in April 2025, the DOJ rescinded its 2022 LEP guidance, which directed agencies to assess and enhance their language access policies, and published a new memorandum providing implementation guidance related to the EO. The DOJ also removed LEP.gov, a website that provided resources to federal agencies and other entities receiving federal funding for developing language access plans.

Patients are still entitled to interpreter services under Title VI through qualified bilingual staff or interpreter services at no additional cost. Historically, providers have often aligned their services with the Department of Health and Human Services (HSS) outlined National Standards for Culturally Linguistically Appropriate Services (CLAS), a set of 15 voluntary guidelines designed to advance language access and cultural competence in healthcare. These standards include informing individuals of language assistance availability, ensuring the competence of individuals providing translation services, and providing written translation of key documents such as health consent and education documents. While the CLAS standards are not a binding federal regulation and therefore cannot be revoked by EO 14224, their adoption and implementation may decline as changes to federal language access policies reduce oversight, investment, and incentives for compliance.

The new memorandum recommends that federal agencies scale back the provision of language services, minimizing non-essential multilingual services, and recommends that agencies consider offering services exclusively in English. However, it does not require agency heads to amend, remove, or otherwise stop the production of documents, products, or other services prepared or offered in languages other than English. Despite these ongoing requirements, the new guidance signals that the DOJ will no longer treat a lack of multilingual services as discrimination, and that agencies are no longer required to implement wide-scale language access plans.

The EO and accompanying DOJ guidance apply only to federal government agencies and do not change existing language access requirements under laws like Title VI of the Civil Rights Act or Section 1557 of the ACA. Executive Orders cannot overturn existing statutes and regulations that go through formal revisions and public notice and comment processes. Title VI and Section 1557, which were issued by HHS, outline compliance measures that cannot unilaterally be changed by Executive Order. Entities that receive federal funding including state and local health departments, hospitals, insurance companies, clinics, and other health care providers remain legally obligated to provide meaningful language access under these laws. Under Section 1557 regulations, forms such as informed consent documents, intake forms, and discharge instructions are still required to be translated for individuals with LEP. Moreover, several states, including, New York, California, Hawaii, Maryland, and the District of Columbia, have state-level language access laws that remain in effect. However, the reduction in federal oversight, and granting agencies the ability to decide how and when to offer services in languages other than English, including at HHS and the DOJ, may create uncertainty about implementation and compliance practices, and reduce the availability of federal resources for providing language access services. Enforcement is also likely to shift since the DOJ has narrowed its interpretation of Title VI, indicating that it will no longer pursue enforcement based on disparate impact claims related to language access, instead, it will now focus on cases involving intentional discrimination. This change in enforcement could impact accountability measures and ultimately weaken protections for individuals with LEP.

Who is Likely to Be Affected by Reductions in Language Access Services?

Over 27 million people in the U.S. have LEP and may be affected by decreased access to language access services, with disproportionate impacts on Asian and Hispanic people, immigrants, and people with lower incomes. Data from the 2023 ACS show that 9% of the population ages 5 and older, or 27.3 million individuals, have LEP (defined as speaking a language other than English at home and speaking English less than very well). Asian (30%) and Hispanic people (29%), immigrants (47%), and those with incomes under $40,000 per year (13%) are disproportionately more likely to have LEP than the overall population (Figure 1). Decreased access to language assistance services comes at a time when immigrants are facing other barriers to accessing health care and other services, including increased immigration-related fears and more limited eligibility for health care coverage and other services.

Hispanic and Asian People, Immigrants, and Those With Lower Incomes are More Likely to Have Limited English Proficiency (Bar Chart)

Decreased access to language assistance services would have greater effects in some states, since there are wide variations in the shares of people with LEP across states (Figure 2). The share of people ages 5 and older with LEP ranges from less than 1% in West Virginia to 18% in California. New York (14%), New Jersey (14%), Texas (13%), and Florida (13%) also have relatively high shares of individuals with LEP, likely reflecting larger numbers of immigrants residing in those states.

The Shares of People with Limited English Proficiency Vary Across States (Choropleth map)

Language access services have important implications for health and health care. People with LEP face challenges and barriers to accessing high-quality health care. Language barriers between providers and patients can reduce the quality of care and increase the risk of adverse outcomes or medical errors. Studies have found that a lack of language assistance often delays patients’ access to timely care, leading to poor chronic disease management and resulting in worse health outcomes. Despite existing language access requirements, KFF survey data find that around half (48%) of adults with LEP have encountered at least one language barrier in a health care setting within the past three years, such as difficulty filling out forms for a health care provider (34%), communicating with office staff at a doctor’s office or clinic (33%), understanding instructions given by a doctor or health care provider (30%), filling a prescription or understanding how to use it (27%), or scheduling a medical appointment (25%) (Figure 3). Among adults with LEP, one in five reported experiencing at least one of several negative experiences with a health care provider in the past three years, including a provider ignoring a direct request or question (11%), assuming something about them without asking (8%), suggesting they were personally to blame for a health problem (8%), or refusing to prescribe needed pain medication they thought they needed (8%).

About a Half of Adults With Limited English Proficiency Say They Have Faced Language Barriers When Seeking Health Care (Bar Chart)

Reductions in requirements for federal agencies to provide language access services may create new challenges for health care and other service providers. If federal agencies reduce language access guidance and requirements, providers will have fewer translated materials to rely on, such as consent documents and health education materials. This can also create inconsistencies in the quality and accuracy of materials across the health care landscape. Community health centers (CHCs) and other safety net providers may be disproportionately impacted by the reduced availability of federal language access resources as they are disproportionately likely to serve individuals with LEP and those with lower incomes. Federal cuts have already eliminated funding for community workers who help people who speak other languages navigate and sign up for health insurance coverage. Moreover, given differences between the new guidance and other laws that remain in place, providers may have questions or confusion about when translation services are required, compliance risks, and how comprehensive services must be.