5 Key Facts About Medicaid Eligibility for Seniors and People with Disabilities

Published: Feb 7, 2025

Options under consideration in Congress to reduce Medicaid spending by nearly one-third in future years could have major implications for seniors and people with disabilities. Nearly 1 in 4 Medicaid enrollees are eligible for the program because they are ages 65 and older or have a disability, and they have higher per-enrollee costs than other enrollees. Within this group, there are multiple eligibility pathways, most of which are optional for states to cover, and all of which have more complex eligibility requirements than coverage for children and non-elderly adults. Proposals to limit federal spending on Medicaid may create incentives for states to drop or reduce their eligibility or coverage for seniors and people with disabilities in response to fewer federal revenues. Loss of Medicaid coverage poses unique challenges for seniors and people with disabilities, people who are likely to live on fixed incomes, have high health care spending, and rely on Medicaid for coverage of long-term care.

Considering the proposed reductions in Medicaid spending, this issue brief describes Medicaid eligibility pathways, enrollment, and spending among people eligible through the age and disability-related pathways (known as “non-MAGI” pathways because they do not determine eligibility based on Modified Adjusted Gross Income, as is the case for people covered under the Affordable Care Act Medicaid expansion and other groups). This analysis uses the most recent data available to KFF at the time of the analysis (Medicaid T-MSIS data, 2021, see Methods).

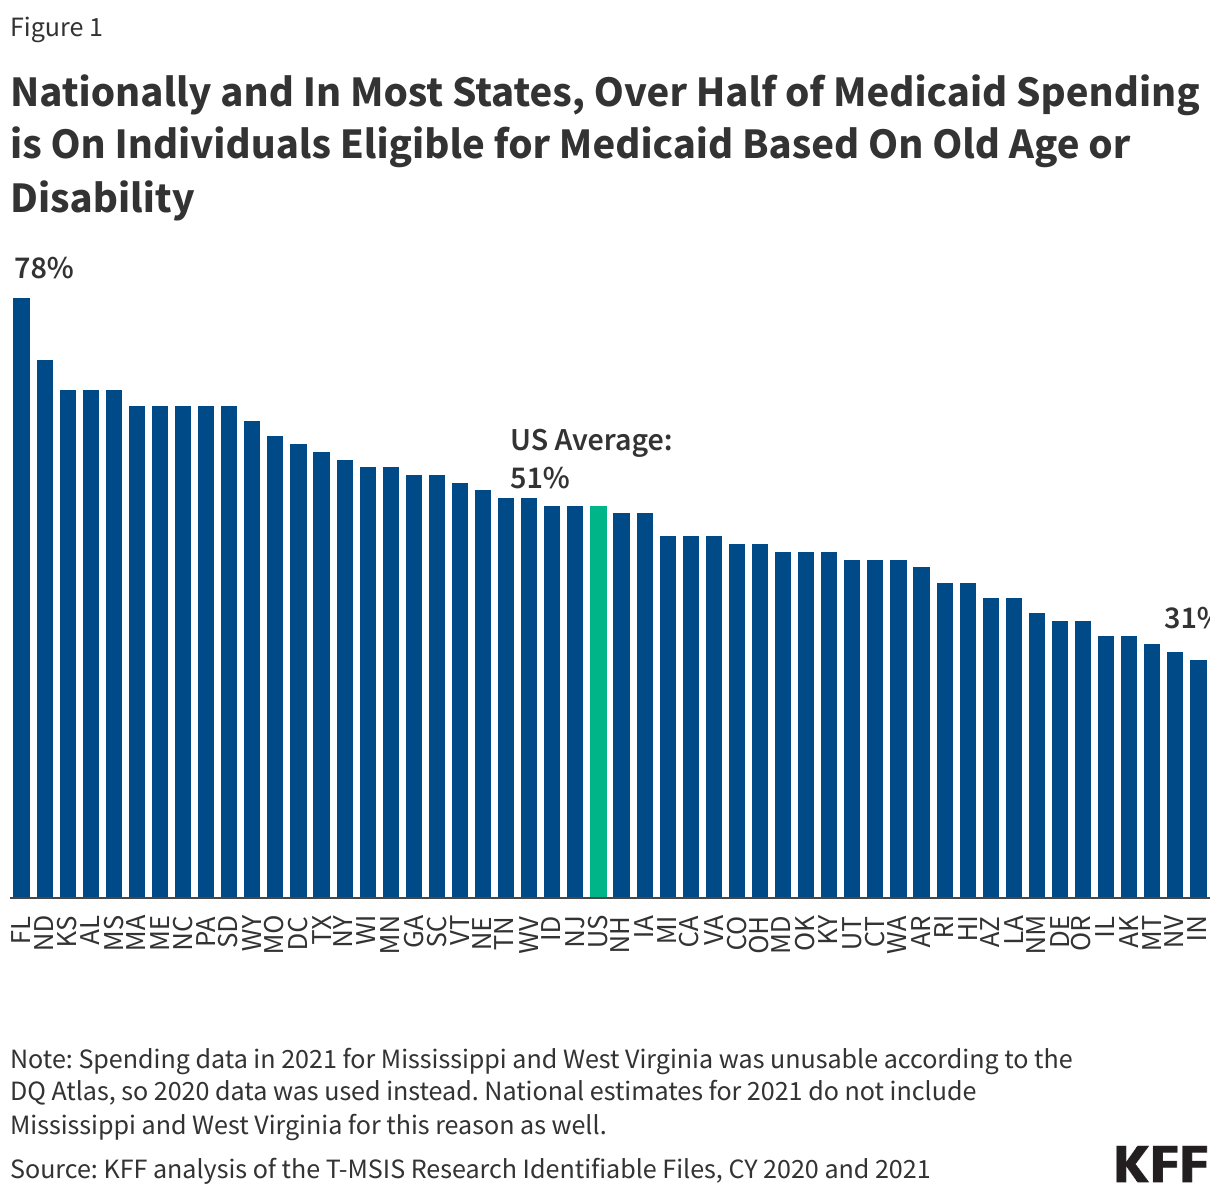
1.  Over half of Medicaid spending is on people eligible for Medicaid because of old age or disability.

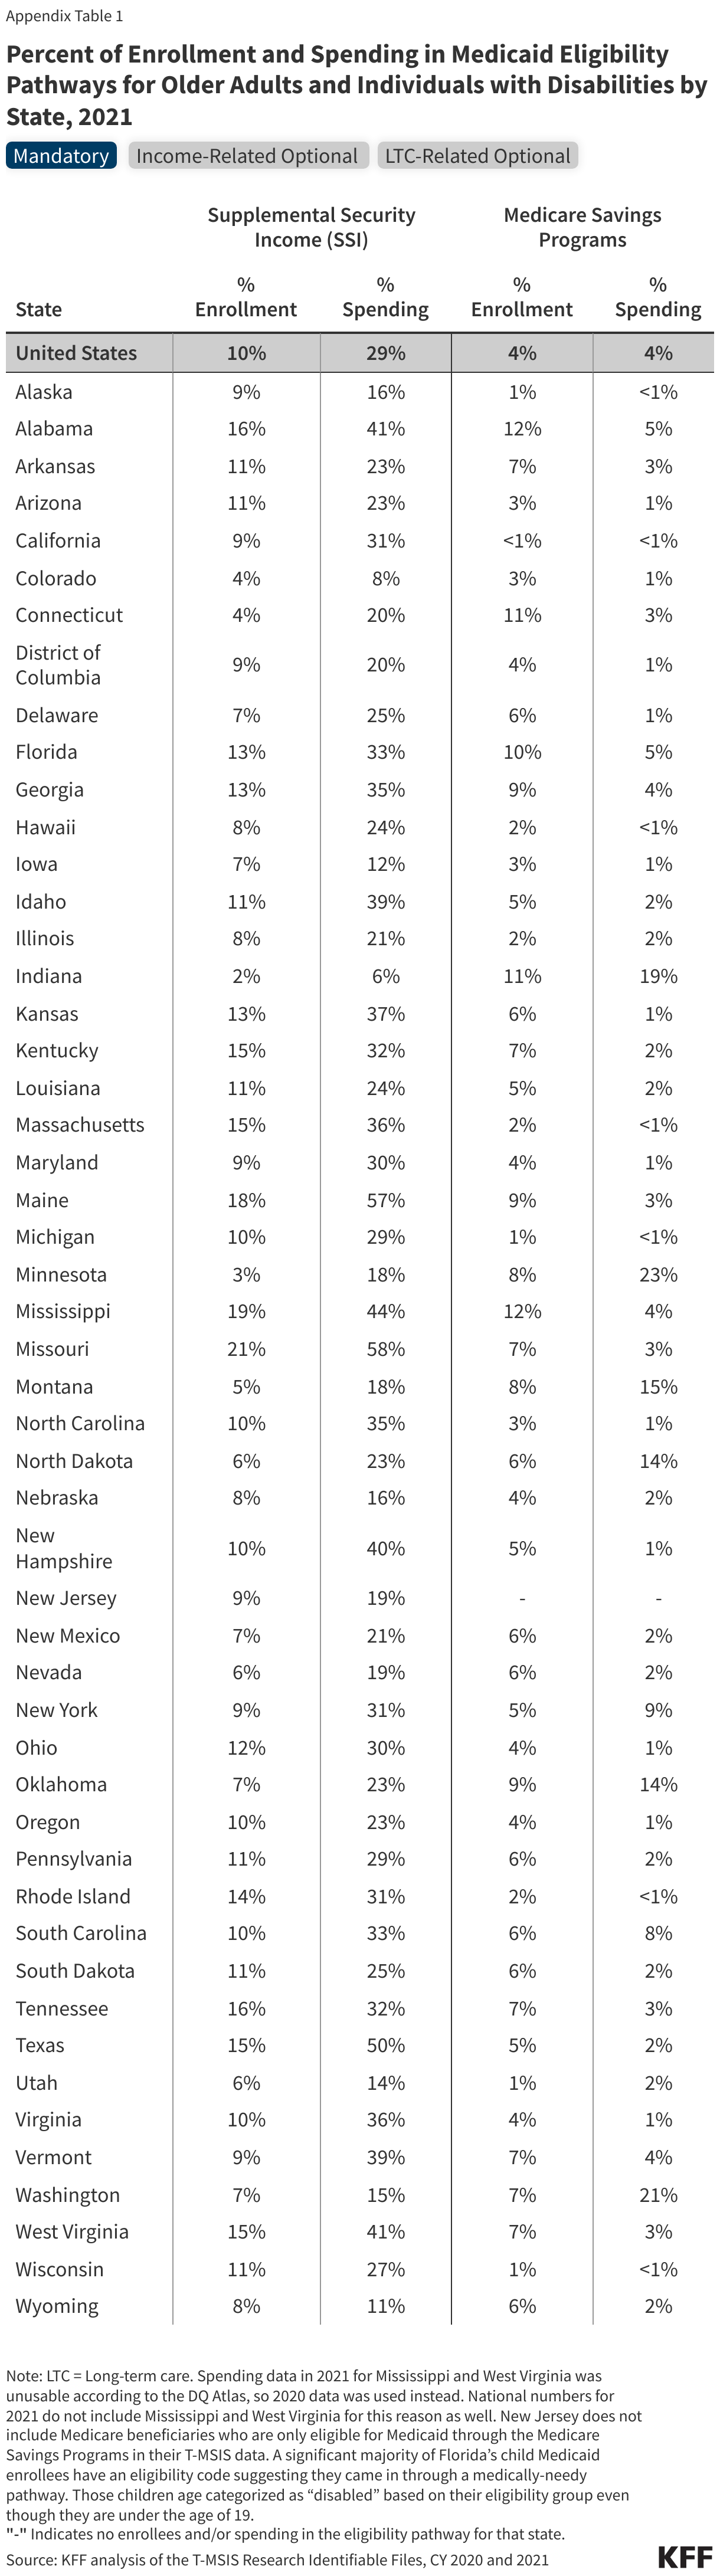
Over half of Medicaid spending ($339 billion in 2021) pays for care for people eligible through the non-MAGI pathways (Figure 1). Seniors and people with disabilities often have higher health care costs than other enrollees due to more complex health care needs, higher rates of chronic conditions and being more likely to utilize long-term care. There is significant state variation in the percentage of Medicaid spending that pays for non-MAGI enrollees (Appendix Table 1). In some states (Alaska, Nevada, Montana, Illinois and Indiana), only a third of spending went to these populations, and in five states (Alabama, Florida, Kansas, Mississippi, and North Dakota), care for seniors and people with disabilities accounted for at least two-thirds of spending (Figure 1). Differences in the percentage of spending across the states stem from differences in eligibility criteria for both MAGI and non-MAGI eligibility pathways, which also affects relative levels of enrollment in these pathways, as well as demographic variation across states.

Nationally and In Most States, Over Half of Medicaid Spending is On Individuals Eligible for Medicaid Based On Old Age or Disability

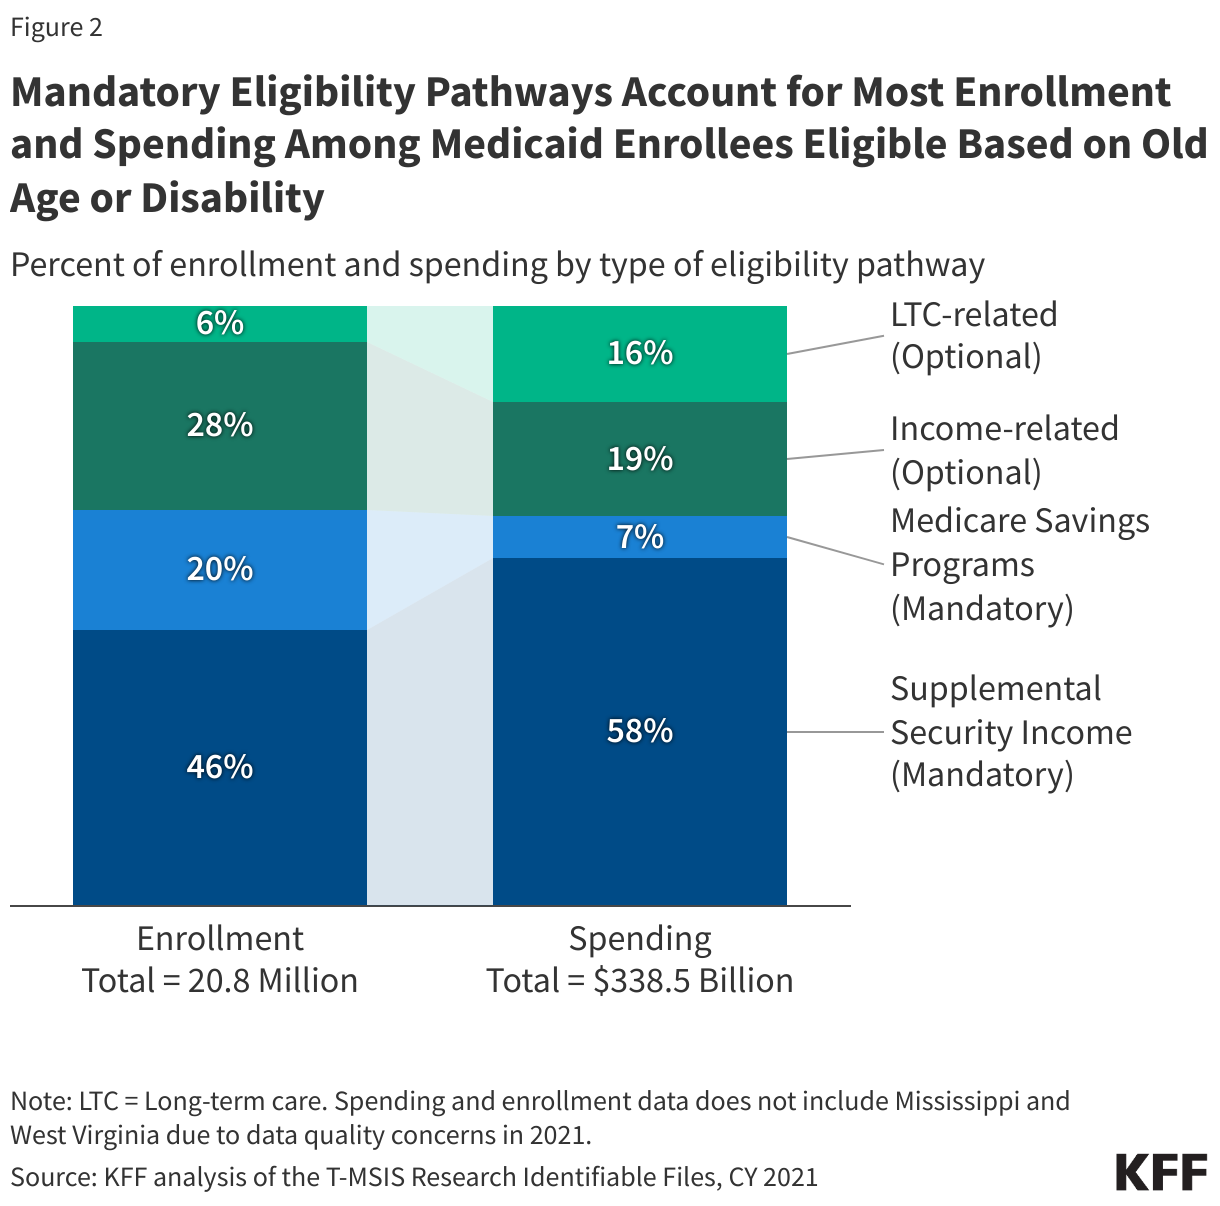
2.  Most non-MAGI Medicaid enrollees are eligible through mandatory eligibility pathways that are tied to Medicare and Supplemental Security Income.

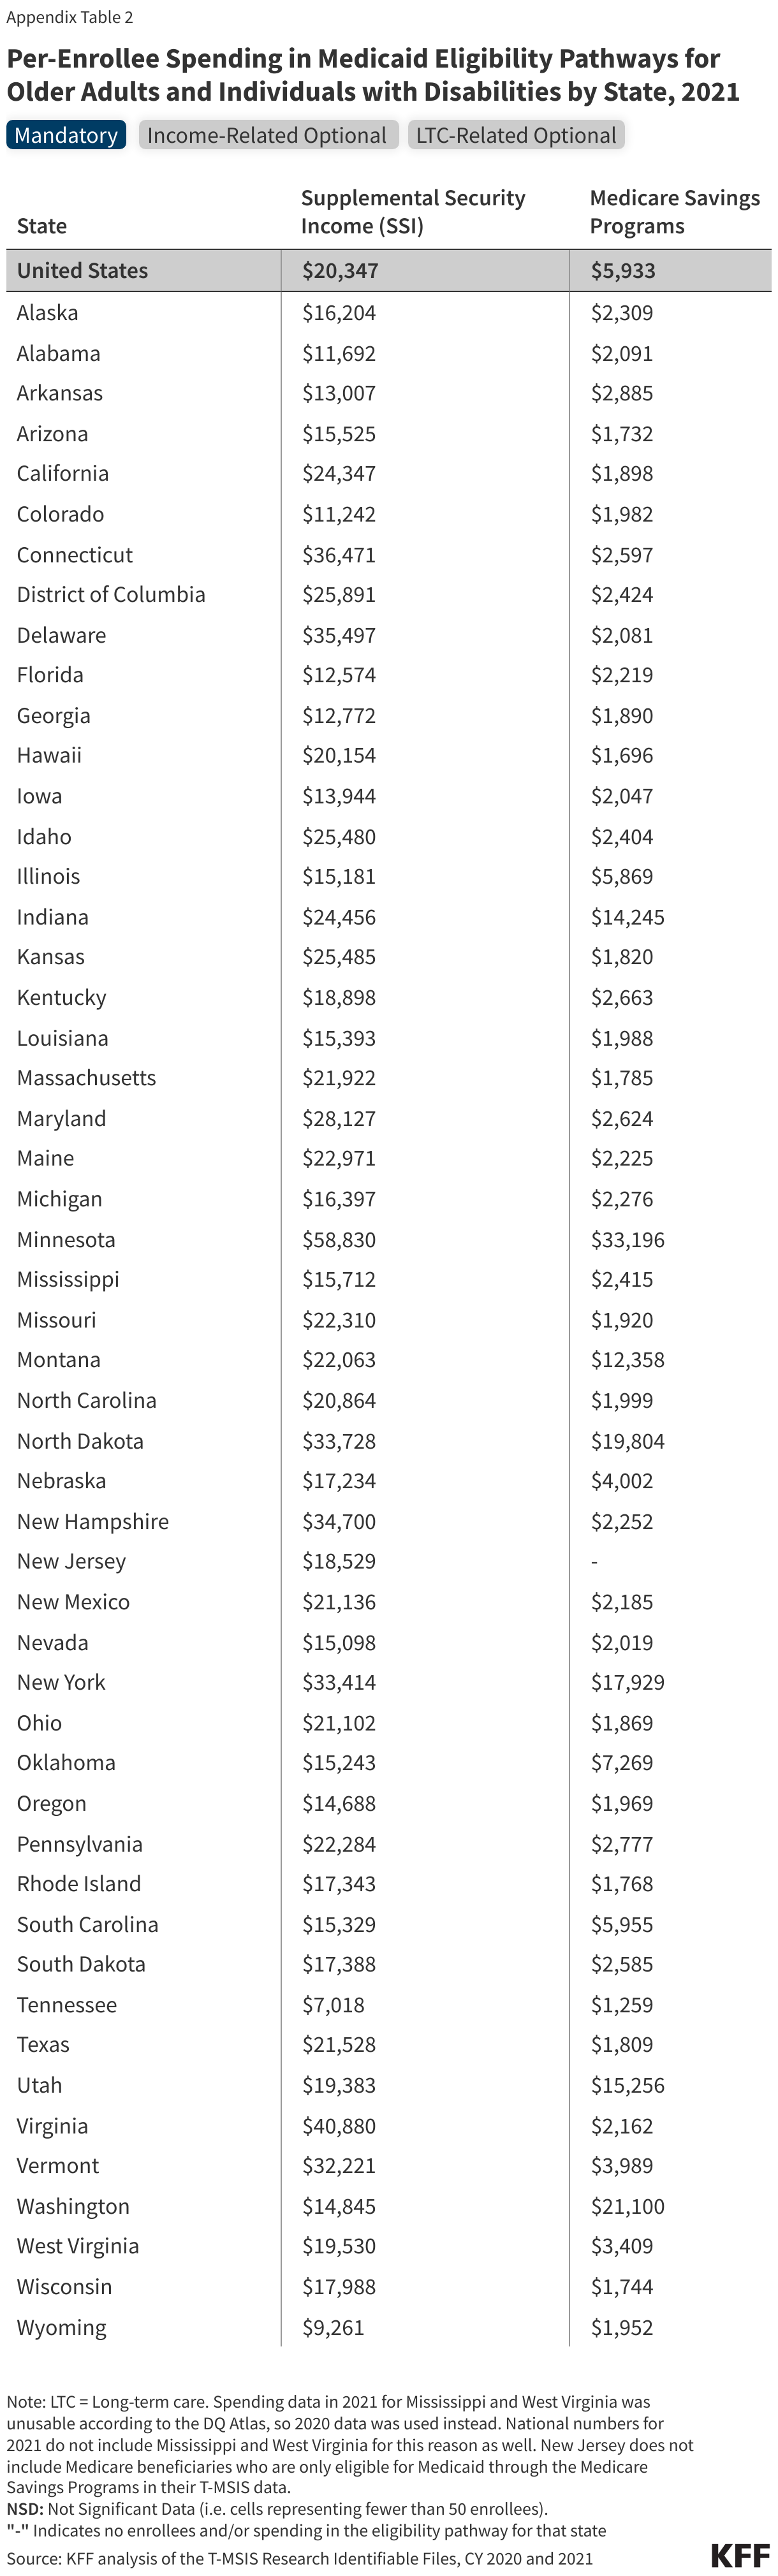
Federal statutes require states to enroll people who receive Supplemental Security Income (SSI) in Medicaid and to enroll eligible Medicare beneficiaries in the Medicare Savings Programs. SSI is a disability program that provides monthly income to people who are unable to work on account of a disability and who have income and financial resources below federal limits. The Medicare Savings Programs provide Medicaid coverage of Medicare premiums and in most cases, cost sharing to Medicare beneficiaries with limited financial resources. People who are eligible for the Medicare Savings Programs, but not full Medicaid, only receive Medicaid coverage for the costs of Medicare premiums and usually, cost sharing. Beyond these two “mandatory” eligibility pathways, there are optional Medicaid eligibility pathways that states may choose to offer for people who have disabilities or are ages 65 and older, including options to expand coverage beyond what is required under federal law to low-income seniors and people with disabilities and coverage for people who need long-term care.

Roughly two-thirds of Medicaid enrollees who qualify based on old age or disability are eligible for Medicaid through a mandatory pathway and those enrollees account for about two-thirds of Medicaid spending on non-MAGI enrollees (Figure 2). The remaining third of enrollees includes people coming in through optional income-related pathways (28% of all non-MAGI enrollees and 19% of spending) and those coming in on account of their need for long-term care (6% of enrollees, 16% of spending).

Mandatory Eligibility Pathways Account for Most Enrollment and Spending Among Medicaid Enrollees Eligible Based on Old Age or Disability

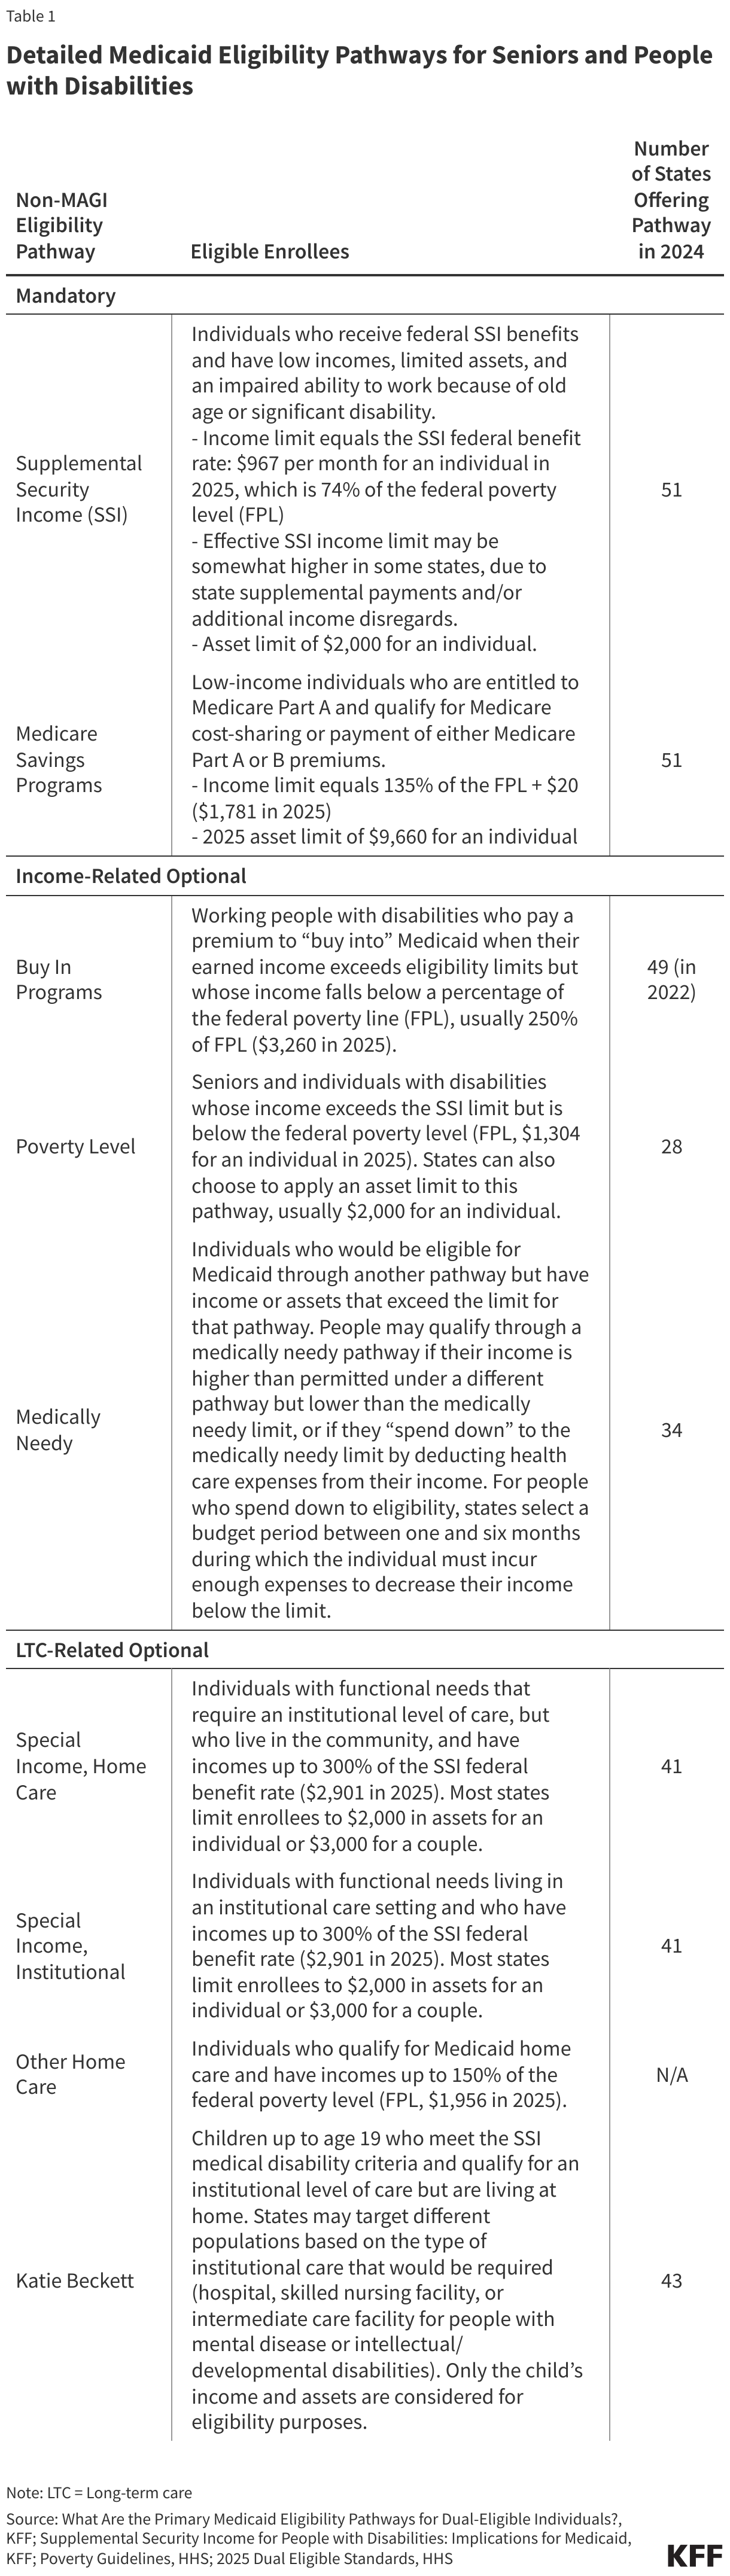
Most seniors and people with disabilities who are eligible for non-MAGI Medicaid must demonstrate limited financial resources and go through an application process that requires documentation of their income and savings (Table 1). States that offer eligibility based on long-term care have higher income eligibility criteria for those eligibility pathways, but nearly all still require applicants to demonstrate having limited savings ($2,000 for an individual, $3,000 for a couple). Some assets, including the home, are excluded from the calculation of financial resources, but states are required to recoup the certain Medicaid costs after enrollees die through a process known as estate recovery. States that offer eligibility for seniors and people with disabilities based on income, have income limits generally little more than the federal poverty level with similarly low thresholds for applicants’ savings; and most states have more complicated eligibility processes for non-MAGI pathways than they do for MAGI pathways.

Detailed Medicaid Eligibility Pathways for Seniors and People with Disabilities

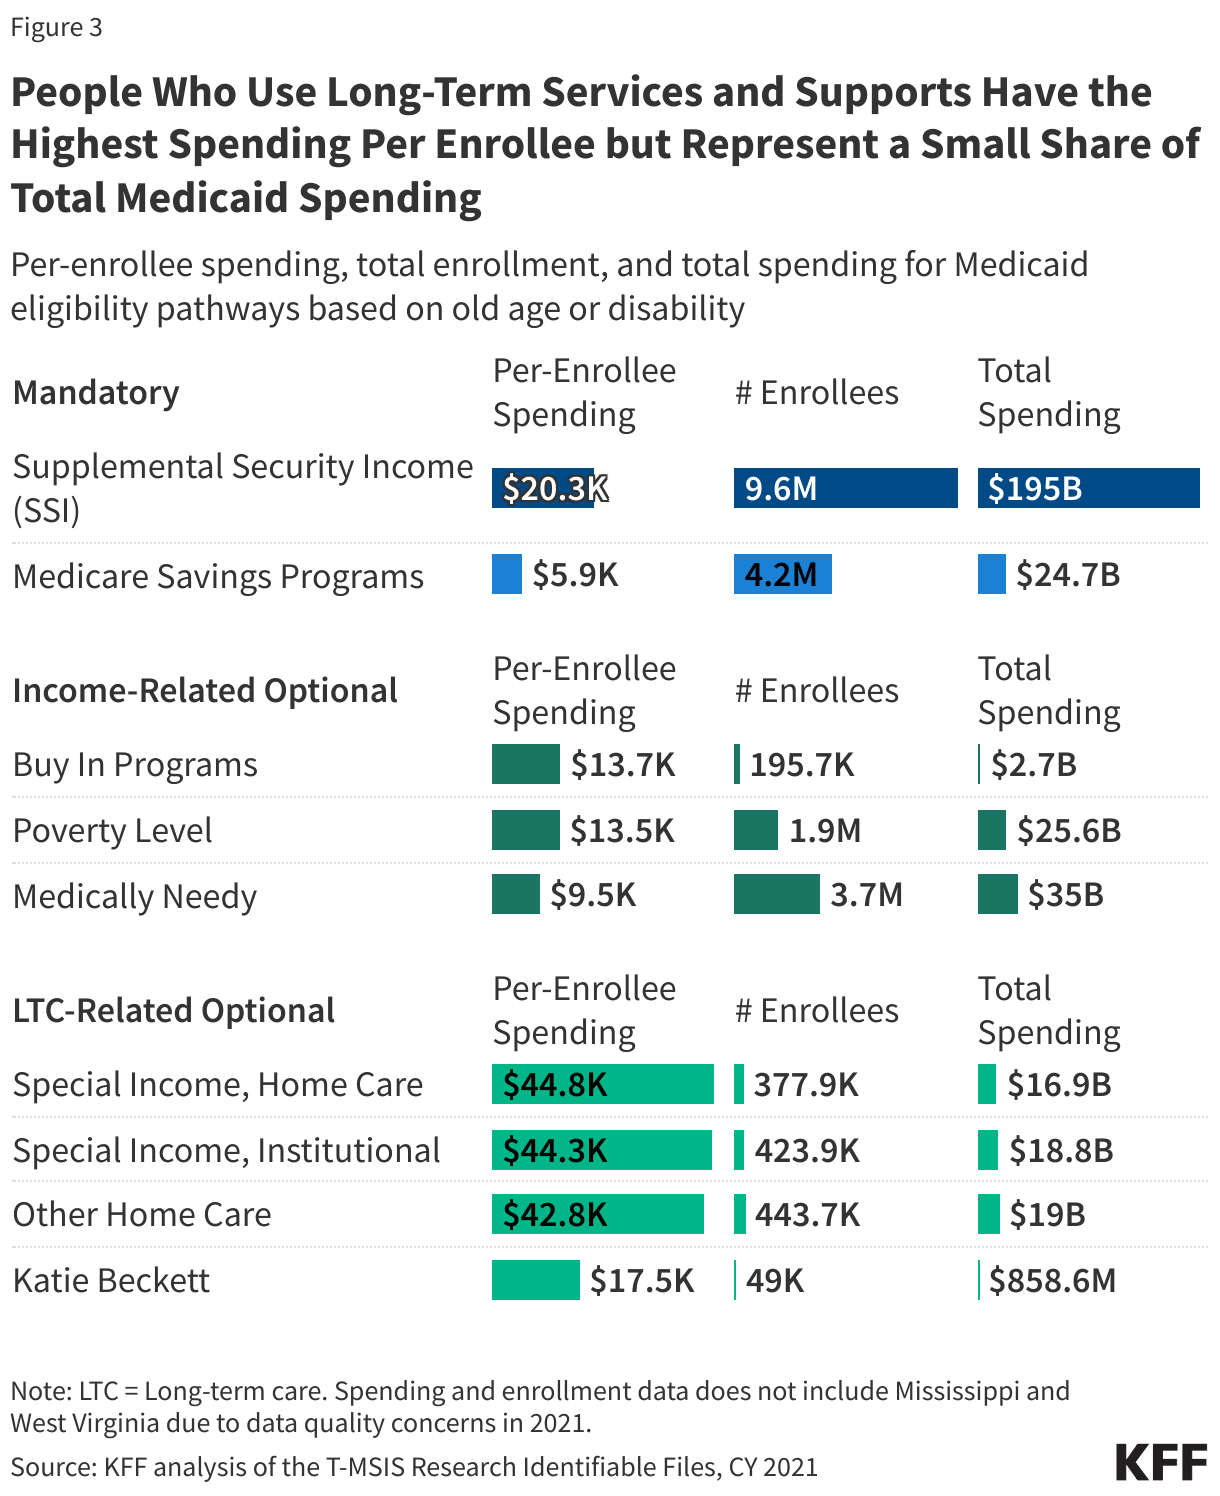
3.  Enrollees eligible because they need long-term care have much higher spending per enrollee.

Among the four eligibility pathways specifically for people who use long-term care, per-enrollee spending is over $40,000 per year for three of the pathways (Figure 3). Per-enrollee spending for children with disabilities enrolled through Katie Beckett programs (which include Family Opportunity Act options too) is more similar to that of other eligibility pathways for seniors and people with disabilities (close to $20,000 per year) because many of those children also have private health insurance. In such cases, Katie Beckett coverage helps lower- and middle-income families cover the costs of long-term care for children, which are very difficult to save for. Although per-enrollee costs for people eligible through the long-term care pathways are high, they still represent a small share of total Medicaid spending because the number of people enrolled is so low.

People Who Use Long-Term Services and Supports Have the Highest Spending Per Enrollee but Represent a Small Share of Total Medicaid Spending

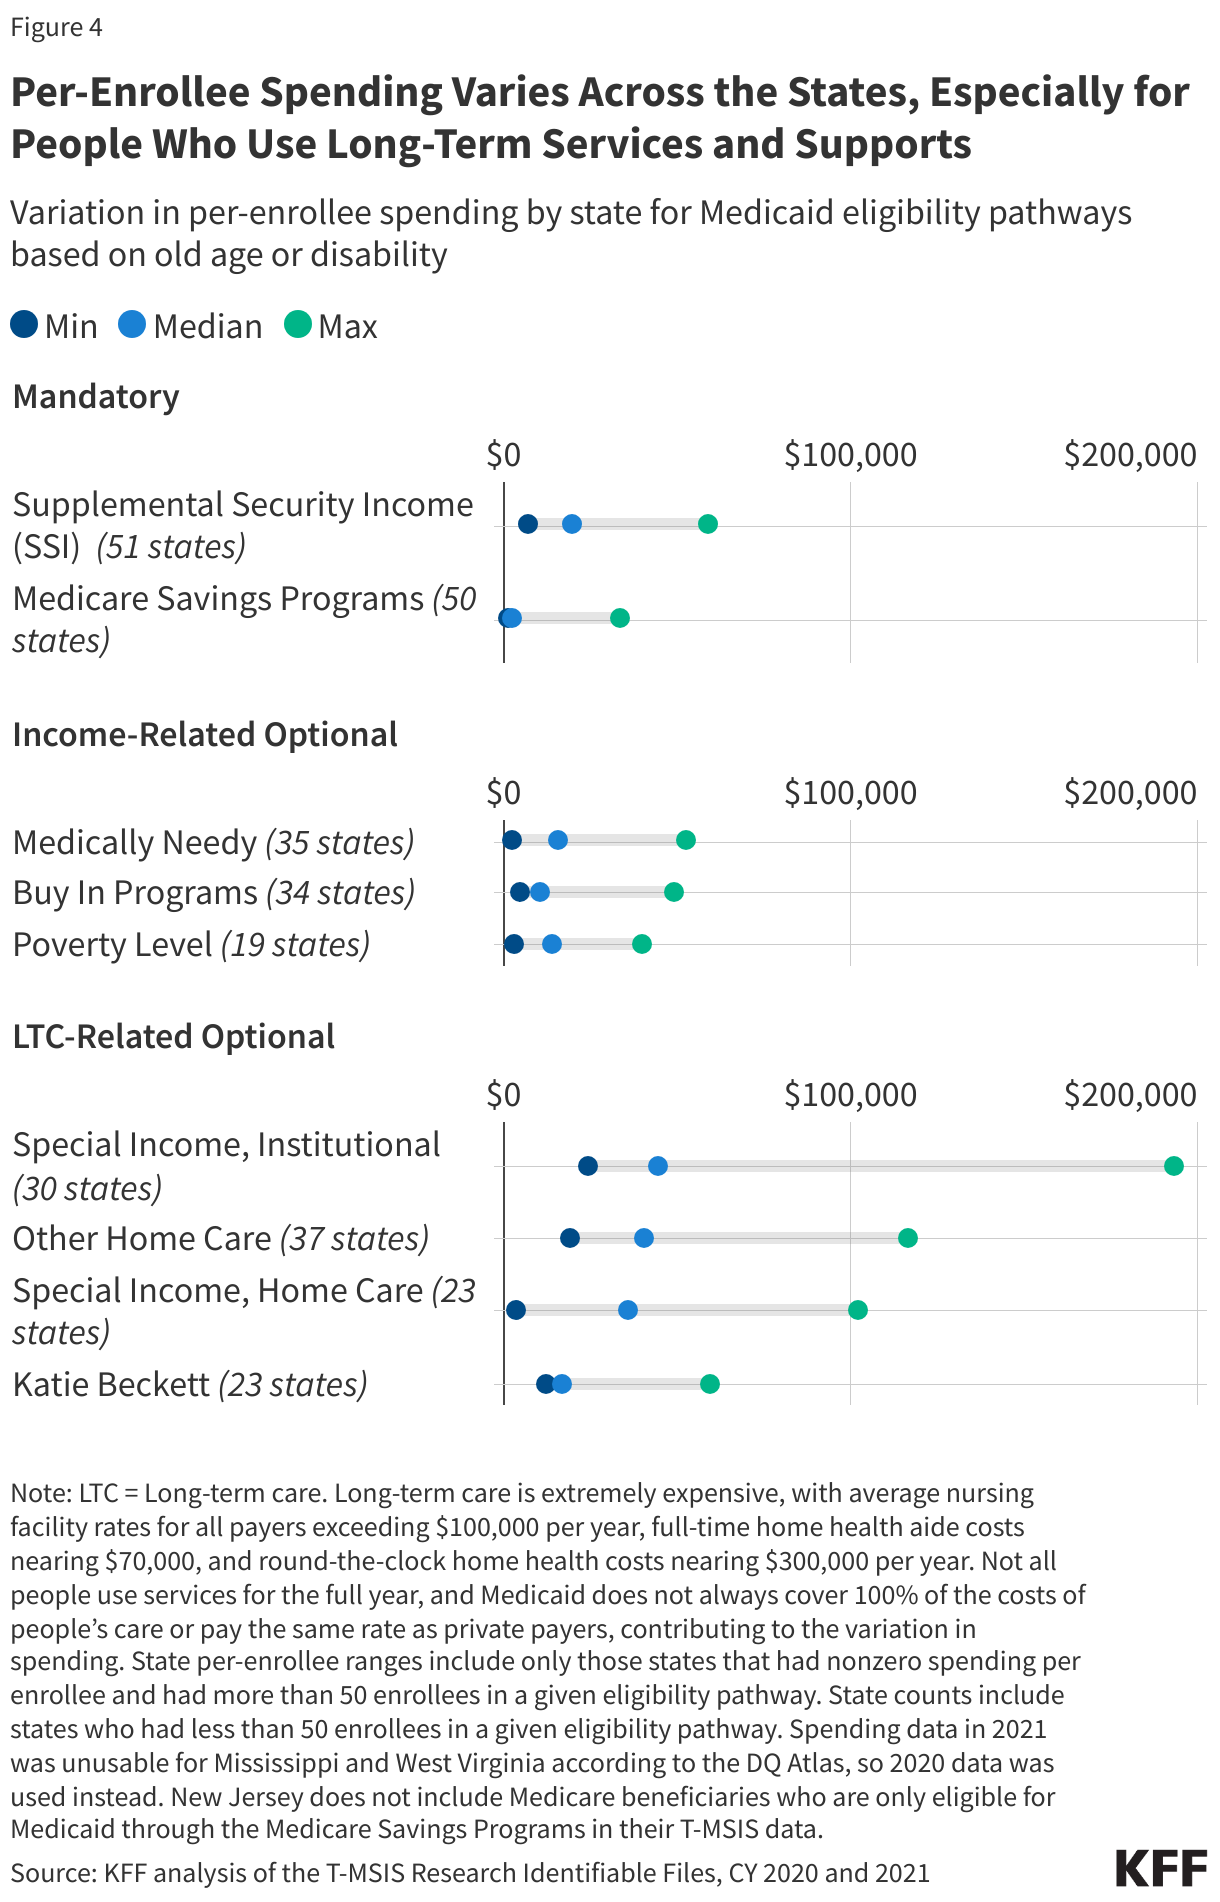
4.  Per-enrollee spending varies across states, especially for enrollees who use long-term care.

For mandatory and income-related optional eligibility pathways, per-enrollee spending (including all services) varies from under $2,000 per enrollee to over $33,000 per enrollee for the Medicare Savings Programs and nearly $60,000 per enrollee for the SSI eligibility pathway (Figure 4). As large as that variation is, variation for the long-term care-related pathways is far greater: Variation in per-enrollee spending for people who use institutional care ranges from $24,000 to nearly $200,000 per year in Alaska. For people eligible through one of the two home care programs, per-enrollee spending ranges from about $3,000 to well over $100,000. in Washington, D.C. (Appendix Table 2).

The large variation in spending among the long-term care related pathways reflects states having considerable flexibility in determining who is eligible to receive optional benefits, what services to provide, and how much to pay providers. Long-term care is extremely expensive, with average nursing facility rates for all payers exceeding $100,000 per year, full-time home health aide costs nearing $70,000, and round-the-clock home health costs nearing $300,000 per year. Not all people use services for the full year, and Medicaid does not always cover 100% of the costs of people’s care or pay the same rate as private payers, contributing to the variation in spending. There is little information about how much states pay providers, but a KFF survey about payment rates for home care showed significant variation among states able to report. The Biden Administration finalized regulations that would require states to report payment rates for Medicaid, but Congress or the Trump administration may seek to undo that rule.

Per-Enrollee Spending Varies Across the States, Especially for People Who Use Long-Term Services and Supports

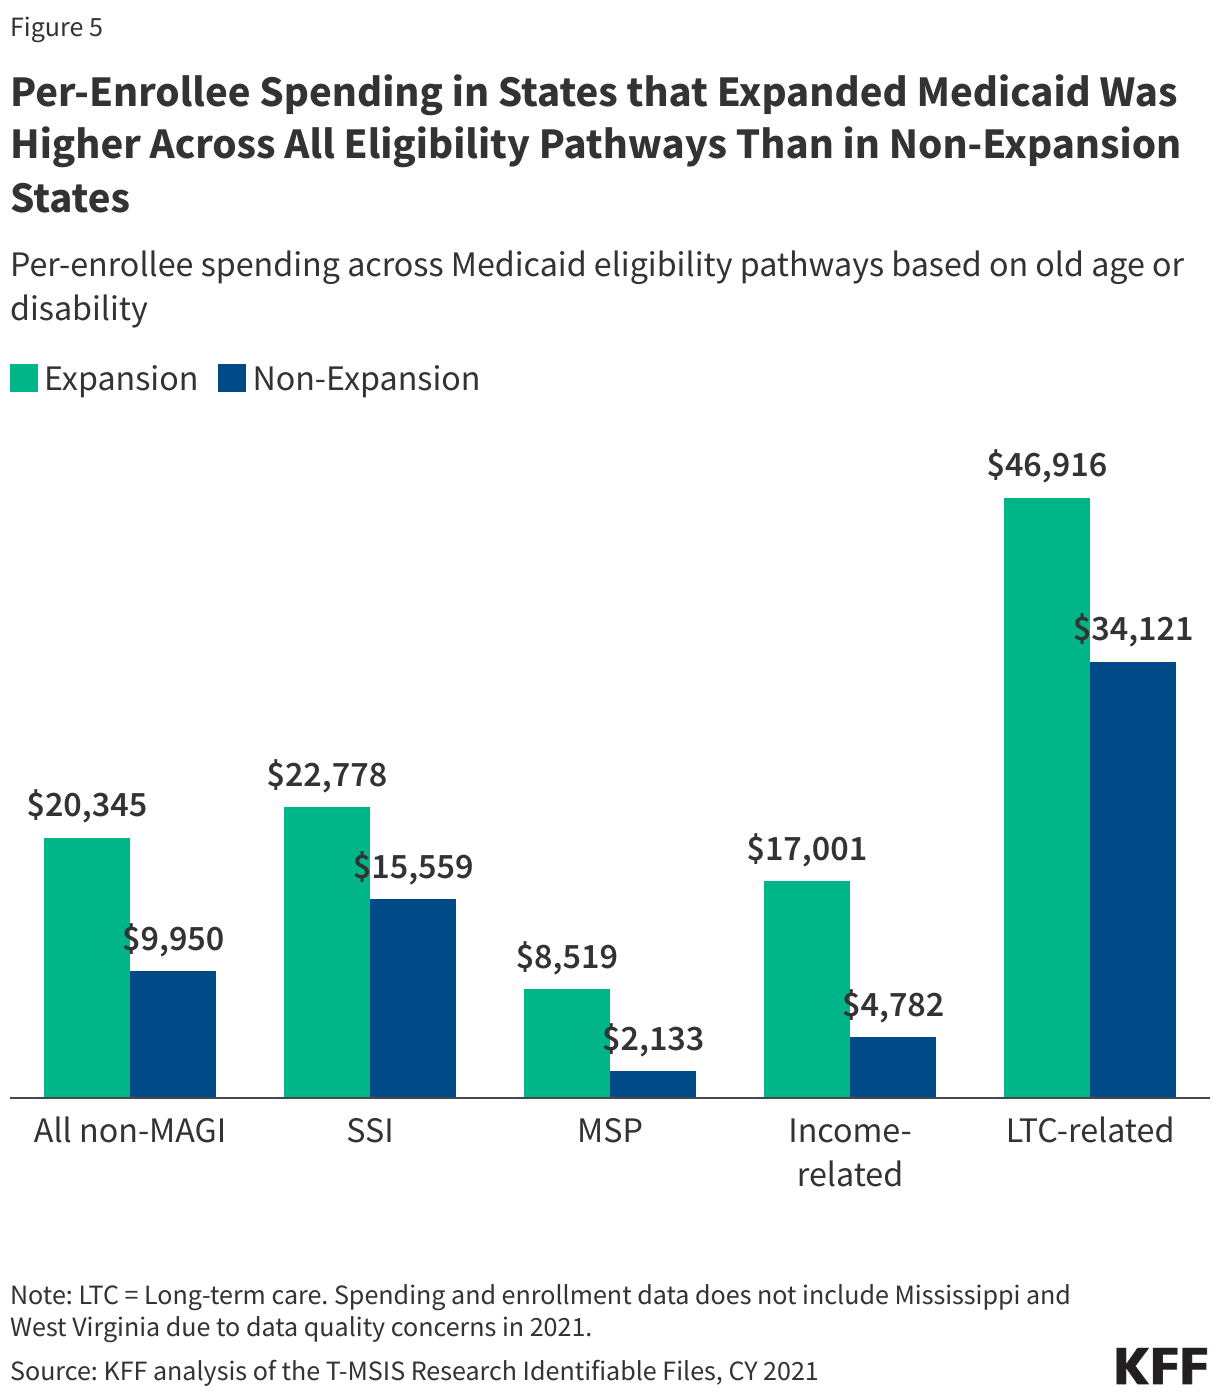
5.  Across all non-MAGI eligibility pathways, per-enrollee spending is higher in ACA expansion states.

Although some researchers have criticized the ACA eligibility pathway as diverting resources away from Medicaid enrollees with disabilities, the data show per-enrollee spending for seniors and people with disabilities is two times larger in expansion states ($20,345 versus $9,950, Figure 5). The largest difference in per-enrollee spending stems from people eligible through optional income-related pathways, where spending is $17,000 per enrollee per year in expansion states but less than $5,000 per year in non-expansion states. Even in mandatory pathways, expansion states spent more per enrollee: Expansion states spent $6,386 more per enrollee eligible through the Medicare Savings Program pathway, and $7,219 more per enrollee through the SSI pathway.

Per-Enrollee Spending in States that Expanded Medicaid Was Higher Across All Eligibility Pathways Than in Non-Expansion States

Appendix Tables

Percent of Enrollment and Spending in Medicaid Eligibility Pathways for Older Adults and Individuals with Disabilities by State, 2021
Per-Enrollee Spending in Medicaid Eligibility Pathways for Older Adults and Individuals with Disabilities by State, 2021

Methods

Data: Data are from the 2021 and 2020 T-MSIS Research Identifiable Demographic-Eligibility and Claims Files (T-MSIS data). This analysis includes all Medicaid-eligible enrollees, with either full or partial benefits.

State Inclusion Criteria: National estimates include enrollees living in 48 states and DC and exclude residents in the U.S. territories. West Virginia and Mississippi enrollees were not included in the national estimates due to unusable data in 2021, according to the DQ Atlas. However, their reported state-level data in figures 1 and 4, and in the appendix tables, was calculated using 2020 T-MSIS data.

Medicaid non-MAGI eligibility pathways:  Eligibility pathways for older adults and individuals with disabilities were identified using ELGBLTY_GRP_CD_LTST in the T-MSIS demographic-eligibility file.

Eligibility pathways for older adults and individuals with disabilities:

Supplemental Security Income (SSI) with values of 11-22, 37, 38, 40, 41

Medicare Savings Program (MSP) with values of 23-26.

Buy In Programs with values of 47, 48, 49.

Poverty Level with values of 46.

Medically Needy with values of 53-56, 59, 60.

Other Home Care with values of 39, 43, 51.

Special Income, Institutional with a value of 42.

Special Income, Home Care with a value of 52.

Katie Beckett with values of 45, 50.

Missingness: Approximately 0.36% (N=334,091) of Medicaid enrollees were missing a value for ELGBLTY_GRP_CD_LTST, representing 0.29% ($1.9 billion) of Medicaid spending, and were thus not included in this analysis.

Spending: Spending was calculated by summing the total Medicaid paid amount on all claims for each Medicaid-eligible enrollee with the desired ELGBLTY_GRP_CD_LTST code in the T-MSIS claims files.

Potential Impacts of Mass Detention and Deportation Efforts on the Health and Well-Being of Immigrant Families

Published: Feb 6, 2025

President Trump has made a slew of immigration policy changes focused on restricting entry at the border and increasing interior enforcement efforts to support mass deportation. These include rescinding protections against enforcement action in previously protected areas such as health care facilities and schools. While many of these actions focus on the estimated 11 million undocumented immigrants in the U.S., they will have ripple effects among the much larger number of people in immigrant families, including millions of U.S.-born citizen children. During the first Trump administration, restrictive immigration policies and increased enforcement activity led to increased fears among immigrant families across immigration statuses that had negative effects on health and well-being, employment, and daily life. They also could lead to family separations as well as mass detentions, which can have negative mental and physical health impacts on immigrants across statuses and their children. Mass deportations also could negatively impact the U.S. economy and workforce, given the role immigrants play, particularly in certain industries, including health care.

The extent to which President Trump will be able to carry out his plans without additional legislative action and in the face of potential court challenges remains uncertain. However, these plans are already affecting immigrants’ daily lives and increasing fears, with Immigrations and Customs Enforcement (ICE) agents carrying out raids across communities, and reports of nearly 1,000 people arrested in one recent day. This brief discusses the potential implications of increased enforcement actions under the Trump administration for the health and well-being of families and potential broader impacts for communities, the workforce, and the economy, including health care.

What actions is President Trump taking to increase interior enforcement and who may be affected?

Upon taking office, President Trump issued a series of executive orders focused on restricting immigration and increasing interior enforcement activity. These include orders limiting birthright citizenship, declaring a national emergency at the Southern border and restricting access at the border, expanding enforcement policies, suspending the refugee admissions program, and rescinding numerous Biden-era policies, including a policy that protected against enforcement in “sensitive areas,” including schools and health care facilities. Many of the changes outlined in the orders may require legislative or regulatory action to implement, and many are likely to be challenged in court. For example, a federal judge has already blocked the order to end birthright citizenship through a temporary restraining order. However, these changes are already increasing fears and uncertainty among families and communities. Other changes may put other groups with lawful status at risk of losing protections, including Deferred Action for Childhood Arrivals (DACA) recipients and people with Temporary Protected Status (TPS) designations from some countries. The administration recently revoked TPS for Venezuelans living in the U.S., which will make them at risk for deportation in coming months and eliminate their work authorizations.

While enforcement actions are focused on undocumented immigrants, they will have ripple effects across millions more people living in immigrant families, including U.S.-born citizen children. As of 2023, there were 47.1 million immigrants residing in the U.S., including 22.4 million noncitizen immigrants, of whom an estimated 11 million are undocumented. Additional immigrants that currently have lawful statuses may be at risk for enforcement actions under new policies if they lose protections, including nearly 1.2 million immigrants who either have or are eligible for TPS, the over 530,000 active DACA recipients, and individuals in the U.S. with pending asylum cases. Millions of additional individuals living in immigrant families also are likely to be impacted. Many undocumented immigrants live in families with mixed immigration statuses that may include people with lawful status and U.S. citizens. As of 2023, 19 million, or one in four, children in the U.S. had an immigrant parent, including one in ten (12%) who are citizen children with a noncitizen parent. An estimated 4.4 million U.S.-born children live with an undocumented immigrant parent.

What are the likely impacts of enhanced enforcement activity on the health and well-being of immigrant families?

Prior KFF focus groups with immigrant families during the first Trump administration found that restrictive immigration policies, including increases in detention and deportation, led to increased fears among immigrant families across immigration statuses that had negative effects on health and well-being. Immigrant families, including those with lawful status, reported experiencing resounding levels of fear and uncertainty. Some also reported changes in daily life such as increased difficulty finding employment, leading to increased financial strains on families. Some parents, particularly those who are undocumented or who have an undocumented family member, said they would only leave the house when necessary, such as for work; limit driving; or no longer participate in recreational activities, leading to children spending many hours inside. Parents and pediatricians reported a broad array of impacts of increased fears among children, including behavioral changes, such as problems sleeping and eating; psychosomatic symptoms, such as headaches and stomachaches; and mental health issues, such as depression and anxiety. Parents and pediatricians also felt that fears negatively affected children’s behavior and performance in school. Pediatricians expressed significant concerns about the long-term health consequences of these fears for children, including the damaging effects of toxic stress on physical and mental health over the lifespan, negative effects on children’s growth and development, and compounding social and environmental challenges that negatively impact health.

Increased fears under the first Trump Administration also led to growing reluctance among some families, including lawfully present immigrants and citizen children, about participating in programs and seeking services for which they are eligible, including health coverage and care. In KFF focus groups with immigrant families during the first Trump administration, parents noted that they highly prioritize their children’s health and generally viewed hospitals and doctors’ offices as safe spaces. However, there were some reports of changes in health care use, including decreased use of some care, and decreased participation in Medicaid and CHIP and other programs due to increased immigration-related fears. Despite efforts by the Biden administration to reduce these fears, data from the KFF/LA Times Survey of Immigrants showed that, as of 2023, nearly seven in ten (69%) likely undocumented immigrants, a third (33%) of lawfully present immigrants, and over one in ten (12%) naturalized citizen immigrants said they ever worried that they or a family member could be detained or deported. Moreover, about a quarter (27%) of likely undocumented immigrants and nearly one in ten (8%) lawfully present immigrants say they avoided applying for food, housing, or health care assistance in the past year due to immigration-related fears (Figure 1). Fears about accessing health care services may be enhanced under the second Trump administration, given the recission of a policy dating back to 2011, that protected against enforcement activity in sensitive areas, including health care facilities. Health care providers will face new challenges helping families feel safe accessing health care, protecting patient information, and establishing protocols to respond to potential encounters with ICE agents. Additionally, Florida and Texas have implemented policies that require hospitals to request immigration status from patients, which may further enhance fears about accessing care.

About A Quarter of Immigrants Who Are Likely Undocumented Say They Have Avoided Applying for Food, Housing, or Health Care Programs Due to Immigration-Related Fears

KFF interviews with individuals who had a family member detained or deported during the first Trump administration reported broad negative impacts on health and well-being. Respondents reported that detention and deportation of family members often occurred suddenly and unexpectedly, leaving families in shock and unprepared. One of the most immediate and significant effects on families was the loss of income, which left them struggling to pay their bills, including rent, food, and utilities. They further reported disruptions to children’s daily lives, and, in some cases, older children assuming new responsibilities and changing plans, such as no longer attending college, to support the family. Families also reported direct health impacts, including symptoms of depression and worsening chronic conditions. Some families reported losing health coverage and increased barriers to accessing coverage or care due to fears and increased financial challenges.

Other research shows that immigration enforcement raids and family separations can lead to worsened physical and mental health of both parents and children of deported parents. Exposing children to traumatic events and prolonged or toxic stress such as raids and separation from a parent disrupts a child’s healthy development and can result in short- and long-term negative effects on physical, mental, and behavioral health. Research has found that living near areas subject to immigration enforcement raids increased the risk of negative mental health among children of immigrants and worse birth outcomes among both Hispanic immigrant mothers as well as U.S.-born Hispanic mothers as compared to non-Hispanic White mothers. Education outcomes also worsened among Hispanic children in areas impacted by raids compared to White children. One potential consequence of raids and detentions and deportations is the separation of parents from their children. Studies have found that children and caregivers impacted by family separations experience worse mental health, including anxiety, depression, and posttraumatic stress disorder. Family separations can also lead to financial challenges for mixed-status households due to loss of income.

Prior experience suggests that immigrants held in detention facilities may not receive sufficient health care and face unsafe conditions. As the Trump administration escalates enforcement actions, the number of people held in detention facilities will grow likely beyond current capacity. Research showed that detainees, including children, experience poor conditions and inadequate care in detention facilities. An analysis found that most of the deaths of immigrants in detention occurred among “relatively young and healthy men” and were associated with ICE violating their own medical standards. Detention and solitary confinement can also worsen the mental health of immigrants. Studies show high levels of psychiatric distress, including depression and post-traumatic stress, among detained immigrants and their children, even after short detention periods. Research on immigrant detention centers have also found gaps in care for pregnant Hispanic migrants and that LGBT detainees experience higher rates of harassment than non-LGBT detainees.

What are the potential impacts of enhanced enforcement activity on the nation’s economy and workforce?

Mass deportations could also negatively impact the U.S. workforce, given the role immigrants play, particularly in certain industries, including health care. Most immigrants say they came to the U.S. for better work and educational opportunities. Immigrants and their U.S.-born children fill unmet labor market needs and have been the primary drivers of workforce growth, accounting for 83% of the growth in the U.S. labor force between 2010 and 2018. Research shows that immigration does not displace nor lead to more unemployment among U.S. born workers as they often do not compete for the same jobs. Immigrants and their adult children play outsized roles in certain occupations, including agriculture, construction, and health care (Figure 1). As the U.S. 65 and older population grows, deportation of immigrants may exacerbate the health care workforce shortage. Immigrants and their adult children make up a larger share of physicians, surgeons, and other health care practitioners than they do of the population and play a particularly large role as direct care workers in home and community-based settings.

Immigrant Adults and Adult Children of Immigrants Play an Outsized Role in the Health Care Workforce

Mass deportations may also reduce the billions of dollars immigrants, including undocumented immigrants, pay in federal, state, and local taxes, which help subsidize health care for U.S.-born citizens. It is estimated that more than a third of their tax dollars are payroll taxes that fund programs they cannot access, including Social Security, Medicare, and the federal share of unemployment insurance. Children of immigrants also contribute more in taxes on average than their parents or the rest of the U.S.-born population. The Congressional Budget Office (CBO) estimates that the recent immigration surge will reduce the federal deficit over the next decade. Research further finds that immigrants pay more into the health care system through taxes and health insurance premiums than they utilize, helping to subsidize health care for U.S.-born citizens. Earlier research found that without the contributions undocumented immigrants make to the Medicare Trust Fund, it would reach insolvency earlier, and that undocumented immigrants result in a net positive effect on the financial status of Social Security.

Expanding capacity to carry out mass deportations would likely be a significant cost to taxpayers and may require additional allocations by Congress. New estimates suggest that Trump’s plan to deport millions of undocumented immigrants could cost hundreds of billions of dollars. Trump’s selected border czar reported an estimated cost of $86 billion. Increases in enforcement activity would likely strain limited resources at ICE and the current system of detention centers, which is already at capacity. Expanding detention capacity to support large-scale deportations would require large investments in infrastructure, including setting up new detention facilities, expanding immigration court capacity, increasing the use of private contractors, and paying for more flights used for deportations.

U.S. Global Health Budget Figures

Published: Feb 4, 2025

This resource provides visualizations on the U.S. global health budget and will be updated as needed. Click through the table of contents to jump to different figures.

Table of Contents

  1. U.S. Global Health Funding as a Share of the Federal Budget
  2. U.S. is the Largest Donor of International Health Assistance
  3. Top 10 Donor Governments to International Health Assistance as a Share of Total Assistance
  4. U.S. Funding for Global Health, Trends Over Time
  5. U.S. Funding for Global Health, Request vs. Enacted Levels
  6. U.S. Global Health Funding (in millions), By Program Area
    1. U.S. Global Health Funding (in millions), By Program Area, FY 2024
    2. U.S. Global Health Funding (in millions), By Program Area, FY 2025 Request
  7. U.S. Global Health Funding Percent Change by Program Area, Request Compared to Enacted
  8. U.S. Funding for Global Health (in millions), Bilateral and Multilateral Share

1. U.S. Global Health Funding as a Share of the Federal Budget

U.S. Global Health Funding as a Share of the Federal Budget, FY 2024

(Back to top)

2. U.S. is the Largest Donor of International Health Assistance

U.S. was the Largest Donor of International Health Assistance in 2023

(Back to top)

3. Top 10 Donor Governments to International Health Assistance as a Share of Total Assistance

Donor Governments with the Largest Share of Development Assistance Directed to International Health

(Back to top)

4. U.S. Funding for Global Health, Trends Over Time

U.S. Funding for Global Health (in billions), FY 2006 - FY 2025 Request

(Back to top)

5. U.S. Funding for Global Health, Request vs. Enacted Levels

U.S. Funding for Global Health, Request vs. Enacted Levels, FY 2015 - FY 2024

(Back to top)

6. U.S. Global Health Funding (in millions), By Program Area

U.S. Global Health Funding (in millions), By Sector, FY 2024
U.S. Global Health Funding (in millions), By Sector, FY 2025 Request

(Back to top)

7. U.S. Global Health Funding Percent Change by Program Area, Request Compared to Enacted

U.S. Global Health Funding Percent Change by Program Area, FY 2025 Request Compared to FY 2024 Enacted

(Back to top)

8. U.S. Funding for Global Health, Bilateral and Multilateral Share

U.S. Global Health Funding (in millions), Bilateral and Multilateral Share, FY 2024

(Back to top)

A Look at Medicaid Enrollment and Finances of the Five Largest Medicaid Managed Care Plans

Published: Feb 4, 2025

Centene, CVS Health, Elevance, Molina, and UnitedHealth are the five largest publicly traded companies (also referred to as “parent” firms) operating Medicaid MCOs, accounting for half of Medicaid MCO enrollment nationally. During the unwinding of the pandemic-era Medicaid continuous enrollment provision, millions of people were disenrolled and states and plans have faced considerable rate setting uncertainty. Firms report current capitation rates do not align with higher member risk and utilization patterns, and many states have sought federal approval to adjust rates to address these shifts. As we look ahead, shifts in state fiscal conditions and talks in Congress about cutting federal Medicaid spending could result in the reductions in Medicaid funding with implications for coverage as well as plans and providers. While plans confront continued uncertainty looking ahead, plan attention and scrutiny has intensified in the aftermath of the killing of UnitedHealthcare’s CEO, Brian Thompson. Within this broad context, this brief examines enrollment and financial data through the end of September 2024 from quarterly company earnings reports and calls, financial filings, and other company materials as well as from national administrative data. Key findings include:

  • Medicaid enrollment. As of September 2024, combined Medicaid enrollment across the five firms was 6.2 million (or 20%) higher than enrollment at the start of the pandemic. However, Medicaid enrollment across the firms declined by more than 7 million since March 2023 (just before the “unwinding” began). Medicaid membership as a share of total medical membership has declined for all five firms.
  • Medicaid revenue and MLRs. While the three firms that reported Medicaid-specific revenues (Centene, Molina, and UnitedHealth) reported growth in Medicaid revenue in the first nine months of 2024 compared to the same period in 2023, the two firms that reported Medicaid medical loss ratios (MLRs) (percentage of premium revenue spent on medical care costs) reported higher Medicaid MLRs in 2024 (Q1-Q3) compared to 2023 (Q1-Q3), implying a potential decrease in profitability.
  • Member acuity and utilization trends. During Q3 2024 earnings calls, firms reported higher member acuity (i.e., average risk profile) due to unwinding redeterminations as well as increased utilization trends in 2024. Higher acuity could be related to a number of factors including that during the unwinding people with higher health care needs were less likely to be disenrolled. Firms say that the Medicaid rate updates they have received (from states) fall short of covering current acuity and cost trends. This could put upward pressure on Medicaid spending at a time when Congress may consider cuts in federal Medicaid contributions.

Medicaid enrollment in the five largest publicly traded companies operating Medicaid MCOs

Five for-profit, publicly traded companies – Centene, Elevance (formerly Anthem), UnitedHealth Group, Molina, and CVS Health – account for 50% of Medicaid MCO enrollment nationally (Figure 1). All five are ranked in the Fortune 500. Each company operates Medicaid MCOs in 14 or more states (Figure 2).

Five For-Profit, Publicly Traded Companies Have Half of the Medicaid MCO Market.
Five Firms Have a Wide Geographic Reach in Medicaid, Each With MCOs in 14 or More of the 41 MCO States.

All five firms also operate in the commercial and Medicare markets (Figure 3); however, the distribution of membership across markets varies across firms. Two firms – Molina and Centene – have historically focused predominantly on the Medicaid market. Medicaid members accounted for nearly 90% of Molina’s overall medical membership and about 60% of Centene’s medical membership as of September 2024 (Figure 3). Since March 2023 (just before unwinding began), Medicaid membership as a share of total medical membership has declined for all five firms, ranging from a decline of about 1 percentage point for UnitedHealth to 8 percentage points for Centene. The unwinding may have contributed to membership distribution shifts.

The Distribution of Medical Membership Across Markets Varies Across the Five Largest Publicly Traded Companies Operating Medicaid MCOs.

Despite a combined 7.3 million decline in enrollment during the unwinding, Medicaid enrollment across the five firms remains higher by 6.2 million (or 20%) compared to enrollment at the start of the pandemic (Figure 4). In comparison, national data show total Medicaid/CHIP enrollment in September 2024 was 11% higher than Medicaid/CHIP enrollment in February 2020, prior to the pandemic. These changes in “net” enrollment reflect the people who are dropped from Medicaid as well as those who newly enroll, and those who re-enroll within a short timeframe following disenrollment, also known as “churn.” Changes in parent firm enrollment also reflect activity including firm acquisitions or sales and new or lost Medicaid contracts.

Medicaid Enrollment Across the Five Firms Decreased by 7.3 Million Since the Start of the "Unwinding" but is 6.2 Million Higher Than at the Start of the Pandemic.

While some firms report growth in Medicaid revenue through the end of September 2024, other measures of financial performance (gross margins and medical loss ratios) show a potential decrease in profitability (Figure 5). Even accounting for enrollment declines due to the unwinding, the three firms that report Medicaid-specific financial information through Q3 (UnitedHealth, Molina, and Centene) reported growth in Medicaid revenue in the first nine months of 2024 compared to the same period in 2023. For the first nine months of 2024, medical margins (the amount by which premium revenue exceeds medical costs) earned by the Medicaid segment declined by 27% for Centene and 2% for Molina when compared to the same period in 2023, and Medicaid simple medical loss ratios (medical costs as a share of premium revenue) increased for Centene from 89.9% to 92.3% and for Molina from 88.5% to 90.3%, implying a potential decrease in profitability.

Medicaid Financial Performance as of Q3 2024

Impact of unwinding for the five largest publicly traded companies operating Medicaid MCOs

During Q3 2024 earnings calls, firms reported current capitation rates do not align with increased Medicaid medical cost trends. Capitation provides upfront fixed payments to plans for expected utilization of covered services, administrative costs, and profit (see Box 1). Plan capitation rates, usually for a 12-month rating period, are set using baseline utilization and cost data from prior periods (which can lag one to two years, to allow claims to complete) trended forward to determine per member per month payment amounts. States may also use different mechanisms to adjust plan risk (e.g., to ensure payments are not too high or too low), including risk-sharing arrangements (see Box 1). During Q3 2024 earnings calls, firms reported higher member acuity (i.e., average risk profile) due to unwinding redeterminations as well as increased utilization trends in 2024. Specifically, firms pointed to increased utilization of behavioral health care, pharmaceuticals (including GLP-1s), and long-term services and supports (LTSS).

A recent analysis conducted by Wakely, a consulting firm with actuarial expertise, highlights many states have recently implemented program changes to improve access to care (e.g., increasing provider rates, implementing limitations to prior authorization, etc.), which can affect utilization trends and put upward pressure on per person costs. Wakely notes that these program changes may be adding complexity to an “already challenging year for capitation rate setting.”

Parent firms expect the misalignment between rates and emerging acuity and cost/utilization trends is temporary but may extend through 2025. In a 2024 KFF survey of Medicaid directors, about two-thirds of responding MCO states reported seeking CMS approval for a capitation rate amendment to address shifts in the average risk profile (or “acuity”) of MCO members in FY 2024 and/or FY 2025. During earnings calls, firms say that the rate updates they have received fall short of covering current acuity and cost trends. Parent firms also report continuing discussions with states on adjustments to 2024 rates and on the development of 2025 rates (which often renew on January 1 or July 1). Centene and Elevance reported sharing current experience / trend data with states to inform these discussions.

Box 1: Medicaid Managed Care Capitation Rate Setting

MCOs are at financial risk for services covered under their contracts, receiving a per member per month “capitation” payment for these services. While plans set rates in the commercial and Medicare Advantage markets, Medicaid managed care rates are developed by states and their actuaries and reviewed and approved by CMS. Under federal law, payments to Medicaid MCOs must be actuarially sound. Actuarial soundness means that “the capitation rates are projected to provide for all reasonable, appropriate, and attainable costs that are required under the terms of the contract and for the operation of the managed care plan for the time period and the population covered under the terms of the contract.” Unlike fee-for-service, capitation provides upfront fixed payments to plans for expected utilization of covered services, administrative costs, and profit.

In developing actuarially sound rates, states must follow accepted actuarial methods and specific federal requirements outlined in regulations and other guidance. Plan rates, usually for a 12-month rating period (which typically run on a state fiscal year or a calendar year basis), are set using baseline utilization and cost data from prior periods (which can lag one to two years, to allow claims to complete). Baseline spending data is trended forward to determine per member per month payment amounts and must take into account/adjust for factors such as medical cost inflation, expected changes in utilization, and state Medicaid program changes (e.g., changes to eligibility, benefits, cost-sharing, FFS payment rate changes (if state bases managed care rates on FFS rates)).

States may use a variety of mechanisms to adjust plan risk, incentivize plan performance, and ensure payments are not too high or too low, including risk-sharing arrangements (including risk corridors), risk and acuity adjustments, medical loss ratios (MLRs, which reflect the proportion of total capitation payments received by an MCO spent on clinical services and quality improvement), or incentive and withhold arrangements. (Many states implemented pandemic-related “risk corridors” (where states and health plans agree to share profit or losses), allowing for the recoupment of funds.) Even if the risk mitigation strategies are in place, states may determine rate amendments are necessary if their actual experience differs significantly from the assumptions used for the initial certified rates.

The Status of President Trump’s Pause of Foreign Aid and Implications for PEPFAR and other Global Health Programs

Author: Jennifer Kates
Published: Feb 3, 2025

Starting on day one of his second term, President Trump began to issue several executive orders and other actions that affect global health. One was “Reevaluating and Realigning United States Foreign Aid” which calls for a 90-day pause in new foreign assistance obligations and disbursements pending review of all foreign aid programs. A notice sent to all diplomatic and consular officials on January 24 implementing the order went further, requiring stop-work orders to be issued for all existing foreign assistance awards, effectively halting implementation of U.S. global health efforts, including PEPFAR, in low and middle-income countries around the world. While PEPFAR was issued a limited waiver a week later, allowing it to restart some services, the situation remains fluid and fast-moving, intersects with several other executive orders and an apparent effort to dissolve USAID (the U.S. international development agency which implements most U.S. global health programs) as an independent agency. In addition, no waivers for other global health programs have been announced. This policy watch provides an overview of what has happened to date, as of February 3, 2025.

What does the Executive Order (EO) pausing foreign aid do? The order, issued on January 20, 2025, was one of the first to be issued by the President. It states that “It is the policy of United States that no further United States foreign assistance shall be disbursed in a manner that is not fully aligned with the foreign policy of the President of the United States” and calls for two main actions:

  • A 90-day pause in U.S. foreign development assistance (new obligations and disbursements) to assess programmatic efficiencies and consistency with U.S. foreign policy.
  • A review of U.S. foreign assistance programs under guidelines provided by the Secretary of State, in consultation with the Director of the Office of Management and Budget (OMB).

Determinations are to be made within 90 days about whether to continue, modify, or cease programs based on the review, with the concurrence of the Secretary of State. New obligations and disbursements may resume prior to the end of the 90-day period if a review and a determination are made to do so. The EO also allows the Secretary of State to waive the pause for specific programs but does not provide criteria for waivers.

Why was the executive order issued? The rationale for the order appears to be based on both economic efficiency and ideological grounds. According to its preamble, the U.S. “foreign aid industry and bureaucracy are not aligned with American interests and in many cases antithetical to American values. They serve to destabilize world peace by promoting ideas in foreign countries that are directly inverse to harmonious and stable relations internal to and among countries.” A media note issued by the State Department states that the EO is “rooting out waste” and “blocking woke programs.” It also states that “Every dollar we spend, every program we fund, and every policy we pursue must make America safer, stronger, and more prosperous”, a statement made Secretary Rubio during his confirmation hearing and one that underpins the current department’s mission and priorities in Trump’s second term. These ideas also echo several that were included in Project 2025’s Mandate for Leadership, a set of recommendations for the next Republican president released in 2023 by a coalition of conservative organizations. For example, Project 2025 called for freezing foreign aid pending a review by political appointees (p. 174), refocusing “attention away from the special interests and social experiments that are used in some quarters to capture U.S. foreign policy” (p. 196), realigning U.S. foreign assistance “with American national interests and the principles of good governance” and undoing “the gross misuse of foreign aid by the current Administration to promote a radical ideology that is politically divisive at home and harms our global standing” (p. 279).

What is the “stop-work”order and is that different than the pause of new funds? While the EO calls for a pause on new foreign assistance obligations and disbursements (funds that have already been appropriated by Congress usually for specific programs or activities but have not yet gone to programs), a notice sent to all diplomatic and consular officials on January 24 went further. It requires all grant and contract officers to immediately issue stop-work orders for all existing foreign assistance awards (not just new obligations and disbursements) until a review is conducted. This means that work already underway with funding provided to organizations must be immediately stopped, such as clinics providing services, health care workers being funded, and other activities. The notice indicates that waivers had been granted for foreign military financing for Israel and Egypt and emergency food assistance (as well as some salaries and administrative costs).

Have any waivers been granted? While the EO notice indicates that waivers for foreign military financing for Israel and Egypt and emergency food assistance have been granted, it does not provide any further detail or indicate what the process is for requesting a waiver. Separately, on January 28, Secretary Rubio announced that he had issued an additional emergency humanitarian waiver, which allows implementers of “existing life-saving humanitarian assistance programs” to continue or resume work. The waiver is temporary and does not apply to new contracts (unless a separate waiver is granted). Life-saving humanitarian assistance is defined as “core life-saving medicine, medical services, food, shelter, and subsistence assistance, as well as supplies and reasonable administrative costs as necessary to deliver such assistance.”

While additional waivers could be requested through the Director of Foreign Assistance at the Department of State, several activities are not eligible for waivers at all, including those that involve: abortions (which are not paid for using U.S. government funds anyway), family planning, conferences, administrative costs other than those covered by the humanitarian assistance waiver, gender or DEI ideology programs, transgender surgeries, or other non-life saving assistance. Some of these services are also the subject of other executive orders and actions issued by the President include (including “Ending Radical And Wasteful Government DEI Programs And Preferencing” and “Defending Women from Gender Ideology Extremism And Restoring Biological Truth to The Federal Government”).

Despite the emergency humanitarian waiver specifying life-saving medicine and medical services, it was still unclear what programs it actually applied to and whether it included services provided by PEPFAR, the President’s Malaria Initiative, and other health programs, since under the State Department’s framework for foreign aid, health programs and humanitarian assistance efforts are categorized separately. As a result, the PEPFAR program applied for a specific waiver, which was granted on February 1, for certain activities. No other waivers have been announced for any other U.S. global health program, such as for the President’s Malaria Initiative (PMI), TB, maternal and child health, and nutrition activities.

What does PEPFAR’s limited waiver allow for? PEPFAR’s limited waiver, granted on February 1, allows for some PEPFAR services to resume during the 90-day period (unless other guidance is issued). Specifically, the waiver was granted to “implement urgent life-saving HIV treatment services in alignment with the Secretary of State’s January 28 memo “Emergency Humanitarian Waiver to Foreign Assistance Pause.” Life-saving HIV treatment is defined by the waiver as follows:

  • Life-saving HIV care and treatment services (including antiretroviral treatment), inclusive of HIV testing and counseling, prevention and treatment of opportunistic infections including TB, laboratory services, and procurement and supply chain for commodities/medicines. This includes health care workers providing these services.
  • Prevention of mother-to-child transmission services, inclusive of commodities/test kits, medicines and PrEP for pregnant and breastfeeding women.

Activities covered by the waiver may be resumed, including new disbursements and limited obligations (only where pre-planned obligations already existed for the activities or where they otherwise could not be restarted without new obligations). No other activities can be resumed. The waiver indicates that the PEPFAR program will create an interagency team to provide ongoing guidance to programs. 

What are the implications of stopping U.S. global health programs? The stop-work orders on existing awards and pause on new obligations and disbursements have, for the time being, halted current U.S. global health (and other foreign assistance) programs, other than activities permitted under PEPFAR’s limited waiver. This is because health care workers have been told to stop work, clinics are having to close, and commodities and other supplies cannot be provided to clients, affecting access for millions of individuals around the world, many of whom are women and children. Some of the interventions at risk of interruption and discontinuation are:

  • PEPFAR/HIV: services not included in the limited waiver such as cervical cancer screening, PrEP (other than for pregnant women), and services for orphans and vulnerable children.
  • PMI/Malaria: bed-nets, indoor residual spraying, seasonal malaria chemoprevention, intermittent preventive treatment in pregnancy.
  • Tuberculosis: diagnosis of TB and drug-resistant TB, provision of life-saving medicines.
  • Polio: identification of polio cases, vaccination of children.
  • Maternal and child health: emergency obstetric care, prenatal and antenatal care, essential newborn care, skilled birth attendants.
  • Family planning: contraception, birth spacing counseling, prevention and repair of obstetric fistula, linkage to maternal health services.
  • Nutrition: nutrition education, nutrition during pregnancy, exclusive breastfeeding, and micronutrient supplementation.
  • Outbreak investigations: halting investigations of and responses to current outbreaks of Ebola, Marburg, and mpox.

Beyond these direct impacts on access to services for people, hundreds of health care and aid workers have lost their jobs and it is expected that many more will as well, and there are widespread reports of confusion as criteria are not often specified, changes are rapid, and high level health officials at the agency which has historically overseen implementation of many of these programs, have been placed on leave.

What happens next? The implications of the pause in global health efforts will likely increase over the 90-day period, as additional programs and activities — those without waivers — are forced to shut down and lay off staff, and more people are unable to get services. The review of foreign aid programs is also underway. Depending on the results of the review, some programs may be recommended for continuation, modification, or may be discontinued. For those that are allowed to continue, it is not clear whether they will still have the capacity (staff, clinic infrastructure, systems) to be able to do so. There is also some confusion regarding the legal status of the foreign aid EO, given that a separate administrative action requiring all federal agencies to temporarily pause all new obligations and disbursements of all Federal financial assistance to ensure compliance with EOs has been successfully challenged in court and temporary restraining orders are in effect, preventing any pause. There are also reports that a lawsuit may be brought specifically challenging the foreign aid EO. Finally, Congress could step in. Congress has oversight of foreign aid programs and, in some cases, Congressional notification is required for program changes. Still, only Democratic Senators have publicly weighed in on the foreign aid freeze and other changes underway thus far (https://www.foreign.senate.gov/press/dem/release/ranking-members-shaheen-schatz-meeks-frankel-we-cannot-afford-to-take-a-timeout-from-usaid-programs and https://www.coons.senate.gov/news/press-releases/senator-coons-decries-president-trumps-freeze-on-almost-all-foreign-assistance-in-speech-on-senate-floor) and it is unclear if additional oversight efforts will be made.

Congressional District Interactive Map: How Much Will ACA Premium Payments Rise if Enhanced Subsidies Expire?

Published: Feb 3, 2025

Enhanced Affordable Care Act (ACA) subsidies were first made available as part of the American Rescue Plan Act in 2021 and were extended through the end of 2025 by the Inflation Reduction Act. The enhanced subsidies build on the ACA’s original tax credits by increasing the amount of premium assistance lower-income enrollees receive, and by making middle- and higher-income enrollees (with incomes over four times poverty) newly eligible for financial assistance to buy health insurance. These enhanced subsidies will expire at the end of this year unless Congress further extends them and President Trump signs it into law. In 2024, 56% of ACA Marketplace enrollees live Congressional Districts represented by Republicans and 76% of enrollees are in states won by President Trump in the 2024 election.

If the enhanced subsidies expire, monthly premium payments for the vast majority of Marketplace enrollees will increase sharply starting January 1, 2026. Among subsidized enrollees living in states that use Healthcare.gov (where data are available), premium payments would have been an average of 93% higher in 2024 without the enhanced tax credits. If these enhanced subsidies expire, the Congressional Budget Office (CBO) projects that there will be an average of 3.8 million more uninsured people each year. Unsubsidized premiums will also likely rise as healthier enrollees drop their coverage. While some state-based Marketplaces offer additional premium financial assistance for certain enrollees, the amount of and availability of these state subsidies would not be enough to fully replace the federal enhanced subsidies.

The interactive map below illustrates how much premium payments would rise without the enhanced subsidies, net of tax credits, at the congressional district level. The tool presents average net premium increases (for states that use Healthcare.gov, where data are available) and two hypothetical scenarios (in all states): one of an older couple who would lose subsidy eligibility due to their income exceeding four times poverty and another for a single individual with a $31,000 income (206% of poverty). A KFF calculator allows users to evaluate zip-code specific changes in premium payments with and without enhanced subsidies for other income and family scenarios.

Premium Payments for Subsidized Enrollees Will Increase Nationwide if Enhanced ACA Subsidies Expire

Because enhanced tax credits decrease premium payments across the board for people receiving a tax credit, all subsidized Marketplace enrollees will experience increases in their monthly premium payments if the enhanced subsidies expire. However, how much each enrollee’s premium payment increases will vary widely and will depend on their family size, location, and income.

Average Increases in Premium Payments Among Subsidized ACA Enrollees

In some congressional districts, there is both a large share of the population enrolled in ACA Marketplace coverage and an expectation of very high average increases in premium payments without the enhanced tax credits. Among states that use Healthcare.gov (where average enhanced tax credit data are available), there are 39 congressional districts where at least 10% of the population is enrolled in the ACA Marketplaces and where 2024 average premium payments would have been double or more had it not been for the enhanced subsidies (Table 1). While these 39 districts are politically split (19 are represented by Democrats and 20 are represented by Republicans), these districts are mostly concentrated in a few red states. Twenty of these 39 districts are in Texas, 7 are in Florida, and 3 are in Georgia. These states are among those that have seen ACA Marketplace enrollment grow the most since the enhanced subsidies went into effect. Since 2020, ACA Marketplace enrollment has more than doubled in Florida and more than tripled in Texas and Georgia.

Increases in Premium Payments for An Older Couple on the “Subsidy Cliff”

The expiration of the enhanced premium tax credits would mean that people with incomes over four times the poverty level are no longer eligible for financial assistance. Prior to the availability of enhanced subsidies, ACA Marketplace premium assistance eligibility capped at 400% of poverty (which is $60,240 for a single person or $81,760 for a couple in 2025). If enhanced subsidies expire, Marketplace enrollees making just above 400% of poverty will encounter the “subsidy cliff” and would face the full price of a Marketplace plan. If the enhanced subsidies expire, a 60-year-old couple making $82,000 (401% of poverty) would see their premium payment for the benchmark silver plan, on average, at least double in the vast majority of congressional districts. The benchmark silver premium for a 60-year-old couple at this income would triple or more, on average, in 328 congressional districts.

Premium Increases for Lower-Income Enrollees

A 40-year-old Marketplace enrollee in the contiguous U.S. making $31,000 (206% of poverty) would see monthly premium payments in 2025 rise by $95 (a 165% increase) from $58 to $153. (Alaska and Hawaii have different poverty guidelines). Nationally, there are 75 congressional districts where at least 10% of the population is enrolled in the Marketplace. For a 40-year-old making $31,000, premium payments would at least double on average in all 75 districts. 62 of these districts are in Florida, Georgia and Texas. 38 of these 62 districts are represented by Republicans while 24 are represented by Democrats.

Under the enhanced phase out caps, Marketplace enrollees with incomes up to 150% of poverty currently pay zero (or near zero) dollars for a benchmark silver plan. Should the enhanced subsidies expire, enrollees in this income group will be on the hook for some of the cost of their premiums if they want to keep a silver plan. Before the enhanced subsidies went into effect, Marketplace enrollees at this income group paid about 2-4% of their income for a benchmark plan. A sizeable portion of the Marketplace population benefits from zero dollar premiums, with 42% of HealthCare.gov enrollees in 2024 paying nothing for Marketplace coverage (up from 14% of HealthCare.gov enrollees in 2021).

Premium Payments for the Vast Majority of Marketplace Enrollees Would Increase If Enhanced Subsidies Expire

Methods

These maps visualize the 119th Congressional District boundaries in place for 2025-2026, as of September 2024. County to Congressional District designations are taken from the Missouri Census Data Center GeoCorr 2022 data.

Premium changes displayed for the average scenario are calculated using CMS data on subsidized HealthCare.gov enrollees in 2024. Average premiums by congressional district for income-specific scenarios are calculated using 2025 county-level premiums weighted by 2024 county-level plan selections, which are taken from a combination of CMS files, state-provided data, or estimated using plan selections from prior years when otherwise not available. When a county is part of multiple congressional districts, an allocation factor from the GeoCorr tool is used to apportion county-level plan selections among the congressional districts based on the 2020 decennial census. 2025 county-level premiums are collected from a combination of insurer rate filings, state regulatory authorities, or state shopping tools. Hypothetical premium payments without enhanced subsidies are calculated using indexed required contribution percentages provided by CBO. Premiums used in this map do not account for state-based premium assistance and may not reflect non-essential health benefits.

Enrollment by Congressional District displayed for HealthCare.gov states is taken from CMS data, while estimates are displayed for state-based Exchanges using plan selections for each county allocated to Congressional District using the GeoCorr allocation factor. To calculate the share of people in each Congressional District enrolled in the ACA Marketplace, total Marketplace enrollment is divided by Census estimates of population for the 119th Congressional Districts. For non-HealthCare.gov states, the share of population enrolled in an ACA Marketplace plan may differ from the estimate if population growth diverge from the proportions recorded in the Census.

A Look at Federal Health Data Taken Offline

Published: Feb 2, 2025

On Friday January 31, 2025, several federal government datasets went offline. The datasets taken down included some widely used, large-scale national health surveys, indices, and data dashboards that inform research, policy making, and media coverage about health care and public health. For example, several Centers for Disease Control and Prevention (CDC) surveys and datasets were offline Friday and Saturday, with messages simply saying the page “was not found.” The homepage of the United States Census displayed an error message, but data.census.gov – where many datasets can be downloaded – was functioning.

By Sunday February 2, 2025, some of the landing pages started to come back online – now with a warning message: “CDC’s website is being modified to comply with President Trump’s Executive Orders,” suggesting there could be future changes. In some cases, survey data files are back online and appear to be intact, but the survey documentation (questionnaires and codebooks), which researchers use to analyze the data files, remained offline. Some related reports also remained offline. It is not yet clear whether all the datasets and their documentation that went offline will come back or remain online, and if they do, what changes, if any, will be made. It also remains to be seen what changes may be made to future data collection efforts.

The removal or modification of these data sources appears to be in response to executive orders issued by President Trump on his first day in office outlining the administration’s perspectives and approach to sex and gender and on racial equity and diversity equity and inclusion (DEI), as well as a pause on foreign assistance. An Office of Personnel Management (OPM) memorandum on the first EO directed departments and agencies to “take down all outward facing media (websites, social media accounts, etc.) that inculcate or promote gender ideology” and “withdraw any final or pending documents, directives, orders, regulations, materials, forms, communications, statements, and plans that inculcate or promote gender ideology.” Another OPM memorandum similarly directed departments and agencies to “Take down all outward facing media (websites, social media accounts, etc.) of DEIA offices”. None of these executive orders nor the OPM memos specifically mention datasets or survey data.

Federal surveys play a key role in the health surveillance system, which helps direct initiatives to address some of the most pressing health conditions and problems facing the country. For example, one of the affected datasets is CDC’s Behavioral Risk Factor Surveillance System (BRFSS), which is one of the most widely used national health surveys and has been ongoing for about 40 years. Datafiles for all years were temporarily offline and as of this writing have been reposted, but without questionnaires or codebooks. BRFSS is described on one federal website as a source of state-level “information about health risk behaviors, preventive health practices, and health care access primarily related to chronic disease and injury.” The survey has been used for decades to inform policymakers, the media, and the public on a wide range of health topics, such as obesity rates, access to breast cancer screenings, vaccination rates, and the share of people with pre-existing conditions. With sampling in every state, BRFSS data are particularly helpful for understanding health issues in low-population states and rural areas.

In reviewing KFF’s archives of the BRFSS core questionnaire, it did not include detailed questions about sexual orientation or gender identity. However, in recent years, BRFSS offered an optional module on sexual orientation and gender identity, which was implemented in most states. This supplemental data has been used by KFF to show that adults who identify as transgender are more likely than cisgender adults to be uninsured, experience depression, and report being in poor health. At the time of this writing, the BRFSS data file is back online and appears to be intact, including the question about gender identity, though the survey documentation is not online.

Another of the datasets taken offline was CDC’s Youth Risk Behavior Survey (YRBS), which, since 1990, has tracked high school students’ behaviors that can influence health and social outcomes, like smoking, drug and alcohol use, and dietary and exercise habits. Like BRFSS, the landing page and associated materials were offline but, as of the time of this writing, have returned without questionnaires or codebooks. This survey is particularly useful because it asks questions to teenagers directly, rather than surveying their parents, who may be unable or unwilling to answer questions accurately. KFF analysis of YRBS data has shown that large shares of teenagers experience persistent sadness and hopelessness, and that teenage girls experienced a sharp rise in suicidal ideation during the pandemic. Recently, the YRBS has asked respondents about their sexual orientation and gender identity, and the data has been used to highlight substantial mental health disparities among LGBTQ+ high school students, compared to their non-LGBTQ+ peers.

Several of the other datasets taken down (at least temporarily) relate to HIV/AIDS in the U.S. as well as global health efforts around the world in low and middle-income countries, including but not limited to:

  • CDC AtlasPlus: an interactive database with about 15 years of surveillance data for HIV, viral hepatitis, STD, and TB, as well as data on the social determinants of health. Additionally, CDC HIV surveillance reports dating back to the beginning of the epidemic were also removed.
  • PEPFAR Data Dashboards: PEPFAR, the U.S. global HIV/AIDS Program, comprehensive, up-to-date online data portal of program budgets and expenditures by country and service category, among other variables
  • Demographic and Health Surveys (DHS) databases: data downloads from the DHS, an ongoing set of nationally representative household surveys supported by USAID, the U.S. international development agency, with population, health, HIV, and nutrition data from more than 90 countries. Separately, the entire website for USAID has been taken down resulting in the removal of countless reports and other data sources.
  • foreignassistance.gov: The U.S. government’s website with all foreign assistance data by country, budget, expenditure, program, going back more than two decades and created to increase aid transparency.

Other federal dashboards and indices were also offline, at least temporarily, including but not limited to: Area Health Resource Files (a resource of data on health professionals, hospitals, and economic indicators), CDC’s Social Vulnerability Index (Census-based socioeconomic data used for disaster planning, response and recovery), and the Environmental Justice Index (Census tract-level data used to identify populations facing negative environmental, social and health factors).

While not the focus of this brief, other health information intended for the public has also been removed or changed, which could have implications for access to and receipt of services and other interventions.

Medicaid 1115 Waiver Watch: Round-up of Key Themes at the End of the Biden Administration

Published: Jan 31, 2025

Section 1115 Medicaid demonstration waivers offer states an avenue to test new approaches in Medicaid that differ from what is required by federal statute, so long as the approach is likely to “promote the objectives of the Medicaid program.” Waivers generally reflect priorities identified by states as well as changing priorities from one presidential administration to another. Section 1115 waivers generally are approved for an initial five-year period and can be renewed, typically for three-to-five-year periods. The Biden administration encouraged states to propose waivers that expand coverage, reduce health disparities, advance whole-person care, and improve access to behavioral health care. Some waiver initiatives, including using Medicaid to assist with reentry from incarceration, have been pursued by both Republican and Democratic governors. This waiver watch recaps key Biden administration 1115 waiver priorities and initiatives, and highlights states that received approval in each area. For the latest on Medicaid waiver activity (pending applications and approvals), visit KFF’s 1115 tracker.

Looking ahead, the new Trump administration’s waiver priorities will likely differ significantly from those of the Biden administration. However, it is unclear how the Trump administration will treat certain waivers promoted and approved by the Biden administration. The Trump administration could choose not to approve waivers that remain pending or come up for renewal (as many existing waivers are due to expire during the Trump administration) or rescind existing waiver guidance. Additionally, outlined in waiver approval terms and conditions, CMS reserves the right to withdraw 1115 waiver or expenditure authorities at any time (including those already in operation under an active/approved waiver). Although this authority has been infrequently used in the past, the Biden administration withdrew Medicaid work requirement waivers in all states that had approvals, concluding that the provisions do not promote the objectives of the Medicaid program. States can appeal withdrawal decisions to the HHS Department Appeals Board and/or challenge recissions in court.

The Biden administration approved 18 waivers authorizing evidence-based housing and nutrition services for specific high-need populations under a new “health-related social needs” (HRSN) 1115 framework. The Centers for Medicare and Medicaid Services (CMS) defines health-related social needs as an individual’s unmet, adverse social conditions (e.g., housing instability, homelessness, nutrition insecurity) that contribute to poor health and are a result of underlying social determinants of health (SDOH). In 2022, CMS announced a Section 1115 demonstration waiver opportunity to expand the tools available to states to address enrollee health-related social needs (building on guidance released at the end of the first Trump administration in 2021). In 2023, CMS issued a detailed Medicaid and CHIP HRSN framework accompanied by an Informational Bulletin, which was updated in 2024. Approvals under the HRSN framework include coverage of rent/temporary housing and utilities for up to 6 months and meal support up to three meals per day (for up to 6 months), departing from longstanding prohibitions on payment of “room and board” in Medicaid. North Carolina’s “Healthy Opportunities” pilots was originally approved during the first Trump administration (allowing the state to provide certain non-medical services targeting SDOH in limited regions of the state) but was recently renewed under the Biden administration’s HRSN framework (extending the scope of services and geographic reach). Some 1115 SDOH-related requests for housing and/or nutrition services remain pending with CMS, including Connecticut, DC, Maine, Nevada, and Rhode Island. Many HRSN waivers will face renewal during the Trump administration, with Colorado’s waiver set to expire at the end of 2025 and others (e.g., California, New York) due for renewal starting in late 2026/early 2027.

Health-Related Social Needs (HRSN) Waivers Approved as of January 20, 2025

Medicaid Pre-release Coverage for Individuals Who Are Incarcerated

The Biden administration approved 19 state waivers to facilitate reentry for individuals who are incarcerated. In April 2023, CMS released guidance encouraging states to apply for a new Section 1115 demonstration opportunity to test transition-related strategies to support community reentry for people who are incarcerated—as directed by the 2018 SUPPORT Act (which was signed into law during the first Trump administration). This demonstration allows states a partial waiver of the inmate exclusion policy, which prohibits Medicaid from paying for services provided during incarceration (except for inpatient services). Reentry services aim to improve care transitions and increase continuity of health coverage, reduce disruptions in care, improve health outcomes, and reduce recidivism rates. At a minimum, states must provide case management, medication-assisted treatment for all types of substance use disorders (with accompanying counseling), and a 30-day supply of prescription medications at the time of release. Nine states (including DC) have waivers to provide reentry services pending with CMS.

Medicaid Pre-release Waivers Approved as of January 20, 2025

Multi-year Continuous Eligibility for Children

The Biden administration approved 9 waivers that allow states to provide multi-year continuous eligibility for children (e.g., from birth to age six). The Consolidated Appropriations Act, 2023 required all states to implement 12-month continuous eligibility for children beginning on January 1, 2024. States may request Section 1115 waiver authority to provide continuous eligibility for children for longer than 12 months. Continuous eligibility has been shown to reduce Medicaid disenrollment and “churn” rates (rates of individuals temporarily losing Medicaid coverage and then re-enrolling within a short period of time). When individuals churn on and off coverage, the gaps in coverage may limit access to care or lead to delays in getting needed care, which can be especially problematic for young children who receive frequent screenings and check-ups. Most states with waivers are approved to provide continuous coverage for young children from birth to age six; some states are also approved to provide 24 months of continuous eligibility for children ages six to 19. While no additional multi-year continuous eligibility waivers for children are pending with CMS, some may remain under consideration at the state-level.

Multi-year Continuous Eligibility Waivers Approved as of January 20, 2025

How Does U.S. Life Expectancy Compare to Other Countries?

Published: Jan 31, 2025

Between 2019 and 2022, the U.S. experienced a sharper decline and a slower rebound in life expectancy than peer countries, on average, due to increased mortality and premature death rates in the U.S. from the COVID-19 pandemic. Updated life expectancy estimates in this chart collection show that in 2023, life expectancy in the U.S. returned to pre-pandemic levels, but remains lower than that of comparable countries.

This chart collection examines how life expectancy in the U.S. compares to that of other similarly large and wealthy countries in the Organisation for Economic Co-operation and Development (OECD). The countries included in the comparison are Australia, Austria, Belgium, Canada, France, Germany, Japan, Netherlands, Sweden, Switzerland, and the United Kingdom.

The analysis is available through the Peterson-KFF Health System Tracker, an information hub dedicated to monitoring and assessing the performance of the U.S. health system.

VOLUME 15

Skepticism About Vaccines and Response to Bird Flu

This is Irving Washington and Hagere Yilma. We direct KFF’s Health Information and Trust Initiative and on behalf of all of our colleagues at KFF, we’re pleased to bring you this edition of our bi-weekly Monitor.


Summary

This volume shares key findings from the latest KFF Tracking Poll on Health Information and Trust, along with updates from Robert Kennedy Jr.’s senate hearings. We also examine narratives that reflect distrust in public health messaging about bird flu, motivations for sharing information online, and how fraudulent research can sometimes inform AI chatbot models.


KFF’s latest Tracking Poll on Health Information and Trust shows declining public trust in key government health agencies with divisions along partisan lines, a continuation of a trend beginning during the COVID-19 pandemic. Compared to KFF polling from June 2023, fewer adults now say they have a “great deal” or a “fair amount” of trust in the CDC (from 66% to 61% in the latest poll), FDA (from 65% to 53%), or their state and local public health officials (from 64% to 54%) to make the right recommendations when it comes to health issues. Trust in government health agencies is divided along partisan lines, with Republicans far less likely than Democrats and independents to say they trust each of these agencies. On the other hand, about eight in ten Republicans trust President Trump, Robert F. Kennedy, Jr., and Dr. Mehmet Oz, compared to closer to one in ten Democrats.

While doctors remain the most trusted source of health recommendations among the public, this share has also decreased by eight percentage points overall, driven largely by declining trust among Republicans and independents.

Trust in Personal Doctors and Government Health Agencies Has Declined Since 2023

Recent Developments

Senate Questions Kennedy on Vaccine Views Amid Rising Parental Vaccine Hesitancy

Becky Wright / Getty Images

Robert F. Kennedy Jr. appeared before the Senate Finance Committee on Wednesday, January 29th and the Senate Committee on Health, Education, Labor, and Pensions on Thursday, January 30th for his confirmation hearings as the nominee for Department of Health and Human Services (HHS) Secretary. During the hearings, senators raised questions about Kennedy’s history of casting doubt on vaccines, including his past claims about the safety and efficacy of COVID-19, measles, and polio vaccines. Kennedy framed his position as pro-safety rather than an outright opposition to vaccines, stating that all his children are fully vaccinated. However, some senators challenged this characterization, citing his financial gains from lawsuits against vaccine manufacturers and suggesting political or financial motives for questioning vaccine safety. A KFF policy watch explains the influence Kennedy could have over vaccine approval processes, recommendations, and advisory committees as HHS Secretary. Kennedy would oversee a department that not only approves and recommends vaccines, but also one with programs providing health coverage to over half the population.

Polling Insight:

The concerns raised at the hearings come amid broader discussions about vaccine safety. While large shares of the public continue to express positive attitudes toward childhood vaccines and school vaccination requirements, KFF’s latest Tracking Poll on Health Information and Trust shows larger shares of parents now report delaying or skipping recommended vaccines for their children. Nearly one in five (17%) parents now say they have ever delayed or skipped some recommended vaccines, such as the MMR vaccine, for their children – an increase of seven percentage points since September 2023.

The false claim that the MMR vaccines have been proven to cause autism continues to persist, with most adults – including most parents – falling in the “malleable middle,” expressing some level of uncertainty about whether this claim is true or false. Parents who believe or are open to believing the falsehood that the MMR vaccines have been proven to cause autism are about four times as likely as those who say this myth is definitely or probably false to report delaying or skipping vaccines for their children (37% vs. 8%).

Parents Who Believe False Claim About MMR Vaccines Causing Autism Are More Likely To Have Skipped Some Routine Vaccines for Their Child

Vaccine Skepticism Towards Existing and Potential Bird Flu Vaccines

skodonnell / Getty Images

As bird flu spreads among animals and raises concerns about the potential for future human transmission, the Department of Health and Human Services, under the Biden Administration, announced that it is investing another $590 million to expedite the development of Moderna’s mRNA-based bird flu vaccines. However, misinformation and skepticism surrounding bird flu vaccines persist online, often misrepresenting data and undermining trust. KFF monitoring of online conversations about bird flu reveals narratives that have focused on Audenz, a bird flu vaccine that was approved by the FDA in 2020. Concerns that Audenz caused one in 200 clinical trial participants to die circulated widely on social media, pointing to a 2021 clinical trial that found some deaths (<1%) among adult participants but determined no link to the vaccine. The study’s researchers concluded, “No adult deaths were vaccine-related, and the frequency of these events was in line with U.S. mortality statistics for the age groups in question.” The misrepresentation of clinical data has stoked fear about vaccine safety before, as similar misrepresentations of deaths during COVID-19 clinical trials raised concern about the Pfizer’s COVID-19 vaccines in previous years.

In addition to misrepresenting data, online narratives often raise concerns about vaccine ingredients, reiterate resistance to bird flu vaccines, and oppose future public health measures. Some users also share anecdotes about alleged vaccine injuries from COVID-19 vaccines to argue that bird flu vaccines would cause similar harm. One online post, which received thousands of likes and reposts, said “We are not masking up. We are not PCR testing. We are not socially distancing. We are not getting mRNA vaccines. We are not locking down.” Many comments echoed this sentiment, questioned the need for public health measures, or expressed solidarity with those resisting public health guidance.

Polling Insight:

Misinformation and skepticism surrounding the bird flu vaccines echo those related to the COVID-19 vaccines. KFF’s latest Health Information and Trust poll shows that these myths have persisted, particularly among Republicans. While about one in four adults say the false claim that “more people have died from COVID-19 vaccines than have died from the COVID-19 virus,” is “definitely true” (8%) or “probably true” (18%), four in ten Republicans say it is “definitely” (13%) or “probably true” (27%), an increase from one in four Republicans who said this was at least probably true in June 2023.

Larger Shares of Republicans Now Say it is Probably or Definitely True That the COVID-19 Vaccine is More Deadly Than Virus 

Concerns About Bird Flu Reflect Distrust in Public Health Messaging

DIGICOMPHOTO/SCIENCE PHOTO LIBRARY / Getty Images

As the U.S. invests in vaccine development, along with other preventative measures, some have shared concerns beyond vaccine skepticism, suggesting that bird flu might be used as a pretext for lockdowns and food supply restrictions. KFF media monitoring research shows that these narratives are resonating with tens of thousands of people online. For example, a radio host garnered 80,000 likes and 29,000 reposts in 10 days when they shared a video on X making these claims with a caption describing bird flu as “A Plot To Shutdown Society” and an “Evil Psyop.” Many of the 2,800 comments on the post conveyed similar concerns. Skepticism is also expressed about health communicators aligned with federal health agencies. In early January, a video of Dr. Leana Wen discussing the bird flu response was captioned with an accusation that she trying to restart the “COVID-19 scam.” The post quickly attracted thousands of interactions, including comments accusing Wen, Dr. Anthony Fauci, and Bill Gates of criminal activity.

Contrary to these persistent claims, the CDC explains that the risk of bird flu to the general public remains low. However, the most common strain of bird flu can spread through contact with an infected animal’s saliva, mucus, feces, respiratory secretions, and other body fluids, so certain groups that work with livestock (e.g., farmers, backyard bird flock owners, veterinarians, and animal health responders) face increased risk due to their frequent exposure to potentially infected animals or animal byproducts. To prevent infection, the CDC recommends avoiding direct contact with infected animals, practicing good hygiene, and using personal protective equipment (PPE) when necessary. Despite the agency closely monitoring the situation, eroding trust in health institutions may undermine public confidence in these prevention strategies and guidance.

Polling Insight:

The latest KFF Tracking Poll on Health Information and Trust finds that forty-four percent of U.S. adults are “very” or “somewhat concerned” that there will be a widespread outbreak of bird flu in the U.S., while fewer (34%) say they are concerned that they or someone in their family will get sick. Majorities of Democrats, Hispanic adults, and adults in lower income households express concern about a widespread outbreak of bird flu, and each of these groups is more likely than their counterparts to say they are concerned they or their families will get sick.

Just Under Half Are Concerned About a Widespread Outbreak of the Bird Flu in the U.S., a Third Worried That They or Someone in Their Family Will Get Sick 

Research Insights

Desire for Power and Influence Linked to Increased Online Misinformation Sharing

Krongkaew / Getty Images

Research published in Computers in Human Behavior investigated how power motives influence social media behavior, particularly the spread of false or misleading information. Across four studies, individuals with strong power motives—those who prioritize influence, authority, and control—were found to actively share content, including fake news, driven by a desire to assert influence and control narratives within online networks. Power values were stronger predictors of misinformation sharing than dominance or context-specific power goals, meaning that people who value power are more likely to share misinformation, regardless of whether they are trying to dominate others or act strategically. While actual power had minimal impact, power-motivated individuals showed moral leniency by using misinformation to enhance visibility and network centrality. The findings suggest that power-motivated individuals use manipulable narratives to achieve social influence, although real-world dynamics and other contributing factors such as social skills and charisma warrant further exploration.

Source: Guinote, A., Kossowska, M., Jago, M., Idenekpoma, S., & Biddlestone, M. (2025). Why do people share (mis) information? Power motives in social media. Computers in Human Behavior162, 108453.

Monitoring and Addressing Misleading Ads for Alternative Cancer Treatments

Olena Malik / Getty Images

A study in the HKS Misinformation Review explored how alternative cancer clinics used Google search ads to target cancer patients seeking information about treatment, prognosis, and options. Between 2012 and 2023, these clinics spent more than $15 million on Google ads, resulting in millions of website visits. The ads often mimicked sensitive patient queries, such as those related to cancer survival rates and top treatment centers, only to redirect users to clinics offering unproven therapies. The research highlights the need for health communicators to monitor, pre-bunk, and debunk misleading ads promoting non-evidence-based cancer treatments. Understanding the types of alternative treatments being marketed through these ads is important to help address misinformation before patients encounter it.

Source: Zenone, M., Marcon, A., Kenworthy, N., van Schalkwyk, M., Caulfield, T., Hartwell, G., & Maani, N. (2024). Google allows advertisers to target the sensitive informational queries of cancer patients. Harvard Kennedy School Misinformation Review.


AI & Emerging Technology

Fraudulent Research Can ‘Poison’ LLM Training Datasets

Bill Hinton / Getty Images

Large Language Models (LLMs), such as ChatGPT, are trained on large datasets, often including publicly available information from the internet. However, the quality and reliability of these data sources can limit the accuracy and trustworthiness of the models. A recent study in Nature explored how the inclusion of fraudulent scientific papers in publicly available repositories can contribute to misinformation. These fraudulent studies, often produced by paper mills, mimic legitimate research but lack rigorous peer review. When such content is used to train LLMs, it risks perpetuating inaccuracies and false claims, particularly in sensitive areas such as health information. According to the study, even when only 0.01% of the training data was corrupted, 10% of the responses contained errors, including false claims about vaccine effectiveness and misidentified medications.

About The Health Information and Trust Initiative: the Health Information and Trust Initiative is a KFF program aimed at tracking health misinformation in the U.S., analyzing its impact on the American people, and mobilizing media to address the problem. Our goal is to be of service to everyone working on health misinformation, strengthen efforts to counter misinformation, and build trust. 


View all KFF Monitors

The Monitor is a report from KFF’s Health Information and Trust initiative that focuses on recent developments in health information. It’s free and published twice a month.

Sign up to receive KFF Monitor
email updates


Support for the Health Information and Trust initiative is provided by the Robert Wood Johnson Foundation (RWJF). The views expressed do not necessarily reflect the views of RWJF and KFF maintains full editorial control over all of its policy analysis, polling, and journalism activities. The Public Good Projects (PGP) provides media monitoring data KFF uses in producing the Monitor.